catalysts - mdpi
TRANSCRIPT

catalysts
Article
Regeneration of Pt-Sn/Al2O3 Catalyst for HydrogenProduction through Propane Dehydrogenation UsingHydrochloric Acid
Yi Sun Choi 1, Kyeongseok Oh 2, Kwang-Deog Jung 3 , Won-Il Kim 4 and Hyoung Lim Koh 1,*1 Department of Chemical Engineering, RCCT, Hankyong National University, 327, Jungang-ro, Anseong,
Gyeonggi 17579, Korea; [email protected] Chemical and Environmental Technology Department, Inha Technical College, Inha-ro 100, Michuhol-gu,
Incheon 22212, Korea; [email protected] Clean Energy Research Center, Korean Institute of Science and Technology, P.O. Box 131, Cheongryang,
Seoul 02792, Korea; [email protected] R&D Business Lab., Hyosung Co., 74 Simin-daero, Dongan-gu, Anyang, Gyeounggi 14080, Korea;
[email protected]* Correspondence: [email protected]; Tel.: +82-31-670-5410
Received: 14 July 2020; Accepted: 5 August 2020; Published: 7 August 2020�����������������
Abstract: Compared with dehydrogenation in conventional petroleum refinery processes, relativelypure hydrogen can be produced by propane dehydrogenation (PDH) without innate contaminantslike sulfur and metals. Among the existing catalysts for PDH, Pt catalysts are popular and areoften used in conjunction with Sn as a co-catalyst. Coke formation is a major concern in PDH,where catalyst regeneration is typically achieved by periodic coke burning to achieve sustainableoperation. In this study, Pt-Sn/Al2O3 catalysts were regenerated after coke burning in three stages:mixing the catalyst with liquid hydrochloric acid, drying, and calcining under air atmosphere. In thisprocess, the optimum concentration of hydrochloric acid was found to be 35% w/w. HCl treatment waseffective for enhancing redispersion of the metal catalysts and aiding the formation of the Pt3Sn alloy,which is considered to be effective for PDH reaction. HCl treatment may provide oxychlorination-likeconditions under the calcination atmosphere. The characteristics of the catalysts were examinedby X-ray diffraction (XRD), transmission electron microscopy (TEM), temperature-programmedreduction (TPR), X-ray photoelectron spectroscopy (XPS), and CO chemisorption.
Keywords: hydrochloric acid treatment; propane dehydrogenation; Pt-Sn/Al2O3; Pt3Sn alloy; regeneration
1. Introduction
Hydrogen has been produced via various chemical processes and is considered a future alternativeenergy resource. Among the chemical processes, propane dehydrogenation (PDH) is becoming popularbecause it produces hydrogen, along with propylene, from propane feedstock. In stoichiometric counts,one mole of propylene as well as one mole of hydrogen can be produced from one mole of propanefeed for PDH. The global demand for propylene is up 100 million tons annually, where propylene isused in various areas such as polymers and chemical intermediates [1,2]. Two major catalysts are usedin commercial PDH, that is, Pt-Sn and Cr-based catalysts [3–5]. The main drawback of Cr catalysts isthe environmental impact, which tends to decrease its usage [6–9]. In other words, Pt catalysts areknown to promote the PDH reaction in the presence of co-metals [10–14] and refined supports [15–19].The PDH reaction is performed at high temperatures (over 550 ◦C), leading to unfavorable cokeformation on the surface of the catalysts [20–22], which causes deactivation. In qualitative studies,coke has been classified as aliphatic, aromatic, and pseudo-graphitic [23]. The effect of the coke quality
Catalysts 2020, 10, 898; doi:10.3390/catal10080898 www.mdpi.com/journal/catalysts

Catalysts 2020, 10, 898 2 of 17
on Pt-Sn catalysts was evaluated by assessing the combustion kinetics [24]. When coke on the catalystwas combusted, the metals on the surface of the catalysts spontaneously sintered [25]. In practice,coke deposits on commercial catalysts are caused by contamination with impurities and loss of chlorinecompounds. Sintering of the metal reduces the catalyst activity and destabilizes the balance betweenthe metal and alumina [11]. If the catalyst activity falls considerably below that of the fresh catalyst,regeneration steps can be added. The regeneration of coke-contaminated catalysts is important andshould be evaluated with accompanying processes, such as coke burning followed by redispersion,reduction, and so on, if necessary. Coke burning is the primary option for coke removal under oxygenatmosphere [26,27]. It was reported that oxygen atmosphere promotes coke removal from metalsurfaces [11,28], whereas ozone atmosphere promotes coke removal from alumina supports [29,30].Alternatively, coke burning under hydrogen atmosphere has also been reported. It was reported thatalumina enhances activation of the catalytically active sites, thereby facilitating regeneration of Pt-Sncatalysts in the naphtha reforming process [31]. Various options have been proposed for regeneratingPt-Sn catalysts subsequent to coke burning. Oxidation redispersion as a secondary treatment wasalso used under oxygen atmosphere and even under ozone atmosphere. In our previous study [32],we reported that oxychlorination treatment was effective in regenerating Pt-Sn/Al2O3 catalysts afterthe PDH reaction, and we observed that the activity of catalysts containing Pt3Sn alloys was improvedafter oxychlorination treatment.
Regeneration of Pt-Sn/Al2O3 for PDH reaction by oxychlorination has been rarely studied.Meanwhile, reports of study in regeneration of Pt or Pt-Sn catalyst for naphtha reforming byoxychlorination using HCl or dichloropropane include the following. Arteaga et al. [33] reportedthat recovery of dispersion in Pt/Al2O3 could be attained by oxychlorination as well as recovery ofactivity in naphtha reforming, but the effect of chorine during regeneration of Pt-Sn/Al2O3 is lesssignificant, although chlorine has the additional effect of favoring PtSn alloy formation [34] at high metalloadings [35] or greater intimacy between Pt and Sn dispersed on SnOx-modified alumina [34,36,37]at low metal loadings [33]. Our study was intended to study the effect of oxychlorination treatmentof Pt-Sn catalysts used in propane dehydrogenation reactions. As the Pt-Sn catalyst for propanedehydrogenation is calcined and reduced at a higher temperature than the Pt-Sn catalyst used forthe naphtha reforming reaction, the effect on oxychlorination is expected to be different. It is also ofinterest whether the PtSn alloy reported in the catalyst for the naphtha reforming reaction will beproduced or whether other alloy types may be produced. In this study, we investigate the effects oftreatment with a liquid chlorine compound at room temperature on the catalyst activity. The treatmentincludes three stages: immersion into concentrated HCl solution, drying, and calcination, which namesto HCl treatment. In commercial processes, gas-phase regeneration is the better option for regenerationbecause used catalysts can be regenerated in a reaction vessel in a continual process. The mainobjectives of the hydrochloric acid (HCl) treatment are to achieve economic catalyst redispersionand enhanced catalyst activation. Coke burning option was used as a reference. After drying andcalcining the HCl-treated Pt-Sn/Al2O3 catalysts, the Pt dispersion and the role of Sn/SnOx in thecatalyst are evaluated. The catalysts are characterized by X-ray diffraction (XRD), transmission electronmicroscopy (TEM), temperature-programmed reduction (TPR), X-ray photoelectron spectroscopy(XPS), and CO-chemisorption.
2. Results
2.1. Catalyst Performance
Table 1 shows the classification of the catalysts used in this study. The catalysts were regeneratedby different techniques such as coke burning and coke burning combined with HCl treatment indifferent concentrations of HCl. A bimetallic catalyst composed of Pt-Sn on an alumina support wasused. As shown in the catalyst codes in Table 1, two different weight percentages of Pt (3 wt.%)and Sn (4.5 wt.%) were used. As a fresh catalyst, impregnated 3Pt4.5Sn/Al2O3 was calcined and
Catalysts 2020, 10, 898 3 of 17
named PtSn-C. Before the first or second run of PDH, the catalysts were reduced with hydrogen Aftersubjection to the PDH reaction for 3 h, the used PtSn-C catalyst was denoted as PtSn-U, and PtSn-Bwas named after coke burning of PtSn-U. Subsequently, the catalysts were treated with HCl of differentconcentrations, and these samples were denoted as the PtSn-B-HCl series, from PtSn-B-HCl5 toPtSn-B-HCl35, depending on the concentration of HCl. Note that HCl treatment comprises treatmentwith HCl solutions at different concentrations, followed by drying and calcination at 600 ◦C.
Table 1. Procedure for catalyst regeneration (dehydrogenated: first reduction + propane dehydrogenation(PDH) reaction).
Catalyst Code Treatment
PtSn-C CalcinedPtSn-U Calcined/dehydrogenationPtSn-B Calcined/dehydrogenated/coke burning
PtSn-B-HCl5 Calcined/dehydrogenated/coke burning/HCl (5%)PtSn-B-HCl15 Calcined/dehydrogenated/coke burning/HCl (15%)PtSn-B-HCl25 Calcined/dehydrogenated/coke burning/HCl (25%)PtSn-B-HCl35 Calcined/dehydrogenated/coke burning/HCl (35%)
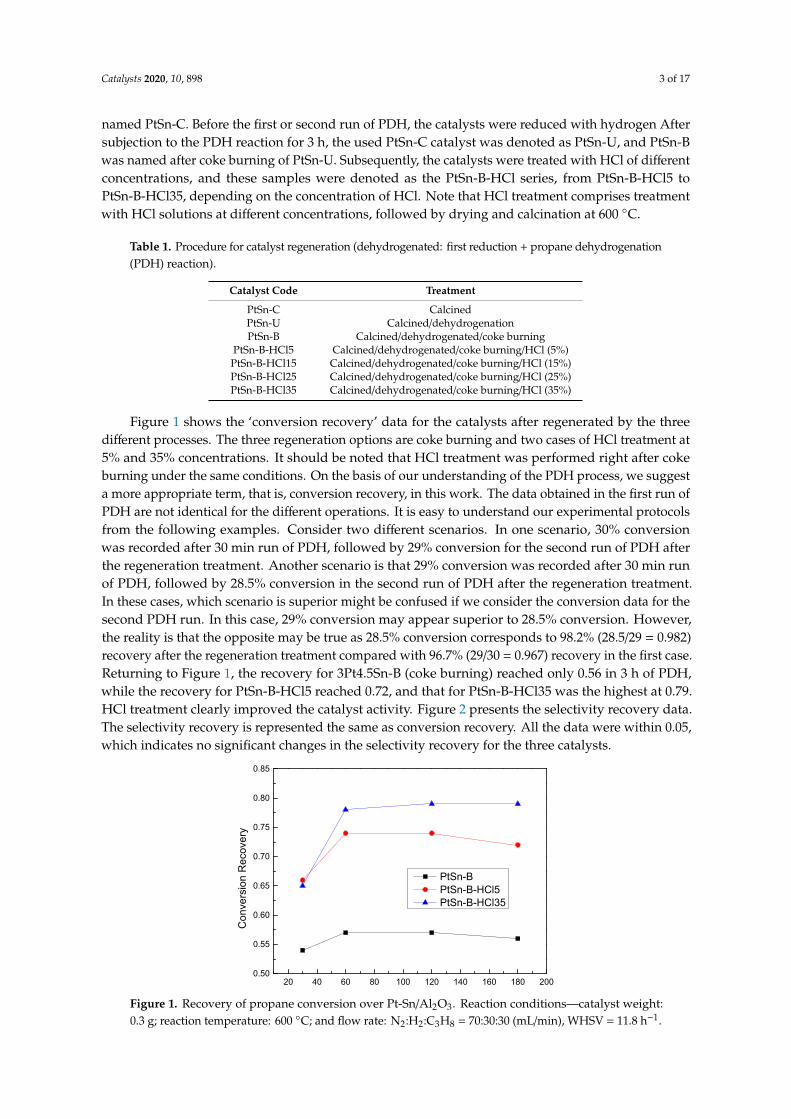
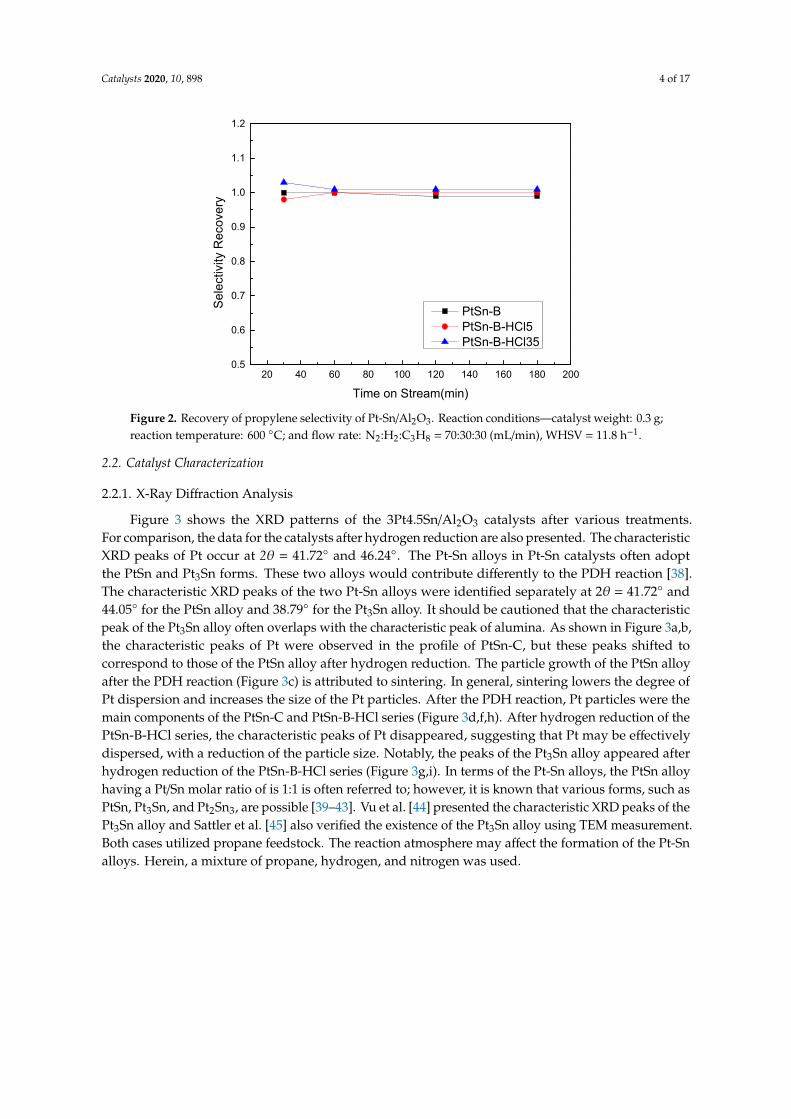
Figure 1 shows the ‘conversion recovery’ data for the catalysts after regenerated by the threedifferent processes. The three regeneration options are coke burning and two cases of HCl treatment at5% and 35% concentrations. It should be noted that HCl treatment was performed right after cokeburning under the same conditions. On the basis of our understanding of the PDH process, we suggesta more appropriate term, that is, conversion recovery, in this work. The data obtained in the first run ofPDH are not identical for the different operations. It is easy to understand our experimental protocolsfrom the following examples. Consider two different scenarios. In one scenario, 30% conversionwas recorded after 30 min run of PDH, followed by 29% conversion for the second run of PDH afterthe regeneration treatment. Another scenario is that 29% conversion was recorded after 30 min runof PDH, followed by 28.5% conversion in the second run of PDH after the regeneration treatment.In these cases, which scenario is superior might be confused if we consider the conversion data for thesecond PDH run. In this case, 29% conversion may appear superior to 28.5% conversion. However,the reality is that the opposite may be true as 28.5% conversion corresponds to 98.2% (28.5/29 = 0.982)recovery after the regeneration treatment compared with 96.7% (29/30 = 0.967) recovery in the first case.Returning to Figure 1, the recovery for 3Pt4.5Sn-B (coke burning) reached only 0.56 in 3 h of PDH,while the recovery for PtSn-B-HCl5 reached 0.72, and that for PtSn-B-HCl35 was the highest at 0.79.HCl treatment clearly improved the catalyst activity. Figure 2 presents the selectivity recovery data.The selectivity recovery is represented the same as conversion recovery. All the data were within 0.05,which indicates no significant changes in the selectivity recovery for the three catalysts.
Catalysts 2020, 10, x FOR PEER REVIEW 4 of 17
20 40 60 80 100 120 140 160 180 2000.50
0.55
0.60
0.65
0.70
0.75
0.80
0.85
Con
vers
ion
Rec
over
y
Time on Stream(min)
PtSn-B PtSn-B-HCl5 PtSn-B-HCl35
Figure 1. Recovery of propane conversion over Pt-Sn/Al2O3. Reaction conditions—catalyst weight: 0.3 g; reaction temperature: 600 °C; and flow rate: N2:H2:C3H8 = 70:30:30 (mL/min), WHSV = 11.8 h−1.
20 40 60 80 100 120 140 160 180 2000.5
0.6
0.7
0.8
0.9
1.0
1.1
1.2
Sele
ctiv
ity R
ecov
ery
Time on Stream(min)
PtSn-B PtSn-B-HCl5 PtSn-B-HCl35
Figure 2. Recovery of propylene selectivity of Pt-Sn/Al2O3. Reaction conditions—catalyst weight: 0.3 g; reaction temperature: 600 °C; and flow rate: N2:H2:C3H8 = 70:30:30 (mL/min), WHSV = 11.8 h−1.
2.2. Catalyst Characterization
2.2.1. X-Ray Diffraction Analysis
Figure 3 shows the XRD patterns of the 3Pt4.5Sn/Al2O3 catalysts after various treatments. For comparison, the data for the catalysts after hydrogen reduction are also presented. The characteristic XRD peaks of Pt occur at 2θ = 41.72° and 46.24°. The Pt-Sn alloys in Pt-Sn catalysts often adopt the PtSn and Pt3Sn forms. These two alloys would contribute differently to the PDH reaction [38]. The
Figure 1. Recovery of propane conversion over Pt-Sn/Al2O3. Reaction conditions—catalyst weight:0.3 g; reaction temperature: 600 ◦C; and flow rate: N2:H2:C3H8 = 70:30:30 (mL/min), WHSV = 11.8 h−1.
Catalysts 2020, 10, 898 4 of 17
Catalysts 2020, 10, x FOR PEER REVIEW 4 of 17
20 40 60 80 100 120 140 160 180 2000.50
0.55
0.60
0.65
0.70
0.75
0.80
0.85
Con
vers
ion
Rec
over
y
Time on Stream(min)
PtSn-B PtSn-B-HCl5 PtSn-B-HCl35
Figure 1. Recovery of propane conversion over Pt-Sn/Al2O3. Reaction conditions—catalyst weight: 0.3 g; reaction temperature: 600 °C; and flow rate: N2:H2:C3H8 = 70:30:30 (mL/min), WHSV = 11.8 h−1.
20 40 60 80 100 120 140 160 180 2000.5
0.6
0.7
0.8
0.9
1.0
1.1
1.2
Sele
ctiv
ity R
ecov
ery
Time on Stream(min)
PtSn-B PtSn-B-HCl5 PtSn-B-HCl35
Figure 2. Recovery of propylene selectivity of Pt-Sn/Al2O3. Reaction conditions—catalyst weight: 0.3 g; reaction temperature: 600 °C; and flow rate: N2:H2:C3H8 = 70:30:30 (mL/min), WHSV = 11.8 h−1.
2.2. Catalyst Characterization
2.2.1. X-Ray Diffraction Analysis
Figure 3 shows the XRD patterns of the 3Pt4.5Sn/Al2O3 catalysts after various treatments. For comparison, the data for the catalysts after hydrogen reduction are also presented. The characteristic XRD peaks of Pt occur at 2θ = 41.72° and 46.24°. The Pt-Sn alloys in Pt-Sn catalysts often adopt the PtSn and Pt3Sn forms. These two alloys would contribute differently to the PDH reaction [38]. The
Figure 2. Recovery of propylene selectivity of Pt-Sn/Al2O3. Reaction conditions—catalyst weight: 0.3 g;reaction temperature: 600 ◦C; and flow rate: N2:H2:C3H8 = 70:30:30 (mL/min), WHSV = 11.8 h−1.
2.2. Catalyst Characterization
2.2.1. X-Ray Diffraction Analysis
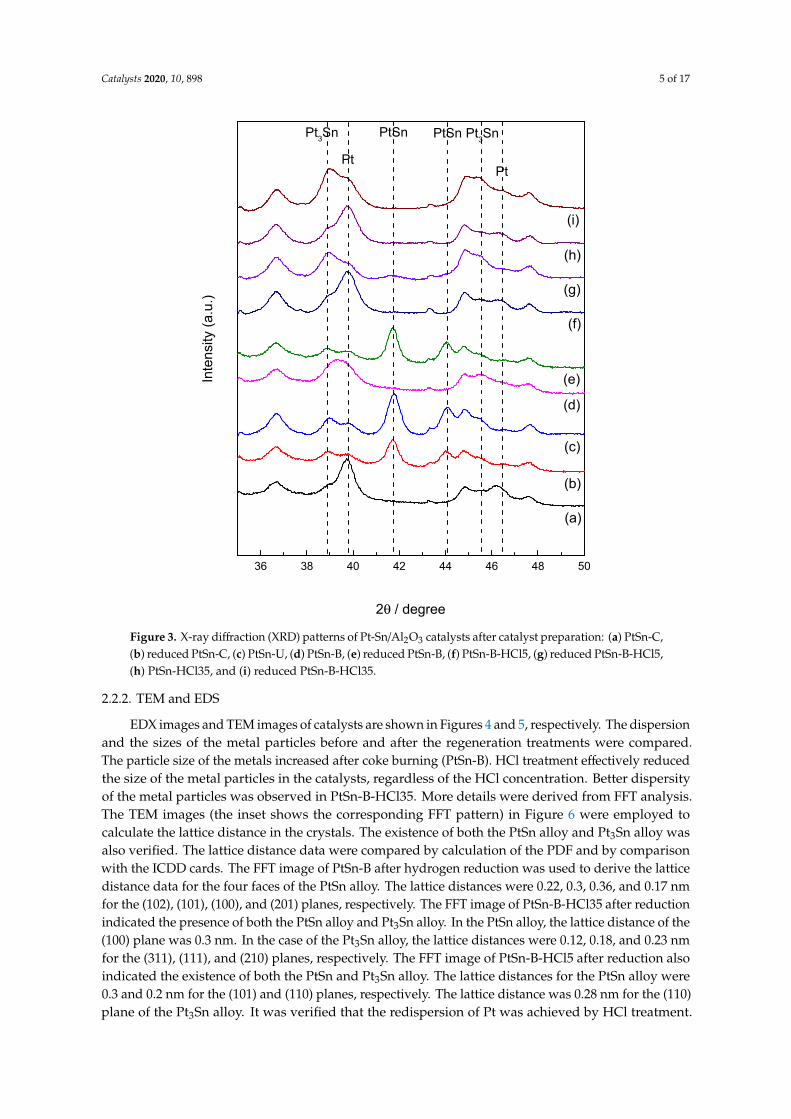
Figure 3 shows the XRD patterns of the 3Pt4.5Sn/Al2O3 catalysts after various treatments.For comparison, the data for the catalysts after hydrogen reduction are also presented. The characteristicXRD peaks of Pt occur at 2θ = 41.72◦ and 46.24◦. The Pt-Sn alloys in Pt-Sn catalysts often adoptthe PtSn and Pt3Sn forms. These two alloys would contribute differently to the PDH reaction [38].The characteristic XRD peaks of the two Pt-Sn alloys were identified separately at 2θ = 41.72◦ and44.05◦ for the PtSn alloy and 38.79◦ for the Pt3Sn alloy. It should be cautioned that the characteristicpeak of the Pt3Sn alloy often overlaps with the characteristic peak of alumina. As shown in Figure 3a,b,the characteristic peaks of Pt were observed in the profile of PtSn-C, but these peaks shifted tocorrespond to those of the PtSn alloy after hydrogen reduction. The particle growth of the PtSn alloyafter the PDH reaction (Figure 3c) is attributed to sintering. In general, sintering lowers the degree ofPt dispersion and increases the size of the Pt particles. After the PDH reaction, Pt particles were themain components of the PtSn-C and PtSn-B-HCl series (Figure 3d,f,h). After hydrogen reduction of thePtSn-B-HCl series, the characteristic peaks of Pt disappeared, suggesting that Pt may be effectivelydispersed, with a reduction of the particle size. Notably, the peaks of the Pt3Sn alloy appeared afterhydrogen reduction of the PtSn-B-HCl series (Figure 3g,i). In terms of the Pt-Sn alloys, the PtSn alloyhaving a Pt/Sn molar ratio of is 1:1 is often referred to; however, it is known that various forms, such asPtSn, Pt3Sn, and Pt2Sn3, are possible [39–43]. Vu et al. [44] presented the characteristic XRD peaks of thePt3Sn alloy and Sattler et al. [45] also verified the existence of the Pt3Sn alloy using TEM measurement.Both cases utilized propane feedstock. The reaction atmosphere may affect the formation of the Pt-Snalloys. Herein, a mixture of propane, hydrogen, and nitrogen was used.
Catalysts 2020, 10, 898 5 of 17
Catalysts 2020, 10, x FOR PEER REVIEW 5 of 17
characteristic XRD peaks of the two Pt-Sn alloys were identified separately at 2θ = 41.72° and 44.05° for the PtSn alloy and 38.79° for the Pt3Sn alloy. It should be cautioned that the characteristic peak of the Pt3Sn alloy often overlaps with the characteristic peak of alumina. As shown in Figure 3a,b, the characteristic peaks of Pt were observed in the profile of PtSn-C, but these peaks shifted to correspond to those of the PtSn alloy after hydrogen reduction. The particle growth of the PtSn alloy after the PDH reaction (Figure 3c) is attributed to sintering. In general, sintering lowers the degree of Pt dispersion and increases the size of the Pt particles. After the PDH reaction, Pt particles were the main components of the PtSn-C and PtSn-B-HCl series (Figure 3d,f,h). After hydrogen reduction of the PtSn-B-HCl series, the characteristic peaks of Pt disappeared, suggesting that Pt may be effectively dispersed, with a reduction of the particle size. Notably, the peaks of the Pt3Sn alloy appeared after hydrogen reduction of the PtSn-B-HCl series (Figure 3g,i). In terms of the Pt-Sn alloys, the PtSn alloy having a Pt/Sn molar ratio of is 1:1 is often referred to; however, it is known that various forms, such as PtSn, Pt3Sn, and Pt2Sn3, are possible [39–43]. Vu et al. [44] presented the characteristic XRD peaks of the Pt3Sn alloy and Sattler et al. [45] also verified the existence of the Pt3Sn alloy using TEM measurement. Both cases utilized propane feedstock. The reaction atmosphere may affect the formation of the Pt-Sn alloys. Herein, a mixture of propane, hydrogen, and nitrogen was used.
Figure 3. X-ray diffraction (XRD) patterns of Pt-Sn/Al2O3 catalysts after catalyst preparation: (a) PtSn-C, (b) reduced PtSn-C, (c) PtSn-U, (d) PtSn-B, (e) reduced PtSn-B, (f) PtSn-B-HCl5, (g) reduced PtSn-B-HCl5, (h) PtSn-HCl35, and (i) reduced PtSn-B-HCl35.
36 38 40 42 44 46 48 50
(i)
(h)
(g)
(f)
(a)
(b)
2θ / degree
Inte
nsity
(a.u
.)
(e)
(d)
(c)
PtPt
PtSnPtSn Pt3Sn
Pt3Sn
Figure 3. X-ray diffraction (XRD) patterns of Pt-Sn/Al2O3 catalysts after catalyst preparation: (a) PtSn-C,(b) reduced PtSn-C, (c) PtSn-U, (d) PtSn-B, (e) reduced PtSn-B, (f) PtSn-B-HCl5, (g) reduced PtSn-B-HCl5,(h) PtSn-HCl35, and (i) reduced PtSn-B-HCl35.
2.2.2. TEM and EDS
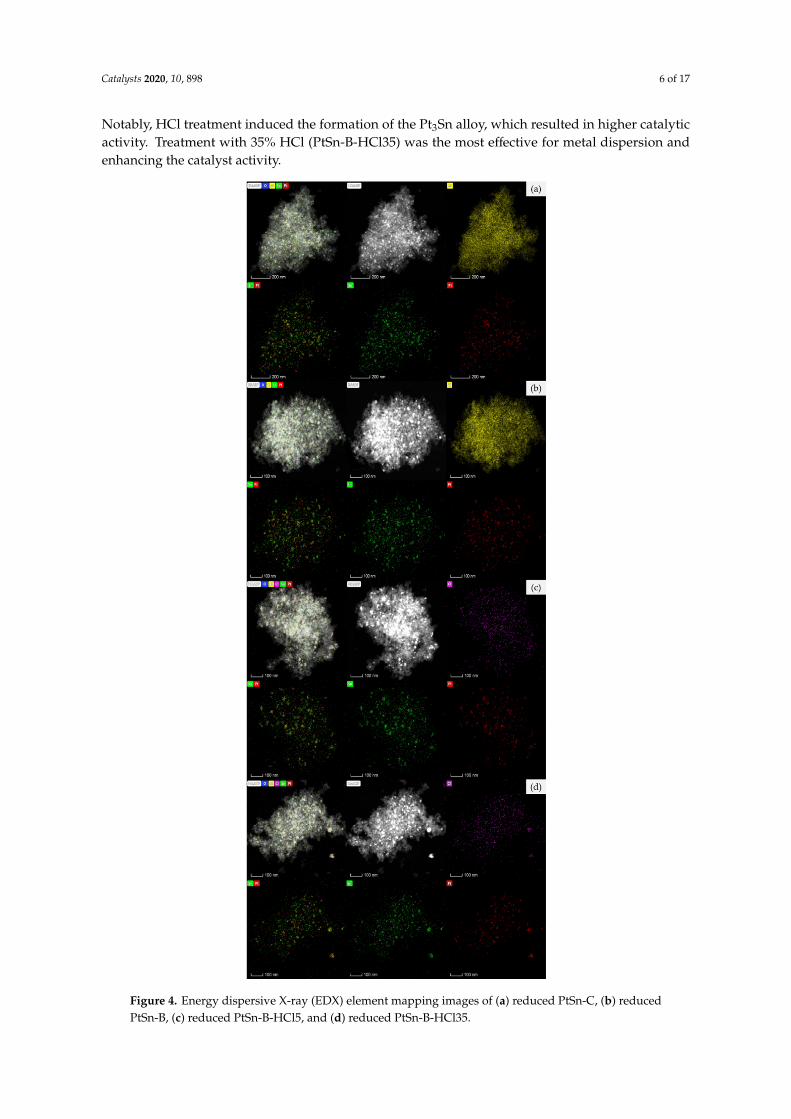
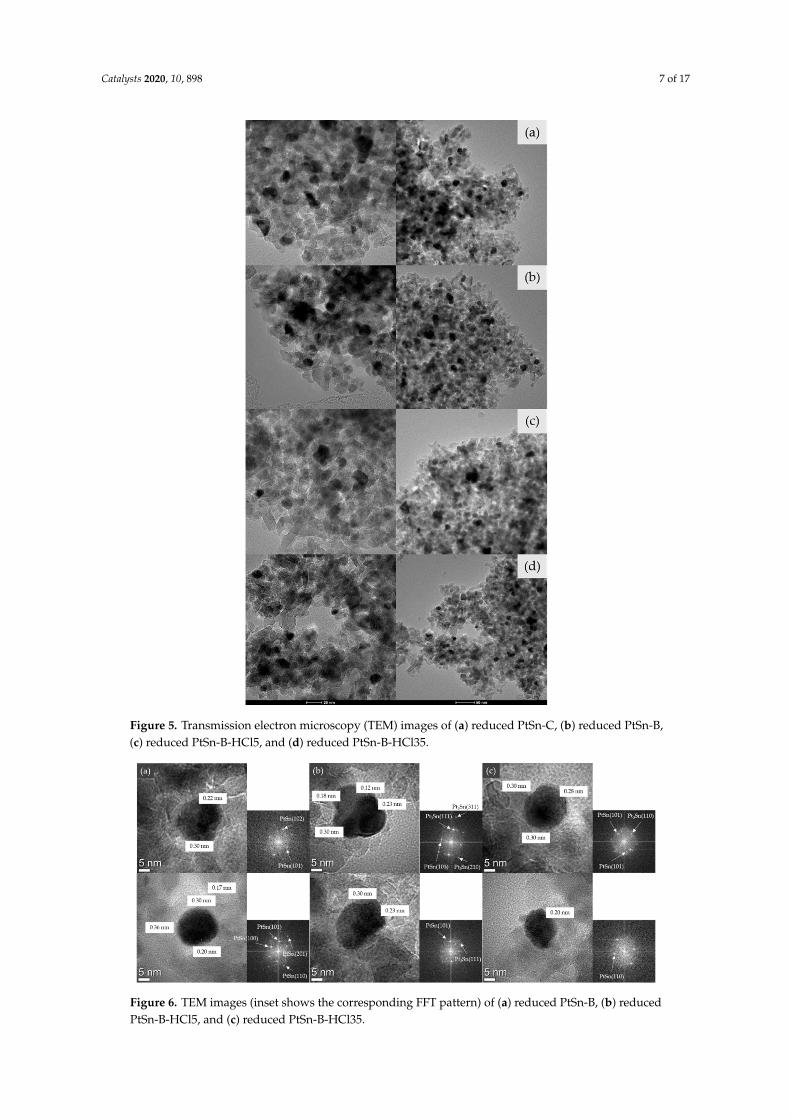
EDX images and TEM images of catalysts are shown in Figures 4 and 5, respectively. The dispersionand the sizes of the metal particles before and after the regeneration treatments were compared.The particle size of the metals increased after coke burning (PtSn-B). HCl treatment effectively reducedthe size of the metal particles in the catalysts, regardless of the HCl concentration. Better dispersityof the metal particles was observed in PtSn-B-HCl35. More details were derived from FFT analysis.The TEM images (the inset shows the corresponding FFT pattern) in Figure 6 were employed tocalculate the lattice distance in the crystals. The existence of both the PtSn alloy and Pt3Sn alloy wasalso verified. The lattice distance data were compared by calculation of the PDF and by comparisonwith the ICDD cards. The FFT image of PtSn-B after hydrogen reduction was used to derive the latticedistance data for the four faces of the PtSn alloy. The lattice distances were 0.22, 0.3, 0.36, and 0.17 nmfor the (102), (101), (100), and (201) planes, respectively. The FFT image of PtSn-B-HCl35 after reductionindicated the presence of both the PtSn alloy and Pt3Sn alloy. In the PtSn alloy, the lattice distance of the(100) plane was 0.3 nm. In the case of the Pt3Sn alloy, the lattice distances were 0.12, 0.18, and 0.23 nmfor the (311), (111), and (210) planes, respectively. The FFT image of PtSn-B-HCl5 after reduction alsoindicated the existence of both the PtSn and Pt3Sn alloy. The lattice distances for the PtSn alloy were0.3 and 0.2 nm for the (101) and (110) planes, respectively. The lattice distance was 0.28 nm for the (110)plane of the Pt3Sn alloy. It was verified that the redispersion of Pt was achieved by HCl treatment.
Catalysts 2020, 10, 898 6 of 17
Notably, HCl treatment induced the formation of the Pt3Sn alloy, which resulted in higher catalyticactivity. Treatment with 35% HCl (PtSn-B-HCl35) was the most effective for metal dispersion andenhancing the catalyst activity.Catalysts 2020, 10, x FOR PEER REVIEW 7 of 17
Figure 4. Energy dispersive X-ray (EDX) element mapping images of (a) reduced PtSn-C, (b) reduced PtSn-B, (c) reduced PtSn-B-HCl5, and (d) reduced PtSn-B-HCl35. Figure 4. Energy dispersive X-ray (EDX) element mapping images of (a) reduced PtSn-C, (b) reducedPtSn-B, (c) reduced PtSn-B-HCl5, and (d) reduced PtSn-B-HCl35.
Catalysts 2020, 10, 898 7 of 17
Catalysts 2020, 10, x FOR PEER REVIEW 8 of 17
Figure 5. Transmission electron microscopy (TEM) images of (a) reduced PtSn-C, (b) reduced PtSn-B, (c) reduced PtSn-B-HCl5, and (d) reduced PtSn-B-HCl35.
Figure 6. TEM images (inset shows the corresponding FFT pattern) of (a) reduced PtSn-B, (b) reduced PtSn-B-HCl5, and (c) reduced PtSn-B-HCl35.
Figure 5. Transmission electron microscopy (TEM) images of (a) reduced PtSn-C, (b) reduced PtSn-B,(c) reduced PtSn-B-HCl5, and (d) reduced PtSn-B-HCl35.
Catalysts 2020, 10, x FOR PEER REVIEW 8 of 17
Figure 5. Transmission electron microscopy (TEM) images of (a) reduced PtSn-C, (b) reduced PtSn-B, (c) reduced PtSn-B-HCl5, and (d) reduced PtSn-B-HCl35.
Figure 6. TEM images (inset shows the corresponding FFT pattern) of (a) reduced PtSn-B, (b) reduced PtSn-B-HCl5, and (c) reduced PtSn-B-HCl35.
Figure 6. TEM images (inset shows the corresponding FFT pattern) of (a) reduced PtSn-B, (b) reducedPtSn-B-HCl5, and (c) reduced PtSn-B-HCl35.
Catalysts 2020, 10, 898 8 of 17
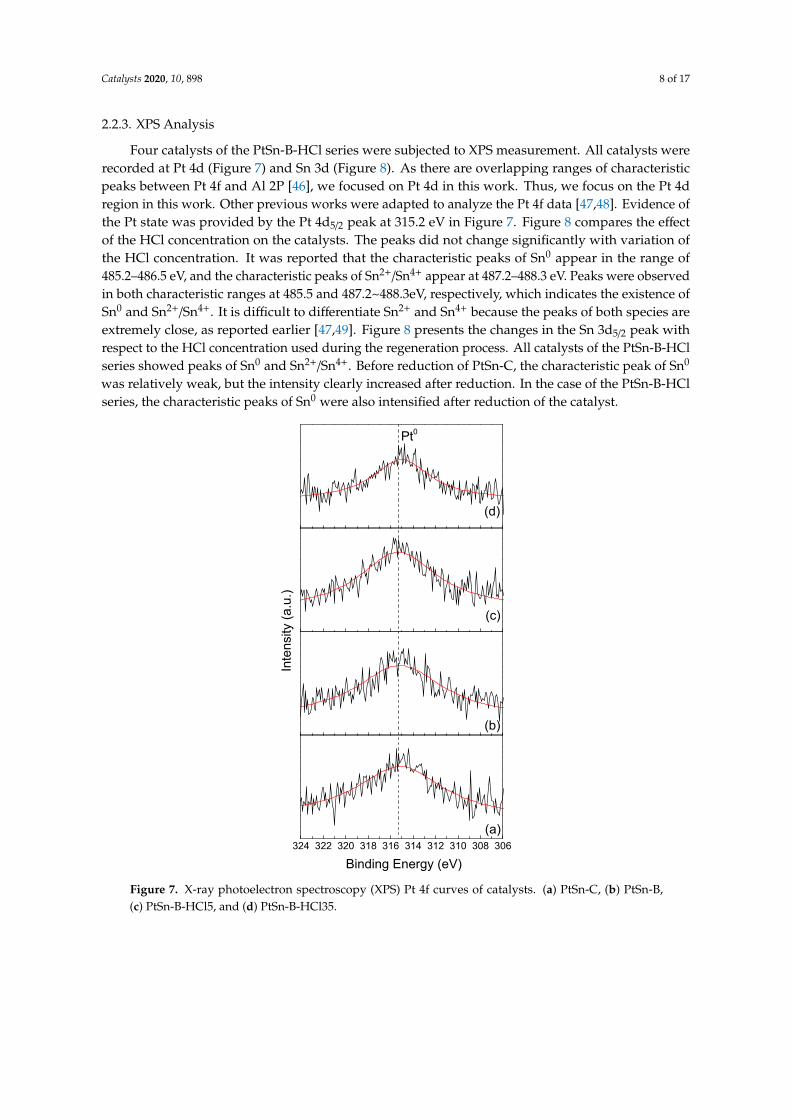
2.2.3. XPS Analysis
Four catalysts of the PtSn-B-HCl series were subjected to XPS measurement. All catalysts wererecorded at Pt 4d (Figure 7) and Sn 3d (Figure 8). As there are overlapping ranges of characteristicpeaks between Pt 4f and Al 2P [46], we focused on Pt 4d in this work. Thus, we focus on the Pt 4dregion in this work. Other previous works were adapted to analyze the Pt 4f data [47,48]. Evidence ofthe Pt state was provided by the Pt 4d5/2 peak at 315.2 eV in Figure 7. Figure 8 compares the effectof the HCl concentration on the catalysts. The peaks did not change significantly with variation ofthe HCl concentration. It was reported that the characteristic peaks of Sn0 appear in the range of485.2–486.5 eV, and the characteristic peaks of Sn2+/Sn4+ appear at 487.2–488.3 eV. Peaks were observedin both characteristic ranges at 485.5 and 487.2~488.3eV, respectively, which indicates the existence ofSn0 and Sn2+/Sn4+. It is difficult to differentiate Sn2+ and Sn4+ because the peaks of both species areextremely close, as reported earlier [47,49]. Figure 8 presents the changes in the Sn 3d5/2 peak withrespect to the HCl concentration used during the regeneration process. All catalysts of the PtSn-B-HClseries showed peaks of Sn0 and Sn2+/Sn4+. Before reduction of PtSn-C, the characteristic peak of Sn0
was relatively weak, but the intensity clearly increased after reduction. In the case of the PtSn-B-HClseries, the characteristic peaks of Sn0 were also intensified after reduction of the catalyst.
Catalysts 2020, 10, x FOR PEER REVIEW 9 of 17
2.2.3. XPS Analysis
Four catalysts of the PtSn-B-HCl series were subjected to XPS measurement. All catalysts were recorded at Pt 4d (Figure 7) and Sn 3d (Figure 8). As there are overlapping ranges of characteristic peaks between Pt 4f and Al 2P [46], we focused on Pt 4d in this work. Thus, we focus on the Pt 4d region in this work. Other previous works were adapted to analyze the Pt 4f data [47,48]. Evidence of the Pt state was provided by the Pt 4d5/2 peak at 315.2 eV in Figure 7. Figure 8 compares the effect of the HCl concentration on the catalysts. The peaks did not change significantly with variation of the HCl concentration. It was reported that the characteristic peaks of Sn0 appear in the range of 485.2‒486.5 eV, and the characteristic peaks of Sn2+/Sn4+ appear at 487.2‒488.3 eV. Peaks were observed in both characteristic ranges at 485.5 and 487.2~488.3eV, respectively, which indicates the existence of Sn0 and Sn2+/Sn4+. It is difficult to differentiate Sn2+ and Sn4+ because the peaks of both species are extremely close, as reported earlier [47,49]. Figure 8 presents the changes in the Sn 3d5/2
peak with respect to the HCl concentration used during the regeneration process. All catalysts of the PtSn-B-HCl series showed peaks of Sn0 and Sn2+/Sn4+. Before reduction of PtSn-C, the characteristic peak of Sn0 was relatively weak, but the intensity clearly increased after reduction. In the case of the PtSn-B-HCl series, the characteristic peaks of Sn0 were also intensified after reduction of the catalyst.
Pt0
(d)
(c)
(b)
(a)
324 322 320 318 316 314 312 310 308 306
Binding Energy (eV)
Inte
nsity
(a.u
.)
Figure 7. X-ray photoelectron spectroscopy (XPS) Pt 4f curves of catalysts. (a) PtSn-C, (b) PtSn-B, (c) PtSn-B-HCl5, and (d) PtSn-B-HCl35.
Figure 7. X-ray photoelectron spectroscopy (XPS) Pt 4f curves of catalysts. (a) PtSn-C, (b) PtSn-B,(c) PtSn-B-HCl5, and (d) PtSn-B-HCl35.

Catalysts 2020, 10, 898 9 of 17
Catalysts 2020, 10, x FOR PEER REVIEW 10 of 17
Sn0
Sn2+,4+ (d)
(c)
(b)
(a)
492 490 488 486 484 482
Inte
nsity
(a.u
.)
Binding Energy (eV)
492 490 488 486 484 482
Binding Energy (eV)
Inte
nsity
(a.u
.)
(e)
(f)
(g)
(h)Sn2+,4+
Sn0
Figure 8. XPS Sn 3d curves of catalysts. (a) PtSn-C, (b) PtSn-B, (c) PtSn-B-HCl5, (d) PtSn-B-HCl35, (e) reduced PtSn-C, (f) reduced PtSn-B, (g) reduced PtSn-B-HCl5, and (h) reduced PtSn-B-HCl35.
2.2.4. TPR Analysis
TPR analysis was performed to examine the interaction between the catalyst support and metal particles. Two peaks were noticeable for PtSn-C at 330 °C (weak) and 400 °C (strong). The TPR profiles of all catalysts showed two peaks, presenting evidence of reduction. In the case of the regenerated catalysts, the two peaks at 330 °C and 400 °C almost disappeared, while two new peaks appeared in the ranges of 280‒330 °C and 480‒530 °C. Under the various regeneration conditions, the peak at 330 °C for PtSn-C shifted to the lower temperature range of 280‒330 °C and the peak became more intense. The peaks at 280‒330 °C for the three catalysts were attributed to Pt oxides. In general, the characteristic TPR peak of the Pt particles appeared at 200 °C or lower. The peak shift to 280‒330 °C, that is, higher than 200 °C, was presumed to be owing to Sn addition. The first peak was observed at 330, 283, 297, and 323 °C for PtSn-CPtSn-B, PtSn-B-HCl5, and PtSn-B-HCl35, respectively. Notably, the first peak of PtSn-C and PtSn-B-HCl35 occurred at very close temperatures, which implies that similar catalytic activity can be expected for PtSn-C and PtSn-B-HCl35. When PtSn-C was initially prepared, the average distance between Pt and Sn appeared to relatively small because of the impregnation method used in this work. In the case of PtSn-B, the TPR curves showed that the overall interactions between Pt and Sn became less. This may be because Pt sintering was accelerated during coke burning. Returning to Figure 3d, Sn present in the PtSn alloy may be expelled to form Sn oxides, leaving more individual Pt from the PtSn alloy phase. If subsequent HCl treatment is performed, the behaviors of Pt and Sn will be altered. In the case of Sn, HCl treatment may dissolve Sn/SnOx located on the surfaces of the Pt particles and/or alumina support, and in the edges between Pt and the
Figure 8. XPS Sn 3d curves of catalysts. (a) PtSn-C, (b) PtSn-B, (c) PtSn-B-HCl5, (d) PtSn-B-HCl35,(e) reduced PtSn-C, (f) reduced PtSn-B, (g) reduced PtSn-B-HCl5, and (h) reduced PtSn-B-HCl35.
2.2.4. TPR Analysis
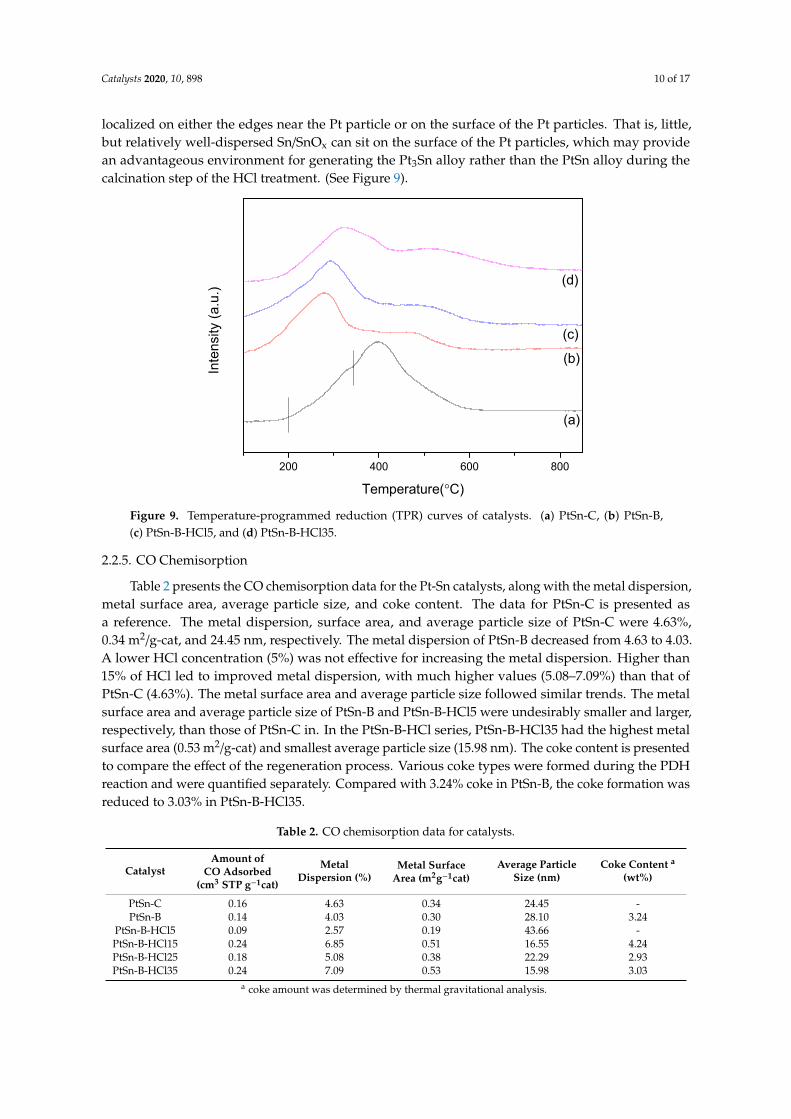
TPR analysis was performed to examine the interaction between the catalyst support and metalparticles. Two peaks were noticeable for PtSn-C at 330 ◦C (weak) and 400 ◦C (strong). The TPR profilesof all catalysts showed two peaks, presenting evidence of reduction. In the case of the regeneratedcatalysts, the two peaks at 330 ◦C and 400 ◦C almost disappeared, while two new peaks appearedin the ranges of 280–330 ◦C and 480–530 ◦C. Under the various regeneration conditions, the peak at330 ◦C for PtSn-C shifted to the lower temperature range of 280–330 ◦C and the peak became moreintense. The peaks at 280–330 ◦C for the three catalysts were attributed to Pt oxides. In general,the characteristic TPR peak of the Pt particles appeared at 200 ◦C or lower. The peak shift to 280–330 ◦C,that is, higher than 200 ◦C, was presumed to be owing to Sn addition. The first peak was observed at 330,283, 297, and 323 ◦C for PtSn-CPtSn-B, PtSn-B-HCl5, and PtSn-B-HCl35, respectively. Notably, the firstpeak of PtSn-C and PtSn-B-HCl35 occurred at very close temperatures, which implies that similarcatalytic activity can be expected for PtSn-C and PtSn-B-HCl35. When PtSn-C was initially prepared,the average distance between Pt and Sn appeared to relatively small because of the impregnationmethod used in this work. In the case of PtSn-B, the TPR curves showed that the overall interactionsbetween Pt and Sn became less. This may be because Pt sintering was accelerated during coke burning.Returning to Figure 3d, Sn present in the PtSn alloy may be expelled to form Sn oxides, leaving moreindividual Pt from the PtSn alloy phase. If subsequent HCl treatment is performed, the behaviors of Ptand Sn will be altered. In the case of Sn, HCl treatment may dissolve Sn/SnOx located on the surfacesof the Pt particles and/or alumina support, and in the edges between Pt and the alumina support.Consequently, HCl treatment could force Sn/SnOx to migrate some distance from the Pt-occupied sites.Quantitatively, the majority of Sn may stay on the surface of the alumina support and little may be
Catalysts 2020, 10, 898 10 of 17
localized on either the edges near the Pt particle or on the surface of the Pt particles. That is, little,but relatively well-dispersed Sn/SnOx can sit on the surface of the Pt particles, which may providean advantageous environment for generating the Pt3Sn alloy rather than the PtSn alloy during thecalcination step of the HCl treatment. (See Figure 9).
Catalysts 2020, 10, x FOR PEER REVIEW 11 of 17
alumina support. Consequently, HCl treatment could force Sn/SnOx to migrate some distance from the Pt-occupied sites. Quantitatively, the majority of Sn may stay on the surface of the alumina support and little may be localized on either the edges near the Pt particle or on the surface of the Pt particles. That is, little, but relatively well-dispersed Sn/SnOx can sit on the surface of the Pt particles, which may provide an advantageous environment for generating the Pt3Sn alloy rather than the PtSn alloy during the calcination step of the HCl treatment. (See Figure 9)
200 400 600 800
(d)
(c)
(b)
Inte
nsity
(a.u
.)
Temperature(°C)
(a)
Figure 9. Temperature-programmed reduction (TPR) curves of catalysts. (a) PtSn-C, (b) PtSn-B, (c) PtSn-B-HCl5, and (d) PtSn-B-HCl35.
2.2.5. CO Chemisorption
Table 2 presents the CO chemisorption data for the Pt-Sn catalysts, along with the metal dispersion, metal surface area, average particle size, and coke content. The data for PtSn-C is presented as a reference. The metal dispersion, surface area, and average particle size of PtSn-C were 4.63%, 0.34 m2/g-cat, and 24.45 nm, respectively. The metal dispersion of PtSn-B decreased from 4.63 to 4.03. A lower HCl concentration (5%) was not effective for increasing the metal dispersion. Higher than 15% of HCl led to improved metal dispersion, with much higher values (5.08‒7.09%) than that of PtSn-C (4.63%). The metal surface area and average particle size followed similar trends. The metal surface area and average particle size of PtSn-B and PtSn-B-HCl5 were undesirably smaller and larger, respectively, than those of PtSn-C in. In the PtSn-B-HCl series, PtSn-B-HCl35 had the highest metal surface area (0.53 m2/g-cat) and smallest average particle size (15.98 nm). The coke content is presented to compare the effect of the regeneration process. Various coke types were formed during the PDH reaction and were quantified separately. Compared with 3.24% coke in PtSn-B, the coke formation was reduced to 3.03% in PtSn-B-HCl35.
Table 2. CO chemisorption data for catalysts.
Catalyst Amount of CO Adsorbed (cm3
STP g‒1cat)
Metal Dispersion
(%)
Metal Surface Area (m2g‒
1cat)
Average Particle Size
(nm)
Coke Contenta (wt%)
PtSn-C 0.16 4.63 0.34 24.45 -
PtSn-B 0.14 4.03 0.30 28.10 3.24
Figure 9. Temperature-programmed reduction (TPR) curves of catalysts. (a) PtSn-C, (b) PtSn-B,(c) PtSn-B-HCl5, and (d) PtSn-B-HCl35.
2.2.5. CO Chemisorption
Table 2 presents the CO chemisorption data for the Pt-Sn catalysts, along with the metal dispersion,metal surface area, average particle size, and coke content. The data for PtSn-C is presented asa reference. The metal dispersion, surface area, and average particle size of PtSn-C were 4.63%,0.34 m2/g-cat, and 24.45 nm, respectively. The metal dispersion of PtSn-B decreased from 4.63 to 4.03.A lower HCl concentration (5%) was not effective for increasing the metal dispersion. Higher than15% of HCl led to improved metal dispersion, with much higher values (5.08–7.09%) than that ofPtSn-C (4.63%). The metal surface area and average particle size followed similar trends. The metalsurface area and average particle size of PtSn-B and PtSn-B-HCl5 were undesirably smaller and larger,respectively, than those of PtSn-C in. In the PtSn-B-HCl series, PtSn-B-HCl35 had the highest metalsurface area (0.53 m2/g-cat) and smallest average particle size (15.98 nm). The coke content is presentedto compare the effect of the regeneration process. Various coke types were formed during the PDHreaction and were quantified separately. Compared with 3.24% coke in PtSn-B, the coke formation wasreduced to 3.03% in PtSn-B-HCl35.
Table 2. CO chemisorption data for catalysts.
CatalystAmount of
CO Adsorbed(cm3 STP g−1cat)
MetalDispersion (%)
Metal SurfaceArea (m2g−1cat)
Average ParticleSize (nm)
Coke Content a
(wt%)
PtSn-C 0.16 4.63 0.34 24.45 -PtSn-B 0.14 4.03 0.30 28.10 3.24
PtSn-B-HCl5 0.09 2.57 0.19 43.66 -PtSn-B-HCl15 0.24 6.85 0.51 16.55 4.24PtSn-B-HCl25 0.18 5.08 0.38 22.29 2.93PtSn-B-HCl35 0.24 7.09 0.53 15.98 3.03
a coke amount was determined by thermal gravitational analysis.
Catalysts 2020, 10, 898 11 of 17
3. Discussion
The results show that two major factors affect the generation of the Pt3Sn alloy during theregeneration process. One is the initial molar ratio between Pt and Sn during catalyst preparation.The other is the specific treatment for regeneration, such as the oxychlorination process. In our previousstudy [32], the Pt/Sn ratio of was set to 1 to 0.5 by weight, which corresponds to a Pt/Sn molar ratio of1.23 to 1. When the fresh catalyst was prepared, there was no evidence of the Pt3Sn alloy. After thefirst run of PDH, no Pt3Sn alloy was detected, even after coke burning. Coke burning was used asthe primary process for regeneration of the Pt-Sn catalyst, followed by oxychlorination treatment as asecond process. HCl and air were fed into the reactor at a high temperature of 550 ◦C [32], after whichthe Pt3Sn alloy was detected by XRD. Thus, generation of the Pt3Sn alloy was triggered by the secondaryoxychlorination treatment. Another study used the molar ratio of 1 to 1 for Pt to Sn [50]. In that case,direct reduction was employed and the Pt3Sn alloy was detected in the fresh catalysts. Direct reductionwas attempted before the first run of PDH in that case. In this work, the Pt/Sn ratio was set to 3 to 4.5by weight, which is close to the Pt/Sn molar ratio of 1 to 2.5. If the molar ratio of Pt/Sn is less than 1,the Pt3Sn alloy is hardly formed, whereas formation of the PtSn alloy is favored. As expected, the Pt3Snalloy was not detected in the fresh catalyst, even after coke burning. However, the Pt3Sn alloy wasformed after HCl treatment. The present HCl treatment includes immersion, drying, and calcination,which is analogous to our prior oxychlorination treatment [32]. It seems that calcination plays arole similar to oxychlorination in dispersing the Pt particles as well as generating the Pt3Sn alloy.As mentioned above, the initial Pt/Sn weight ratio was controlled to 3 to 4.5, which appears to favorformation of the PtSn alloy than Pt3Sn in the initial condition. During HCl treatment, the interactionsbetween Pt and HCl and between Sn/SnOx and HCl may contribute differently to forming the Pt-Snalloys. If concentrated liquid HCl easily dissolves and migrates Sn/SnOx constituents far from the sitesnearby Pt, the interfaces between Pt and Sn/SnOx may change to lower, but more well-dispersed SnOx
on the surface of Pt particles. If this happens, a lesser amount of wished-off Sn/SnOx can be placed onthe surface of Pt particles, where we defined the Pt-rich phase. If Pt particles in the Pt-rich phase mayredisperse during calcination for HCl treatment, Pt3Sn alloy is more favorably generated than PtSnalloy. This is different with the case after coke burning only. That is, when coke burning proceeds,Pt and Sn/SnOx could not migrate too far from original locations. If this is true, PtSn alloy is morefavorable to form than Pt3Sn alloy during coke burning.
4. Materials and Methods
4.1. Catalyst Preparation
The overall procedure for preparing Pt-Sn/Al2O3 is similar to the method published earlier [50].Aluminum-oxide-supported Pt-Sn catalysts were prepared with 3 wt.% Pt and 4.5 wt.% Sn usinghydrogen hexachloroplatinate(IV) hydrate (H2PtCl6·6H2O, Kojima Chemicals, Saitama, Japan) andtin(II) chloride (SnCl2, Sigma-Aldrich, St. Louis, MO, USA, >98%) through a co-impregnation methodusing ethanol (C2H5OH, 99.5%, Daejung, Seoul, Korea). The catalysts were dried at 110 ◦C for 12 hunder air atmosphere in an oven and then calcined at 600 ◦C for 4 h at a heating rate of 5 ◦C min−1.
4.2. Catalytic Activity Measurements
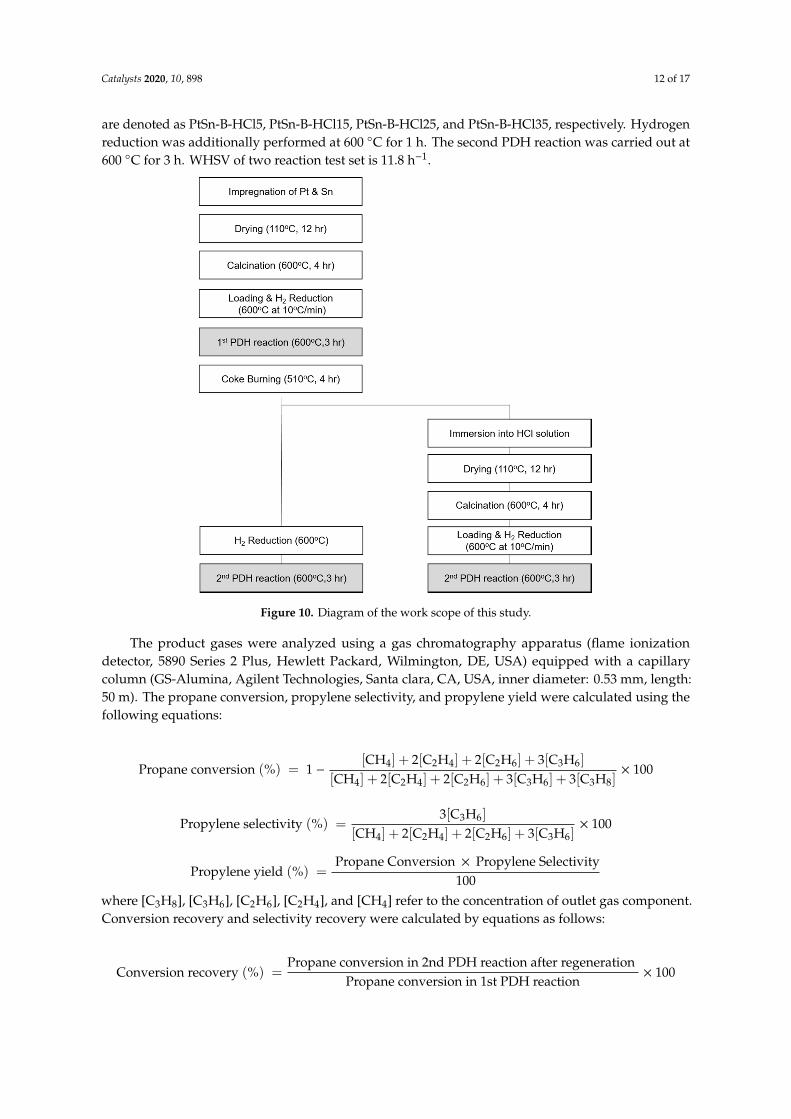
The work scope of this study is presented in Figure 10. The catalytic activity during the PDHreaction was evaluated in a fixed-bed quartz reactor (inner diameter of 18 mm) using 0.3 g of catalyst.The PDH reaction was carried out at 600 ◦C for 3 h at atmospheric pressure in the presence of C3H8
(30 mL min−1), H2 (30 mL min−1), and N2 (70 mL min−1). Before the PDH reaction, the samples wereheated to 600 ◦C at 10 ◦C min−1 in the presence of H2 (30 mL min−1) and N2 (100 mL min−1). After thePDH reaction, coke burning was carried out under air atmosphere at 510 ◦C for 4 h. Hydrochloricacid (HCl) treatment was performed using four different concentrations: 5, 15, 25, and 35% by weight.After HCl treatment, the catalyst was dried at 110 ◦C for 12 h and calcined at 600 ◦C for 4 h. These amples
Catalysts 2020, 10, 898 12 of 17
are denoted as PtSn-B-HCl5, PtSn-B-HCl15, PtSn-B-HCl25, and PtSn-B-HCl35, respectively. Hydrogenreduction was additionally performed at 600 ◦C for 1 h. The second PDH reaction was carried out at600 ◦C for 3 h. WHSV of two reaction test set is 11.8 h−1.
Catalysts 2020, 10, x FOR PEER REVIEW 13 of 17
4.2. Catalytic Activity Measurements
The work scope of this study is presented in Figure 10. The catalytic activity during the PDH reaction was evaluated in a fixed-bed quartz reactor (inner diameter of 18 mm) using 0.3 g of catalyst. The PDH reaction was carried out at 600 °C for 3 h at atmospheric pressure in the presence of C3H8 (30 mL min‒1), H2 (30 mL min‒1), and N2 (70 mL min‒1). Before the PDH reaction, the samples were heated to 600 °C at 10 °C min‒1 in the presence of H2 (30 mL min‒1) and N2 (100 mL min‒1). After the PDH reaction, coke burning was carried out under air atmosphere at 510 °C for 4 h. Hydrochloric acid (HCl) treatment was performed using four different concentrations: 5, 15, 25, and 35% by weight. After HCl treatment, the catalyst was dried at 110 °C for 12 h and calcined at 600 °C for 4 h. These samples are denoted as PtSn-B-HCl5, PtSn-B-HCl15, PtSn-B-HCl25, and PtSn-B-HCl35, respectively. Hydrogen reduction was additionally performed at 600 °C for 1 h. The second PDH reaction was carried out at 600 °C for 3 h. WHSV of two reaction test set is 11.8 h−1.
Figure 10. Diagram of the work scope of this study.
The product gases were analyzed using a gas chromatography apparatus (flame ionization detector, 5890 Series 2 Plus, Hewlett Packard, Wilmington, DE, USA) equipped with a capillary column (GS-Alumina, Agilent Technologies, Santa clara, CA, USA, inner diameter: 0.53 mm, length: 50 m). The propane conversion, propylene selectivity, and propylene yield were calculated using the following equations:
Propane conversion (%) = 1 − − × 100
Propylene selectivity (%) = × 100
Propylene yield (%) = where [C3H8], [C3H6], [C2H6], [C2H4], and [CH4] refer to the concentration of outlet gas component. Conversion recovery and selectivity recovery were calculated by equations as follows: Conversion recovery (%) = × 100
Selectivity recovery (%) = × 100
Figure 10. Diagram of the work scope of this study.
The product gases were analyzed using a gas chromatography apparatus (flame ionizationdetector, 5890 Series 2 Plus, Hewlett Packard, Wilmington, DE, USA) equipped with a capillarycolumn (GS-Alumina, Agilent Technologies, Santa clara, CA, USA, inner diameter: 0.53 mm, length:50 m). The propane conversion, propylene selectivity, and propylene yield were calculated using thefollowing equations:
Propane conversion (%) = 1 −[CH4] + 2[C2H4] + 2[C2H6] + 3[C3H6]
[CH4] + 2[C2H4] + 2[C2H6] + 3[C3H6] + 3[C3H8]× 100
Propylene selectivity (%) =3[C3H6]
[CH4] + 2[C2H4] + 2[C2H6] + 3[C3H6]× 100
Propylene yield (%) =Propane Conversion × Propylene Selectivity
100where [C3H8], [C3H6], [C2H6], [C2H4], and [CH4] refer to the concentration of outlet gas component.Conversion recovery and selectivity recovery were calculated by equations as follows:
Conversion recovery (%) =Propane conversion in 2nd PDH reaction after regeneration
Propane conversion in 1st PDH reaction× 100
Catalysts 2020, 10, 898 13 of 17
Selectivity recovery (%) =Propylene selectivity in 2nd PDH reaction after regeneration
Propylene selectivity in 1st PDH reaction× 100
4.3. Characterization
The crystalline phases of Pt-Sn/Al2O3 and regenerated Pt-Sn/Al2O3 were examined using XRD(D’Max 2500/PC, Rigaku, tokyo, Japan). The operating voltage and current were 40 kV and 200 mA,respectively. Scanning was performed in the 2θ range 20◦–90◦, at a scanning rate of 4◦ min−1.TEM images were obtained using FEI Tecnai G2-20 S-Twin and FEI TitanTM 80–300 instruments(Hillsboro, OR, USA) operating at an accelerating voltage of 200 kV. TEM mapping images wereobtained using an FEI transmission electron microscope (Hillsboro, OR, USA). The metal dispersionwas measured by CO chemisorption using a Micromeritics ASAP2020 volumetric analyzer (Norcross,GA, USA). A fixed amount of each catalyst (0.5 g) was treated under He gas flow at 110 ◦C for 0.5 h.Subsequently, the pretreated catalysts were heated from room temperature to 350 ◦C under pure H2
flow for 3 h. In the subsequent reduction, a purge step was performed under He gas flow at thesame temperature for 2 h. The sample was cooled to 35 ◦C and purged under He gas flow for 2 h.After pretreatment, the catalyst was subjected to a flow of CO as an adsorbate for total adsorptionmeasurements. Afterward, the catalyst was evacuated to remove the physically adsorbed CO, and theCO flow was initiated again for the physical adsorption measurements. The amount of chemisorbed COwas determined by analyzing the difference between the two quantities of adsorbed CO. To analyze thechemical states of the elements, XPS spectra were obtained with a PHI 5000 Versa Probe spectrometer(Ulvac-PHI) equipped with a monochromatic electroanalyzer (Kanagawa, Japan) and a monochromaticAl-Kα 150 W X-ray source.
Temperature-programmed reduction (TPR) was used to measure the reducibility of the catalystsusing a Micromeritics Auto-Chem II 2910 apparatus (Norcross, GA, USA). The samples (0.1 g) wereloaded into the quartz reactor. Prior to TPR analysis, the samples were dried under flowing N2 at 500 ◦Cfor 1 h (30 mL min−1). The TPR profiles were then recorded under 10% H2/Ar flow in the temperaturerange of 50–900 ◦C at a heating rate of 10 ◦C min−1. The hydrogen consumption was continuouslymonitored as a function of the reduction temperature by a TCD cell and recorded. The amount ofcoke after the propane dehydrogenation of the spent catalysts was determined by thermogravimetricanalyzer (SDT Q600, TA Instruments, New Castle, DE, USA) from room temperature to 850 ◦C at 5 ◦Cmin−1 under flowing air (100 mL min−1).
5. Conclusions
Pt-Sn catalysts are widely used in PDH. Coke generation during PDH is inevitable, and thegenerated coke must be removed from the catalyst periodically. Coke burning is a typical option forcatalyst regeneration. However, coke burning results in extensive Pt sintering. In order to maintain thecatalyst activity, an extended treatment was explored for redispersing the metal catalysts. In our priorwork, oxychlorination treatment after coke burning was attempted, and enhanced the performancein successive PDH runs. In this work, Pt-Sn/Al2O3 catalysts were regenerated by treatment withliquid hydrochloric acid after coke burning. Here, the protocol of HCl treatment includes three stages:immersion of the catalysts in liquid HCl solution, drying, and calcination. The results suggest that thecurrent HCl treatment may be effective for regenerating Pt-Sn catalysts supported on alumina. The Ptand Sn loadings used in the fresh catalyst were 3 and 4.5% by weight (PtSn-C). For clear comparison,we coined two new terms: the conversion recovery and the selectivity recovery. The conversion andselectivity recovery were calculated as the ratio of the propane conversion and propylene selectivity,respectively, for the first PDH run versus the second PDH run. Propane conversion recovery wasachieved by HCl treatment. This study focuses on evaluating the effectiveness of HCl treatment aftercoke burning. The catalysts subjected to HCl treatment were termed the PtSn-B-HCl series. The effect
Catalysts 2020, 10, 898 14 of 17
of different HCl concentrations (5–35% w/w in water) was examined, where the HCl-treated catalystsare termed PtSn-B-HCl5 to PtSn-B-HCl35. The optimal conversion recovery was achieved by treatmentwith 35% HCl (PtSn-B-HCl35). The improved catalyst activity is attributed to two factors: effectiveredispersion of the Pt particles and formation of the Pt3Sn alloy. HCl treatment acted analogously tooxychlorination treatment. It seems that the calcination during HCl treatment played a similar roleas oxychlorination in dispersing the Pt particles as well as generating the Pt3Sn alloy. As mentionedabove, the initial ratios of Pt and Sn were controlled to 3 to 4.5, which is more favorable for formingthe PtSn alloy rather than Pt3Sn during hydrogen reduction. With the addition of hydrochloric acid,the interactions between Pt and HCl and between Sn/SnOx and HCl may contribute differently toinducing the formation of different Pt-Sn alloys. If Sn/SnOx is easily dissolved in HCl and migratesaway from the Pt sites, the interfaces between Pt and Sn/SnOx change to less, but well-dispersed SnOx
on the surface of the Pt particles, which we defined as a Pt-rich phase. If the Pt particles in the Pt-richphase are effectively redispersed during calcination for HCl treatment, the Pt3Sn alloy is more favorablygenerated than the PtSn alloy. This is different from the case after plain coke burning. In other words,during coke burning, Pt and Sn/SnOx cannot migrate too far from the original sites. In such a case,the PtSn alloy is generated in preference to the Pt3Sn alloy after the ensuing reduction. Because moreSnOx covers the surface of the Pt particles, where the ratio of Pt to Sn may be larger than 1, the PtSnalloy is favorably formed during the ensuing reduction process. In addition, redispersion of the metalswas examined by TPR. Both coke burning and HCl treatment led to separation of the Pt and SnOx
phases. However, after HCl treatment, the degree of separation between the Pt and SnOx phases wasrecovered to the initial condition. The improved redispersion was also verified by CO chemisorption.The metal dispersion, metal surface area, and average particle size were all improved for PtSn-B-HCl35after HCl treatment compared with the plain coke burning process. HCl treatment may be applicableto the regeneration of catalysts in PDH plants. In industrial PDH operation, chlorine gas or CCl4 can beadded to regenerate Pt-Sn catalyst after coke burning. If the concept of this study works, we can expectto use concentrated HCl for alternative treatment to current chlorine-based oxychlorination options.
Author Contributions: The experimental work was designed and performed by Y.S.C.; K.-D.J. and W.-I.K.analyzed the data; writing, review, and editing were done by K.O.; writing and original draft preparation weredone by H.L.K. All authors have read and agreed to the published version of the manuscript.
Funding: This work was financed by the Basic Science Research Program through the National ResearchFoundation of Korea (NRF) funded by the Ministry of Education (2017R1D1A1B03034244).
Conflicts of Interest: The authors declare no conflicts of interest.
References
1. Wannapakdee, W.; Yutthalekha, T.; Dugkhuntod, P.; Rodponthukwaji, K.; Thivasasith, A.; Nokbin, S.;Witoon, T.; Pengpanich, S.; Wattanakit, C. Dehydrogenation of propane to propylene using promoter-freehierarchical Pt/Silicalite-1 nanosheets. Catalysts 2019, 9, 174. [CrossRef]
2. Tolek, W.; Suriye, K.; Praserthdam, P.; Panpranot, J. Effect of preparation method on the Pt-In modifiedMg(Al)O catalysts over dehydrogenation of propane. Catal. Today 2019, in press. [CrossRef]
3. Searles, K.; Chan, K.W.; Burak, J.A.M.; Zemlyanow, D.; Safonova, O.; Copéret, C. Highly productive propanedehydrogenation catalyst using silica supported Ga-Pt nanoparticles generated from single-sites. J. Am.Chem. Soc. 2018, 140, 11674–11679. [CrossRef] [PubMed]
4. Shenjun, Z.; Guodong, S.; Tengfang, W.; Jiubing, Z.; Zhi-Jian, Z.; Jinlong, G. Identification of Pt-basedcatalysts for propane dehydrogenation via a probability analysis. Chem. Sci. 2018, 9, 3925–3931.
5. NaKaYa, Y.; Hirayama, J.; Yamazoe, S.; Shimizu, K.; Furukawa, S. Single-atom Pt in intermetallics asan ultrastable and selective catalyst for propane dehydrogenation. Nat. Commun. 2020, 11, 2838–2844.[CrossRef] [PubMed]
6. Ge, M.; Chen, X.; Li, Y.; Wang, J.; Xu, Y.; Zhang, L. Perovskite-derived cobalt-based catalyst for catalyticpropane dehydrogenation. React. Kinet. Mech. Catal. 2020, 130, 241–256. [CrossRef]
Catalysts 2020, 10, 898 15 of 17
7. Sricharoen, C.; Jongsomjit, B.; Panpranot, J.; Praserthdam, P. The key to catalytic stability on sol–gelderived SnOx/SiO2 catalyst and the comparative study of side reaction with K-PtSn/Al2O3 toward propanedehydrogenation. Catal. Today 2020, in press. [CrossRef]
8. Ji, Z.; Miao, D.; Gao, L.; Pan, X.; Bao, X. Effect of pH on the catalytic performance of PtSn/B-ZrO2 in propanedehydrogenation. Chin. J. Catal. 2020, 41, 719–729. [CrossRef]
9. Liu, Q.; Luo, M.; Zhao, Z.; Zhao, Q. K-modified Sn-containing dendritic mesoporous silica nanoparticleswith tunable size and SnOx-silica interaction for the dehydrogenation of propane to propylene. Chem. Eng. J.2020, 380, 122423–122434.
10. An-Hua, D.; Kang, W.; Shi-Zhen, Z.; Gong-Bing, Y.; Xi-Tao, W. Facile preparation of PtSn-La/Al2O3 catalystwith large pore size and its improved catalytic performance for isobutane dehydrogenation. Fuel Process.Technol. 2017, 158, 218–225.
11. Pham, H.N.; Sattler, J.J.H.B.; Weckhuysen, B.M.; Datye, A.K. Role of Sn in the regeneration of Pt/γ-Al2O3
light alkane dehydrogenation catalysts. ACS Catal. 2016, 6, 2257–2264. [CrossRef] [PubMed]12. Chen, X.; Ge, M.; Li, Y.; Liu, Y.; Wang, J.; Zhang, L. Fabrication of highly dispersed Pt-based catalysts on
γ-Al2O3 supported perovskite Nano islands: High durability and tolerance to coke deposition in propanedehydrogenation. Appl. Surf. Sci. 2019, 490, 611–621. [CrossRef]
13. Cybulskis, V.J.; Bukowski, B.B.; Tseng, H.; Gallagher, J.R.; Wu, Z.; Wegener, E.; Kropf, A.J.; Ravel, B.;Ribeiro, F.H.; Greeley, J.; et al. Zinc promotion of platinum for catalytic light alkane dehydrogenation:Insights into geometric and electronic effects. ACS Catal. 2017, 7, 4173–4181. [CrossRef]
14. Kaylor, N.; Davis, R.J. Propane dehydrogenation over supported Pt-Sn nanoparticles. J. Catal. 2018,367, 181–193. [CrossRef]
15. Liu, J.; Li, J.; Rong, J.; Liu, C.; Dai, Z.; Bao, J.; Da, Z.; Zheng, H. Defect-driven unique stability of Pt/carbonnanotubes for propane dehydrogenation. Appl. Surf. Sci. 2019, 464, 146–152. [CrossRef]
16. Wang, G.; Zhang, H.; Zhu, Q.; Zhu, X.; Li, X.; Wang, H.; Li, C.; Shan, H. Sn-containing hexagonal mesoporoussilica (HMS) for catalytic dehydrogenation of propane: An efficient strategy to enhance stability. J. Catal.2017, 351, 90–94. [CrossRef]
17. Srisakwattana, T.; Suriye, K.; Praserthdam, P.; Panpranot, J. Preparation of aluminum magnesium oxide bydifferent methods for use as PtSn catalyst supports in propane dehydrogenation. Catal. Today 2019, in press.[CrossRef]
18. Long, L.; Xia, K.; Lang, W.; Shen, L.; Yang, Q.; Yan, X.; Guo, Y. The comparison and optimization of zirconia,alumina, and zirconia-alumina supported PtSnIn trimetallic catalysts for propane dehydrogenation reaction.J. Ind. Eng. Chem. 2017, 51, 271–280. [CrossRef]
19. Zhou, H.; Gong, J.; Xu, B.; Deng, S.; Ding, Y.; Yu, L.; Fan, Y. PtSnNa/SUZ-4: An efficient catalyst for propanedehydrogenation. Chin. J. Catal. 2017, 38, 529–536. [CrossRef]
20. Shen, L.; Xia, K.; Lang, W.; Chu, L.; Yan, X.; Guo, Y. The effects of calcination temperature of support onPtIn/Mg(Al)O catalysts for propane dehydrogenation reaction. Chem. Eng. J. 2017, 324, 336–346. [CrossRef]
21. Gong, N.; Zhao, Z. Efficient supported Pt-Sn catalyst on carambola-like alumina for direct dehydrogenationof propane to propene. Mol. Catal. 2019, 477, 110543–110551. [CrossRef]
22. Vu, B.K.; Song, M.B.; Ahn, I.Y.; Suh, Y.W.; Suh, D.J.; Kim, J.S.; Shin, E.W. Location and structure of cokegenerated over Pt–Sn/Al2O3 in propane dehydrogenation. J. Ind. Eng. Chem. 2011, 17, 71–76. [CrossRef]
23. Bare, S.R.; Vila, F.D.; Charochak, M.E.; Prabhakar, S.; Bradley, W.J.; Jaye, C.; Fischer, D.A.; Hayashi, S.T.;Bradley, S.A.; Rehr, J.J. Characterization of coke on a Pt-Re/γ-Al2O3 re-forming catalyst: An experimentaland theoretical study. ACS Catal. 2017, 7, 1452–1461. [CrossRef]
24. Nasution, P.S.; Jung, J.W.; Oh, K.; Koh, H.L. Coke combustion kinetics of spent Pt-Sn/Al2O3 catalysts inpropane dehydrogenation. Korean J. Chem. Eng. in press.
25. Li, B.; Xu, Z.; Chu, W.; Luo, S.; Jing, F. Ordered mesoporous Sn-SBA-15 as support for Pt catalyst withenhanced performance in propane dehydrogenation. Chin. J. Catal. 2017, 38, 726–735. [CrossRef]
26. Iglesias-Juez, A.; Beale, A.M.; Maaijen, K.; Weng, T.C.; Glatzel, P.; Weckhuysen, B.M. A combined in situtime-resolved UV–Vis, Raman and high-energy resolution X-ray absorption spectroscopy study on thedeactivation behavior of Pt and PtSn propane dehydrogenation catalysts under industrial reaction conditions.J. Catal. 2010, 276, 268–279. [CrossRef]
Catalysts 2020, 10, 898 16 of 17
27. Sun, C.; Luo, J.; Cao, M.; Zheng, P.; Li, G.; Bu, J.; Cao, Z.; Chen, S.; Xie, X. A comparative study on differentregeneration processes of Pt-Sn/γ -Al2O3 catalysts for propane dehydrogenation. J. Energy Chem. 2018,27, 311–318. [CrossRef]
28. Xiong, H.; Lin, S.; Goetze, J.; Pletcher, P.; Guo, H.; Kovarik, L.; Artyushkova, K.; Weckuysen, B.M.; Datye, A.K.Thermally stable and regenerable platinum–tin clusters for propane dehydrogenation prepared by atomtrapping on ceria. Angew. Chem. 2017, 56, 8986–8991. [CrossRef]
29. Pieck, C.L.; Vera, C.R.; Querini, C.A.; Parera, J.A. Differences in coke burning-off from Pt–Sn/Al2O3 catalystwith oxygen or ozone. Appl. Catal. A 2005, 278, 173–180. [CrossRef]
30. Pieck, C.L.; Jablonski, E.L.; Parera, J.M. Regeneration of Coked Pt-Re/Al2O3 catalyst by burning with oxygenand ozone. Stud. Surf. Sci. Catal. 1994, 88, 289–295.
31. Pieck, C.L.; Jablonski, E.L.; Parera, J.M. Sintering-Redispersion of Pt-Re/Al2O3 during regeneration. Appl. Catal.1990, 62, 47–60. [CrossRef]
32. Kim, G.H.; Jung, K.-D.; Kim, W.-I.; Um, B.-H.; Shin, C.-H.; Oh, K.; Koh, H.L. Effect of oxychlorinationtreatment on the regeneration of Pt–Sn/Al2O3 catalyst for propane dehydrogenation. Res. Chem. Intermed.2016, 42, 351–365. [CrossRef]
33. Arteaga, G.J.; Anderson, J.A.; Rochester, C.H. Effects of oxidation–reduction and oxychlorination–reductioncycles on CO adsorption by Pt–Sn/Al2O3 catalysts. J. Catal. 1999, 184, 268–279. [CrossRef]
34. Lieske, H.; Völter, J. State of tin Pt-Sn/Al2O3 reforming catalysts investigated by TPR and chemisorption.J. Catal. 1984, 90, 96–105. [CrossRef]
35. Geomar, J.A.; James, A.A.; Susanne, M.B.; Colin, H.R. Influence of oxychlorination treatment on the surfaceand bulk properties of a Pt–Sn/Al2O3 catalyst. J. Mol. Catal. A Chem. 1999, 145, 183–201.
36. Merlen, E.; Beccat, P.; Bertolini, J.C.; Delichère, P.; Zanier, N.; Didillon, B. Characterization of bimetallicPt–Sn/Al2O3Catalysts: Relationship between particle size and structure. J. Catal. 1996, 159, 178–188.[CrossRef]
37. Sexton, B.A.; Hughes, A.E.; Foger, K. An X-ray photoelectron spectroscopy and reaction study of Pt-Sncatalysts. J. Catal. 1984, 88, 466–477. [CrossRef]
38. Anresa, P.; Gaune-Escarda, M.; Brosa, J.P.; Hayerb, E. Enthalpy of formation of the (Pt-Sn) system.J. Alloys Compd. 1998, 280, 158–167. [CrossRef]
39. Kuznetsov, V.I.; Belyi, A.S.; Yurchenko, E.N.; Smolikov, M.D.; Protasova, M.T.; Zatolokina, E.V.; Duplyakin, V.K.Mössbauer spectroscopic and chemical analysis of the composition of Sn-containing components ofPt-Sn/Al2O3(Cl) reforming catalyst. J. Catal. 1986, 99, 159–170. [CrossRef]
40. Srinivasan, R.; Angelis, R.J.D.; Davis, B.H. Structural studies of Pt-Sn catalysts on high and low surface areaalumina supports. Catal. Lett. 1990, 4, 303–308. [CrossRef]
41. Tasbihi, M.; Feyzi, F.; Amlashi, M.A.; Abdullah, A.Z.; Mohamed, A.R. Effect of the addition of potassiumand lithium in Pt-Sn/Al2O3 catalysts for the dehydrogenation of isobutane. Fuel Process. Technol. 2007,88, 883–889. [CrossRef]
42. Llorca, J.; Delapiscina, P.R.; Fierro, J.L.; Sales, J.; Homs, N. Influence of metallic precursors on the preparationof silica-supported PtSn alloy—Characterization and reactivity in the catalytic activation of CO2. J. Catal.1995, 156, 139–146. [CrossRef]
43. Srinivasan, R.; Davis, B.H. The structure of platinum-tin reforming catalysts. Platin. Met. Rev. 1992,36, 151–163.
44. Vu, B.K.; Song, M.B.; Ahn, I.Y.; Suh, Y.W.; Suh, D.J.; Kim, W.; Koh, H.L.; Choi, Y.G.; Shin, E.W. Pt-Sn alloyphases and coke mobility over Pt-Sn/Al2O3 and Pt-Sn/ZnAl2O4 catalysts for propane dehydrogenation.Appl. Catal. A 2011, 400, 25–33. [CrossRef]
45. Sattler, J.J.H.B.; Ruiz-Martinez, J.; Santillan-Jimenez, E.; Weckhuysen, B.M. Catalytic dehydrogenation oflight alkanes on metals and metal oxides. Chem. Rev. 2014, 114, 10613–10653. [CrossRef]
46. Nagaraja, B.M.; Shin, C.H.; Jung, K.D. Selective and stable bimetallic Pt-Sn/θ-Al2O3 catalyst fordehydrogenation of n-butane to n-butenes. Appl. Catal. A 2013, 467, 211–223. [CrossRef]
47. Hoang, D.L.; Farrage, S.A.-F.; Radnik, J.; Pohl, M.-M.; Schneider, M.; Lieske, H.; Martin, A. A comparativestudy of zirconia and alumina supported Pt and Pt–Sn catalysts used for dehydrocyclization of n-octane.Appl. Catal. A 2007, 333, 67–77. [CrossRef]

Catalysts 2020, 10, 898 17 of 17
48. Song, A.; Lu, G. Enhancement of Pt–Ru catalytic activity for catalytic wet air oxidation of methylaminevia tuning the Ru surface chemical state and dispersion by Pt addition. RSC Adv. 2014, 4, 15325–15331.[CrossRef]
49. Angel, G.D.; Bonilla, A.; Pena, Y.; Navarrete, J.; Fierro, J.L.G.; Acosta, D.R. Effect of lanthanum on the catalyticproperties of PtSn/γ-Al2O3 bimetallic catalysts prepared by successive impregnation and controlled surfacereaction. J. Catal. 2003, 219, 63–73. [CrossRef]
50. Jung, J.W.; Kim, W.I.; Kim, J.R.; Oh, K.; Koh, H.L. Effect of direct reduction treatment on Pt-Sn/Al2O3 catalystfor propane dehydrogenation. Catalysts 2019, 9, 446. [CrossRef]
© 2020 by the authors. Licensee MDPI, Basel, Switzerland. This article is an open accessarticle distributed under the terms and conditions of the Creative Commons Attribution(CC BY) license (http://creativecommons.org/licenses/by/4.0/).