characterisation of gut microbiota of obesity and type 2
TRANSCRIPT

doi: 10.12938/bmfh.2019-031
Characterisation of gut microbiota of obesity and type 2 diabetes in a rodent modelKhalid S. IBRAHIM1, 2*, Nowara BOURWIS1, Sharron DOLAN1, Sue LANG1, 3, Janice SPENCER1 and John A CRAFT1
1Department of Biological and Biomedical Sciences, Glasgow Caledonian University, Glasgow, G4 0BA, United Kingdom2Department of Biology, Faculty of Science, University of Zakho, Zakho International Road, Kurdistan Region-Iraq3Present address: School of Clinical and Applied Sciences, Leeds Beckett University, Portland Building, City Campus, Leeds, LS1 3HE, United Kingdom
Received October 18, 2019; Accepted October 6, 2020; Published online in J-STAGE October 10, 2020
Various studies have suggested that the gut microbiome interacts with the host and may have a significant role in the aetiology of obesity and Type 2 Diabetes (T2D). It was hypothesised that bacterial communities in obesity and T2D differ from control and compromise normal interactions between host and microbiota. Obesity and T2D were developed in rats by feeding a high-fat diet or a high-fat diet plus a single low-dose streptozotocin administration, respectively. The microbiome profiles and their metabolic potentials were established by metagenomic 16S rRNA sequencing and bioinformatics. Taxonomy and predicted metabolism-related genes in obesity and T2D were markedly different from controls and indeed from each other. Diversity was reduced in T2D but not in Obese rats. Factors likely to compromise host intestinal, barrier integrity were found in Obese and T2D rats including predicted, decreased bacterial butyrate production. Capacity to increase energy extraction via ABC-transporters and carbohydrate metabolism were enhanced in Obese and T2D rats. T2D was characterized by increased proinflammatory molecules. While obesity and T2D show distinct differences, results suggest that in both conditions Bacteroides and Blautia species were increased indicating a possible mechanistic link.Key words: butyrate, inflammatory molecules, microbiome, obesity, Type 2 diabetes
INTRODUCTION
The worldwide incidence of obesity and diabetes mellitus (DM) has significantly increased in recent years and efforts to address this silently-killing disease are urgently required. During the last decade, several studies have focused on the role of the gut microbiota in maintenance of gut health and wellbeing. It has been proposed that an altered microbial-community might result in greater levels of energy being harvested from food, particularly from a high fat diet, and several mechanisms facilitate metabolic disorders, particularly Type 2 Diabetes (T2D) [1, 2]. These changes include the production of short chain fatty acids (SCFAs) and lipopolysaccharide (LPS) which cause chronic low-grade-inflammation [3]. Microbiome-profiling has been developed to determine the metagenomic structure of bacterial communities based on analysis of 16S rRNA sequences with software such as Quantitative Insights Into Microbial Ecology (QIIME) [4]. Recently, Phylogenetic Investigation of Communities by Reconstruction of Unobserved States (PICRUSt) has been
developed to provide a view of metagenome function from 16S rRNA metagenomics or from full genomes [5].
Rat models have significantly contributed to the study of the function and role of microbiota in the gastrointestinal tract and its association with diseases such as metabolic disorder and obesity [6, 7], type 1 diabetes [8–10] and other complex diseases [11]. A model of T2D in rats has been introduced by Reed et al. [12] and subsequently refined by various investigators (reviewed in [13]). The rats are maintained on a high-fat diet to produce obesity, hyperinsulinaemia, glucose intolerance and insulin resistance. Subsequent administration of a low dose of streptozotocin results in a reduction of pancreatic β-cell function. We hypothesise that the gut microbiome varies with phenotype and the aim of the present study was to characterize the composition of gut microbiota using 16S rRNA sequencing in two rat models: a model of obesity, induced by feeding a high-fat diet; and a model of T2D induced by high fat diet and a single, low-dose injection of streptozotocin (STZ). The identification of bacteria that contribute to protection of host and those that cause harm
*Corresponding author. Khalid S. Ibrahim (E-mail: [email protected])(Supplementary materials: refer to PMC https://www.ncbi.nlm.nih.gov/pmc/journals/2480/)
©2021 BMFH Press
Full Paper
Bioscience of Microbiota, Food and Health Vol. 40 (1), **–**, 2021
This is an open-access article distributed under the terms of the Creative Commons Attribution Non-Commercial No Derivatives (by-nc-nd) License. (CC-BY-NC-ND 4.0: https://creativecommons.org/licenses/by-nc-nd/4.0/)

K. Ibrahim, et al. 66
doi: 10.12938/bmfh.2019-031 ©2021 BMFH Press
will potentially open the door to novel therapies for obesity and T2D and will provide clues to links between the two metabolic diseases.
MATERIALS AND METHODS
Animal maintenance and treatmentIn-house-bred, male Wistar rats (age 10–12 weeks, 250–350 g,
n=24) were maintained at room temperature (25°C) and 12/12-hr light-dark cycle and housed in standard cages (3 rats/cage). At the beginning of the procedure (week 1), the rats were divided randomly into four groups, with 6 animals in each group and treated for a period of 12 weeks as described below. After 12 weeks, faecal pellets were collected from each group early in the morning (7:30 am) from animals housed individually over-night and immediately stored at −80°C.
Control group: (Normal Diet Vehicle). Rats were fed a normal diet (RM1, Rat and Mouse No. 1 Maintenance Diet; SDS, UK) containing crude fat of 2.7% by weight. Energy provision by component is: 13% calories from fat, 22% from protein and 65% from carbohydrate with Gross Energy 14.72 MJ/kg (Summary composition in Supplementary Table 1; full analysis at http://www.sdsdiets.com/pdfs/RM1P-E-FG.pdf). They received a single intraperitoneal (I/P) injection of citrate buffer (pH 4.4) in a volume of 1 mL kg−1 at 4 weeks. Rats were maintained on the same diet for another 8 weeks.
STZ-alone group: (Normal Diet Streptozotocin). Rats were fed a normal RM1 diet and received a single I/P injection of streptozotocin (STZ) in citrate buffer at 30 mg kg−1 at 4 weeks, and maintained on same diet for another 8 weeks.
Obese group (Ob): (High-Fat Diet Vehicle). Rats were fed a high fat diet (HFD; product code 821424, SDS, UK) containing crude fat of 22% by weight. Energy provision by component is: 45% calories from fat, 18% from protein and 37% from carbohydrate with Gross Energy 19.67 MJ/kg (Supplementary Table 1). They also received a single I/P injection of citrate buffer (pH 4.4) in a dose of 1 mL kg−1 at 4 weeks. Rats were maintained on HFD for another 8 weeks.
Diabetic group (T2D): (High-Fat Diet STZ). Rats were fed a HFD and injected I/P with a single I/P injection of STZ at 30 mg kg−1 at 4 weeks. Rats were maintained on HFD for another 8 weeks.
Animal weights and blood glucose were measured weekly. Blood glucose levels were measured using a glucometer (Accu-Check Aviva System; Roche Diagnosis, USA). An insulin tolerance test (ITT) was carried out in Control (Control; n=3) and Diabetic (T2D; n=3) groups 10 weeks after-the vehicle or STZ injection. Rats were fasted for 6 hr then received an I/P injection of bovine insulin (1U kg−1; Sigma, UK). Blood samples were collected from the tail tip just before insulin administration (time 0) and at 30, 60, and 120 min after glucose/insulin injection for measurement of blood glucose concentration using the glucometer.
Bacterial DNA extraction from faecal pellets and Illumina MiSeq sequencing
Genomic DNA was isolated, within one day of faecal collection using the QIAamp DNA Stool Mini Kit (QIAGEN Limited, Manchester (UK)) following the manufacturer’s protocol. Separate isolations were made from three individual pellets/
animal with material being taken from three separate locations on each pellet (180–220 mg for each animal), then placed in a 2 mL Lysing Matrix E (4 mm glass beads) microcentrifuge tubes (MP Biochemicals, Strasbourg). Tube contents were thoroughly homogenized in ASL Buffer using a FastPrep®-24 Instrument (MP Biomedicals, UK) at 4.5 M second−1 for 30 seconds. A single DNA sample for each individual animal was recovered by pooling equal quantities of the separate DNA preparations and stored at −80°C prior to sequencing.
Purified DNA was used for PCR amplification and sequencing of 16S rRNA genes on an Illumina MiSeq instrument with 2 × 300 base-pair paired-end reads at GATC Biotech (Germany). Universal primers of 16S rRNA genes were used to amplify the hypervariable regions, V3–V5 (V3F (357F), V5R (926R)). In a second PCR, Illumina TruSeq adapters and tag sequences were attached prior to sequencing. Reads have been submitted to the SRA with Accession Number SRP152214.
Bioinformatics and statistical analysisSequences were provided in a demultiplexed format and
processed using Quantitative Insights Into Microbial Ecology (QIIME) v 1.8.0 [4]. Paired reads were merged (minimum overlap 18, tolerance 5) and quality filtered with default settings. Filtered sequences were clustered into Operational Taxonomic Units (OTUs) at 97% sequence similarity and Chimera sequences removed using USEARCH [14]. The most abundant sequences for each OTU were used as a representative to identify taxonomy by alignment with the GreenGenes database (gg_13_5, PyNAST default) [4, 15] prior to filtering with default settings. Alpha- and beta-diversity were calculated in QIIME using the OTU table.
Predicted molecular functions were generated from the taxonomy frequencies using PICRUSt [5] following the workflow described at https://github.com/LangilleLab/microbiome_helper/wiki/PICRUSt-workflow. It is important to note that this approach produces only predictions of metabolic function. The OTU table produced by QIIME was converted to .biom format (http://biom-format.org/documentation/biom conversion.html) before a filtering step to remove those entries which do not have an identified organism. The filter-command produced a closed reference .biom table. Entries to this table were normalised to 16S rRNA gene copy number to provide abundance numbers for each OTU. Kyoto Encyclopedia of Genes and Genomes (KEGG) orthologs (KOs) were then predicted prior to them being collapsed at level three to provide pathway predictions. The abundance data was normalized to the geometric mean [16] of values for ‘house-keeping’ functions in genetic information processing [5]. To evaluate the significance of particular taxa to defined pathways (L3) within each group, the predicted contribution of taxa, identified by regression analysis as being connected to the pathway, were summed.
Relative abundance is presented as mean ± SEM and differences within and between groups were assessed using GraphPad Prism 6 by: Dunn’s multiple comparison tests after one-way ANOVA; Bonferroni multiple comparison tests after two-way ANOVA for differences among more than two groups; Dunnett’s multiple comparison tests after two-way ANOVA to compare differences between the control group and other groups. A p value of <0.05 was considered significant. Principal Coordinates Analysis (PCoA), heat map and hierarchical clustering analysis were conducted with the R software package version 3.2.1 (https://

**RIGHT RUNNING HEAD MISSING** 67
doi: 10.12938/bmfh.2019-031 ©2021 BMFH Press
cran.r-project.org/bin/windows/base/old/3.2.1) to compare communities of two or more groups.
Compliance with ethical standards and ethical approvalAll applicable international, national, and/or institutional
guidelines for the care and use of animals were followed. Rats were treated with full approval of the Institute’s Animal Ethic’s and Welfare Committee; the procedures complied with UK Animal Scientific Procedures Act (1986) and were approved by the Home Office.
RESULTS
Induction of obesity and T2D in ratsRats fed a high-fat diet and injected with vehicle exhibited a
significant increase in body weight (p<0.05 vs. (versus) all other groups; Fig. 1a). Treatment with a high-fat diet and a low dose of STZ (T2D) induced a significant increase in blood glucose; significant hyperglycaemia was observed 1 week post-STZ injection in T2D rats (p<0.05 vs. all other groups) and this was maintained until the end of the study (Fig. 1b). The insulin tolerance test revealed that T2D rats were insensitive to insulin compared to control rats and displayed significant hyperglycaemia for the duration of the test (all p<0.05 vs. Controls; Fig. 1c).
Phylogenetic composition and the relative abundance of taxa of the microbiome communities
Basic statistics for the number of reads and clusters of similar sequences for all four groups are shown in Supplementary Table 2. Determination of the 16S rRNA sequences allowed phylogenetic classification via QIIME of OTUs of the gut microbiota from the level of phylum to family or genus. At phylum level (Supplementary Fig. 1) Bacteroidetes predominate over Firmicutes in the control group while similar levels for each were found in the STZ-alone animals. In contrast the proportion of each switch in the Obese and T2D groups and Firmicutes now predominate followed by Bacteroidetes. The proportion of Firmicutes was significantly higher (p<0.0001 and p<0.001) in T2D compared to both control and STZ-alone, while the abundance of Bacteroidetes was significantly lower (p<0.0001 and 0.001). Firmicutes was enriched (p<0.0001) and Bacteroidetes lower (p<0.01) in Obese compared to STZ-alone while it was
higher (p<0.05) in STZ-alone vs. control (Supplementary Fig. 1) and (p<0.01) in T2D vs. Obese.
At family level S24-7 family was the most abundant in both control and STZ-alone followed by various other families while in Obese, Ruminococcaceae was the predominant family and in T2D, Lachnospiraceae was the predominant family (Supplementary Fig. 2). When comparing bacteria at family levels, no significant differences were found between control and STZ-alone but differences were found for all other pairwise comparisons of the groups (Supplementary Fig. 3). For instance Bacteroidaceae and Lachnospiraceae were significantly enriched (p<0.0001) in the T2D vs. control and vs. STZ-alone, while the abundance of S24-7 decreased in both Obese and T2D vs. control and STZ-alone (p<0.0001). There were significant differences between nine families when Obese was compared to control and with STZ-alone while there were eight significant differences between Obese and T2D.
The abundant bacteria at genus level differ between the four experimental groups and are shown in Fig. 2 and Supplementary Table 3. In the control animals, the most abundant genera were Prevotella from Prevotellaceae family, while in the STZ-alone animals, the most abundant genera Prevotella and noticeably Allobaculum from Erysipelotrichaceae family. In the Obese group, Bacteroides from Bacteroidaceae family, [Prevotella] from [Paraprevotellaceae] family, Oscillospira and Ruminococcus from Ruminococcaceae family and Prevotella occur at highest levels. In T2D, the most abundant genera were Bacteroides, Prevotella and Blautia from Lachnospiraceae family. Figure 3 shows the comparison of bacterial genera between the groups. Comparison of genera in control vs. STZ-alone showed no statistical difference but differences were apparent for all other groups. For instance a higher proportion of Blautia and Bacteroides were found in T2D vs. both control and STZ-alone while Allobaculum was higher in T2D vs. control (p<0.0001) (Fig. 3). Noticeably the ratio of Bacteroides/Prevotella was much higher in Obese and T2D than both control and STZ-alone (Supplementary Fig. 4).
Differences between genera in bacterial communities or groups were also apparent when data was analysed by PCoA and hierarchical clustering (not shown). The PCoA was conducted in a pairwise manner and is shown in Fig. 4 and reveals spatial separations between the groups. The exception was between
Fig. 1. Total weight gain (g) from week 0 to week 12 (a), blood glucose (mmol/L) measured on week 12 (b) in Control, STZ-alone, Obese and Diabetic rats (n=6/group), and the insulin tolerance test compared Diabetic vs Control rats (c). Data are mean ± SEM. Significant difference from all other groups. *p<0.05, ***p<0.001.

K. Ibrahim, et al. 68
doi: 10.12938/bmfh.2019-031 ©2021 BMFH Press
control and STZ-alone which could not be resolved and were overlapping or very close to each other (Fig. 4a). In contrast, Obese and T2D rats showed distinct differences when compared to the control group (Fig. 4b and c).
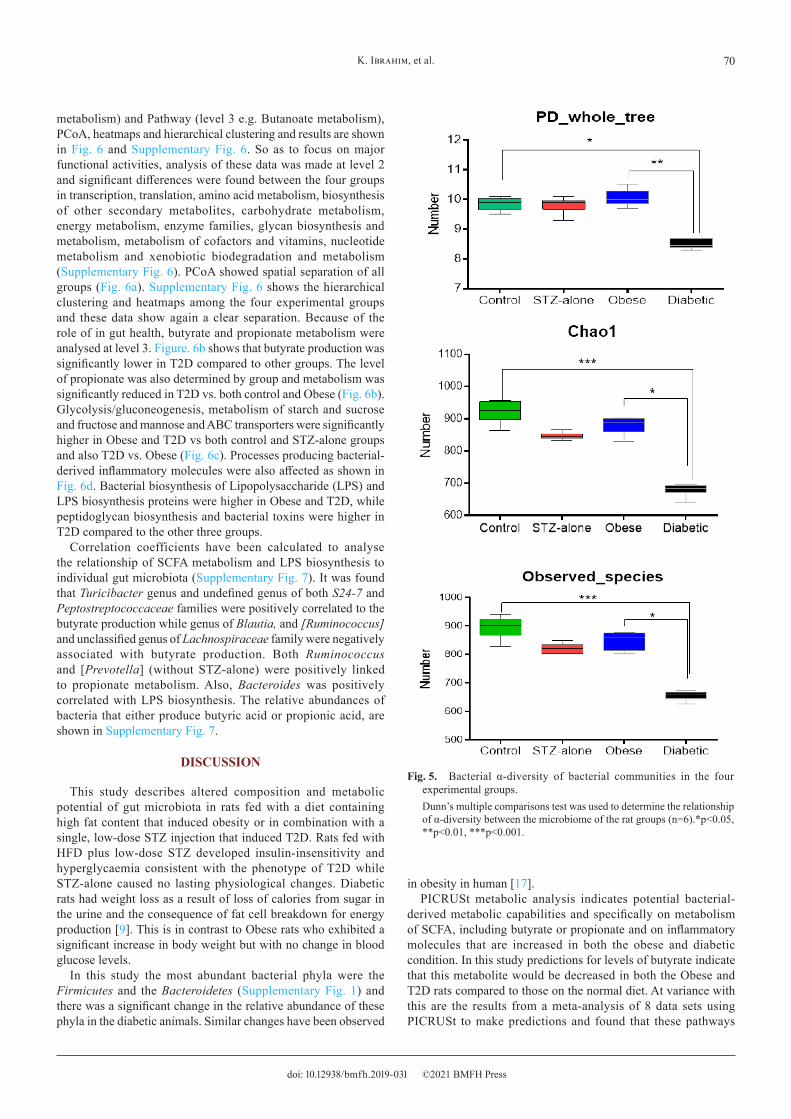
The differences in diversity of taxa across the groups were also shown by measures of both α- and β-diversity. Figure 5 illustrates α-diversity determined as PD-whole-tree, chao1 and observed-species. Each of the measures showed a significant reduction in diversity in T2D compared to control. α-diversity in T2D was also significantly lower than in Obese rats. The distance-difference of Unweighted and Weighted UniFrac β-diversity was
measured for the bacterial community in the individual animals, pairwise, with animals within the same group and between groups (Supplementary Table 4). Supplementary Fig. 5 shows the separations of the distance matrix among the four groups with the exception of control vs STZ-alone and Obese vs. T2D of the weighted UniFrac distances by PCoA analysis.
The functional microbiomeThe potential for bacterial metabolism in each bacterial
group has been provided by PICRUSt. The normalised data was analysed by KEGG Category (level 2 e.g. Carbohydrate
Fig. 2. Bacterial taxonomy and abundance of the gut metagenome at genus level between the four experimental groups.

**RIGHT RUNNING HEAD MISSING** 69
doi: 10.12938/bmfh.2019-031 ©2021 BMFH Press
Fig. 3. Differences in abundance of genera between the four experimental groups.*p<0.05, **p<0.01, ***p<0.001, ****p<0.0001.
Fig. 4. Comparison of bacterial communities at genus level in the four experimental groups based on Principal Coordinates Analysis (PCoA).Comparisons are pairwise for individual rats in each group (n=6); Control: green, STZ-alone: red, Obese: blue and Diabetic: black.
K. Ibrahim, et al. 70
doi: 10.12938/bmfh.2019-031 ©2021 BMFH Press
metabolism) and Pathway (level 3 e.g. Butanoate metabolism), PCoA, heatmaps and hierarchical clustering and results are shown in Fig. 6 and Supplementary Fig. 6. So as to focus on major functional activities, analysis of these data was made at level 2 and significant differences were found between the four groups in transcription, translation, amino acid metabolism, biosynthesis of other secondary metabolites, carbohydrate metabolism, energy metabolism, enzyme families, glycan biosynthesis and metabolism, metabolism of cofactors and vitamins, nucleotide metabolism and xenobiotic biodegradation and metabolism (Supplementary Fig. 6). PCoA showed spatial separation of all groups (Fig. 6a). Supplementary Fig. 6 shows the hierarchical clustering and heatmaps among the four experimental groups and these data show again a clear separation. Because of the role of in gut health, butyrate and propionate metabolism were analysed at level 3. Figure. 6b shows that butyrate production was significantly lower in T2D compared to other groups. The level of propionate was also determined by group and metabolism was significantly reduced in T2D vs. both control and Obese (Fig. 6b). Glycolysis/gluconeogenesis, metabolism of starch and sucrose and fructose and mannose and ABC transporters were significantly higher in Obese and T2D vs both control and STZ-alone groups and also T2D vs. Obese (Fig. 6c). Processes producing bacterial-derived inflammatory molecules were also affected as shown in Fig. 6d. Bacterial biosynthesis of Lipopolysaccharide (LPS) and LPS biosynthesis proteins were higher in Obese and T2D, while peptidoglycan biosynthesis and bacterial toxins were higher in T2D compared to the other three groups.
Correlation coefficients have been calculated to analyse the relationship of SCFA metabolism and LPS biosynthesis to individual gut microbiota (Supplementary Fig. 7). It was found that Turicibacter genus and undefined genus of both S24-7 and Peptostreptococcaceae families were positively correlated to the butyrate production while genus of Blautia, and [Ruminococcus] and unclassified genus of Lachnospiraceae family were negatively associated with butyrate production. Both Ruminococcus and [Prevotella] (without STZ-alone) were positively linked to propionate metabolism. Also, Bacteroides was positively correlated with LPS biosynthesis. The relative abundances of bacteria that either produce butyric acid or propionic acid, are shown in Supplementary Fig. 7.
DISCUSSION
This study describes altered composition and metabolic potential of gut microbiota in rats fed with a diet containing high fat content that induced obesity or in combination with a single, low-dose STZ injection that induced T2D. Rats fed with HFD plus low-dose STZ developed insulin-insensitivity and hyperglycaemia consistent with the phenotype of T2D while STZ-alone caused no lasting physiological changes. Diabetic rats had weight loss as a result of loss of calories from sugar in the urine and the consequence of fat cell breakdown for energy production [9]. This is in contrast to Obese rats who exhibited a significant increase in body weight but with no change in blood glucose levels.
In this study the most abundant bacterial phyla were the Firmicutes and the Bacteroidetes (Supplementary Fig. 1) and there was a significant change in the relative abundance of these phyla in the diabetic animals. Similar changes have been observed
in obesity in human [17].PICRUSt metabolic analysis indicates potential bacterial-
derived metabolic capabilities and specifically on metabolism of SCFA, including butyrate or propionate and on inflammatory molecules that are increased in both the obese and diabetic condition. In this study predictions for levels of butyrate indicate that this metabolite would be decreased in both the Obese and T2D rats compared to those on the normal diet. At variance with this are the results from a meta-analysis of 8 data sets using PICRUSt to make predictions and found that these pathways
Fig. 5. Bacterial α-diversity of bacterial communities in the four experimental groups.Dunn’s multiple comparisons test was used to determine the relationship of α-diversity between the microbiome of the rat groups (n=6).*p<0.05, **p<0.01, ***p<0.001.

**RIGHT RUNNING HEAD MISSING** 71
doi: 10.12938/bmfh.2019-031 ©2021 BMFH Press
would be increased [18]. It is likely that the conflict between our predictions and those of Jiao et al. [18] are a consequence of their use of a mixture of genera (5 mice, 3 rats) with variant species of each genus. It is generally accepted that butyrate production is beneficial and thus decreased production in Obese and T2D may be expected and those predictions could be tested in further experimentation. Butyrate is protective of the single cell-layer of epithelial cells along with its mucin coating while this barrier is compromised by inflammatory molecules [19]. In this study, the most abundant taxa in the control animals were unclassified genus of S24-7 family, Turicibacter genus and unclassified genus of Peptostreptococcaceae family (Fig. 2). PICRUSt positively linked these bacteria to butyrate production (Supplementary Fig. 7) and they have been identified as butyrate-producing bacteria (S24-7 family [20], Peptostreptococcaceae family [21], and Turicibacter genus [22]). Butyrate is produced as a bacterial metabolite and contributes to the integrity and thickness of
the whole mucosal barrier [23] since it promotes the synthesis and secretion of mucin into the intestine [9, 24], stimulates Claudin-1, a protein of tight-junctions [25] and acts as an anti-inflammatory [26]. Butyrate is also important in the activation of host GRP41/43 that elicits production of appetite-suppressing PYY and insulin-producing GLP1 [27]. In the STZ-alone rats, there was no significant difference in bacterial profile compared to control at the level of genus with the exception of an increase of Allobaculum genus (Figs. 2 and 3). A study of gut microbiota in mice [28] found that mice fed with low fat diet showed an enrichment of this genus. In fact, Allobaculum in the intestine encourages mucin release because this bacterium produces butyrate [29]. We found no difference in our predictions between Control and Obese groups for propionate metabolism again in contrast to the predictions of Jiao et al. [18] but consistent with the predictions of Lee and Ko [30] who found an improvement in metabolic parameters and increased propionate in metformin
Fig. 6. Phylogenetic Investigation of Communities by Reconstruction of Unobserved States (PICRUSt) analysis for predictions of the functional microbiome of each group.PICRUSt was conducted at level 3. Principal Coordinates Analysis (PCoA) was used with individuals (a). The Mann Whitney test was used to estimate the significant differences; Metabolism of SCFA (butyrate and propionate) (b); energy related metabolism (glycolysis/ gluconeogenesis, starch and sucrose metabolism, fructose and mannose metabolism, and ABC transporters) (c) and processes producing bacterial-derived inflammatory molecules (d) Bacterial biosynthesis of lipopolysaccharide (LPS), LPS biosynthesis proteins, Bacterial toxins and Peptidoglycan biosynthesis.*p<0.05, **p<0.01.

K. Ibrahim, et al. 72
doi: 10.12938/bmfh.2019-031 ©2021 BMFH Press
administered mice on a high fat diet. Our results for predictions on butyrate and propionate are also in accord with a chemical study of human subjects and both of these SCFAs were decreased in faecal material from patients with T2D [31]. Additionally, a study employing genome-wide genotyping and gut metagenomic sequencing of a large panel of human subjects found a positive association between butyrate production and good insulin response to oral glucose administration [32].
The data from Obese rats highlighted the significant increase in Firmicutes phylum and associated decrease in Bacteroidetes. There was a significant enrichment of genus Bacteroides and a reduction of genus Prevotella in Obese rats compared to both control and STZ-alone groups. Bacteroides is a Gram-negative bacterium and is able to digest a variety of polysaccharides [33] producing fructose from fructans and then saccharolytic fermentation, produces acetate which is used for methanogenesis by Methanobrevibacter smithii [34]. Acetate is also utilised in energy metabolism by the host leading to increased adipose tissue. In the Obese rats, there was enrichment of [Prevotella]/ [Paraprevotellaceae] and this bacterium was predicted to be positively associated with propionate metabolism (Supplementary Fig. 7). Ruminococcus and Oscillibacter were increased in the Obese rats (Fig. 3). Some Ruminococcus sp. are acetate producers [35] and R. bromii and R. obeum were associated with obesity [36] and here a positive correlation between Ruminococcus and predicted propionate metabolism was found (Supplementary Fig. 7). There are three pathways of propionate metabolism and the association between Ruminococcus sp. and one of these has recently been confirmed in the human gut microbiota [37]. Reichardt and his colleagues found that the propanediol pathway occurs in some species of Ruminococcus genus and Lachnospiraceae family. Krych et al.[38], showed that the occurrence of bacteria such as Lachnospiraceae family, and both genera Oscillospira and Ruminococcus from Ruminococcaceae family are associated with the promotion of diabetes.
Perhaps the most dramatic changes in bacterial communities were found in the rats in which T2D had been induced. Further these changes appear to be associated with the physiological state expected of a diabetic animal. The diabetic rats had a decreased ratio of Firmicutes/ Bacteroidetes despite an increase of Bacteroides. The increase of Bacteroides was positively correlated with predicted LPS biosynthesis. Blautia was also increased and is a gram-positive, non-sporulating coccobacillus belonging to the Firmicutes phylum [39]. In humans Blautia was the predominant genus in pre-diabetic and T2D patients [40] and plays a vital role in the metabolism of glucose which it converts to acetate, lactate, hydrogen, ethanol and succinate in the gut [39]. A recent report by Ozato et al.[41], found that visceral fat in individuals in a Japanese population was inversely associated with Blautia. In our study Blautia was not significantly different in the Obese animals compared to the Control, however, our measure of Obesity was body weight rather than visceral fat. The predicted increase of bacterial gut-derived inflammatory molecules (for instance, LPS, flagellin and peptidoglycans) and predicted decreased butyrate production would be likely to be associated with the causation of inflammation and T2D [42]. Increased permeability of the gut membrane and low level inflammation caused by LPS and bacterial toxins has been reviewed [43].
As a working hypothesis we propose that the relationship between diet and the role of either beneficial or harmful gut
microbiota in Wistar rats is that summarized in Fig. 7. The taxonomy of the bacterial communities and the bacterial metabolic capabilities were comparable in both control groups and predicted to promote the production of mucin and protection of the gut barrier layer. On the other hand, there were significant differences in the bacterial communities and metabolic potential in the Obese and T2D rats. Changes from a high ratio of Prevotella/ Bacteroides in controls to a low ratio in the T2D animals (data not shown) are associated with a healthy to diabetic transition and similar conclusions have been reached in humans and mice [44]. This is diet associated and these differences were observed when comparing both groups on a normal diet to both groups on a high fat diet. In humans Prevotella is associated with plant-based diets [45] and the normal diet provided for control rats is derived from a plant-based source including soya, wheat and barley (http://www.sdsdiets.com/pdfs/RM1P-E-FG.pdf). However, single-component diet change does not itself bring about a change in Prevotella/ Bacteroides ratio or a loss of body weight [46]. Intervention is clearly context specific and the development of therapies for metabolic diseases will need to be mindful of the antagonistic interaction between Prevotella and Bacteroides [47], dietary presence of complex carbohydrates or presence of a fat- and protein-rich diet.
Obesity predisposes to T2D but this is not the case in all instances of the disease [48, 49]. Identifying the pathway from obesity to T2D and the role of the gut microbiome is especially difficult because of the interaction of a large number of gut organisms, many of which have not been identified, with each other and the host and the balance between harmful and beneficial interactions [50]. Seeking links between obesity and T2D is not revealed by this study but some clues are provided. Blautia is present in Obese rats and significantly elevated in T2D rats. This is predicted to disrupt carbohydrate and glucose metabolism that reduces butyrate production with an increase of other SCFA and these products may contribute to energy capture by the host [51, 52]. The one common feature of the microbial changes in both Obese and T2D rats is the increase of Bacteroides. Bacteroides are uniquely able to regulate the expression of genes for polysaccharide degradation and uptake and these are determined by the identity and availability of specific polysaccharides. They do this through different gene cassettes that are differentially controlled by intermediates of the breakdown process and may differ between species [53]. Thus we hypothesise that species within Blautia and Bacteroides are significantly associated with both Ob and T2D possibly as a mechanistic driver. The animal models share many characteristics that have been described from studies of humans either of obesity or T2D and future work may profit from a focus on Blautia and Bacteroides in these animal models and identifying which specific species in the two genera are altered.
Conflict of Interest
KSI declares that he has no conflict of interest. NB declares that she has no conflict of interest. SD declares that she has no conflict of interest. SL declares that she has no conflict of interest.
JS declares that she has no conflict of interest. JAC declares that he has no conflict of interest.

**RIGHT RUNNING HEAD MISSING** 73
doi: 10.12938/bmfh.2019-031 ©2021 BMFH Press
ACKNOWLEDGEMENT
We thank Dr R Martin and his team for assistance in running QIIME and PICRUSt at the EPSRC (EP/K000586/1)-funded Archie-West HPC.
REFERENCES
1. Musso G, Gambino R, Cassader M. 2010. Obesity, diabetes, and gut microbiota: the hygiene hypothesis expanded? Diabetes Care 33: 2277–2284. [Medline] [CrossRef]
2. Karlsson F, Tremaroli V, Nielsen J, Bäckhed F. 2013. Assessing the human gut microbiota in metabolic diseases. Diabetes 62: 3341–3349. [Medline] [CrossRef]
3. Gomez-Llorente MA, Romero R, Chueca N, Martinez-Cañavate A, Gomez-Llorente C. 2017. Obesity and ssthma: a missing link. Int J Mol Sci 18: E1490. [Medline] [CrossRef]
4. Caporaso JG, Kuczynski J, Stombaugh J, Bittinger K, Bushman FD, Costello EK, Fierer N, Peña AG, Goodrich JK, Gordon JI, Huttley GA, Kelley ST, Knights D, Koenig JE, Ley RE, Lozupone CA, McDonald D, Muegge BD, Pirrung M, Reeder J, Sevinsky JR, Turnbaugh PJ, Walters WA, Widmann J, Yatsunenko T, Zaneveld J, Knight R. 2010. QIIME allows analysis of high-throughput community sequencing data. Nat Methods 7: 335–336. [Medline] [CrossRef]
5. Langille MG, Zaneveld J, Caporaso JG, McDonald D, Knights D, Reyes JA, Clemente JC, Burkepile DE, Vega Thurber RL, Knight R, Beiko RG, Huttenhower C. 2013. Predictive functional profiling of microbial communities using 16S rRNA marker gene sequences. Nat Biotechnol 31: 814–821. [Medline] [CrossRef]
6. Waldram A, Holmes E, Wang Y, Rantalainen M, Wilson ID, Tuohy KM, McCartney AL, Gibson GR, Nicholson JK. 2009. Top-down systems biology modeling of host metabotype-microbiome associations in obese rodents. J Proteome Res 8: 2361–2375. [Medline] [CrossRef]
7. de La Serre CB, Ellis CL, Lee J, Hartman AL, Rutledge JC, Raybould HE. 2010. Propensity to high-fat diet-induced obesity in rats is associated with changes in the gut microbiota and gut inflammation. Am J Physiol Gastrointest Liver Physiol 299: G440–G448. [Medline] [CrossRef]
8. Wirth R, Bódi N, Maróti G, Bagyánszki M, Talapka P, Fekete É, Bagi Z, Kovács KL. 2014. Regionally distinct alterations in the composition of the gut microbiota in rats with streptozotocin-induced diabetes. PLoS One 9: e110440. [Medline] [CrossRef]
9. Patterson E, Marques TM, O’Sullivan O, Fitzgerald P, Fitzgerald GF, Cotter PD, Dinan TG, Cryan JF, Stanton C, Ross RP. 2015. Streptozotocin-induced type-1-diabetes disease onset in Sprague-Dawley rats is associated with an altered intestinal microbiota composition and decreased diversity. Microbiology (Reading) 161: 182–193. [Medline] [CrossRef]
10. Sohail MU, Shabbir MZ, Steiner JM, Ahmad S, Kamran Z, Anwar H, Hussain G, Shaukat A, Suchodolski JS. 2017. Molecular analysis of the gut microbiome of diabetic rats supplemented with prebiotic, probiotic, and synbiotic foods. Int J Diabetes Dev Ctries 37: 419–425. [CrossRef]
11. Yin X, Peng J, Zhao L, Yu Y, Zhang X, Liu P, Feng Q, Hu Y, Pang X. 2013. Structural changes of gut microbiota in a rat non-alcoholic fatty liver disease model treated with a Chinese herbal formula. Syst Appl Microbiol 36: 188–196. [Medline] [CrossRef]
12. Reed MJ, Meszaros K, Entes LJ, Claypool MD, Pinkett JG, Gadbois TM, Reaven GM. 2000. A new rat model of type 2 diabetes: the fat-fed, streptozotocin-treated rat. Metabolism 49: 1390–1394. [Medline] [CrossRef]
13. Skovsø S. 2014. Modeling type 2 diabetes in rats using high fat diet and streptozotocin. J Diabetes Investig 5: 349–358. [Medline] [CrossRef]
14. Edgar RC. 2010. Search and clustering orders of magnitude faster than BLAST. Bioinformatics 26: 2460–2461. [Medline] [CrossRef]
15. DeSantis TZ, Hugenholtz P, Larsen N, Rojas M, Brodie EL, Keller K, Huber T, Dalevi D, Hu P, Andersen GL. 2006. Greengenes, a chimera-checked 16S rRNA gene database and workbench compatible with ARB. Appl Environ Microbiol 72: 5069–5072. [Medline] [CrossRef]
16. Vandesompele J, De Preter K, Pattyn F, Poppe B, Van Roy N, De Paepe A, Speleman F. 2002. Accurate normalization of real-time quantitative RT-PCR data by geometric averaging of multiple internal control genes. Genome Biol 3: H0034. [Medline] [CrossRef]
17. Ley RE, Turnbaugh PJ, Klein S, Gordon JI. 2006. Microbial ecology: human gut microbes associated with obesity. Nature 444: 1022–1023. [Medline] [CrossRef]
18. Jiao N, Baker SS, Nugent CA, Tsompana M, Cai L, Wang Y, Buck MJ, Genco RJ, Baker RD, Zhu R, Zhu L. 2018. Gut microbiome may contribute to insulin resistance and systemic inflammation in obese rodents: a meta-analysis. Physiol Genomics 50:
Fig. 7. A model of the interactions between gut and microbial communities in normal (a), diabetic (b) and obese (c) conditions.

K. Ibrahim, et al. 74
doi: 10.12938/bmfh.2019-031 ©2021 BMFH Press
244–254. [Medline] [CrossRef] 19. McGuckin MA, Lindén SK, Sutton P, Florin TH. 2011. Mucin dynamics and enteric
pathogens. Nat Rev Microbiol 9: 265–278. [Medline] [CrossRef] 20. Evans CC, LePard KJ, Kwak JW, Stancukas MC, Laskowski S, Dougherty J, Moulton
L, Glawe A, Wang Y, Leone V, Antonopoulos DA, Smith D, Chang EB, Ciancio MJ. 2014. Exercise prevents weight gain and alters the gut microbiota in a mouse model of high fat diet-induced obesity. PLoS One 9: e92193. [Medline] [CrossRef]
21. Vital M, Gao J, Rizzo M, Harrison T, Tiedje JM. 2015. Diet is a major factor governing the fecal butyrate-producing community structure across Mammalia, Aves and Reptilia. ISME J 9: 832–843. [Medline] [CrossRef]
22. Zhong Y, Nyman M, Fåk F. 2015. Modulation of gut microbiota in rats fed high-fat diets by processing whole-grain barley to barley malt. Mol Nutr Food Res 59: 2066–2076. [Medline] [CrossRef]
23. Vanhoutvin SA, Troost FJ, Hamer HM, Lindsey PJ, Koek GH, Jonkers DM, Kodde A, Venema K, Brummer RJ. 2009. Butyrate-induced transcriptional changes in human colonic mucosa. PLoS One 4: e6759. [Medline] [CrossRef]
24. Barcelo A, Claustre J, Moro F, Chayvialle JA, Cuber JC, Plaisancié P. 2000. Mucin secretion is modulated by luminal factors in the isolated vascularly perfused rat colon. Gut 46: 218–224. [Medline] [CrossRef]
25. Günzel D, Yu AS. 2013. Claudins and the modulation of tight junction permeability. Physiol Rev 93: 525–569. [Medline] [CrossRef]
26. Hamer HM, Jonkers D, Venema K, Vanhoutvin S, Troost FJ, Brummer RJ. 2008. Review article: the role of butyrate on colonic function. Aliment Pharmacol Ther 27: 104–119. [Medline] [CrossRef]
27. Kimura I, Ozawa K, Inoue D, Imamura T, Kimura K, Maeda T, Terasawa K, Kashihara D, Hirano K, Tani T, Takahashi T, Miyauchi S, Shioi G, Inoue H, Tsujimoto G. 2013. The gut microbiota suppresses insulin-mediated fat accumulation via the short-chain fatty acid receptor GPR43. Nat Commun 4: 1829. [Medline] [CrossRef]
28. Ravussin Y, Koren O, Spor A, LeDuc C, Gutman R, Stombaugh J, Knight R, Ley RE, Leibel RL. 2012. Responses of gut microbiota to diet composition and weight loss in lean and obese mice. Obesity (Silver Spring) 20: 738–747. [Medline] [CrossRef]
29. Tachon S, Zhou J, Keenan M, Martin R, Marco ML. 2013. The intestinal microbiota in aged mice is modulated by dietary resistant starch and correlated with improvements in host responses. FEMS Microbiol Ecol 83: 299–309. [Medline] [CrossRef]
30. Lee H, Ko G. 2014. Effect of metformin on metabolic improvement and gut microbiota. Appl Environ Microbiol 80: 5935–5943. [Medline] [CrossRef]
31. Adachi K, Sugiyama T, Yamaguchi Y, Tamura Y, Izawa S, Hijikata Y, Ebi M, Funaki Y, Ogasawara N, Goto C, Sasaki M, Kasugai K. 2019. Gut microbiota disorders cause type 2 diabetes mellitus and homeostatic disturbances in gut-related metabolism in Japanese subjects. J Clin Biochem Nutr 64: 231–238. [Medline] [CrossRef]
32. Sanna S, van Zuydam NR, Mahajan A, Kurilshikov A, Vich Vila A, Võsa U, Mujagic Z, Masclee AAM, Jonkers DMAE, Oosting M, Joosten LAB, Netea MG, Franke L, Zhernakova A, Fu J, Wijmenga C, McCarthy MI. 2019. Causal relationships among the gut microbiome, short-chain fatty acids and metabolic diseases. Nat Genet 51: 600–605. [Medline] [CrossRef]
33. Flint HJ, Bayer EA, Rincon MT, Lamed R, White BA. 2008. Polysaccharide utilization by gut bacteria: potential for new insights from genomic analysis. Nat Rev Microbiol 6: 121–131. [Medline] [CrossRef]
34. Patil DP, Dhotre DP, Chavan SG, Sultan A, Jain DS, Lanjekar VB, Gangawani J, Shah PS, Todkar JS, Shah S, Ranade DR, Patole MS, Shouche YS. 2012. Molecular analysis of gut microbiota in obesity among Indian individuals. J Biosci 37: 647–657.[Medline] [CrossRef]
35. Crost EH, Le Gall G, Laverde-Gomez JA, Mukhopadhya I, Flint HJ, Juge N. 2018. Mechanistic insights into the cross-feeding of Ruminococcus gnavus and Ruminococcus bromii on host and dietary carbohydrates. Front Microbiol 9: 2558. [Medline] [CrossRef]
36. Kasai C, Sugimoto K, Moritani I, Tanaka J, Oya Y, Inoue H, Tameda M, Shiraki K, Ito M, Takei Y, Takase K. 2015. Comparison of the gut microbiota composition between
obese and non-obese individuals in a Japanese population, as analyzed by terminal restriction fragment length polymorphism and next-generation sequencing. BMC Gastroenterol 15: 100. [Medline] [CrossRef]
37. Reichardt N, Duncan SH, Young P, Belenguer A, McWilliam Leitch C, Scott KP, Flint HJ, Louis P. 2014. Phylogenetic distribution of three pathways for propionate production within the human gut microbiota. ISME J 8: 1323–1335. [Medline] [CrossRef]
38. Krych Ł, Nielsen DS, Hansen AK, Hansen CH. 2015. Gut microbial markers are associated with diabetes onset, regulatory imbalance, and IFN-γ level in NOD mice. Gut Microbes 6: 101–109. [Medline] [CrossRef]
39. Liu C, Finegold SM, Song Y, Lawson PA. 2008. Reclassification of Clostridium coccoides, Ruminococcus hansenii, Ruminococcus hydrogenotrophicus, Ruminococcus luti, Ruminococcus productus and Ruminococcus schinkii as Blautia coccoides gen. nov., comb. nov., Blautia hansenii comb. nov., Blautia hydrogenotrophica comb. nov., Blautia luti comb. nov., Blautia producta comb. nov., Blautia schinkii comb. nov. and description of Blautia wexlerae sp. nov., isolated from human faeces. Int J Syst Evol Microbiol 58: 1896–1902. [Medline] [CrossRef]
40. Egshatyan L, Kashtanova D, Popenko A, Tkacheva O, Tyakht A, Alexeev D, Karamnova N, Kostryukova E, Babenko V, Vakhitova M, Boytsov S. 2016. Gut microbiota and diet in patients with different glucose tolerance. Endocr Connect 5: 1–9. [Medline] [CrossRef]
41. Ozato N, Saito S, Yamaguchi T, Katashima M, Tokuda I, Sawada K, Katsuragi Y, Kakuta M, Imoto S, Ihara K, Nakaji S. 2019. Blautia genus associated with visceral fat accumulation in adults 20–76 years of age. NPJ Biofilms Microbiomes 5: 28. [CrossRef]
42. Delzenne NM, Cani PD. 2011. Gut microbiota and the pathogenesis of insulin resistance. Curr Diab Rep 11: 154–159. [Medline] [CrossRef]
43. de Punder K, Pruimboom L. 2013. The dietary intake of wheat and other cereal grains and their role in inflammation. Nutrients 5: 771–787. [Medline] [CrossRef]
44. Kovatcheva-Datchary P, Nilsson A, Akrami R, Lee YS, De Vadder F, Arora T, Hallen A, Martens E, Björck I, Bäckhed F. 2015. Dietary fiber-induced improvement in glucose metabolism is associated with increased abundance of Prevotella. Cell Metab 22: 971–982. [Medline] [CrossRef]
45. Gorvitovskaia A, Holmes SP, Huse SM. 2016. Interpreting Prevotella and Bacteroides as biomarkers of diet and lifestyle. Microbiome 4: 15. [Medline] [CrossRef]
46. Hjorth MF, Roager HM, Larsen TM, Poulsen SK, Licht TR, Bahl MI, Zohar Y, Astrup A. 2018. Pre-treatment microbial Prevotella-to-Bacteroides ratio, determines body fat loss success during a 6-month randomized controlled diet intervention. Int J Obes 42: 284. [Medline] [CrossRef]
47. Ley RE. 2016. Gut microbiota in 2015: Prevotella in the gut: choose carefully. Nat Rev Gastroenterol Hepatol 13: 69–70. [Medline] [CrossRef]
48. Fenger M, Hansen DL, Worm D, Hvolris L, Kristiansen VB, Carlsson ER, Madsbad S. 2016. Gastric bypass surgery reveals independency of obesity and diabetes melitus type 2. BMC Endocr Disord 16: 59. [Medline] [CrossRef]
49. Malone JI, Hansen BC. 2019. Does obesity cause type 2 diabetes mellitus (T2DM)? Or is it the opposite? Pediatr Diabetes 20: 5–9. [Medline] [CrossRef]
50. Gurung M, Li Z, You H, Rodrigues R, Jump DB, Morgun A, Shulzhenko N. 2020. Role of gut microbiota in type 2 diabetes pathophysiology. EBioMedicine 51: 102590. [Medline] [CrossRef]
51. Yan X, Feng B, Li P, Tang Z, Wang L. 2016. Microflora disturbance during progression of glucose intolerance and effect of sitagliptin: an animal study. J Diabetes Res 2016: 2093171. [Medline] [CrossRef]
52. Kashtanova DA, Tkacheva ON, Doudinskaya EN, Strazhesko ID, Kotovskaya YV, Popenko AS, Tyakht AV, Alexeev DG. 2018. Gut microbiota in patients with different metabolic statuses: Moscow study. Microorganisms 6: E98. [Medline] [CrossRef]
53. Wexler AG, Goodman AL. 2017. An insider’s perspective: Bacteroides as a window into the microbiome. Nat Microbiol 2: 17026. [Medline] [CrossRef]