characteristics and management of household solid waste in urban areas in ghana
TRANSCRIPT

Civil and Environmental Research www.iiste.org
ISSN 2224-5790 (Paper) ISSN 2225-0514 (Online)
Vol.3, No.9, 2013
10
Characteristics and management of household solid waste in
urban areas in Ghana: the case of WA.
Isaac Monney1* Benjamin Makimula Tiimub1, Henry Chendire Bagah2
1. Department of Environmental Health and Sanitation Education, University of Education, Winneba,
P.O. Box M40, Mampong-Ashanti, Ghana
2. Environmental Health and Sanitation Unit, Wa Municipal Assembly, Wa, Ghana
*E-mail of the corresponding author: [email protected]
Abstract
This paper presents the characteristics (composition, bulk density and generation rate) of household solid waste
and waste management practices in Wa; an urban community in Ghana. The study approach involved an
assessment of the physical characteristics approximately 2.3tons of solid waste generated by 15 households in
the study area over a 30-day period. Structured questionnaires were administered to residents, the Waste
Management Department and the only private waste management company in Wa. The results indicate that the
waste generation rate for the Wa is 0.68±0.24kg/cap/day with the average bulk density of 44.9±28 kg/m3.
Household solid waste is dominated by organic waste (48%) and inert materials (33%). Plastics/rubber and
metals make up an average proportion of 5% each whiles textiles/fabric, paper/cardboard and miscellaneous
constitute 4%, 3% and 2% respectively. The characteristics of the solid waste management system include
disparities in waste collection services, lack of waste recovery mechanisms, disposal of comingled waste and
lack of regulation and monitoring of the private waste collection company. The study identifies that, waste
recovery can reduce to almost a third of the amount of household solid waste that end up at the landfill. The
study recommends the pay-as-you-dump method as a cost recovery mechanism to offset waste collection costs.
Keywords: characteristics, household, solid waste, management, Wa
1. Introduction
Solid waste management has been one of the most crucial issues facing authorities in the fast-growing cities in
developing countries. In Africa for instance, solid waste is regarded as the second most important environmental
health concern apart from water quality as per the WHO (Zerbock 2003). The problems caused by solid waste in
urban Africa is largely due to the explosive growth rates, particularly in sub-Saharan Africa, which eventually
translates into generation of copious amounts of solid waste (UN-HABITAT 2010; Taiwo 2011). However, city
authorities lack the financial and technical resources keep pace with the challenges associated with huge amounts
of solid waste (Ogwueleka 2009). Consequently, heaps of solid waste are not uncommon sights in these areas.
In Ghana, available literature indicate that some proportion of solid waste generated are not collected and thus
end up in open spaces and drains. The effects of this phenomenon are threatening to both human life and the
environment. These repercussions range from flooding, water pollution, spread of diseases and ugly sights of
stinking and pest-infested piles of solid waste in some parts of urban areas (Boadi & Kuitunen 2004; Puopiel
2010). Studies have shown that, in Accra and Kumasi, the two largest cities in Ghana, over 3,000tons of solid
waste is generated daily out of which approximately 70% is collected (Anomanyo 2004; Ketibuah 2004; Mensah
& Larbi 2005). In Tamale, Puopiel (2010) concluded that only 27% of the 810tons of waste generated daily is
collected. This tends to portray that challenges still exist in solid waste collection in the country in spite of the
fact that various private waste collection companies have been contracted to augment government's efforts in this
regard.
According to Oduro-Kwarteng (2011), three different modes of solid waste collection are practised in Ghana;
kerbside collection, house-to-house collection and communal collection. This is based on the income levels of
the people, types of housing and the required level of service. As he noted, kerbside and house-to-house
collection are rendered in middle and high income areas but communal collection is rendered in low income
areas. In the kerbside collection system, waste is deposited at the kerbside on specific days within the week to be
taken by collection crew whiles in house-to-house collection, the crew picks up the waste from each property to
be emptied and the bin returned after being emptied into collection vehicles. In communal collection, waste is

Civil and Environmental Research www.iiste.org
ISSN 2224-5790 (Paper) ISSN 2225-0514 (Online)
Vol.3, No.9, 2013
11
deposited into containers placed at vantage points within the community and picked up by collection vehicles
when it is full. Regardless of these strategies for waste collection in different income areas authors of various
studies (Tsiboe 2004; Oduro-Kwarteng 2011) conclude that huge disparities exist in the level of service.
Statistically significant difference exist between service quality in low-, middle- and high-income areas. Whiles
service quality is very poor in low-income areas, that of middle- and high-income areas are comparatively better
since the latter mostly pay for waste collection services whiles in most cases, the government bears the cost of
solid waste collection on behalf of the former (Obirih-Opareh & Post 2002).
Anomanyo (2004) observed that, apart from lack of funds, insufficient information on quantities and
characteristics of waste is the major contributing factor to Ghana's waste management problems. As he noted, the
existing waste management systems in the country has not appropriately integrated other essential components
of waste management such as reuse, recycling, reprocessing and treatment. However, as Tchobanoglous &
Kreith (2002) puts it, an understanding of the characteristics of the waste stream is a must in any solid waste
management system. This is helpful to municipalities in determining the best management methods for different
materials, planning recycling and recovery programs, purchasing equipment, sizing facilities, among others
Cheremisinhoff (2003). Various studies in Ghana in this regard has over the years been concentrated in the
southern sector, where conditions (weather and income levels) widely vary from that of the northern sector.
Against this background, this study seeks to characterise household solid waste in Wa (composition, bulk density
and generation rate) and to assess the waste management practices in the study area.
2.0 Materials and methods
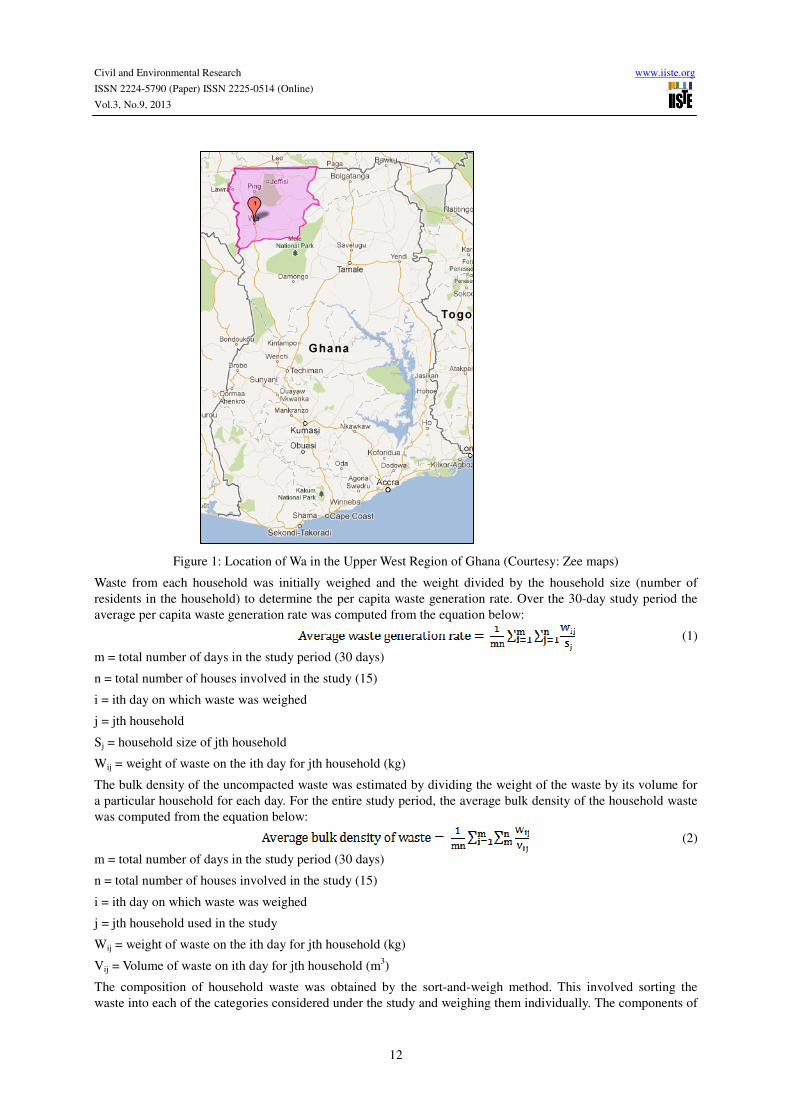
Located in the Upper West Region of Ghana, Wa doubles as both the regional capital and the capital of the only
Municipal Assembly in the region; Wa Municipal Assembly. Geographically, Wa is located on 10°4′N 2°30′W
and lies within the savannah high plains in Ghana (Figure 1). It currently has an estimated population of over
100,000 people. Farming is the major source of livelihood for most rural folks in the Municipality with about
80% of them engaged in subsistence farming. However, in urban centres in the Municipality, including Wa,
residents are mostly into commercial activities such as petty trading, shea butter extraction, local soap
manufacturing, pito brewing, weaving, dressmaking, blacksmithing, masonry, carpentry, vehicle repairs.
The study approach involved an assessment of the physical characteristics (composition, generation rate and bulk
density) of solid waste generated from 15 households in the study area over a 30-day period using the weight-
volume analysis. Purposive random sampling method was used in the selection of the study households both for
solid waste composition analysis and questionnaire administration. By this method, households and study
respondents were selected from low, middle and high income communities within the study area to provide a
holistic idea about the waste characteristics and management practices in Wa. The criteria used to classify the
households were based on the residents' living standards, housing and access to basic essential services such as
potable water, electricity and toilet facilities, among others, according to the Wa Municipal Assembly Valuation
Unit. Three communities from Wa were therefore identified for study: Zongo/Sokpariyiri as low income
community, Junior Staff Quarters as middle income community and Degu Government Residential Area as high
income community. Five households from each of these communities were used for the study. Each of the
participating households were provided with a 120L bin after thoroughly sensitizing residents on the study
objectives for their full cooperation.
Civil and Environmental Research www.iiste.org
ISSN 2224-5790 (Paper) ISSN 2225-0514 (Online)
Vol.3, No.9, 2013
12
Figure 1: Location of Wa in the Upper West Region of Ghana (Courtesy: Zee maps)
Waste from each household was initially weighed and the weight divided by the household size (number of
residents in the household) to determine the per capita waste generation rate. Over the 30-day study period the
average per capita waste generation rate was computed from the equation below:
(1)
m = total number of days in the study period (30 days)
n = total number of houses involved in the study (15)
i = ith day on which waste was weighed
j = jth household
Sj = household size of jth household
Wij = weight of waste on the ith day for jth household (kg)
The bulk density of the uncompacted waste was estimated by dividing the weight of the waste by its volume for
a particular household for each day. For the entire study period, the average bulk density of the household waste
was computed from the equation below:
(2)
m = total number of days in the study period (30 days)
n = total number of houses involved in the study (15)
i = ith day on which waste was weighed
j = jth household used in the study
Wij = weight of waste on the ith day for jth household (kg)
Vij = Volume of waste on ith day for jth household (m3)
The composition of household waste was obtained by the sort-and-weigh method. This involved sorting the
waste into each of the categories considered under the study and weighing them individually. The components of

Civil and Environmental Research www.iiste.org
ISSN 2224-5790 (Paper) ISSN 2225-0514 (Online)
Vol.3, No.9, 2013
13
each category used for the study are shown in the Table 1.
Table 1: Classification of waste components
Category Components
Organic Food remains, green leaves, yam peels, dry leaves
Plastics/Rubber Polythene bags, sachet water bags, plastic bottles, food
wrappers, plastic bowls, sandals and pampers
Paper/Cardboard Newspaper, used toilet rolls, cartons and scratch cards
Metal Metal cans, scrap metal, spoons and used blades
Textiles rejected used clothing, pieces of cut cloth and school
bags
Inert materials Charcoal remnants, ashes and sand
Miscellaneous Bottles and ceramic
The proportions of each component was expressed as a percentage of the total weight of waste over the study
period as illustrated in the equation below:
(3)
Wt = Total weight of solid waste from all households over study period
i = ith day on which weight of waste was measured
n = number of days for study period (30 days)
wc,i = weight of a specific category of waste component for a particular house measured on the ith day
Structured questionnaires and extensive field observations were also used to determine the waste management
practices at the household level vis-a-vis primary storage at the household level; final waste disposal and
associated costs; waste recovery at the household level and the perception on the quality of service rendered by
waste collection companies. 105 questionnaires, made up of 35 questionnaires for each of the three communities,
were administered for the assessment of waste management practices in the study area. In addition, key
stakeholder interviews were also conducted to ascertain the challenges to the solid waste management system in
the study area.
3. Results and discussion
3.1 Household waste characteristics and options for recovery
A total of approximately 2.3tons of solid waste generated by 15 households over the 30-day study period was
used for the assessment. Half of this total quantity of solid waste emanated from households in the low-income
area whilst middle- and high-income households contributed 24% and 26% respectively. The greater proportion
of waste emanating from low-income households is due to relatively larger household size as compared to
middle- and high-income households. However, the average per capita waste generation rate in the low-income
area (0.49kg/cap/day) was lower than that of middle and high income areas (0.72kg/cap/day and 0.82kg/cap/day
respectively). The increasing trend in waste generation rate from the low to high income groups as shown by this
study is similar to that reported in Kumasi by Mensah (2010) - 0.542 kg/cap/day, 0.608kg/cap/day and
0.728kg/cap/day for low, middle and high income areas respectively. Moreover, the difference in waste
generation rates among the income groups conforms to available literature (Chandrappa and Das 2012;
Hoornweg and Bhada-Tata 2012) which assert that the quantity of waste generated is a function of the residents'
lifestyle and living standards. Residents in low-income communities are generally poorer and has low purchasing
power resulting in low waste generation rates. In addition, the average per capita waste generation rate for Wa
throughout the study period is estimated as 0.68±0.24kg/cap/day. This falls within the range of per capita waste
generation rates reported by Hoornweg and Bhada-Tata (2012) for sub-Saharan countries (0.09 - 3.0kg/cap/day)
but slightly higher than that reported in Accra by Anomanyo (2004) - 0.5kg/cap/day.
The bulk density of uncompacted household solid waste obtained for the low-, middle- and high-income
households involved in the study are 84.1±25.7kg/m3, 30.8±9.1kg/m3 and 27.6±7.8kg/m3 respectively.
Moreover, the average bulk density of solid waste for all households is 44.9±28 kg/m3. These values are far
below those reported by Acquah (2010) from his study in Kumasi in which the bulk density of waste for low-,
middle- and high-income households were reported as 381 kg/m3 237 kg/m3, 306 kg/m3 respectively. This

Civil and Environmental Research www.iiste.org
ISSN 2224-5790 (Paper) ISSN 2225-0514 (Online)
Vol.3, No.9, 2013
14
could be due to the relatively low proportion of wet waste in the domestic solid waste in Wa (average of 48%) as
compared to Kumasi (average of 71%). Although the density of domestic waste is lower at the household level,
Cointreau (1982) asserts that it can double upon storage in communal containers over a couple of days.
Knowledge of the density of waste and the waste generation rates, expressed in weight, are essential in
estimating the payload capacity of collection equipment as well as the number of vehicles needed for waste
collection.
The two principal components that dominate solid waste from all income areas in Wa are organics and inert
materials (Figure 2). Particularly for the low income area, the organic proportion forms approximately half (54%)
of the household waste produced followed by inert materials (sand, ash and charcoal remnants). It was observed
from the study that, sand from household sweepings forms a substantial amount of the inert materials found in
the household waste. This results from sweepings from unpaved areas in the households, particularly for low
income areas, subsequently increasing the proportion of inert materials ending up in the waste stream. According
to Zurbrugg (2003), the abrasiveness of inert materials such as sand and stones in the solid waste stream may
rapidly weaken waste collection equipment. Therefore, education of residents to desist from adding sand from
sweepings to their household waste would significantly reduce the fraction of inert materials ending up in the
waste stream as well as protecting collection equipment from rapid deterioration.
The proportion of organics and inert materials in the household waste reduces from low-income areas to high
income areas - 54%, 47%, 37% (organics) and 39%, 35% 20% (inert materials). However, all other components
show a reverse trend. This pattern in waste composition is attributed to factors such as high spending among rich
folks on packaging materials and a relatively low level of recovery of components such as metals, plastics and
papers for scrap dealers (Chandrappa and Das 2012). Moreover, compared with results from available studies by
Ketibuah et al. (2004) conducted in Kumasi, the proportions of organics in the waste from all areas are relatively
lower.
Figure 2: Variation of solid waste composition for low-, middle- and high-income areas
Civil and Environmental Research www.iiste.org
ISSN 2224-5790 (Paper) ISSN 2225-0514 (Online)
Vol.3, No.9, 2013
15
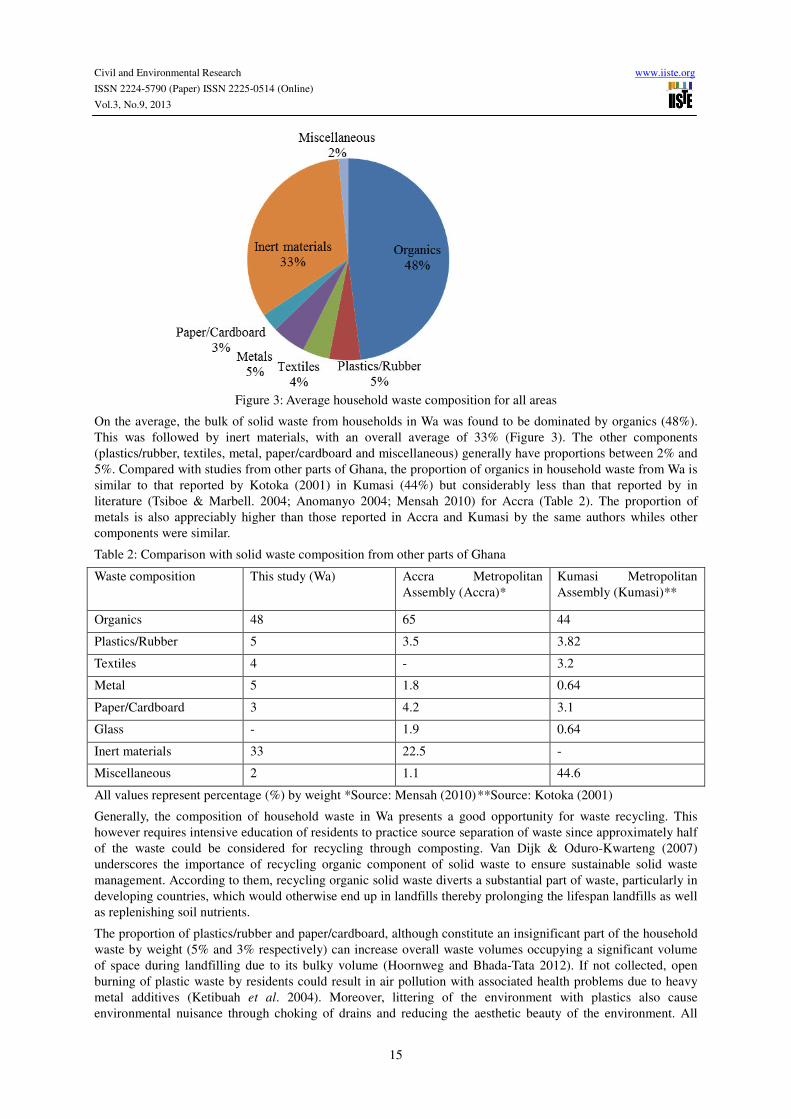
Figure 3: Average household waste composition for all areas
On the average, the bulk of solid waste from households in Wa was found to be dominated by organics (48%).
This was followed by inert materials, with an overall average of 33% (Figure 3). The other components
(plastics/rubber, textiles, metal, paper/cardboard and miscellaneous) generally have proportions between 2% and
5%. Compared with studies from other parts of Ghana, the proportion of organics in household waste from Wa is
similar to that reported by Kotoka (2001) in Kumasi (44%) but considerably less than that reported by in
literature (Tsiboe & Marbell. 2004; Anomanyo 2004; Mensah 2010) for Accra (Table 2). The proportion of
metals is also appreciably higher than those reported in Accra and Kumasi by the same authors whiles other
components were similar.
Table 2: Comparison with solid waste composition from other parts of Ghana
Waste composition
This study (Wa)
Accra Metropolitan
Assembly (Accra)*
Kumasi Metropolitan
Assembly (Kumasi)**
Organics 48 65 44
Plastics/Rubber 5 3.5 3.82
Textiles 4 - 3.2
Metal 5 1.8 0.64
Paper/Cardboard 3 4.2 3.1
Glass - 1.9 0.64
Inert materials 33 22.5 -
Miscellaneous 2 1.1 44.6
All values represent percentage (%) by weight *Source: Mensah (2010) **Source: Kotoka (2001)
Generally, the composition of household waste in Wa presents a good opportunity for waste recycling. This
however requires intensive education of residents to practice source separation of waste since approximately half
of the waste could be considered for recycling through composting. Van Dijk & Oduro-Kwarteng (2007)
underscores the importance of recycling organic component of solid waste to ensure sustainable solid waste
management. According to them, recycling organic solid waste diverts a substantial part of waste, particularly in
developing countries, which would otherwise end up in landfills thereby prolonging the lifespan landfills as well
as replenishing soil nutrients.
The proportion of plastics/rubber and paper/cardboard, although constitute an insignificant part of the household
waste by weight (5% and 3% respectively) can increase overall waste volumes occupying a significant volume
of space during landfilling due to its bulky volume (Hoornweg and Bhada-Tata 2012). If not collected, open
burning of plastic waste by residents could result in air pollution with associated health problems due to heavy
metal additives (Ketibuah et al. 2004). Moreover, littering of the environment with plastics also cause
environmental nuisance through choking of drains and reducing the aesthetic beauty of the environment. All

Civil and Environmental Research www.iiste.org
ISSN 2224-5790 (Paper) ISSN 2225-0514 (Online)
Vol.3, No.9, 2013
16
these problems can be averted if plastics are separated at source and sold to recycling companies in the country
to make other products. Papers/cardboard can also be recycled to manufacture egg-crates and toilet roll.
The average proportion of metals in household waste in the study area (5%) is considerably higher than those
reported in Kumasi (0.64%) and Accra (1.8%). This presents the prospect for selling this component of waste to
metal scrap dealers if source separation is practiced. In spite of the numerous items which could be potentially
recovered for recycling none of the residents interviewed during the survey recovered or sorted out any item
from the waste. There is therefore the need to educate residents on source separation and a readily available
market made available to purchase recovered items from residents who recover valuable items for recycling.
3.2 Household waste management options and quality of solid waste collection service
More than half of the respondents (64.8%) were between the age group of 36-60 with the least proportion being
those above 60 years (Figure 4). With respect to sex distribution, females constituted a greater proportion (81%)
of the respondents. This is due to the fact that household waste management is generally regarded as the duty of
women, as part of their culture, and thus the men were usually reluctant to contribute whatsoever to the study.
Almost half (44.8%) of respondents have no educational background with approximately a quarter (22.9%)
attaining Tertiary level education (Figure 4). This confirms the low level of literacy rate (46.2%) in the Upper
West Region of Ghana as reported by Ghana Statistical Services (Dapatem 2013). Majority (41.0%) of
respondents are engaged in commercial activities like shea butter extraction, local soap manufacturing, pito
brewing, weaving, dressmaking, blacksmithing, masonry, and carpentry offering a form of self employment
whilst 36.2% are government employees.
Figure 4: Socio-demographic characteristics of respondents
Civil and Environmental Research www.iiste.org
ISSN 2224-5790 (Paper) ISSN 2225-0514 (Online)
Vol.3, No.9, 2013
17
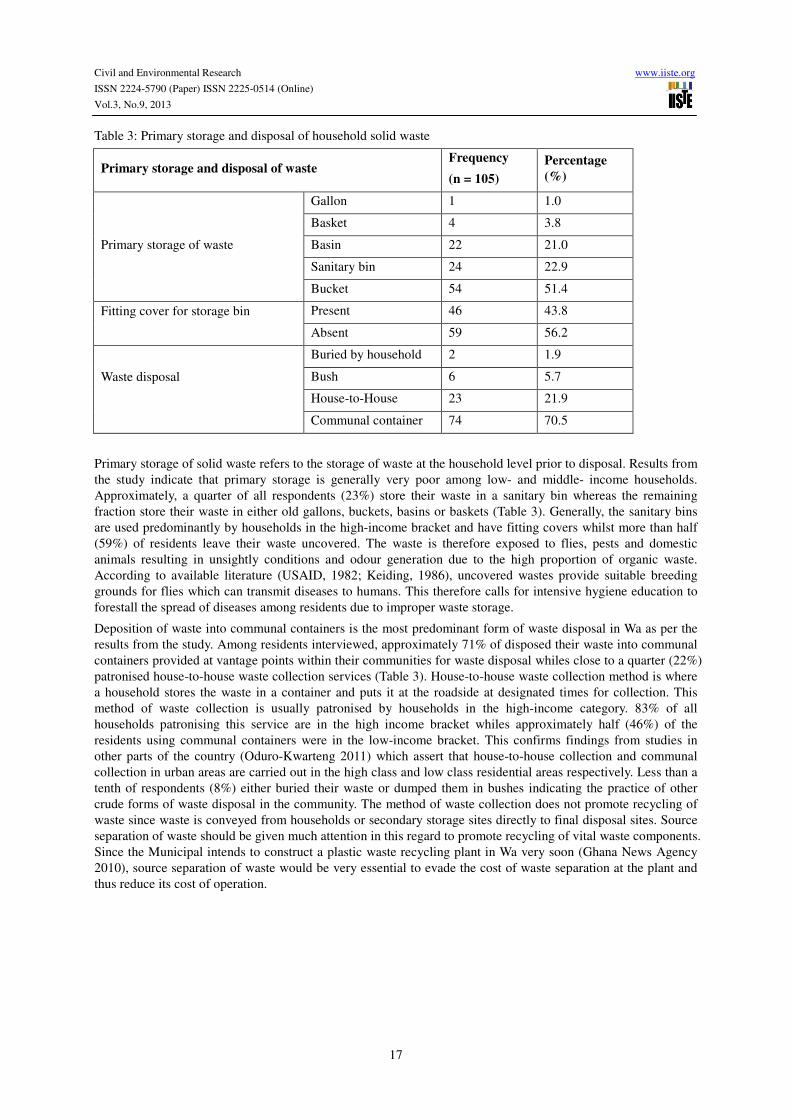
Table 3: Primary storage and disposal of household solid waste
Primary storage and disposal of waste Frequency
(n = 105)
Percentage
(%)
Primary storage of waste
Gallon 1 1.0
Basket 4 3.8
Basin 22 21.0
Sanitary bin 24 22.9
Bucket 54 51.4
Fitting cover for storage bin
Present 46 43.8
Absent 59 56.2
Waste disposal
Buried by household 2 1.9
Bush 6 5.7
House-to-House 23 21.9
Communal container 74 70.5
Primary storage of solid waste refers to the storage of waste at the household level prior to disposal. Results from
the study indicate that primary storage is generally very poor among low- and middle- income households.
Approximately, a quarter of all respondents (23%) store their waste in a sanitary bin whereas the remaining
fraction store their waste in either old gallons, buckets, basins or baskets (Table 3). Generally, the sanitary bins
are used predominantly by households in the high-income bracket and have fitting covers whilst more than half
(59%) of residents leave their waste uncovered. The waste is therefore exposed to flies, pests and domestic
animals resulting in unsightly conditions and odour generation due to the high proportion of organic waste.
According to available literature (USAID, 1982; Keiding, 1986), uncovered wastes provide suitable breeding
grounds for flies which can transmit diseases to humans. This therefore calls for intensive hygiene education to
forestall the spread of diseases among residents due to improper waste storage.
Deposition of waste into communal containers is the most predominant form of waste disposal in Wa as per the
results from the study. Among residents interviewed, approximately 71% of disposed their waste into communal
containers provided at vantage points within their communities for waste disposal whiles close to a quarter (22%)
patronised house-to-house waste collection services (Table 3). House-to-house waste collection method is where
a household stores the waste in a container and puts it at the roadside at designated times for collection. This
method of waste collection is usually patronised by households in the high-income category. 83% of all
households patronising this service are in the high income bracket whiles approximately half (46%) of the
residents using communal containers were in the low-income bracket. This confirms findings from studies in
other parts of the country (Oduro-Kwarteng 2011) which assert that house-to-house collection and communal
collection in urban areas are carried out in the high class and low class residential areas respectively. Less than a
tenth of respondents (8%) either buried their waste or dumped them in bushes indicating the practice of other
crude forms of waste disposal in the community. The method of waste collection does not promote recycling of
waste since waste is conveyed from households or secondary storage sites directly to final disposal sites. Source
separation of waste should be given much attention in this regard to promote recycling of vital waste components.
Since the Municipal intends to construct a plastic waste recycling plant in Wa very soon (Ghana News Agency
2010), source separation of waste would be very essential to evade the cost of waste separation at the plant and
thus reduce its cost of operation.

Civil and Environmental Research www.iiste.org
ISSN 2224-5790 (Paper) ISSN 2225-0514 (Online)
Vol.3, No.9, 2013
18
Table 4:Cost and quality of household waste management services
Household waste management
services
Variables Frequency Percentage (%)
Payment for household waste
collection (n = 105)
Yes 23 21.9
No 82 78.10
Cost of waste collection per
month (n = 23)
GH¢7/120L (US$3.6/120L)* 3 13.0
GH¢10/240L (US$5/240L)* 20 87.0
Opinion on cost of waste
collection (n = 23)
Economical 20 87.0
Expensive 3 13.0
Opinion on quality of service Satisfactory 33 31.4
Unsatisfactory 72 68.6
*Based on US$1 = GH¢1.97
Figure 5: Residents' satisfaction with waste collection services
Payment for waste collection is only done by residents patronising the house-to-house waste collection service
(22%) whiles others do not pay for waste collection (Table 4). The house-to-house method is given out on
franchise basis to private waste management companies in urban centres in Ghana and subscribers are made to
pay a fee for weekly collection (Puopiel 2010). Results from the study indicate that this service costs subscribers
US$3.6 and US$5 per month for 120L and 240L bins respectively (Table 4). Majority of residents (87%)
patronising this service paid US$5 per month. Moreover, most residents opined that the waste collection cost is
economical.
However, according to the residents, the general quality of service regarding waste collection service is
unsatisfactory. More than half (69%) of residents interviewed expressed their dissatisfaction about the quality of
service rendered by the service provider. The major reason given for their assertion include delays in waste
collection leading to overflow of bins or communal containers creating unsightly conditions and generation of
offensive odour. Particularly among residents who deposited their waste into communal containers, close to 4 out
of every 5 people (73%) regarded the waste collection service unsatisfactory (Figure 5). This confirms findings
by Puopiel (2010) in the capital of the Northern Region of Ghana, Tamale regarding the quality of service by
private waste management companies. Although more than half (52%) of residents patronising house-to-house
collection (mostly high-income households) also considered their quality of service as unsatisfactory it can be
deduced that it is comparatively better than the communal container service in low-income areas (Figure 5). This
is in consonance with findings by various authors (Zurbrugg 2003; Anomanyo 2004; Tsiboe 2004; Oduro-
Kwarteng 2011) which pointed out that the quality of service of solid waste collection in low-income areas is
poor as compared to middle and high income areas.
Therefore, the urban poor usually suffer most from the repercussions from the poor solid waste management
system. Nonetheless, residents have no medium to channel their concerns and attributed the poor quality of
service to monopolization of waste collection services in the township by the private waste management
Civil and Environmental Research www.iiste.org
ISSN 2224-5790 (Paper) ISSN 2225-0514 (Online)
Vol.3, No.9, 2013
19
company. This poor quality of service could coerce some residents to revert to other crude dumping methods if
drastic measures are not put in place to improve current conditions in the study area.
It could be deduced that the private waste company devote their resources to areas where they would readily
recover cost viz. subscribers to house-to-house collection whiles neglecting those who do not readily pay for
waste collection services. This is confirmed by findings by Quartey (2011) after conducting a performance audit
on the solid waste management system in Accra Metropolitan Assembly. According to him, the delays in
payment for services rendered by private waste management companies is the major factor that contribute to the
poor waste collection services in communities relying on communal containers for waste disposal. The private
companies are consequently unable to buy fuel, maintain their equipment and pay staff salaries, leading to low
morale and low performance. The Assembly therefore lacks the thrust to undertake performance evaluation of
the service providers and apply the necessary sanctions for the poor services rendered. Therefore, to reverse the
poor level of service in low- and middle-income areas in the Wa municipality, other cost recovery strategies such
as the pay-as-you-throw (PAYT) method, currently being practised in some parts of the country, can be
employed. This where residents are made to pay a fee for waste disposal at communal container sites before
depositing waste into communal containers based on the amount of waste to be disposed of.
3.3 Forces behind poor waste management services in Wa
The Waste Management Department (WMD) is the public outfit tasked with the day-to-day collection,
transportation and disposal of waste (solid and liquid), public education on waste management, public cleansing
and supervision of private contractors engaged by Metropolitan, Municipal and District Assemblies (Oduro-
Kwarteng 2011). However, due to lack of funds, limited logistics and personnel, this task has been mostly
contracted to private waste management companies in the country. Currently, the WMD plays the role of
facilitation, regulation and monitoring of solid waste management services by private waste management
companies. Although there are several private waste management companies in the country, ZoomLion
Company Limited has the greatest proportion of the waste management services across the country, including the
Wa Municipal Assembly. An assessment of the institutional arrangement for solid waste management in the
Assembly indicated that, solid waste collection services is being monopolized by ZoomLion Company Limited
possibly resulting in the poor services rendered by the company. There are also no punitive measures instituted to
coerce the company deliver competitive services to residents.
Interviews with the Waste Management Department (WMD) and ZoomLion Company Limited revealed that the
solid waste management system in place in Wa is plagued with many challenges resulting in the poor quality of
service. Apart from the poor layout of the township which hinders collection and transportation of solid waste,
respondents from the WMD indicated that inadequate communal containers, frequent breakdown of waste
collection vehicles and the poor attitude of the public towards sanitation are among the factors that militate
against solid waste management in Wa. The Department also lacks a strategic plan to monitor the quality of
service and apply the necessary sanctions on the private solid waste management company. Moreover,
representatives of the ZoomLion Company Limited also expressed similar challenges and also pointed out that
bye-laws on sanitation is ill-enforced thereby encouraging insanitary practices among the public. According to
them, practices such as indiscriminate dumping of waste, open defecation at communal container sites and
disposal of waste containing embers sometimes resulting in burning of communal containers also adversely
affect their operations in the township.
4.0 Conclusions
The study showed that household solid waste in Wa is dominated by organic waste (48%) and inert materials
(33%). Plastics/rubber and metals together make up an average proportion of 10% of domestic waste (5% each)
whiles textiles/fabric, paper/cardboard and miscellaneous constitute 4%, 3% and 2% respectively. Since almost
half of the household waste is organic, composting could be considered as the best management option. This
would reduce the household waste by half thereby prolonging the lifespan of landfills whiles at the same time
serve as manure for farmers in the Municipality. It should however, be preceded by intensive education of
residents on source separation of waste in order to evade the cost of waste separation at composting sites. The
study points out that, the inert materials in household solid waste is mostly made up sand resulting from
household sweepings of unpaved surfaces particularly in low income areas. As a result, education of residents to
desist from adding sand from sweepings to their household waste would further significantly reduce the fraction
of inert materials ending up in the waste stream. This will also protect collection equipment from rapid
deterioration due to abrasion from inert materials. Moreover, since the Municipal has the intention of
constructing a plastic waste recycling plant, efforts should be directed at recovering all the plastic materials in

Civil and Environmental Research www.iiste.org
ISSN 2224-5790 (Paper) ISSN 2225-0514 (Online)
Vol.3, No.9, 2013
20
domestic waste for recycling. This, apart from generating employment opportunities, will also curb the current
practice of indiscriminate littering of the environment with plastics and at the same time recover valuable
materials.
The average domestic waste generation rate (0.68±0.24kg/cap/day) coupled with the average bulk density
(44.9±28 kg/m3) would be helpful in sizing communal storage facilities, determining waste collection
frequencies and the optimum number of trucks to be used for waste collection from households. However, the
quantity of domestic waste that end up at the landfill site can be reduce to almost a third if waste recovery efforts
are implemented. Considering the low density of waste in the study area, compactor trucks would be suitable for
waste collection from households since it requires compaction.
Much effort is needed to ensure that waste is stored in a hygienic matter prior to disposal. From the study, about
half of residents exposed their waste to flies and other insects before final disposal. Although insignificant, the
study also found that a fraction of residents dump their waste into nearby bushes. This practice could lead to the
spread of diseases in the community and thus require health education to be intensified among residents.
Generally, more than half of residents are not satisfied with the level of service rendered by the service providers,
particularly in low income areas. This could stimulate open dumping of waste among the residents due to
overflow communal containers in the community which could trigger an epidemic. To improve the service level
in low income areas, the study recommends a cost recovery mechanism for private waste collection companies
viz. the pay-as-you-throw method to enable them offset the cost of solid waste collection. It is only by doing so
that the Municipal can have the impetus to monitor and sanction non-performing service providers.
Acknowledgements
The authors wish to express their profound gratitude to the entire staff of the Wa Municipal Environmental Health Unit and ZoomLion Ghana Limited for their assistance in diverse ways during the course of this study.
References
Anomanyo, D.E. (2004), "Integration of Municipal Solid Waste Management in Accra (Ghana): Bioreactor
Treatment Technology as an Integral Part of the Management Process", MSc. thesis. Lund University, Sweden.
Boadi, K. O. & Kuitunen, M. (2004), "Municipal Solid Waste Management in the Accra Metropolitan Area,
Ghana", The Environmentalist 23, Kluwer Academic Publishers, The Netherlands.
Chandrappa, R. & Das, D. B. (2012), "Solid Waste Management: Principles and Practice", Environmental
Science and Engineering, Springer, 48-50.
Cheremisinoff, P. N. (2002), "Handbook of Water and Wastewater Treatment Technologies", Butterworth-
Heinemann Publications, Woburn, USA.
Cointreau S. J. (1982), "Environmental Management of Urban Solid Wastes in Developing Countries: A Project
Guide", The World Bank, Urban Development Paper 5, 10.
Dapatem, D. A. (2013), "Report on 2010 Population Census Out", Retrieved from:
http://graphic.com.gh/General-News/report-on-2010-population-census-out.html Accessed: 7/6/2013
Ghana News Agency (2010), " Recycling Plant for Wa Soon",
Retrieved from : http://wa.ghanadistricts.gov.gh/?arrow=nws&read=33458 Accessed: 9/6/2013
Hoornweg, D. & Bhada-Tata, P. (2012), "What a Waste: A Global Review of Solid Waste Management", The
World Bank, Urban Development Series 15, 8-10.
Keiding, J. (1986), "The Housefly - Biology and Control", Training and information guide WHO/VBC/86.937,
World Health Organization, Geneva.
Ketibuah, E., Asase M., Yusif S., Mensah, M.Y. & Fischer, K. (2004), "Comparative Analysis of Household
Waste in the Cities of Stuttgart and Kumasi-Option for Waste Recycling and Treatment in Kumasi", Proceedings
of the 19th international CODATA Conference, 1-8.
Kotoka, P. (2001), "Physical Analysis of Solid Waste in Selected High-Income Communities in Kumasi", MSc
Thesis, Kwame Nkrumah University of Science and Technology, Kumasi.
Mensah, A. A. (2010), "Physico-Chemical Characteristics of Solid Waste and Treatment Options: A Case Study
of Kumasi, Ghana", MSc Thesis, Kwame Nkrumah University of Science Technology, Kumasi, Ghana.
Oduro-Kwarteng, S. (2011), "Private Sector Involvement in Urban Solid Waste Collection: Performance,
Capacity, and Regulation in Five Cities in Ghana", CRC Press, Taylor and Francis Group, 13-26.

Civil and Environmental Research www.iiste.org
ISSN 2224-5790 (Paper) ISSN 2225-0514 (Online)
Vol.3, No.9, 2013
21
Ogwueleka, T. C. (2009), "Municipal Solid Waste Characteristics and Management in Nigeria", Iran. J. Environ.
Health. Sci. Eng. 6 (3), 173-180.
Obirih-Opareh, N. and Post, J. (2002), "Quality Assessment of Public and Private Modes of Solid Waste
Collection in Accra", Habitat International 26, 95 - 112.
Puopiel, F. (2010), "Solid Waste Management in Ghana: The Case of Tamale Metropolitan Area", MSc Thesis,
Kwame Nkrumah University of Science and Technology, Kumasi, Ghana.
Quartey, Q. R. (2011), " Performance Audit Report of the Auditor-General on Solid Waste Management by Accra
Metropolitan Assembly", Retrieved from:
http://www.ghaudit.org/reports/WASTE_MANAGEMENT.pdf Accessed: 14/6/2013
Taiwo, A. M. (2011), "Composting as a Sustainable Waste Management Technique in Developing Countries",
Journal of Environmental Science and Technology 4(2), 93 -102
Tchobanoglous, G. & Kreith, F. (2002), "Handbook of Solid Waste Management", The McGraw-Hill Companies,
USA.
Tsiboe, I. A. & Marbell, E. (2004), "A Look at Urban Waste Disposal Problems in Accra, Ghana", MSc Thesis,
Roskilde University, Roskilde, Denmark.
UN-HABITAT (2010). Housing as a Strategy for Poverty Reduction in Ghana. United Nations Human
Settlements Programme. UNON, Publishing Services Section, Nairobi. Kenya, 11.
USAID (1982), "Water for the World: Planning Solid Waste Management Systems", Technical Note No. San.
3.P., US Agency for International Development, Washington DC, USA.
van Dijk, P.M. & Oduro-Kwarteng, S. (2007), "Urban Management and Solid Waste Issues in Africa", ISWA
World Congress, Amsterdam.
Zerbock, O. (2003), "Urban Solid Waste Management: Waste Reduction in Developing Nations", Michigan
Technological University, Houghton, MI.
Zurbrugg, C. (2003), "Urban Solid Waste Management in Low-Income Countries of Asia: How to Cope with the
Garbage Crisis", Urban Solid Waste Management Review Session, Durban, South Africa, 1-10.
This academic article was published by The International Institute for Science,
Technology and Education (IISTE). The IISTE is a pioneer in the Open Access
Publishing service based in the U.S. and Europe. The aim of the institute is
Accelerating Global Knowledge Sharing.
More information about the publisher can be found in the IISTE’s homepage:
http://www.iiste.org
CALL FOR JOURNAL PAPERS
The IISTE is currently hosting more than 30 peer-reviewed academic journals and
collaborating with academic institutions around the world. There’s no deadline for
submission. Prospective authors of IISTE journals can find the submission
instruction on the following page: http://www.iiste.org/journals/ The IISTE
editorial team promises to the review and publish all the qualified submissions in a
fast manner. All the journals articles are available online to the readers all over the
world without financial, legal, or technical barriers other than those inseparable from
gaining access to the internet itself. Printed version of the journals is also available
upon request of readers and authors.
MORE RESOURCES
Book publication information: http://www.iiste.org/book/
Recent conferences: http://www.iiste.org/conference/
IISTE Knowledge Sharing Partners
EBSCO, Index Copernicus, Ulrich's Periodicals Directory, JournalTOCS, PKP Open
Archives Harvester, Bielefeld Academic Search Engine, Elektronische
Zeitschriftenbibliothek EZB, Open J-Gate, OCLC WorldCat, Universe Digtial
Library , NewJour, Google Scholar