characterization of electric solid propellant pulsed
TRANSCRIPT

Scholars' Mine Scholars' Mine
Masters Theses Student Theses and Dissertations
Fall 2016
Characterization of electric solid propellant pulsed microthrusters Characterization of electric solid propellant pulsed microthrusters
Matthew Scott Glascock
Follow this and additional works at: https://scholarsmine.mst.edu/masters_theses
Part of the Aerospace Engineering Commons
Department: Department:
Recommended Citation Recommended Citation Glascock, Matthew Scott, "Characterization of electric solid propellant pulsed microthrusters" (2016). Masters Theses. 7598. https://scholarsmine.mst.edu/masters_theses/7598
This thesis is brought to you by Scholars' Mine, a service of the Missouri S&T Library and Learning Resources. This work is protected by U. S. Copyright Law. Unauthorized use including reproduction for redistribution requires the permission of the copyright holder. For more information, please contact [email protected].

CHARACTERIZATION OF ELECTRIC SOLID PROPELLANT
PULSED MICROTHRUSTERS
by
MATTHEW SCOTT GLASCOCK
A THESIS
Presented to the Faculty of the Graduate School of the
MISSOURI UNIVERSITY OF SCIENCE AND TECHNOLOGY
In Partial Fulfillment of the Requirements for the Degree
MASTER OF SCIENCE IN AEROSPACE ENGINEERING
2016
Approved by
Joshua L. Rovey, Advisor David W. Riggins Henry J. Pernicka

2016
Matthew Scott Glascock
All Rights Reserved

iii
PUBLICATION THESIS OPTION
This thesis consists of the following two articles, formatted in the style used by
the Missouri University of Science and Technology:
Paper I: Pages 4-39 has been accepted by the AIAA Journal of Propulsion and
Power.
Paper II: Pages 40-59 are intended for submission to the AIAA Journal of
Propulsion and Power.

iv
ABSTRACT
Electric solid propellants are an attractive option for space propulsion because
they are ignited by applied electric power only. In this work, the behavior of pulsed
microthruster devices utilizing such a material is investigated. These devices are similar
in function and operation to the pulsed plasma thruster, which typically uses Teflon as
propellant. A Faraday probe, Langmuir triple probe, residual gas analyzer, pendulum
thrust stand and high speed camera are utilized as diagnostic devices. These thrusters are
made in batches, of which a few devices were tested experimentally in vacuum
environments. Results indicate a plume electron temperature of about 1.7 eV, with an
electron density between 1011 and 1014 cm-3. According to thermal equilibrium and
adiabatic expansion calculations, these relatively hot electrons are mixed with ~2000 K
neutral and ion species, forming a non-equilibrium gas. From time-of-flight analysis, this
gas mixture plume has an effective velocity of 1500-1650 m/s on centerline. The ablated
mass of this plume is 215 µg on average, of which an estimated 0.3% is ionized species
while 45±11% is ablated at negligible relative speed. This late-time ablation occurs on a
time scale three times that of the 0.5 ms pulse discharge, and does not contribute to the
measured 0.21 mN-s impulse per pulse. Similar values have previously been measured in
pulsed plasma thrusters. These observations indicate the electric solid propellant material
in this configuration behaves similar to Teflon in an electrothermal pulsed plasma
thruster.

v
ACKNOWLEDGMENTS
First and foremost, I would like to thank my advisor, Dr. Josh Rovey, without
whom this work would have never taken form. Dr. Rovey has been known to occupy my
desk in the late afternoon on beautiful Fridays in the spring to inquire the location of his
top graduate students via email. Through this and many other interactions, he has
inspired me to better myself professionally and academically. I eagerly look ahead to the
future of my graduate studies with him, and will forever appreciate the time spent under
his supervision. Additionally, I would like to thank the members of my committee for
agreeing to serve and offering their technical knowledge and advice to me in completion
of this work.
Huge thanks are due to the Missouri Space Grant Consortium, the Chancellor’s
Fellowship program and especially the NASA Space Technology Research Fellowship
for supporting this work and my graduate career financially. Further, Digital Solid State
Propulsion provided not only support via funding but also the microthrusters, essential
testing hardware and help from members of its staff. Specifically, I must thank Jason
Thrasher for personally helping get the testing off the ground, Shae Williams for many a
fruitful discussion on the observations made, Tim Manship for assistance with the high
speed camera and of course John Sousa for infinite patience and diligence in the repair of
his electronic equipment. I would like to also acknowledge others who offered help on
this work while asking nothing in return. The machinists of the MAE department here at
Missouri S&T, John Sumpter and Warner Meeks have all been asked for much by me
during the course of this work, and assisted greatly. Of course, I must thank my
colleagues in the Aerospace Plasma Lab at Missouri S&T for sustaining a friendly and
intellectual work atmosphere.
Finally, many thanks are due to my loving family and friends for much needed
moral support in my career. Though many of you are unaware of the material of this
work, it is only with your encouragement of me that it has been completed.
vi
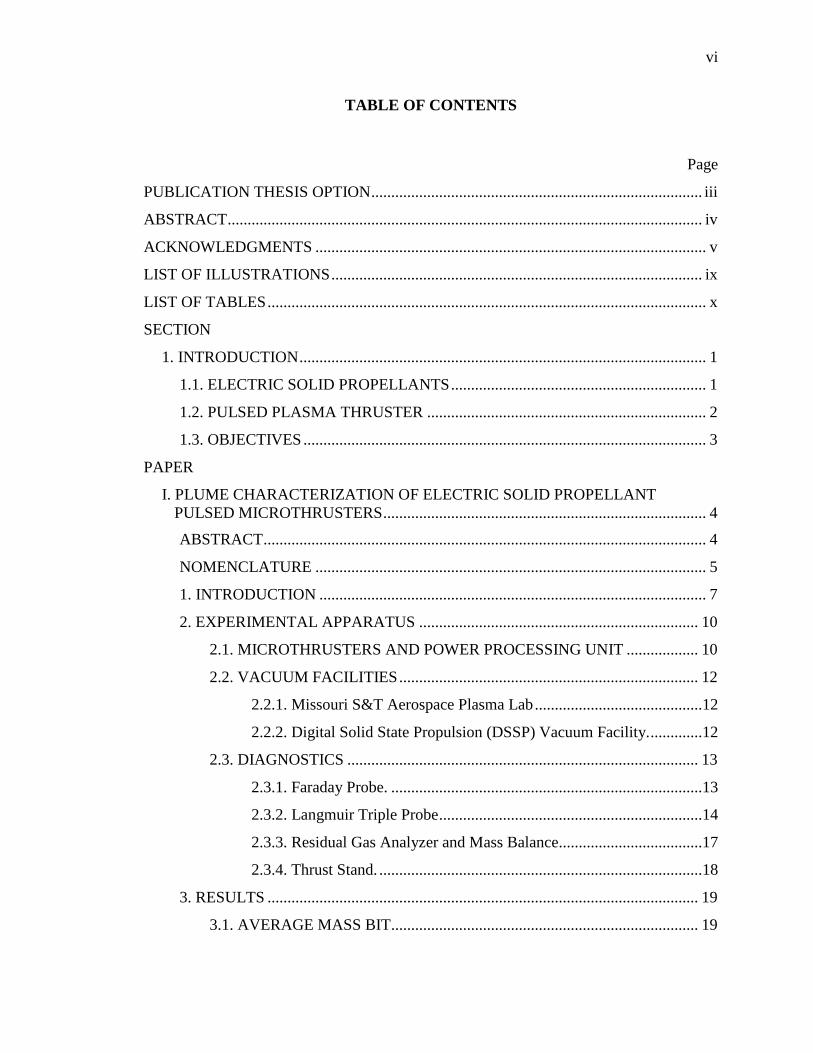
TABLE OF CONTENTS
Page
PUBLICATION THESIS OPTION ................................................................................... iii
ABSTRACT ....................................................................................................................... iv
ACKNOWLEDGMENTS .................................................................................................. v
LIST OF ILLUSTRATIONS ............................................................................................. ix
LIST OF TABLES .............................................................................................................. x
SECTION
1. INTRODUCTION ...................................................................................................... 1
1.1. ELECTRIC SOLID PROPELLANTS ................................................................ 1
1.2. PULSED PLASMA THRUSTER ...................................................................... 2
1.3. OBJECTIVES ..................................................................................................... 3
PAPER
I. PLUME CHARACTERIZATION OF ELECTRIC SOLID PROPELLANT PULSED MICROTHRUSTERS ................................................................................. 4
ABSTRACT ............................................................................................................... 4
NOMENCLATURE .................................................................................................. 5
1. INTRODUCTION ................................................................................................. 7
2. EXPERIMENTAL APPARATUS ...................................................................... 10
2.1. MICROTHRUSTERS AND POWER PROCESSING UNIT .................. 10
2.2. VACUUM FACILITIES ........................................................................... 12
2.2.1. Missouri S&T Aerospace Plasma Lab ..........................................12
2.2.2. Digital Solid State Propulsion (DSSP) Vacuum Facility. .............12
2.3. DIAGNOSTICS ........................................................................................ 13
2.3.1. Faraday Probe. ..............................................................................13
2.3.2. Langmuir Triple Probe ..................................................................14
2.3.3. Residual Gas Analyzer and Mass Balance....................................17
2.3.4. Thrust Stand. .................................................................................18
3. RESULTS ............................................................................................................ 19
3.1. AVERAGE MASS BIT ............................................................................. 19

vii
3.2. IMPULSE BIT .......................................................................................... 19
3.3. FARADAY PROBE RESULTS ............................................................... 21
3.4. LANGMUIR TRIPLE PROBE RESULTS ............................................... 22
3.5. RGA RESULTS ........................................................................................ 26
4. ANALYSIS AND DISCUSSION........................................................................ 28
4.1. PLUME CHARGE .................................................................................... 28
4.2. PLUME COMPOSITION ......................................................................... 29
4.3. PLUME IONIZATION FRACTION ........................................................ 30
4.4. EFFECTIVE EXHAUST VELOCITY ..................................................... 31
4.5. NON-THERMAL EQUILIBRIUM EXHAUST ....................................... 32
5. CONCLUSION .................................................................................................... 35
REFERENCES ........................................................................................................ 37
II. OBSERVATION OF LATE-TIME ABLATION IN ELECTRIC SOLID PROPELLANT PULSED MICROTHRUSTERS ................................................... 40
ABSTRACT ............................................................................................................. 40
1. INTRODUCTION ............................................................................................... 41
2. EXPERIMENTAL APPARATUS ...................................................................... 44
2.1. MICROTHRUSTERS AND POWER PROCESSING UNIT .................. 44
2.2. VACUUM FACILITIES ........................................................................... 46
2.2.1. Missouri S&T Aerospace Plasma Lab ..........................................46
2.2.2. Digital Solid State Propulsion (DSSP) Vacuum Facility. .............46
2.3. DIAGNOSTICS ........................................................................................ 46
2.3.1. Langmuir Triple Probe. .................................................................47
2.3.2. Mass Balance. ...............................................................................48
2.3.3. Thrust Stand. .................................................................................48
2.3.4. High Speed Camera. .....................................................................49
3. RESULTS ............................................................................................................ 50
3.1. ABLATION MASS ................................................................................... 50
3.2. LANGMUIR TRIPLE PROBE ................................................................. 51
3.3. IMPULSE BIT .......................................................................................... 52
3.4. HIGH SPEED IMAGES ........................................................................... 53
4. ABLATION MASS ANALYSIS ........................................................................ 54

viii
5. CONCLUSION .................................................................................................... 56
REFERENCES ........................................................................................................ 57
SECTION
2. CONCLUSIONS ...................................................................................................... 60
VITA ............................................................................................................................ 62

ix
LIST OF ILLUSTRATIONS
Figure Page
PAPER I
2.1: CAD Model illustrating composition and operation of the ESP microthruster. ........ 10
2.2: Faraday Probe integrated into large vacuum chamber diagnostic probe arm. ........... 14
2.3: Illustration of Langmuir triple probe physical size and location relative to plume. .. 16
2.4: Electrical schematic and illustration of the triple Langmuir probe in voltage-mode. 16
3.1: Measured impulse bit for four different microthrusters............................................. 20
3.2: Ion current density as measured by the Faraday probe at multiple downstream locations on the thruster centerline. ........................................................................... 21
3.3: Peak current density contours, as measured by the Faraday probe at the locations marked with dots. ....................................................................................................... 22
3.4: Typical trace for the electron temperature and electron density of the thruster plume as measured by the triple Langmuir probe. .................................................... 23
3.5: Lifetime trends observed for peak electron temperature and peak electron density of the thruster plume as measured by the triple Langmuir probe. ............................. 24
3.6: Lifetime trends observed for time-average electron temperature and time-average electron density of the thruster plume as measured by the triple Langmuir probe. ... 25
4.1: Integrated Faraday Probe results indicating total ion charge collected in Coulombs for the a.) centerline locations and b.) off-centerline locations. ............... 29
4.2: Plume exhaust gas species comparison. .................................................................... 30
4.3: Exhaust velocity calculated using (a) time-of-flight and (b) measured impulse bit and mass bit. ......................................................................................................... 32
4.4: Equilibrium ionization as a function of temperature and pressure. ........................... 33
4.5: Exit velocity calculated assuming adiabatic expansion. ............................................ 34
PAPER II
2.1: CAD Model illustrating composition and operation of the ESP microthruster. ........ 44
2.2: Electrical schematic and illustration of the triple Langmuir probe in voltage-mode. 47
3.1: Typical thruster discharge and Langmuir triple probe current traces. ....................... 51
3.2: Effective exhaust velocity from Langmuir triple probe time-of-flight measurements. ........................................................................................................... 51
3.3: Measured impulse bit for four microthrusters. ......................................................... 52
3.4: Selected images from high speed footage. ................................................................ 53

x
LIST OF TABLES
Table Page
PAPER I
2.1: Nominal composition of the High Performance Electric Propellant tested in the microthrusters. ........................................................................................................... 11
2.2: Critical parameters for the Langmuir triple probe operating regime. ........................ 15
3.1: Average ablation mass bit data for the selected microthrusters................................. 20
3.2: Confidence intervals for peak electron temperature and density from LTP measurements. ........................................................................................................... 26
3.3: Average increases in partial pressure of each species in RGA results. ..................... 27
PAPER II
2.1: Nominal composition of the High Performance Electric Propellant. ........................ 45
3.1: Average ablation mass bit data for selected microthrusters. ..................................... 50

1. INTRODUCTION
This thesis presents work the characterization of a novel electric solid propellant
operating in a pulsed microthruster configuration. This device configuration operates
similar to a type of in-space electric propulsion device, the pulsed plasma thruster, which
typically uses Teflon® as a propellant. Primary objectives are the formation of key
observations of behavior and performance of the electric solid propellant in this
configuration and key comparisons to that of the traditional propellant. A fundamental
understanding of this novel propellant’s behavior could be used in the future to optimize
device configuration for performance, or expand the propellant’s applications.
In this thesis, two papers prepared for publication in an aerospace journal are
presented on this topic. The first paper details the characterization of the weakly ionized
exhaust plume created during a pulse of the electric solid propellant microthruster. The
second paper supplements this work with findings of propellant ablation following the
primary discharge, and the negative impact this behavior has on the efficiency of the
microthruster. The work in these papers offers great insight to the behavior and
performance of the novel propellant, and comparisons to the propellant used typically.
Preceding these papers is an introduction to the above mentioned topics, as well as the
motivation driving research on this topic.
1.1. ELECTRIC SOLID PROPELLANTS
Research on Electric Solid Propellants (ESPs) has emerged in recent years due to
its attractive characteristics, particularly in the field of aerospace propulsion. In basest
form, ESPs are a solid rocket propellant that is only ignited when sufficient electric
power is supplied to the material. Like in solid rocket propellants, this power initiates a
chemical reaction in the material, which releases significant stored energy stored in the
chemical bonds of the propellant constituents. Much unlike solid rocket propellants,
however, once this input power is removed (or “switched” off) the chemical reaction
halts and the propellant burn is completely extinguished. In modern ESPs, this cycle can
then be repeated until there is no longer any propellant to be ignited. Additionally, this
behavior desensitizes the propellant to accidental ignition from external sources such as

2
sparks, external shock or even direct flame. These characteristics give ESPs a large
advantage over most energetic materials in safety and handling. Work on ESPs began in
the 1990s, with the investigation of an eco-friendly air bag inflator propellant as an
alternative to those containing the toxic sodium azide. A new ammonium nitrate based
material was developed and the U.S. Air Force saw the potential for other applications of
this propellant, namely, rocket propulsion. In short time, the first solid propellants which
could be extinguished in a controlled manner, beginning with the compound “ASPEN.”
This material showed performance metrics similar to that of solid rocket propellants, but
experienced significant problems with ignition. Thus, a modern breed of electric solid
propellants was developed with higher conductivity and specific impulse. This new
energetic material, the high performance electric propellant (HIPEP), is based on the
inorganic hydroxyl-ammonium-nitrate (HAN). This ionic liquid serves as the oxidizer of
the propellant and incites the creation of nitric acid when electric power is applied,
initiating chemical breakdown. This pyroelectric behavior is fundamental to the
character of the HIPEP, which is the first known energetic material to exhibit such
behavior. Because these propellants respond so readily to electric power, they have also
garnered attention for application in the electric spacecraft propulsion field. More
specifically, these materials have been tested as propellant in the pulsed plasma thruster
device.
1.2. PULSED PLASMA THRUSTER
The pulsed plasma thruster (PPT) is an in-space electric propulsion device first
flown in 1964 aboard a Soviet spacecraft, marking the first ever application of electric
propulsion. PPT operation begins with a high-current capacitive discharge across the
exposed surface of a solid propellant, usually Teflon® (PTFE), between two electrodes.
This discharge can be initiated via a number of methods, the most common being the
short pulse of a spark plug or gap embedded in the cathode. The introduction of charge
carriers from this pulse initiates breakdown of the electric field into a plasma arc
discharge between the electrodes near the surface of the propellant. Exposure to this
high-temperature plasma causes the propellant to rapidly ablate material, supplying
plume constituents that may or may not then become ionized. This plasma is then
accelerated to high velocities by one (or a combination) of two mechanisms. The

3
temperatures in such an arc discharge are sufficiently high to provide high exhaust
velocities via thermal energy. This is referred to as the electrothermal acceleration. On
the other hand, the electromagnetic force arising from the j × B current front in the device
may also contribute to particle acceleration, leading greatly increased exhaust velocity.
The ESPs mentioned above have all been tested as propellant in a PPT, instead of
PTFE, and have shown comparable performance marks (e.g. thrust, specific impulse).
However, at this time it is unclear how key differences in the propellant makeup affect
the current performance of ESPs in a propellant, or the potential applications for these
propellants. For instance, PTFE is a solid synthetic polymer (fluorocarbon) material,
where HIPEP (an ESP) is a soft solid mixture of an inorganic ionic liquid (HAN) and a
similar synthetic polymer, polyvinyl alcohol. PTFE seals out atmospheric moisture
extremely well, while HIPEP is very hygroscopic. The ESP is also quite conductive, but
PTFE is an excellent electrical insulator.
1.3. OBJECTIVES
Because ESP materials are new to the electric propulsion research field, it is
desired that a clear comparison is drawn between these materials and the current state-of-
the-art propellants. In the case of the PPT, the behavior of the ESP material should be
compared to that of PTFE. Thus, the primary objectives of this work are to first describe
the operation of a PPT-like device using an ESP in as much detail as possible, then
discuss the observed similarities or differences in this operation to that of traditional
PPTs using PTFE as propellant. The first paper presented in this thesis focuses on the
experimental characterization of the ESP device. The key parameters of the plume
created by this device like the electron temperature and density, ionization fraction, and
effective velocity are examined. Further, the propellant mass ablated by the device per
shot and the composition of this mass (i.e. the plume) are investigated. These properties
are then compared to those previously measured in PTFE PPT research, which has been
extensively detailed in the literature. The second paper focuses specifically on the
ablation process of the ESP material. Measurements of the ablation mass and measured
impulse per pulse are compared to those of exhaust velocity. High speed photography is
also introduced to provide qualitative observations of this propellant ablation. Again, the
findings in the work of the second paper are compared to those of traditional PPTs.

4
PAPER
I. PLUME CHARACTERIZATION OF ELECTRIC SOLID PROPELLANT PULSED MICROTHRUSTERS
Matthew S. Glascock and Joshua L. Rovey,
Missouri University of Science and Technology, Rolla, Missouri, 65409
and
Shae Williams and Jason Thrasher,
Digital Solid State Propulsion, Reno, Nevada, 89511
ABSTRACT
Electric solid propellants are an attractive option for propulsion because they are
ignited only by an applied electric current. This leads to capabilities such as on-demand
throttling and re-ignition in chemical combustion operation, and lends itself to application
in electric propulsion. In this work, the plasma plume created by electric solid propellant
pulsed microthrusters is investigated using a nude Faraday probe, a triple Langmuir
probe, and residual gas analysis. The thrusters were tested at a vacuum level of 2×10⁻⁵
Torr. Results indicate an average plume electron temperature of 1.7 eV and a density of
1011 to 1014 cm-3. Time-of-flight analysis indicates an exhaust velocity of 1500-1650 m/s
on centerline. Additionally, ionization fraction is estimated to be 0.3% for an ablation
mass bit of 215 µg on average. Thermal equilibrium and adiabatic expansion
calculations suggest a non-equilibrium gas with high-temperature electrons and lower
temperature neutral and ion species. Results indicate the pulsed microthruster operates
similar to a coaxial pulsed plasma thruster, and is dominated by electrothermal effects.

5
NOMENCLATURE
An = probe collection area of probe n; n = 1, 2, 3
h = Planck constant
In = current flow in probe n
Ip = probe current
j = current density
k = Boltzmann constant
MW = molecular weight
me = electron mass
mi = mass of ion species i
ne = electron number density
Pn = probe label
p = pressure
Qi = ion charge
QintZ, Z+ = internal partition function
ℜ = universal gas constant
T = temperature
Tc = chamber temperature
Te = electron and exhaust temperature
td = time duration of microthruster discharge pulse
Vd2 = voltage difference between probe 1 and probe 2
Vd3 = bias voltage between probe 1 and probe 3
rp = probe tip radius
s = probe tip separation distance
λD = Debye length
ds = plasma sheath diameter
λie = charged particle collision mean-free path
Vex, ue = exhaust velocity
Vf = floating potential, with respect to ground
Vn = voltage of probe n, with respect to space potential

6
Vp = space potential
γ = ratio of specific heats
φ = ionization fraction
θi = ionization potential

7
1. INTRODUCTION
Electric solid propellants (ESP’s) are an emerging topic of research with major
implications in the field of propulsion from the micro to macro scale [1-3]. These
propellants offer exciting capabilities for controlling solid chemical rocket motors
previously unheard of for typical energetic materials. When electric power at the proper
current and voltage levels is applied to an ESP, the solid propellant ignites and continues
to exothermically decompose until that power is removed. This process can be repeated
until the solid propellant is entirely consumed. Further, the burn rate of the propellant
can be throttled by altering the electrical power applied. This method of operation is not
possible with traditional solid rocket propellants and energetics, and greatly expands the
potential applications for solid rocket motors that are fit with an ESP. Additionally, ESPs
are insensitive to accidental ignition by spark, impact or even open flame. This is a huge
advantage over most energetics in safety considerations and ease of use.
The development of ESPs began in the mid-late 90’s with the investigation of a
“green” automobile air bag inflator propellant (ABIP). This ammonium nitrate based
material quickly garnered attention from the U.S. Air Force for other applications,
including a patented formulation [4] for rocket propulsion application. Soon after, the
first controlled extinguishable solid propellants were developed, the first of which was
referred to as “ASPEN.” This development process began adding ingredients to the
ammonium nitrate based propellant to lower the melting point and increase the electrical
conductivity during chemical combustion. Performance metrics of the ASPEN propellant
were comparable to typical marks for solid rocket motors, but experienced major
problems with initial ignition. Addressing these problems led to the development of a
more advanced formula to achieve higher specific impulse and conductivity of the
propellant. This higher performance electric propellant (HIPEP) is a hydroxyl
ammonium nitrate (HAN) based energetic material. In this formulation, the ionic liquid
oxidizer HAN exhibits a pyroelectric behavior; the application of electric power to this
material incites the creation of nitric acid, triggering ignition of the formulation. This
behavior has been previously observed in organic materials, but none of which are known
to be energetic.

8
Electric solid propellants have also been tested for application in electric
propulsion. All of the aforementioned ESP’s have been tested as alternative
fuel/propellant for the ablation fed pulsed plasma thruster and have shown performance
marks comparable to that of the traditional Teflon propellant [3]. The Pulsed Plasma
Thruster [5, 6] (PPT) is a type of in-space electric propulsion system first flown in
November of 1964 aboard the Soviet spacecraft Zond 2, marking the first application of
electric propulsion on a spacecraft. Modern PPT’s are primarily used for stationkeeping
needs [7-9], attitude control [10-12], and other secondary propulsion system duties [13].
These thrusters have received considerable attention in the propulsion community due to
the relative simplicity of the supporting technology and their ability to reliably generate
small impulse bits.
Operation of the ablation-fed PPT begins with a high-current discharge between
electrodes across the exposed surface of a solid propellant, typically Teflon® (PTFE).
Burton and Turchi [5] illustrate two distinct operating modes for this discharge: the
ablation arc or the propagating mode. Typically the mode is influenced by whether the
PPT is in a breech-fed or a side-fed [14] configuration. Breech-fed PPT’s, such as the
LES-6 typically do not exhibit mass ablation rates great enough to sustain a stable arc at
the surface of the propellant, thus the current distribution propagates downstream,
reducing the ablation rate [15]. In side-fed devices, the heat transfer from the arc
discharge to the propellant is sufficient to provide new particles at a rate to sustain the arc
near the propellant surface. In addition to these arc operating modes, PPT’s are typically
classified by geometry into rectangular and coaxial configurations. The LES 8/9 and the
University of Illinois PPT-3/PPT-4 designs are examples of a rectangular and coaxial
PPT configuration, respectively. Additionally, the LES 8/9 is a breech-fed device [9] that
exhibits a propagating discharge mode of operation, while the PPT-3/PPT-4 device is a
side-fed PPT with an ablation arc operation [5, 16]. These two designs are also examples
of the differing acceleration mechanisms often observed in PPT operation. The LES 8/9
has a plume that is ionized by the main discharge (~10% ionization fraction) and
accelerated by the electromagnetic force arising from the 𝑗 × 𝐵 current front that
propagates along with the ablated mass [17]. These high-energy, high-velocity particles
contribute 15% (or more) of the kinetic energy of the exhaust gas despite the much lower

9
mass compared to the rest of the plume, which remains neutral. On the other hand, in the
PPT-3/PPT-4 device the acceleration of the ablated mass is dominated by electrothermal
effects [16]. The temperature arising from the arc discharge is sufficiently high to
provide exhaust velocities comparable to or even exceeding that of chemical thrusters.
These temperatures are typically limited by radiation and other dissipative processes to a
few eV, but the high temperature neutrals provide nearly the entirety of the kinetic energy
in the exhaust [18]. Additionally, both thrusters (and most PPTs in general) have shown
evidence of lost mass after the completion of the discharge pulse in the form of low
velocity neutrals and even macroparticles that contribute little to nothing by way of
performance, though the mass fraction of this “late-time ablation” is not well
characterized [19].
This paper focuses on the exhaust plume of a PPT operating with an electric solid
propellant. Results from ion current density, electron temperature, and time-averaged
plume species composition are coupled with thermodynamic equilibrium calculations and
adiabatic expansion to show that the PPT operates in an electrothermal mode.
Additionally impulse bit measurements are presented from thrust stand testing. The
experimental apparatus is described in Section 2, and the Results and Analysis are given
in Section 3 and 4, respectively. Conclusions from the work are described in Section 5.

10
2. EXPERIMENTAL APPARATUS
The PPT microthrusters are described, along with the ESP and power processing
unit. Then the facilities in which the microthrusters are operated are described, followed
by the diagnostics used to characterize the plume.
2.1. MICROTHRUSTERS AND POWER PROCESSING UNIT
The microthrusters used in this work are an initial configuration, and a main goal
of this work is to help guide design of a higher performance variant. The microthrusters
have a coaxial geometry as shown in Figure 2.1. The outer electrode is a 3.2 mm
diameter aluminum tube and the concentric inner electrode is a 1.2 mm diameter
molybdenum rod. The total length of the microthruster is about 2.5 cm, with the
propellant grain measuring roughly half of that length. The molybdenum inner electrode
is also coated with polymer insulation (shellac) with a nominal thickness of 0.03 mm.
The ESP has an annular shape and fills the space between the inner and outer electrodes.
By applying a relatively low voltage discharge from a capacitor bank (300 V) for a short
duration pulse (about 0.5 ms) a small mass of the ESP is ablated and expelled from the
thruster. Performance testing indicates that the impulse bit is 200-500 μN-s per pulse,
with a specific impulse estimated on the order of 200 seconds. In general, these
microthrusters have an operation lifetime of around 200 pulses.
Figure 2.1: CAD Model illustrating composition and operation of the ESP microthruster.
The ESP is a hydroxyl ammonium nitrate (HAN)-based solution solid
manufactured using benign processes and “green” ingredients, mixed in standard
chemical glassware and cured conveniently at warm room temperatures (35°C/95°F). It
Outer Electrode TubeInner Electrode Tube
Insulation
PropellantPotting Compound
Pre-Ignition Burning Post Burn
Propellant and insulation recedes after each pulse
11
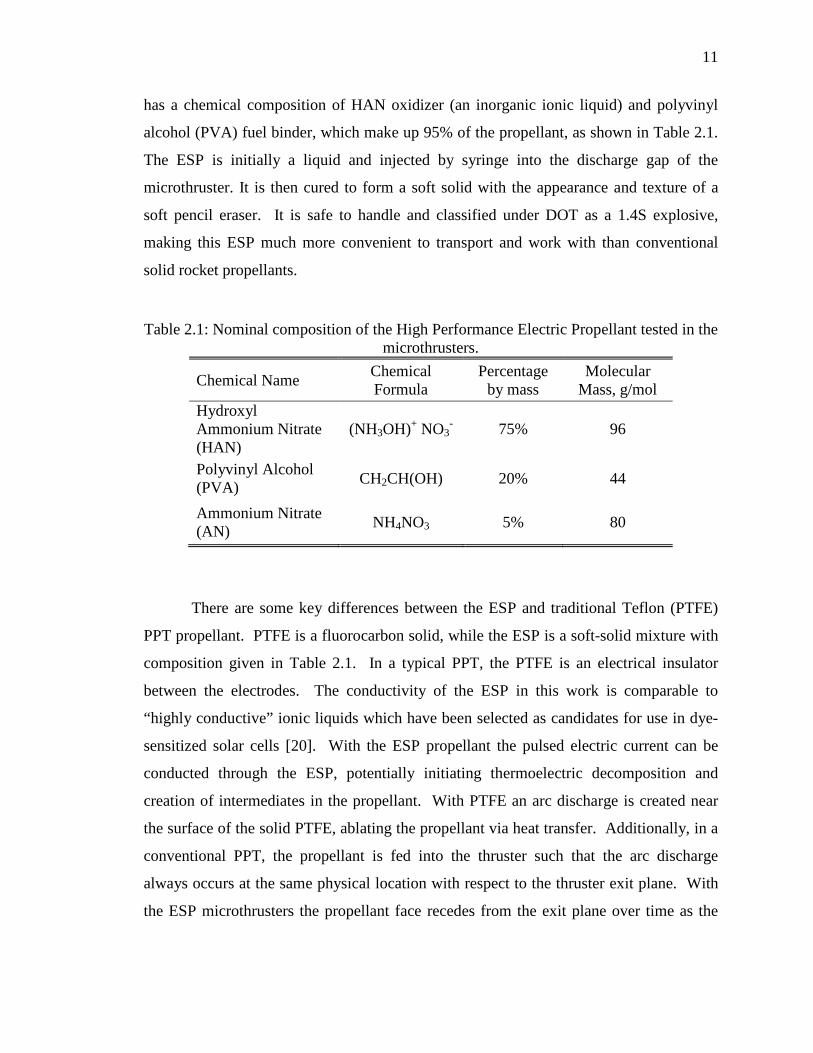
has a chemical composition of HAN oxidizer (an inorganic ionic liquid) and polyvinyl
alcohol (PVA) fuel binder, which make up 95% of the propellant, as shown in Table 2.1.
The ESP is initially a liquid and injected by syringe into the discharge gap of the
microthruster. It is then cured to form a soft solid with the appearance and texture of a
soft pencil eraser. It is safe to handle and classified under DOT as a 1.4S explosive,
making this ESP much more convenient to transport and work with than conventional
solid rocket propellants.
Table 2.1: Nominal composition of the High Performance Electric Propellant tested in the microthrusters.
Chemical Name Chemical Formula
Percentage by mass
Molecular Mass, g/mol
Hydroxyl Ammonium Nitrate (HAN)
(NH3OH)+ NO3- 75% 96
Polyvinyl Alcohol (PVA) CH2CH(OH) 20% 44
Ammonium Nitrate (AN) NH4NO3 5% 80
There are some key differences between the ESP and traditional Teflon (PTFE)
PPT propellant. PTFE is a fluorocarbon solid, while the ESP is a soft-solid mixture with
composition given in Table 2.1. In a typical PPT, the PTFE is an electrical insulator
between the electrodes. The conductivity of the ESP in this work is comparable to
“highly conductive” ionic liquids which have been selected as candidates for use in dye-
sensitized solar cells [20]. With the ESP propellant the pulsed electric current can be
conducted through the ESP, potentially initiating thermoelectric decomposition and
creation of intermediates in the propellant. With PTFE an arc discharge is created near
the surface of the solid PTFE, ablating the propellant via heat transfer. Additionally, in a
conventional PPT, the propellant is fed into the thruster such that the arc discharge
always occurs at the same physical location with respect to the thruster exit plane. With
the ESP microthrusters the propellant face recedes from the exit plane over time as the

12
propellant is burned away. It is currently unclear how these propellant differences affect
the operation and performance of a PPT using the ESP as a propellant.
The power processing unit (PPU) used to operate the microthrusters is a custom
in-house pulsed power supply. This PPU is primarily a bank of capacitors with a nominal
rating of 900 μF. This bank is charged to 300 V with a small input power (5 V at < 1A).
Once charged, the stored energy (about 40 J) is then rapidly discharged directly into the
thruster electrodes, an event which typically lasts about 500 μs. This mode of operation
was chosen as it was shown to increase the total impulse delivered over the thruster
lifetime. Additionally, the voltage level of 300 V was chosen to keep the impulse bit per
pulse around 500 μN-s. This PPU is vacuum-compatible and is mounted a few inches
from the thruster during testing; the PPU is then remotely controlled via serial
communication.
2.2. VACUUM FACILITIES
2.2.1. Missouri S&T Aerospace Plasma Lab. The microthrusters were tested in
the large (1.8 m dia., 3 m lg.) space and high altitude vacuum facility at the Aerospace
Plasma Laboratory of Missouri S&T. This facility uses four 89 cm diameter oil vapor
diffusion pumps backed by an Edwards EH 4200 roots-blower pump and a Tokunda KP-
7500BG rotary-vane pump. Standard operation for this work was two oil vapor diffusion
pumps active which gives the facility a nominal base pressure of 2×10⁻⁵ Torr. The
interior of the facility is equipped with a two-axis translation table system with a
minimum step size of 2.6 μm that is controllable remotely to allow for the measurements
made at varying locations.
2.2.2. Digital Solid State Propulsion (DSSP) Vacuum Facility. Microthrusters
were also tested in the large vacuum facility at DSSP. This facility uses a single Varian
VHS-250 oil vapor diffusion pump and an Alcatel ADS501 model rotary-vane, roots-
blower pump combination for roughing of the chamber. Standard operation for this work
was with the oil vapor diffusion pump active, yielding a nominal base pressure of 5×10⁻⁴
Torr. The interior of the facility is equipped with an optical table for mounting of
hardware and diagnostics.

13
2.3. DIAGNOSTICS
Characterization of the plasma plume created during a pulse is generally the first
step of analyzing a PPT system, and the primary focus of this work. Plume velocity
distribution, plasma density and temperature, and current density are useful in analyzing
performance of a PPT. Plasma plume characterization of the microthruster has been
conducted at Missouri S&T and DSSP. A number of prevalent PPT plume diagnostics
were prepared and used for the analysis of the microthruster. Faraday probe
measurements for bulk plasma current [21, 22] and a Langmuir triple probe [23-26] to
determine plasma densities and temperatures were employed as plasma diagnostic tools.
Additionally, a residual gas analyzer [27] and mass balance were used to investigate the
composition of the plume and the ablated mass per pulse. Finally, a thrust stand was used
to measure the impulse bit of microthrusters.
2.3.1. Faraday Probe. The nude Faraday Probe (FP) is used to measure the ion
current density in the plume of an electric propulsion device, be it an electrostatic device
such as a Hall Effect thruster, or a pulsed device such as the PPT. The nude Faraday
probe has a sensitivity to vacuum facility effects and elevated backpressures. Walker et
al. [22] reported maxima of -20% and +20% difference in FP current density
measurements at angles of 20° and 60° off-centerline between measurements made at
1.2×10⁻⁵ and 4.2×10⁻⁶ Torr. On centerline, this value is less than 10%. In this work, the
nominal base pressure is on the order of 10-5 Torr, indicating the error due to this effect is
about 10% of the peak measured current density, found on centerline. Due to the low
measured ablation mass, it is expected that the local pressure at the face of the probe will
not exceed this order of 10-5 Torr. As signal noise was less than 1% peak value, this
backpressure sensitivity is the dominant source of error in these measurements. Thus, the
overall uncertainty in FP measurements is taken to be 10%. The Faraday probe used in
this work is shown in Figure 2.2.
The probe and guard ring are biased to a negative voltage (in this work, -30 V
relative to ground) to repel stray electrons and encourage the collection of ions. The
center collector is then connected to a measurement circuit similar to that of a traditional
planar Langmuir probe. Monitoring the current draw through the collector of the Faraday
probe provides the ion current density of the plume.

14
Figure 2.2: Faraday Probe integrated into large vacuum chamber diagnostic probe arm.
The collector is 2.54 cm (1”) in diameter, giving it a circular (planar) collection
area of about 5 cm2. Because the size of this probe is quite large relative to the
microthruster and the estimated size of the plasma plume created, it is assumed that the
probe will collect a large majority of the ions present in the plume when positioned near
(~5 cm) the thruster exhaust and aligned with the axis of the microthruster. The Faraday
probe was positioned on R-Z translation stages in the vacuum test facility, allowing it to
make measurements of the ion current density at selected axial and radial locations.
2.3.2. Langmuir Triple Probe. The Langmuir Triple Probe (LTP) is used to
measure electron density and electron temperature without requiring a voltage sweep.
This makes the LTP well suited to operation in pulsed environments, and a common
diagnostic for the pulsed plasma thruster [25, 26]. Tungsten wire of 0.5 mm diameter
was inserted into three bores of a quad-bore alumina tube of 10 mm diameter, creating
the three isolated probe tips of 5.0 mm in length, separated by 1.5 mm. The remaining
bore is plugged with a ceramic adhesive. On the other end of the probe, the tungsten
wires connect to individual standard RF cables inside a grounded enclosure.
For cylindrical geometry Langmuir probes, there are five base assumptions in the
probe theory to consider. The first two concern electrical properties: (1) the measured
probe currents are small relative to the discharge current and (2) the electrons in the
plasma are governed by a Maxwellian energy distribution. The first criterion is readily
met as the probe current, I3 has peak values of a few Amps at most, compared to the
discharge current peak of >1000 A. Electron-electron collision timescale for plasma with
density 1012 cm-3 and temperature 1.7 eV is on the order of 10-8 s, while the thruster
15
discharge lasts about 5×10⁻⁴ s. This implies that the number of electron collisions during
a pulse is sufficient to create an equilibrium Maxwellian distribution. The final three
assumptions of Langmuir probe theory concern the physical size of the probe.
Specifically, (1) the probe radius (rp) must be much greater in size than the characteristic
shielding (Debye) length of the plasma, λD, (2) probe separation distance (s) must be
much larger than the Debye sheath (a positively charged plasma layer several Debye
lengths thick) diameter, ds, (3) the ratio of the mean-free path, λie, to the probe radius (i.e.
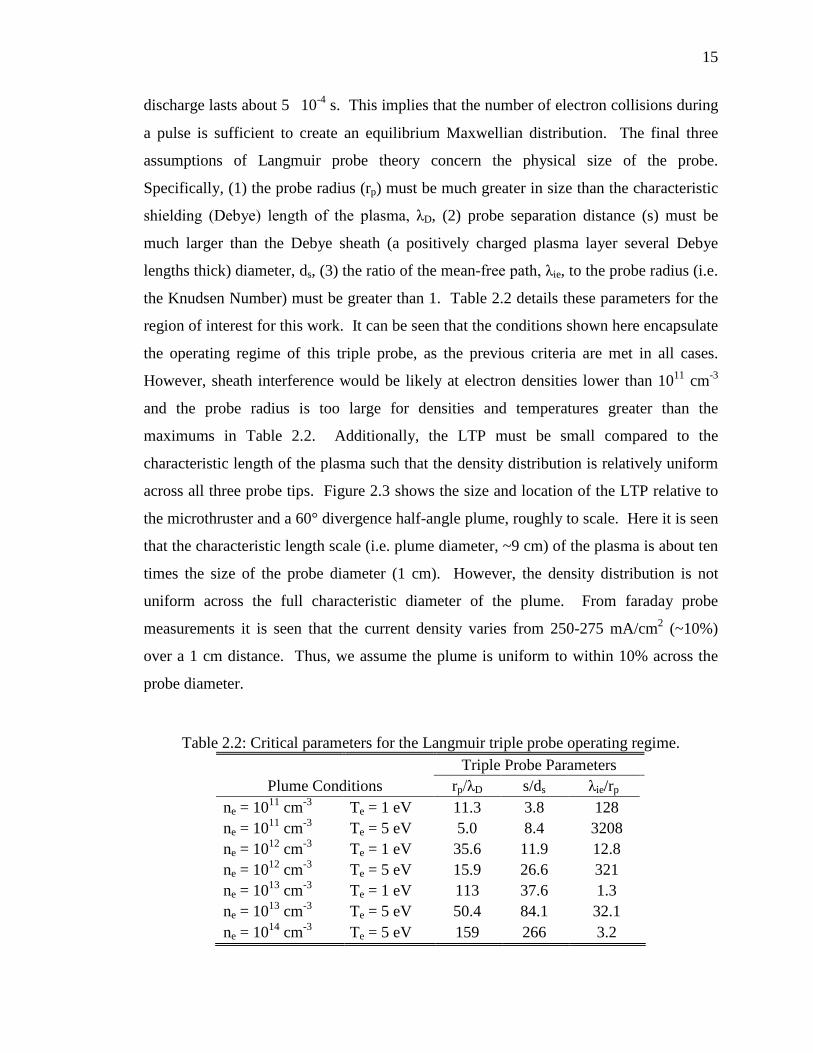
the Knudsen Number) must be greater than 1. Table 2.2 details these parameters for the
region of interest for this work. It can be seen that the conditions shown here encapsulate
the operating regime of this triple probe, as the previous criteria are met in all cases.
However, sheath interference would be likely at electron densities lower than 1011 cm-3
and the probe radius is too large for densities and temperatures greater than the
maximums in Table 2.2. Additionally, the LTP must be small compared to the
characteristic length of the plasma such that the density distribution is relatively uniform
across all three probe tips. Figure 2.3 shows the size and location of the LTP relative to
the microthruster and a 60° divergence half-angle plume, roughly to scale. Here it is seen
that the characteristic length scale (i.e. plume diameter, ~9 cm) of the plasma is about ten
times the size of the probe diameter (1 cm). However, the density distribution is not
uniform across the full characteristic diameter of the plume. From faraday probe
measurements it is seen that the current density varies from 250-275 mA/cm2 (~10%)
over a 1 cm distance. Thus, we assume the plume is uniform to within 10% across the
probe diameter.
Table 2.2: Critical parameters for the Langmuir triple probe operating regime. Triple Probe Parameters
Plume Conditions rp/λD s/ds λie/rp ne = 1011 cm-3 Te = 1 eV 11.3 3.8 128 ne = 1011 cm-3 Te = 5 eV 5.0 8.4 3208 ne = 1012 cm-3 Te = 1 eV 35.6 11.9 12.8 ne = 1012 cm-3 Te = 5 eV 15.9 26.6 321 ne = 1013 cm-3 Te = 1 eV 113 37.6 1.3 ne = 1013 cm-3 Te = 5 eV 50.4 84.1 32.1 ne = 1014 cm-3 Te = 5 eV 159 266 3.2

16
In this work, the triple probe was operated in what is referred to as “voltage-
mode,” wherein (as in Figure 2.4) three identical probes are inserted into the plasma. All
three probes are floating with respect to ground (Vf), and a bias voltage difference, Vd3, is
applied externally to two of the probes via a battery. In this work, Vd3 was selected as a
nominal 27 V, supplied via three 9V batteries in series.
Figure 2.3: Illustration of Langmuir triple probe physical size and location relative to
plume.
Figure 2.4: Electrical schematic and illustration of the triple Langmuir probe in voltage-
mode.
During a pulse, the voltage difference Vd2 is measured via a differential voltage
probe and the probe current, I3, is measured via a current monitor. The high voltage
differential probe is less susceptible to signal noise than digitally subtracting signals on
an oscilloscope, or a differential operational amplifier [25, 26]. However, the high
Microthruster10 mm
Ø 0.5 mm
5 cm60°
LTP
PlasmaP2 P1 P3
Vd2 Vd3
I3
P2 P1 P3
Vp
Vf
V3
Vd2
V2
Vd3
V1

17
impedance of the differential probe limits the probe measurement circuit rise time to a
minimum of 70 ns. This rise time is negligible compared to the plasma timescale, which
is greater than 100 µs. These measurements are displayed as a function of time during
testing on a 4-channel oscilloscope. Through the Langmuir Triple Probe theory from
Chen and Sekiguchi [23, 24], outlined below, these measurements Vd2(t) and I3(t) can be
used to directly calculate the plasma electron temperature, Te(t), and the plasma density,
ne(t) via equations (1) and (2) below.
1 − exp �−𝑉𝑑2𝑇𝑒�
1 − exp �−𝑉𝑑3𝑇𝑒�
=12
(1)
𝑛𝑒 =𝑚𝑖
12 � 𝐼3𝐴3
�1.05 × 10⁹
(𝑇𝑒)12 �exp �𝑉𝑑2𝑇𝑒
� − 1� (2)
In Eqn. 1 and 2, Te is the electron temperature of the plasma in eV, mi is the
plume mixture mass number, I3 the measured probe current in μA, A3 the individual
probe collection area in mm2 and ne is the plasma density measured in cm-3. In the
equations above, the applied voltage difference Vd3 is assumed constant during each
pulse; testing found that the current draw on the batteries supplying this voltage was
negligible and thus a valid assumption. Additionally, the density equation requires a
plasma species mass. In this work, the results from a residual gas analysis were used to
estimate the plume mixture molecular mass.
2.3.3. Residual Gas Analyzer and Mass Balance. Plume species composition is
estimated from measurements using a residual gas analyzer. The residual gas analyzer
used for this work was an Extorr XT100 model, which is a quadrupole RGA with
included Pirani gauge and hot cathode ion gauge. This model’s resolution is adjustable
based on the selected mass range (max width 1-100 amu), but is greater than 0.5 amu at
10% peak height; the sensitivity is 5×10⁻⁴ A/Torr into the detector and the device has a
minimum detectable partial pressure of 10-11 Torr. The thruster mass before and after

18
testing is measured using a mass balance. The mass balance has a resolution of 1 mg,
with noise on the order of that resolution.
2.3.4. Thrust Stand. The existing thrust stand previously built in-house by DSSP
for performance testing of the microthrusters was used in this work. The design is a
pendulum using spring steel as a dampening method. The microthruster is mounted to a
fixture suspended from an aluminum frame by two pieces of 2.5 cm wide spring steel to
ensure minimal cross-axis movement. During each thruster discharge, the displacement
of the fixture is measured by a laser displacement sensor with a resolution of 5 μm. This
corresponds to a resolution in thrust measurement of about 1 mN for typical pendulum
fixture mass. The maximum expected uncertainty of the thrust stand is ±10% based on
error analysis in the laser and chamber back pressure. In the current configuration, the
thrust stand can measure the impulse-per-pulse (or impulse bit, Ibit) of the microthruster
within a range of 0.025 mN-s to 5 mN-s.

19
3. RESULTS
Experimental results from the mass balance, thrust stand, Faraday probe, triple
Langmuir probe and the residual gas analyzer are presented. The mass bit, impulse bit,
plume current density, plume plasma properties, and plume species composition are
presented.
3.1. AVERAGE MASS BIT
Table 3.1 details the results of the mass balance measurements of fourteen
selected microthrusters tested during this work. These thrusters are all at (or nearly at)
the observed end-of-life. The analysis in this work focuses on the lifetime averaged
behavior of the microthrusters. Average ablated mass per pulse (the mass bit) is
calculated by subtracting the final from initial mass and dividing by the number of pulses.
Overall, the average mass bit is 215.4 μg. This result is on the order of typical values for
a PTFE PPT, which is usually between 10 and 100 μg, though it is noticeably greater.
Further, in comparing the energy specific ablation mass of these devices, we find that the
ESP microthruster (5.4 µg/J) falls right in line with PTFE PPTs (1.5-10 µg/J). However,
examination of the mass bit per ablation area shows that the ESP microthruster (~790
µg/cm2) is more than an order above that of typical PPTs, which fall in the range of 1-50
µg/cm2. This is due to the comparable discharge energy and ablation mass, but a very
small ablation area relative to PTFE PPTs [5].
3.2. IMPULSE BIT
Thrust testing was conducted at DSSP. A primary focus of this thrust testing was
to determine the impulse bit per pulse of the microthrusters. Figure 3.1 shows these
results over the pulse lifetime of four different microthrusters from various batches. The
first three (RR43A08, RR50A14 and RR51A10) were tested in the DSSP vacuum facility
equipped with the triple Langmuir probe diagnostic. The final thruster (RR50A20) was
not interrogated with the Langmuir probe. From the data shown in Figure 3.1, the
impulse bit is between 0.15-0.27 mN-s with trends that vary from thruster to thruster, as
well as pulse-to-pulse. RR50A20 has an average impulse bit of 0.257 mN-s, standard
deviation of 0.02 mN-s and increases by about 40% over its lifetime.

20
Table 3.1: Average ablation mass bit data for the selected microthrusters.
Serial no. Pulses Initial Mass (mg)
Final Mass (mg)
Average Mass Bit (µg)
OD01A09 200 639 549 450.0 OD01A12 222 647 590 256.8 OD01A13 206 642 588 262.1 OD01A14 155 636 545 587.1 OD01A17 280 643 611 114.3 OD02A06 150 637 603 226.7 OD02A10 150 625 613 80.0 RR43A08 121 641 631 82.6 RR50A14 143 658 639 132.9 RR50A20 153 661 637 156.9 RR51A03 150 661 614 313.3 RR51A06 150 642 623 126.7 RR51A10 161 641 624 105.6 RR52A10 150 665 647 120.0
Mean: 215.4
The remaining two microthrusters, RR43A08 and RR50A14 have impulse bit
averages of 0.189 and 0.199 mN-s, respectively, with relatively constant trends but wide
standard deviations (0.08 and 0.05 mN-s). The average impulse bit across the four
microthrusters was found to be 0.210 mN-s. These variations are not attributed to
measurement error, but rather to real changes in thruster performance from pulse to pulse
and thruster to thruster, the exact cause for which is not yet known.
Figure 3.1: Measured impulse bit for four different microthrusters.

21
3.3. FARADAY PROBE RESULTS
Figure 3.2 shows typical traces of the ion current density as a function of time as
measured by the nude Faraday probe at the multiple downstream locations along the
centerline of thruster OD01A09. In all time-resolved measurement figures, the zero time
location is aligned with the rising edge of the measured thruster discharge current at 1 A,
which marks the beginning of the thruster discharge. All of the peak values were
measured between 20 and 50 µs after the thruster discharge, which agrees with the time-
of-flight measurements in Section 4. The greatest ion current density is at the 5 cm
location, closest to the thruster exit, which peaks at about 273 mA/cm2. The data from
these traces are later used to calculate the total charge collected and determine the
ionization fraction of the microthruster plume.
Figure 3.2: Ion current density as measured by the Faraday probe at multiple
downstream locations on the thruster centerline.
Moving further from the thruster exit, the ion current density decreases by < 10%
(242 mA/cm2) at the 7.5 cm location, but quickly decreases further downstream to about
50% of that peak at 10 cm and then to about 35% at 15 cm. Further, the far-field ion
current measurement at 40 cm downstream is less than 5% of that peak value (~10
mA/cm2). Additional measurements were made with the Faraday Probe at radial
locations centered at 5 cm downstream and made on-centerline and 5, 10, and 15 cm off-
centerline. These results showed similar trends with the peak current density on-
centerline and decreasing by about 50% at 5 cm off-centerline and more than an order of
magnitude at 10 cm with the measurement decreasing to negligible levels at 15 cm off-

22
centerline. Marked by black dots on Figure 3.3 are the spatial locations of the Faraday
probe measurements. Overlaid on this figure are contours of the peak current density as
measured by the Faraday probe at these locations.
Figure 3.3: Peak current density contours, as measured by the Faraday probe at the
locations marked with dots.
3.4. LANGMUIR TRIPLE PROBE RESULTS
The triple Langmuir probe provides measurements of electron temperature (Te)
and density (ne) as a function of time for each pulse of a microthruster, taken at 5 cm
downstream of the thruster on centerline. Figure 3.4 below shows typical traces of Te(t)
and ne(t) typical as measured by the triple Langmuir probe for a single pulse. These
results are obtained by numerical filtering of the probe current and voltage differential
measurements and solution of equations (1) and (2). As seen in the figures, both the Te
and ne measurements peak between 20 and 25 μs after the beginning of the thruster
discharge. At this point, the electron temperature peaks at 1.2 eV and quickly recedes to
0.5 eV by 100 μs and then slowly increases again to about 75% peak value until quickly
dropping to zero at around 400 μs. This increase at ~200 µs is not fully understood. It
could be a secondary interaction of high relative energy electrons with the probe while
the colder ions are still present in the vicinity of the probe. Due to this observation, the
authors have chosen to report both the peak and time-averaged electron temperature
values. The electron density trace peaks at a maximum value of 6.9×1011 cm-3 and

23
decreases constantly for about 325 μs. At ~350 μs the electron density measurement
drops off to near-zero values.
For the probe parameters in Table 2.2, the expected accuracy of the triple probe
measurements is within ~20% for electron temperature, and 40-60% in density [28]. The
dominant source of measurement error in the triple Langmuir probe data is the significant
signal noise attributed to the high-impedance measurement of Vd2. This bit error is on the
order of ±25% of peak value (~0.3 eV) in electron temperature measurement, and about
10% peak value in density measurements. The effects of other sources of error have been
deemed negligible relative to the above values. Ion current models for the 5 ≤ rp/λD ≤
100 are optimal, with only a slight error for higher ratios [23]. Plasma sheath interaction
at the probe tips is unlikely because the tip separation distance is greater than the sheath
diameter for the region of interest. The effect of a magnetic field on the ion current
collection can be assumed negligible, as there are no applied fields, and the induced field
is of negligible strength. Similarly, ion collisions are not expected to greatly influence
the ion current measurements for the condition λie/rp > 200/(rp/λD), which is met for most
cases as shown in Table 2.2. Thus we estimate that the maximum uncertainty in electron
temperature measurements is 25% and the maximum uncertainty in the electron density
measurements is 60%. These values are typical when investigating the plumes of
magneto-plasma-dynamic thruster and PTFE PPT plumes [25, 28].
Figure 3.4: Typical trace for the electron temperature and electron density of the thruster
plume as measured by the triple Langmuir probe.

24
Also of particular interest in this work are the observable trends in the electron
temperature and density of the microthruster over its 150-200 pulse lifetime. Figure 3.5
below shows the trends of peak electron temperature and density for the lifetime of
microthruster OD02A10. Peak electron temperature varies from 2 to just below 4 eV,
with a generally decreasing trend for the first 40 pulses. Between 50-150 pulses, the peak
electron temperature is consistently between 1 and 2 eV. Additionally, peak electron
density varies from 1011 cm-3 to 1013 cm-3. However, 80% of the peak electron density
measurements lie in the 0.5×10¹² to 1.5×1012 cm-3 range, with the average ~9.2×1011 cm-
3, which is four or more orders of magnitude lower than a typical PTFE PPT [5, 25].
Figure 3.5: Lifetime trends observed for peak electron temperature and peak electron
density of the thruster plume as measured by the triple Langmuir probe.
Further, the time-averaged electron temperature, ⟨𝑇𝑒⟩, and electron density, ⟨𝑛𝑒⟩
for each pulse over the duration of the pulse is obtained from equations (3) and (4) below
for each pulse. The pulse duration (𝑡𝑑) is determined by finding the time index of the
minimum value above a tolerance (0.1 eV for Te, 105 cm-3 for ne), marking the end of the
pulse. This value is then determined as the pulse duration, as the zero time marks the
beginning of the pulse.
Figure 3.6 below shows the results of these calculations for the same
microthruster (OD02A10) as shown in Figure 3.5. Time-average electron temperature
calculations have a standard deviation of 0.7 eV, and roughly 65% of the calculations

25
falling between 0.5 and 1 eV. These results are consistent with the values and trends
observed in the peak temperature measurements, with the maximum values (2-3 eV)
occurring in early lifetime and decreasing sharply (<1 eV) from pulse 1 to 50. The time-
average electron density is similarly consistent with the average at about 1.3×1011 cm-3,
and about 85% of the measurements just greater than 1011 cm-3.
⟨𝑇𝑒⟩ =1𝑡𝑑� 𝑇𝑒(𝑡) 𝑑𝑡
𝑡𝑑
0
(3)
⟨𝑛𝑒⟩ =1𝑡𝑑� 𝑛𝑒(𝑡) 𝑑𝑡
𝑡𝑑
0
(4)
Figure 3.6: Lifetime trends observed for time-average electron temperature and time-
average electron density of the thruster plume as measured by the triple Langmuir probe.
The above results for the peak electron temperature and density were tabulated for
a number of thrusters tested and interrogated using the Langmuir triple probe. These
results are summarized in Table 3.2 in the form of the statistical 95% confidence intervals
across measurements from each pulse of all six microthrusters. Ultimately, the triple
probe indicates that the electron temperature of the microthruster plume is typically
between 1 and 2 eV, which is roughly equal to that seen in some electrothermal PTFE
PPT’s [5, 25]. The electron density measured is between 1011 to 1014 cm-3, which is quite

26
low relative to PTFE PPT’s [5, 25], and more akin to that of MPD thruster plumes.
Additionally, the variability of the electron temperature peak measurement is different
across thrusters, but overall is about 40%. The density measured varies greatly from
thruster to thruster, and thus a simple range estimate is reported here, along with the
measurements from each microthruster.
Table 3.2: Confidence intervals for peak electron temperature and density from LTP measurements.
Serial No. Pulses 95% CI Peak
Te (eV) 95% CI Peak
ne (cm-3) OD02A10 150 2.1 ± 0.2 2.3E+12 ± 1.6E+11 RR51A03 150 2.0 ± 0.5 2.3E+11 ± 1.6E+10 RR51A06 150 1.7 ± 0.1 3.4E+12 ± 1.3E+12 RR51A10 150 1.6 ± 0.1 2.4E+14 ± 1.7E+13 RR52A10 149 1.2 ± 0.4 2.8E+11 ± 2.0E+10
Overall: 1.7 ± 0.7 1011 – 1014
3.5. RGA RESULTS
Residual gas analysis of the plume estimates the gas species present in the exhaust
mixture of the microthruster. Incoming particles are ionized and exposed to a quadrupole
mass spectrometer that filters the particles by mass. Typically, an RGA system is
operated in a “mass sweep” mode, where the partial pressure of all species in the chosen
range are detected and displayed. However, this process is too slow to capture the plume
species for the ESP microthruster. Thus, a “trend” mode was employed whereby specific
mass values (8 in this case) are continuously recorded. We observed eight different mass
values corresponding to the most probable plume constituents based on the ESP
composition (HAN, PVA, AN), combustion products (N2, H2, CO2, H2O, C2) as well as
decomposition intermediates such as nitric acid (HNO3), nitrous acid (HONO),
hydroxylamine (NH2OH) and other nitrogen oxides. The RGA measures the temporal
evolution of the partial pressure for each of these mass values. Data are acquired for each
of 40 pulses of a single microthruster, 20 pulses in the early lifetime (pulses 1-20), and 20
pulses in the later lifetime (pulses 50-70). For each mass the average change in the

27
partial pressure over all 40 pulses is calculated. These values are reported in Table 3.3,
along with the possible plume species that could contribute to the measured increase in
partial pressure. A scan for partial pressure of nitric acid (HNO3, MW=63 g/mol) did not
reveal a signal from the RGA, though a number of other intermediates and exhaust
species were detected.
Table 3.3: Average increases in partial pressure of each species in RGA results. MW
(g/mol) Species Average ∆P (Torr)
2 H2 4.84E-08 12 C2 1.85E-06 18 H2O 2.70E-06 28 N2, NO 9.83E-07 32 O2, NH2OH 4.74E-07 44 CO2, PVA, NO2, HONO 2.11E-07 80 AN 1.48E-06 96 HAN 1.74E-06

28
4. ANALYSIS AND DISCUSSION
Experimental results are used to determine the total plume charge and ionization
fraction. Further results are used to determine an effective exhaust velocity of the plume.
Direct measurements of effective exhaust velocity agree well with indirect calculations
from mass bit and impulse bit measurements. A thermal equilibrium and adiabatic
expansion analysis suggest the exhaust is not in equilibrium, and that the electrons are at
much higher temperature than the colder neutral species.
4.1. PLUME CHARGE
The measured current density shown in Figure 3.2 is integrated to determine the
total charge collected at different radial and axial locations within the plume, according to
equation (5). Figure 3.2 shows the results for variations in axial and radial locations,
including 5, 7.5, 10, 15, 20, 30 and 40 cm downstream on-centerline and then 5, 10 and
15 cm radial locations for a 5cm downstream location.
𝑄𝑖 = � 𝐼𝑝(𝑡) 𝑑𝑡
𝑡𝑑
𝟎
(5)
The peak collected charge is 4.3×10⁻⁵ C at the 5 cm location, and that value
rapidly decreases with distance downstream to 50% of that peak at 10 cm, 20% at 20 cm
and more than an order of magnitude lower at the 40 cm location, where the collected
charge is calculated 4.0×10⁻⁶ C. Similarly, the results from the off-centerline testing in
Figure 4.1b shows a peak value of 4.2×10⁻⁵ C at the centerline location that decreases by
75% at 5 cm in the radial direction, more than an order of magnitude at 10 cm (1.6×10⁻⁶
C), and becomes negligible (< 0.1 𝜇C) relative to the peak at 15 cm or more off-
centerline. Results are quite consistent across the samples taken of 100-150 pulses on
three separate microthrusters, and the 95% confidence intervals are shown for these
calculations. These results indicate that the majority of the charged particles present in
the thruster plume are contained in the radial region from -10 to 10 cm. Since these
measurements were taken at a distance of 5 cm downstream of the thruster, this indicates
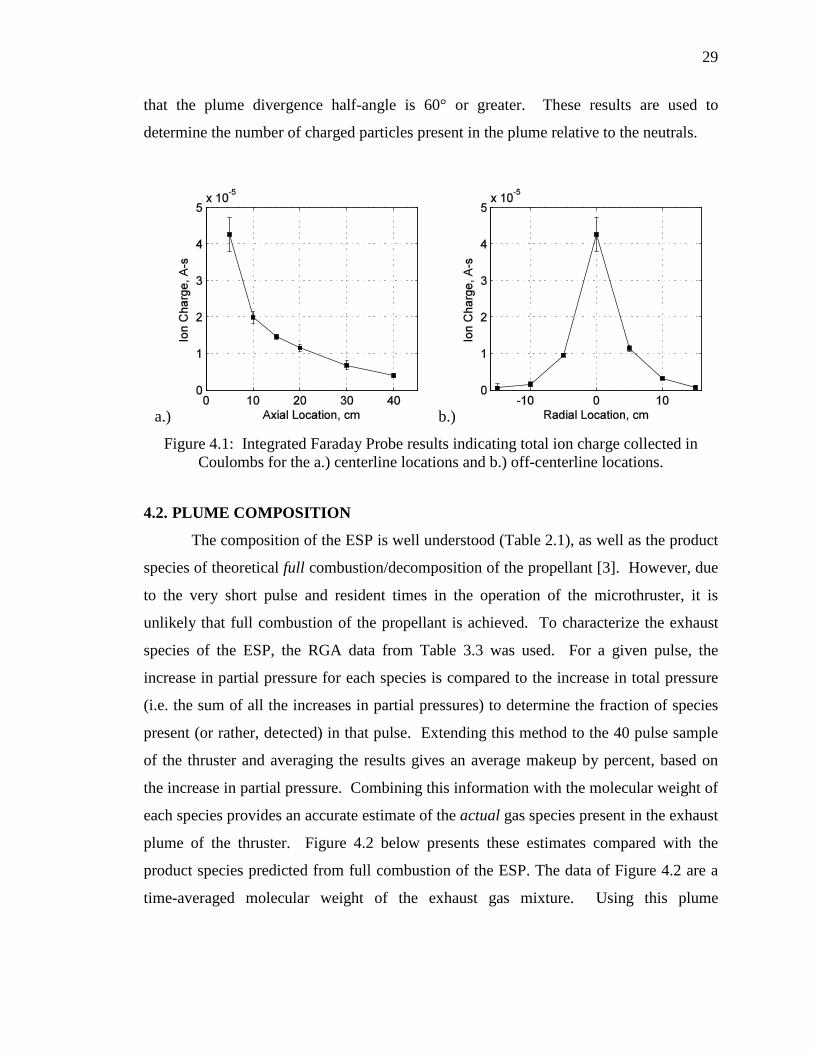
29
that the plume divergence half-angle is 60° or greater. These results are used to
determine the number of charged particles present in the plume relative to the neutrals.
a.) b.)
Figure 4.1: Integrated Faraday Probe results indicating total ion charge collected in Coulombs for the a.) centerline locations and b.) off-centerline locations.
4.2. PLUME COMPOSITION
The composition of the ESP is well understood (Table 2.1), as well as the product
species of theoretical full combustion/decomposition of the propellant [3]. However, due
to the very short pulse and resident times in the operation of the microthruster, it is
unlikely that full combustion of the propellant is achieved. To characterize the exhaust
species of the ESP, the RGA data from Table 3.3 was used. For a given pulse, the
increase in partial pressure for each species is compared to the increase in total pressure
(i.e. the sum of all the increases in partial pressures) to determine the fraction of species
present (or rather, detected) in that pulse. Extending this method to the 40 pulse sample
of the thruster and averaging the results gives an average makeup by percent, based on
the increase in partial pressure. Combining this information with the molecular weight of
each species provides an accurate estimate of the actual gas species present in the exhaust
plume of the thruster. Figure 4.2 below presents these estimates compared with the
product species predicted from full combustion of the ESP. The data of Figure 4.2 are a
time-averaged molecular weight of the exhaust gas mixture. Using this plume

30
composition, the exhaust gas mixture molecular weight is calculated to be 43 g/mol. This
is the molecular weight used in equation (2) for triple Langmuir probe calculations.
Figure 4.2: Plume exhaust gas species comparison.
The results from the residual gas analysis confirm the hypothesis that the
propellant does not have a sufficient residence time to undergo full decomposition. In
fact, raw propellant material (HAN, AN, perhaps PVA) are detected in the exhaust gas, in
addition to combustion intermediates and products. The presence of materials from each
of these stages suggests that the plume is in a “frozen flow” state, which could contribute
to propellant use inefficiency in the current configuration. Detection of raw propellant
material also suggests that the ESP material may suffer from particulate generation
during a pulse (or following one). Particulate emission at low velocity has been observed
in PTFE PPTs, and has been identified as one of the dominant sources of propellant
utilization inefficiency [19].
4.3. PLUME IONIZATION FRACTION
Plume ionization fraction is estimated using the total charge calculations and
plume composition calculations. The ionization fraction is calculated by dividing the
total number of emitted charged particles by the total number of emitted particles during
a single pulse. Total collected charge was calculated and presented for various locations
in Figure 3.2. We assume the plume to be axially symmetric, in which case the data of
Figure 3.2b can be integrated over a hemisphere of the plume to yield the total charge
emitted from the thruster. We assume all emitted charged particles are singly ionized

31
since the measured electron temperature is on the order of 1-2 eV, and the ionization
potential for plume species are on the order of 13-15 eV, it is unlikely that a significant
multiply-charged ion population exists. With these assumptions the total number of
charge carriers is estimated to be on the order of 1014 emitted charged particles per pulse.
Number of total emitted particles is determined using the measured average mass bit
(Table 3.1), the measured plume composition (Figure 4.2), and the known molecular
weight of each plume species. On average this results in 3x10¹⁶ total emitted particles per
pulse. The results indicate an ionization fraction of 0.31% ± 0.03%. The ionization
fraction is much lower than is typically measured in the plume of a PTFE PPT, which is
typically 10 – 20% [5]. This lower ionization fraction is likely due to the lower electron
temperature (1-2 eV vs. 4-5 eV) and voltage of electric discharge (300 V vs. 1-2 kV),
resulting in less ionization of the exhaust gas.
4.4. EFFECTIVE EXHAUST VELOCITY
Effective exhaust velocity was determined two different ways showing good
agreement and lending confidence to the results. It was calculated from time-of-flight
measurements and it was calculated from measured mass bit and impulse bit results. The
triple probe results were used to calculate the time-of-flight of the plume exhaust from
the thruster exit to the probe. The distance of travel is known (5 cm), and we define the
time-of-flight to be the time between when the discharge current measurement becomes
positive (time zero) and the time of peak current measured by the triple probe (~20 to ~60
µs). Due to an inadequate temporal resolution of the data acquisition system the accuracy
of this time of flight is ±4 µs, limiting the determination of the time-of-flight to an ~10%
uncertainty. Additionally, velocity was calculated from impulse bit and mass bit results.
The measured impulse bit (Figure 3.1) is divided by the measured average mass bit
(Table 3.1) for the respective thruster. Results of these calculations are shown in Figure
4.3. Time-of-flight results indicate an average exhaust velocity over all pulses of about
1500 m/s, while the impulse bit and mass bit calculations suggest a 10% higher exhaust
velocity of about 1650 m/s. The calculations shown in Figure 4.3a have a combined
standard deviation of about 576 m/s, which is dominated by microthruster RR43A08.
The high shot-to-shot variation of the time-of-flight calculated velocity is likely due to
the intrinsic shot-to-shot variations of the microthrusters, as seen in the previous results.

32
It may also be affected by the large observed plume divergence half angle, leading to a
less uniform axial velocity. The impulse bit and mass bit velocity calculations do not
exhibit as much shot-to-shot variation because the average mass bit is used in the
calculation, the actual mass bit for a given shot is unknown. The calculated velocities of
Figure 4.3 are on the order of typical mass-averaged PPT plume velocities (3-5 km/s), but
much slower than typical ion/charged particle velocities observed in PTFE PPT’s, which
are 10-50 km/s [5, 29, 30].
a.) b.)
Figure 4.3: Exhaust velocity calculated using (a) time-of-flight and (b) measured impulse bit and mass bit.
4.5. NON-THERMAL EQUILIBRIUM EXHAUST
Thermal equilibrium and adiabatic expansion calculations are presented and
results suggest a non-thermal equilibrium exhaust gas, possibly a two temperature
exhaust. Ionization at thermal equilibrium is governed by the Saha Equation, equation
(6). The microthruster exhaust is composed of multiple species with different ionization
potential, θi. These exhaust species have ionization potential ranging from 13-15 eV, and
we assume the ionization potential is 13 eV for this analysis. The ionization fraction does
not vary substantially within this range. We also assume the internal partition functions
do not change between the neutral and ionized species. Using the Saha equation the
ionization fraction as a function of temperature and pressure is calculated and shown in
Figure 4.4.

33
The microthruster exhaust gas is not in thermal equilibrium. Experiments
measured a plume electron temperature of 1-2 eV (10,000-20,000 K). If the gas were in
thermal equilibrium at 1-2 eV, then an ionization fraction of 0.01 – 0.2 (1-20%) is
expected. Measurements indicate an ionization fraction an order of magnitude lower at
0.003 (0.3%). The measured level of ionization of 0.003 suggests a thermal equilibrium
temperature of 5500 – 8000 K; however, additional results suggest the actual exhaust gas
temperature is much lower.
( )32 2 5 intint2
2 2intint
221 exp1
Z
e iZ
Qm kTp h Q T
π θφφ
+
Π = − − Π (6)
Figure 4.4: Equilibrium ionization as a function of temperature and pressure.
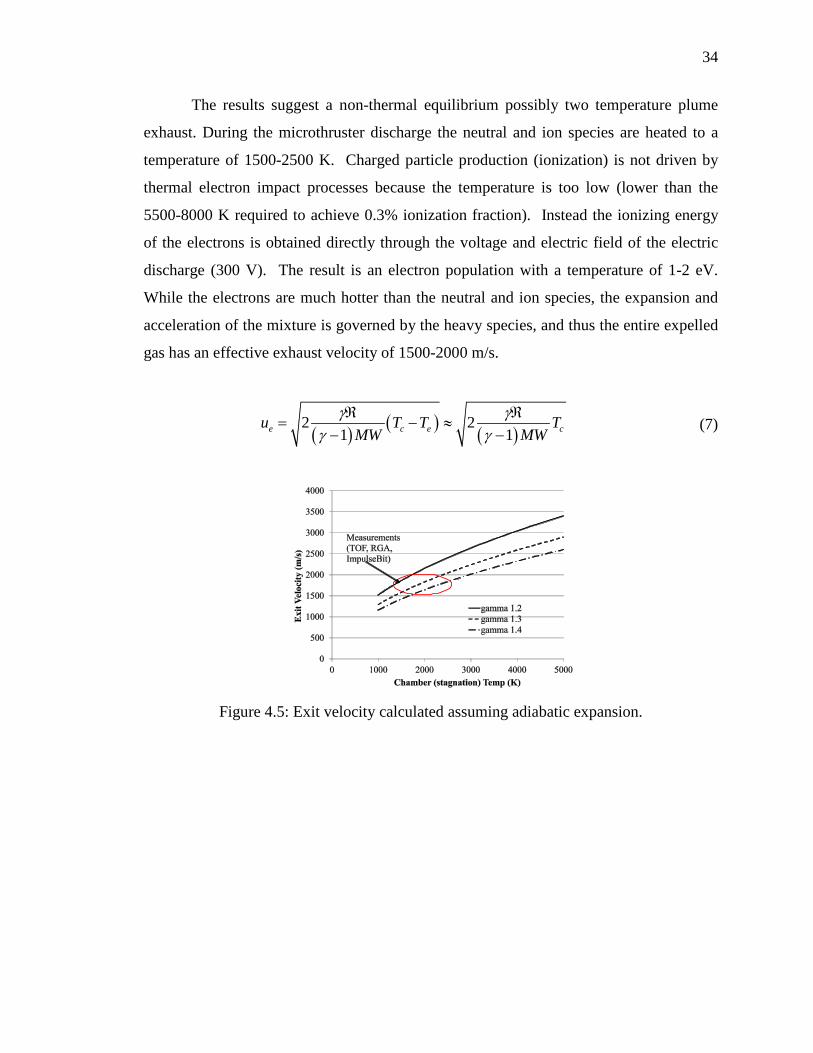
Conservation of energy requires the exhaust velocity of the gas to be equal to the
difference in the total and static enthalpy according to equation (7), assuming there is no
contribution from chemical reactions in the propellant. Given the indication of frozen
flow in residual gas analysis results, we believe this is a valid assumption. The molecular
weight of the exhaust mixture is assumed to be 43 g/mol based on the RGA
measurements. Further we assume the exhaust temperature of the gas is much lower than
the internal chamber temperature (𝑇𝑒 ≪ 𝑇𝑐). The predicted exhaust velocity as a function
of specific heat ratio and chamber temperature is given in Figure 4.5. Based on the
calculated exhaust velocity (from both time-of-flight and impulse bit/mass bit) the
temperature of the gas inside the thruster is 1500-2500 K.
34
The results suggest a non-thermal equilibrium possibly two temperature plume
exhaust. During the microthruster discharge the neutral and ion species are heated to a
temperature of 1500-2500 K. Charged particle production (ionization) is not driven by
thermal electron impact processes because the temperature is too low (lower than the
5500-8000 K required to achieve 0.3% ionization fraction). Instead the ionizing energy
of the electrons is obtained directly through the voltage and electric field of the electric
discharge (300 V). The result is an electron population with a temperature of 1-2 eV.
While the electrons are much hotter than the neutral and ion species, the expansion and
acceleration of the mixture is governed by the heavy species, and thus the entire expelled
gas has an effective exhaust velocity of 1500-2000 m/s.
( ) ( ) ( )2 2
1 1e c e cu T T TMW MW
γ γγ γ
ℜ ℜ= − ≈
− − (7)
Figure 4.5: Exit velocity calculated assuming adiabatic expansion.

35
5. CONCLUSION
This experimental characterization of the plasma plume of a solid electric
propellant microthruster was conducted with the goal of understanding the physics of the
novel electric solid propellant, HIPEP, and the performance of the microthruster as a
pulsed plasma thruster device. The diagnostics employed included a nude Faraday probe,
a triple Langmuir probe and a residual gas analyzer. Centerline ion current density
measurements were made at 5, 7.5, 10, 15, 20, 30 and 40 cm downstream location, and 5,
10 and 15 cm off-centerline in two directions. The peak ion current density measured
was about 273 mA/cm2, observed at a location on the centerline of the thruster at 5 cm
downstream. Electron temperature and density measurements were also made using a
triple Langmuir probe on centerline at 5 cm downstream. Overall, measurements of peak
electron temperature were about 1.7 eV and peak electron density between 1011 and 1014
cm-3. Ablation mass characterization yields an average mass bit of about 215 µg.
Extending the plasma measurements to this value yields an ionization fraction of 0.3% of
the ablation mass. Further, time-of-flight measurements, and impulse bit and mass bit
measurements, indicate a plume exhaust velocity of about 1500-1650 m/s. Analytical
calculations suggest a non-equilibrium plume gas composed of hot electrons (1-2 eV) and
colder neutral and ion species (1500-2500 K).
Experimental results indicate significant variations from pulse to pulse and from
thruster to thruster. Impulse bit can vary by as much as 40% over the thruster lifetime,
and 60% from thruster to thruster. Plume temperature can vary by over 50% from
thruster to thruster, and typically decreases by a factor of 2 or more in early thruster
lifetime. Electron density does not vary considerably over pulse lifetime, but can vary by
up to 3 orders of magnitude from thruster to thruster. The exact causes of this variation
are not yet known, though two main candidates have been identified: inconsistencies in
the solgel propellant filling process and variations in the chemical makeup of large
batches of the propellant. Inconsistencies in the solgel propellant filling process (viscous
liquid injected by hand into microthruster) are perhaps the most likely as it is a variable
process. Human inconsistency could lead to slight variations in the cured propellant
between thrusters. Further, the cured propellant may not be entirely uniform in each

36
microthruster. Structural variations in the propellant such as voids, density gradients or
grain changes may exist in a given microthruster, but are unable to be visually observed.
This could lead to the observed pulse-to-pulse and thruster-to-thruster variation. On a
larger scale, variations in the chemical makeup may exist in the large batches of uncured
propellant that is then used to assemble many microthrusters. These variations are
expected to be minimal between batches as the materials and processes used are not
substantially different.
Despite the observed fluctuations of plume properties, results suggest the thruster
plume is a weakly ionized gas consisting of high temperature electrons in a low relative
temperature ions and neutrals. The acceleration mechanism is thus dominated by
electrothermal energy, a property typical of some “electrothermal” PPT’s. Thermal
inefficiency is evident in the low temperature and density plume relative to PTFE PPT
plumes despite a stored energy (40 J) in the upper regime of PPT operation. This
suggests that much of the thermal energy generated by the discharge is deposited into the
electrodes or other parts of the thruster (i.e. not the propellant). Further, the propellant
may suffer from inefficient propellant utilization mechanisms like those observed in
PTFE, as well as frozen flow losses, though additional investigation is required.
Ultimately, the HIPEP material behaves similar to PTFE, but the plume has a lower
electron temperature, electron density and ionization fraction, and a larger ablation mass
bit in this configuration. However, further study of the propellant is desired, particularly
identifying key differences in the physical mechanisms of the propellant ablation [31] in
comparison to PTFE.

37
REFERENCES
[1] Sawka, W. N., "Pulse Performance and Power Requirements for Electrically Controlled Solid Propellant," 54th JANNAF Propulsion Meeting, JANNAF, Denver, CO, 2007.
[2] Sawka, W. N., Katzakian, A., and Grix, C., "Solid State Digital Cluster Thrusters for Small Satellites, Using High Performance Electrically Controlled Extinguishable Solid Propellants," AIAA/USU Conference on Small Satellites, AIAA, Logan, UT, 2005.
[3] Sawka, W. N., and McPherson, M., "Electrical Solid Propellants: A Safe, Micro to Macro Propulsion Technology," 49th AIAA/ASME/SAE/ASEE Joint Propulsion Conference, AIAA, San Jose, CA, 2013. doi: 10.2514/6.2013-4168
[4] Sawka, W. N., U.S. Patent for a "Controllable Digital Solid State Cluster Thrusters for Rocket Propulsion and Gas Generation," No. 7958823 B2 and 8464640; June 14, 2011 and June 18, 2013.
[5] Burton, R. L., and Turchi, P. J., "Pulsed Plasma Thruster," Journal of Propulsion and Power, Vol. 14, No. 5, 1998, pp. 716-735. doi: 10.2514/2.5334
[6] Guman, W. J., and Peko, P. E., "Solid-Propellant Pulsed Plasma Microthruster Studies," Journal of Spacecraft and Rockets, Vol. 5, No. 6, 1968, pp. 732-733. doi: 10.2514/3.29340
[7] Guman, W. J., and Nathanson, D. M., "Pulsed Plasma Microthruster Propulsion System for Synchronous Orbit Satellite," Journal of Spacecraft and Rockets, Vol. 7, No. 4, 1970, pp. 409-415. doi: 10.2514/3.29955
[8] LaRocca, A. V., "Pulsed Plasma Thruster System for Attitude and Station Control of Spacecraft," First Western Space Congress, 1970, pp. 688-702.
[9] Vondra, R. J., and Thomassen, K. I., "Flight Qualified Pulsed Electric Thruster for Satellite Control," Journal of Spacecraft and Rockets, Vol. 11, No. 9, 1974, pp. 613-617. doi: 10.2514/3.62141
[10] Gatsonis, N. A., Lu, Y., Blandino, J., Demetriou, M. A., and Paschalidis, N., "Micropulsed Plasma Thrusters for Attitude Control of a Low-Earth-Orbiting Cubesat," Journal of Spacecraft and Rockets, Vol. 53, No. 1, 2016, pp. 57-73. doi: 10.2514/1.A33345

38
[11] Rayburn, C. D., Campbell, M. E., and Mattick, A. T., "Pulsed Plasma Thruster System for Microsatellites," Journal of Spacecraft and Rockets, Vol. 42, No. 1, 2005, pp. 161-170. doi: 10.2514/1.15422
[12] Rudolph, L. K., Pless, L. C., and Harstad, K. G., "Pulsed Plasma Thruster Backflow Characteristics," Journal of Spacecraft and Rockets, Vol. 17, No. 5, 1980, pp. 447-452. doi: 10.2514/3.57763
[13] Janson, S., "The on-Orbit Role of Electric Propulsion," 29th Joint Propulsion Conference and Exhibit, AIAA, Monterey, CA, 1993. doi: 10.2514/6.1993-2220
[14] Vondra, R. J., and Thomassen, K. I., "Performance Improvements in Solid Fuel Microthrusters," Journal of Spacecraft and Rockets, Vol. 9, No. 10, 1972, pp. 738-742. doi: 10.2514/3.61794
[15] Solbes, A., Thomassen, K., and Vondra, R. J., "Analysis of Solid Teflon Pulsed Plasma Thruster," Journal of Spacecraft and Rockets, Vol. 7, No. 12, 1970, pp. 1402-1406. doi: 10.2514/3.30181
[16] Boyd, I. D., Keidar, M., and McKeon, W., "Modeling of a Pulsed Plasma Thruster from Plasma Generation to Plume Far Field," Journal of Spacecraft and Rockets, Vol. 37, No. 3, 2000, pp. 399-407. doi: 10.2514/2.3574
[17] Jahn, R. G., Physics of Electric Propulsion, New York: McGraw-Hill, 1968.
[18] Liebing, L., and Seidel, F., "Low Current Pulsed Ablation Plasma Thruster," Journal of Spacecraft and Rockets, Vol. 11, No. 9, 1974, pp. 609-610. doi: 10.2514/3.62139
[19] Spanjers, G. G., Lotspeich, J. S., McFall, K. A., and Spores, R. A., "Propellant Losses Because of Particulate Emission in a Pulsed Plasma Thruster," Journal of Propulsion and Power, Vol. 14, No. 4, 1998, pp. 554-559. doi: 10.2514/2.5313
[20] Sigma-Aldrich, "Ionic Liquids for Electrochemical Applications," Aldrich ChemFiles, Vol. 5, No. 6, 2005.
[21] Lau, M., Manna, S., Herdrich, G., Schönherr, T., and Komurasaki, K., "Investigation of the Plasma Current Density of a Pulsed Plasma Thruster," Journal of Propulsion and Power, Vol. 30, No. 6, 2014, pp. 1459-1470. doi: 10.2514/1.B35131

39
[22] Walker, M. L. R., Victor, A. L., Hofer, R. R., and Gallimore, A. D., "Effect of Backpressure on Ion Current Density Measurements in Hall Thruster Plumes," Journal of Propulsion and Power, Vol. 21, No. 3, 2005, pp. 408-415. doi: 10.2514/1.7713
[23] Chen, S.-L., "Studies of the Effect on Ion Current on Instantaneous Triple-Probe Measurements," Journal of Applied Physics, Vol. 42, No. 1, 1971, pp. 406-412. doi: 10.1063/1.1659611
[24] Chen, S.-L., and Sekiguchi, T., "Instantaneous Direct-Display System of Plasma Parameters by Means of Triple-Probe," Journal of Applied Physics, Vol. 36, No. 8, 1965, pp. 2363-2375. doi: 10.1063/1.1714492
[25] Eckman, R., Byrne, L., Gatsonis, N. A., and Pencil, E. J., "Triple Langmuir Probe Measurements in the Plume of a Pulsed Plasma Thruster," Journal of Propulsion and Power, Vol. 17, No. 4, 2001, pp. 762-771. doi: 10.2514/2.5831
[26] Gatsonis, N. A., Eckman, R., Yin, X., Pencil, E. J., and Myers, R. M., "Experimental Investigations and Numerical Modeling of Pulsed Plasma Thruster Plumes," Journal of Spacecraft and Rockets, Vol. 38, No. 3, 2001, pp. 454-464. doi: 10.2514/2.3704
[27] Eckman, R., "Pulsed Plasma Thruster Plume Diagnostics," 36th AIAA Aerospace Sciences Meeting and Exhibit, AIAA, Reno, NV, 1998. doi: 10.2514/6.1998-4
[28] Tilley, D. L., Kelly, A. J., and Jahn, R. G., "The Application of the Triple Probe Method to Mpd Thruster Plumes," 21st International Electric Propulsion Conference, AIAA, Orlando, FL, 1990. doi: 10.2514/6.1990-2667
[29] Schönherr, T., Komurasaki, K., and Herdrich, G., "Propellant Utilization Efficiency in a Pulsed Plasma Thruster," Journal of Propulsion and Power, Vol. 29, No. 6, 2013, pp. 1478-1487. doi: 10.2514/1.B34789
[30] Thomassen, K., and Vondra, R. J., "Exhaust Velocity Studies of a Solid Teflon Pulsed Plasma Thruster," 9th Aerospace Sciences Meeting, AIAA, New York, NY, 1971. doi: 10.2514/6.1971-194
[31] Keidar, M., Boyd, I. D., and Beilis, I. I., "Model of an Electrothermal Pulsed Plasma Thruster," Journal of Propulsion and Power, Vol. 19, No. 3, 2003, pp. 424-430. doi: 10.2514/2.6125

40
II. OBSERVATION OF LATE-TIME ABLATION IN ELECTRIC SOLID PROPELLANT PULSED MICROTHRUSTERS
Matthew S. Glascock and Joshua L. Rovey,
Missouri University of Science and Technology, Rolla, Missouri, 65409
and
Shae Williams and Jason Thrasher,
Digital Solid State Propulsion, Reno, Nevada, 89511
ABSTRACT
Electric solid propellants are an interesting potential option for propulsion
because they are ignited by an applied electric current. The electric nature of these
materials leads to the capability for use in pulsed electric propulsion devices. In this
work, the ablation process of an electric solid propellant during pulsed microthruster
operation is investigated using a triple Langmuir probe, thrust stand and high speed video
camera. Results include quantitative time-of-flight, ablation mass per pulse and impulse-
per-pulse measurements. Additionally, qualitative images from the high speed video are
temporally correlated to these measurements. Analyses indicate 45±11% of the ablated
mass per pulse is expelled at negligible speeds relative to the effective plume exhaust
velocity (1500 m/s). Further, this occurs on a time scale that is three times longer than
the 0.5 ms primary discharge. This late-time ablation has been identified in other pulsed
microthrusters with traditional Teflon propellant, and the results presented here indicate
that electric solid propellant exhibits similar behavior.

41
1. INTRODUCTION
Electric solid propellants (ESP’s) are an emerging topic of research with major
implications in the field of propulsion from the micro to macro scale [1,2]. These
propellants offer new capabilities for controlling solid chemical rocket motors previously
unheard of for typical energetic materials. When electric power at sufficient current and
voltage levels is applied to an ESP, the solid propellant ignites and continues to
exothermically decompose until that power is removed. This process can be repeated
until the solid propellant is entirely consumed. Further, the burn rate of the propellant
can be throttled by altering the electrical power applied. This method of operation is not
possible with traditional solid rocket propellants and energetics, and greatly expands the
potential applications for solid rocket motors that are fit with an ESP. Additionally, ESPs
are insensitive to accidental ignition by spark, impact or even open flame. This is a huge
advantage over most energetics in safety considerations and ease of use.
The development of ESPs began in the mid-late 90’s with the investigation of a
“green” automobile air bag inflator propellant (ABIP). This ammonium nitrate based
material quickly garnered attention from the U.S. Air Force for other applications,
including a patented [3] formulation for rocket propulsion application. Soon after, the
first controlled extinguishable solid propellants were developed, the first of which was
referred to as “ASPEN.” This development process began adding ingredients to the
ammonium nitrate based propellant to lower the melting point and increase the electrical
conductivity during chemical combustion. Performance metrics of the ASPEN propellant
were comparable to typical marks for solid rocket motors, but experienced major
problems with initial ignition. Addressing these problems led to the development of a
more advanced formula to achieve higher specific impulse and conductivity of the
propellant. This higher performance electric propellant (HIPEP) is a hydroxyl
ammonium nitrate (HAN) based energetic material. In this formulation, the ionic liquid
oxidizer HAN exhibits a pyroelectric behavior; the application of electric power to this
material incites the creation of nitric acid, triggering ignition of the formulation. This
behavior has been previously observed in organic materials, but none of which are known
to be energetic.

42
Electric solid propellants have also been tested for application in electric
propulsion. All of the aforementioned ESP’s have been tested as alternative
fuel/propellant for the ablation fed pulsed plasma thruster and have shown performance
marks comparable to that of the traditional propellant [2]. The Pulsed Plasma Thruster [4]
(PPT) is a type of in-space electric propulsion system first flown in November of 1964
aboard the Soviet spacecraft Zond 2, marking the first application of electric propulsion
on a spacecraft. Modern PPTs are primarily used for stationkeeping needs, attitude
control, and other secondary propulsion system duties [5-7]. These thrusters have
received considerable attention in the propulsion community due to the relative simplicity
of the supporting technology and their ability to reliably generate small impulse bits.
Operation of the ablation-fed PPT begins with a high-current discharge between
electrodes across the exposed surface of a solid propellant, usually Teflon® (PTFE).
Typically, PPTs fall within two distinct classes of electric propulsion: electrothermal or
electromagnetic [8]. The key difference lies in the acceleration mechanisms observed in
PPT operation. LES 8/9 exhibits a typical behavior in that a portion of the plume is
ionized by the main discharge (~10% in this case) and accelerated by the electromagnetic
force arising from the 𝑗 × 𝐵 current front that propagates along with the ablated mass [8].
These high-energy, high-velocity particles contribute 15% (or more) of the kinetic energy
of the exhaust gas despite the low mass relative to the rest of the plume, which remains
neutral. On the other hand, the PPT-3/PPT-4 design is less common in that the
acceleration of the ablated mass is dominated by electrothermal effects [9]. The
temperature arising from the arc discharge is sufficiently high to provide enough energy
to the particles to provide exhaust velocities comparable to or even exceeding that of
chemical thrusters. These temperatures are typically limited by radiation and other
dissipative processes to a few eV, but the high temperature neutrals provide nearly the
entirety of the kinetic energy in the exhaust. Additionally, both thrusters (and most PPTs
in general) have shown evidence of lost mass after the completion of the discharge pulse
in the form of low relative velocity neutrals and even macroparticles [10]. This “late-
time ablation” contributes little to nothing by way of performance. Further, this ablation
is not readily measured, thus the mass fraction is not well characterized, but modeling
efforts have estimated large fractions of the total ablated mass per pulse [11].

43
This paper focuses on the ablation of an electric solid propellant in PPT operation.
Results from ablation mass, impulse-per-pulse and time-of-flight measurements are
coupled with high speed imagery to show that the electric solid propellant exhibits late-
time ablation. The experimental apparatus is described in Section 2, and the Results and
Analysis are given in Section 3 and 4, respectively. Conclusions from the work are
described in Section 5.
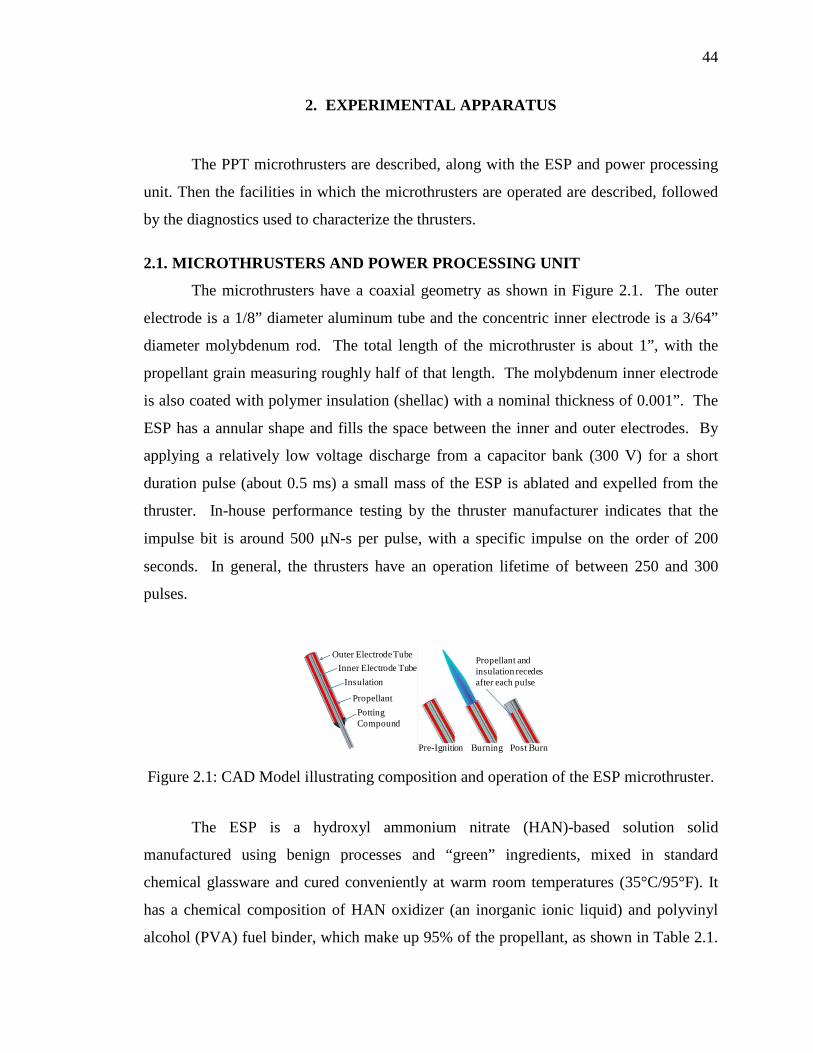
44
2. EXPERIMENTAL APPARATUS
The PPT microthrusters are described, along with the ESP and power processing
unit. Then the facilities in which the microthrusters are operated are described, followed
by the diagnostics used to characterize the thrusters.
2.1. MICROTHRUSTERS AND POWER PROCESSING UNIT
The microthrusters have a coaxial geometry as shown in Figure 2.1. The outer
electrode is a 1/8” diameter aluminum tube and the concentric inner electrode is a 3/64”
diameter molybdenum rod. The total length of the microthruster is about 1”, with the
propellant grain measuring roughly half of that length. The molybdenum inner electrode
is also coated with polymer insulation (shellac) with a nominal thickness of 0.001”. The
ESP has a annular shape and fills the space between the inner and outer electrodes. By
applying a relatively low voltage discharge from a capacitor bank (300 V) for a short
duration pulse (about 0.5 ms) a small mass of the ESP is ablated and expelled from the
thruster. In-house performance testing by the thruster manufacturer indicates that the
impulse bit is around 500 μN-s per pulse, with a specific impulse on the order of 200
seconds. In general, the thrusters have an operation lifetime of between 250 and 300
pulses.
Figure 2.1: CAD Model illustrating composition and operation of the ESP microthruster.
The ESP is a hydroxyl ammonium nitrate (HAN)-based solution solid
manufactured using benign processes and “green” ingredients, mixed in standard
chemical glassware and cured conveniently at warm room temperatures (35°C/95°F). It
has a chemical composition of HAN oxidizer (an inorganic ionic liquid) and polyvinyl
alcohol (PVA) fuel binder, which make up 95% of the propellant, as shown in Table 2.1.
Outer Electrode TubeInner Electrode Tube
Insulation
PropellantPotting Compound
Pre-Ignition Burning Post Burn
Propellant and insulation recedes after each pulse

45
The ESP is initially a liquid and injected by syringe into the discharge gap of the
microthruster. It is then cured to form a soft solid with the appearance and texture of a
soft pencil eraser. It is safe to handle and classified under DOT as a 1.4S explosive,
making this ESP much more convenient to transport and work with than conventional
solid rocket propellants.
Table 2.1: Nominal composition of the High Performance Electric Propellant.
Chemical Name Chemical Formula
Percentage by mass
Molecular Mass, g/mol
Hydroxyl Ammonium Nitrate (HAN)
(NH3OH)+ NO3- 75% 96
Polyvinyl Alcohol (PVA) CH2CH(OH) 20% 44
Ammonium Nitrate (AN) NH4NO3 5% 80
There are some key differences between the ESP and traditional Teflon® (PTFE)
PPT propellant. PTFE is a fluorocarbon solid, while the ESP is a soft-solid mixture with
composition given in Table 2.1. In a typical PPT, the PTFE is an electrical insulator
between the electrodes. The conductivity of the ESP in this work is comparable to
“highly conductive” ionic liquids which have been selected as candidates for use in dye-
sensitized solar cells [12]. With the ESP propellant the pulsed electric current can be
conducted through the ESP, potentially initiating thermoelectric decomposition and
creation of intermediates in the propellant. With PTFE an arc discharge is created near
the surface of the solid PTFE, ablating the propellant via heat transfer. Additionally, in a
conventional PPT, the propellant is fed into the thruster such that the arc discharge
always occurs at the same physical location with respect to the thruster exit plane. With
the ESP microthrusters the propellant face recedes from the exit plane over time as the
propellant is burned away. It is currently unclear how these propellant differences affect
the operation and performance of a PPT using the ESP as a propellant.
The power processing unit (PPU) used to operate the microthrusters is a custom
in-house pulsed power supply. This PPU is primarily a bank of capacitors with a nominal

46
rating of 900 μF. This bank is charged to 300 V with a small input power (5 V at < 1A).
Once charged, the stored energy (about 40 J) is then rapidly discharged directly into the
thruster electrodes, an event which typically lasts about 500 μs. This mode of operation
was chosen as it was shown to increase the total impulse delivered over the thruster
lifetime. Additionally, the voltage level of 300 V was chosen to keep the impulse bit per
pulse around 500 μN-s. This PPU is vacuum-compatible and is mounted a few inches
from the thruster during testing; the PPU is then remotely controlled via serial
communication.
2.2. VACUUM FACILITIES
2.2.1. Missouri S&T Aerospace Plasma Lab. The microthrusters were tested in
the large (1.8 m dia., 3 m lg.) space and high altitude vacuum facility at the Aerospace
Plasma Laboratory of Missouri S&T. This facility uses four 89 cm diameter oil vapor
diffusion pumps backed by an Edwards EH 4200 roots-blower pump and a Tokunda KP-
7500BG rotary-vane pump. Standard operation for this work was two oil vapor diffusion
pumps active which gives the facility a nominal base pressure of 2×10⁻⁵ Torr. The
interior of the facility is equipped with a two-axis translation table system with a
minimum step size of 2.6 μm that is controllable remotely to allow for the measurements
made at varying locations.
2.2.2. Digital Solid State Propulsion (DSSP) Vacuum Facility. Microthrusters
were also tested in the large vacuum facility at DSSP. This facility uses a single Varian
VHS-250 oil vapor diffusion pump and an Alcatel ADS501 model rotary-vane, roots-
blower pump combination for roughing of the chamber. Standard operation for this work
was with the oil vapor diffusion pump active, yielding a nominal base pressure of 5×10⁻⁴
Torr. The interior of the facility is equipped with an optical table for mounting of
hardware and diagnostics.
2.3. DIAGNOSTICS
Characterization of the plasma plume created during a pulse is generally the first
step of analyzing a PPT system, and the primary focus of this work. Plume velocity
distribution, plasma density and temperature, and current density are very useful in
analyzing performance of a PPT. Work on plasma plume characterization of the

47
microthruster has been conducted at Missouri S&T, who has partnered with DSSP to
analyze the microthruster. A number of prevalent PPT plume diagnostics were prepared
and used for the analysis of the microthruster. In this work, a Langmuir triple probe was
used to determine plasma densities and temperatures as well as for time of flight
measurements. Additionally, a mass balance and high speed camera were used to
investigate the ablated mass per pulse.
2.3.1. Langmuir Triple Probe. The Langmuir Triple Probe (LTP) is used to
measure electron density and electron temperature at various locations in the plume as a
function of time. The triple probe is well suited to operation in pulsed environments, and
is a common diagnostic for the pulsed plasma thruster [13,14]. Tungsten wire of 0.5 mm
diameter was inserted into three bores of a quad-bore alumina tube, creating the three
isolated probe tips with 5.0 mm of exposed length. The remaining bore is plugged with a
ceramic adhesive. On the other end of the probe, the tungsten wires connect to individual
standard RF cables inside a grounded enclosure to ensure the connections are well
shielded.
Figure 2.2: Electrical schematic and illustration of the triple Langmuir probe in voltage-
mode.
In this work, the triple probe was operated in what is referred to as “voltage-
mode,” wherein (as in Figure 2.2) three identical probes are inserted into the plasma. All
three probes are floating with respect to ground (Vf), and a bias voltage difference, Vd3, is
applied externally to two of the probes via a battery. In this work, Vd3 was selected as a
nominal 27 V, supplied via three 9V batteries in series. During a pulse, the voltage
PlasmaP2 P1 P3
Vd2 Vd3
I3
P2 P1 P3
Vp
Vf
V3
Vd2
V2
Vd3
V1

48
difference Vd2 is measured via a differential voltage probe and the probe current, I3, is
measured via a current monitor. The high voltage differential probe was selected because
these probes were found to be less susceptible to signal noise than digitally subtracting
signals on an oscilloscope, or using differential operational amplifiers. These
measurements are displayed as a function of time during testing on a 4-channel Tektronix
TDS2024B oscilloscope. Through the Langmuir Triple Probe theory from Chen and
Sekiguchi [15] these measurements Vd2(t) and I3(t) can be used to directly calculate the
plasma electron temperature, Te(t), and the plasma density, ne(t). This process was
conducted by the authors previously [16]. In the present work, the triple probe is used as
a plume time-of-flight measurement device in order to evaluate the effective exhaust
velocity of the microthruster. This is accomplished by examining the probe current, I3.
This signal is then temporally correlated to initiation of the thruster circuit discharge
current, ID, as measured by an IPC CM-1-MG current monitor to determine the plume
time-of-flight.
2.3.2. Mass Balance. Additionally, the mass bit expelled per pulse is a quality of
interest in the testing of the microthrusters. In order to estimate this, the mass of a
microthruster is measured immediately prior to testing and again immediately following
testing. The mass scale used was a Radwag AS310/C/2 which has a resolution of 0.1 mg
and a quoted repeatability (standard deviation from 10 weighing cycles) of 0.1 mg. With
careful tabulation of the number of pulses logged on a microthruster during testing, an
estimate within 2% of the average mass expelled per pulse (the mass bit) value can be
determined. This value will be important for the analysis of the thrust contribution of the
plasma plume and analysis of the impulse-per-pulse.
2.3.3. Thrust Stand. The existing thrust stand previously built in-house for
performance testing of the microthrusters was used in this work. This thrust stand is
integrated into the DSSP vacuum facility, and was thus not available for testing in the
S&T facility. The design is a pendulum using spring steel as a dampening method. The
microthruster is mounted to a fixture suspended from an aluminum frame by two pieces
of 2.5 cm wide spring steel to ensure minimal cross-axis movement. During each thruster
discharge, the displacement of the fixture is measured by a laser displacement sensor with
a resolution of 5 μm. This corresponds to a resolution in thrust measurement of about 1

49
mN for typical pendulum fixture mass. Estimated accuracy of the thrust stand is ±10%
based on error analysis in the laser and chamber back pressure. In the current
configuration, the thrust stand can measure the impulse-per-pulse (or impulse bit, Ibit) of
the microthruster within a range of 0.025 mN-s to 5 mN-s.
2.3.4. High Speed Camera. The high speed camera for the visual ablation
analysis of the microthruster is a Vision Research Inc. Phantom V7.3 model camera with
a maximum framerate of 500,000 frames-per-second (fps). Due to restrictions on image
resolution, however, the framerate used in this work was 125,000 fps. This correlates to
an exposure time of 8 μs per image. The typical setting for the camera in this work was
to capture 200 images during the thruster discharge (i.e. 1.6 ms of footage). Additionally,
the camera was triggered digitally in sync with the microthruster via LabVIEW.
Measurement of a digital output of the high-speed camera detailing when the camera is
triggered allows for temporal correlation of the images to probe diagnostic data accurate
to about one frame (±8 μs).

50
3. RESULTS
In this section, experimental results from the mass balance, triple Langmuir probe
and thrust stand are presented. These results include the average mass bit of all thrusters
tested in recent time and some impulse-per-pulse results for a few of these that were
measured. Experimental results are used to determine an effective exhaust velocity of the
plume and temporally correlated to high speed images.
3.1. ABLATION MASS
Table 3.1 details the results of the mass balance measurements made of the
microthrusters tested, both during this work, as well as in previous work [16,17]. These
thrusters are all at (or nearly at) the observed end-of-life. The average mass bit (mbit) is
calculated by subtracting the final from initial mass and dividing by the number of pulses.
Overall, the average mass bit is 215.4 μg. Note that some of the microthrusters shown
here were tested in the DSSP facility, while others were tested in the S&T facility. This
result is on the order of typical values for a PTFE PPT, which is usually between 10 and
100 μg, though it is noticeably higher than typical values [4].
Table 3.1: Average ablation mass bit data for selected microthrusters.
Serial no. Pulses Initial Mass (mg)
Final Mass (mg)
Average Mass Bit (µg)
OD01A09 200 639 549 450.0 OD01A12 222 647 590 256.8 OD01A13 206 642 588 262.1 OD01A14 155 636 545 587.1 OD01A17 280 643 611 114.3 OD02A06 150 637 603 226.7 OD02A10 150 625 613 80.0 RR43A08 121 641 631 82.6 RR50A14 143 658 639 132.9 RR50A20 153 661 637 156.9 RR51A03 150 661 614 313.3 RR51A06 150 642 623 126.7 RR51A10 161 641 624 105.6 RR52A10 150 665 647 120.0
Mean: 215.4

51
3.2. LANGMUIR TRIPLE PROBE
The Langmuir triple probe provides measurements of probe current (Ip) as a
function of time for each pulse of a microthruster. Additionally, a current monitor
measures the thruster circuit discharge current (ID) for each pulse. Figure 3.1 shows
typical traces of Ip(t) and ID(t) measurements for a single pulse of thruster RR51A10.
These data are used to calculate the time-of-flight of the thruster plume from the initiation
of the discharge current (here, ~110 µs) and peak probe current (~150 µs).
Figure 3.1: Typical thruster discharge and Langmuir triple probe current traces.
Figure 3.2: Effective exhaust velocity from Langmuir triple probe time-of-flight
measurements.
Effective exhaust velocity (Vex) was determined from these time-of-flight
measurements, and the calculated data are shown in Figure 3.2. The three thrusters

52
shown were tested in the DSSP facility such that the impulse bit could be measured
simultaneously with time-of-flight. The triple probe signal was used to calculate the
time-of-flight of the plume exhaust from the thruster exit to the probe. The distance of
travel is known (5 cm), and we define the time-of-flight to be the time between when the
discharge current measurement becomes positive (i.e. time zero) and the time of peak
current measured by the triple probe (~20 to ~60 µs). Time-of-flight results indicate an
average exhaust velocity over all pulses of about 1500 m/s. Inadequate temporal
resolution of the data acquisition system limits the accuracy of the determination of time-
of-flight to ~10% uncertainty.
Figure 3.3: Measured impulse bit for four microthrusters.
3.3. IMPULSE BIT
Thrust testing was conducted at DSSP. A primary focus of this thrust testing was
to determine the impulse bit per pulse (Ibit) of the microthrusters. Figure 3.3 shows these
results over the pulse lifetime of four different microthrusters from various batches. The
first three (RR43A08, RR50A14 and RR51A10) were tested in the DSSP vacuum facility
equipped with the triple Langmuir probe diagnostic. The final thruster (RR50A20) tested
previously by DSSP, was not interrogated with the Langmuir probe. From the data
shown in Figure 3.3, the impulse bit is between 0.15-0.27 mN-s with an average value of
0.21 and 95% CI of ± 0.01 mN-s. The trends seen here are commonly observed for these
microthrusters [2].

53
3.4. HIGH SPEED IMAGES
The Phantom high speed camera was used to capture images during the discharge
of a small number of the thrusters tested. These images were then correlated with the
measured discharge current of the thruster circuit. Figure 3.4 shows nine images taken
from a single discharge with timestamps and corresponding time marks on the discharge
circuit measurement. Note that the beginning of the discharge occurs at roughly 0.117
ms, as indicated by the rapid rise in discharge current and verified by the appearance of a
visible glow at the thruster exit. Additionally, both the discharge current and the high
speed images indicate a peak (peak current, peak visible intensity) at 0.133 ms, seeming
to validate the correlation between the visible glow and the measured discharge current.
Figure 3.4: Selected images from high speed footage.
More interesting, however, is that the glow of the discharge and the apparent
expulsion of particles are visible long after the discharge ends. The measured discharge
current becomes negligible at the 0.501 ms timestamp, with a bright glow still visible.
Further, even long after the discharge current is no longer measured, visible particles are
observed, continuing through to the final image taken, at a timestamp of 1.597 ms. The
time-scale for the total ablation is roughly three times that of the primary discharge. The
ablation observed post-discharge is a previously studied phenomenon in PTFE PPTs, and
is referred to as “late-time” ablation. Qualitatively, from the high speed imagery, it
would seem that this ablated mass is a significant fraction of the total ablated mass per
pulse, though there is no way to directly measure this fraction here.

54
4. ABLATION MASS ANALYSIS
The high speed imagery provides a qualitative indication of propellant ablation
well after the main discharge has ended (late-time ablation). However, it is impossible to
make a quantitative mass estimate for this ablated propellant without making restrictive
and unfounded assumptions. Thus, it is desirable to apply the above numerical results to
obtain some estimate of this late-time ablation mass. Using the simple equation (1)
below, from the definition of impulse, the calculated ablated mass per pulse can be
determined from the measured impulse bit and exhaust velocity. This calculation will
then be compared to the directly measured ablation mass from this and previous work.
𝑚𝑏𝑖𝑡 =𝐼𝑏𝑖𝑡𝑉𝑒𝑥
(1)
Recall that mbit is the ablation mass per pulse, Ibit the impulse per pulse and Vex the
effective exhaust velocity. Using the average values measured for these quantities (0.21
mN-s, 1500 m/s), an average calculated mass bit of 140 µg is obtained. This calculated
mass bit is 65% of the measured average ablation mass bit (215 µg). This would indicate
that the remaining 35% of the ablated propellant per pulse is ablating very slowly and not
contributing to the measured impulse of each pulse. Looking at the specific cases of each
microthruster, we find the average value to be 45±11% late-time ablation mass. Of
course, this range is based on an average value, and some disagreement is to be expected
for individual cases. For example, consider the three microthrusters for which both
impulse-per-pulse and exhaust velocity measurement data are available: RR43A08,
RR50A14 and RR51A10 (see Figure 3.2, Figure 3.3). From Table 3.1, we see the
ablation mass measurements for these thrusters are 82.6, 132.9 and 105.6 µg,
respectively. Comparing these values to the ablation mass calculated above indicates that
all (or more) of the mass bit is necessary to produce the measured impulse bit at that
velocity. This is nonsensical, and is likely due to a combination of measurement error
and facility effects for these thrusters. More specifically, the DSSP test facility (where
impulse bit can be measured) has a base pressure of more than twenty times that of the

55
facility used to test the other microthrusters. This raised back pressure will reduce the
effective exhaust velocity from a time-of-flight measurement, falsely indicating that the
entire ablation mass contributes to the measured impulse. Unfortunately, this data is only
available for a select few thrusters. Nevertheless, we surmise that these are rough bounds
for the actual late-time ablation mass fraction, and this sizeable fraction has been
observed in PPTs previously.
The ablation process of PTFE has been investigated in detail by the PPT research
community. Ablation modeling efforts have shown that the ablation is not an
instantaneous process, but a gradual process correlated with the discharge current [11,18-
20]. Experimental results have shown agreement with these conclusions [21].
Additionally, PPT experiments have identified residual heating, large particulate
emission [10] and late-time material ablation [22] as causes of poor propellant efficiency
in PPTs. Spanjers et. al [10] observed particulate emission in a PTFE PPT consuming
40±3% of the ablation mass and yet contributing less than 1% to thrust performance.
Investigating post-pulse temperature effects, Antonsen et. al [22] found that late-time
ablation accounted for 23±11% of the lost propellant. Clearly, these effects have a
considerable negative impact on efficiency in PPTs. We have observed that these
processes still occur when using an electric solid propellant in a PPT, with similar mass
fractions.

56
5. CONCLUSION
Plume diagnostics were performed on a novel electric solid propellant
microthruster. Twenty microthrusters were tested in two separate facilities. A Langmuir
triple probe was used to measure the time-of-flight of the plume and an impulse-per-pulse
of 0.21 mN-s was measured using a thrust stand. The average mass bit was found to be
215 µg from mass balance measurements. Analysis of the time-of-flight data yields an
effective velocity of 1500 m/s. Additionally, high speed imagery of a microthruster
during discharge shows evidence of late-time ablation of the electric solid propellant in
the form of bright particles being expelled from the device long after the main discharge
dissipates.
Numerical analysis of the measured impulse bit and exhaust velocity yields a
calculated ablation mass that contributes to the impulse of 140 µg. This number differs
from the measured ablation mass substantially and indicates that much of the ablation
mass is expelled at low velocities and does not contribute meaningfully to the
performance. The mass fraction of this late-time ablation is estimated to be 45±11%.
Traditional pulsed plasma thrusters using PTFE for propellant experience a similar
phenomenon with mass fractions on this order. Thus, we conclude that electric solid
propellant exhibits the same behavior on a similar magnitude. Particulate emission and
late-time ablation have been identified as causes of poor propellant efficiency in PPTs.
Reduction of this late-time ablation during pulsed plasma thruster operation is an avenue
of performance improvement for electric solid propellant.

57
REFERENCES
[1] Sawka, W. N., Katzakian, A., and Grix, C., "Solid State Digital Cluster Thrusters for Small Satellites, Using High Performance Electrically Controlled Extinguishable Solid Propellants," AIAA/USU Conference on Small Satellites, AIAA, Logan, UT, 2005.
[2] Sawka, W. N., and McPherson, M., "Electrical Solid Propellants: A Safe, Micro to Macro Propulsion Technology," 49th AIAA/ASME/SAE/ASEE Joint Propulsion Conference, AIAA, San Jose, CA, 2013. doi: 10.2514/6.2013-4168
[3] Sawka, W. N., U.S. Patent for a "Controllable Digital Solid State Cluster Thrusters for Rocket Propulsion and Gas Generation," No. 7958823 B2 and 8464640; June 14, 2011 and June 18, 2013.
[4] Burton, R. L., and Turchi, P. J., "Pulsed Plasma Thruster," Journal of Propulsion and Power, Vol. 14, No. 5, 1998, pp. 716-735. doi: 10.2514/2.5334
[5] Gatsonis, N. A., Lu, Y., Blandino, J., Demetriou, M. A., and Paschalidis, N., "Micropulsed Plasma Thrusters for Attitude Control of a Low-Earth-Orbiting Cubesat," Journal of Spacecraft and Rockets, Vol. 53, No. 1, 2016, pp. 57-73. doi: 10.2514/1.A33345
[6] Guman, W. J., and Nathanson, D. M., "Pulsed Plasma Microthruster Propulsion System for Synchronous Orbit Satellite," Journal of Spacecraft and Rockets, Vol. 7, No. 4, 1970, pp. 409-415. doi: 10.2514/3.29955
[7] LaRocca, A. V., "Pulsed Plasma Thruster System for Attitude and Station Control of Spacecraft," First Western Space Congress, 1970, pp. 688-702.
[8] Jahn, R. G., Physics of Electric Propulsion, New York: McGraw-Hill, 1968.
[9] Boyd, I. D., Keidar, M., and McKeon, W., "Modeling of a Pulsed Plasma Thruster from Plasma Generation to Plume Far Field," 35th Joint Propulsion Conference and Exhibit, AIAA, 1999. doi: 10.2514/6.1999-2300
[10] Spanjers, G. G., Lotspeich, J. S., McFall, K. A., and Spores, R. A., "Propellant Losses Because of Particulate Emission in a Pulsed Plasma Thruster," Journal of Propulsion and Power, Vol. 14, No. 4, 1998, pp. 554-559. doi: 10.2514/2.5313
58
[11] Mikellides, P., and Turchi, P., "Modeling of Late-Time Ablation in Teflon Pulsed Plasma Thrusters," 32nd Joint Propulsion Conference and Exhibit, AIAA, Lake Buena Vista, FL, 1996. doi: 10.2514/6.1996-2733
[12] Sigma-Aldrich, "Ionic Liquids for Electrochemical Applications," Aldrich ChemFiles, Vol. 5, No. 6, 2005.
[13] Eckman, R., Byrne, L., Gatsonis, N. A., and Pencil, E. J., "Triple Langmuir Probe Measurements in the Plume of a Pulsed Plasma Thruster," Journal of Propulsion and Power, Vol. 17, No. 4, 2001, pp. 762-771. doi: 10.2514/2.5831
[14] Gatsonis, N. A., Eckman, R., Yin, X., Pencil, E. J., and Myers, R. M., "Experimental Investigations and Numerical Modeling of Pulsed Plasma Thruster Plumes," Journal of Spacecraft and Rockets, Vol. 38, No. 3, 2001, pp. 454-464. doi: 10.2514/2.3704
[15] Chen, S.-L., and Sekiguchi, T., "Instantaneous Direct-Display System of Plasma Parameters by Means of Triple-Probe," Journal of Applied Physics, Vol. 36, No. 8, 1965, pp. 2363-2375. doi: 10.1063/1.1714492
[16] Glascock, M. S., Rovey, J. L., Williams, S., and Thrasher, J., "Plume Characterization of Electric Solid Propellant Micro Pulsed Plasma Thrusters," 51st AIAA/SAE/ASEE Joint Propulsion Conference, AIAA, Orlando, FL, 2015. doi: 10.2514/6.2015-4185
[17] Glascock, M. S., Rovey, J. L., Williams, S., and Thrasher, J., "Characterization of Electric Solid Propellant Pulsed Microthrusters," Journal of Propulsion and Power, (to be published).
[18] Gatsonis, N. A., Juric, D., Stechmann, D., and Byrne, L., "Numerical Analysis of Teflon Ablation in Pulsed Plasma Thrusters," 43rd AIAA/ASME/SAE/ASEE Joint Propulsion Conference & Exhibit, AIAA, Cincinnati, OH, 2007. doi: 10.2514/6.2007-5227
[19] Keidar, M., Boyd, I. D., and Beilis, I. I., "Electrical Discharge in the Teflon Cavity of a Coaxial Pulsed Plasma Thruster," IEEE Transactions on Plasma Science, Vol. 28, No. 2, 2000, pp. 376-385.
[20] Schönherr, T., Zach, W. A., Komurasaki, K., Hörner, S., Arakawa, Y., and Herdrich, G., "Mechanical Probe and Modeling Efforts for Evaluation of Plasma Creation and Acceleration in Ppt," 33rd International Electric Propulsion Conference, Washington, D.C., 2013.

59
[21] Scharlemann, C. A., and York, T., "Mass Flux Measurements in the Plume of a Pulsed Plasma Thruster," 42nd AIAA/ASME/SAE/ASEE Joint Propulsion Conference & Exhibit, AIAA, Sacramento, CA, 2006. doi: 10.2514/6.2006-4856
[22] Antonsen, E. L., Burton, R. L., Reed, G. A., and Spanjers, G. G., "Effects of Postpulse Surface Temperature on Micropulsed Plasma Thruster Operation," Journal of Propulsion and Power, Vol. 21, No. 5, 2005, pp. 877-883. doi: 10.2514/1.13032

60
SECTION
2. CONCLUSIONS
The solid electric propellant pulsed microthruster has been characterized through
experimental investigation. Primarily, this was conducted such that the behavior of the
novel ESP used in this device configuration could be accurately described for use in
future devices and applications. The key parameters of the plume created by this device
like the electron temperature and density, ionization fraction, and effective velocity were
examined. Further, the propellant mass ablated by the device per shot and the
composition of this mass (i.e. the plume) were investigated. Measurements of the
ablation mass and measured impulse per pulse were compared to those of exhaust
velocity. High speed photography is also introduced to provide qualitative observations
of this propellant ablation. These are properties typically measured in PTFE PPT
research.
In this configuration, the ESP material behaves much like PTFE in a typical
pulsed plasma thruster. Experimental results can vary greatly (up to 60% in some cases)
from pulse to pulse and thruster to thruster. These variations are likely caused by
inconsistencies in manufacture of the device. Despite these variations, general trends
hold well enough to make the following conclusions. At 5 cm downstream of the device,
the peak electron temperature is about 1.7 eV and the ion density is about 273 mA/cm2,
which suggests an ionization fraction of 0.3%. Correlating with this low percentage of
charged particles is the measured electron density (1011 – 1014 cm-3), which is very low
compared to PPTs. These results are very similar to PTFE PPTs, which are usually
observed in the 1-10 eV range with ionization fractions of 1-10%. Additionally, the
average ablation mass is about 215 µg. A significant portion (~45%) of this mass does
not contribute to the measured impulse bit, likely being expelled at a very low velocity
relative to the effective plume speed of about 1500 m/s. This behavior, known as late-
time ablation, is an inefficient mechanism previously observed in a number PTFE PPTs,
especially those dominated by electrothermal effects.

61
Despite these observed fluctuations, the overall results suggest the thruster creates
a weakly ionized gas plume consisting of high temperature (1-2 eV) electrons in a low
relative temperature (1500-2000 K) mixture of ions and neutrals. This plume is
accelerated to its effective velocity by the thermal interaction in the thruster device. Due
to radiation and other dissipative processes, the heavy particles can only receive a limited
amount of energy via heat transfer, thus limiting this velocity to a few km/s. In this
configuration, there is likely no electromagnetic acceleration of the bulk of the plume,
due to negligible induced magnetic field during discharge. These effects are often
observed in electrothermal PPTs using PTFE as propellant, thus it is concluded that the
pulsed microthrusters in this work operate similar to these devices.

62
VITA
Matthew Scott Glascock was born in 1992 in Emporia, Kansas shortly before
relocating to West Plains, Missouri where he spent the rest of his childhood. From a
young age, he had grand illusions of one day working for the great NASA organization.
These aspirations were not serious until he graduated from West Plains High School in
2010 already enrolled in an Aerospace Engineering program. Matthew attended Missouri
University of Science and Technology, where he graduated Magna cum Laude with a
Bachelor of Science degree in Aerospace Engineering plus a minor in Physics in May of
2014. The summer of that year, he finally achieved his dreams by working as an intern at
NASA Marshall Space Flight Center in Huntsville. In August of 2014, he returned to
Missouri S&T to begin graduate studies, and received a Master of Science in Aerospace
Engineering in December of 2016.