characterization of elemental and structural...
TRANSCRIPT
Seediscussions,stats,andauthorprofilesforthispublicationat:http://www.researchgate.net/publication/44798352
Characterizationofelementalandstructuralcompositionofcorrosionscalesanddepositsformedindrinkingwaterdistributionsystems
ARTICLEinWATERRESEARCH·AUGUST2010
ImpactFactor:5.53·DOI:10.1016/j.watres.2010.05.043·Source:PubMed
CITATIONS
21
READS
109
6AUTHORS,INCLUDING:
Ching-YuPeng
UniversityofWashingtonSeattle
19PUBLICATIONS101CITATIONS
SEEPROFILE
GregoryVKorshin
UniversityofWashingtonSeattle
104PUBLICATIONS1,993CITATIONS
SEEPROFILE
MelindaFriedman
ConfluenceEngineeringGroup,LLC
17PUBLICATIONS170CITATIONS
SEEPROFILE
Availablefrom:GregoryVKorshin
Retrievedon:09November2015
wat e r r e s e a r c h 4 4 ( 2 0 1 0 ) 4 5 7 0e4 5 8 0
Avai lab le at www.sc iencedi rect .com
journa l homepage : www.e lsev ier . com/ loca te /wat res
Characterization of elemental and structural compositionof corrosion scales and deposits formed in drinking waterdistribution systems
Ching-Yu Peng a,*, Gregory V. Korshin a, Richard L. Valentine b, Andrew S. Hill c,Melinda J. Friedman c, Steve H. Reiber d
aDepartment of Civil and Environmental Engineering, University of Washington, Box 352700, Seattle, WA 98105-2700, USAbDepartment of Civil and Environmental Engineering, University of Iowa, Iowa City, IA 52242-1527, USAcConfluence Engineering, 517 NE 92nd Street, Seattle, WA, USAdHDR Inc. 500 108th Ave NE Suite 1200, Bellevue, WA 98004-5549, USA
a r t i c l e i n f o
Article history:
Received 9 January 2010
Received in revised form
23 May 2010
Accepted 26 May 2010
Available online 10 June 2010
Keywords:
Corrosion scales
Composition
Structure
Drinking water distribution systems
* Corresponding author.E-mail address: [email protected]
0043-1354/$ e see front matter ª 2010 Elsevdoi:10.1016/j.watres.2010.05.043
a b s t r a c t
Corrosion scales and deposits formed within drinking water distribution systems (DWDSs)
have the potential to retain inorganic contaminants. The objective of this study was to
characterize the elemental and structural composition of extracted pipe solids and
hydraulically-mobile deposits originating from representative DWDSs. Goethite (a-FeOOH),
magnetite (Fe3O4) and siderite (FeCO3) were the primary crystalline phases identified in
most of the selected samples. Among the major constituent elements of the deposits, iron
was most prevalent followed, in the order of decreasing prevalence, by sulfur, organic
carbon, calcium, inorganic carbon, phosphorus, manganese, magnesium, aluminum and
zinc. The cumulative occurrence profiles of iron, sulfur, calcium and phosphorus for pipe
specimens and flushed solids were similar. Comparison of relative occurrences of these
elements indicates that hydraulic disturbances may have relatively less impact on the
release of manganese, aluminum and zinc, but more impact on the release of organic
carbon, inorganic carbon, and magnesium.
ª 2010 Elsevier Ltd. All rights reserved.
1. Introduction presence of corrosion inhibitors (e.g., phosphate), overall
Corrosion scales affect water quality in drinking water
distribution systems (DWDSs) in many important ways. The
rates at which such scales are generated and chemical
composition, structures, morphologies and solubilities of
predominant mineralogical phases constituting them are all
affected by both the pipe material (cast iron, steel or PVC) on
which they are deposited and water chemistry parameters
that include pH, temperature, DIC and alkalinity, concentra-
tions of sulfate, chloride and natural organic matter (NOM),
dissolved oxygen (DO) and disinfectant type and residual,
u (C.-Y. Peng).ier Ltd. All rights reserve
conductivity of water, and hydraulic patterns (Sarin et al.,
2001; Korshin et al., 1996; Vazquez et al., 2006).
Over past several years, the issue of potentially significant
accumulation of trace inorganic contaminants (e.g., arsenic,
vanadium, lead and others) within DWDSs has gained
considerable attention. Reiber and Dostal, 2000; Lytle et al.,
2004; Schock et al., 2008 and Gerke et al., 2009 have demon-
strated that when these inorganic contaminants are present
at concentrations below their respective maximum contami-
nant levels (MCLs) or even at essentially non-detect levels in
water sources, they are capable of accumulating to
d.
wat e r r e s e a r c h 4 4 ( 2 0 1 0 ) 4 5 7 0e4 5 8 0 4571
measurable levels on andwithin deposits that exist in DWDSs.
Certain compounds commonly found in corrosion scales and
other deposits, including individual phases of iron(III) and
manganese oxides, have been shown to adsorb and concen-
trate trace inorganic contaminants (Sugiyama et al., 1992;
Nelson et al., 1995; Fendorf et al., 1997; Larsen and Postma,
1997; Gray et al., 1999; O’Reilly et al., 2001; Trived et al., 2001;
Lytle et al., 2004; Cances et al., 2005).
While the amount of information concerning the proper-
ties of corrosion scales, deposits and colloidal particles in
DWDSs is remarkable (Tuovinen et al., 1980; Benjamin et al.,
1996; Sarin et al., 2001; Teng et al., 2008; Gerke et al., 2008;
Borch et al., 2008; Barkatt et al., 2009), there is a need to
provide a more complete characterization of their physico-
chemical properties. This information can provide valuable
insight on factors that influence and control the accumulation
and co-occurrence of regulated trace inorganic contaminants.
Accordingly, the main objective of this study was to charac-
terize corrosion scales and deposits originating from DWDSs
with varying finished water chemistries and pipe materials.
2. Materials and methods
2.1. Participating utilities
Twenty drinking water utilities that participated in the study
were located in the contiguous United States. The selection of
participated utilities and detailed information on sampling
and analytical approaches can be found in the report by
Friedman et al. (2010) on the relevant study funded by Water
Research Foundation. Most of the utilities were from the
upper Midwest while others were from the Western, South-
western, and Northeastern regions, where groundwater tends
to be softer and less mineralized than in the Midwest. Table 1
provides a summary of the utility participants and certain
characteristics of each, as reported by each utility.
2.2. Sample types and processing
Three types of samples were collected: (1) pipe specimens,
either obtained from a recent “live” extraction or from a utility
storage area (referred to as “boneyard” specimens); (2)
hydraulically-mobile deposit material collected during
hydrant flushing events; and (3) distribution system water
samples. Where appropriate, distribution system water
samples were collected to correspond to each solid sample (i.
e., at a site near the location where the solid sample was
obtained). General water quality parameters (pH, tempera-
ture, alkalinity, disinfectant residual, and turbidity) were
measured at the same time and location as water sample
collection.
Samples provided by utility participants were sent to the
Environmental Engineering and Science Laboratory (EES) of
the University of Iowa for processing, distribution and anal-
yses for radionuclides (to be reported elsewhere). Water
samples were shipped to the Department of Civil and Envi-
ronmental Engineering (CEE) of the University of Washington.
Upon receipt, the samples were filtered through a 33-mm
Millex�-HA syringe filter (Millipore Corporation, Bedford MA)
with a 0.45-mm nominal pore size to remove particulate
matter. The filtrate was acidified to reach a 1% nitric acid
concentration and placed in 15 mL conical polypropylene test
tubes. The samples were spiked with internal standards (45Sc,74Ge, and 103Rh) and stored at 4 �C until analyzed.
2.3. Solid samples collection
72 Solid samples were collected from 20 drinking water utili-
ties. Of those, 26 were hydrant flush solids and 46 were pipe
specimens (including 34 live pipe extractions and 12 boneyard
samples). The hydrant flush samples were obtained during
conventional flushing. They provided an opportunity to assess
the composition of hydraulically-mobile solids released due to
hydraulic disturbances. In contrast with hydrant flush solids,
scale from pipe specimens can be operationally considered as
hydraulically-inert material. Removal and characterization of
scale allow for an assessment of total accumulation of inor-
ganic compounds and contaminants, particularly in cases of
adhering scales that are not susceptible to removal by flush-
ing. Solid samples examined in this study are summarized in
Table 1.
To obtain pipe specimens, deposit material was carefully
removed from the exposed pipe surface. To obtain solids
mobilized during hydrant flush events, a net assembly con-
sisting of twin hydrant nets and/or pantyhose was used to
retain the particulates. All collected solid material was dried
at 103 �C for 24 h andweighed to determine its drymass. In the
case of pipe specimens, a portion of mixed dried sample was
crushed using a mortar and pestle, passed through a number
50 sieve (300-mmmesh) and homogenized. The crushed/sieved
material was digested (as described below) and analyzed to
determine its elemental composition. For selected samples,
subsets of both crushed and uncrushed material were used
examined using X-Ray Diffraction (XRD) and Scanning Elec-
tron Microscopy (SEM) to determine their mineralogy and
morphology.
Determination of the elemental composition was possible
for 35 of 46 pipe specimens and 23 of 26 of hydrant flush solids.
The determination of elemental sulfur and carbon content
was carried out for the subsets of 48 and 36 samples,
respectively.
2.4. Analytical procedures
All digestions of solid sampleswere performed at the EES using
USEPA Method 3050B (Acid Digestion of Sediments, Sludges
and Soils) (U.S.EPA method 3050B). For 58 samples that had
adequatemass for processing, the fraction of samplemass that
was digested by the above procedure ranged from 24 to 96%,
with an average � standard deviation of 78% � 15%
(Supplementary Information Table S1). Aliquots of the digests
were sent to the CEE to determine their elemental composition.
Ten of the solid samples were chosen for morphological
and surface elemental composition using SEM and energy
dispersive spectroscopy (EDS) technique. SEM/EDS measure-
ments were performed with a JEOL-7000F high-resolution
SEM instrument (JEOL Corporation, Japan). EDS data were
acquired in two modes. The first mode allowed examining
the entire surface of the sample, while the second mode
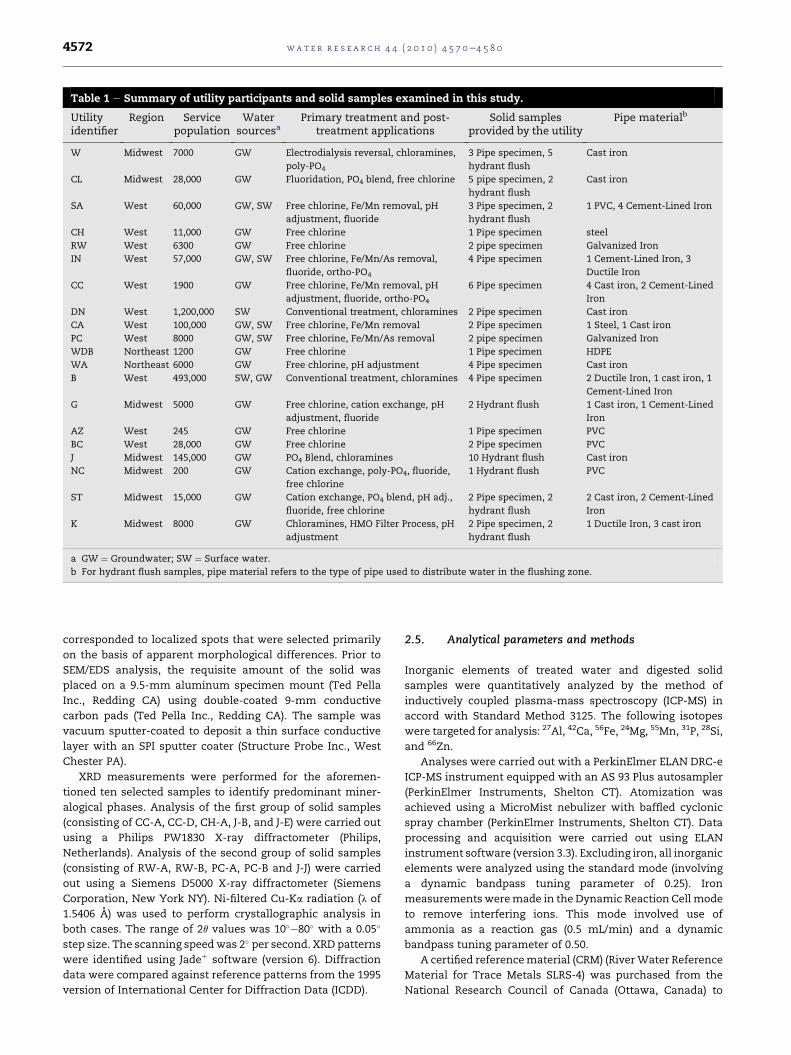
Table 1 e Summary of utility participants and solid samples examined in this study.
Utilityidentifier
Region Servicepopulation
Watersourcesa
Primary treatment and post-treatment applications
Solid samplesprovided by the utility
Pipe materialb
W Midwest 7000 GW Electrodialysis reversal, chloramines,
poly-PO4
3 Pipe specimen, 5
hydrant flush
Cast iron
CL Midwest 28,000 GW Fluoridation, PO4 blend, free chlorine 5 pipe specimen, 2
hydrant flush
Cast iron
SA West 60,000 GW, SW Free chlorine, Fe/Mn removal, pH
adjustment, fluoride
3 Pipe specimen, 2
hydrant flush
1 PVC, 4 Cement-Lined Iron
CH West 11,000 GW Free chlorine 1 Pipe specimen steel
RW West 6300 GW Free chlorine 2 pipe specimen Galvanized Iron
IN West 57,000 GW, SW Free chlorine, Fe/Mn/As removal,
fluoride, ortho-PO4
4 Pipe specimen 1 Cement-Lined Iron, 3
Ductile Iron
CC West 1900 GW Free chlorine, Fe/Mn removal, pH
adjustment, fluoride, ortho-PO4
6 Pipe specimen 4 Cast iron, 2 Cement-Lined
Iron
DN West 1,200,000 SW Conventional treatment, chloramines 2 Pipe specimen Cast iron
CA West 100,000 GW, SW Free chlorine, Fe/Mn removal 2 Pipe specimen 1 Steel, 1 Cast iron
PC West 8000 GW, SW Free chlorine, Fe/Mn/As removal 2 pipe specimen Galvanized Iron
WDB Northeast 1200 GW Free chlorine 1 Pipe specimen HDPE
WA Northeast 6000 GW Free chlorine, pH adjustment 4 Pipe specimen Cast iron
B West 493,000 SW, GW Conventional treatment, chloramines 4 Pipe specimen 2 Ductile Iron, 1 cast iron, 1
Cement-Lined Iron
G Midwest 5000 GW Free chlorine, cation exchange, pH
adjustment, fluoride
2 Hydrant flush 1 Cast iron, 1 Cement-Lined
Iron
AZ West 245 GW Free chlorine 1 Pipe specimen PVC
BC West 28,000 GW Free chlorine 2 Pipe specimen PVC
J Midwest 145,000 GW PO4 Blend, chloramines 10 Hydrant flush Cast iron
NC Midwest 200 GW Cation exchange, poly-PO4, fluoride,
free chlorine
1 Hydrant flush PVC
ST Midwest 15,000 GW Cation exchange, PO4 blend, pH adj.,
fluoride, free chlorine
2 Pipe specimen, 2
hydrant flush
2 Cast iron, 2 Cement-Lined
Iron
K Midwest 8000 GW Chloramines, HMO Filter Process, pH
adjustment
2 Pipe specimen, 2
hydrant flush
1 Ductile Iron, 3 cast iron
a GW ¼ Groundwater; SW ¼ Surface water.
b For hydrant flush samples, pipe material refers to the type of pipe used to distribute water in the flushing zone.
wat e r r e s e a r c h 4 4 ( 2 0 1 0 ) 4 5 7 0e4 5 8 04572
corresponded to localized spots that were selected primarily
on the basis of apparent morphological differences. Prior to
SEM/EDS analysis, the requisite amount of the solid was
placed on a 9.5-mm aluminum specimen mount (Ted Pella
Inc., Redding CA) using double-coated 9-mm conductive
carbon pads (Ted Pella Inc., Redding CA). The sample was
vacuum sputter-coated to deposit a thin surface conductive
layer with an SPI sputter coater (Structure Probe Inc., West
Chester PA).
XRD measurements were performed for the aforemen-
tioned ten selected samples to identify predominant miner-
alogical phases. Analysis of the first group of solid samples
(consisting of CC-A, CC-D, CH-A, J-B, and J-E) were carried out
using a Philips PW1830 X-ray diffractometer (Philips,
Netherlands). Analysis of the second group of solid samples
(consisting of RW-A, RW-B, PC-A, PC-B and J-J) were carried
out using a Siemens D5000 X-ray diffractometer (Siemens
Corporation, New York NY). Ni-filtered Cu-Ka radiation (l of
1.5406 A) was used to perform crystallographic analysis in
both cases. The range of 2q values was 10�e80� with a 0.05�
step size. The scanning speedwas 2� per second. XRD patterns
were identified using Jadeþ software (version 6). Diffraction
data were compared against reference patterns from the 1995
version of International Center for Diffraction Data (ICDD).
2.5. Analytical parameters and methods
Inorganic elements of treated water and digested solid
samples were quantitatively analyzed by the method of
inductively coupled plasma-mass spectroscopy (ICP-MS) in
accord with Standard Method 3125. The following isotopes
were targeted for analysis: 27Al, 42Ca, 56Fe, 24Mg, 55Mn, 31P, 28Si,
and 66Zn.
Analyses were carried out with a PerkinElmer ELAN DRC-e
ICP-MS instrument equipped with an AS 93 Plus autosampler
(PerkinElmer Instruments, Shelton CT). Atomization was
achieved using a MicroMist nebulizer with baffled cyclonic
spray chamber (PerkinElmer Instruments, Shelton CT). Data
processing and acquisition were carried out using ELAN
instrument software (version 3.3). Excluding iron, all inorganic
elements were analyzed using the standard mode (involving
a dynamic bandpass tuning parameter of 0.25). Iron
measurements weremade in the Dynamic Reaction Cell mode
to remove interfering ions. This mode involved use of
ammonia as a reaction gas (0.5 mL/min) and a dynamic
bandpass tuning parameter of 0.50.
A certified referencematerial (CRM) (RiverWater Reference
Material for Trace Metals SLRS-4) was purchased from the
National Research Council of Canada (Ottawa, Canada) to
wat e r r e s e a r c h 4 4 ( 2 0 1 0 ) 4 5 7 0e4 5 8 0 4573
evaluate ICP-MS performance. Results of ICP-MS analysis on
this CRM are summarized in Table S2 in the Supplementary
Information section. On the average, the deviation from
expected values was �3.6% indicating a reasonable level of
accuracy. Recoveries of known additionswere also conducted.
They ranged from 85% to 120%.
Determination of total carbon (TC), total inorganic carbon
(TIC) and total sulfur in crushed undigested samples was
carried at the EPA laboratory in Cincinnati, OH, using a LECO
model CS230 combustion furnace instrument (LECO Corpo-
ration, St. Joseph MI). TIC concentrations were determined by
a modified ASTM D513 method. Total organic carbon (TOC)
was calculated as the difference between TC and TIC values.
3. Results and discussion
3.1. Treated water chemistry
Treated water conditions were ascertained through a combi-
nation of “snapshot” site-specific distribution system
sampling (at locations where solid samples were obtained)
and utility-provided records of entry-point and system
monitoring results (Friedman et al., 2010). The compilation of
distribution systemwater quality observations for each utility
and sample site is provided in Table 2. It should be noted that
the water quality conditions reported here reflect only the
data obtained from either the water sampling performed
specifically for this study or utility-provided water quality
data representing entry-point sampling.
Of the 20 utility participants, 17 utility participants had Fe
concentrations at or above 0.06 mg/L (i.e., 20% of the
secondary MCL) in entry-point and/or distribution system
water samples. The median iron concentration in the treated
water at sampling locations was 0.25 mg/L. A total of 11 utility
participants reported and/or were found to have manganese
present at concentrations exceeding 0.01 mg/L (i.e., 20% of the
secondary MCL) in entry-point and/or distribution system
water samples; however, the median Mn concentration in
treated water at sampling locations was only 0.5 mg/L. Six
utilities had dedicated iron and/or manganese removal
processes (e.g., greensand filtration, permanganate-enhanced
direct filtration, hydrous manganese oxide (HMO) filtration
process) at problem sources. Five utilities used polyphosphate
(either alone or as part of an ortho/poly blend) to sequester the
soluble, reduced forms of these metals and/or to prevent
excessive calcite precipitation.
3.2. Morphological examination of corrosion scales
Themorphological properties of selected samples of corrosion
scales were examined using SEM/EDS and XRD. The examined
samples typically lacked morphologically significant features
(Supplementary Information Fig. S1). EDS analysis indicated
that most frequently detected elements found on the surfaces
were Fe, O, C, Si, S and Ca.
XRD showed that goethite (a-FeOOH), magnetite (Fe3O4)
and siderite (FeCO3) weremajor phases present in the samples
(Table 3). This observation was in accordance with the find-
ings of Sarin et al. (2001) and Barkatt et al., 2009. Calcite CaCO3
was identified in the hydrant flush samples, which may be
indicative of its precipitation from the bulk distributed water.
Quartz SiO2 was also frequently found. Its presence may be
attributed to carryover from the source water or as treatment
breakthrough. Hydroxyapatite Ca5(PO4)3(OH) was observed in
cases where the utility applied orthophosphate or phosphate
blend to control corrosion. It should be noted that while the
possibility of the presence of some artifacts caused by sample
processing (partial conversion of Fe(II) to Fe(III) caused by
drying, Sarin et al., 2001) cannot be ruled out, XRD charac-
terization of the samples used in this study provides an
important insight into the nature of prevalent solid phases
formed in drinking water distribution systems (Borch et al.,
2008; Gerke et al., 2008).
3.3. Deposit composition-common matrix elements
The elemental composition of DWDS samples is discussed
below in the context of the occurrence of the common matrix
elements, notably iron, sulfur, total organic carbon (TOC),
calcium, inorganic carbon (TIC), phosphorous, manganese,
magnesium, aluminum and zinc. This combination of major
matrix components was determined based on the approach
developed in our recently completed study undertaken under
the auspices of Water Research Federation (Friedman et al.,
2010). The data for silicon (Si) will not be considered since
that element was not necessarily dissolved during the diges-
tion procedure employed in this work.
Since statistical analysis of the data showed that the
concentrations of these elements were not normally distrib-
uted (Friedman et al., 2010), the results at selected percentiles
(e.g., median) are emphasized over average values and stan-
dard deviations. Table 4 provides a statistical summary of the
concentrations of common elements constituting the solids.
In most cases, the reporting units are micrograms of element
per gram of deposit (mg/g), or parts-per-million. When the
median result for a given element exceeds 10,000 mg/g, the
results are presented as weight percent (wt%). For reference,
10,000 mg/g is equivalent to 1.0 wt%.
61% and 83% of Samples processed in this study were pipe
specimens and hydrant flush solids, respectively, formed on
unlined cast iron. Thus, the data reported here are more
representative of drinking water distribution systems in
which unlined cast iron pipes predominate over other pipe
materials.
3.3.1. IronIron (Fe) was the most prevalent inorganic constituent in
practically all samples. Thirty three of the 35 pipe specimens
that contained enoughmass for processing were composed of
unlined iron or steel, and 19 of 23 hydrant flush samples that
contained enough mass were obtained from unlined iron
pipes. The median Fe concentration was 31.7 wt% and the
10th and 90th percentile Fe concentration were 11.8 wt% and
40.6 wt%, respectively. This was in agreement with the XRD
data confirming the prominence of goethite a-FeOOH,
magnetite Fe3O4, siderite FeCO3 and in some cases troilite FeS.
Fig. 1(a) illustrates the cumulative iron occurrence profiles for
all deposit samples and the different sample types (pipe
specimens or hydrant flush solids). The Fe percentile profiles
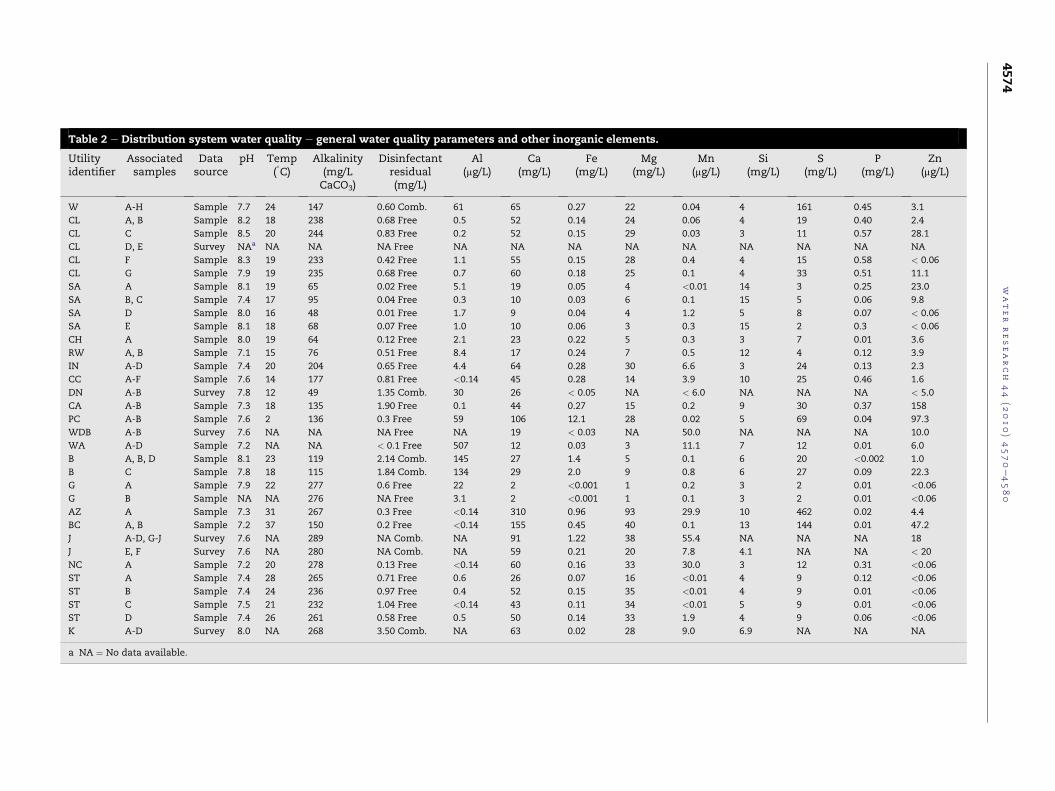
Table 2 e Distribution system water quality e general water quality parameters and other inorganic elements.
Utilityidentifier
Associatedsamples
Datasource
pH Temp(�C)
Alkalinity(mg/LCaCO3)
Disinfectantresidual(mg/L)
Al(mg/L)
Ca(mg/L)
Fe(mg/L)
Mg(mg/L)
Mn(mg/L)
Si(mg/L)
S(mg/L)
P(mg/L)
Zn(mg/L)
W A-H Sample 7.7 24 147 0.60 Comb. 61 65 0.27 22 0.04 4 161 0.45 3.1
CL A, B Sample 8.2 18 238 0.68 Free 0.5 52 0.14 24 0.06 4 19 0.40 2.4
CL C Sample 8.5 20 244 0.83 Free 0.2 52 0.15 29 0.03 3 11 0.57 28.1
CL D, E Survey NAa NA NA NA Free NA NA NA NA NA NA NA NA NA
CL F Sample 8.3 19 233 0.42 Free 1.1 55 0.15 28 0.4 4 15 0.58 < 0.06
CL G Sample 7.9 19 235 0.68 Free 0.7 60 0.18 25 0.1 4 33 0.51 11.1
SA A Sample 8.1 19 65 0.02 Free 5.1 19 0.05 4 <0.01 14 3 0.25 23.0
SA B, C Sample 7.4 17 95 0.04 Free 0.3 10 0.03 6 0.1 15 5 0.06 9.8
SA D Sample 8.0 16 48 0.01 Free 1.7 9 0.04 4 1.2 5 8 0.07 < 0.06
SA E Sample 8.1 18 68 0.07 Free 1.0 10 0.06 3 0.3 15 2 0.3 < 0.06
CH A Sample 8.0 19 64 0.12 Free 2.1 23 0.22 5 0.3 3 7 0.01 3.6
RW A, B Sample 7.1 15 76 0.51 Free 8.4 17 0.24 7 0.5 12 4 0.12 3.9
IN A-D Sample 7.4 20 204 0.65 Free 4.4 64 0.28 30 6.6 3 24 0.13 2.3
CC A-F Sample 7.6 14 177 0.81 Free <0.14 45 0.28 14 3.9 10 25 0.46 1.6
DN A-B Survey 7.8 12 49 1.35 Comb. 30 26 < 0.05 NA < 6.0 NA NA NA < 5.0
CA A-B Sample 7.3 18 135 1.90 Free 0.1 44 0.27 15 0.2 9 30 0.37 158
PC A-B Sample 7.6 2 136 0.3 Free 59 106 12.1 28 0.02 5 69 0.04 97.3
WDB A-B Survey 7.6 NA NA NA Free NA 19 < 0.03 NA 50.0 NA NA NA 10.0
WA A-D Sample 7.2 NA NA < 0.1 Free 507 12 0.03 3 11.1 7 12 0.01 6.0
B A, B, D Sample 8.1 23 119 2.14 Comb. 145 27 1.4 5 0.1 6 20 <0.002 1.0
B C Sample 7.8 18 115 1.84 Comb. 134 29 2.0 9 0.8 6 27 0.09 22.3
G A Sample 7.9 22 277 0.6 Free 22 2 <0.001 1 0.2 3 2 0.01 <0.06
G B Sample NA NA 276 NA Free 3.1 2 <0.001 1 0.1 3 2 0.01 <0.06
AZ A Sample 7.3 31 267 0.3 Free <0.14 310 0.96 93 29.9 10 462 0.02 4.4
BC A, B Sample 7.2 37 150 0.2 Free <0.14 155 0.45 40 0.1 13 144 0.01 47.2
J A-D, G-J Survey 7.6 NA 289 NA Comb. NA 91 1.22 38 55.4 NA NA NA 18
J E, F Survey 7.6 NA 280 NA Comb. NA 59 0.21 20 7.8 4.1 NA NA < 20
NC A Sample 7.2 20 278 0.13 Free <0.14 60 0.16 33 30.0 3 12 0.31 <0.06
ST A Sample 7.4 28 265 0.71 Free 0.6 26 0.07 16 <0.01 4 9 0.12 <0.06
ST B Sample 7.4 24 236 0.97 Free 0.4 52 0.15 35 <0.01 4 9 0.01 <0.06
ST C Sample 7.5 21 232 1.04 Free <0.14 43 0.11 34 <0.01 5 9 0.01 <0.06
ST D Sample 7.4 26 261 0.58 Free 0.5 50 0.14 33 1.9 4 9 0.06 <0.06
K A-D Survey 8.0 NA 268 3.50 Comb. NA 63 0.02 28 9.0 6.9 NA NA NA
a NA ¼ No data available.
water
research
44
(2010)4570e4580
4574
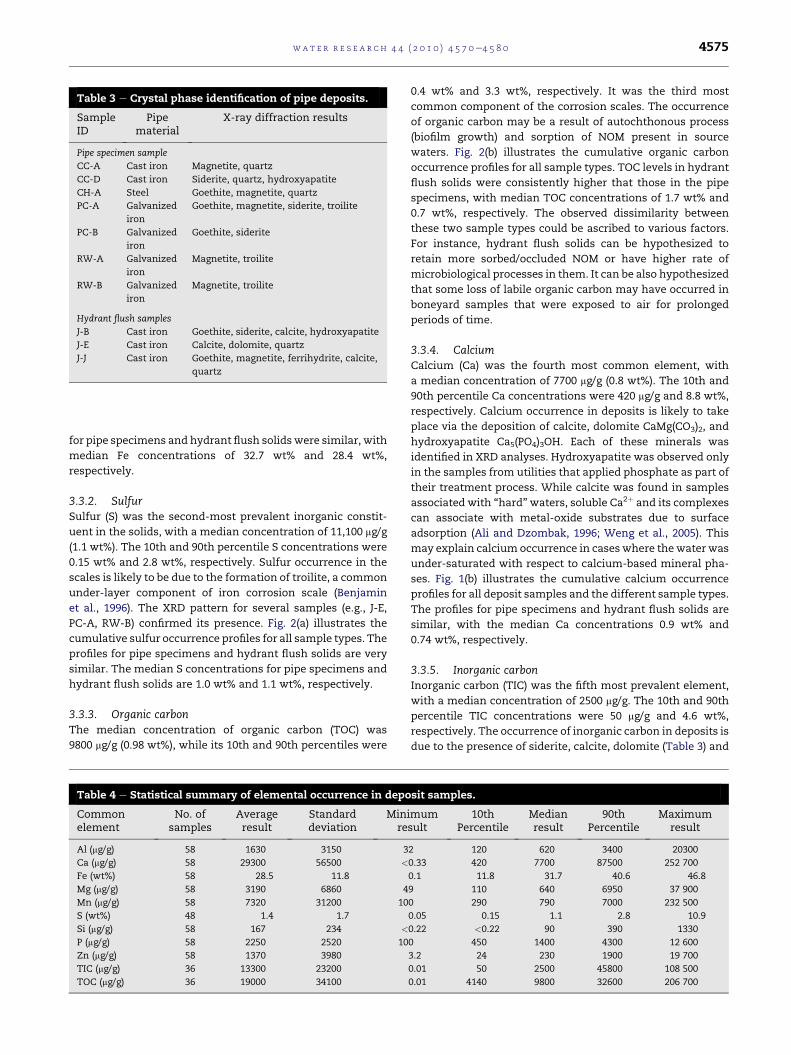
Table 3 e Crystal phase identification of pipe deposits.
SampleID
Pipematerial
X-ray diffraction results
Pipe specimen sample
CC-A Cast iron Magnetite, quartz
CC-D Cast iron Siderite, quartz, hydroxyapatite
CH-A Steel Goethite, magnetite, quartz
PC-A Galvanized
iron
Goethite, magnetite, siderite, troilite
PC-B Galvanized
iron
Goethite, siderite
RW-A Galvanized
iron
Magnetite, troilite
RW-B Galvanized
iron
Magnetite, troilite
Hydrant flush samples
J-B Cast iron Goethite, siderite, calcite, hydroxyapatite
J-E Cast iron Calcite, dolomite, quartz
J-J Cast iron Goethite, magnetite, ferrihydrite, calcite,
quartz
wat e r r e s e a r c h 4 4 ( 2 0 1 0 ) 4 5 7 0e4 5 8 0 4575
for pipe specimens and hydrant flush solidswere similar, with
median Fe concentrations of 32.7 wt% and 28.4 wt%,
respectively.
3.3.2. SulfurSulfur (S) was the second-most prevalent inorganic constit-
uent in the solids, with a median concentration of 11,100 mg/g
(1.1 wt%). The 10th and 90th percentile S concentrations were
0.15 wt% and 2.8 wt%, respectively. Sulfur occurrence in the
scales is likely to be due to the formation of troilite, a common
under-layer component of iron corrosion scale (Benjamin
et al., 1996). The XRD pattern for several samples (e.g., J-E,
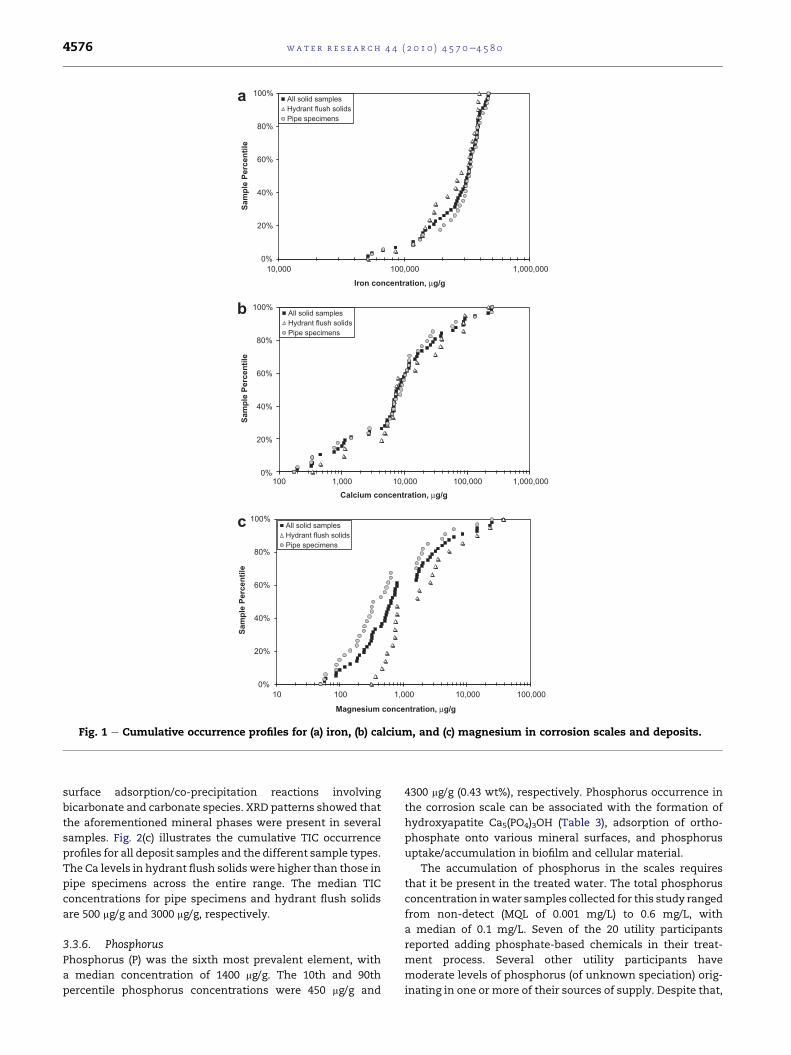
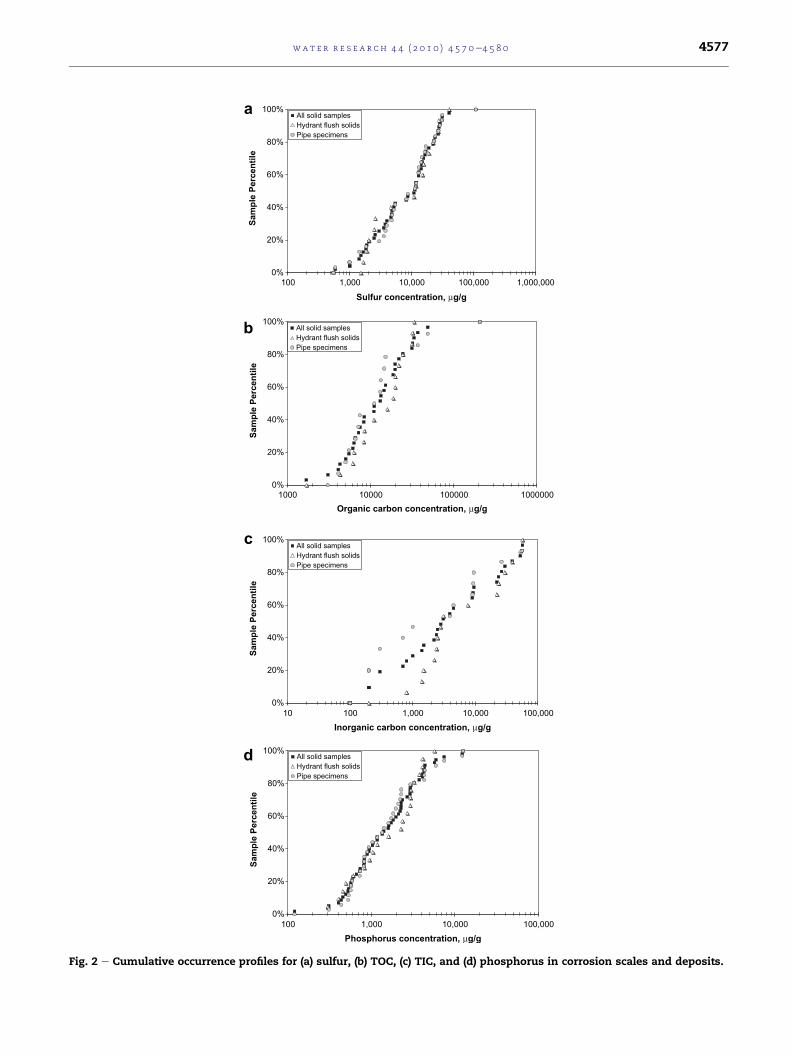
PC-A, RW-B) confirmed its presence. Fig. 2(a) illustrates the
cumulative sulfur occurrence profiles for all sample types. The
profiles for pipe specimens and hydrant flush solids are very
similar. The median S concentrations for pipe specimens and
hydrant flush solids are 1.0 wt% and 1.1 wt%, respectively.
3.3.3. Organic carbonThe median concentration of organic carbon (TOC) was
9800 mg/g (0.98 wt%), while its 10th and 90th percentiles were
Table 4 e Statistical summary of elemental occurrence in depo
Commonelement
No. ofsamples
Averageresult
Standarddeviation
Minire
Al (mg/g) 58 1630 3150 3
Ca (mg/g) 58 29300 56500 <
Fe (wt%) 58 28.5 11.8
Mg (mg/g) 58 3190 6860 4
Mn (mg/g) 58 7320 31200 10
S (wt%) 48 1.4 1.7
Si (mg/g) 58 167 234 <
P (mg/g) 58 2250 2520 10
Zn (mg/g) 58 1370 3980
TIC (mg/g) 36 13300 23200
TOC (mg/g) 36 19000 34100
0.4 wt% and 3.3 wt%, respectively. It was the third most
common component of the corrosion scales. The occurrence
of organic carbon may be a result of autochthonous process
(biofilm growth) and sorption of NOM present in source
waters. Fig. 2(b) illustrates the cumulative organic carbon
occurrence profiles for all sample types. TOC levels in hydrant
flush solids were consistently higher that those in the pipe
specimens, with median TOC concentrations of 1.7 wt% and
0.7 wt%, respectively. The observed dissimilarity between
these two sample types could be ascribed to various factors.
For instance, hydrant flush solids can be hypothesized to
retain more sorbed/occluded NOM or have higher rate of
microbiological processes in them. It can be also hypothesized
that some loss of labile organic carbon may have occurred in
boneyard samples that were exposed to air for prolonged
periods of time.
3.3.4. CalciumCalcium (Ca) was the fourth most common element, with
a median concentration of 7700 mg/g (0.8 wt%). The 10th and
90th percentile Ca concentrations were 420 mg/g and 8.8 wt%,
respectively. Calcium occurrence in deposits is likely to take
place via the deposition of calcite, dolomite CaMg(CO3)2, and
hydroxyapatite Ca5(PO4)3OH. Each of these minerals was
identified in XRD analyses. Hydroxyapatite was observed only
in the samples from utilities that applied phosphate as part of
their treatment process. While calcite was found in samples
associated with “hard” waters, soluble Ca2þ and its complexes
can associate with metal-oxide substrates due to surface
adsorption (Ali and Dzombak, 1996; Weng et al., 2005). This
may explain calcium occurrence in caseswhere thewater was
under-saturated with respect to calcium-based mineral pha-
ses. Fig. 1(b) illustrates the cumulative calcium occurrence
profiles for all deposit samples and the different sample types.
The profiles for pipe specimens and hydrant flush solids are
similar, with the median Ca concentrations 0.9 wt% and
0.74 wt%, respectively.
3.3.5. Inorganic carbonInorganic carbon (TIC) was the fifth most prevalent element,
with a median concentration of 2500 mg/g. The 10th and 90th
percentile TIC concentrations were 50 mg/g and 4.6 wt%,
respectively. The occurrence of inorganic carbon in deposits is
due to the presence of siderite, calcite, dolomite (Table 3) and
sit samples.
mumsult
10thPercentile
Medianresult
90thPercentile
Maximumresult
2 120 620 3400 20300
0.33 420 7700 87500 252 700
0.1 11.8 31.7 40.6 46.8
9 110 640 6950 37 900
0 290 790 7000 232 500
0.05 0.15 1.1 2.8 10.9
0.22 <0.22 90 390 1330
0 450 1400 4300 12 600
3.2 24 230 1900 19 700
0.01 50 2500 45800 108 500
0.01 4140 9800 32600 206 700
10 100 1,000 10,000 100,000
Magnesium concentration, µg/g
All solid samplesHydrant flush solidsPipe specimens
100 1,000 10,000 100,000 1,000,000Calcium concentration, µg/g
All solid samplesHydrant flush solidsPipe specimens
a
b
c
0%
20%
40%
60%
80%
100%
0%
20%
40%
60%
80%
100%
10,000 100,000 1,000,000
Iron concentration, µg/g
Sam
ple P
ercen
tile
Sam
ple P
ercen
tile
0%
20%
40%
60%
80%
100%
Sam
ple P
ercen
tile
All solid samplesHydrant flush solidsPipe specimens
Fig. 1 e Cumulative occurrence profiles for (a) iron, (b) calcium, and (c) magnesium in corrosion scales and deposits.
wat e r r e s e a r c h 4 4 ( 2 0 1 0 ) 4 5 7 0e4 5 8 04576
surface adsorption/co-precipitation reactions involving
bicarbonate and carbonate species. XRD patterns showed that
the aforementioned mineral phases were present in several
samples. Fig. 2(c) illustrates the cumulative TIC occurrence
profiles for all deposit samples and the different sample types.
The Ca levels in hydrant flush solids were higher than those in
pipe specimens across the entire range. The median TIC
concentrations for pipe specimens and hydrant flush solids
are 500 mg/g and 3000 mg/g, respectively.
3.3.6. PhosphorusPhosphorus (P) was the sixth most prevalent element, with
a median concentration of 1400 mg/g. The 10th and 90th
percentile phosphorus concentrations were 450 mg/g and
4300 mg/g (0.43 wt%), respectively. Phosphorus occurrence in
the corrosion scale can be associated with the formation of
hydroxyapatite Ca5(PO4)3OH (Table 3), adsorption of ortho-
phosphate onto various mineral surfaces, and phosphorus
uptake/accumulation in biofilm and cellular material.
The accumulation of phosphorus in the scales requires
that it be present in the treated water. The total phosphorus
concentration inwater samples collected for this study ranged
from non-detect (MQL of 0.001 mg/L) to 0.6 mg/L, with
a median of 0.1 mg/L. Seven of the 20 utility participants
reported adding phosphate-based chemicals in their treat-
ment process. Several other utility participants have
moderate levels of phosphorus (of unknown speciation) orig-
inating in one or more of their sources of supply. Despite that,
0%
20%
40%
60%
80%
100%
100 1,000 10,000 100,000 1,000,000
Sulfur concentration, g/g
eli
tn
ec
re
Pel
pm
aS
All solid samplesHydrant flush solidsPipe specimens
0%
20%
40%
60%
80%
100%
1000 10000 100000 1000000Organic carbon concentration, g/g
eli
tn
ec
re
Pel
pm
aS
All solid samplesHydrant flush solidsPipe specimens
0%
20%
40%
60%
80%
100%
10 100 1,000 10,000 100,000Inorganic carbon concentration, g/g
eli
tn
ec
re
Pel
pm
aS
All solid samplesHydrant flush solidsPipe specimens
0%
20%
40%
60%
80%
100%
100 1,000 10,000 100,000Phosphorus concentration, g/g
eli
tn
ec
re
Pel
pm
aS
All solid samplesHydrant flush solidsPipe specimens
b
c
d
a
Fig. 2 e Cumulative occurrence profiles for (a) sulfur, (b) TOC, (c) TIC, and (d) phosphorus in corrosion scales and deposits.
wat e r r e s e a r c h 4 4 ( 2 0 1 0 ) 4 5 7 0e4 5 8 0 4577
wat e r r e s e a r c h 4 4 ( 2 0 1 0 ) 4 5 7 0e4 5 8 04578
little correlation between phosphorus levels in water and
solids was observed (Supplementary Information Fig. S2).
Fig. 2(d) illustrates the cumulative phosphorus occurrence.
The profiles for pipe specimens and hydrant flush solids are
similar. The median phosphorus concentrations for pipe
specimens and hydrant flush solids are 1360 mg/g and 1600 mg/
g, respectively.
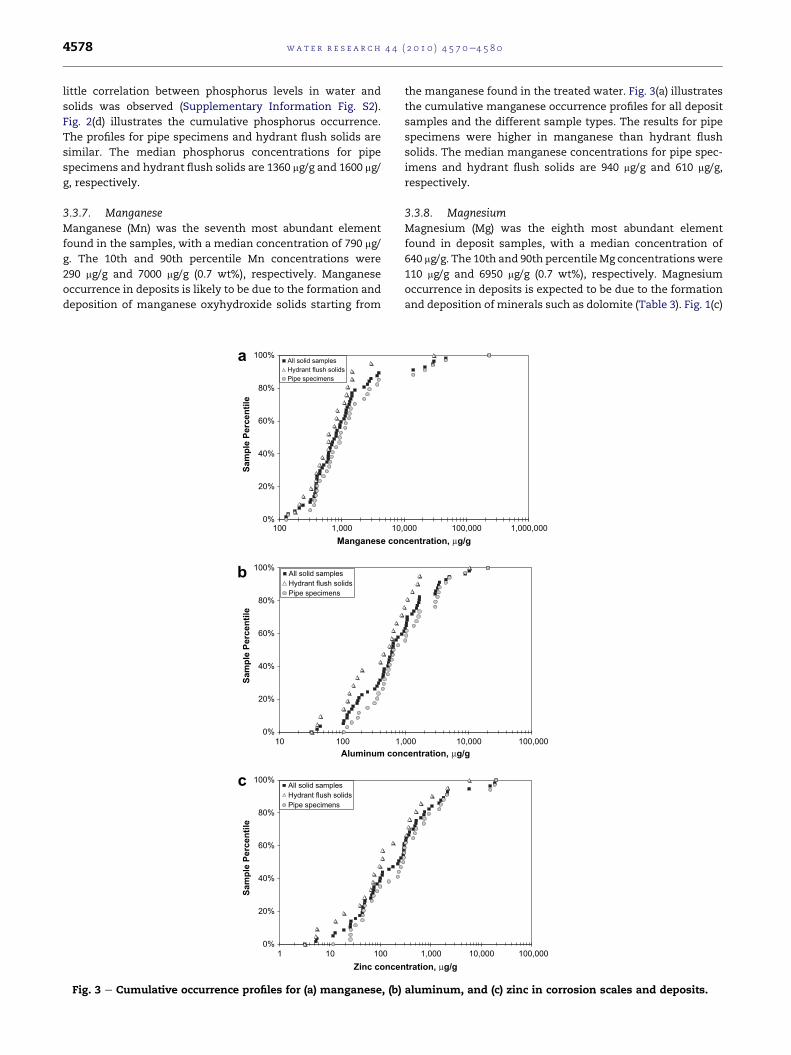
3.3.7. ManganeseManganese (Mn) was the seventh most abundant element
found in the samples, with a median concentration of 790 mg/
g. The 10th and 90th percentile Mn concentrations were
290 mg/g and 7000 mg/g (0.7 wt%), respectively. Manganese
occurrence in deposits is likely to be due to the formation and
deposition of manganese oxyhydroxide solids starting from
0%
20%
40%
60%
80%
100%
Aluminum con
eli
tn
ec
re
Pe
lp
ma
S
All solid samplesHydrant flush solidsPipe specimens
0%
20%
40%
60%
80%
100%
100 1,000 10Manganese con
el
it
ne
cr
eP
el
pm
aS
All solid samplesHydrant flush solidsPipe specimens
0%
20%
40%
60%
80%
100%
10 100 1,
1 10 100Zinc conce
el
it
ne
cr
eP
el
pm
aS
All solid samplesHydrant flush solidsPipe specimens
c
b
a
Fig. 3 e Cumulative occurrence profiles for (a) manganese, (b)
the manganese found in the treated water. Fig. 3(a) illustrates
the cumulative manganese occurrence profiles for all deposit
samples and the different sample types. The results for pipe
specimens were higher in manganese than hydrant flush
solids. The median manganese concentrations for pipe spec-
imens and hydrant flush solids are 940 mg/g and 610 mg/g,
respectively.
3.3.8. MagnesiumMagnesium (Mg) was the eighth most abundant element
found in deposit samples, with a median concentration of
640 mg/g. The 10th and 90th percentile Mg concentrationswere
110 mg/g and 6950 mg/g (0.7 wt%), respectively. Magnesium
occurrence in deposits is expected to be due to the formation
and deposition of minerals such as dolomite (Table 3). Fig. 1(c)
centration, g/g
,000 100,000 1,000,000centration, g/g
000 10,000 100,000
1,000 10,000 100,000ntration, g/g
aluminum, and (c) zinc in corrosion scales and deposits.
wat e r r e s e a r c h 4 4 ( 2 0 1 0 ) 4 5 7 0e4 5 8 0 4579
illustrates the cumulative magnesium occurrence profiles.
The results for hydrant flush solids were higher than pipe
specimens, with the median Mg concentrations 800 mg/g and
340 mg/g, respectively.
3.3.9. AluminumAluminum (Al) was the ninthmost common element found in
deposit samples, with amedian concentration of 620 mg/g. The
10th and 90th percentile aluminum concentrations were
120 mg/g and 3400 mg/g, respectively. Aluminum presence in
deposits canbedue to thedepositionof aluminaAl2O3, gibbsite
Al(OH)3, precipitationof amorphousaluminumhydroxide, and
formation of aluminosilicates. Surface adsorption/co-precipi-
tation reactions involving freeAl3þ and its complexesmay also
account for its occurrence. Sources of aluminum may include
the treated water, either due to natural occurrence in source
water and/or the application and treatment “breakthrough” of
aluminum-based coagulants. Fig. 3(b) illustrates the cumula-
tive aluminumoccurrence profiles for all samples. The profiles
for pipe specimens and hydrant flush solids are dissimilar,
with the Al levels in pipe specimens being higher across the
entire range. ThemedianAl concentrations for pipe specimens
andhydrantflush solids are 640 mg/g and555 mg/g, respectively.
3.3.10. ZincZinc (Zn) was the tenth most abundant element found in
deposit samples, with amedian concentration of 230 mg/g. The
10th and 90th percentile zinc concentrations were 24 mg/g and
1900 mg/g, respectively. Sources of zinc may include the
treated water, either due to natural occurrence in source
water, applications of zinc orthophosphate and “inner” sour-
ces such as its presence as in galvanized pipe and as
a component in copper-based alloys. Internal corrosion of
galvanized iron piping appears to be the primary source of
zinc in many samples. Indeed, comparison between cast iron
and galvanized iron specimens showed that Zn concentration
was much higher in the latter case, with median Zn concen-
trations being 185 mg/g and 8422.5 mg/g (Supplementary
Information Table S2). Fig. 3(c) illustrates the cumulative Zn
occurrence profiles for all deposit samples and the different
sample types. The profiles for pipe specimens and hydrant
flush solids are dissimilar, with the results for pipe specimens
being higher across the entire range. The median zinc
concentrations for pipe specimens and hydrant flush solids
are 290 mg/g and 110 mg/g, respectively.
4. Conclusions
Characteristics of corrosion scales formed in drinking water
distribution systems predominated by unlined cast iron pipes
and deposits mobilized during hydrant flushing events were
determined using SEM/EDS, XRD and ICP/MS. XRD data
showed that goethite (a-FeOOH), magnetite (Fe3O4) and
siderite (FeCO3) were the primary crystalline phases identi-
fied in most of the samples. Among the major constituent
elements of the scales, iron was most prevalent by a consid-
erable margin, followed, in the order of decreasing preva-
lence, by sulfur, organic carbon, calcium, inorganic carbon,
phosphorus, manganese, magnesium, aluminum and zinc.
The nature of relatively abundant organic carbon found in
the scales remains to be determined. The cumulative occur-
rence profiles of iron, sulfur, calcium and phosphorus for
pipe specimens and hydrant flush solids were similar. For
TOC, TIC and magnesium, the cumulative occurrence profiles
showed that hydrant flush solids have consistently higher
levels of these components compared with pipe specimens.
On the other hand, the cumulative occurrence profiles for
manganese, aluminum and zinc indicated that pipe speci-
mens tended to have higher concentrations of these
elements than hydrant flush solids. Comparison of relative
occurrences of these elements indicates that hydraulic
disturbances may have relatively less impact on the release
of manganese, aluminum and zinc. However, observations
concerning differences of concentrations of selected
elements in pipe specimens and hydrant flush solids need to
be confirmed in further exploration of hydraulically immobile
and mobile solids originating from the same systems. Zinc
concentrations in the scales formed on galvanized iron were
much higher than those formed on cast iron, with internal
corrosion suspected of being the major sources of zinc in the
former case.
Acknowledgments
This study was supported by Water Research Foundation
(Project Number 3118) and the USEPA. The authors would like
to thank the WRF project manager Dr. Jian Zhang and the
personnel of the EPA laboratory, Cincinnati, OH for carrying
out analyses for carbon and sulfur in solid samples. The
content and conclusions are the views of the authors and do
no necessarily reflect the views of the funding agency.
Appendix. Supplementary data
The supplementary data associated with this article can
be found in the on-line version at doi:10.1016/j.watres.
2010.05.043.
r e f e r e n c e s
Ali, M.A., Dzombak, D.A., 1996. Effects of simple organic acids onsorption of Cu2þ and Ca2þ on goethite. Geochimica etCosmochimica Acta 60 (2), 291e304.
U.S. EPA method 3050B, Acid digestion of sediments, sludges andsoils. http://www.epa.gov/waste/hazard/testmethods/sw846/pdfs/3050b.pdf.
Barkatt, A., Pulvirenti, A.L., Adel-Hadadi, M.A., Viragh, C.,Senftle, F.E., Thorpe, A.N., Grant, G.R., 2009. Composition andparticle size of superparamagnetic corrosion products in tapwater. Water Research 43 (13), 3319e3325.
Benjamin, M.M., Sontheimer, H., Leroy, P., 1996. Corrosion of Ironand Steel. In Internal Corrosion of Water DistributionSystems. Cooperative Research Report. AWWA ResearchFoundation, Denver, CO, pp. 29e70.
wat e r r e s e a r c h 4 4 ( 2 0 1 0 ) 4 5 7 0e4 5 8 04580
Borch, T., Camper, A.K., Biederman, J.A., Butterfield, P.W.,Gerlach, R., Amonette, J.E., 2008. Evaluation ofcharacterization techniques for iron pipe corrosion productsand iron oxide thin films. Journal of EnvironmentalEngineering-ASCE 134 (10), 835e844.
Cances, B., Juillot, F., Morin, G., Laperche, V., Alvarez, L., Proux, O.,Hazemann, J.-L., Brown Jr., G.E., Calas, G., 2005. XAS evidence ofAs(V) association with iron oxyhydroxides in a contaminatedsoil at a former arsenical pesticide processing plant.Environmental Science & Technology 39 (24), 9398e9405.
Fendorf, S., Eick, M.J., Grossl, P., Sparks, D.L., 1997. Arsenate andchromate retention on goethite: I. Surface structure.Environmental Science & Technology 31 (2), 315e320.
Friedman, M.J., Hill, A.S., Reiber, S.H., Valentine, R.L., Larsen, G.,Young, A., Korshin, G.V., Peng, C.-Y., 2010. Assessment ofInorganics Accumulation in Drinking Water System Scalesand Sediments. Water Research Foundation, Denver, CO.
Gerke, T.L., Maynard, J.B., Schock, M.R., Lytle, D.L., 2008.Physiochemical characterization of five iron tubercles froma single drinking water distribution system: possible newinsights on their formation and growth. Corrosion Science 50(7), 2030e2039.
Gerke, T.L., Scheckel, K.G., Schock, M.R., 2009. Identification anddistribution of vanadinite (Pb5(V
5þO4)3Cl) in lead pipecorrosion by-products. Environmental Science & Technology43 (12), 4412e4418.
Gray, C.W., McLaren, R.G., Roberts, A.H.C., Condron, L.M., 1999.Solubility, sorption and desorption of native and addedcadmium in relation to properties of soils in New Zealand.European Journal of Soil Science 50 (1), 127e137.
Korshin, G.V., Ferguson, J.F., Perry, S., 1996. Influence of naturalorganicmatter oncorrosionof copper inpotablewaters. Journalof the American Water Works Association 88 (7), 36e47.
Larsen, F., Postma, D., 1997. Nickel mobilization in a groundwaterwell field: release by pyrite oxidation and desorption frommanganese oxides. Environmental Science & Technology 31(9), 2589e2595.
Lytle, D.A., Sorg, T.J., Frietch, C., 2004. Accumulation of arsenic indrinking water distribution systems. Environmental Science &Technology 38 (20), 5365e5372.
Nelson, Y.M., Lo, W., Lion, L.W., Shuler, M.L., Ghiorse, W.C., 1995.Lead distribution in a simulated aquatic environment: effectsof bacterial biofilms and iron oxide. Water Research 29 (8),1934e1944.
O’Reilly, S.E., Strawn, D.G., Sparks, D.L., 2001. Residence timeeffects on arsenate adsorption/desorption mechanisms ongoethite. Soil Science Society of America Journal 65 (1), 67e77.
Reiber, S., Dostal, G., 2000. Well water disinfection sparkssurprises. Opflow 26 (3), 1e6.
Sarin, P., Snoeyink, V.L., Bebee, J., Kriven, W.M., Clement, J.A.,2001. Physico-chemical characteristics of corrosion scales inold iron pipes. Water Research 35 (12), 2961e2969.
Schock, M.R., Hyland, R., Welch, M., 2008. Occurrence ofcontaminant accumulation in lead pipe scales from domesticdrinking water distribution systems. Environmental Science &Technology 42 (12), 4285e4291.
Sugiyama, M., Hori, T., Kihara, S., Matsui, M., 1992. A geochemicalstudy on the specific distribution of barium in lake Biwa,Japan. Geochimica et Cosmochimica Acta 56 (2), 597e605.
Teng, F., Guan, Y.T., Zhu, W.P., 2008. Effect of biofilm on castiron pipe corrosion in drinking water distribution system:corrosion scales characterization and microbial communitystructure investigation. Corrosion Science 50 (10),2816e2823.
Trived, P., Axe, L., Tyson, T.A., 2001. XAS studies of Ni and Znsorbed to hydrous manganese oxide. Environmental Science &Technology 35 (22), 4515e4521.
Tuovinen, O.H., Button, K.S., Vuorinen, A., Carlson, L., Mair, D.M.,Yut, L.A., 1980. Bacterial, chemical, and mineralogicalcharacteristics of tubercles in distribution system pipelines.Journal of the American Water Works Association 72 (11),626e635.
Vazquez, F.A., Heaviside, R., Tang, Z., Taylor, J.S., 2006. Effect offree chlorine and chloramines on lead release in a distributionsystem. Journal of the American Water Works Association 98(2), 144e154.
Weng, L.P., Koopal, L.K., Hiemstra, T., Meeussen, J.C.L., VanRiemsdijk, W.H., 2005. Interactions of calcium and fulvic acidat the goethiteewater interface. Geochimica et CosmochimicaActa 69 (2), 325e339.