anal. chem. 1988, 60, 1459-1467 ellipsometric...
TRANSCRIPT
Anal. Chem. 1988, 60, 1459-1467 1459
Ellipsometric, Electrochemical, and Elemental Characterization of the Surface Phase Produced on Glassy Carbon Electrodes by Electrochemical Activation
L a r r y J. Kepley and Allen J. Bard*
Department of Chemistry, T h e University of Texas, Austin, Texas 78712
Ellipsometry was used to monitor the In situ growth of a fllm on a glassy carbon electrode, whlch was electrochemlcally anodized at 1.8 V In 0.1 M H,SO,. The layer grew contlnu- ously In an uninhlblted fashion wlth constant optical constants to a thlckness of at least 925 nm. I t was nearly transparent at wavelengths of 545 and 632.8 nm. X-ray and elemental analysls of bulk quantltles of the phase Indicate that It Is an amorphous form of graphlte oxlde. Comblned elllpsometrlc and electrochemical measurements show that the phase ac- tivates the surface and that deactivation occurs upon ex- tennslve reductlon of the layer. The electrode actlvlty, as monitored by the voltammetrlc response In dilute solutlons of catechol, hydroquhne, and 2,3-dlcyanohydroqulnone, varled wlth the extent of reductlon of the layer.
Surface treatments have been used extensively to improve the electrochemical performance of several types of carbon electrodes: vitreous (glassy) carbon (1-7), pyrolytic graphite @-IO), carbon paste (11,12), carbon fibers (13,14). Surface activation has been accomplished by chemical oxidation with chromic acid ( I , 9), exposure to an rf plasma in an oxygen atmosphere (IO), heat treatment (15,16), exposure to strong laser light pulses (17), and electrochemical anodization (1-8, 12-14). The studies described here were undertaken to obtain additional information about the nature of the surface changes that occur upon anodic activation of carbon. We describe in situ ellipsometric measurements, as well as ex situ charac- terization by X-ray powder diffraction and elemental analysis of the phase that forms during activation. To our knowledge no previous ellipsometric studies of carbon activation have appeared.
Evidence for increased surface oxygen concentration upon activation (4,6,18-23) has prompted investigators to propose that activation results from electron transfer mediation by oxygen-containing groups such as phenolic, quinoidal, and carboxyl functionalities (5, 10, 24, 25). Surface waves in current-potential curves with graphite electrodes (20-23) have been attributed to the oxidation/reduction of hydro- quinone/quinonelike surface groups, and similar waves for glassy carbon (GC) were attributed to a surface group and chemisorbed oxygen (18,19). Other evidence indicates the removal of surface impurities can be important (4,7,11). The large increase in double-layer charging that occurs with ac- tivation of the GC surface ( I ) was not attributed to an increase in macroscopic surface area (5, 6), although an increased microscopic surface area or heavy functionalization of the surface on activation is possible.
There is some evidence, however, that does not support the theory of mediation by oxygen functionalities, especially for GC. Heat treatment has been shown to remove oxygen functionalities but yet improve the voltammetry of ascorbic acid and ferricyanide (7). Dioxygen reduction was shown to be independent of pH a t an activated GC electrode, but a predictable function of pH at a quinone-coated electrode (with
no reduction a t a pH C pK, of the semiquinone (25)). The charge under the reductive stripping peak associated with the “functional groups” formed by anodization was estimated to be the equivalent of 11 groups/A2 (assuming n = 2) (4); such a density of groups would require a multilayer structure, rather than simple functionalization of the surface. The results presented here show that a dominant process during elec- trochemical activation of the GC surface is the formation of a nearly transparent homogeneous graphitic oxide phase.
Ellipsometry has been used extensively to study electrode surfaces (26-31). The technique can detect monolayer cov- erages and (microscopic) surface roughness on an optically flat surface. The glasslike structure (32) and hardness of vitreous carbon allow polishing to give a very flat, reflective, and isotropic surface. These properties make GC an attractive material for specular reflectance techniques (18). Ellipsometry was used to monitor the optical constants and thickness of a nearly transparent film that developed during electro- chemical activation of GC.
EXPERIMENTAL SECTION Chemicals. Reagent grade sulfuric acid was used as received
and diluted with deionized water. The electrolyte solution was 0.1 M sulfuric acid in all experiments. Hydroquinone (HQ) was used without purification. Catechol was sublimed twice under vacuum. Day old solutions of catechol produced extraneous voltammetric waves superimposed on the catechol waves. Therefore, solutions containing catechol were prepared imme- diately before use. 2,3-Dicyanohydroquinone (DCHQ) was re- crystallized several times from EtOH/water solution. Stock so- lutions of the redox couples were about 1.0 mM.
Electrodes. The polished end of a 5 mm diameter glassy carbon (GC) rod (Tokai Carbon Co., Ltd., grad GC-20) served as the working electrode. A 10 mm length of the rod was attached coaxially to a brass rod of equal diameter with graphite epoxy (Dylon Industries, Inc., Cleveland, OH, grade PX), which had been doped with platinum black. A gold-plated pin connector was soldered to the brass rod, giving an assembly with an internal resistance of about 10 R. The rod assembly was sealed in heat- shrinkable FEP Teflon tubing and then pressed into an undersized (by about 0.25 mm) cylinder of TFE Teflon. An optically flat working surface was prepared by facing-off the Teflon shroud on a lathe and sanding the GC rod with 6W-grit carborundum paper. By application of only gentle pressure during sanding, coplanarity was achieved without removing much of the shroud or destroying its planarity. The surface was polished successively with 3.0-, LO-, and 0.25-fim diamond paste on microcloth-felt with an 8-in. polishing wheel (all polishing suppliers from Buehler, Ltd.). The electrode was sonicated in deionized water twice for 15 min be- tween polishings. It was repolished with 0.25-pm diamond paste between experiments. A silver wire served as a quasi-reference electrode (Ag-QRE) and a 5-cm2 Pt screen as the counter electrode. The Ag-QRE potential was about 0.24 (10.02) V positive of a sodium-saturated calomel electrode (0.48 (k0.02) V positive of NHE (normal hydrogen electrode)) and varied slightly from week to week, as determined by comparing either the E I j z of HQ or the onset of hydrogen evolution from Pt relative to each reference electrode.
Activation Procedure. The electrode was activated in blank solution and in solutions of HQ and DCHQ by sweeping the
0003-2700/8S/0360-1459$01.50/0 @2 1988 American Chemical Soclety

1460 ANALYTICAL CHEMISTRY, VOL. 60, NO. 14, JULY 15, 1988
w
Flgure 1. Side view and cross-sectional view of the MA1 cell. The cell body (CB), windows (W), and solution compartment (SC) are la- beled.
potential to 1.8 V vs Ag-QRE at a rate of 200 mV/s. The Ag-QRE was isolated from the working electrode by a sintered glass frit. The potential was either swept continuously or stopped mo- mentarily at the negative end of the sweep to record potential-step transients and cyclic voltammograms. The sample used in the X-ray powder diffraction measurements was obtained by scanning the potential in this way for 2 days, at which point large thin flakes were dislodged into the solution by gently tapping the electrode. The solution was decanted and replaced with deionized water twice before drying the flakes under vacuum at room temperature for 24 h. Follow-up X-ray measurements were taken from the sample used for elemental analysis, which was collected after activating a large area rod electrode for 3 weeks by the above procedure. The electrode was rinsed for a few minutes and dried under vacuum for 3 days, at which point the activated layer cleanly separated from the mderlying GC rod.
Optical Cell. A multiple-angle-of-incidence cell, shown in Figure 1, was constructed from TFE Teflon. The cell design permits incidence angles of 55-80’ from normal for a 2 mm diameter beam. The working electrode fits into the bottom port of the cell and was held in place by a threaded hollow plug. The 1/8 in. wide seat ensured that the working electrode was accurately positioned at the center of the circle defined by the arcs of the windows. The windows were arcs cut from a 1 in. length of vacuum-formed, precision bored (2.750 f 0.001 in.) Pyrex tubing (Wilmad Glass, Buena, NJ). The inside of the Pyrex cylinder was polished by Tadson, Inc. (Edina, MN), to remove the mandrel pattern, which remained from the vacuum-forming process. The outside diameter of the Teflon cell body was machined to within 0.001 in. of the inside diameter of the Pyrex cylinder to minimize stress in the windows. The windows were sealed to the cell body with high vacuum grease (Dow Corning, Midland, MI) and gently held in place with clamps (not shown) screwed into the cell body. The top port allowed viewing of the electrode at normal incidence with an autocollimator. Swagelock fittings (not shown) were mounted in the cell body and held feed-throughs for the auxiliary electrodes and solution handling.
Instrumentation. The polarization studies were made with a Rudolph Research Model 2437 ellipsometer (Rudolph Research, Flanders, NJ) equipped with a Model RR2000FT automatic ro- tating analyzer, a Model C6332 tungsten iodine light source, and a 5-mW He-Ne laser, Model 3222H-PC (Hughes Aircraft). The optical data were recorded and processed with a Hewlett-Packard Model 98169 desk-top computer, equipped with a HP Model 4740A digital plotter. Electrochemical measurements were performed with a Princeton Applied Research Model 175 pro- grammer, Model 173 potentiostat, and Model 179 digital cou- lometer. Current-potential curves were recorded on either a Hewlett-Packard Model 7045B or a Houston Instruments Model 200 X-Y recorder. Current transients were recorded with a Norland Model 3001 digital oscilloscope.
RESULTS Ellipsometric Characterization of the_ Polished GC
Electrode. The complex refractive index (N, = n, - k, i ) of the glassy carbon surface was measured in a$ after each step of the polishing process. The real part of N, (n,) increased each time a successively finer polish was performed, as ex- pecied by the “biggest is best” rule (33). The imaginary part of N,(k,) was essentially unchanged by polishing. Sonication
1 8 1
I a
01 1 I I I I I I I I 1 I 1 2 0 6 0 DELTR 100 1 4 0
Flgure 2. Ellipsometric characterlzation of the polished glassy carbon electrode. The points from left to right are 4 and A measured at 8 = 75, 70, 65 and 60°, X = 6328 A, and the line is a simulation 0-f the angular dependence of I/. and A for a film-free substrate with N, = 1.94 - 0.79i and N o = 1.0.
in deionized water after polishing reduced n, slightly (less than the increase by each polishing step), and two 15-min sonication periods were necessary to give an unchaning n,. The same value of N, was observed when the electrode was rotated about the axis normal to the surface, indicating a reasonably isotropic surface. Another GC sample showed variation with rotation because of a nonrandom distribution of ca. 10-pm pits (visible a t 335x) that probably resulted from bubbles formed during fabrication of the material. The sample used in this study appeared smooth and featureless under microscopic inspection at 335X magnification (ca. 2-pm resolution). The surface was a good mirror, showed no distortion of the reflected image, and gave an unblurred autocollimator-reflection, indicating a surface with negligible curvature. N, remained the same after adding the electrolyte solution.
The good fit of the data shown in Figure 2 indicates that effects of the cell components and surface imperfections were s2fficiently negligible to allow reproducible measurement of N, a t multiple angles of incidence (MAI). Each point rep- resents the measured change in polarization experienced upon reflection of 632.8-nm light a t a particular angle of incidence (0). Tan 4 is the relative change in amplitude, and A is the differential change in phase of the electric vector component parallel to the plane of incidence to that of the perpendicular component (27). The solid curves are simulations of the dependence o-f I/. and A upon 8, assuming a planar film-free surface with N, = 1.94 - 0.79i in air (No = 1.0). Similar MA1 measurements gave I?, = 1.885 - 0.773i for 545-nm light.
Ellipsometric Measurements during Anodic Activa- tion. Activation of the surface was monitored a t two wave- lengths, X = 545 and 643.8 nm, in separate experiments by making ellipsometric measurements while continuously cycling the potential between 0.0 and 1.8 V a t 200 mV/s in 0.1 M H@04 solution. Twenty measurements were made during the first 4 s of each anodic sweep (i.e., between 0.0 and 0.8 V), where negligible faradaic current flowed. A total of 0.45 C of anodic charge accumulated over periods of 1.0 and 1.25 h, respectively, with growth of a surface layer in’each experiment to almost a micrometer, as discussed below. A typical volt- ammogram for activation of the surface is shown in Figure 3. The current a t the positive end of each sweep steadily increased during the first 12 sweeps but remained reproducible during subsequent layer growth. Plots of 4 vs A a t X = 545 and 632.8 nm are given in Figures 4 and 5, respectively (8 = 75’). Each point is the average of the 20 measurements made during a potential cycle, and the point labeled “0” corresponds

ANALYTICAL CHEMISTRY, VOL. 60, NO. 14, JULY 15, 1988 1461
1 .a 1.0 0.0 vo l ts vs Ag-wire
Figure 3. Typical cyclic voltammagram recorded during activation of the glassy carbon electrode (geometric area = 0.203 cm2) in 0.1 M H,SO,. The sweep rate was 200 mV/s and E is relative to a Ag-wire electrode.
c
01 1 I 1 1 1 1 I I I 1 1 1 - 90 - 3 0 D E L T A 3 0 9 0
Flgure 4. Evolution of the polarization change experienced by 545-nm light upon reflection at 0 = 75, as the potential of the electrode was continuously cycled between 0.0 and 1.8 V at 200 mV/s in 0.1 M H,SO,. The curve of connected Iln? segments is a simulation of $ and A for growth of an isotropic layer (N = 1.53 - 0.027;) on glassy carbon (A = 1.885 - 0.77;) in solution (No = 1.333). The layer thickness was increased in 10-nm increments and is Indicated for a few points.
to the freshly polished surface. Layer growth showed no signs of becoming inhibited, and therefore, anodization of the surface was arbitrarily stopped after about 210 and 250 cycles, respectively.
Reasonably good fits of the growth curves in Figures 4 and 5 _were obtained by simulating the growth of an isotropic layer ( N , = 1.53 - 0.027i and 1.52 - 0.013i a t h = 545 and 632.8 respectively) on GC (mB = 1.885 - 0.77i and 1.94 - 0.79i a t h = 545 and 632.8, respectively). The best fits are shown in Figures 4 and 5 as solid curves, where the line segments that collectively form the simulated curves represent 10- and 5-nm increments in film thickness, respectively. Each fit was de- termined as follows: by use of the two-parameter analysis of So (34) , a film thickness (d ) and film extinction coefficient (k,, the imaginary part of R1) were calculated from each data point for several values of the real part of the film refractive index, n,. The n, value that gave the smallest scatter in k , and the average of t_he calculated k l values were taken to be the components of N1 that best fit the data. As pointed out by several authors (26-31, 33), in prinicple only two film thicknesses and two sets of ellipsometric measurements are necessary to give a unique solution of the Drude equations for the film constants and thicknesses, if the film grows as an isotropic homogeneous layer with unchanging optical constants. Therefore, the solutions determined by simulating the data are greatly overdetermined and unique. Slightly
6 0?
c
c
01 I I 1 I 1 1 1 1 1 I I J - 2 1 0 -90 D E L T R 3 0 1 5 0
Figure 5. Evolution of the polarization change experienced by 632.8-nrn light upon reflection of 6 = 75, as the potential of the electrode was continuously cycled between 0.0 and 1.8 V at 200 mV/s in 0.1 M H,SO,. The curve of connected llne segments is a simulation of $ and A forgrowth of an isotropic layer (N = 1.52 - 0.013i) on glassy carbon (N = 1.94 - 0.79i) in solution (No = 1.333). The layer thickness was increased in 5-nm increments and is indicated for a few points.
improved fits were obtained by least-squares fitting of the data, but the improved opitcal constants did not differ sig- nificantly from those above. The calculated layer thicknesses were quite sensitive to nl, but much less so to k,, for optical constants near the above values. Therefore, almost all the uncertainty in d results from the uncertainty in n, and the measurement error. Error estimates of 0.2" and 0.5" for $ and A, respectively, and a confidence interval of 0.02 for n, (as judged from the goodness of overall fits a t different nl) gave the relative error in d to be about 4 % at d < 100 nm, 3% a t d = 100-300 nm, and 2% at d > 300 nm. Although d was not very sensitive to k,, the quality of the fit for each growth curve was; thus, the confidence interval for k, was fairly small (about 0.01).
The growth curve at X = 545 nm (Figure 4) appears to deviate noticeably from that expected for growth of an iso- tropic homogeneous layer, during the first quarter of the second and third optical cycle. The deviation is too large to be due to the uncertainty in the phase retardation of the compensator. The deviation appears to be most noticeable during each cycle a t $ = 45". The deviation might be the result of refraction by small bubbles that formed on the electrode. Small gas bubbles evolved from the surface throughout the activation (oxidation) process. The poorness of fit during the middle of the first optical cycle is under- standable for two reasons: $ and A are very sensitive to changes in d for that range of film thicknesses, as illustrated by the length of the line segments of the simulated curve in that region. Therefore, the deviations appear exaggerated compared to those in other regions of the plot. Secondly, and more importantly, the ellipticity of the polarization state as seen by the detector during this region was lower than that recommended by the manufacturer. At low ellipticity, the error in calibrating the dark current of the detector can cause systematic errors in $ and A comparable to the observed deviations.
Since d was insensitive to small changes in kl, the thickness of the film after each cycle could be calculated accurately by parameterizing k , in the two-parameter analysis. Values obtained in this way agreed well with those obtained from visual comparison to the best fits in Figures 4 and 5. This was possible because the small variation in k1 (0.007) necessary to fit each point (for nl fixed at the values for the fits in

1462 ANALYTICAL CHEMISTRY, VOL. 60, NO. 14, JULY 15, 1988
1000-
No o f C y C l e S
Flgure 6. Thickness ( d ) of the anodized layer as a function of the number of potential cycles for the data and refractive indices given in Figure 4.
Figures 4 and 5) corresponds to only a 0.5% variation in d. I t should be noted that this method of parameterizing k l to calculate d is valid only because of the very low k l values involved. The layer thickness versus the number of potential cycles for the data in Figure 4 is shown in Figure 6. The slope of the plot equals 4.5 nm per cycle and indicates that the layer grew at a constant rate to almost a micrometer. A similar plot for the X = 632.8-nm experiment had a slope of 3.6 nm per cycle. The lower growth rate observed during the 632.8-nm experiment correlates with the lower oxidation currents ob- served during that experiment. The current density a t the reversal potential of the oxidative sweeps in the 632.8-nm experiment was 8.1 mA/cm2, compared to 9.4 mA/cm2 during the 545-nm experiment. Since a Ag wire QRE served as the reference electrode, the difference in current densities probably resulted from a small shift in the reference electrode potential between experiments. A shift of 20 mV would cause the different current densities. This would also account for the fewer gas bubbles that formed on the electrode during the 632.8-nm experiment and, therefore, the better fi t of the 632.8-nm data.
Ellipsometric and Voltammetric Measurements after Activation of the Surface. After passage of a total of 0.48 C of charge, the potential was held a t 0.0 V and a $-A point was recorded every 17 s for 20 min. These data points form the clusters of points shown in Figures 4 and 5 a t the ends of the growth curves and give the thicknesses that form the flat part of the plot in Figure 6. The plots indicate the film growth essentially stopped immediately upon ending the potential cycling. The $-A points with E = 0 indicate that kl, and to a lesser extent n,, increased slightly after film growth stopped; e.g., after 15 min at E = 0 during the X = 545 nm experiment, k1 increased from 0.027 to 0.034 (ignoring any changes in nl, as justified below). After the electrode of the X = 632.8 nm experiment was allowed to soak in the electrolyte solution for 6 days, its optical properties were determined by making MA1 measurements. Figure 7 shows $ vs A as a function of the angle of incidence for 632.8-nm light. Four replicate measurements were made a t integer values of 0 = 60-75O inclusive. The complex refractive index and thickness of the film were determined by simulating the data and by iterative least-squares regression analysis. The solid curve is a simulation of the best fit. Since the goodness of fit was quite sensitive to values of nl, kl , and d, their values were determined at X = 632.8 nm precisely and uniquely: nl = 1.527 f 0.002, k , = 0.034 f 0.001, and d = 992 & 4 nm. Therefore, with the electrode at open circuit for 6 days, k1 increased by 0.021, nl increased by only 0.007, and d increased by about 67 nm.
51 I I I I I I I I I I I J
- 3 0 10 DELTA 50 9 0
Flgure 7. Multiple angle of Incidence data (6 = 60-75') for the ano- dization hyer produced durlng the X = 632.8 nm experiment. The solid curve is a simulation of # and A versus 6 for a 9?2 nm thick, isotropic layer ( N , = 1.527 - 0.034;) on glassy carbon (N, = 1.94 - 0.79;) in solution (No = 1.333).
0 -
10 - 20 - 30 - 40 - 5 0 -
a 55'
~
0.4 0.2 0.0 -0.2 -0 .4
E v s A g ORE (V )
Flgure 8. Growth of background surface waves from an activated electrode in blank solution (d = about 400 nm, Q = 0.202 C). E was swept continuously at 200 mV/s, except between sweeps a and b ( E = 0.0 V for 3.5 h), and the current was recorded at 5-min Intervals.
Subsequent experiments showed that kl remained un- changed if the electrode was held at potentials 20.3 V. At potentials below 0.3 V, a small (ca. microampere) but long- lived reduction current flowed that caused changes in the optical constants similar to those noted above. Along with the increase in k, upon reduction of the layer, there occurred a substantial increase in the background charging current in blank solution and the growth of cyclic voltammetric peaks a t about E = 0.0 V. The growth of these surfacelike peaks is shown in Figure 8. The current was recorded at 5-min intervals while continuously cycling the potential between 0.4 and -0.4 V in blank solution. The rising current a t the neg- ative end of the trace is the foot of the cathodic stripping wave reported by Engstrom (4). The optical changes and the growth of the background waves also occurred at open circuit but a t a much slower rate. If the cell was maintained at 10.3 V, cyclic

ANALYTICAL CHEMISTRY, VOL. 60, NO. 14, JULY 15, 1988 1463
Table I. Ellipsometric and Voltammetric Changes during Activation of a GC Electrode
no. of activation cycles A $ kla d," 8, AE,,~ mV ip,a,b FA ipSctb FA
0 24.1 28.0 250 52 46 1 24.2 28.1 0.132 15 100 65 53 2 24.4 28.2 0.043 31 85 60 52 3 24.6 28.4 0.012 47 4 24.9 28.5 0.007 70 60 61 53 5 25.1 28.7 0.013 95 52 61 53 6 25.4 28.9 0.018 123 7 25.8 29.1 0.011 151 40 62 52
time elapsed' A $ , kla d," 8, AE,,~ mV ip.a,b FA ip,c,b FA
7 min 25.7 29.2 0.018 156 13 rnin 25.7 29.2 0.020 157 35 min 25.5 29.1 0.027 148 40 101 85 2.75 h 25.4 29.1 0.033 144 45 93 85 16 h 24.9 29.1 0.083 142 80 86 80 23 h 24.7 29.2 0.103 140 85 80 70 39 h 24.4 29.2 0.134 134 95 80 70
"Determined by two-parameter analysis for n, = 1.50. bFrom cyclic voltammograms during activation in 0.45 mM catechol/O.l M H,S04 solution; sweep rate of 200 mV/s. cTime since seventh activation cycle.
voltammograms of the activated surface in blank solution remained flat for days, much like those expected for an ideal capacitor, and t+b and A remained close to their values im- mediately following growth of the activation layer. Care was taken to ensure that the reduction of Ag+ ions from the ref- erence electrode was not responsible for the growth of the peaks and the optical instabilities. Determinations of Ag in the electrolyte solution by atomic absorption indicated the Ag contamination was below the detection limit (0.1 ppm). When the reference electrode was not isolated from the so- lution by a sintered glass frit, Ag contamination in solution after several hours equaled about 4.0 pM.
Voltammetr ic Charac te r iza t ion of t h e Activated Electrode. The role of the anodically formed layer in acti- vating the surface was studied by using catechol, hydro- quinone, and 2,3-dicyanohydroquinone as probes in poten- tial-step and cyclic voltammetric experiments. Cyclic vol- tammagrams (CVs) of catechol were recorded while optically monitoring the growth of the layer in order to determine the layer thickness necessary to effect activation of the surface. Figure 9 illustrates the typical improvement in voltammetric behavior for catechol with a few anodic activation cycles. The solid traces are the voltammograms observed before and during the first, second, fourth, an seventh activation cycles. The potential was cycled continuously (as above), but the anodic reversal potential was set at 1.78 V vs Ag-QRE (rather than 1.80 V as in the earlier experiments) to produce less layer growth per cycle. The cathodic sweep limit was extended a little to obtain good voltammograms of catechol. J / and A were monitored during activation and then on holding the cell a t 0.0 V following activation. Table I summarizes the optical and voltammetric data obtained during this experiment. The background-corrected peaks remained about the same size during the activation procedure but grew to almost twice their original height in the 30 min after activation with the cell held at 0.0 V (dashed trace in Figure 9). The layer thicknesses and extinction coefficient were calculated assuming nl = 1.5. Because of the small layer thicknesses produced during this experiment, precise values for the layer optical constants were difficult to determine, but the relative changes are trustworthy. Reasonable fits of the data were possible only for nl = 1.45-1.55 and kl = 0.0-0.02, giving a film thickness after the seventh activation cycle of 150 * 25 A. Therefore, a ca. 150-A layer was required to give the maximum improvement in the voltammetry of catechol. AEp, kl, and d did not change much during the 30-min period in which the peak heights grew
L I I I I I I 0 . 8 0.4 , o . o -0.4
V o l t s V S A S - Q R E
Figure 9. Cyclic voltammograms from a GC electrode after polishing, during the first, second, fourth, and seventh activation cycles (solid traces), and 35 rnin after activation (- --), in 0.45 mM catechoV0.1 M H,SO, solution.
larger, but they did revert toward their initial values after several hours. The changes in Up, i,, k , and d at long times suggest that deactivation of the surface coincided with re- version of the layer back to its initial state.
The large increases in the voltammetric peak heights for the probe species on the activated vs polished surface sug- gested that anodization of the GC induced adsorption. Po- tential-step chronocoulometry experiments, performed shortly after activation of the surface, indicated considerable ad- sorption, r, of all probe species. Plots of charge vs square root of time, Q vs t l / * , were linear for t > 50 ms and had slopes with some variation between experiments that corresponded to a diffusion coefficient in the range from 0.9 X to 1.7 X cm2/s, a range of values that is slightly high for small molecules in aqueous solution. Others have reported higher than expected currents for dopamine and other electroactive cations in potential-step experiments, which were attributed

1464 ANALYTICAL CHEMISTRY, VOL. 60, NO. 14, JULY 15, 1988
20 0 60 :o YF& --<as*"- i - A P I_ -i-L
Ld,W T, i i i n e s s ("rn)
Figure 10. Plots of cell capacitance in blank solution as a function of layer thickness when the electrode was activated by sweeping E in the following ranges: E = 0.3-1.8 V (m) and E = -0.1 to 1.8 V (0). The intercepts of Q-t"2 plots for 0.3-0.7 V steps in 0.15 mM DCHQ (0) and blank solution (0) are also shown as a function of layer thickness
to adsorption on the activated surface (14 ) . Intercepts of Q-t1/2 plots for 0.1-0.6 mM solutions gave r values of about 3 X mol/cm2. Attempts to obtain adsorption isotherms, r vs C*, for catechol and hydroquinone as a function of the thickness of the activation layer were thwarted by the in- stability of the layer. I? increased smoothly with concentration in each case, but accurate measurements were not possible because the intercept of the Q-t1lz plots was only reproducible over a period of a few minutes. The contribution of the background processes to the intercept (see Figure 8) continued to increase during the time necessary to vary C*. Reduction of the layer and growth of the background waves continued for several hours until the background waves swamped out the signal from the solution species. A polished electrode showed no such instability.
Since the potential for oxidation of 2,3-dicyanohydro- quinone (DCHQ) is greater than 0.3 V, it was used to probe the properties of the activation layer while avoiding reduction of the layer and the corresponding instabilities. Q-t1I2 plots for potential steps from 0.3 to 0.7 V for the oxidation of DCHQ at an activated electrode were reproducible for several hours. To determine how much of the anodic layer was electroactive, rDCHQ was measured as a function of the layer thickness. The negative-going potential sweep was reversed a t 0.3 V during activation of the surface in these experiments. Figure 10 shows the intercept of Q-t1I2 plots as a function of layer growth in 0.1 mM DCHQ solution and in blank solution. The intercept increased with layer growth to about 25 nm, but a much smaller increase occurred in blank solution. To avoid the variations caused by polishing, the data in Figure 10 for d < 60 nm were collected in one experiment for each solution by repeating the following sequence: (1) layer growth was affected by one potential cycle (0.3-1.8 V) after which $ and A were recorded; (2) the current during a few 50-mV potential steps near 0.3 V was recorded to measure the cell resistance and capacitance (C); (3) Q-t1l2 data were obtained for potential steps from 0.3 to 0.7 V; (4) a cyclic voltammogram was re- corded between 0.3 and 0.7 v. The data for d > 300 nm were obtained in separate experiments in which the DCHQ solution was exchanged for blank solution after layer growth was stopped ( E = 0.3 V). In each experiment layer growth was continued to a t least d = 180 nm to ensure an accurate de- termination of the layer refractive index and thicknesses. Least-squares fits were much better than for the experiments in which the negative-going sweep was reversed at 0.0 V. Figure 11 shows the ellipsometric data for the experiment with DCHQ in solution and d < 60 nm. nl was similar to the values above (about 1.56), but k l was significantly lower (about 0.006 vs 0.013). Because the intercepts were reproducible between experiments and over time, r D C H Q could be calculated from the difference between the intercepts obtained with and
I-
ZLP - A -- I_---- I , , , - 9 2 -3e E E L T A 3a sa
Figure 11. Plot of the $-A data taken during activation of the GC electrode in 0.15 mM DCHQ solution. These data were used to cal- culate the thicknesses in Figure 10. The solid curve is a simulation of layer growth in 1.0-nm increments using the following constants: N o = 1.333, f i s = 1.90 - 0.692/', f i , = 1.567 - O.O06i, A = 632.8 nm, 0 = 75, dflna, = 182 nm.
10
v - 1 2
o-* E vs Ag ORE ( V I
Figure 12. Cyclic voltammograms recorded between activation sweeps (E = 0.3-1.8 V) in 0.015 mM DCHQ solution. Each CV was recorded a few minutes after each additional activation sweep. The labels indicate the total number of sweeps.
without DCHQ in solution. The net limiting intercept gave rDCHQ,Ji,,, = (3.2 f 0.2) X mol/cm2 (for 0.1 mM DCHQ). The polished electrode gave r D C H Q = (0.3 i 0.1) X lo-'' mol/ cm2.
The cell resistance and capacitance (also shown in Figure 10) were calculated from the slopes and intercepts of In i vs t plots (fit a t t = 70-350 p s ) from the 50-mV potential steps. The cell resistance dropped dramatically (48 to 26 Q) with the first activation sweep but remained essentially constant after successive sweeps. Figure 10 shows that the cell capacitance increased in the same way as r D C H Q with layer growth up to about 25 nm and remained essentially constant a t higher d. The cyclic voltammograms recorded between each activation sweep are shown in Figure 12. Their peak heights increased after each of the first 13 sweeps, the same number of sweeps required for r and the cell capacitance to become constant and for the current a t the positive end of the sweep to stop growing. These results suggest that the bulk of the activation
ANALYTICAL CHEMISTRY, VOL. 60, NO. 14, JULY 15, 1988 1465
Table 11. Calculated kl and d Values for $-A points recorded during the Hour after Activation of the Electrode While Holding k at -0.1 Vn
time,* min A
3 289.68 289.90
4 290.35 290.40
7 291.80 291.78
10 293.27 293.64
14 295.17 295.33
16 295.17 295.57
18 296.49 296.47
23 298.52 298.59
28 301.40 301.68
34 306.04 306.28
39 309.40 309.06
46 313.26 313.48
51 317.38 317.55
56 328.54 328.91
v - 3 3
1 I I I 1 0.6 0.4 0.2 0.0 -0.2
E v s Ag ORE ( V I
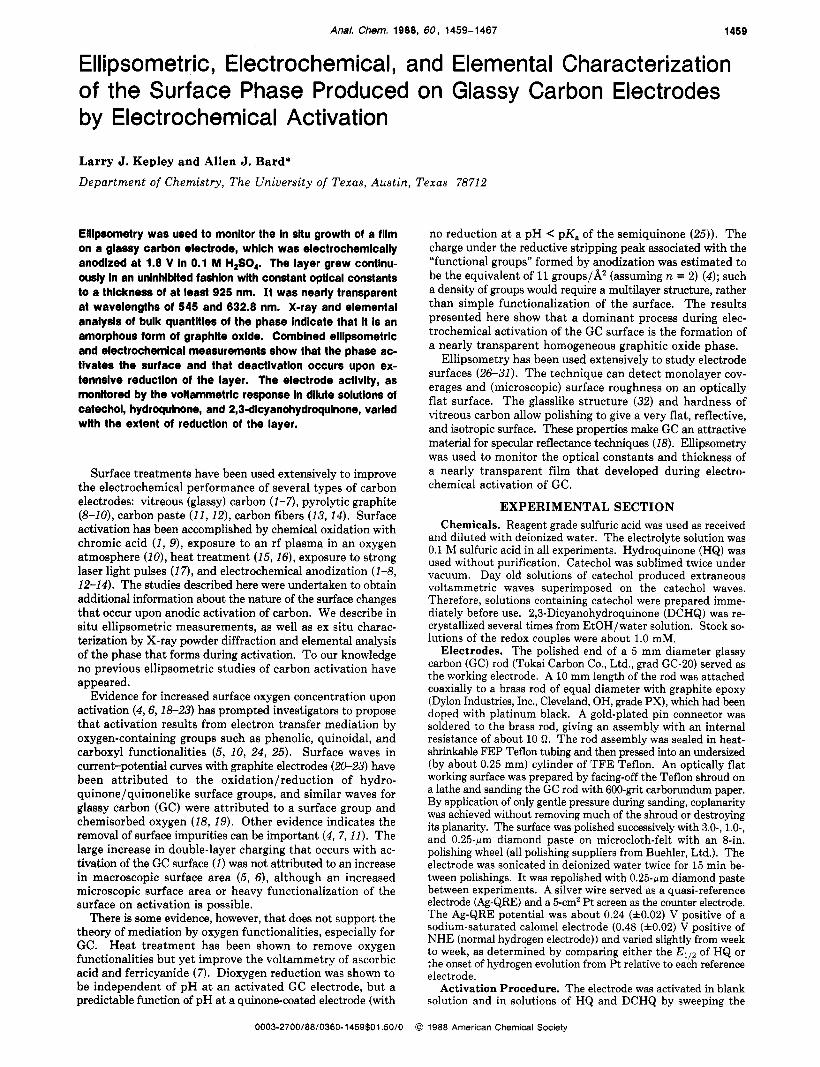
Figure 13. Cycllc voltammograms from an activated electrode in 0.13 mM HQ solution (activated in blank solution, E = 0.3-1.8 V), as a function of the time spent reducing the activation layer. The labels indicate total time in minutes. The CVs were recorded about 4 min apart and E was held at -0.1 V between sweeps, except for 1 or 2 potential steeps between each sweep (E = -0.1 to 0.5 V). The k, and d of the layer as ,a function of time are given in Table 11. At t = 0, d = 160 nm and N, = 1.596 - 0.OOi.
$
45.02 45.03 45.13 45.12 45.42 45.40 45.76 45.93 46.25 46.20 46.25 46.25 46.40 46.40 46.73 46.74 47.08 47.12 47.31 47.31 47.31 47.05 47.21 47.27 47.05 47.07 45.49 45.52
k,' 0.005 0.005 0.006 0.006 0.008 0.008 0.010 0.010 0.012 0.012 0.013 0.013 0.014 0.014 0.016 0.017 0.020 0.021 0.026 0.027 0.031 0.031 0.037 0.037 0.043 0.044 0.064 0.065
d,' A
1613.0 1613.5 1613.6 1613.9 1614.3 1614.5 1614.3 1613.4 1613.4 1614.3 1614.5 1614.2 1614.5 1614.4 1614.6 1614.6 1615.4 1615.4 1618.7 1618.9 1621.6 1624.6 1624.9 1624.3 1627.5 1627.3 1642.2 1641.0
Electrode activated in blank solution by sweeping E between 0.3 and 1.8 V. The blank solution was replaced with 0.125 mM H,O solution and the voltammograms in Figure 13 were recorded simultaneously with this ellipsometric data. *Time spent holding E at -0.1 V, except for recording voltammograms in Figure 13. cCalculated by using two-parameter analysis with n, = 1.596 (see ref 34).
layer generated at E > 0.3 V is not electroactive and that only the portion immediately adjacent to the GC substrate is electronically connected to the substrate. This contention is supported by the almost zero value of kl.
T o probe the effect of partial reduction of the layer, the measurement sequence used above with DCHQ was repeated a t lower potentials with hydroquinone, HQ, as the probe molecule. In these experiments the reversal potential during the activation sweep was -0.1 V instead of 0.3 V, the large potential steps were from -0.1 to 0.5 V, and the 50-mV po- tential steps were taken near 0.0 V. The capacitance during one such experiment is shown in Figure 10 (open squares) as a function of the layer thickness. The capacitance increased with layer growth in the same way as when the reversal po- tential was 0.3 V, but the limiting C was higher, about 16 pF compared to 8.5 WF (varying between experiments in the 15-20 WF range). The chronocoulometric intercepts (not shown) for blank and 0.1-0.6 mM HQ solutions were considerably higher a t all d (about 2-3 times larger in each case) than those for the DCHQ experiments. Q and C (vs d ) became constant a t d = 25 nm, indicating that the short periods spent a t E < 0.3 V (in conjuction with the subsequent oxidation sweeps) did not significantly increase the electrical conductivity in the bulk of the layer. The limiting r for the adsorption of HQ was also about twice that for DCHQ (rHQ,Jim = 6 X after 12 ac- tivation sweeps, d = 50 nm). Measurement of rHQ,Jim was difficult a t d > 50 nm, because the surface waves near E = 0.0 V (see Figure 13) became significant contributors to the intercept of the Q-tllz plots. CVs taken during activation in blank solution at E = -0.1 to 1.8 V did not show the surface waves, even for d = 300 nm. Therefore, the intercepts for potential step data in blank solution did not contain the
contributions from the surface waves, making it difficult to subtract correctly the background charging to yield accurate rHB values. The larger values of I t , , rlim, and C indicate that lowering the reversal potential to -0.1 V leads to a doubling of the electroactivity of the layer but that the bulk of the layer still remains electrically disconnected from the GC substrate.
To display further the effect of reducing the layer, cyclic voltammograms of HQ and ellipsometric data were recorded with an activated electrode as a function of the time spent reducing the surface at E = -0.1 V (n , = 1.596, k , = 0.000, d = 160 nm; activated in blank solution by sweeping E over the range 0.3-1.8 V). The voltammograms are shown in Figure 13 with labels corresponding to the time spent holding E a t -0.1 V. Calculated kl and d values (assuming a constant value for nl = 1.596) are given in Table 11. Initially, the net peak heights and k l increased proportionately, suggesting that the increases were both caused by reduction of the surface. The voltammograms began to show large background charging and surface waves near 0.0 V at times longer than about 1 h, and the net peak heights stopped increasing.
X-ray Diffraction and Chemical Analysis of Surface Layer. X-ray diffraction measurements were made to de- termine the composition of the anodically formed layer. Powder diffraction patterns taken from untreated and ano- dized GC indicated that both forms contained a fair amount of microcrystallinity, consistent with the structure reported by Jenkins and Kawamura (32) for GC formed a t tempera- tures near 2500 OC. A powder sample of untreated GC gave broad diffraction lines with d spacings of 3.46 (very strong), 2.11, 1.71, and 1.22 A. Although the fit was not very good, the lines were tentatively assigned to the 002, 100,004, and 110 planes of a hexagonal graphitic phase, with spacing of a
1466 ANALYTICAL CHEMISTRY, VOL. 60, NO. 14. JULY 15, 1988
= 2.44 A and c = 6.86 A. The pattern from the anodized sample showed simlar hkO lines, none of the d = 3.46 A line, and two additional lines: a very broad intense line with d = 4.15 A, and a broad, very weak line with d = 1.69 A. The additional lines were tentatively assigned to the 002 and 103 planes of hydrated graphite oxide a = 2.46 A, c = 8.28 A. (Graphite oxide has been thoroughly discussed in reviews on graphite intercalation compounds; see ref 35-37.) The c-axis spacing is near the values reported for stage 1, bisulfate in- tercalated graphite (35-40). However, since acid graphite salts decompose instantly in water and only form in concentrated acid, the formation of an intercalated graphite phase was judged improbable. In experiments in which an activated sample was dried more thoroughly (under vacuum for 3 days), the interlayer spacing collapsed back to almost that for the unactivated sample. Graphite oxide is known to swell more that 100% in polar media (e.g., from 6.50 to 10.00 A in H,O (35)). The 002 line of the thoroughly dried sample was much broader than that of the hydrated sample, making it difficult to assign an accurate value for the interlayer spacing. The absence of the 3.46-A line indicates that very little unoxidized carbon was present in the activated layer.
A bulk sample of the layer was made by activating the surface of a large area rod electrode for about 3 weeks. Ali- quots of the electrolyte solution were replaced daily with fresh solution, in an effort to keep the solution conditions the same throughout the lengthy electrolysis necessary to produce the bulk sample. The electrode was rinsed for a few minutes and then dried under vacuum for 3 days. Upon drying the acti- vated layer cleanly separated from the underlying GC rod and was collected for analysis. Analysis for C, H, and S gave: 71.8% C, 1.25% H, 0.5% S, (leaving 26.5% as 0). Analysis of an unactivated sample for C, H, S, and 0 gave 99.4% C, 0.3% H, and less than 0.1% 0 and S. Therefore, intercalation of bisulfate or other S-containing species does not occur upon activating the surface; the activation layer is mostly graphite oxide, and the O/C ratio in the layer is a t least 1:6 (assuming all H as HzO) or a t most 1:4 (assuming no HzO present). The analysis gave 0.54 for the number of oxidation equivalents per C atom, consistent with the value given by Besenhard for the maximum degree of oxidation attainable by anodic overoxi- dation of graphite in aqueous acids (ca. 0.5 (35)). If all of the H is assumed to be as OH functional groups, there remains a large fraction of 0 as ether or carbonyl-like functionalities.
DISCUSS ION By assuming that the anodic layer is responsible for acti-
vation of the surface, one can account for the physical and chemical changes that cause activation of GC electrodes. This is a resonable assumption, because activation of the surface coincided with growth of the layer and its optical properties over time correlated with changes in the activity of the electrode (Figure 9 and Table I). The good fits of the ellip- sometric data over a wide thickness range (nea_rly a microm- eter) by the single-layer model with constant N suggest that the layer grows with uniform composition and that the bulk sample is representative of the phase responsible for activation of the electrode. The layer is nonconductive and has optical constants greatly reduced from those of GC. Similar anodic layers probably formed during the studies of electrochemical activation reported by others (4 , 6), because the electro- chemical pretreatment was similar to that used here; except that the potential in their studies was held at 1.8 V instead of being cycled between 0 and 1.8 V. Typically, anodization periods of 5 min were used and comparable amounts of charge per unit area were passed. Engstrom reported that the amount of charge in the cathodic stripping peak indicated a multilayer structure, and we observed the same visible changes during activation as those reported by Cabaniss et al. (6) and Eng-
strom and Strasser (5); i.e., the color of the surface changed from black to pink, to green to purple, and finally to gold. Note that these colors are the result of interference effects produced by a nearly transparent layer. In addition, water beaded on the polished surface but wet the anodized surface. Finally, the surface was easily scratched immediately after anodization (by dragging Kim wipe over the surface) and became brittle and flaky upon drying.
Our results allow a qualitative description of the chemical and physical changes that occur upon activation, which ac- counts for the optical and electrical properties of the layer. Activation of the surface involves a combination of surface roughening, the formation of graphite oxide, intercalation and adsorption of the redox couple, and reduction of the anodic layer to form a porous, hydrated, and partially conductive 3-D structure. The rather small value of kl and the near constancy of the current function for probe molecule oxidation at electrodes with layers thicker than 25 nm suggest that the bulk of the layer is nonconductive. The optical constants of the layer are greatly reduced compared to those of GC, because anodization of the surface disrupts the long-range order and delocalization of the electronic states necessary for electrical conductivity. We think that oxidation of GC leads to the formation of graphite oxide, which causes disruption of the band structure, the formation of electron scattering centers, and loss of electrical conductivity. I t also causes disintegration of some of the GC on a microscopic scale, leaving behind a porous phase filled with solution. Graphite oxide is a rather poorly characterized material, which is composed of disordered carbon layers and covalent C-0 bonds (35-37). Anodic growth of the layer is similar to the formation of graphite oxide by "overoxidation" of graphite in dilute acid, which also causes loss of electrical conductivity, except that in that case, graphite does not disintegrate upon oxidation and can be reduced back to bulk graphite with almost 100% efficiency (35).
The low value of nl suggests that the layer is a porous, swollen, and hydrated composite phase, because a dense phase would have a n, value of about 2. Easy transfer of the layer to a tissue upon gentle wiping of the surface supports the contention that the layer is composed of easily removable, microscopic particles. Judging from the severe cracking and buckling upon drying of a surface activated for 2 days and the finely divided (smaller than 500 nm) particles that de- posited into the solution, the layer appears to be a very porous, hydrated, and colloidlike microstructure of semicrystalline particles. Activation of the surface and the optical constants of the layer result from both chemical and physical changes.
Many investigators have considered the possibility of sur- face roughening and the associated increase in surface area during activation (5, 6). Their studies did not show any increase in surface area for moderate anodization potentials (11.8 V), but the methods used were limited to roughness on the order of the wavelength of light. The electrochemical studies (chronoamperometry and rotating disk voltammetry) involved measuring the limiting current for a diffusion-con- trolled process, and therefore, they were insensitive to any roughness less than the diffusion layer thickness-a few micrometers. Electron micrographs taken before and after activation indicated no change in roughness a t 500-nm reso- lution (5) . Surface roughening would cause changes in + and 3. orders of magnitude smaller than those for growth of the layer, making it impossible to calculate the level of roughness from changes in $ and A. The fact that the layer grew to large thicknesses without grossly scattering visible light indicates that any roghness was less than about 150 nm. Our data (Figure 9 and Table I) suggests that surface roughening does not contribute significantly to activation of the surface. A layer thickness of 10 nm was adequate to decrease AE, for

ANALYTICAL CHEMISTRY, VOL. 60, NO. 14, JULY 15, 1988 1467
contains a significant amount of microcrystallinity and gra- phite oxide. The new phase is nearly transparent to red and green light, has refractive indices markedly reduced from those of GC, and is very porous, hydrated, and nonconductive. The phase grows with uniform composition to thicknesses of at least about a micrometer and is about 25% oxygen by weight. The conductivity and activity of the electrode are functions of the state of reduction of this layer and the redox potential in solution. Deactivation of the surface occurs upon extensive reduction of the layer.
ACKNOWLEDGMENT We thank Professor Thomas E. Mallouk for his assistance
in interpreting the X-ray powder diffraction pattern and for many helpful discussions. We also appreciate the advice and encouragement given by Dr. Shimshon Gottesfeld.
LITERATURE CITED (1) Taylor, R. J.; Humffray, A. A. J . Electroanal. Chem. 1973, 42, 347. (2) Blaedel, W. J.; Jenkins, R. A. Anal. Chem. 1974, 46. 1952. (3) Blaedel, W. J.; Jenkins, R. A. Anal. Chem. 1975, 4 7 , 1337. (4) Engstrom, R. C. Anal. Chem. 1982, 54, 2310. (5) Engstrom, R. C.; Strasser, V. A. Anal. Chem. 1984, 56, 136. (6) Cabaniss, G. E.; Diamantis, A. A.; Murphy, W. R., Jr.; Linton, R. W.;
Meyer, T. J. J . Am. Chem. Soc. 1985, 107, 1845. (7) Hu, I. F.; Karwelk, D. H.: Kuwana, 1. J . Electroanal. Chem. 1985,
188, 59. (8) Blaedel, W. J.; Mabbott, G. A. Anal. Chem. 1978, 50, 933. (9) Wightman. R. M.; Paik, E. C.; Borman, S.; Dayton, M. A. Anal. Chem.
1978, 50, 1410. (IO) Evans, J. F.; Kuwana. T.; Henne, M. T.; Royer, G. P. J . Electroanal.
Chem. 1977, 80, 409. (11) Deakin, M. R.; Kovach, P. M.; Stutts. K. J.; Wightman, R. M. Anal.
Chem. 1986, 58, 1474. (12) Faiat, L.; Cheng, H. Y. Anal. Chem. 1982, 5 4 , 2108. (13) Gonon, F.; Fombarlet, C. M; Buda, M. J.; Pujol, J. F. Anal. Chem.
1981, 53, 1386. (14) Kovach, P. M.; Deakin, M. R.; Wightman, R. M. J . fhys. Chem. 1988,
90, 4612. (15) Stutts, K. J.; Kovach, P. M.; Kuhr, W. G.; Wightman, R. M. Anal.
Chem. 1983, 55, 1632. (16) Fagen. D. T.; Hu, I. F.; Kuwana. T Anal Chem. 1985, 57, 2759. (17) Poon M.; McCreery, R. L. Anal. Chem. 1986, 58, 2754. (18) Laser, D.: Ariel, M. J. J . Electroanal. Chem. 1974, 80, 291. (19) Gunasingham, H.; Fleet, B. Analyst (London) 1982, 107, 896. (20) Epstein, B. D.; Dab-Malle, E.; Mattson, J. S. Carbon 1971, 9 , 609. (21) Blurton, F. Electrochim. Acta 1973, 18, 869. (22) Procter, A.; Sherwood, P. M. A. Carbon 1983, 21, 53. (23) Evans, J. F.; Kuwana, T. Anal. Chem. 1977, 49, 1635. (24) Nagaoka, T.; Yoshlno, T. Anal. Chem. 1966, 58, 1037. (25) Nagaoka, T.; Sakai, T.; Ogura, K.: Yoshino, T. Anal. Chem. 1988, 58,
1953. (26) Ellipsomehy in the Measurements of Surfaces and Thin Films ; Passag-
lia, E., Stromberg, R. R., Kruger, J., Eds.; Natl. Bur. Std. Misc. Publ. 256, US Government Printing Office: Washington, DC, 1964.
(27) Azzam, R. M. A.; Bashara, N. M. Ellipsometry and Polarized Light; North-Holland: Amsterdam, 1977.
(28) Gottesfeid, S.; Babai, M.; Reichman, B. Surf. Sci. 1976, 56. 373. (29) Kim, S. H.; Paik, W.; Bockris, J. 0. Surf. Sci. 1972, 33, 617. (30) Kruger. J. In Advances in Electrochemistry and Electrochemical Engl-
neering; Delahay, P., Tobias, C. W., Eds., Wiley: New York, 1973; Vol. 9.
(31) Gottesfeld, S. In Electroanalytical Chemistry; Bard, A. J.. Ed.; Marcel Dekker: New York, Voi. 15, in press.
(32) Jenkins, G. M.; Kawamura. K. Nature (London) 1971, 231, 175. (33) Aspnes, D. E. Thin Solid Films 1962, 89, 249. (34) So, S. S. Surf. Sci. 1976, 56(1), 97. (35) Besenhard, 0.; Fritz, H. P. Angew. Chem., In t . Ed. Engl. 1983, 22,
950. (36) Rudorff, W. Adv. Inorg. Chem. Radiochem. 1959, 1 , 223. (37) Hennig, G. R. frog. Inorg. Chem. 1959, 1 , 125. (38) Olk, C. H.; Yeh, V.; Holler, F. J.; Ekiund, P. C. Mater. Res. SOC.
Symp. froc. 1983, 20, 259. (39) Aronson, S.; Frishberg, C.; Frankl, G. Carbon 1971, 9 , 715. (40) Aronson, S.; Lemont, S.; Weiner, J. Inorg. Chem. 1971, IO, 1297.
HQ to almost that for a reversible couple, and the current response remained about the same, indicating little change in the electroactive (geometric) area. Therefore, marked activation occurs even when surface roughness is limited to about 10 nm.
This is not to say that layer growth did not lead to a sig- nificant increase in the effective electroactive area. Although graphite oxide is nonconductive, it intercalates aromatic molecules quite well (swelling by almost 100% with the uptake of nitrobenzene and even more with pyridine). Therefore, the outer nonelectroactive portion of the layer acts to concentrate the redox couple near the electroactive surface. Secondly, reduction of the layer made it partially conductive, thus in- creasing the dimensionality, electroactive area, and sensitivity of the surface. Although it is not straightforward to use k, as a measure of the dc conductivity, the increase in lzl com- bined with increases in i,, C, and r suggest that partial re- duction of the layer slightly increased its conductivity and activity. I t should be noted that extensive reduction caused deactivation (see table 1 for t > 1 h). The formation of gra- phite oxide is a chemically reversible process, nearly 100% so with highly ordered graphite, but it was not possible to reduce the layer completely back to GC, indicating significant breakup of the carbon structure. MA1 data from an exten- sively reduced layer was inconsistent with the model for a single layer with uniform optical constants.
The peaks for DCHQ and HQ in Figures 12 and 13 have shapes representative of those for surface-confined redox couples. The importance of adsorption for activation is dif- ficult to judge from these experiments. Possibly steady-state current experiments (e.g., RDE experiments) would distin- guish whether the adsorbed species mediates electron transfer to solution species or simply increases the local concentration. Adsorption of DCHQ was 10 times more prevalent on the activated surface than on the polished surface.
The use of DCHQ and HQ as probe molecules permitted comparison of the activity of the electrode as a function of the level of reduction. The experiments with HQ provided a more conductive layer (k, = 0.035 vs 0.006), because of the lower potentials involved. Partial reduction of the layer a t E = -0.1 V did not increase the layer conductivity enough to extend the range of d in which the capacitance and I'HQ in- creased with layer growth. Reduction of the layer a t 0.0 V caused a substantial but limited improvement in the per- formance of the electrode. Reduction of the layer causes loss of the graphite oxide in the layer, which is presumably re- sponsible for the properties of the activated surface. Lengthy reduction of the layer used for the data in Figure 13 led to continued growth of the background charging current, but the net peak height stopped increasing; thus the performance of the electrode eventually dropped. Thinner layers (ca. 50 nm) might possibly reach a quasi steady state where further re- duction of the layer does not occur, and the current response of the electrode is stable and optimized. Note, however, that the activity of the activated GC surface can change over time and as a function of the redox potential in solution. Deac- tivation is a commonly reported phenomenon, and our results indicate that reduction of the layer eventually deactivates the surface.
CONCLUSIONS Activation of glassy carbon electrodes involves the formation
of a different phase on the surface of the electrode, which
RECEIVED for review November 12, 1987. Accepted March 18, 1988. The support of the National Science Foundation (CHE8402135) is gratefully acknowleged.