characterization of submicron aerosols at a rural site in … x.-f. huang et al.: characterization...
TRANSCRIPT
Atmos. Chem. Phys., 11, 1865–1877, 2011www.atmos-chem-phys.net/11/1865/2011/doi:10.5194/acp-11-1865-2011© Author(s) 2011. CC Attribution 3.0 License.
AtmosphericChemistry
and Physics
Characterization of submicron aerosols at a rural site in Pearl RiverDelta of China using an Aerodyne High-Resolution Aerosol MassSpectrometer
X.-F. Huang1, L.-Y. He1, M. Hu2, M. R. Canagaratna3, J. H. Kroll 4, N. L. Ng3, Y.-H. Zhang2, Y. Lin 1, L. Xue1,T.-L. Sun1, X.-G. Liu 2, M. Shao2, J. T. Jayne3, and D. R. Worsnop3
1Key Laboratory for Urban Habitat Environmental Science and Technology, School of Environment and Energy, PekingUniversity Shenzhen Graduate School, Shenzhen, China2State Key Joint Laboratory of Environmental Simulation and Pollution Control, College of Environmental Sciences andEngineering, Peking University, Beijing, China3Aerodyne Research, Inc. Billerica, MA, USA4Department of Civil and Environmental Engineering, Massachusetts Institute of Technology, Cambridge, MA, USA
Received: 21 October 2010 – Published in Atmos. Chem. Phys. Discuss.: 3 November 2010Revised: 13 January 2011 – Accepted: 1 February 2011 – Published: 1 March 2011
Abstract. The Pearl River Delta (PRD) region in SouthChina is one of the most economically developed regions inChina, but it is also noted for its severe air pollution due toindustrial/metropolitan emissions. In order to continuouslyimprove the understanding and quantification of air pollu-tion in this region, an intensive campaign was executed inPRD during October–November 2008. Here, we report andanalyze Aerodyne High-Resolution Aerosol Mass Spectrom-eter measurements at Kaiping, a rural site downwind of thehighly-polluted central PRD area, to characterize the gen-eral features of submicron particulate pollution in the re-gional air. The mean measured PM1 mass concentration was33.1±18.1 µg m−3 during the campaign and composed of or-ganic matter (33.8%), sulfate (33.7%), ammonium (14.0%),nitrate (10.7%), black carbon (6.7%), and chloride (1.1%),which is characterized by high fractions of inorganic ionsdue to huge emissions of SO2 and NOx in PRD. The av-erage size distributions of the species (except BC) were alldominated by an accumulation mode peaking at∼450 nmin vacuum aerodynamic diameter. Calculations based onhigh-resolution organic mass spectra indicate that C, H, O,and N on average contributed 56.6, 7.0, 35.1, and 1.3% tothe total organic mass, respectively, corresponding to an or-ganic matter mass to organic carbon mass ratio (OM/OC) of1.77±0.08. Based on the high-resolution organic mass spec-tral dataset observed, Positive Matrix Factorization (PMF)
Correspondence to:L.-Y. He([email protected])
analysis differentiated the organic aerosol into three compo-nents, i.e., biomass burning (BBOA) and two oxygenated(LV-OOA and SV-OOA) organic aerosols, which on aver-age accounted for 24.5, 39.6 and 35.8% of the total organicmass, respectively. The BBOA showed strong features ofbiomass burning emissions and has been mainly attributed tothe open field burning of crop residues after the harvest inPRD rural areas. The LV-OOA and SV-OOA were found tocorrespond to more aged (and thus less-volatile) and fresher(and semi-volatile) secondary organic aerosol (SOA), respec-tively. Analysis of meteorological influence supported thatregional transport from the central PRD area was the majororigin of the PM1 observed at the Kaiping site.
1 Introduction
The Pearl River Delta (PRD) region lies in the southeasterncoastal part of China and is noted for its flourishing man-ufacturing and export industries. The urbanization in PRDis now characterized by several big cities like Guangzhou,Shenzhen, and Hong Kong and many medium-small citieslinked by dense highways. The rapid economic developmentand urbanization in PRD in the recent decades comes withthe consequence of severe deterioration of its atmosphericenvironment from urban to regional scale. For example, theannual mean PM2.5 concentrations were reported to rangefrom 29 (for regional background site) to 71 (for urban site)µg m−3 in PRD with organic matter and sulfate as the mostabundant constituents (Hagler et al., 2006). The air pollution
Published by Copernicus Publications on behalf of the European Geosciences Union.
1866 X.-F. Huang et al.: Characterization of submicron aerosols at a rural site in Pearl River Delta of China
problems in PRD have been a major concern of the nationalgovernment of China and have raised global scientific in-terest (Streets et al., 2006; Zhang et al., 2008). As aerosolparticles are a complicated mixture of various species, deepunderstanding of variation of aerosol chemical and physicalproperties is essential for the purposes of source identifica-tion and pollution control. Most previous aerosol studies inPRD were based on filter sampling followed by laboratoryanalysis, which provided datasets at a coarse time resolutionlike a day. The coarse time resolution of the aerosol datasetscannot match the actual faster variation of aerosol propertiesin the real atmosphere, which strongly favors highly time-resolved on-line measurement techniques.
In order to characterize in depth the variation of chem-ical and physical properties of fine particles in the atmo-sphere of PRD, an intensive monitoring campaign supportedby the project “Synthesized Prevention Techniques for AirPollution Complex and Integrated Demonstration in KeyCity-Cluster Region” launched by the Ministry of Scienceand Technology, China, was organized by Peking Univer-sity in PRD during October–November, 2008. As part ofthis campaign, we deployed an Aerodyne high-resolutionaerosol mass spectrometer for measurement of submicronaerosol particles downwind of the most polluted central PRDarea, in order to better characterize the particulate pollutionfeatures in the well mixed and more aged regional air. Itwas the first application of a high-resolution aerosol massspectrometer in PRD. Utilizing the advantages of the high-resolution aerosol mass spectrometer, highly-time resolvedspecies variations, elemental analysis and source apportion-ment of organic aerosol (OA) in the atmosphere of PRD weresystematically studied in this paper.
2 Experimental methods
2.1 Sampling site description
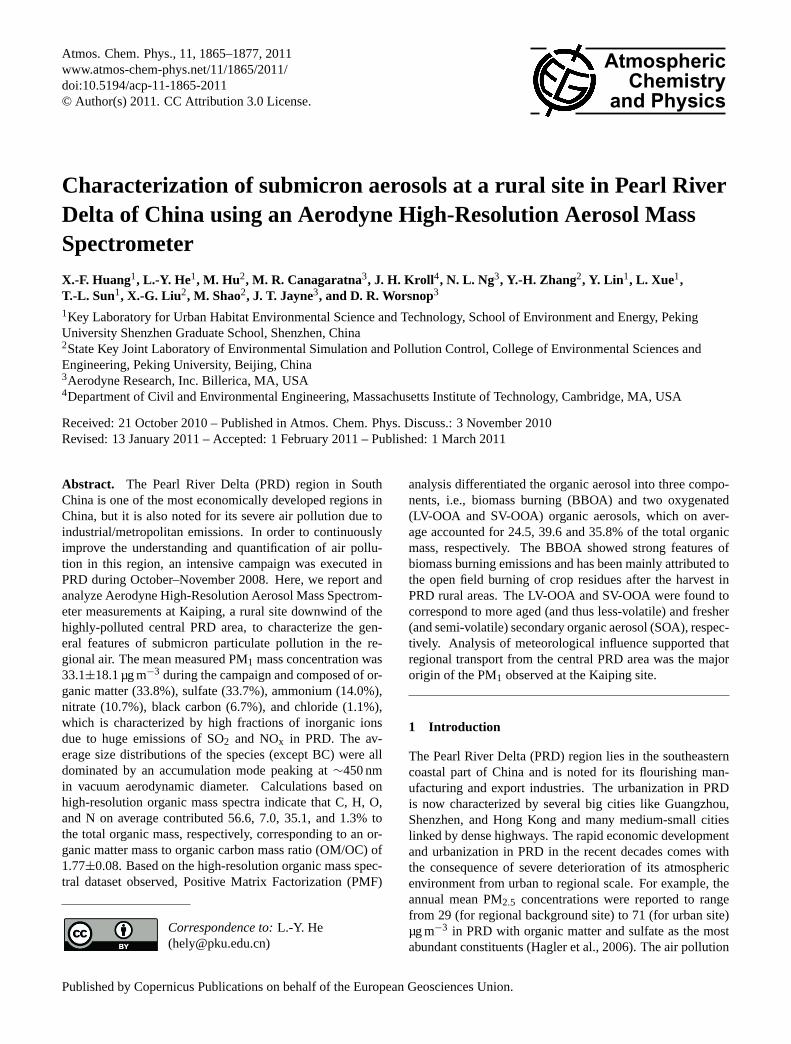
The landscape of PRD consists of a flat plain between theNan Ling Mountains in the North and the South China Seain the south. Hills surround PRD in the east, west, andnorth. In the campaign of this study, air monitoring sites wereset along the northeast-southwest axis of PRD, as shown inFig. 1, including two supersites in the rural areas, i.e., Con-ghua and Kaiping, respectively. In the period of October–November, under the influence of the East Asian monsoon,the prevailing wind in PRD is northeasterly and thus Con-ghua is upwind of the central PRD area, while Kaipingis downwind of the central PRD area, receiving pollutantsthrough regional transport. The Kaiping supersite was lo-cated at a patriotic educational base (22.32◦ N, 112.53◦ E),about 120 km away from Guangzhou. This site was sur-rounded by shrubs and eucalyptus forest and was free of anysignificant local pollution emissions.
580
581
582
Fig. 1. The location of the Kaiping monitoring site in the PRD region.
22
Fig. 1. The location of the Kaiping monitoring site in the PRDregion.
2.2 HR-ToF-AMS operation
An Aerodyne High-Resolution Time-of-Flight Aerosol MassSpectrometer (HR-ToF-AMS) was deployed in an air mon-itoring container settled at the Kaiping supersite from 12October to 18 November 2008. A detailed instrumentaldescription of HR-ToF-AMS can be found in DeCarlo etal. (2006). A PM2.5 cyclone inlet was supported on theroof of the container to remove coarse particles and intro-duce air stream into the container through a copper tubewith a flow rate of 10 l min−1. The HR-ToF-AMS sam-pled isokinetically from the center of the copper tube at aflow rate of 80 cc min−1. During the campaign, the HR-ToF-AMS operated in a cycle of 5 modes every 10 min-utes, including: 2 min V-mode to obtain the mass concen-trations of the non-refractory species; 2 min W-mode to ob-tain high resolution mass spectral data; 4 min separate PToF(particle time-of-flight) mode to determine size distributionsof species under the V-mode; and 2 min Soft-EI mode us-ing a lower EI voltage (∼13 eV). The PToF mode was notrun under the W-mode because of poor signal-to-noise. TheSoft-EI mode data are not included in this paper. The HR-ToF-AMS was calibrated for inlet flow, ionization efficiency(IE), and particle sizing at the beginning, the middle and theend of the campaign following the standard protocols (Jayneet al., 2000; Jimenez et al., 2003; Drewnick et al., 2005).The calibration of IE used size-selected pure ammonium ni-trate particles and the particle size calibration was conductedusing mono-disperse polystyrene latex spheres (PSL, den-sity = 1.05 g cm−3) (Duke Scientific, Palo Alto, California,USA) with nominal diameters of 100–700 nm. For a bettermass closure measurement of fine particles in the campaign,a Multi-Angle Absorption Photometer (MAAP, Model 5012,Thermo) coupled with a PM2.5 cyclone was used for simulta-neous measurement of refractory black carbon (BC), whichcannot be detected by HR-ToF-AMS.
Atmos. Chem. Phys., 11, 1865–1877, 2011 www.atmos-chem-phys.net/11/1865/2011/

X.-F. Huang et al.: Characterization of submicron aerosols at a rural site in Pearl River Delta of China 1867
2.3 HR-ToF-AMS data processing
Mass concentrations and size distributions of thespecies measured with the HR-ToF-AMS were calcu-lated using methods outlined in DeCarlo et al. (2006).Standard ToF-AMS data analysis software pack-ages (SQUIRREL version 1.49 and PIKA version1.08) downloaded from the ToF-AMS-Resourceswebpage (http://cires.colorado.edu/jimenez-group/ToFAMSResources/ToFSoftware/index.html) were usedto generate unit and high-resolution mass spectra from theV-mode and W-mode data respectively. For mass concentra-tion calculations an empirical particle collection efficiency(CE) factor of 0.5 was used to account for the incompletedetection of species due to particle bouncing at the vaporizerand partial transmission through the aerodynamic lens(Canagaratna et al., 2007). The relative ionization efficiency(RIE) values used in this study were 1.2 for sulfate, 1.1 fornitrate, 1.3 for chloride and 1.4 for organics (Jimenez et al.,2003, Canagaratna et al., 2007). A RIE value of 4.0–4.4was used for ammonium based on the measurement of pureNH4NO3 particles.
Positive matrix factorization (PMF) (Paatero and Tapper,1994) analysis was conducted on the high-resolution (HR)mass spectra (m/z 12–150) using the PMF evaluation tooldeveloped by Ulbrich et al. (2009). Compared with unitmass-resolution (UMR) spectra, HR mass spectra can pro-vide better separation of different organic components inPMF analysis (Docherty et al., 2008; Aiken et al., 2009, De-Carlo et al., 2010; Huang et al., 2010). The data and noisematrices input into the PMF analysis were generated with thedefault fragmentation waves in PIKA version 1.08. The noisevalues were calculated as the sum of electronic and Poissonion-counting errors for the relevant high resolution ion frag-ment (Allan et al., 2003, Ulbrich et al., 2009). The averagenoise value observed for ions during low signal time periodswas used as the minimum error value for the error matrix.The ions of H2O+, HO+, O+, and CO+ were not includedinto PMF running since they were determined according totheir relationship with CO+2 and thus including them in thePMF analysis can introduce additional weight to CO+
2 (Ul-brich et al., 2009). These ions were inserted back into themass spectra of the resulted PMF components. Weak ions(0.2<signal to noise ratio<2) were downweighted by a fac-tor of 3 while bad ions (signal to noise ratio<0.2) were re-moved from the analysis (Paatero and Hopke, 2003; Ulbrichet al., 2009). More technical details of the PMF analysis canbe found in another of our recent publication (Huang et al.,2010). Elemental analysis of the organic components iden-tified by PMF was carried out with the methods describedpreviously (Aiken et al., 2007, 2008).
3 Results and discussion
3.1 Variations of PM1 components
During the entire campaign from 12 October to 18 Novem-ber 2008, the average ambient temperature and relative hu-midity at the Kaiping site were 24±5◦C and 69±15%, re-spectively, as shown in Fig. 2a. A clear diurnal pattern ofwind during the campaign can be observed in Fig. 2b: east-northeasterly wind usually blew during the day, bringing pol-lution from the central PRD area to Kaiping, while during thenight the wind usually became calm. An exception, however,was that during 8–10 November a cold front passed throughPRD, which was characterized by continuous lower temper-ature and stronger east-northeasterly wind. There were fewrainfall events during the campaign that leaded to significantwet removal of air pollutants. These meteorological condi-tions were very typical of the fall in PRD.
Figure 2c–e present the time series of the PM1 mass con-centration (the sum of all components measured) and of PM1components during the campaign. The corresponding statis-tical values of the concentrations are summarized in TableS-1. During the entire campaign, the PM1 mass concentra-tion was observed to be in a range of 2.4–150 µg m−3, with amean value of 33.1 µg m−3. The PM1 variation traced closely(R2
= 0.86) the particle volume variation measured witha collocated Scanning Mobility Particle Sizer (SMPS, TSIInc.) and calculated based on the size distribution between 15and 600 nm in mobility diameter by assuming spherical par-ticles. The mass concentrations of PM1 components also var-ied widely. On average, organics and sulfate had equal con-centrations of 11.2 µg m−3 and together accounted for 67.5%of the PM1 mass (in Fig. 2f). Ammonium, nitrate, BC, andchloride accounted for the rest 14.0, 10.7, 6.7, and 1.1% ofthe PM1 mass, respectively. It should be noted in this pa-per that the BC mass fraction in PM1 is likely overestimatedbecause BC was measured for PM2.5 by MAAP in the cam-paign. During the cold front event (November 8–10), theconcentrations of all PM1 species showed continuous lowerconcentrations as a result of higher wind speeds. After thiscold front event, the meteorological conditions became backto normal and the PM1 species concentrations became backto higher levels. In addition, it is clearly seen that organ-ics reached and maintained at abnormally high concentrationlevels (even>50 µg/m3) after 12 November. The comparisonof average PM1 compositions before and after 12 Novemberis shown in Fig. 2g, in which it is clearly seen that organ-ics increased by a factor of 2.3 times in ambient concentra-tion during the biomass burning period. A primary explana-tion for this high OA episode is that rice straw burning be-came prevalent in PRD after the rice harvest starting in midNovember. More detailed analysis of contribution of biomassburning aerosol to OA is performed in Sect. 3.4.
Despite being a rural site, the average non-refractory PM1(NR-PM1) mass concentration (29.5 µg m−3, without BC) at
www.atmos-chem-phys.net/11/1865/2011/ Atmos. Chem. Phys., 11, 1865–1877, 2011

1868 X.-F. Huang et al.: Characterization of submicron aerosols at a rural site in Pearl River Delta of China
1086420
WS
(m s
-1)
10/16 10/21 10/26 10/31 11/5 11/10 11/152008
100806040200
PM1,
%
60
40
20
0
Mas
s C
onc.
(µg
m-3
)
16012080400
PM1 (µg m
-3)
403020100
100
Tem
p (°
C)
80604020
RH
(%)
360270180900
WD
(deg)
100806040200
SMPS
(µm
cm
-3)
Sulfate Nitrate Chloride
SMPS PM1
(a) (b) (c) (d) (e)
Ammonium Organics BC
40
30
20
10Mas
s C
onc.
(µg
m-3)
PRD PRD UK1 UK2 Ger1 Ger2 USnon-BB BB
(g)
6.7%
33.9%
14.0%
1.1%
10.7% 33.6%
(f)20
15
10
5
0
dM/d
log 1
0dva
(µg
m-3
)
7 8100
2 3 4 5 6 7 81000
(h)
2
40
30
20
10
0
dM/d
log 1
0dva
(µg
m-3
)
7 8100
2 3 4 5 6 7 81000
Org_BB Org_non_BB
2
Vaccum Aerodynatic Diameter (nm)
Org_diff
(i)
583
23
Fig. 2. The time series of(a) ambient temperature and relative humidity;(b) wind direction and wind speed;(c) PM1 mass concentrationby AMS species+BC and SMPS volume;(d) PM1 species concentrations;(e) PM1 percent composition; the average(f) PM1 chemicalcomposition;(g) comparison of average species concentrations with other urban downwind sites;(h) mean species size distributions; and(i)mean OA size distributions during biomass burning period (after 12 November) and non-biomass burning period (before 12 November).
Atmos. Chem. Phys., 11, 1865–1877, 2011 www.atmos-chem-phys.net/11/1865/2011/
X.-F. Huang et al.: Characterization of submicron aerosols at a rural site in Pearl River Delta of China 1869
20
15
10
5Mas
s C
onc.
(µg
m-3
)
Diurnal Pattern of SO4 (5-95 % whiskers)1412108642
Diurnal Pattern of NO3 (5-95 % whiskers)
12
10
8
6
4
2
Diurnal Pattern of NH4 (5-95 % whiskers)2.0
1.5
1.0
0.5
0.0
Mas
s C
onc.
(µg
m-3
)
Diurnal Pattern of Chl (5-95 % whiskers)
40
30
20
10Mas
s C
onc.
(µg
m-3
)
00-0
101
-02
02-0
303
-04
04-0
505
-06
06-0
707
-08
08-0
909
-10
10-1
111
-12
12-1
313
-14
14-1
515
-16
16-1
717
-18
18-1
919
-20
20-2
121
-22
22-2
323
-24
Diurnal Pattern of Org (5-95 % whiskers)6
5
4
3
2
1
00-0
101
-02
02-0
303
-04
04-0
505
-06
06-0
707
-08
08-0
909
-10
10-1
111
-12
12-1
313
-14
14-1
515
-16
16-1
717
-18
18-1
919
-20
20-2
121
-22
22-2
323
-24
Diurnal Pattern of BC (5-95 % whiskers)
592
593
594
595
596
597
Fig. 3. Diurnal variation box plots of PM1 species. The upper and lower boundaries of
boxes indicate the 75th and 25th percentiles; the line within the box marks the median;
the whiskers above and below boxes indicate the 90th and 10th percentiles; and cross
symbols represent the means.
25
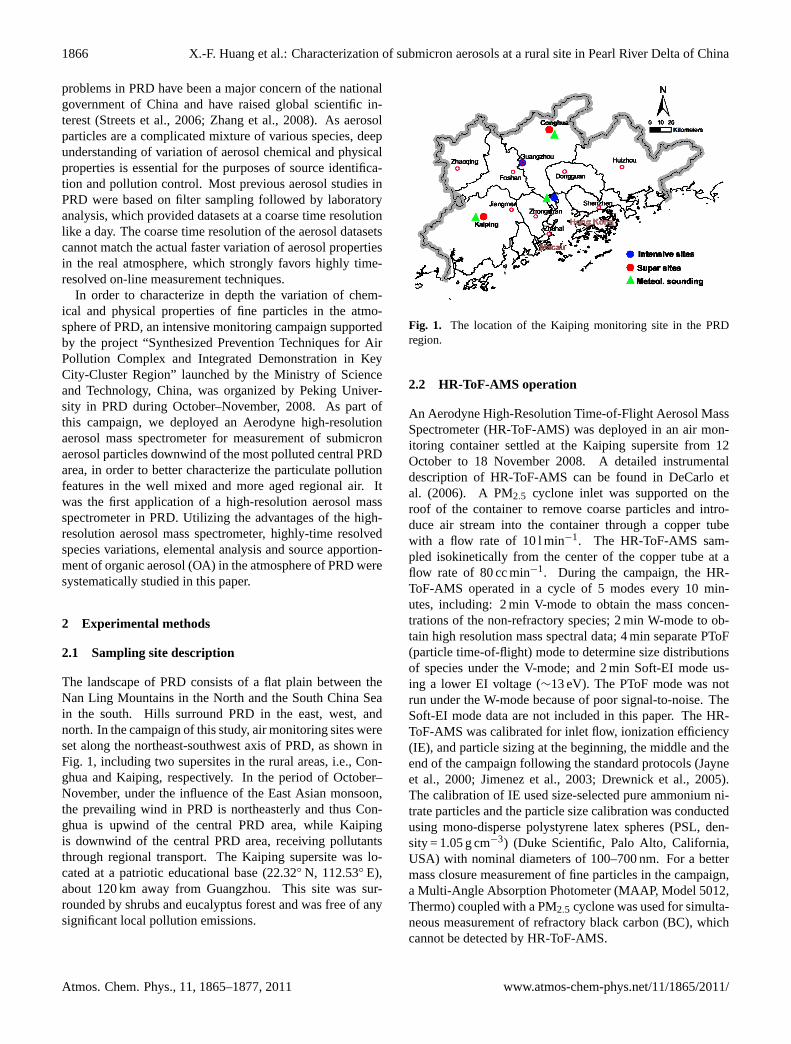
Fig. 3. Diurnal variation box plots of PM1 species. The upper and lower boundaries of boxes indicate the 75th and 25th percentiles; the linewithin the box marks the median; the whiskers above and below boxes indicate the 90th and 10th percentiles; and cross symbols representthe means.
Kaiping during normal days (i.e., before 12 November) ismuch higher than those observed in the atmospheres in devel-oped countries (below 20 µg m−3), including at five similarurban downwind sites in UK, US, and Germany (mostly be-low 10 µg m−3) (Zhang et al., 2007), as shown in Fig. 2g. Interms of NR-PM1 components, Kaiping had a far higher con-centration level for sulfate due to coal burning, which is stillthe primary energy source in China. On the other hand, theaverage NR-PM1 mass concentration at Kaiping is less thanhalf of that in urban Beijing in summer (61 µg m−3) (Huanget al., 2010).
Figure 2h presents the average species size distributionsdetermined by the HR-ToF-AMS during the campaign. Allthe species generally showed a similar accumulation modepeaking at a large size of∼450 nm, which is indicative of
aged regional aerosol (Allan et al., 2003; Alfarra et al., 2004;Zhang et al., 2005b). Their similar size distribution pat-terns suggest that most of them were likely internally mixedthrough gas-to-particle condensation processes during agingof the air mass, which is consistent with the fact that Kaip-ing was a downwind rural monitoring site. Organics showedsome additional mass distribution at smaller sizes of 100–300 nm, suggesting significant input of fresh primary organicaerosols. In the case of this campaign, biomass burningaerosol is implied to be a major contributor to the organicmass at smaller sizes as analyzed in Sect. 3.4. To support thishypothesis, the mean OA size distributions during biomassburning period (after 12 November) and non-biomass burn-ing period (before 12 November) are compared in Fig. 2i.It is clearly seen that the peak of the OA size distribution
www.atmos-chem-phys.net/11/1865/2011/ Atmos. Chem. Phys., 11, 1865–1877, 2011

1870 X.-F. Huang et al.: Characterization of submicron aerosols at a rural site in Pearl River Delta of China
moved from 450 nm to 350 nm for the biomass burning pe-riod. The difference between them yielded an OA size distri-bution peaking at∼300 nm, as shown in Fig. 2i, more clearlyindicating the contribution from fresh emissions.
3.2 Diurnal patterns of PM1 components
Figure 3 presents the diurnal variation patterns of differentPM1 species in the form of box plot. In terms of the av-erage cases, the PM1 species roughly exhibited two typesof patterns: sulfate, ammonium and organics showed rela-tively stable concentrations during the whole day; while ni-trate, chloride and black carbon showed significantly lowerconcentrations in the daytime. The higher planetary bound-ary layer (PBL) and wind speeds in the daytime shouldbe crucial factors leading to effective dilution of air pollu-tants, and the semi-volatility of nitrate and chloride wouldfurther lower their daytime concentrations due to evapora-tion at higher temperatures (Zhang et al., 2005a; Salcedo etal., 2006; Hennigan et al., 2008; Zheng et al., 2008). Thelowest concentrations of nitrate in the afternoon also sug-gest that the amount of its photochemical production couldnot overwhelm the simultaneous evaporation and dilution ef-fects. For less-volatile secondary sulfate, its daytime photo-chemical production might compensate the daytime dilutioneffect and made its concentration level relatively stable dur-ing the whole day. The diurnal variation of ammonium is acombined result of particulate (NH4)2SO4 and NH4NO3. Asaerosol organic matter has both large primary and secondarysources and also large amounts of semi-volatile compounds,the observed diurnal variation of organics was a complex out-come of those of different types of organics, which will beprovided and discussed in the next section. It is interestingto note that in the BC diurnal pattern there was an absenceof a morning peak. The morning BC peak due to rush-hourtraffic and low boundary layer was observed in many previ-ous urban studies (Lin et al., 2009; Han et al., 2009; Aiken etal., 2009). The missing morning BC peak in this campaign,however, is well consistent with the fact that Kaiping is freeof significant local traffic emissions.
3.3 Elemental composition of organic aerosol
The high-resolution organic mass spectral dataset obtainedare used to calculate the elemental composition and OM/OC(the ratio of organic mass/organic carbon mass) of OA fol-lowing the methods described previously (Aiken et al., 2007,2008). Figure 4a and b show the variations of the atomic ra-tios of H/C, N/C and O/C and the mass ratio of OM/OC ofOA during this campaign. On average, C, H, O, and N con-tributed 56.6, 7.0, 35.1, and 1.3% to the total organic mass,respectively, as shown in Fig. 4c. The H/C ratio varies in arange of 1.26–1.69, with a mean value of 1.48±0.08, whilethe O/C ratio varies in a range of 0.19–0.78, with a meanvalue of 0.47±0.07. The O/C ratio is regarded as a good
reference for oxidation state and photochemical age of or-ganic aerosols (Jimenez et al., 2009; Ng et al., 2010), andthus the variation of O/C in this campaign roughly reflectsthe variation of the aging level of OA at Kaiping. The N/Cratio ranges between 0.008 and 0.036, with a mean value of0.02±0.01. A notable feature for the N/C variation is its sig-nificant elevation during the biomass burning period. Theaverage N/C ratios before and after 12 November are 0.018and 0.029, respectively, clearly indicating significant inputof high N-containing OA during the biomass burning period.As shown in Fig. S1, the relative intensity of N-containingorganic fragments significantly increased during the biomassburning period. However, the direct HR-ToF-AMS measure-ment of burning plumes of rice straw and five other biomassmaterials in laboratory by our group did not find N/C ratiosof above 0.02 (He et al., 2010). Thus, the high N/C ratiosobserved near the end of the campaign are inferred to be pos-sibly due to secondary reactions of NH3 and NOx with organ-ics in biomass burning plumes and/or simultaneous burningof high N-containing soil materials in the open field. An-other possibility is that, biomass burning in PRD may alsoinclude other high N-containing biomass materials that werenot tested by He et al. (2010), since Laskin et al. (2009)have found high abundance of N-heterocyclic alkaloids inbiomass burning aerosols in test burns of ponderosa pine inthe US. The OM/OC ratio highly correlates with the O/Cratio (R2
= 0.98), having a mean value of 1.77±0.08. TheOM/OC ratio has been extensively used to convert organiccarbon mass to organic matter mass in filter-based aerosolchemistry studies, and 1.8 should be a reasonable approxi-mate OM/OC ratio for the Kaiping rural site based on theHR-ToF-AMS elemental analysis.
Figure 4d shows a Van Krevelen diagram (H/C versus O/Cof OA) and an apparent anti-correlation with a slope of−0.76was observed. The highlighted data points for the biomassburning period in Fig. 4d were mostly distributed in the upperleft area, suggesting that the primary biomass burning orgnicaerosols usually had relatively lower O/C ratios but higherH/C ratios. This is consistent with the elemental composi-tion of the BBOA component extracted from PMF analysisof OA in the next section. The slope is a little shallower thanthose (about−1.0) observed in Riverside, the Central Ama-zon Basin, and Mexico City (Heald et al., 2010). As sug-gested by Heald et al. (2010), the shallower slope of OA inthe Van Krevelen diagram can reflect different aging mech-anisms (such as greater tendency of alcohol addition) and/orrelative mixes of fresh and aged air masses in the PRD envi-ronment.
Figure 4e and f present the average diurnal variations ofH/C, N/C, O/C and OM/OC. Since the ratios are influencedby relative organic constitutions rather than absolute organicconcentrations, their diurnal patterns should be mostly at-tributed to the diurnal changing of relative importance of dif-ferent sources. Both the O/C and OM/OC ratios start to in-crease at 9 a.m. in the morning, and reach a peak at 3 p.m.
Atmos. Chem. Phys., 11, 1865–1877, 2011 www.atmos-chem-phys.net/11/1865/2011/

X.-F. Huang et al.: Characterization of submicron aerosols at a rural site in Pearl River Delta of China 1871
1.54
1.52
1.50
1.48
1.46
1.44
1.42
Rat
io o
f H/C
20151050Hour of Day
26x10-3
24
22
20
18
16
Ratio of N
/C
Ratio of H/C Ratio of N/C
(e)1.84
1.80
1.76
1.72
Rat
io o
f OM
/OC
20151050Hour of Day
0.60
0.55
0.50
0.45
0.40
Ratio of O
/C
Ratio of OM/OC Ratio of O/C (f)
0.6
0.4
0.2
0.0
Ratio of O
/C
10/16 10/21 10/26 10/31 11/5 11/10 11/152008
2.2
2.0
1.8
1.6
1.4
Rat
io o
f OM
/OC
1.8
1.6
1.4
1.2
1.0
Rat
io o
f H/C
50x10-3
40
30
20
10
0
Ratio of N
/C
(a) (b)
56.6%
7.0%
35.1%
1.3%
(c)
C
H O
N
2.0
1.8
1.6
1.4
1.2
1.0
Rat
io o
f H/C
1.00.80.60.40.20.0Ratio of O/C
Intercept= 1.83Slope = -0.76R
2 = 0.43
(d)
598
599
600
601
602
603
Fig. 4. The time series of (a) H/C and N/C ratios; and (b) O/C and OM/OC ratios; (c)
the average mass-based organic elemental composition; (d) the Van Krevelen diagram
(with data points during biomass burning period highlighted with blue); the average
diurnal variations of (e) H/C and N/C ratios and (f) O/C and OM/OC ratios.
26
Fig. 4. The time series of(a) H/C and N/C ratios; and(b) O/C and OM/OC ratios;(c) the average mass-based organic elemental composition;(d) the Van Krevelen diagram (with data points during biomass burning period highlighted with blue); the average diurnal variations of(e)H/C and N/C ratios and(f) O/C and OM/OC ratios.
in the afternoon when photochemistry is the most active toproduce secondary organic aerosol (SOA) with high O/C ra-tios. The H/C ratio shows a reverse diurnal pattern to thoseof O/C and OM/OC as expected. The diurnal pattern of N/Cstarts to increase at 6 p.m. in the early morning and reaches apeak at 5 p.m. in the late afternoon, which is generally con-sistent with the daily activities time of local farmers. Thismay imply that the accumulation of biomass burning-relatedaerosols in the atmosphere due to daytime burning eventscould be responsible for the continuous daytime N/C ratioincrease.
3.4 PMF analysis of organic matter composition
The PMF analysis based on the high-resolution mass spec-trum dataset observed in the campaign was performed for1 to 8 factors, and the results and diagnostics are summa-rized in Table S2. It can be seen in the table that, PMF solu-tions with factor numbers greater than 3 resulted in splittingbehavior of the existing factors, but provided no new dis-tinct factors. Based on all the qualified tests in Table S2,the three factor, FPEAK = 0, seed = 0 solution was chosenas the optimal solution for this analysis. The three organic
www.atmos-chem-phys.net/11/1865/2011/ Atmos. Chem. Phys., 11, 1865–1877, 2011

1872 X.-F. Huang et al.: Characterization of submicron aerosols at a rural site in Pearl River Delta of China
0.16
0.12
0.08
0.04
0.00
14012010080604020m/z (amu)
0.12
0.08
0.04
0.000.12
0.08
0.04
0.00Frac
tion
of O
A Si
gnal
CxHyNp+
CxHy+
CxHyOz+
CxHyOzNp+
HxO+
BBOA O/C: 0.26 H/C: 1.62 N/C: 0.06 OM/OC: 1.55
SV-OOA O/C: 0.39 H/C: 1.48 N/C: 0.01 OM/OC: 1.65
LV-OOA O/C: 0.64 H/C: 1.30 N/C: 0.02 OM/OC: 1.99
604
605
606
Fig. 5. The MS profiles of the three OA components identified by PMF in this study.
27
Fig. 5. The MS profiles of the three OA components identified by PMF in this study.
components identified in this campaign include a biomassburning (BBOA) and two oxygenated (SV-OOA and LV-OOA) organic aerosol components. Figure 5 shows the MSprofiles of the three components and Fig. 6a–c present theirtime series during the campaign. The BBOA, LV-OOA andSV-OOA on average accounted for 24.5, 39.6 and 35.8% ofthe total organic mass, respectively, as shown in Fig. 6d. Therepresentativeness of the different components identified willbe examined for their MS signatures, correlation with trac-ers, and other characteristics in the following (Zhang et al.,2005b; Ulbrich et al., 2009).
The BBOA MS has an O/C ratio of 0.27 and is dis-tinguished by a prominent contribution ofm/z 60, whichis a good tracer ion for biomass burning-emitted aerosols(Alfarra et al., 2007; Aiken et al., 2009). The O/C ra-tio of the BBOA is similar to those (0.18–0.26) measuredfor laboratory-produced different primary biomass burningorganic aerosols by our group, and the HR-MS of BBOAalso showed high correlations with those of the primary OAs(R2
= 0.67–0.75) (He et al., 2010). The O/C ratio of theBBOA is also similar to that (0.30) of the BBOA identifiedin a similar PMF study of the AMS dataset measured in Mex-ico City (Aiken et al., 2009). In the PMF-resolved time se-ries of BBOA, as shown in Fig. 6a, the large elevation of theBBOA concentration after 12 November (ave. 9.12 µg m−3
compared to ave. 1.36 µg m−3 before 12 November) is con-sistent with the fact that biomass burning smoke could beeasily smelled at the sampling site during that time. The
identification of BBOA in this campaign was an expected re-sult because there are extensive farmlands around the Kaip-ing site and the farmers in PRD have the habit to burn off ricestraw after the rice harvest around mid November. The timeseries of BBOA is compared to that of the collocated mea-surement of acetonitrile (in Fig. 6a), a well-known gaseoustracer for biomass burning emissions (de Gouw et al., 2003),using a Proton Transfer Reaction Mass Spectrometry (PTR-MS) (Yuan et al., 2010). The correlation between BBOAand acetonitrile (R2
= 0.60) is consistent with the interpreta-tion that this component has a biomass burning source. Cor-relation between BC and BBOA (R2
= 0.49) and betweenBC and acetonitrile (R2
= 0.46) further indicate that biomassburning was an important source of BC at Kaiping.
The MS of the two OOA components had O/C ratios of0.64 and 0.39, respectively, and were both characterized byprominent CxHyOz fragments, especially CO+2 (m/z 44),suggesting large presence of oxidized organic compounds.OOAs have been extensively identified in previous factoranalyses of AMS ambient aerosol datasets and shown to be agood surrogate of SOA (Zhang et al., 2005b, 2007; Jimenezet al., 2009; Ng et al., 2010). Two types of OOAs with dif-ferent O/C ratios have been observed in many places fromurban, suburban, to rural ambient: the OOA with higherO/C, which is more oxidized and aged, is referred to as low-volatility OOA (LV-OOA); while the OOA with lower O/C,which is less oxidized and fresher, is referred to as semi-volatile OOA (SV-OOA) (Jimenez et al., 2009; Ng et al.,
Atmos. Chem. Phys., 11, 1865–1877, 2011 www.atmos-chem-phys.net/11/1865/2011/

X.-F. Huang et al.: Characterization of submicron aerosols at a rural site in Pearl River Delta of China 1873
30
20
10
0
SO
4 (µg m-3)
10/16 10/21 10/26 10/31 11/5 11/10 11/152008
2
1
0C
H3 C
N
20
10
0BB
OA
(µg
m-3
)
20151050S
V-O
OA
(µg
m-3
)
15
10
5
0LV-O
OA
(µg
m-3
)
20151050
NO
3 (µg m-3)
SV-OOA NO3
LV-OOA SO4
BBOA CH3CN BC
(a) (b) (c)
8
6
4
2
0
Mas
s C
onc.
( µg
m-3
)
201612840Hour of Day
0.50
0.45
0.40
0.35
0.30
0.25
0.20
0.15
CH
3 CN
LV-OOA SV-OOA BBOA CH3CN
(e) 39.6%
35.8% 24.5%
(d)
607
608
609
610
611
Fig. 6. Time series of (a–c) the OA components and other relevant species; (d) the
average OA composition; and (e) the diurnal variations of the OA components and
acetonitrile.
28
Fig. 6. Time series of(a–c) the OA components and other relevant species;(d) the average OA composition; and(e) the diurnal variationsof the OA components and acetonitrile.
2010). OOA time trends typically correlate well with thoseof inorganic secondary aerosol species, with SV-OOA cor-relating best with nitrate due to the common semi-volatilityand LV-OOA correlating best with sulfate due to the commonlow volatility (Docherty et al., 2008; Huffman et al., 2009;Jimenez et al., 2009; Ng et al., 2010). Based on the sum-marization of O/C ratio ranges of OOAs revealed in globalAMS measurements, Ng et al. (2010) have shown a widerange of O/C ratio for both LV-OOA (0.73±0.14) and SV-OOA (0.35±0.14), reflecting the fact that there is a con-tinuum of OOA properties in ambient aerosols. The O/Cratios of the two OOA components identified in this cam-paign lie within the typical ranges for LV-OOA and SV-OOA,therefore they are referred to as LV-OOA and SV-OOA, re-spectively, following the existing terminology. In this cam-paign, the LV-OOA correlated best with sulfate (R2
= 0.42)rather than with nitrate (R2
= 0.13) while the SV-OOA cor-related best with nitrate (R2
= 0.65) rather than with sulfate
(R2= 0.30), well consistent with the findings of some previ-
ous AMS measurements (Lanz et al., 2007; Docherty et al.,2008; Ulbrich et al., 2009, Huffman et al., 2009). When con-sidering LV-OOA and SV-OOA together, the sum of themshowed a quite high correlation with the sum of sulfate andnitrate (R2
= 0.78), further confirming their secondary natureof OOA.
It is interesting to note that a hydrocarbon-like (HOA) or-ganic aerosol component, typically distinguished by the ionseries of CnH+
2n+1 and CnH+
2n−1 and low O/C ratios of<0.2(Jimenez et al., 2009; Ng et al., 2010), is not identified inthis PMF analysis. HOA has been extensively identified inprevious AMS measurements and is mainly attributed to pri-mary combustion sources (Zhang et al., 2007; Lanz et al.,2007; Ulbrich et al., 2009). In this PMF analysis, increas-ing the number of PMF factors only resulted in splitting ofthe OOA components, as shown in Table S2, and did notyield a new HOA-like component. The fact that a distinct
www.atmos-chem-phys.net/11/1865/2011/ Atmos. Chem. Phys., 11, 1865–1877, 2011
1874 X.-F. Huang et al.: Characterization of submicron aerosols at a rural site in Pearl River Delta of China
612
613 Fig. 7. The variation of PM1 component concentration with wind direction and speed.
29
Fig. 7. The variation of PM1 component concentration with wind direction and speed.
HOA component was not extracted for this campaign is a re-sult of Kaiping being a rural site about 120 km away down-wind of the central PRD area. Previous studies have shown asharp reduction in the HOA contribution to total OA loadingsdownwind of cities. As illustrated in Zhang et al. (2007), deGouw et al. (2005), and Jimenez et al. (2009), HOA emit-ted from cities can be quickly diluted in regional air dom-inated by OOA and overwhelmed by SOA production. Inaddition, the HOA from the central PRD area could be oxi-dized quickly during transport because the atmospheric ox-idizing capacity in PRD was demonstrated to be unexpect-edly high (Hofzumahaus et al., 2009). Very small contribu-tions of HOA to total OA mass were identified at two similarurban downwind sites, i.e., Taunus, Germany and off NewEngland coast, US, in previous AMS measurements and noHOA was identified in analyses of data from other remotesites (Jimenez et al., 2009).
As shown in Fig. 6e, the average diurnal patterns of thethree OA components are also quite different and well con-sistent with their own origins. The BBOA showed a smallmorning peak and a large evening peak, which is similar tothat of acetonitrile. This type of diurnal pattern could bereasonably attributed to the combined result of the low PBLheights and burning events in the morning and evening. TheLV-OOA showed a continuous concentration increase in thedaytime, reflecting its large photochemical production in thedaytime. As LV-OOA is regarded as aged aerosol, it is in-ferred to be well mixed in PBL. Therefore, unlike the near-
ground emissions, the elevation of PBL in the daytime mightnot have a strong dilution effect on LV-OOA concentrations.In contrast to the LV-OOA, the diurnal variation of SV-OOAshowed large concentration decease in the daytime, similarto that of nitrate, which should be the combined result of itssemi-volatility and high PBL heights in the daytime.
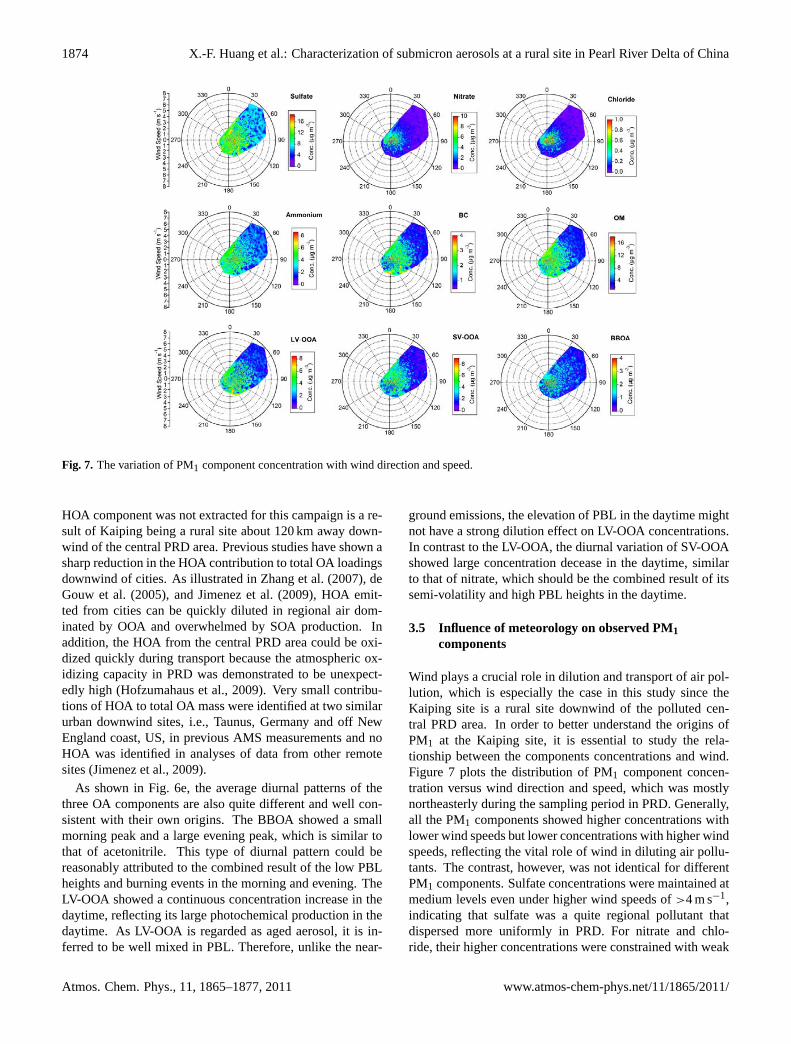
3.5 Influence of meteorology on observed PM1components
Wind plays a crucial role in dilution and transport of air pol-lution, which is especially the case in this study since theKaiping site is a rural site downwind of the polluted cen-tral PRD area. In order to better understand the origins ofPM1 at the Kaiping site, it is essential to study the rela-tionship between the components concentrations and wind.Figure 7 plots the distribution of PM1 component concen-tration versus wind direction and speed, which was mostlynortheasterly during the sampling period in PRD. Generally,all the PM1 components showed higher concentrations withlower wind speeds but lower concentrations with higher windspeeds, reflecting the vital role of wind in diluting air pollu-tants. The contrast, however, was not identical for differentPM1 components. Sulfate concentrations were maintained atmedium levels even under higher wind speeds of>4 m s−1,indicating that sulfate was a quite regional pollutant thatdispersed more uniformly in PRD. For nitrate and chlo-ride, their higher concentrations were constrained with weak
Atmos. Chem. Phys., 11, 1865–1877, 2011 www.atmos-chem-phys.net/11/1865/2011/

X.-F. Huang et al.: Characterization of submicron aerosols at a rural site in Pearl River Delta of China 1875
winds (about<2 m s−1), which implies either more localproduction or more gas-to-particle condensation at lowerwind speeds. Considering Kaiping was a rural site with lesslocal emissions, more gas-to-particle condensation of HNO3due to air pollutant accumulation under calm air conditionsseems to be more plausible. Higher BBOA concentrationswere mostly associated with wind speeds of<2 m s−1, de-noting the dominant role of local burning events. However,there are still some higher BBOA concentrations correspond-ing to wind speeds of>2 m s−1, suggesting that the regionaltransport of BBOA also existed. Other PM1 components hadhigher and relatively uniform concentrations associated with0–4 m s−1 northeasterly wind, without even higher concen-trations under weak winds (<2 m s−1). This strongly sug-gests that regional transport from central PRD rather than lo-cal emission was the major origins of these PM1 componentsat the Kaiping site.
4 Conclusions
Based on the HR-ToF-AMS measurement at a rural sitedownwind of the highly-polluted central PRD area dur-ing October–November, 2008, the PM1 mass concentra-tions in 10 min-resolution varied largely between 2.4 and150 µg m−3, with a mean value of 33.1 µg m−3. Organicsand sulfate were the most abundant species, each account-ing for ∼1/3 of the total mass, respectively. The high con-centration levels of PM1 mass and sulfate are a feature offine aerosol particles in PRD in comparison with other simi-lar measurements in developed countries. Secondary organicaerosol was found to dominate the OA at this rural site withthe following characteristics: (1) the O/C ratio had a cleardiurnal pattern that is consistent with that of photochemi-cal activity; (2) PMF analysis indicated that LV-OOA andSV-OOA totally accounted for about three quarters of the to-tal OA; (3) the sum of LV-OOA and SV-OOA showed highcorrelation with the sum of sulfate and nitrate, strongly con-firming their secondary nature. It is interestingly found thatBBOA comprised a large OA fraction of about a quarter inthis campaign, with its concentration highly elevated after 12November due to the open field burning of crop residues afterharvest in PRD. High N/C ratios were found to be closely as-sociated with biomass burning. Analysis of meteorologicalinfluence supported that regional transport from the centralPRD area was the major origin of the PM1 components ob-served at this rural site.
Supplement related to this article is available online at:http://www.atmos-chem-phys.net/11/1865/2011/acp-11-1865-2011-supplement.pdf.
Acknowledgements.This work was supported by the “863” project(2006AA06A308) from the Ministry of Science and Technologyof China, the National Natural Science Funds for DistinguishedYoung Scholar (21025728), and the National Natural ScienceFoundation of China (40805049, 20777001).
Edited by: C. K. Chan
References
Aiken, A. C., DeCarlo, P. F., and Jimenez, J. L.: Elemental analysisof organic species with electron ionization high-resolution massspectrometry, Anal. Chem., 79, 8350–8358, 2007.
Aiken, A. C., Decarlo, P. F., Kroll, J. H., Worsnop, D. R., Huff-man, J. A., Docherty, K. S., Ulbrich, I. M., Mohr, C., Kim-mel, J. R., Sueper, D., Sun, Y., Zhang, Q., Trimborn, A., North-way, M., Ziemann, P. J., Canagaratna, M. R., Onasch, T. B., Al-farra, M. R., Prevot, A. S., Dommen, J., Duplissy, J., Metzger,A., Baltensperger, U., and Jimenez, J. L.: O/C and OM/OC ra-tios of primary, secondary, and ambient organic aerosols withhigh-resolution time-of-flight aerosol mass spectrometry, Envi-ron. Sci. Technol., 42, 4478–4485, 2008.
Aiken, A. C., Salcedo, D., Cubison, M. J., Huffman, J. A., De-Carlo, P. F., Ulbrich, I. M., Docherty, K. S., Sueper, D., Kim-mel, J. R., Worsnop, D. R., Trimborn, A., Northway, M., Stone,E. A., Schauer, J. J., Volkamer, R., Fortner, E., de Foy, B., Wang,J., Laskin, A., Shutthanandan, V., Zheng, J., Zhang, R., Gaffney,J., Marley, N. A., Paredes-Miranda, G., Arnott, W. P., Molina,L. T., Sosa, G., and Jimenez, J. L. : Mexico City aerosol analysisduring MILAGRO using high resolution aerosol mass spectrom-etry at the urban supersite (T0)-Part 1: Fine particle composi-tion and organic source apportionment, Atmos. Chem. Phys., 9,6633–6653,doi:10.5194/acp-9-6633-2009, 2009.
Alfarra, M. R., Coe, H., Allan, J. D., Bower, K. N., Boudries, H.,Canagaratna, M. R., Jimenez, J. L., Jayne, J. T., Garforth, A. A.,Li, S. -M., and Worsnop, D. R.: Characterization of urban and ru-ral organic particulate in the lower Fraser valley using two aero-dyne aerosol mass spectrometers, Atmos. Environ., 38, 5745–5758, 2004.
Alfarra, M. R., Prevot, A. S. H., Szidat, S., Sandradewi, J., Weimer,S., Lanz, V. A., Schreiber, D., Mohr, M., and Baltensperger, U.:Identification of the mass spectral signature of organic aerosolsfrom wood burning emissions, Environ. Sci. Technol., 41, 5770–5777, 2007.
Allan, J. D., Alfarra, M. R., Bower, K. N., Williams, P. I., Gal-lagher, M. W., Jimenez, J. L., McDonald, A. G., Nemitz, E.,Canagaratna, M. R., Jayne, J. T., Coe, H., and Worsnop, D. R.:Quantitative sampling using an Aerodyne AerosolMass Spec-trometer. Part 2: Measurements of fine particulate chemical com-position in two UK Cities, J. Geophys. Res.-Atmos., 108, 4091,doi:10.1029/2002JD002359, 2003.
Canagaratna, M. R., Jayne, J. T., Jimenez, J. L., Allan, J. D., Alfarra,M. R., Zhang, Q., Onasch, T. B., Drewnick, F., Coe, H., Middle-brook, A., Delia, A., Williams, L. R., Trimborn, A. M., North-way, M. J., DeCarlo, P. F., Kolb, C. E., Davidovits, P., andWorsnop, D. R.: Chemical and microphysical characterizationof ambient aerosols with the aerodyne aerosol mass spectrome-ter, Mass Spectrom. Rev., 26, 185–222, 2007.
www.atmos-chem-phys.net/11/1865/2011/ Atmos. Chem. Phys., 11, 1865–1877, 2011
1876 X.-F. Huang et al.: Characterization of submicron aerosols at a rural site in Pearl River Delta of China
de Gouw, J. A., Warneke, C., Parrish, D. D., Holloway, J. S.,Trainer, M., and Fehsenfeld, F. C.: Emission sources and oceanuptake of acetonitrile (CH3CN) in the atmosphere, J. Geophys.Res., 108(D11), 4329,doi:10.1029/2002JD002897, 2003.
de Gouw, J. A., Middlebrook, A. M., Warneke, C., Goldan, P.D., Kuster, W. C., Roberts, J. M., Fehsenfeld, F. C., Worsnop,D. R., Canagaratna, M. R., Pszenny, A. A. P., Keene, W. C.,Marchewka, M., Bertman, S. B., and Bates, T. S.: Budget oforganic carbon in a polluted atmosphere: results from the NewEngland Air Quality Study in 2002, J. Geophys. Res-Atmos.,110, D16305, doi:16310.11029/12004JD005623, 2005.
DeCarlo, P. F., Kimmel, J. R., Trimborn, A., Northway M.J., Jayne, J. T., Aiken, A. C., Gonin, M., Fuhrer, K., Hor-vath, T., Docherty, K. S., Worsnop, D. R., and Jimenez, J.L.: Field-deployable, high-resolution time-of-flight aerosol massspectrometer, Anal. Chem., 78, 8281–8289, 2006.
DeCarlo, P. F., Ulbrich, I. M., Crounse, J., de Foy, B., Dunlea,E. J., Aiken, A. C., Knapp, D., Weinheimer, A. J., Campos,T., Wennberg, P. O., and Jimenez, J. L.: Investigation of thesources and processing of organic aerosol over the Central Mex-ican Plateau from aircraft measurements during MILAGRO, At-mos. Chem. Phys., 10, 5257–5280,doi:10.5194/acp-10-5257-2010, 2010.
Docherty, K. S., Stone, E. A., Ulbrich, I. M., DeCarlo, P. F., Sny-der, D. C., Schauer, J. J., Peltier, R. E., Weber, R. J., Murphy, S.M., Seinfeld, J. H., Grover, B. D., Eatough, D. J., and Jimenez, J.L.: Apportionment of primary and secondary organic aerosols inSouthern California during the 2005 Study of Organic Aerosolsin Riverside (SOAR-1), Environ. Sci. Technol., 42, 7655–7662,2008.
Drewnick, F., Hings, S. S., DeCarlo, P., Jayne, J. T., Gonin,M., Fuhrer, K., Weimer, S., Jimenez, J. L., Demerjian, K. L., Bor-rmann, S., and Worsnop, D. R.: A new time-of-flight aerosolmass spectrometer (TOF-AMS)-Instrument description and firstfield deployment, Aerosol. Sci. Tech., 39, 637–658, 2005.
Hagler, G. S. W., Bergin, M. H., Salmon, L. G., Yu, J. Z., Wan, E. C.H., Zheng, M., Zeng, L. M., Kiang, C. S., Zhang, Y. H., Lau, A.K. H., and Schauer, J. J.: Source areas and chemical compositionof fine particulate matter in the Pearl River Delta region of China,Atmos. Environ., 40, 3802–3815, 2006.
Han, S., Kondo, Y., Oshima, N., Takegawa, N., Miyazaki, Y., Hu,M., Lin, P., Deng, Z., Zhao, Y., Sugimoto, N., and Wu, Y.: Tem-poral variations of elemental carbon in Beijing, J. Geophys. Res.-Atmos., 114, D23202,doi:10.1029/2009JD012027, 2009.
He, L.-Y., Lin, Y., Huang, X.-F., Guo, S., Xue, L., Su, Q., Hu,M., Luan, S.-J., and Zhang, Y.-H.: Characterization of high-resolution aerosol mass spectra of primary organic aerosol emis-sions from Chinese cooking and biomass burning, Atmos. Chem.Phys., 10, 11535–11543,doi:10.5194/acp-10-11535-2010, 2010.
Heald, C. L., Kroll, J. H., Jimenez, J. L., Docherty, K. S., DeCarlo,P. F., Aiken, A. C., Chen, Q., Martin, S. T., Farmer, D. K., andArtaxo, P.: A simplified description of the evolution of organicaerosol composition in the atmosphere, Geophys. Res. Lett., 37,L08803,doi:10.1029/2010GL042737, 2010.
Hennigan, C. J., Sullivan, A. P., Fountoukis, C. I., Nenes, A., Heco-bian, A., Vargas, O., Case Hanks, A. T., Huey, L. G., Lefer, B.L., Russell, A. G., and Weber, R. J.: On the volatility and pro-duction mechanisms of newly formed nitrate and water solubleorganic aerosol in Mexico City, Atmos. Chem. Phys., 8, 3761–
3768,doi:10.5194/acp-8-3761-2008, 2008.Hofzumahaus, A., Rohrer, F., Lu K., Bohn, B., Brauers, T., Chang,
C. C., Fuchs, H., Holland, F., Kita, K., Kondo, Y., Li, X., Lou, S.,Shao, M., Zeng, L., Wahner, A., and Zhang, Y.: Amplified tracegas removal in the troposphere, Science, 324, 1702–1704, 2009.
Huang, X.-F., He, L.-Y., Hu, M., Canagaratna, M. R., Sun,Y., Zhang, Q., Zhu, T., Xue, L., Zeng, L.-W., Liu, X.-G., Zhang,Y.-H., Jayne, J. T., Ng, N. L., and Worsnop, D. R.: Highlytime-resolved chemical characterization of atmospheric submi-cron particles during 2008 Beijing Olympic Games using anAerodyne High-Resolution Aerosol Mass Spectrometer, Atmos.Chem. Phys., 10, 8933-8945,doi:10.5194/acp-10-8933-2010,2010.
Huffman, J. A., Docherty, K. S., Aiken, A. C., Cubison, M. J., Ul-brich, I. M., Decarlo, P. F., Sueper, D., Jayne, J. T., Worsnop,D. R., Ziemann, P. J., and Jimenez, J. L.: Chemically resolvedaerosol volatility measurements from two megacity field studies,Atmos. Chem. Phys., 9, 7161–7182,doi:10.5194/acp-9-7161-2009, 2009.
Jayne, J. T., Leard, D. C., Zhang, X. F., Davidovits, P., Smith, K.A., Kolb, C. E., and Worsnop, D. R.: Development of an aerosolmass spectrometer for size and composition analysis of submi-cron particles, Aerosol. Sci. Tech., 33, 49–70, 2000.
Jimenez, J. L., Jayne, J. T., Shi, Q., Kolb, C. E., Worsnop, D.R., Yourshaw, I., Seinfeld, J. H., Flagan, R. C., Zhang, X.-F.,Smith, K. A., Morris, J. W., and Davidovits, P.: Ambient aerosolsampling using the Aerodyne Aerosol Mass Spectrometer, J.Geophys. Res.-Atmos., 108, 8425,doi:10.1029/2001JD001213,2003.
Jimenez1, J. L., Canagaratna, M. R., Donahue, N. M., Prevot, A.S. H., Zhang, Q., Kroll, J. H., DeCarlo, P. F., Allan, J. D. ,Coe, H., Ng, N. L., Aiken, A. C., Docherty, K. S., Ulbrich, I. M.,Grieshop, A. P., Robinson, A. L., Duplissy, J., Smith, J. D., Wil-son, K. R., Lanz, V. A., Hueglin, C., Sun, Y. L., Tian, J., Laakso-nen, A., Raatikainen, T., Rautiainen, J., Vaattovaara, P., Ehn, M.,Kulmala, M., Tomlinson, J. M., Collins, D. R., Cubison, M. J.,Dunlea, E. J., Huffman, J. A., Onasch, T. B., Alfarra, M. R.,Williams, P. I., Bower, K., Kondo, Y., Schneider, J., Drewnick,F., Borrmann, S., Weimer, S., Demerjian, K., Salcedo, D., Cot-trell, L., Griffin, R., Takami, A., Miyoshi, T., Hatakeyama, S.,Shimono, A., Sun, J. Y., Zhang, Y. M., Dzepina, K., Kimmel,J. R., Sueper, D., Jayne, J. T., Herndon, S. C., Trimborn, A.M., Williams, L. R., Wood, E. C., Middlebrook, A. M., Kolb, C.E., Baltensperger, U., and Worsnop, D. R.: Evolution of organicaerosols in the atmosphere, Science, 326, 1525–1529, 2009.
Kroll, J. H., Smith, J. D., Che, D. L., Kessler, S. H., Worsnop, D. R.,and Wilson, K. R.: Measurement of fragmentation and function-alization pathways in the heterogeneous oxidation of oxidized or-ganic aerosol, Phys. Chem. Chem. Phys., 11, 8005–8014, 2009.
Lanz, V. A., Alfarra, M. R., Baltensperger, U., Buchmann, B.,Hueglin, C., and Prevot, A. S. H.: Source apportionment ofsubmicron organic aerosols at an urban site by factor analyti-cal modelling of aerosol mass spectra, Atmos. Chem. Phys., 7,1503–1522,doi:10.5194/acp-7-1503-2007, 2007.
Laskin, A., Smith, J. S., and Laskin, J.: Molecular characterizationof nitrogen-containing organic compounds in biomass burningaerosols using high-resolution mass spectrometry, Environ. Sci.Technol., 43, 3764–3771, 2009.
Lin, P., Hu, M., Deng, Z., Slanina, J., Han, S., Kondo, Y., Takegawa,
Atmos. Chem. Phys., 11, 1865–1877, 2011 www.atmos-chem-phys.net/11/1865/2011/

X.-F. Huang et al.: Characterization of submicron aerosols at a rural site in Pearl River Delta of China 1877
N., Miyazaki, Y., Zhao, Y., and Sugimoto, N.: Seasonal and diur-nal variations of organic carbon in PM2.5 in Beijing and the es-timation of secondary organic carbon, J. Geophys. Res.-Atmos.,114, D00G11,doi:10.1029/2008JD010902, 2009.
Ng, N. L., Canagaratna, M. R., Zhang, Q., Jimenez, J. L., Tian,J., Ulbrich, I. M., Kroll, J. H., Docherty, K. S., Chhabra, P. S.,Bahreini, R., Murphy, S. M., Seinfeld, J. H., Hildebrandt, L.,Donahue, N. M., Decarlo, P. F., Lanz, V. A., Prevot, A. S. H.,Dinar, E., Rudich, Y., and Worsnop, D. R.: Organic aerosolcomponents observed in Northern Hemispheric datasets fromAerosol Mass Spectrometry, Atmos. Chem. Phys., 10, 4625–4641,doi:10.5194/acp-10-4625-2010, 2010.
Paatero, P. and Hopke, P. K.: Discarding or downweighting high-noise variables in factor analytic models, Anal. Chim. Acta, 490,277–289, 2003.
Paatero, P. and Tapper, U.: Positive Matrix Factorization-a Nonneg-ative Factor Model with Optimal Utilization of Error-Estimatesof Data Values, Environmetrics, 5, 111–126, 1994.
Salcedo, D., Onasch, T. B., Dzepina, K., Canagaratna, M. R.,Zhang, Q., Huffman, J. A., Decarlo, P. F., Jayne, J. T., Mor-timer, P., Worsnop, D. R., Kolb, C. E., Johnson, K. S., Zuberi,B., Marr, L. C., Volkamer, R., Molina, L. T., Molina, M. J., Car-denas, B., Bernabe, R. M., Marquez, C., Gaffney, J. S., Marley,N. A., Laskin, A., Shutthanandan, V., Xie, Y., Brune, W., Lesher,R., Shirley, T., and Jimenez, J. L.: Characterization of ambientaerosols in Mexico City during the MCMA-2003 campaign withAerosol Mass Spectrometry: results from the CENICA Super-site, Atmos. Chem. Phys., 6, 925–946,doi:10.5194/acp-6-925-2006, 2006.
Streets, D., Yu, C., Bergin, M., Wang, X., and Carmichael, G. R.:Modeling study of air pollution due to the manufacture of exportgoods in China’s Pearl River Delta, Environ. Sci. Technol., 40,2099–2107, 2006.
Ulbrich, I. M., Canagaratna, M. R., Zhang, Q., Worsnop, D. R., andJimenez, J. L.: Interpretation of organic components from Posi-tive Matrix Factorization of aerosol mass spectrometric data, At-mos. Chem. Phys., 9, 2891–2918,doi:10.5194/acp-8-2891-2009,2009.
Yuan, B., Liu, Y., Shao, M., Lu, S. -H., and Streets, D. G.: BiomassBurning Contributions to Ambient VOCs Species at a ReceptorSite in the Pearl River Delta (PRD), China, Environ. Sci. Tech-nol., 44(12), 4577–4582, 2010.
Zhang, Q., Canagaratna, M. R., Jayne, J. T., Worsnop, D. R., andJimenez, J. -L.: Time- and size-resolved chemical compositionof submicron particles in Pittsburgh: Implications for aerosolsources and processes, J. Geophys. Res.-Atmos., 110, D07S09,doi:10.1029/2004JD004649, 2005a.
Zhang, Q., Worsnop, D. R., Canagaratna, M. R., and Jimenez, J.L.: Hydrocarbon-like and oxygenated organic aerosols in Pitts-burgh: insights into sources and processes of organic aerosols,Atmos. Chem. Phys., 5, 3289–3311,doi:10.5194/acp-5-3289-2005, 2005b.
Zhang, Q., Jimenez, J. L., Canagaratna, M. R., Allan, J. D., Coe,H., Ulbrich, I., Alfarra, M. R., Takami, A., Middlebrook, A.M., Sun, Y. L., Dzepina, K., Dunlea, E., Docherty, K., De-Carlo, P. F., Salcedo, D., Onasch, T., Jayne, J. T., Miyoshi,T., Shimono, A., Hatakeyama, S., Takegawa, N., Kondo, Y.,Schneider, J., Drewnick, F., Borrmann, S., Weimer, S., Demer-jian, K., Williams, P., Bower, K., Bahreini, R., Cottrell, L.,Griffin, R. J., Rautiainen, J., Sun, J. Y., Zhang, Y. M., andWorsnop, D. R.: Ubiquity and dominance of oxygenated speciesin organic aerosols in anthropogenically-influenced NorthernHemisphere midlatitudes, Geophys. Res. Lett., 34, L13801,doi:10.1029/2007GL029979, 2007.
Zhang, Y. H., Hu M., Zhong L. J., Wiedensohler, A., Liu, S. C.,Andreaee, M. O., Wang, W., and Fang, S. J.: Regional Inte-grated Experiments on Air Quality over Pearl River Delta 2004(PRIDE-PRD2004): Overview, Atmos. Environ., 42(25), 6157-6173, 2008.
Zheng, J., Zhang, R., Fortner, E. C., Molina, L., Aiken, A. C.,Jimenez, J. L., Gaggeler, K., Dommen, J., Dusanter, S., Stevens,P. S., and Tie, X.: Measurements of HNO3 and N2O5 us-ing ion drift-chemical ionization mass spectrometry during theMILAGRO/MCMA-2006 campaign, Atmos. Chem. Phys., 8,6823–6838,doi:10.5194/acp-8-6823-2008, 2008.
www.atmos-chem-phys.net/11/1865/2011/ Atmos. Chem. Phys., 11, 1865–1877, 2011