characterization of the effect of pyrolysis in torrefied ... · method of biomass pre-treatment and...
TRANSCRIPT

International Conference on Renewable Energies and Power Quality (ICREPQ’18) Salamanca (Spain), 21th to 23th March, 2018
Renewable Energy and Power Quality Journal (RE&PQJ) ISSN 2172-038 X, No.16 April 2018
Characterization of the effect of pyrolysis in torrefied wood chips
L.J.R. Nunes1, R. Godina2, J.C.O. Matias1,2, and J.P.S. Catalão2,3,4
1 GOVCOPP and DEGEIT, University of Aveiro, 3810-193 Aveiro, Portugal 2 C-MAST, University of Beira Interior, 6201-001 Covilhã, Portugal
3 INESC TEC and Faculty of Engineering of the University of Porto, 4200-465 Porto, Portugal 4 INESC-ID, Instituto Superior Técnico, University of Lisbon, 1049-001 Lisbon, Portugal
e-mails: [email protected], [email protected], [email protected], [email protected] Abstract. The pyrolysis behavior of torrefied wood produced in Portugal was investigated. Torrefaction is the thermochemical upgrading of biomass at approximately 300ºC in an atmosphere free of oxidizing agents to increase fuel density and to improve fuel quality, decreasing moisture and increasing heating value. Torrefied woodchips were pyrolysed at pressurized conditions in an inert atmosphere at 600ºC. All the condensable liquids were sampled for analyses. All pyrolysis hydrocarbon liquids were analysed using simulated distillation (simdis) and gas chromatography mass spectrometry (GCMS). Torrefied wood hydrocarbon liquid showed higher concentrations of aliphatic aldehydes liquid. A decrease in all the other molecular components was observed for the torrefied wood hydrocarbon liquid. The main organic components in the torrefied wood pyrolysis water fractions were acids, alcohols and aliphatic oxygenates. Torrefied wood pyrolysis water exhibited a significantly lower acid concentration when compared to non-torrefied wood pyrolysis water. The biomass chars (prepared at 600ºC) were analysed using proximate analyses and carbon dioxide char reactivity. Proximate analyses showed that volatile matter was still present in the torrefied wood, but was almost completely devolatilized after pyrolysis. Key words Pyrolysis, Pyrolysis compounds, Chemical composition, Torrefaction. 1. Introduction Biomass residues and waste are abundant potential feedstock for pyrolysis, gasification or combustion processes and seem to be an attractive alternative raw material to current fossil fuel resources [1]. Pyrolysis is an attractive technology that converts biomass directly into liquid products [2]. However, during pyrolysis can be produced as well gaseous and solid products, depending on the residence time of the raw materials in the reactor chamber, and to the temperature choc to which raw materials are submitted. Torrefaction can be suggested as a method of biomass pre-treatment and can be defined as the thermochemical conversion of biomass at approximately 300ºC in an inert atmosphere [3].
During biomass torrefaction, almost all moisture and a fraction of the light volatiles are removed to form a solid, dry material known as torrefied biomass [4]. The aim of torrefaction is to change the properties of biomass to obtain a better fuel quality with higher energy density, more homogeneous composition, lower hygroscopicity and elimination of biological activity [5]. In this study, torrefied biomass was produced at YGE – Yser Green Energy SA (Portugal) and characterized at Sasol Technology, Research and Development (South Africa). The experimental methods (pyrolysis and analytical methodologies) were previously established using a selection of South African biomass species. 2. Materials and Methods 2.1. Biomass samples Wood chips were torrefied at approximately 260-280ºC at YGE – Yser Green Energy SA in Portugal and subjected for characterization and pyrolysis studies to Sasol Technology, Research and Development in South Africa. 2.2. Fischer-tar Assay The Fischer-tar Assay is a standard laboratory test for determining the yield of tar, water, char and gas (by difference) for a given coal (SANS 647: 1974) ) [6]. The method entails the controlled heating of a defined quantity of material (50g) in an aluminum retort to a final temperature of 520ºC. The heating program used is given in Table 1. During this test, biomass is converted to char with release of volatile matter [7]. All condensable material (tar and water) is collected in a round bottom flask submerged in ice. The water content of the condensable product is determined via a Dean and Stark distillation. The gas percentage is obtained by difference. 2.3. Termogravimetric analysis (TGA) 2.3.1. TGA proximate analysis All thermogravimetric analyses were conducted in a nitrogen atmosphere with a flow of 150 ml/min.
https://doi.org/10.24084/repqj16.371 516 RE&PQJ, Vol.1, No.16, April 2018
Samples were heated from room temperature to 110ºC with a heating rate of 50ºC per minute. The samples were kept at 110ºC for three minutes. Mass loss at this temperature was assigned to moisture. Samples were then heated from 110ºC to 900ºC with a heating rate of 50ºC per minute. The samples were kept at 900ºC for seven minutes. Mass loss at this temperature was assigned as volatile matter. This volatile matter includes liquid hydrocarbons, gas and pyrolytic water. The TGA atmosphere was then changed to oxygen (150 ml/min) and kept for 20 minutes. The mass loss due to combustion was assigned as fixed carbon. The remaining residue was recorded as the amount of ash in the sample. 2.3.2. TGA mass loss All thermogravimetric mass loss analyses were conducted in a nitrogen atmosphere with a flow of 150 ml/min. Samples were devolatilized from room temperature to 900ºC at a heating rate of 10ºC per minute. The samples were kept at 900ºC for seven minutes. 2.3.3. TGA carbon dioxide char reactivity Prior to char reactivity analyses, a standard proximate analysis was conducted to determine the amount of fixed carbon for a given sample. A sample containing 5mg of fixed carbon was heated in an inert atmosphere to 1200ºC with a heating rate of 50ºC per minute. The char was then allowed to cool down to 1000ºC. When the temperature and mass were stabilized, the inert gas was replaced with carbon dioxide. The Boudouard reaction [8] was allowed to continue until no further mass loss was observed. The calculation of the carbon dioxide char reactivity at 60% burn-off is discussed in literature [9]–[12]. 2.3.4. Pyrolysis experiments The standard KoekebakkerTM setup was used for biomass pyrolysis [13]. All experiments were conducted at atmospheric pressure in a nitrogen atmosphere. The KoekebakkerTM was loaded with approximately 150 to 400g of biomass prior to pyrolysis. During the pyrolysis experiments, two hydrocarbon liquid fractions were collected: condensed oil and additional oil. A condenser connected to a chiller was connected to the outlet of the reactor. The condenser was connected to a two-neck round-bottom flask immersed in an acetone/ice bath. Connected to the round-bottom flask were four solvent traps in series (three traps filled with solvent and a final empty trap). With one exception, all the solvent traps were immersed in ice/acetone baths. Table 1. Heating program used for Fischer-tar Assay.
Time from start (minutes) Temperature (ºC) 10 220 20 310 30 380 40 440 50 480 60 505 70 520 80 520
The solvent traps were filled with acetone for both quantity and quality experiments. All involved gases were captured in a bag after the solvent traps. All pyrolysis experiments were conducted at 600ºC with a heating rate of ~10ºC per minute. 2.3.5. Determination of water content in the liquid hydrocarbon Toluene was added to the liquid product in the round-bottom flask and Dean-Stark distilled to quantitatively determine the amount of water. The condenser and all pipes were washed with acetone. All acetone fractions (solvent traps and acetone from washed pipes) were added together. The acetone was removed from the hydrocarbon liquid by distillation. 2.3.6. Determination of liquid hydrocarbon quality Chloroform was added to the condensate in the round-bottom flask and transferred to a separation funnel. The organic phase was removed from the water phase. The condenser and all pipes were washed with acetone. Solvents were removed by distillation. 2.4. Characterization of liquid hydrocarbons 2.4.1. Simulated distillation (simdis) Simulated distillation was conducted on a high-temperature GC-FID fitted with an ARX 2887 Restek column (10m x 0.53mm x 0.53µm). Approximately a 0.2µL sample was injected into the GC column per analysis. The GC oven program started with an initial temperature of 40ºC, then heated at 15ºC per minute to 540ºC and hold at that temperature for 10 minutes. 2.4.2. Gas chromatography mass spectrometry (GCMS) All oil samples were analyzed using a GC-FID (quantification) and a GCMS (peak identification) fitted with HP-FFAP column (50m x 0.2mm x 0.33µm). The HP-FFAP column is a high polarity column suited for the analyses of organic acids, free fatty acids and phenols. Approximately 1µL of sample was injected into GC column with a split of 200 (if samples were too diluted a split of a 100 was used). The GC oven program was as follows: initial temperature of 60ºC held for 5 minutes, heating at 6ºC per minute to 240ºC and hold for 30 minutes (until all compounds were eluted). Gas flow through the column was 1.2ml per minute (helium in GCMS and hydrogen in GC-FID). 2.4.3. Two-dimensional gas chromatography mass spectrometry Two-dimensional gas chromatography mass spectrometry (hereafter GCxGCxMS) was conducted on a Leco GCxGC TOF fitted with a Restek Stabilwax column (60m x 0.25mm x 0.25µm) and Restek RTXi5 column (2m x 0.1mm x 0.1µm). Approximately 0.5µL of sample was injected into the GC column with a split of 400. Helium gas flow through the column was 1.3ml per minute. The GC oven program for column 1 was as follows: initial temperature of 40ºC held for 1 minute, heating at 2ºC per minute to 230ºC. The GC oven program for column 2 was as follows: initial temperature of 65ºC held for 1 minute and heating at 2ºC per minute to 255ºC.
https://doi.org/10.24084/repqj16.371 517 RE&PQJ, Vol.1, No.16, April 2018
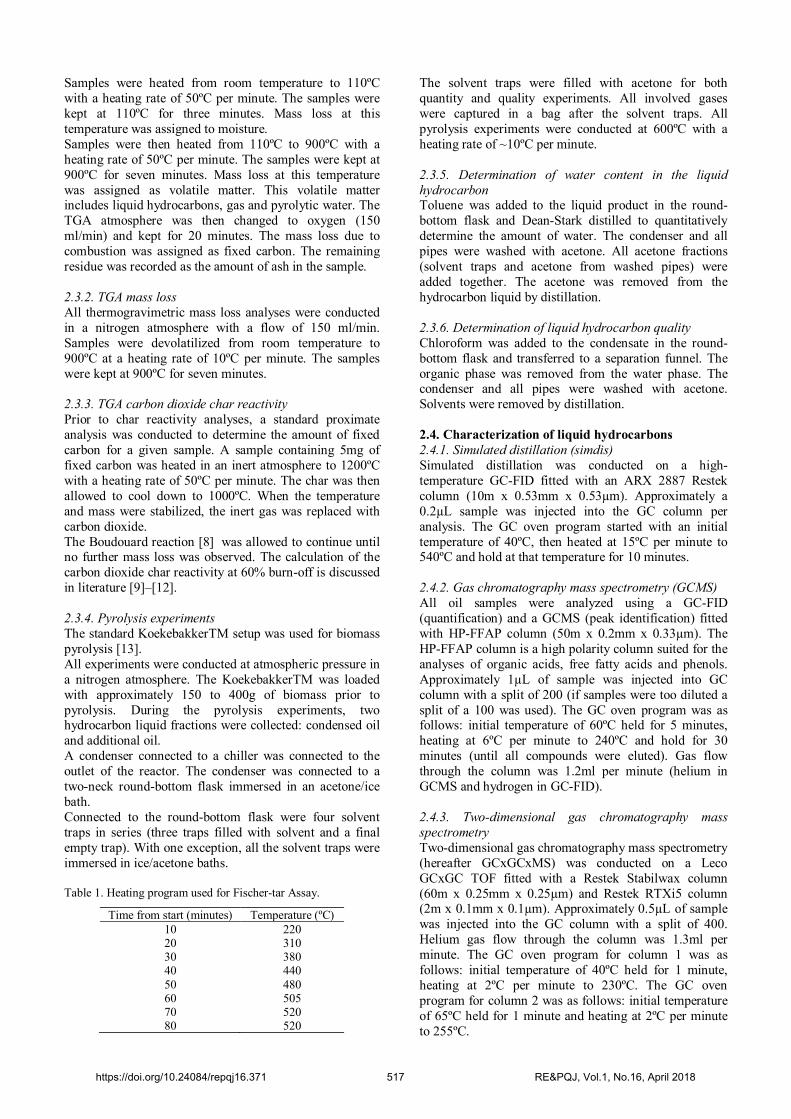
3. Results and discussion 3.1. Characterization of biomass 3.1.1. Proximate analyses Biomass samples were air-dried and crushed to <150µm for proximate analyses and the results are presented in Table 2. During torrefaction, all moisture and light volatiles are removed from the biomass. 3.1.2. Thermochemical behavior (TGA devolatilization) The combined devolatilization profiles (thermograms) are presented in Figure 1. The individual devolatilization profiles are presented in Figure 2. The first derivative of the mass loss curve was determined to observe the thermal behavior of these biomass samples (Figure 3). The thermograms in Figures 2 and 3 exhibited an initial mass loss ending at 110ºC. This mass loss was assigned as moisture associated with the sample. The un-torrefied wood thermogram showed a rapid devolatilization starting at approximately 230ºC and ending at approximately 370ºC (fast pyrolysis zone). A slow mass loss was still observed after 370ºC for this biomass sample (slow pyrolysis zone). The first derivative of the mass loss curve showed that there were two thermal events occurring during fast pyrolysis (between 230ºC to 370ºC). These events could be attributed to the decomposition of hemicellulose and cellulose polymers in the biomass samples [14]. Table 2. Proximate analyses results for torrefied biomass.
Air-dry basis
Dry basis Dry, ash-free basis
Sample % Moisture
% VM
% FC
% Ash
% VM
% FC
Torrefied wood
4.4 62.4 36.4 1.2 63.2 36.8
VM – Volatile matter; FC – Fixed carbon
Figure 1. Devolatilization profiles (thermograms) of torrefied and normal wood.
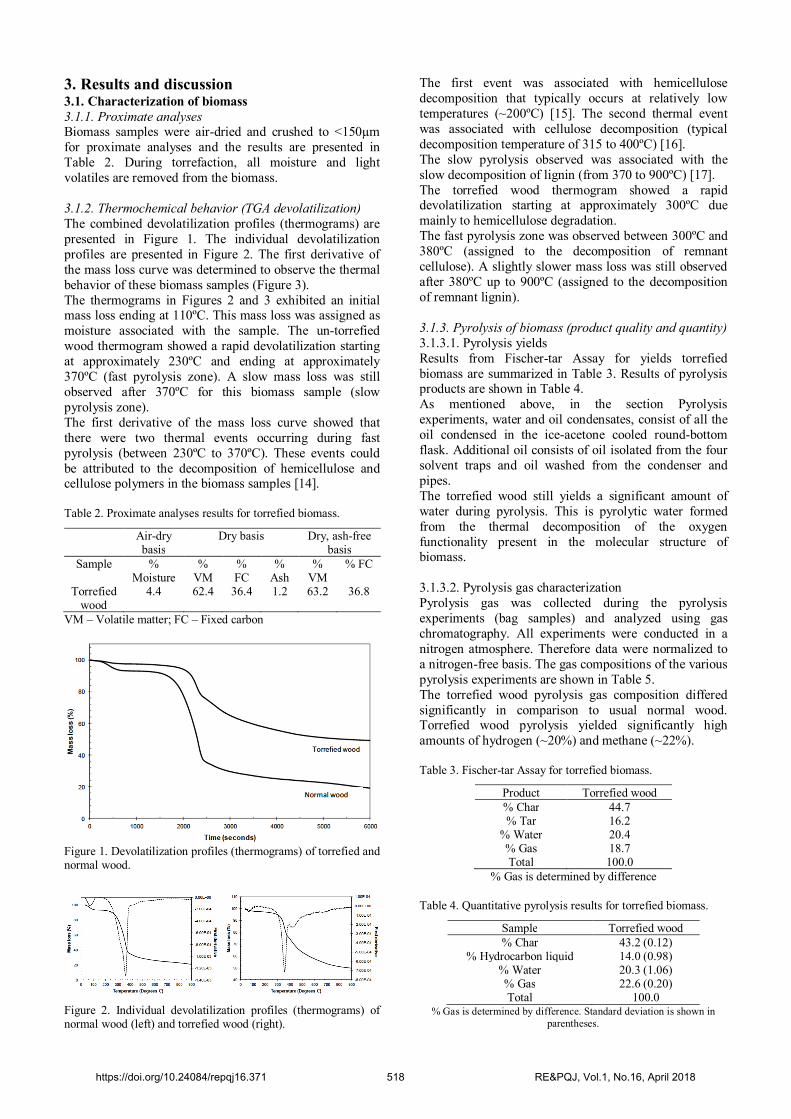
Figure 2. Individual devolatilization profiles (thermograms) of normal wood (left) and torrefied wood (right).
The first event was associated with hemicellulose decomposition that typically occurs at relatively low temperatures (~200ºC) [15]. The second thermal event was associated with cellulose decomposition (typical decomposition temperature of 315 to 400ºC) [16]. The slow pyrolysis observed was associated with the slow decomposition of lignin (from 370 to 900ºC) [17]. The torrefied wood thermogram showed a rapid devolatilization starting at approximately 300ºC due mainly to hemicellulose degradation. The fast pyrolysis zone was observed between 300ºC and 380ºC (assigned to the decomposition of remnant cellulose). A slightly slower mass loss was still observed after 380ºC up to 900ºC (assigned to the decomposition of remnant lignin). 3.1.3. Pyrolysis of biomass (product quality and quantity) 3.1.3.1. Pyrolysis yields Results from Fischer-tar Assay for yields torrefied biomass are summarized in Table 3. Results of pyrolysis products are shown in Table 4. As mentioned above, in the section Pyrolysis experiments, water and oil condensates, consist of all the oil condensed in the ice-acetone cooled round-bottom flask. Additional oil consists of oil isolated from the four solvent traps and oil washed from the condenser and pipes. The torrefied wood still yields a significant amount of water during pyrolysis. This is pyrolytic water formed from the thermal decomposition of the oxygen functionality present in the molecular structure of biomass. 3.1.3.2. Pyrolysis gas characterization Pyrolysis gas was collected during the pyrolysis experiments (bag samples) and analyzed using gas chromatography. All experiments were conducted in a nitrogen atmosphere. Therefore data were normalized to a nitrogen-free basis. The gas compositions of the various pyrolysis experiments are shown in Table 5. The torrefied wood pyrolysis gas composition differed significantly in comparison to usual normal wood. Torrefied wood pyrolysis yielded significantly high amounts of hydrogen (~20%) and methane (~22%). Table 3. Fischer-tar Assay for torrefied biomass.
Product Torrefied wood % Char 44.7 % Tar 16.2
% Water 20.4 % Gas 18.7 Total 100.0
% Gas is determined by difference Table 4. Quantitative pyrolysis results for torrefied biomass.
Sample Torrefied wood % Char 43.2 (0.12)
% Hydrocarbon liquid 14.0 (0.98) % Water 20.3 (1.06) % Gas 22.6 (0.20) Total 100.0
% Gas is determined by difference. Standard deviation is shown in parentheses.
https://doi.org/10.24084/repqj16.371 518 RE&PQJ, Vol.1, No.16, April 2018

Carbon dioxide and carbon monoxide are formed from the thermal decomposition of the oxygen remaining in the molecular structure of biomass. Torrefaction removed a significant amount of oxygen atoms or radicals from the molecular structure of biomass. Therefore less oxygen was available for the formation of carbon monoxide and carbon dioxide. 3.2. Characterization of biomass liquid hydrocarbons As aforementioned, two types of hydrocarbon liquids were collected during the pyrolysis experiments: condensed oil and additional oil. These two hydrocarbon liquid fractions were mixed together to form a homogeneous hydrocarbon sample for analysis. 3.2.1. Simulated distillation of biomass liquid hydrocarbons Simulated distillations (simdis) [18] were conducted to determine the boiling point distributions of all the biomass liquid hydrocarbons (Figure 3). The weight average boiling points (WABP) of the simulated distillation curves were calculated (Equation 1) for comparison. Results are summarized in Table 6.
10wt% 30wt% 50wt% 70wt% 90wt%T + T +T +T +TWABP =5
(1)
From these simulated distillations, was concluded that torrefied wood hydrocarbon liquid and normal wood hydrocarbons liquids had similar boiling point distribution, with torrefied wood liquid being slightly smaller.
Figure 3. Simulated distillation results for torrefied wood and normal wood. Table 5. Pyrolysis gas composition of torrefied wood.
Torrefied wood Other (C2+) 2.3
Oxygen/Argon 2.9 Carbon dioxide 22.5
Carbon monoxide 30.1 Methane 22.0
Hydrogen 20.1 Table 6. Weight average boiling points from simulated distillation curves.
Sample Torrefied wood WABP (ºC) 216.5
3.2.2. Gas chromatography mass spectrometry of biomass liquid hydrocarbons The GCMS profiles of the hydrocarbon liquids consisted of various types of oxygenates (oxygen containing organic compounds). To simplify the chromatographic data, the compounds were grouped according to specific molecular families. These families included: aliphatic hydrocarbons, acids, aliphatic esters, aliphatic aldehydes and ketones, aliphatic alcohols, alkylbenzenes, alkylphenols, furans (with polyfunctional oxygen), linear and cyclic aliphatic oxygenates (polyfunctional oxygen), aromatic oxygenates (polyfunctional oxygen) and nitrogen/sulphur containing compounds. The percentage of each molecular family for each biomass sample was determined and is summarized in Table 7. The torrefied wood hydrocarbon GCMS chromatogram was less complex when compared to normal wood. The normal wood chromatogram consisted of 125 compounds, whereas the torrefied wood chromatogram consisted of 56 compounds (excluding the unknown peaks). This decrease in hydrocarbon complexity was expected since torrefaction removes most of the light hydrocarbons and acids from the solid biomass. Torrefied wood hydrocarbon liquid showed higher concentrations of aliphatic aldehydes, ketones and alkylphenol when compared to normal wood hydrocarbon liquid. A decrease in all the other components was observed for the torrefied wood hydrocarbon liquid when compared to the normal wood sample. The main advantage of torrefaction was the decrease in the acid concentrations when compared to normal wood. 3.2.3. GSMS analytical results for pyrolysis water fraction of torrefied biomass The pyrolysis water and oil were separated using a separation funnel after each pyrolysis experiment. The water fractions were collected and analyzed using GCMS. The organic compounds present in the water phase fraction are summarized in Table 8. Table 7. GCMS analytical results for composition of the various hydrocarbon liquid fraction in torrefied biomass
Molecular component Torrefied wood
Aliphatic 0.57 Acids 2.24
Aliphatic ester 0.00 Aliphatic aldehydes and ketones 33.32
Aliphatic alcohol 0.00 Alkylbenzenes 2.07 Alkylphenol 35.83
Furan 0.70 Furan (polyfunctional oxygen) 5.90
Linear and cyclic aliphatic oxygenates (polyfunctional
oxygen)
6.61
Aromatic oxygenates (polyfunctional oxygen)
12.25
Nitrogen and sulphur containing compounds
0.51
Total 100.0 The amount of unknown compounds observed in the GC
chromatograms was 22.9% for torrefied biomass.
https://doi.org/10.24084/repqj16.371 519 RE&PQJ, Vol.1, No.16, April 2018
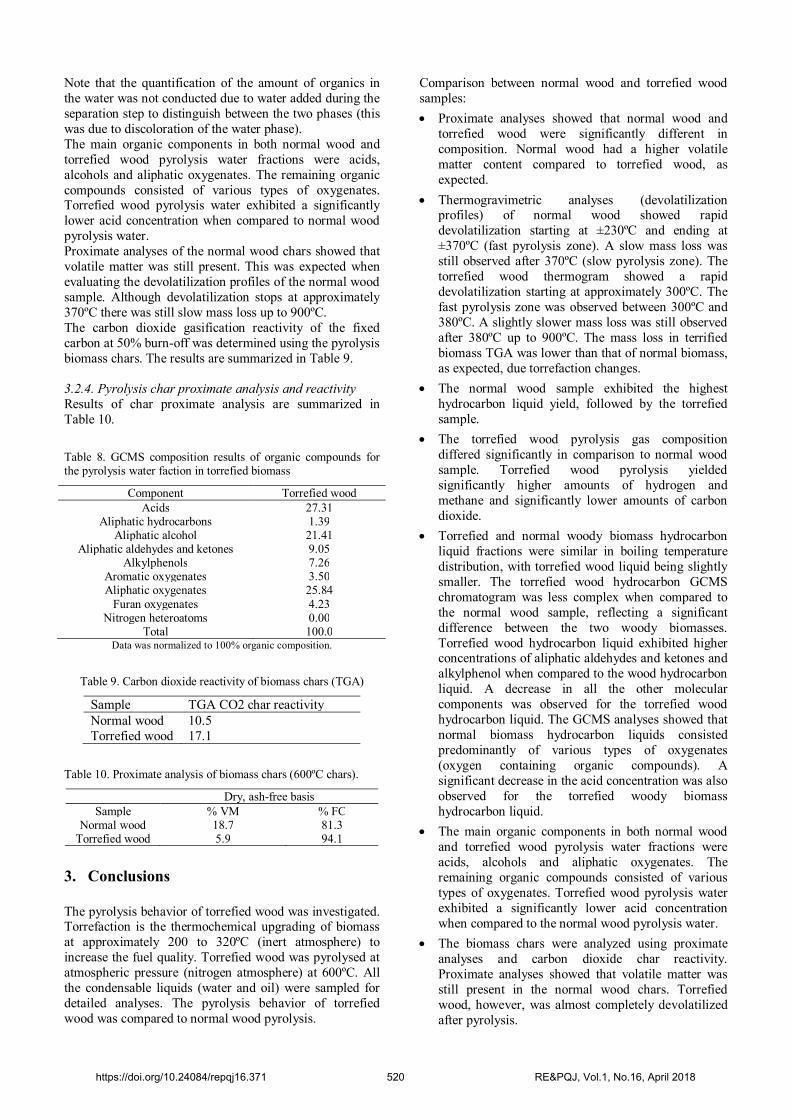
Note that the quantification of the amount of organics in the water was not conducted due to water added during the separation step to distinguish between the two phases (this was due to discoloration of the water phase). The main organic components in both normal wood and torrefied wood pyrolysis water fractions were acids, alcohols and aliphatic oxygenates. The remaining organic compounds consisted of various types of oxygenates. Torrefied wood pyrolysis water exhibited a significantly lower acid concentration when compared to normal wood pyrolysis water. Proximate analyses of the normal wood chars showed that volatile matter was still present. This was expected when evaluating the devolatilization profiles of the normal wood sample. Although devolatilization stops at approximately 370ºC there was still slow mass loss up to 900ºC. The carbon dioxide gasification reactivity of the fixed carbon at 50% burn-off was determined using the pyrolysis biomass chars. The results are summarized in Table 9. 3.2.4. Pyrolysis char proximate analysis and reactivity Results of char proximate analysis are summarized in Table 10. Table 8. GCMS composition results of organic compounds for the pyrolysis water faction in torrefied biomass
Component Torrefied wood Acids 27.31
Aliphatic hydrocarbons 1.39 Aliphatic alcohol 21.41
Aliphatic aldehydes and ketones 9.05 Alkylphenols 7.26
Aromatic oxygenates 3.50 Aliphatic oxygenates 25.84
Furan oxygenates 4.23 Nitrogen heteroatoms 0.00
Total 100.0 Data was normalized to 100% organic composition.
Table 9. Carbon dioxide reactivity of biomass chars (TGA)
Sample TGA CO2 char reactivity Normal wood 10.5 Torrefied wood 17.1
Table 10. Proximate analysis of biomass chars (600ºC chars).
Dry, ash-free basis Sample % VM % FC
Normal wood 18.7 81.3 Torrefied wood 5.9 94.1
3. Conclusions The pyrolysis behavior of torrefied wood was investigated. Torrefaction is the thermochemical upgrading of biomass at approximately 200 to 320ºC (inert atmosphere) to increase the fuel quality. Torrefied wood was pyrolysed at atmospheric pressure (nitrogen atmosphere) at 600ºC. All the condensable liquids (water and oil) were sampled for detailed analyses. The pyrolysis behavior of torrefied wood was compared to normal wood pyrolysis.
Comparison between normal wood and torrefied wood samples: Proximate analyses showed that normal wood and
torrefied wood were significantly different in composition. Normal wood had a higher volatile matter content compared to torrefied wood, as expected.
Thermogravimetric analyses (devolatilization profiles) of normal wood showed rapid devolatilization starting at ±230ºC and ending at ±370ºC (fast pyrolysis zone). A slow mass loss was still observed after 370ºC (slow pyrolysis zone). The torrefied wood thermogram showed a rapid devolatilization starting at approximately 300ºC. The fast pyrolysis zone was observed between 300ºC and 380ºC. A slightly slower mass loss was still observed after 380ºC up to 900ºC. The mass loss in terrified biomass TGA was lower than that of normal biomass, as expected, due torrefaction changes.
The normal wood sample exhibited the highest hydrocarbon liquid yield, followed by the torrefied sample.
The torrefied wood pyrolysis gas composition differed significantly in comparison to normal wood sample. Torrefied wood pyrolysis yielded significantly higher amounts of hydrogen and methane and significantly lower amounts of carbon dioxide.
Torrefied and normal woody biomass hydrocarbon liquid fractions were similar in boiling temperature distribution, with torrefied wood liquid being slightly smaller. The torrefied wood hydrocarbon GCMS chromatogram was less complex when compared to the normal wood sample, reflecting a significant difference between the two woody biomasses. Torrefied wood hydrocarbon liquid exhibited higher concentrations of aliphatic aldehydes and ketones and alkylphenol when compared to the wood hydrocarbon liquid. A decrease in all the other molecular components was observed for the torrefied wood hydrocarbon liquid. The GCMS analyses showed that normal biomass hydrocarbon liquids consisted predominantly of various types of oxygenates (oxygen containing organic compounds). A significant decrease in the acid concentration was also observed for the torrefied woody biomass hydrocarbon liquid.
The main organic components in both normal wood and torrefied wood pyrolysis water fractions were acids, alcohols and aliphatic oxygenates. The remaining organic compounds consisted of various types of oxygenates. Torrefied wood pyrolysis water exhibited a significantly lower acid concentration when compared to the normal wood pyrolysis water.
The biomass chars were analyzed using proximate analyses and carbon dioxide char reactivity. Proximate analyses showed that volatile matter was still present in the normal wood chars. Torrefied wood, however, was almost completely devolatilized after pyrolysis.
https://doi.org/10.24084/repqj16.371 520 RE&PQJ, Vol.1, No.16, April 2018
Acknowledgements The authors would like to acknowledge Sasol Technology, Research and Development in particular to Rudy Coetzer for processing the biomass samples and also for all the KoekebakkerTM pyrolysis work, Ben Ashton for all the thermogravimetric analyses, Neil de Beer for all the gas analyses, Mariska Freyer and Michael Moeketsi for all the GCMS and GC-FID analyses, Rene Engelbrecht for all the simulated distillation analyses, Heinn Potgieter for the two-dimensional GCMS analyses and to Johan van Dyk and Daniel van Niekerk for the elaboration of the analytical report. The authors would like to acknowledge as well the Portuguese company YGE – Yser Green Energy SA, Portugal, that allowed the execution of the laboratory tests. The current study was funded in part by Fundação para a Ciência e Tecnologia (FCT), under project UID/EMS/00151/2013 C-MAST, with reference POCI-01-0145-FEDER-007718. J.P.S. Catalão acknowledges the support by FEDER funds through COMPETE 2020 and by Portuguese funds through FCT, under Projects SAICT-PAC/0004/2015 - POCI-01-0145-FEDER-016434, POCI-01-0145-FEDER-006961, UID/EEA/50014/2013, UID/CEC/50021/2013, and UID/EMS/00151/2013, and also funding from the EU 7th Framework Programme FP7/2007-2013 under GA no. 309048. References [1] P. Srinivasan, A. K. Sarmah, R. Smernik, O. Das, M. Farid,
and W. Gao, “A feasibility study of agricultural and sewage biomass as biochar, bioenergy and biocomposite feedstock: Production, characterization and potential applications,” Sci. Total Environ., vol. 512–513, no. Supplement C, pp. 495–505, Apr. 2015.
[2] A. V. Bridgwater, “Review of fast pyrolysis of biomass and product upgrading,” Biomass Bioenergy, vol. 38, no. Supplement C, pp. 68–94, Mar. 2012.
[3] L. J. R. Nunes, J. C. O. Matias, and J. P. S. Catalão, “A review on torrefied biomass pellets as a sustainable alternative to coal in power generation,” Renew. Sustain. Energy Rev., vol. 40, no. Supplement C, pp. 153–160, Dec. 2014.
[4] B. Batidzirai, A. P. R. Mignot, W. B. Schakel, H. M. Junginger, and A. P. C. Faaij, “Biomass torrefaction technology: Techno-economic status and future prospects,” Energy, vol. 62, no. Supplement C, pp. 196–214, Dec. 2013.
[5] D. Agar and M. Wihersaari, “Torrefaction technology for solid fuel production,” GCB Bioenergy, vol. 4, no. 5, pp. 475–478, Sep. 2012.
[6] M. Gräbner, Industrial Coal Gasification Technologies Covering Baseline and High-Ash Coal. John Wiley & Sons, 2014.
[7] L. Roets, J. R. Bunt, H. W. J. P. Neomagus, and D. van Niekerk, “An evaluation of a new automated duplicate-sample Fischer Assay setup according to ISO/ASTM standards and analysis of the tar fraction,” J. Anal. Appl. Pyrolysis, vol. 106, pp. 190–196, Mar. 2014.
[8] Y. Jiao et al., “In situ catalyzed Boudouard reaction of coal char for solid oxide-based carbon fuel cells with improved performance,” Appl. Energy, vol. 141, no. Supplement C, pp. 200–208, Mar. 2015.
[9] B. g. del-Campo, M. d. Morris, D. a. Laird, M. m. Kieffer, and R. c. Brown, “Optimizing the production of activated carbon from fast pyrolysis char,” TECHNOLOGY, vol. 3, no. 02n03, pp. 104–113, Jun. 2015.
[10] G.-G. Choi, S.-J. Oh, S.-J. Lee, and J.-S. Kim, “Production of bio-based phenolic resin and activated carbon from bio-oil and biochar derived from fast pyrolysis of palm kernel shells,” Bioresour. Technol., vol. 178, no. Supplement C, pp. 99–107, Feb. 2015.
[11] C. Guizani, F. J. Escudero Sanz, and S. Salvador, “Effects of CO2 on biomass fast pyrolysis: Reaction rate, gas yields and char reactive properties,” Fuel, vol. 116, no. Supplement C, pp. 310–320, Jan. 2014.
[12] J. Alvarez, G. Lopez, M. Amutio, J. Bilbao, and M. Olazar, “Upgrading the rice husk char obtained by flash pyrolysis for the production of amorphous silica and high quality activated carbon,” Bioresour. Technol., vol. 170, no. Supplement C, pp. 132–137, Oct. 2014.
[13] A. J. Forney and W. P. Haynes, “Clean Fluid Fuels From Coal and Wastes,” J. Eng. Power, vol. 95, no. 3, pp. 142–144, Jul. 1973.
[14] A. Cabeza, C. M. Piqueras, F. Sobrón, and J. García-Serna, “Modeling of biomass fractionation in a lab-scale biorefinery: Solubilization of hemicellulose and cellulose from holm oak wood using subcritical water,” Bioresour. Technol., vol. 200, pp. 90–102, Jan. 2016.
[15] N. Y. Harun and M. T. Afzal, “Torrefaction of Agriculture and Forestry Biomass Using TGA-FTIR-MS,” in Progress in Exergy, Energy, and the Environment, Springer, Cham, 2014, pp. 805–813.
[16] A. J. Ashworth, S. S. Sadaka, F. L. Allen, M. A. Sharara, and P. D. Keyser, “Influence of Pyrolysis Temperature and Production Conditions on Switchgrass Biochar for Use as a Soil Amendment,” BioResources, vol. 9, no. 4, pp. 7622–7635, Oct. 2014.
[17] S. S. Vincent, N. Mahinpey, and A. Aqsha, “Mass transfer studies during CO2 gasification of torrefied and pyrolyzed chars,” Energy, vol. 67, no. Supplement C, pp. 319–327, Apr. 2014.
[18] L. Roets, C. A. Strydom, J. R. Bunt, H. W. J. P. Neomagus, and D. van Niekerk, “The effect of acid washing on the pyrolysis products derived from a vitrinite-rich bituminous coal,” J. Anal. Appl. Pyrolysis, vol. 116, no. Supplement C, pp. 142–151, Nov. 2015.
https://doi.org/10.24084/repqj16.371 521 RE&PQJ, Vol.1, No.16, April 2018