charles bridge in prague
TRANSCRIPT

STRUCTURAL ANALYSIS DF HISTDRlCAL CONSTRUCTIONS P. Roca, I.L González, A.R. Mari and E. Oi\ate (Eds.)
e ClMNE, Barcelona 1996
CHARLES BRIDGE IN PRAGUE
y
D. Novák and J. Zák Technical University of Bmo
Veveri 95, 662 37 Brno
Czech Republic
SUMMARY
The last controversial reconstruction of the famous Charles bridge caused that the bridge has changed its structural behaviour. This resulted in excessive defleclions and cracks. The aim 01 lhe presenl sludy was lo undersland lhe structural behaviour of lhe bridge using the finite element modelling in combination with a statistical simulation respecting different materiais and their interactions. The variability of seleeted input parameters is taking into aeeount -they are eonsidered to be random variables. The statistical characteristics of a struetural response were calculated based on the advaneed Monte Carla type simulation. lhe distribution functions of selected stresses and deflections are estimated providing a basis for confidence limits. The stochastic sensitivity analysis was also performed , which gives information about the influence of random. variables on the structural response. Temperature load cases were analysed in arder lo assess lhe presenl slage and two suggesled varianls 01 the reeonstruction. The results should be used for the evaluation of the proposed reconstruction and the selection of the most suitable way of repair works.
1. INTRODUCTlON
The aim 01 Ihis paper is lo describe FEM modelling and probabilistic assessment proeedures used for the analysis of the present stage and proposed reconstruction . lhe statistical approach is described in a way which can be generally useful for lhe statistical analysis of historical structures. lhe description of techniques used, lhe assumptions made and the interpretation of resulls are included. The lechniques presenled should conlribule lo lhe effort 01 correct assessment of safety of structures.
lhe safety can be considered to be a degree of assurance to maintain its required function and lhe capacity of resistance against deteriorating causes. Generally. salety leveis should be dislinguished and lhe salely should be evalualed aI lour basic slages: The planning slage. lhe design slage. lhe construction stage and the maintenance stage.
226 STRUCTURAL ANALYSIS OF HISTORICAL CONSTRUCTIONS
Considering historieal bridges the last item - the maintenance 5tage, is the only remaining cne for us to save our historieal heritage for future generations. Our daily experience shows what would happen if either inspection ar maintenance works were ignored. For a required functioning Df a bridge the inspection and feas ible maintenance treatment are inevitably necessary. Nowadays il is generally accepled Ihal lhe so-called mainlenancefree bridges do nol exist This applies, of course, for medieval masonry bridges, 100.
Generally, lhe Iraditional melhods of analysis Ireal lhe physical uncertainties Df various parameters in a sim pie and efficient way. Minimum quaranteed values cf these parameters, usually following the relevant standard ar code of practice (e.9. strength, modulus, etc.) are used for the analysis. This is not applicable for some more complicated structures where lhe minimum (or maximum) quaranteed values may not produce the worse structural behaviour. Charles bridge is a typical example of such a structure. Due to the composition of different materiaIs one cannot predict the structural behaviour under temperature loads.
A statistical approach provides us with a sim pie option how to deal with the above problem. If input parameters are significantly uncertain and structural behaviour unpredictable let the selected parameters be considered random variables. lhen the treatment of structural system becomes feas ible at higher quantitative levei by efficient structural analysis as well as advanced stochastic procedures such as Monte Carlo type simulations. An acceptable determination of input parameters when analysing historical structures is ofien very limited. lhe statistical approach is, in some cases, the only way how to get a realistic prediction of structural behaviour.
2_ THE HISTORY OF CHARLES BRIDGE
Charles bridge, Fig. 1, belongs lo the mosl valuable hislorical monumenls in lhe Czech Republic. II is probably lhe biggesl lourisl attraction in Prague and the Czechs are very proud of it.
The bridge was designed and buill during lhe reign of King Charles IV by famous architect Petr Parléf and was finished in 1402. lhe bridge is 515.76 m long and lhe average width is 9.40 m. II has 16 arches wilh lhe span from 16,62 lo 23.38 m supported by 17 piers. Charles bridge was originally called "Slone Bridge" and was bui ll as lhe second slone bridge in Prague. The bridge was always the most important and busiest traffic route in the city and sti ll creates an inseparable part of Prague's panorama with the most impressive view of lhe Prague Caslle. The Old Town Bridge Tower and many historical sculptures contribute to the outstanding general impression of the bridge.

D. NOVÁK and J. ZÁ K I Charles Bridge in Prague 227
The bridge was damaged many times during wars and by fioods. The fioods that partly damaged the bridge were in 1432, 1496, 1784 and the worse one, in 1890, completely destroyed two piers and three arches. lhe damage was considered a national disaster and the bridge was repaired in 1892. lhe damaged piers were founded on caissons and other piers were also secured by caissons. lhe damaged arches and piers were repaired using in most cases different building stones instead of the original ones. lhese repairs resulted , together with different technologies used, in a great diversity of the bridge.
lhe filling materiais were removed and replaced by expanded clay concrete and a reinforced concrete slab without expansion joints during the last controversial reconstruction (1966-1975) . lhe slab was anchored to the parapet walls and granite paving was put in cement mortar. lhese changes caused the bridge to become toa rigid and resulted in several cracks mainly paraJlel to the lengthwise axis of the bridge. The cracks did not occur in joints only, but some of them appeared in the ashlars. Excessive deflections of the parapet waJls were detected on severa I arches.
Figure 1: The views 01 Cha rles bridge.

228 STRUCTURA L ANALYSIS OF HISTOR ICAL CONSTRUCTIONS
lhe above rnentioned damage together with the surface erosion af building stones initiated a new investigation supervised by the Charles Bridge Committee in 1994. Many bridge and structural engineers, architects, chemists, geo109i5t5, mineralogists and state administrators were involved in a comprehensive preliminary investigation under several sub-committees lhat resulted in a propasal af new reconstruction af the bridge. lhe second author af this paper had a chance to participate as a member af the sub-committee Structural Analysis.
3. DETERMINISTIC COMPUTATIONAL MODEL
Finite element package ANSYS [1 ] was used as a basic tool for the present analysis. This commercial package offers a good selection af suitable 2D. 3D and special elements. It is still practicaliy impossible to analyse the whole structure like Charles bridge using 3D elements. 2D solid model of selected cross-sections (without modelling joints between different materiais) was developed in the first step. Then the results were compared to the results of corresponding 3D model of a quarter of the arch. It was confirmed that the differences were quite significant.
20 models of selected cross-sections respecting joints between different materiais were developed for the present analysis in three different variants corresponding to A) the current state and the state after the proposed reconstruction in the two variants - B) without expansion joints and C} with expansion joints. Arch number IX was selected for lhe analysis. Two crosssections (on the top of the arch and on the foot of the arch) were analysed using 2D plane strain finite elements (Fig. 2).
Figure 2: FEM mesh of the bridge cross-section.

D. NOVÁ K and J. ZÁK I Ch:lrlt:s Bridge in Pr:lgue 229
Three different load cases were considered in lhe analysis as a· result of the study of meteorological data: I1 warm top surface and cold bottom surface, 111 warm surface and cold core, 1111 cold surface and warm core . Respecting the collected meteorological data and previous analyses a nonstationary temperature field analysis was carried out to obtain possible temperature gradients in the structure under different conditions. The results were used as boundary conditions lor the lollowing stationary analyses . 2D temperature elements (PLANE55) were used to obtain the distribution of temperature field in the cross-section in lhe next step of the solution. The calculated temperatures (see Fig. 3 for the load case 11) were converted into initial strains and then transformed into equivalent externai loads for the structural analysis. This is the last part of the analysis Ihat was carried out once, and was not a part of the stochastic repetitive analysis.
Figure 3: Temperature distribution for the load case 11.
(3
r
paving erpanded clay concrete concrete slab arenaceotLS marl sandstone
Figure 4: Materiais 01 the bridge.

230 STRUCTURAL ANALYSIS OF HISTORICAL CONSTRUCTIONS
lhe temperature elements were changed to the corresponding structural plane strain elements (PLANE42), and then a standard structural analysis was performed cne hundred times for various values af slochastic parameters. lhe bridge was built af sandstone, arenaceous marl , unknown materiais and granite paving in sand . lhe current materiais are sandstone, arenaceous marl, concrete slab anchored to the walls, expanded clay concrete and granite paving in morta r, Fig . 4 . lhe proposed repa ir works comprise the removal of the concrete slab, expansion joints Df expanded clay concrete andgranite paving in sand . Different materiais were connected using special contact elements (CONTAC12) which enable us to model friction , normal and tangential inilial stiffness and possible gaps. These elements generally require Newton-Raphson iterations to find the correct status of contacts (opened or closed). Correct input of initial status avoided time consuming iterations to be dane for ali runs of stochastic analyses .
It was quite difficult to input correct coefficients of thermal expansion in the longitudinal direction and for expanded clay concrete with expansion joints. The long itudinal strains are zero for the plane strain analysis but the coefficient of the thermal expansion would produce unrealistic stresses in this direction. On the other hand. zero value of the coefficient of thermal expansion would not be correct for this analysis. As a compromise the coefficient of the thermal expansion in the longitudinal direction was decreased. It would also be difficult to model expansion joints. We assumed that the strains perpendicular to the expansion joints did not almost produce any stresses. So we again assumed the value of the coefficient of the thermal expansion to be decreased in this direction.
The deterministic procedure can be summarised in the following steps:
• Oetermination of material characteristics . Sources: tests, literature, previous projects, engineering judgement.
• Collection of meteorological data , analysis of non-stationary temperature field . Result : boundary condition for stationary temperature field analysis.
• Stationary temperature field analysis. Result: temperature distribution . • Temperatures converted into initial strains. Dane automaticaJly in ANSXS. • Structural analysis. Newton-Raphson iteration if necessary. Results:
deflection. strain, stresses.
4. STATlSTICAL APPROACH
4 1 General remarks
The rel iability methods used for the probabilistic assessment of Charles bridge are described in this section . They have a general use and can easily be applied to a different computational model, to a different bridge , to a different historical structure. The authors believe that the so-called probabi listic risk assessment procedures will be applied in the field af histarical structures more
D. NOVÁ K and J. UK I Charles Bridge in Prague 231
often in the future, and the techniques described here represent one possible alternative how to deal with uncertainties of historical structures.
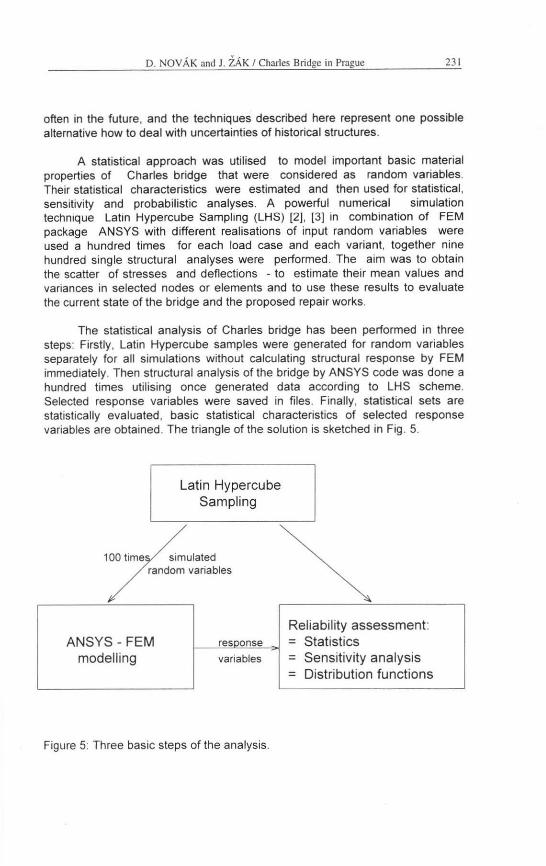
A statistical approach was utilised to model important basic material properties of Charles bridge that were considered as random variables. Their statistical characteristics were estimated and then used for statistical, sensitivity and probabilistic analyses. A powerful numerical simulation technique Latln Hypercube Sampllng (LHS) [2], [31 in combination of FEM package ANSYS with different realisations of input random variables were used a hundred times for each load case and each variant, together nine hundred single structural analyses were performed . The aim was to obtain the scatter of stresses and deflections - to estimate their mean values and variances in selected nodes or elements and to use these results to evaluate the current state of the bridge and the proposed repair works.
The statistical analysis of Charles bridge has been performed in three steps: Firstly, Latin Hypercube samples were generated for random variables separately for ali simulations without calculating structural response by FEM immediately. Then structural analysis of the bridge by ANSYS code was done a hundred times utilising once generated data according to LHS scheme. Selected response variables were saved in files. Finally, statistical sets are statistically evaluated, basic statistical characteristics of selected response variables are obtained . The triangle of lhe solution is sketched in Fig . 5.
100 time
Latin Hypercube Sampling
simulated randam variables
ANSYS - FEM modelling
res anse
variables
Figure 5: Three basic steps of the analysis.
Reliability assessment: = Statistics = Sensitivity analysis = Distribution functions
232 STRUCTURAL ANALYS IS OF HI STORICAL CONSTR UCTlONS
4.2 loput random yarjables
In probabilistic calculations the definition cf the set Df random variables is lhe primary lask. li consisls of two sleps: Firslly, lhe choice of lhe paramelers which will be considered stochastic and will be simulated as random variables. In our case cf modelling thermal effect we consider only the most influencing material properties Df lhe bridge - Young modulus of elasticity and the coefficient of thermal expansion for ali materiais used in the bridge structure to be random.
Secondly, every random variable X should be described wilh lhe aid of the probability distribution function . Such a function is in many cases (twoparamelric dislribulions) characlerised by a particular type of dislribulion (e. g. a normal distribution ar a uniform distribution), mean value J.1 (X) and standard
devialion ,,(X). Very oflen lhe coefficienl of varialion COV(X) ~ ,,(X)/ p( X) is
used as a relative measure cf variability.
If slalislical dala is available for ali lhe variables, lhe slalislical characteristics can be estimated and a theoretical model of probabi lity distribution function can be assigned by well known procedures of mathematical statistics. In most cases there is scanty data available. The statistical properties will then have to be entirely estimated based on different assumptions .
The following sources for estimations (also for deterministic parameters involved) were used:
• in situ measurements • information published in literature • experience and opinion of experts • engineering judgement and intuition
A synthesis of ali information resulted in the estimation of limit values, X'''):h 'X ,,, .... '
above or below which the relevant variable will not be in ali probability situated . For the normal distribution it is well known there is 95 % probability that a variable will have a value situated between J.l - 2a and J.l + 2a. Based on this assumption it is thus possible to estimate the mean value and the standard deviation :
JJ(X)~~lx"" + x,,,.}
,,(X ) ~ ±lx,,,,,, - x,,,.} For a log ~norma l distribution the corresponding formulae are:
Il( X) ~ Jx"" . x,,,. cov(x) ~ ±In lx""/x,,. }
(1 )
(2)
(3)
(4)
D. NOVÁ K and J. ZÁK I Char[es Bridge in Praguc 233
lhe choice between using the normal and log-normal distribution will depend on the physical nature of the random variable . Log-normal distribution is to be preferred for variables which are unable by nature to take on negative values. Bul il should be noled Ihal for small coefficienl of varialion (COV s 0.10)
the difference between normal and log-normal distribution is negligible for practical purposes.
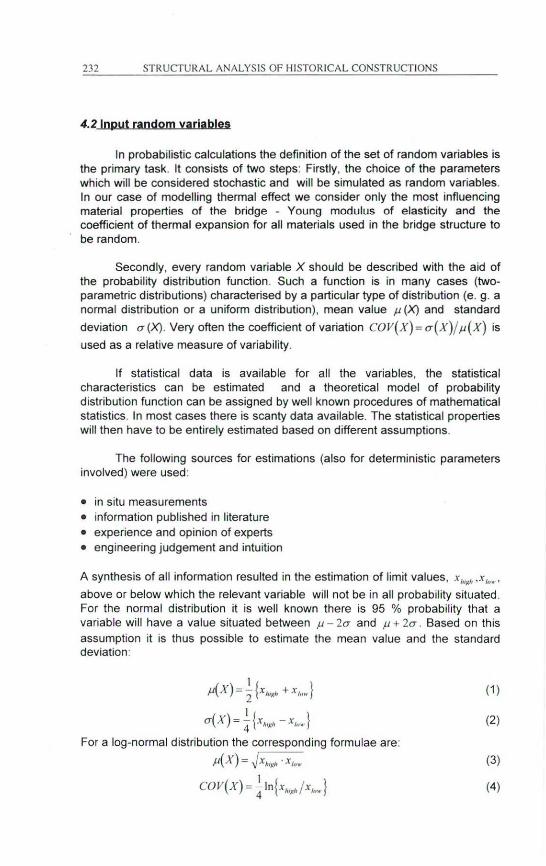
lhe above assumptions resulted in a choice of the type of distribution , the mean value and the standard deviation of the probfem random variables. Random variables XI' X l"'" X IO considered here are listed in labia 1. lhe mean values and standard deviations adopted are those values which were rated as providing the best estimates of the type indicated above. The normal probability distribution was considered to model Young modulus of elasticity (E) and the log-normal distribution for the coefficients of thermal expansion (,1.). The statistical correlation among random variables was not considered
here due lo lhe lack of sufficienl informalion. For varianls B) and C) lhe lable of random variables without concrete slab was used.
Material x, .t "," x/o"~ .u(X) a(X) cov(X) sandstone E - X, 5.0 15. 10.0 2.50 0 .25
). = x : 0.7 1.0 0.84 0 .09 0 .09 arenaceous marl E = X, 3.0 8.0 5.5 0 .23 0.23
). = x .. 0.7 1.0 0 .84 0 .09 0 .09 concrete slab E = X, 18. 28. 23 .0 0 .11 0.11
À = .\'0 1.0 1.2 1.10 0.05 0 .05 expanded clay E = X, 8 .0 12 . 10.0 1.00 0 .10 concrete À = XI 0.4 0 .9 0.60 0.12 0 .20 granite paving E = x~ 4.0 8 .0 6 .00 1.00 0 .17
À = X,O 1.0 1.2 1.10 0.05 0 .05
Table 1: Random variables (E in Gpa, A in ' C ' x 10-' ).
4.3 Statistical analys js
Response funclion g( X) (FEM compulalional model) of random
variables X =XI .X2 •.••.•• X IO gives us response variables (e.g. deflections, stresses) . The response variables are arranged into vector Z :
Z = g(X) (5)
lhe aim of the statislical analysis is the estimation of basic statistical parameters of response variables , e.g. mean values and variances. It can

2:14 STRUCTURAL ANALYS1S DF H1STOR1CAL CONSTRUCT10NS
easi ly be done by Monte Carlo simulation, by repetitive ca lculat ians of the structure. In case of simple Monte Carla simulation such a process is timeconsuming .
A special type of numerical simulation Latin Hypercube Sampling enables us to use a small number of simulation (a hundred) for sat isfactory good estimates of basic statistical parameters [2 ], [31. The probabi lity distribution functions for ali random variables are divided into N equivalent intervals (N is a number of simulations), the centroids of intervals are then used in simulation processo This means that the range af the probability distribution
function F( XJ
) of each random variable X I is divided into N intervals of equal
probabi lity 1/N, see Fig . 6. l he representative parameters of variables are selected randomly based on randam permutations of integers 1, 2, ... i, ... ,N. Every interval of each variable must be used only once during the simulation . A table of random permutations can be used conveniently, each row af such a table belongs to the specific simulation and the column corresponds to one of the input random variables [31 .
F(X)
N
,",'
3 2
, , X
Figure 6: l he divisian of the distribution function into intervals.
4.4 Sensitiv jty analysjs
An impartant task in the structural reliability analysis is to determine the significance of randam variables - haw they influence a response function of a specific problem. There are many different approaches of sensitivity analysis, a summary of present methods is given in [4].
LHS simulation can be effieiently used to obtain sueh an information. lhe sensitivity analys is is obtained as an additional result. lhis provides us with the information about the importanee of basie random variables. Dominating and nondominat ing variables can be distinguished using certa in sensitivity

D. NOVÁK and J. ZÁK I Charles Bridge in Praguc 235
measures. Here two different types of sensitivity were used: Nonparametric rank·order correlation and sensitivity in the form of variation coefficients.
lhe relative effect of each basic variable on the structural response can be measured using the partial correlation coefficient between each basic input variable and the response variable. lhe method is based on lhe assumption that the random variable which influences the response variable most considerably (either in a positive or negative sense) will have a higher correlalion coefficient lhan other variables. In case af a very weak influence lhe carrelatian caefficient will be quite close to zero. In case af Latin Hypercube Sampling this kind of sensitivity analysis can be peliormed almast directly without any particular additional computational effort. Because the model for structural response is generally nonlinear, a nonparametric rank·order correlalion is utilised. lhe key concept of nonparametric correlation is this: Inslead of the aclual numerical values we consider lhe values af ils rank among ali olher values in lhe sample. lhal is 1. 2 •.... N. lhen lhe resulling lisl of numbers will be drawn frem a peliectly known probability distribution function . lhe integers are uniformly distribuled. In case of Latin Hypercube Sampling lhe representative values of random variables cannot be idenlical . Iherefore there is no necessity to consider mid·ranking . lhe nonparametric correlation is more robusl Ihan lhe linear correlation, more resistanl lo defects in data and also distribution independent. lherefore il is particularly suitable for lhe sensitivity analysis based on Latin Hypercube Sampling .
As a measure of nonparametric correlation we use the statistic called Kendall's tau . II uses only the relative ordering af ranks: higher in rank, lower in rank , ar the same in rank. Since it uses a weak property of data , Kendall's tau can be considered as a very robust . For a detailed description of calculation , see [41, here we presenl anly a symbolic farmulae . Kendall's tau is lhe function of ranks q I' (lhe rank of a representative value of the random variable X, in an
ordered sample of N simulated values used in the j·th simulation which is equivalent to the integers in lhe table of random permutations in lhe LHS method) and 17, (lhe rank in ordered sample of lhe respanse variable abtained
by lhe i-Ih run of lhe simulalion process):
r . = r(q " .p, ). }=1 .2 ... , N (6)
In this way the correlation coefficient r, E(- Ll) can easily be abtained
for an arbitrary randam variable and we can compare Ihem. lhe greater absolule value of r , for a variable X, ' lhe greater influence has this variable on the structural respanse . An advantage of Ihis approach is the fact Ihat a sensitivity measure for ali randam variables can be obtained directly within one simulalion analysis.
Anolher method for lhe sensitivity analysis can be applied also based on LHS method. lhe melhod is based on the comparison of variation coefficients of random variables and a response variable . Let us designate the partial

236 STRUCTURAL ANALYSIS OF I-IISTORICAL CONSTRUCTIONS
coefficient af variatian COv(z,) for the case in which the randam variable X; is
the anly one treated as randam in the simulation processo COv( X,) is the
coefficient af variation of this variable. Other basic variables are kept at their mean values. The partia I sensitivity factor a ; for lhe random variable X, may be defined as:
cov(z, ) a = , cov( X, ) (7)
Such factors express the relative influence of individual variables on the variability cf structural response . If ali n random variables are considered to be random, the fol lowing approximate formulae may be written :
, COV(Z) =[t (a,cov(x,))']' (8)
It can be seen that the absolute influence is represented by the value af
COV(Z,)' . Such sensitivity may easily be depicted using pie charts. The
absolute influence of variable X, on the variabil ity af response variable
(COv(Z ) ) is best presented in percentage terms.
In case of sensitivity analysis in the terms af COV the simulation process has to be repeated n-times. This fact represents a great disadvantage for reliability problems with large number of random variables and time-consuming FEM calculation of structural response. For such cases, as modell ing Charles bridge, Lat in Hypercube response approximation can be efficiently used {5).
The aim is to approximate response function g(X) in order to avoid a
time-cansuming solution of the system of linear algebraic equations. This can be done by Taylor"s series around the expansion poinl. Neglecting higher order terms a secand-order polynomial can be considered in standard space of
random variables ); = (x, - Ji( X, ))1 o-(X,) , where mean values are expanslon
points:
" " " g(Y) =ao + L) ,Y, + LLc, ):t; (9) /. 1 , a i ./ . 1
bpc" are caefficients related to the value of partial derivatives and ao is the
value of the response function at expansion poin!, ao = g(,lI(X)).
Based on this concept a multiple regression model can be used to determine coefficients. The most decisive task is the seleclion of interpolation

D. NOY ÁK and J. ZÁ K I Charles B ridg~ in Prague 237
points and the way of perturbing them around the expansion poinl. The Latin Hypercube Sampling ensures that multidimensional space of basic variables is covered by generated points quite regularly with a small number of simulations in comparison with the simple Monte Carlo random sampling to reach a comparable accuracy, the procedure can be called the Latin Hypercube Response Approximation Method (LHRAM) [5). This advantage can be used to obtain interpolation points for an efficient response approximation . Because tensor C'I is symmetric, at least N = 2n + 11(11 - 1) / 2 paints must be generated to
obtain polynomial coefficients. Generaliy higher N can be used, which leads to the multiple regression mode!. In our case of Charles bridge analysis we use N;;100 which is greater than the minimum necessary N;; 65.
4.5 Probabilistic analvsis
Comparing structural response variable 2j (X) with
2 /. ",'1 in a certain chasen range, one can estimate the
cumulative distribution function of response variable Z I
<D( Z,) = p(Z, (X) ~ Zi"" )
required values
complementary
(10)
In th is way the probability that the structuraJ respanse variable (stress ar deflection) will be greater than the prescribed value is defined. Confidence limits for response variables can be estimated. A concept of the probability distribution functian in the complementary farm is used in order to express "subjective failure".
Here the numerical calculat ion of fa ilure probabilities for the estimation of the complementary cumulative distributian function was based on a curve fitting approach [3) , [6) . The selection of the most suitable theoretical model for the probability distribut ion function of a response variable was fi rst done comparing theoretical and empirica l probability distributions obtained from the simulation . The most suitable theoretical model among competing ones was selected and then used for the calculation of probabilities.
5. NUMERICAL RESUL TS
5.1 Oeterministic results
Sorting the results we had to solve the usual problem of any FEM analysis: there were too many available output data so it was difticult to select the most interesting and important ones. We considered node deflections, stress components and principal stresses in the selected elements.

2~8 STRUCTURAL ANALYS IS OF HISTORICAL CONSTRUCTIONS
The lollowing results should be understood as a sample 01 possibilities given by ANSYS package and are related to the top 01 the arch, load case li , variant A Contours of principal tension stresses on deformed shape are shown in Fig . 7 . Contours of principal compression stresses are displayed in Fig. 8. Gaps between different materiais due to the temperature load appeared in both figures. Oirections and magnitudes of principal stresses are illustrated in Fig . 9.
Figure 7: Principal tension stresses.
Figure 8: Principal compression stresses.

D. NOVÁK ::lIld J. ZÁK I Charles Bridge in Prague 239
Figure 9: Principal stresses.
5.2 Statistical results
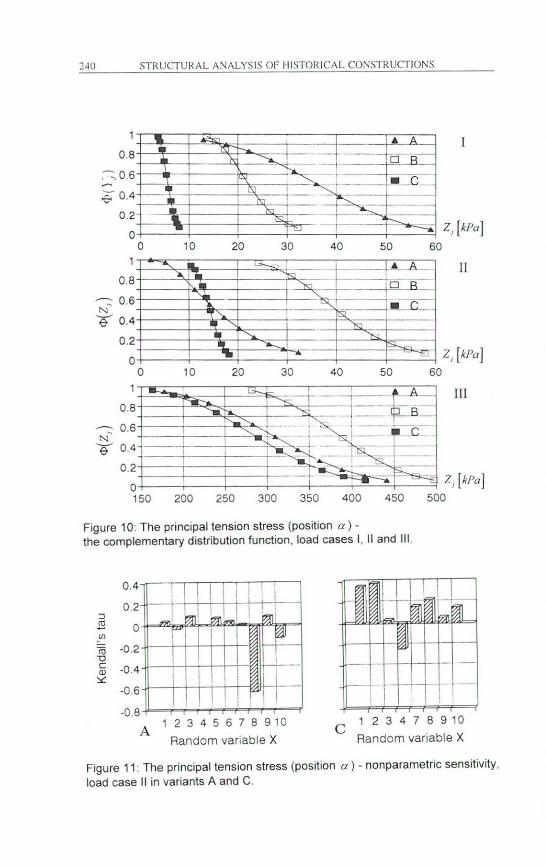
From ali results obtained by the statistical simulation the results for the principal tension stress at position a (see Fig. 10), for the horizontal deflection ai lhe lop edge of lhe parapel wall (posilion fJ) and for lhe principal lension and compression stress at the position r is shown here.
(a) The principal fensio!1 sfress Clf jJosifion a
lhe complementary probability distribution functions for variants A, B and C in ali load cases I, 11 and 111 are presenled in Fig . 10. One can easily observe mean values and fuI! probabilistic information showing confidence limits (5 and 95% percentiles) . It can be seen that the principal tension stress significantly decreased in lhe case of variant C comparing to variant A In case of variant B ;t happened only in the load case I.
The results of nonparametric sensitivity analysis in the form of Kendall's tau for load case 11 are presented in Fig . 11 . lhe plus sign represents a positive influence and the minus sign a negative influence of a random variable on the principal slress, lhe higher lhe more importan\. The dominaling variable of lhe current state is the coefficient of the thermal expansion of expanded clay concrete (.\'8) - Fig. 11 A lhis dominancy diminishes in the state after the
proposed reconstruction in variant C where Kendall's tau for variables of sandstone and expanded clay concrete increased.
240 STRUCTURAL ANALYSIS OF J-[ISTOR1CAL CONSTRUCT1 0NS
0 .8
.-::. 0 .6
;e: 0 .4
0.2
O
--:.- 0.6 N e 0.4
0.2
O
~\; O
O
~
10
1'1
-.:
10
,
20
~
20
~: i -- O B
~, -- - C --+ . . -i~ ;:::I , I
30 40 50 60
~
I~ I --~
;;:-i OR
~I ---.e 3...
30 40 50 60
Z, [kpa]
li
Z, [kl'a]
" _A- li ' 0 .8
~ 0 6 N ' . +---:r--e OA r I ! ! I ~ I
I -l ~I""': jg'J~,=_ ~,- =---. Z, [kPa ]
,-0.2
O 150 200 250 300 350 400 450 500
Figure 10: The principal tension stress (position a)-the complementary distribution function, load cases I, 11 and 111 .
O A ,,-----,-,-,-,-,-,-,-,-,---,
0.2-l1--++l-++l-++f---I
-'" ro -o.2-l1--H++-Hr--'O c Q)
" _OA.jj--H+ +-H!-
-0.6 -lI--+++-O-+-+.0.8 -ll-"';"'-':'''':'''''I-r--r-r'--r--I
A 1 2 3 4 5 6 7 8 910
Random variable X
C 1 2 3 4 7 8 9 10
Random variable X
Figure 11 : The principal tension stress (position a) - nonparametric sensitivity , load case 11 in variants A and C.

D. NOVÃK and J. ZÃK I Cha.rles Bridge in Prague 24 1
The influence of variability of random variables on the coefficient of variation (eOV) of the stress (0.53 - variant A, 0.17 - variant e) is expressed by pie charts in Fig . 12. Here the same trend observed in Fig. 11 can be interpreted as follows: The contribution of X. is 80 % for variant A but only 14
% for variant C.
, % 0% 11 Xl O X6 C
== X2 ~ X7 2%
• X3 UIII X8 16%
• X, I!!I X9
O X5 11m Xl0 41%
Figure 12: The principal tension stress (position a) - sensitivity in percentage of cav, load case 11 in variants A and e.
(b) 711e hori=onral defleclion ai lhe top edge oflhe paropelll'oll (posilion p;
The proposed reconstruction modelled by variants B, C resulted in a decrease of the horizontal defiection at the edge of the parapet wall. For load case I the situation is shown in Fig. 13. 90 % confidence intervals are [mm]: A (0.449. 0.586) , B (0.286, 0.490) and e (0 .114, 0.175). It is obvious that variant C leads to better confidence inlervals also in this case of the horizontal deflection . On the contrary to the principal stress in load case 11 the importance of the coefficient of the thermal expansion of expanded clay concrete did not decrease, Fig . 14 (CaV 0.08 - variant A, 0.13 - variant e).
0.8
0.6
N'" 0 .4 e '----'
1. I 0 .2 --i-
0 --' ,.--,
0.1 0.15 0.2 0 .25 0 .3 0.35 0,4 0,45 0 .5 0.55 0 .6
Figure 13: The horizontal deflection at the top edge of the parapet wall (position fJ) - the complementary distribution function , load case I.
242 STR UCTURAL ANALYSIS OF HISTORI CAL CONSTRUCTIONS
3% C
lII\l X1 O X6
:J X2 ~ X7
11 X3 11111 X8
• X4 ~ X9
O X5 lI!ii. X10
94%
Figure 14: The horizontal deflection at the top edge of the parapet wall (position (3) - sensitivity in percentage of cav, load case I.
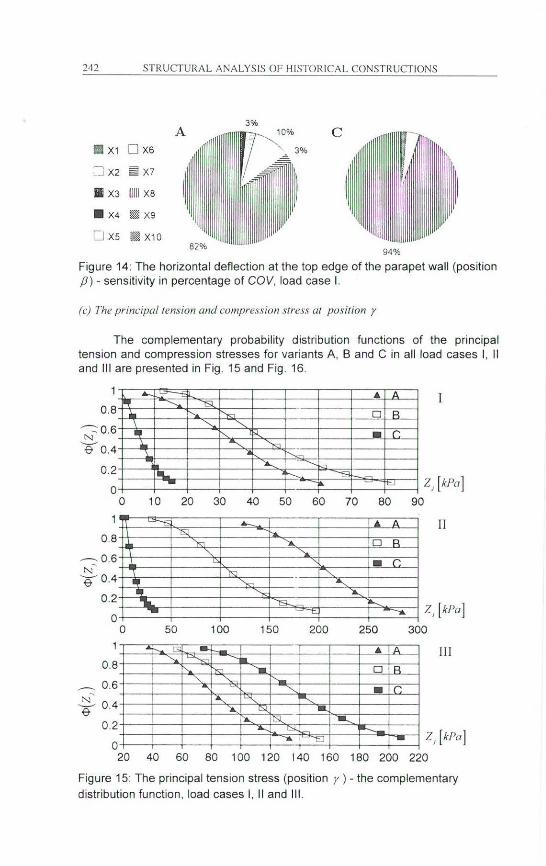
(c) The principalwnsion and compression Slress aI position r
The complementary probabi lity distribution functions of the principal tension and compression stresses for variants A, B and C in ali load cases I, 11 and 111 are presented in Fig . 15 and Fig. 16.
0.8
~0 .6
90A
0.2
O _I
o
• ~
Z, [kPn] O 10 20 30 40 50 60 70 80 90
.-... 0.6 N'
a OA
0.2
O
0.8
___ 0.6 N' a 0.4
0.2
O
O
20 40
.. II
O
•
-.. Z, [kl'a] 50 100 150 200 250 300
.. 111 O
I I
I Z, [kl'n] ~ ~ 100 1~ I~ 1~ 100 = =
Fig ure 15: The principal tension stress (position r) - the complementary distribution function, load cases I, 11 and 111.

D. NOVÂK and J. ZÂK I Charlcs Bridge In Prague 243
A significant decrease of the principal tension stress for variant C can be observed for load cases I and 11. Concerning principal compression stresses, variant C resulted in significantly lower values with small scatter in load cases I and 111. For the warm surfaee and the eold core, load case 11 , it is opposite . But the shape and position of functions is similar, i.e. the coefficient of variation has approximately lhe same value for ali varianls (0.3).
0.8
-;:0.6 .. '" ,&0.4
0 .2 • -50 -45 -40 -35 -30 -25 -20 -15 -10 -5
0 .8
-:: 0.6 N
'90.4
0.2
O
I ..
• -
O
-220 -200 -180 -160 -140 -120 -100 -80 -60 -40
0.8
---0.6 ",'
'9 0.4
0.2
O
.. • ,
-400 -350 -300 -250 -200 -ISO -100 -50 O
Z, [kl'a ]
11
Z, [kl'a]
111
Z, [kl'a]
Figure 16: lhe principal compression stress (position r ) . the complementary
distribution function , load cases I, 11 and 111.
6. CONCLUSIONS
It should be noted that the present statistical simulation was based on the 20 model that cannot produce accurate comprehensive results for th is type of structures. lhe presented analysis was done for comparative purposes of thermal effect in different variants of the structure . Significant differences were found eomparing struetural deterministie results on 20 and 3D models [7] . 3D model should be used for more reliable results , but we realized that. bearing in mind contact elements , a total number of elements and a number of

244 STRUcrURAL ANALYSIS DF I-IISTDR ICAL CONSTR UCTIONS
analyses, requirements on hardware and the time for the development of the model would exceed our facilities . Although 3D model would produce more reliable results the 20 analysis was performed as an initial step and 3D analysis was left for future investigations.
It should also be mentioned that we did not work with random fields, with spatial variations of material properties. There are two main reasons to be stuck with the concept of random variables for the time being . Firstly, random fields require parameters difficult to obtain as the type of correlation function and correlation length . Secondly, the applicability of presented methods is easier and straightforward via an interface to standard computational FEM software. Random fields modell ing requires a specialised software based on lhe stochastic finite element method and the separation of modelling process into two parts (deterministic computational model and statist ical simulation) cannot be made so easily.
It was shown that more reliable results were obtained here by using the statistical approach rather than the classical deterministic analysis. The aim was to acquire more detailed knowledge of the behaviour in order to identify and prevent hazardous situations. These results might be beneficiai for a better understanding of the structural behaviour and for the proposals of future reconstructions of Charles bridge .
Our deduction can be summarized into the following items:
• Stochastic results clearly indicated that significantly lower levei of stresses (both magnitudes and scatters) appeared in variant C of proposed reconstruction (removed concrete slab, expanded clay concrete with expansion joints) .
• Special contact elements are necessary for a realistic prediction of structural behaviour.
• FEM modelling in a combination with statistical simulatl0n Is a suitable tool for analyses of historical masonry structures .
• The variability of stresses and deflections appeared to be quite high (COV reached 0.5 in some cases).
• Distribution functions give us better insight and a basis for confidence limits.
7. ACKNOWLEDGEMENT
This research has been conducted at the Faculty of Civil Eng ineering as a part of the research project No. B 18/94 "Sensitivity and Probabilistic Analysis of Charles Bridge" and has been supported by the Technical University of Brno, Czech Republic. The partia I financiai support from the grant No. 103/93/2037 (Grant Agency of Czech Republic) is gratefully acknowledged.

D. NOVÁ K and J. ZÁK I Charlcs Bridge in Prague
8. REFERENCES
1. "ANSYS User's Manual, Revision 5.0" - Volumes I, 11 , III and IV, Swanson Analysis Systems, Inc., Houston , 1994.
245
2. McKAY, M.D., CONOVER, WJ. and BECKMAN, R.J . - A Comparison of Three Methods for Selecting Values of Input Variables in the Analysis of Output from a Computer Code, Technomelrics, Zi, 239-248, (1979).
3. NOVAK, D. and KIJAWAlWORAWET. W - "A Comparison of Accurale Advanced Simulation Melhods and Lalin Hypercube Sampling Melhod wilh Approximale Curve Fitting lo Solve Reliabilily Problems", Rep . No. 34/90, Institute of Engineering Mechanics, University of Innsbruck, Austria , 1990.
4. NOVAK, D., TEPL Y, B. and SHIRAISHI , N. - 'Sensitivity Analysis of Structures: A Review ', Proc. Int. Conf. on Civil & Structural Engineering Computlng CIVIL- COMP'93 , Edinburgh, Scotland , 1993, p. 201 .
5. NOVAK, D. and SHIRAISHI , N. - "Lalin Hypercube Response Approximalion and Sensilivily Analysis for Reliabifily Problems", Rep. No. 93-ST-01 , School of Civil Engineering , Kyoto University, Japan, 1993.
6. FLORIAN, A. and NOVAK, D. - The Statistical Model Selection for Random Variables, Software for Engineering Workstations Journal, ,4 , No. 3, 158-162 , (1988).
7. KRATOCHVILOVA. D. - "The Analysis 01 lhe Inffuence 01 Temperalure Changes in Charles Bridge ", diploma thesis, Technical Un iversity of Brno, Faculty of Civi l Engineering , Czech Republic, 1994, (in Czech)