charlotte- mecklenburg point-in- time count€¦ · ... formerly known as the charlotte-mecklenburg...
TRANSCRIPT

CHARLOTTE-
MECKLENBURG
2010-2017
POINT-IN-TIME COUNT
Released April 2017
The Housing Advisory Board of Charlotte-Mecklenburg (HAB), formerly known as the Charlotte-Mecklenburg Coalition for Housing,
is a volunteer appointed board charged with educating, advocating, engaging and partnering with community stakeholders to end
and prevent homelessness and ensure a sufficient supply of affordable housing throughout the community. Members are appointed
by the Mayor, City Council and the Mecklenburg Board of County Commissioners. HAB looks to national best practices and local
research to make its recommendations to community stakeholders and providers, and advocates and advises on a strategic level
to reduce homelessness and increase affordable housing. In addition, HAB is responsible for the governance of the Continuum of
Care in Charlotte-Mecklenburg, which carries out activities as specified in 24 CFR part 578.5(b) of the Federal Register of the U.S.
Department of Housing and Urban Development.
The UNC Charlotte Urban Institute is a nonpartisan, applied research and community outreach center at UNC Charlotte. Founded in
1969, it provides services including technical assistance and training in operations and data management; public opinion surveys;
and research and analysis around economic, environmental, and social issues affecting the Charlotte region.
Cover photo: Courtesy of Peter Safir
PREPARED FOR The Housing Advisory Board of
Charlotte-Mecklenburg
FUNDING PROVIDED BY Mecklenburg County
Community Support Services
PREPARED BY University of North Carolina at Charlotte
Urban Institute
CONTENTS
CONTEXT
15. Data & methodology
18. Local context
APPENDIX
62. Data & methodology
67. Limitations
68. National context
69. Local context
71. Data Tables
BACKGROUND
4. Authors & reviewers
5. Thanks
6. About
7. Key definitions
8. Introduction
04 KEY FINDINGS
9. PIT Count
10. HIC
11. Unsheltered
12. Trends
14. Progress report
09
15 FINDINGS
20. Trends in capacity and utilization
24. 2017 overview
33. Adults and children
37. Adults only
41. Child only
44. Unaccompanied and parenting youth
47. Chronically homeless
50. Veteran households
55. Additional unsheltered survey questions
20
62

4 | Authors & Reviewers
Authors & Reviewers
AUTHORS
Ashley Williams Clark, MCRP Assistant Director
Institute for Social Capital UNC Charlotte Urban Institute
Justin T. Lane, MA Data and Research Specialist
Institute for Social Capital UNC Charlotte Urban Institute
REVIEWERS
Andy Cooney, Social Venture Partners
Mary Gaertner, City of Charlotte Neighborhood & Business Services
Amy Hawn Nelson, UNC Charlotte Urban Institute, Housing Advisory Board
Helen Lipman, Mecklenburg County Community Support Services
Stacy Lowry, Mecklenburg County Community Support Services, Housing Advisory Board
Tameka Millner-Gunn, Community Link
Courtney Morton, Mecklenburg County Community Support Services
Rebecca Pfeiffer, City of Charlotte Neighborhood & Business Services
Allison Winston, Urban Ministry Center
ADDITIONAL INPUT PROVIDED BY Housing Advisory Board of Charlotte-Mecklenburg
Point-in-Time Count Planning Committees
Authors & Reviewers

Thanks | 5
Thanks Thanks
FUNDING PROVIDED BY: Mecklenburg County Community Support Services
MANY THANKS FOR THE SUPPORT OF: Charlotte City Council
City of Charlotte Neighborhood & Business Services
Charlotte-Mecklenburg Police Department
Homeless Services Network
Housing Advisory Board of Charlotte-Mecklenburg
Mecklenburg Board of County Commissioners
Mecklenburg County Community Support Services
Point-in-Time Count and Housing Inventory Count Planning Committees
Point-in-Time Count Volunteers
Thanks
6 | About
About
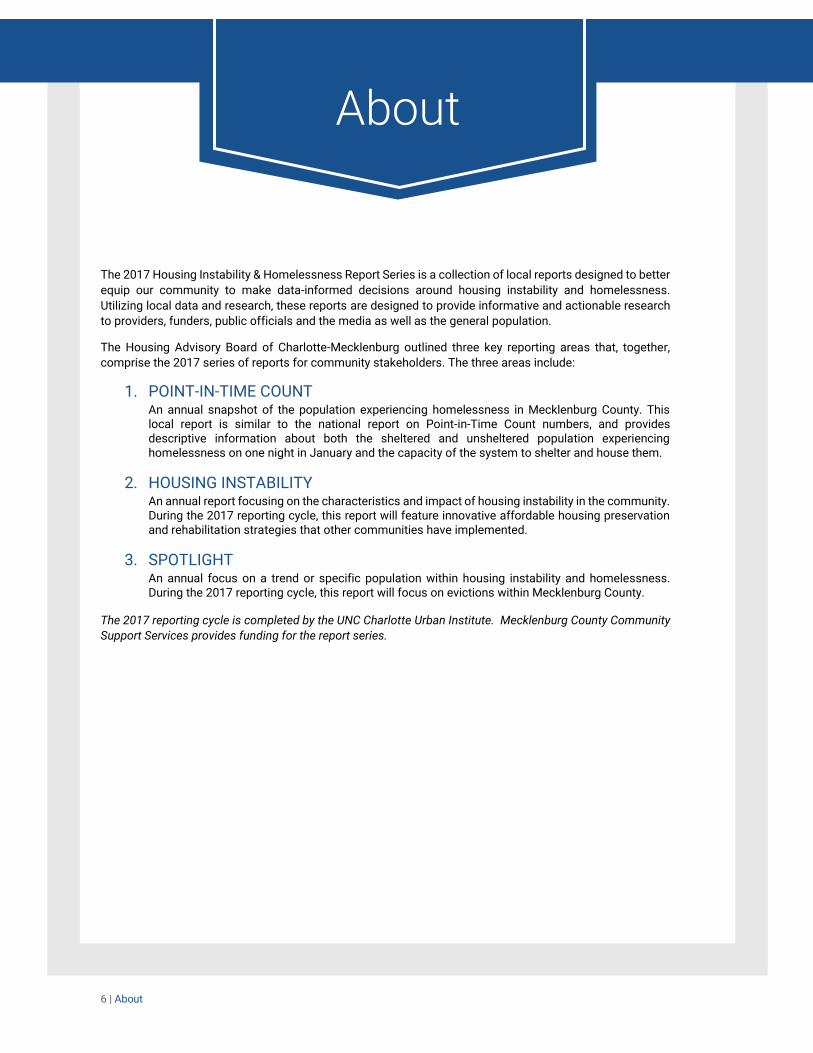
The 2017 Housing Instability & Homelessness Report Series is a collection of local reports designed to better
equip our community to make data-informed decisions around housing instability and homelessness.
Utilizing local data and research, these reports are designed to provide informative and actionable research
to providers, funders, public officials and the media as well as the general population.
The Housing Advisory Board of Charlotte-Mecklenburg outlined three key reporting areas that, together,
comprise the 2017 series of reports for community stakeholders. The three areas include:
1. POINT-IN-TIME COUNT An annual snapshot of the population experiencing homelessness in Mecklenburg County. This local report is similar to the national report on Point-in-Time Count numbers, and provides descriptive information about both the sheltered and unsheltered population experiencing homelessness on one night in January and the capacity of the system to shelter and house them.
2. HOUSING INSTABILITY An annual report focusing on the characteristics and impact of housing instability in the community. During the 2017 reporting cycle, this report will feature innovative affordable housing preservation and rehabilitation strategies that other communities have implemented.
3. SPOTLIGHT An annual focus on a trend or specific population within housing instability and homelessness. During the 2017 reporting cycle, this report will focus on evictions within Mecklenburg County.
The 2017 reporting cycle is completed by the UNC Charlotte Urban Institute. Mecklenburg County Community
Support Services provides funding for the report series.
About

Key definitions | 7
Key definitions
These definitions are based on guidelines from the U.S. Department of Housing and Urban Development (HUD). Child Only Households Households with all members under the age of 18.
Chronically Homeless Individual or head of household with a disability who lives in a place not meant for human habitation, safe haven, or emergency shelter; and who has either been continuously homeless for at least 12 months or has experienced at least four episodes of homelessness in the last 3 years where the combined occasions total at least 12 months. Occasions are separated by a break of at least seven nights. Stays in institutions of fewer than 90 days do not constitute a break.
Emergency / Seasonal Housing (ES) A facility with the primary purpose of providing temporary shelter for homeless people.
Homeless Management Information System (HMIS) A software application designed to record and store client-level information on the characteristics and service needs of homeless people. Each CoC maintains its own HMIS, which can be tailored to meet local needs, but must also conform to HUD’s HMIS Data and Technical Standards.
Households with Adults and Children Households that have at least one adult over the age of 18 and one child under the age of 18.
Households with Adults Only Households with single adults and adult couples unaccompanied by children under the age of 18.
Housing Inventory Count (HIC) A snapshot of the number of beds and units on one night that are dedicated to persons experiencing homelessness and formerly homeless people.
Parenting Youth Youth (under age 25) who identify as the parent or legal guardian of one or more children who are present with or sleeping in the same place as that youth parent.
Permanent Supportive Housing (PSH) Designed to provide housing and supportive services on a long-term basis to formerly homeless people. This is considered a form of permanent housing.
Point-in-Time Count (PIT) An unduplicated one-night estimate of both sheltered and unsheltered homeless populations.
Other Permanent Housing Long-term permanent housing that is not otherwise considered permanent supportive housing or rapid re-housing.
Rapid Re-Housing (RRH) A program that provides short- or medium-term (up to 24 months) financial assistance and services to help those experiencing homelessness to be quickly re-housed and stabilized. This is considered a form of permanent housing.
Transitional Housing (TH) A program that provides temporary housing and supportive services for up to 24 months with the intent for the person to move towards permanent housing.
Sheltered Homeless People People who are living in a supervised publicly or privately operated shelter designated to provide temporary living arrangements (including congregate shelters, transitional housing, and hotels and motels paid for by charitable organizations or by federal, state, or local government programs for low-income individuals.)
Unaccompanied Youth People who are not part of a family during their episode of homelessness and are between the ages of 18 and 24.
Unsheltered Homeless People People with a primary nighttime residence that is not designed for or ordinarily used as a regular sleeping accommodation for human beings.
Veteran Someone who has served on active duty in the Armed Forces of the United States.
Key Definitions

8 | Introduction
Introduction This report highlights the findings from the 2017 Charlotte-Mecklenburg Point-in-Time Count (PIT Count). The PIT Count
is federally mandated by the U.S. Department of Housing and Urban Development (HUD) for all communities receiving
federal funds through the McKinney-Vento Homeless Assistance Grants Program. The PIT Count takes an annual
unduplicated census of people experiencing homelessness—sheltered or unsheltered—on a given night in January and
helps communities better advocate for additional federal, state, and local resources to provide services for persons
experiencing homelessness.
There are two components to the PIT Count using HUD’s definition of homelessness: a sheltered count of how many
people are in shelters (transitional housing and emergency and seasonal shelter) and an unsheltered count of how many
people are living in places unfit for human habitation (e.g. streets, camps, abandoned buildings).
For the first time, this report also includes data from the Housing Inventory Count (HIC). The HIC provides a snapshot of
the number of beds dedicated to people experiencing homelessness (emergency shelter and transitional housing beds)
or formerly experiencing homelessness (rapid re-housing, permanent supportive housing, and other permanent housing
beds) on the night of the PIT Count. The HIC provides context to the PIT Count data by showing how the capacity to house
persons experiencing or formerly experiencing homelessness changes over time. By combining these datasets, it
provides information on how capacity is being utilized and how the community is prioritizing its resources for ending and
preventing homelessness.
Another change to this year’s PIT Count report involves enhancements to the historical data. Historical PIT Count and HIC
data from 2010 to 2016 were adjusted to reflect the most current HUD guidelines around project type classifications.
Adjusting the project types to be consistent across years allows for more accurate analysis of historical trends..
The findings provided in this report are estimates of the number of people that are homeless on a given night in
Mecklenburg County, North Carolina, which includes the City of Charlotte. There are several limitations to the 2017 PIT
Count, as well as the PIT Count overall. Given its limitations, the PIT Count should not be viewed as an exact number, but
rather a useful tool that can be used to estimate characteristics of the Charlotte-Mecklenburg homeless population and
gauge changes in the homeless population over time (see “Limitations” section for more details).
The PIT Count in Mecklenburg County identified 1,476 people experiencing homelessness on the night of Wednesday,
January 25, 2017. This was a 26% (519 person) decrease from 2010 and a 12% (198 person) decrease from 2016.
Unsheltered Sheltered
Number of people experiencing homelessness on one night
Capacity on one night (Beds dedicated to people
currently and formerly experiencing homelessness)
PIT COUNT HIC
Historical trends that use consistent project type
classifications allow for more accurate analysis of historical
trends.
TRENDS
Beds Adjusted trends

Key Findings | 9
Key Findings
Key Findings PIT Count
67%
18%
15% Unsheltered (215)
Transitional Housing (270)
Emergency Shelter (991)
1,476 People experiencing homelessness on one night
in January 2017 in Charlotte-Mecklenburg
1,011 People in households
with ADULTS ONLY
460 People in households
with ADULTS &
CHILDREN
66 UNACCOMPANIED
YOUTH
137 VETERANS
147 CHRONICALLY
Homeless
5 People in households with ONLY CHILDREN
21% Children
79% Black
4% Latino
44% Female
18-24
12% Since
2016
26% Since
2010 * Historical data adjusted. See methodology for
more details.

10 | Key Findings
Historically, emergency shelters were at or near capacity on the night of the
count, while transitional housing programs were relatively under capacity.
There is an increasing shift of resources towards rapid re-housing and
permanent supportive housing and away from transitional housing.
1,389 Emergency shelter
and transitional
housing beds
15% Since
2016
4% Since
2010
Key Findings HIC
2,595 Permanent housing beds
16% Since
2016
321% Since
2010
87%
97%
105%102%
96%
101%
97% 96%
84%
105%
92%
73%
82%78% 77%
75%
100%
2010 2011 2012 2013 2014 2015 2016 2017
Bed Utilization on Night of Count
2010-2017
TH
ES

Key Findings | 11
Key Findings
Unsheltered
215 People experiencing unsheltered homelessness on one
night in January 2017 in Charlotte-Mecklenburg
28% Since
2016
71% Since
2010
60% Slept on
the street
32% Chronic
62% Homeless
12+ months
70% Have
income
The majority (68%) of unsheltered persons have lived in Charlotte-
Mecklenburg for more than 2 years.
Of the 32% (60) of unsheltered persons that moved in the last 2 years
48% Moved from
within North or
South Carolina
35% Came for job
opportunities
JOB 67% Did not have
housing when
they moved

12 | Key Findings
PIT 2016-2017
Overall
Change 2016 2017
Homelessness rate
per 1,000 residents 0.22 1.59 1.37
Total homeless people 198 (12%) 1,674 1,476
Shelter type
Change 2016 2017
Unsheltered people 28 (15%) 187 215
People in emergency & seasonal shelter 85 (8%) 1,076 991
People in transitional housing 141 (34%) 411 270
Household and population types
Change 2016 2017
People in households with
adults and children 47 (9%) 507 460
People in households with
adults only 148 (13%) 1,160 1,011
People in households with
only children 3 (38%) 8 5
Homeless veterans 12 (8%) 149 137
Chronically homeless 23 (14%) 170 147
Unaccompanied Youth (under 25) Not available
Key Findings Trends
1,9952,298
2,0401,737 1,715 1,710 1,674
1,476
1,450
1,9751,750
1,615 1,720 1,635 1,6411,389
2010 2011 2012 2013 2014 2015 2016 2017
Total
People
ES+TH
Beds
Since 2010, the gap between need (people) and capacity (ES and TH beds)
has decreased.
= Increase = Decrease
Key Findings | 13
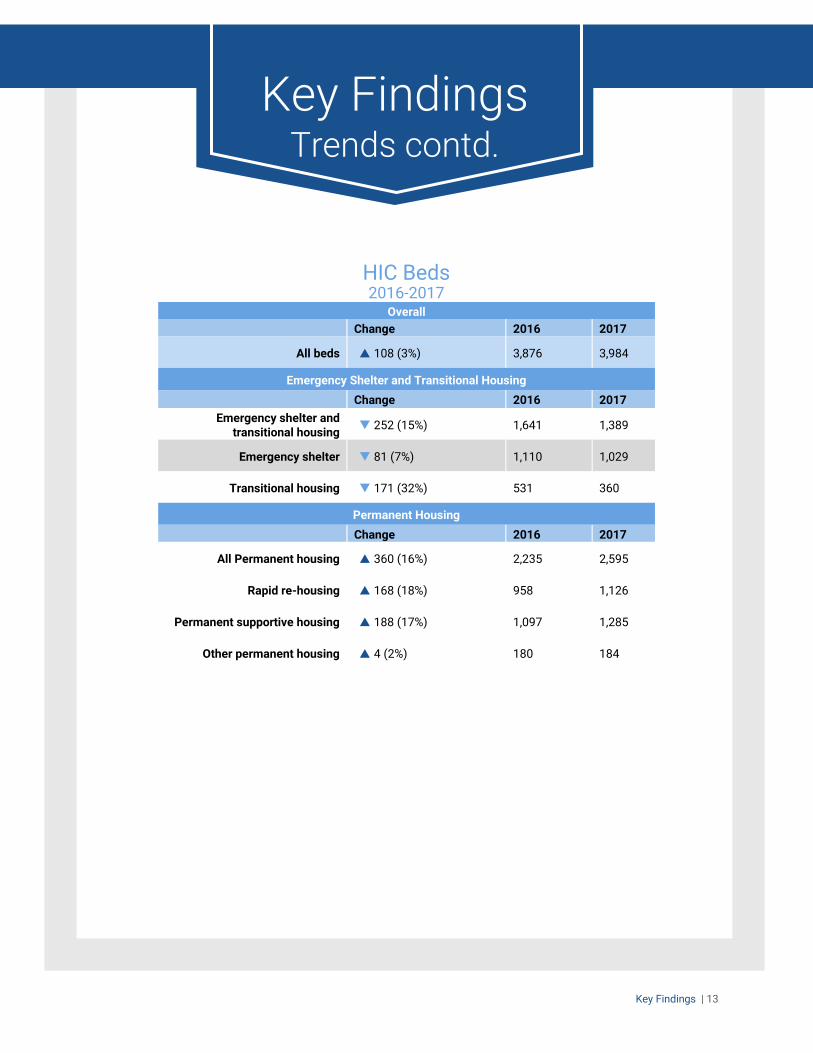
HIC Beds 2016-2017
Overall
Change 2016 2017
All beds 108 (3%) 3,876 3,984
Emergency Shelter and Transitional Housing
Change 2016 2017
Emergency shelter and transitional housing
252 (15%) 1,641 1,389
Emergency shelter 81 (7%) 1,110 1,029
Transitional housing 171 (32%) 531 360
Permanent Housing
Change 2016 2017
All Permanent housing 360 (16%) 2,235 2,595
Rapid re-housing 168 (18%) 958 1,126
Permanent supportive housing 188 (17%) 1,097 1,285
Other permanent housing 4 (2%) 180 184
Key Findings Trends contd.

14 | Key Findings
Key Findings
Community efforts are guided by the four goals outlined in the United States Interagency Council on
Homelessness plan, “Opening Doors: Federal Strategic Plan to Prevent and End Homelessness.” The plan
was originally released in June 2010 and then amended in 2015. Below is Charlotte-Mecklenburg’s progress
on each of the four goals based on the January 2017 PIT Count.
END CHRONIC HOMELESSNESS PREVENT AND END FAMILY, YOUTH,
AND CHILD HOMELESSNESS
PREVENT AND END VETERAN HOMELESSNESS
SET A PATH TO ENDING ALL TYPES OF HOMELESSNESS
GOALS
On a night in January 2017, 147 people
were identified as chronically homeless,
69 (47%) of which were unsheltered.
The number of people experiencing
chronic homelessness has decreased by
14% (23 people) since 2016.
On a night in January 2017, 460 people in
148 households with adults and children
experienced homelessness.
The number of people in homeless
households with adults and children
decreased 9% (47 people) since 2016.
On a night in January 2017, 138
homeless veterans were identified, 17%
(24) of which were unsheltered.
The number of homeless veterans has
decreased 7% (11 people) since 2016.
On a night in January 2017, 1,476 people
experienced homelessness, with 1,261
(85%) sleeping in a shelter.
Since 2016, homelessness decreased by
12% (198 people).
Key Findings Progress report

Data & Methodology | 15
Data & Methodology
The PIT Count uses the U.S. Department of Housing and Urban Development definition of homelessness in
Federal regulation 24 CFR §578.3. The PIT Count estimates the number of people “with a primary nighttime
residence that is a public or private place not designed for or ordinarily used as a regular sleeping
accommodation for human beings, including a car, park, abandoned building, bus or train station, airport, or
camping ground” or residing in a shelter (emergency/seasonal shelter or transitional housing). While the
federal government determines the PIT reporting requirements for both the unsheltered and sheltered counts,
the methodology for conducting the unsheltered count is up to each individual community to develop and
implement.
The HIC is a snapshot of the number of beds dedicated to people experiencing or formerly experiencing
homelessness on the night of the PIT Count. Beds are considered dedicated to people experiencing or
formerly experiencing homelessness if: “A. The primary intent of the project is to serve homeless persons; B.
The project verifies homeless status as part of its eligibility determination; and C. The actual project clients
are predominantly homeless (or, for permanent housing, were homeless at entry).”1
1 https://www.hudexchange.info/resources/documents/Notice-CPD-16-060-2017-HIC-PIT-Data-Collection-Notice.pdf
Emergency Shelter
Transitional Housing
Unsheltered
PIT
Currently experiencing
homelessness
HIC
Currently
homeless
Formerly
homeless
Rapid Re-housing
Permanent
Supportive
Housing
Other Permanent
Housing
Emergency
Shelter
Transitional
Housing
Beds People
Shelter Types Project Types
JAN 2017
25

16 | Data & Methodology
TABLE 1. CHANGES IN PIT METHODOLOGY AND DATA COLLECTION FROM 2011-2017
METHODOLOGY DATA
CHRONICALLY HOMELESS HUD strengthened chronically homeless data reporting requirements in HMIS. This may have contributed to an increase in the number of homeless people identified as chronically homeless.
GENDER Transgender was added as a gender option.
RACE / ETHNICITY Race and ethnicity collected for first time.
UNACCOMPANIED CHILDREN Unaccompanied children now considered a separate household type.
GENDER Option to select transgender male to female or female to male was added. Gender now collected for parenting and unaccompanied youth.
RACE / ETHNICITY Race and ethnicity now collected for parenting and unaccompanied youth.
VETERANS Chronically homeless status of veterans now reported.
MISCELLANEOUS Additional details collected on unaccompanied youth, parenting youth, veterans, and the chronically homeless.
INSTITUTIONAL DISCHARGES REMOVED The decision was made by the PIT Count Planning Committee in 2015 to no longer collect information or report on institutional discharges, such as from jails and hospitals, due to concerns over discrepancies in question phrasing between the sheltered and unsheltered counts.
VOLUNTEER TRAINING EXPANDED Formal volunteer trainings now provided.
INCREASED OUTREACH Increased coordination with The Relatives and Time Out Youth to improve the count of unaccompanied youth.
OUTREACH METHOD Beginning in 2014, volunteer outreach groups were used for the unsheltered count instead of using information provided by the police force. The increased effort to locate and count unsheltered individuals may partially account for the rise in unsheltered homelessness since 2013.
Prior to 2014, the unsheltered count used
estimates of homeless persons living in places
unfit for human habitation that were provided
by the Charlotte-Mecklenburg Police
Department.
2014
2015
2011
Continued on next page
Data & Methodology | 17
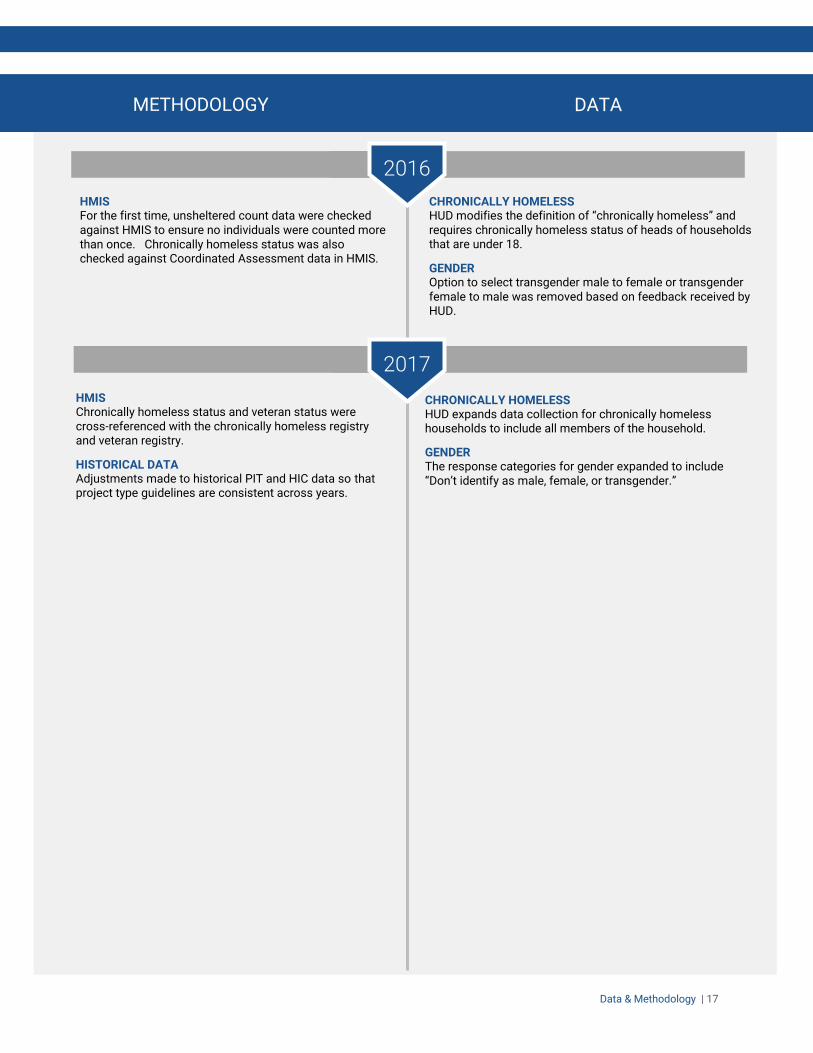
CHRONICALLY HOMELESS HUD modifies the definition of “chronically homeless” and requires chronically homeless status of heads of households that are under 18.
GENDER Option to select transgender male to female or transgender female to male was removed based on feedback received by HUD.
HMIS For the first time, unsheltered count data were checked against HMIS to ensure no individuals were counted more than once. Chronically homeless status was also checked against Coordinated Assessment data in HMIS.
2016
2017
CHRONICALLY HOMELESS HUD expands data collection for chronically homeless households to include all members of the household.
GENDER The response categories for gender expanded to include “Don’t identify as male, female, or transgender.”
HMIS Chronically homeless status and veteran status were cross-referenced with the chronically homeless registry and veteran registry.
HISTORICAL DATA Adjustments made to historical PIT and HIC data so that project type guidelines are consistent across years.
METHODOLOGY DATA

18 | Local Context
Local Context The Charlotte-Mecklenburg community has been active in its efforts to end and prevent homelessness. From
January 2010 to January 2017, there were a number of initiatives, developments and programs aimed at
addressing homelessness in the Charlotte-Mecklenburg community. This historical context and combination
of current strategies and initiatives help provide context for the PIT Count findings. Table 2 provides an
overview of the initiatives and strategies to end and prevent homelessness that were in place in 2017. This
list is intended to provide an overview of system wide initiatives, however there are many agency specific
initiatives that contribute to this work as well. Table 3 provides a historical overview of community efforts
from 2010 to 2017.
TABLE 2. OVERVIEW OF 2016-2017 INTIATIVES AND STRATEGIES
GOALS INITIATIVES STRATEGIES
End chronic homelessness
Housing First Charlotte-Mecklenburg
Community coordination and collaboration
Coordinated assessment
Engagement and advocacy
Low barrier rapid re-housing initiatives
Permanent Supportive Housing
Data, research, and best practice informed decision making
Use of by-name registries for chronically homeless and veterans experiencing homelessness
Prevent and end family, youth, and child homelessness
A Way Home Housing Endowment
Prevent and end veteran homelessness
Charlotte-Mecklenburg Housing Our Heroes

Local Context | 19
TABLE 3. OVERVIEW OF CURRENT AND HISTORICAL EFFORTS
A WAY HOME HOUSING ENDOWMENT
The City of Charlotte and Foundation For The Carolinas establish A Way Home housing
endowment.
ACCELERATION TO HOUSING 100 IN 100 DAYS INITIATIVE
Acceleration to Housing 100 in 100 Days initiative begins. From May 2013 to May 2014, 442 chronically homeless persons are housed.
CHARLOTTE HOUSING AUTHORITY HOUSING CHOICE VOUCHER WAITING LIST
Charlotte Housing Authority’s Housing Choice Voucher waiting list opens.
CHARLOTTE-MECKLENBURG HOUSING OUR HEROES
Charlotte-Mecklenburg accepts the Mayors Challenge with a goal of housing 204 Veterans by the
end of 2015.
COORDINATED ASSESSMENT
Charlotte-Mecklenburg Continuum of Care launches Coordinated Assessment.
HOUSING TRUST FUND
Charlotte voters approve a $15 million bond for the Housing Trust Fund.
MECKLENBURG COUNTY HOUSING STABILITY PARTNERSHIP
Mecklenburg County Housing Stability Partnership forms.
2010
2013
2014
2015
HOUSING ADVISORY BOARD OF CHARLOTTE-MECKLENBURG AND THE TEN-YEAR PLAN TO
END AND PREVENT HOMELESSNESS
Charlotte City Council and Mecklenburg Board of County Commissioners create the Housing Advisory Board of Charlotte-Mecklenburg Board (formerly known as the Charlotte-Mecklenburg Coalition for Housing) to oversee the ten-year plan to end and prevent homelessness.
HOUSING FIRST CHARLOTTE-MECKLENBURG
Housing First Charlotte-Mecklenburg initiative to end chronic homelessness by 2016 launches.
Charlotte joins the national campaign Zero:2016 to end chronic homelessness by 2017.
MECKLENBURG COUNTY HIRES TWO NEW POSITIONS
Mecklenburg County hires two new positions committed to improving data and research.
2016 HOUSING TRUST FUND
Charlotte voters approve a $15 million bond for the Housing Trust Fund.

20 | Trends in Capacity and Utilization
Trends in Capacity and
Utilization Historical Overview The Housing Inventory Count (HIC) gives a one-night snapshot of the number of beds that are dedicated to people
currently experiencing homelessness or formerly experiencing homelessness. The HIC includes emergency shelter
(ES), transitional housing (TH), rapid re-housing (RRH), permanent supportive housing (PSH), and other permanent
housing (OPH) beds. When combined with the PIT Count, the HIC can provide greater insights into the capacity to
shelter people experiencing homelessness on one night and how resources are being utilized.
In 2017, there were 3,984 beds dedicated to people experiencing homelessness. Of those, the majority (65% or 2,595)
were permanent housing of some form (rapid re-housing, permanent supportive housing, and other permanent
housing) and the remaining beds were 26% (1,029) emergency shelter, and 9% (360) transitional housing.
The historical data point to an increasing shift of resources towards rapid re-housing and permanent supportive
housing options and away from transitional housing. Since 2010, the number of permanent supportive housing beds
increased 270% (from 347 beds in 2010 to 1,285 in 2017). Rapid re-housing increased significantly from 2013 to 2014
as HUD funding priorities started placing greater emphasis on rapid re-housing. From 2010 to 2017 the number of
rapid re-housing beds increased by 879% (1,011). During this same time period, emergency shelter increased slightly
(7% or 63 beds), while transitional housing decreased 26% (124 beds). The decrease in the number of transitional
housing beds from 2016 to 2017 is partially due to Hope Haven’s 180 transitional housing beds no longer being
included in the HIC Count.
966
1218
999932
1017
10931110
1029
484
757 751683 703
542 531
360
155
67
180115
210172 180 184
347
475
688
849936
992
1097
1285
115
398450
417
10271013
958
1126
2010 2011 2012 2013 2014 2015 2016 2017
Housing Inventory Count
2010-2017
ES
TH
OPH
PSH
RRH

Trends in Capacity and Utilization | 21
Capacity and Utilization System Capacity
By combining the HIC and PIT Count it is possible to estimate the number of beds that were utilized on the night of the
count. When there are more people experiencing homelessness on one night than the number of beds dedicated for
people currently experiencing homelessness, it indicates a bed shortfall. Since 2010, the bed shortfall has decreased
substantially (84%), however the shortfall has increased since 2014. On the night of the January 2017 count, there were
1,389 emergency shelter and transitional beds dedicated to people experiencing homelessness and 1,476 people
experiencing sheltered and unsheltered homelessness. This indicates that there was a capacity shortage of
approximately 87 beds. In the winter, seasonal shelter is available through Room In The Inn (RITI). During the months
in which RITI is not open, there may be an increase in the shortage of beds. Despite a bed being dedicated to a person
experiencing homelessness, it does not necessarily mean that the bed was occupied on the night of the count.
Additionally, there are differences between emergency shelter and transitional housing utilization (see page 27 for
more details).
1,995
2,298
2,040
1,7371,715 1,710 1,674
1,476
1,450
1,975
1,7501,615
1,7201,635 1,641
1,389
2010 2011 2012 2013 2014 2015 2016 2017
Emergency Shelter and Transitional Housing Bed Utilization
2010-2017
ES+TH Beds
Total People (ES, TH, Unshelt.)
2067
29153068 2996
3893 3812 3876 3984
1000
4500
2010 2011 2012 2013 2014 2015 2016 2017
Total Housing Inventory Count (ES, TH, RRH, PSH, OPH)
2010-2017
(545) (323) (290) (122) (-5) (75) (33) (87) (Shortfall)

22 | Trends in Capacity and Utilization
Emergency Shelter Utilization
Emergency shelter beds are consistently at or near capacity. Since 2011 shelters have been more than 90% occupied
each year. In 2017, 96% of emergency shelter beds were utilized. One factor contributing to the under utilization of
beds is that someone could be signed up to hold a bed for the night, but then did not show up for the bed on the night
of the Count.
Transitional Housing Utilization
In contrast, transitional shelter beds have been consistently underutilized since 2013, despite a decrease in the
number of transitional housing beds since 2010. In 2017, only 75% of transitional housing beds were being utilized on
the night of the count.
838
1185
1046952 978
1107 1076991
966
1218
999932
10171093 1110
1029
2010 2011 2012 2013 2014 2015 2016 2017
Emergency Shelter Bed Utilization
2010-2017
406
798
693
502
573
423 411
270
484
757 751683 703
542 531
360
2010 2011 2012 2013 2014 2015 2016 2017
Transitional Shelter Bed Utilization
2010-2017
ES Beds
People
in ES
(87%) (97%) (105%) (102%) (96%) (101%) (97%) (96%)
TH Beds
People
in TH
(84%) (105%) (92%) (73%) (82%) (78%) (77%) (75%)
(Capacity)
(Capacity)

Trends in Capacity and Utilization | 23
87%
97%
105%102%
96%
101%
97% 96%
84%
105%
92%
73%
82%
78% 77%75%
100%
2010 2011 2012 2013 2014 2015 2016 2017
Bed Utilization
2010-2017
TH
ES

24 | 2017 Overview
2017 Overview
Per Capita The per capita homelessness rate (homeless persons per 1,000 people in Mecklenburg
County) decreased from 2.17 in 2010 to 1.37 in 2017 as the Mecklenburg County population grew.
2.17
1.591.37
0.0
0.5
1.0
1.5
2.0
2.5
3.0
2010 2011 2012 2013 2014 2015 2016 2017
Homeless persons per 1,000 people*
2010-2017
919,628
1,055,8261,077,874
800,000
850,000
900,000
950,000
1,000,000
1,050,000
1,100,000
2010 2011 2012 2013 2014 2015 2016 2017
Mecklenburg County population*
2010-2017
* 2009-2015 Population data obtained from Census Population Estimates. 2016 population projection obtained from the North Carolina Office of State Budget and Management.

2017 Overview | 25
1,476 Homeless persons identified on
the night of January 25, 2017 26%
From 2010 to 2017
12% From 2016 to 2017
Overall, 2010-2017
The 2017 count identified 1,476 homeless persons.
2010 to 2017: There was a 26% (519 people) decrease in the number of people
experiencing homelessness from 2010 to 2017. During this time, the overall number of
HIC beds decreased by 4% (61 beds). The decrease in homeless persons since 2010 is
largely due to a decrease of 136 people in transitional housing and a decrease of 536
unsheltered persons.
2016 to 2017: There was a 12% (198) decrease in homeless persons from 2016 to 2017.
During this same time, the number of emergency shelter and transitional housing HIC beds
decreased 15% (252 beds). The decrease in homeless persons since 2016 is due to a
decrease of 141 people in transitional housing and a decrease of 85 people in emergency
shelter.
838
1185
1046952 978
1107 1076991
406
798693
502573
423 411270
751
315 301 283
164 180 187 215
1995
2298
2040
1737 1715 1710 1674
1476
2010 2011 2012 2013 2014 2015 2016 2017
Overall PIT Count
2010 - 2017
Emergency &
Seasonal
Unsheltered
Total
Transitional Housing
All of Community Link’s
Transitional Housing
units changed to Rapid
Re-Housing
Hope Haven’s
transitional
housing units
no longer
included in PIT
Count

26 | 2017 Overview
Shelter Type, 2017
15% (215 people) of homeless
persons identified were unsheltered,
and the remaining 85% (1,261) of
homeless were sheltered
Unsheltered homelessness increased
by 17% (31 people) and sheltered
homelessness decreased by 22% (360
people) from 2016 to 2017.
The proportion of people experiencing
homelessness in emergency shelters
has increased since 2014 as the
proportion in transitional housing has
decreased.
ES 67%
15%
TH 18%Sheltered
Unsheltered
Total Homeless Population by Shelter
Type
2017
N=1,476
42%
52%
51%
55%
57%
65%
64%
67%
2010
2011
2012
2013
2014
2015
2016
2017
Emergency & Seasonal
20%
35%
34%
29%
33%
25%
25%
18%
Transitional Housing
38%
14%
15%
16%
10%
11%
11%
15%
Unsheltered
PIT Count Shelter type distribution by year 2010-2017
2017 Overview | 27
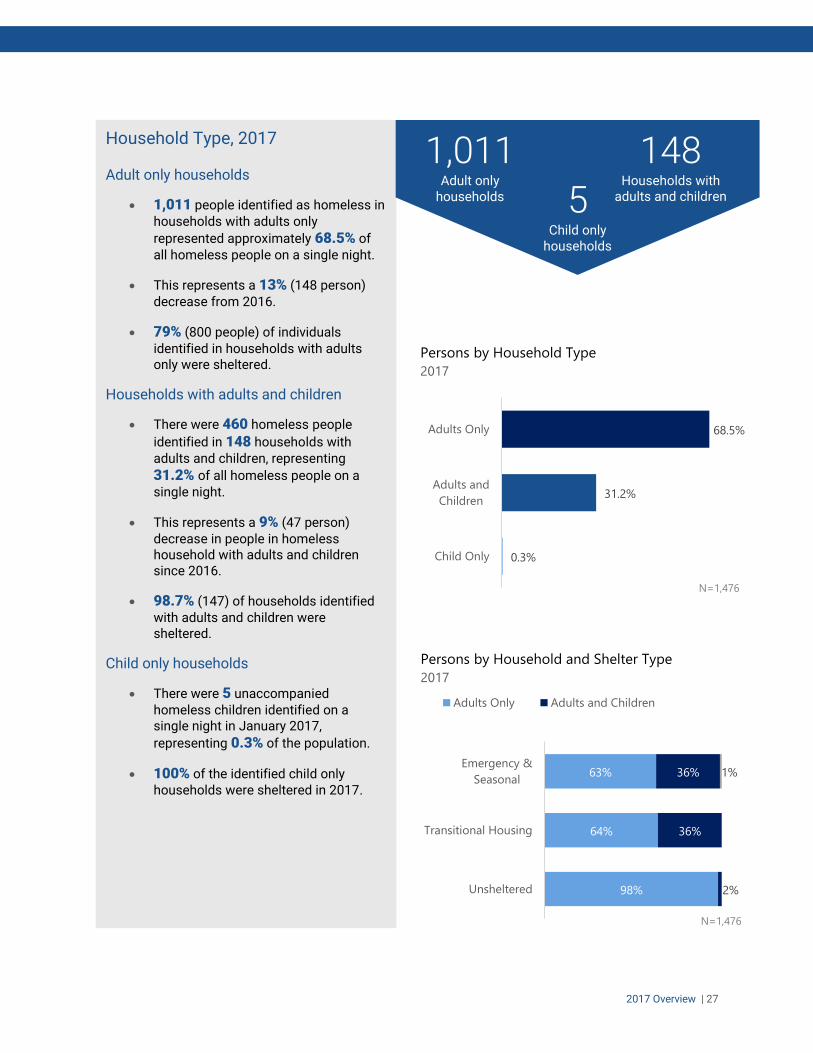
Household Type, 2017
Adult only households
1,011 people identified as homeless in households with adults only
represented approximately 68.5% of all homeless people on a single night.
This represents a 13% (148 person) decrease from 2016.
79% (800 people) of individuals identified in households with adults only were sheltered.
Households with adults and children
There were 460 homeless people
identified in 148 households with adults and children, representing
31.2% of all homeless people on a single night.
This represents a 9% (47 person) decrease in people in homeless household with adults and children since 2016.
98.7% (147) of households identified with adults and children were sheltered.
Child only households
There were 5 unaccompanied homeless children identified on a single night in January 2017,
representing 0.3% of the population.
100% of the identified child only households were sheltered in 2017.
148 Households with
adults and children
1,011 Adult only
households 5 Child only
households
0.3%
31.2%
68.5%
Child Only
Adults and
Children
Adults Only
Persons by Household Type
2017
N=1,476
63%
64%
98%
36%
36%
2%
1%Emergency &
Seasonal
Transitional Housing
Unsheltered
Persons by Household and Shelter Type
2017
Adults Only Adults and Children
N=1,476

28 | 2017 Overview
Chronically Homeless, 2017
10% (147 people) of the homeless population identified as chronically homeless.
53% (78 people) of people experiencing chronic homelessness were in emergency or seasonal shelter
and 47% (69 people) were unsheltered.
Homeless Veterans, 2017
There were 137 homeless veterans
identified in Mecklenburg County.
Veterans experiencing homelessness
accounted for nearly 12% of all
homeless adults.
The majority (82% or 113 people) of
homeless veterans were sheltered.
147 Chronically homeless persons
47%
53%
Unsheltered
Emergency & Seasonal
Chronically Homeless Persons by Shelter Type
2017
N=147
137 Veterans
17.5%
36.2%
46.4%
Unsheltered
Transitional Housing
Emergency &
Seasonal
Veterans by Shelter Type
2017
N=137

2017 Overview | 29
Race, 2017
79% (1,170 people) of the total
homeless population identified as
Black. This is disproportionately high
considering only 31% of the general
population in Mecklenburg County
identifies as Black. In Mecklenburg
County, 23% of people who identify as
Black lived under the poverty line
accounting for 46% of all people under
the poverty line in Mecklenburg County,
according to the U.S. Census Bureau’s
American Community Survey, 2011-
2015 5-year estimates.
61% (132 people) of the unsheltered
homeless population identified as
Black.
People who identify as White
comprised about 18% of the homeless
population (272 people) but 57% of the
general population and 37% of all
people in poverty in Mecklenburg
County, according to the U.S. Census
Bureau’s American Community Survey,
2011-2015 5-year estimates.
An overwhelming proportion of people
in households with adults and children
identify as Black (92% or 1170
people). A large proportion of
unaccompanied youth (82% or 59
people) identify as Black as well.
1%
2%
18%
79%
Asian or Pacific Islander
American Indian
White
Black
Homeless People by Race
2017
N=1,476
74%
92%
100%
82%
24%
7%
15%
2%
1%
3%
1%
1%
Adults Only
Adults and Children
Child Only
Unaccompanied Youth
Homeless People by Race and
Household Type
2017Black White American Indian Asian or Pacific Islander
79% Black 18%
White
3% Other
N=1,476

30 | 2017 Overview
Ethnicity, 2017
4% (60 people) of the total homeless
population identified as
Hispanic/Latino. In comparison, the
Hispanic/Latino population comprises
13% of the general population and
23% of people below the poverty level
in Mecklenburg County, according to
the U.S. Census Bureau’s American
Community Survey, 2011-2015 5-year
estimates.
4% (9 people) of the unsheltered
homeless population identify as
Hispanic/Latino.
85% (51 people) of homeless people
who identify as Hispanic/Latino were
sheltered.
5% (24 people) of people in
Households with Children identify as
Hispanic/Latino
96%
4%
Non-Hispanic/Latino
Hispanic/Latino
Homeless People by Ethnicity
2017
N=1,476
4% Latino
95%
96%
96%
100%
5%
4%
4%
Adults and Children
Adults Only
Unaccompanied Youth
Child Only
Homeless People by Ethnicity and
Household Type
2017Non-
Hispanic/Latino
Hispanic/
Latino
N=1,476

2017 Overview | 31
Gender, 2017
56.2% (829) of all homeless people
identified were male in 2017, yet males
accounted for 85% (182 people) of the
unsheltered homeless population.
43.6% (644) of all homeless people
identified were women in 2017,
however women accounted for 64%
(296) of people in households with
adults and children.
0.1% (2) of all homeless people
identified as transgender; one person
was in emergency and seasonal
housing and the other was unsheltered.
0.1% (1) of all homeless people
identified did not identify with a gender.
This individual was unsheltered.
43.6% Female 56.2%
Male 0.1% Transgender
0.1%
0.1%
43.6%
56.2%
Do not
identify
Transgender
Female
Male
Homeless Persons by Gender
2017
45.9%
58.5%
14.4%
54.0%
41.5%
84.6% 0.5%
0.1%
0.5%
Emergency &
Seasonal
Transitional Housing
Unsheltered
Gender by Shelter Type
2017
Female Male Do not identify Transgender
N=1,476
0.1% Do not identify
N=1,476

32 | 2017 Overview
Age, 2017
21% (311 people) of all homeless
people identified on a single night in
January 2017 were under the age of
18.
101 people (7%) were ages 18 to 24.
Of the 101 youth ages 18 to 24, 66 (or
65%) were unaccompanied youth and
29 (29%) were part of a household with
an adult and child.
The majority of homeless people
identified (72% or 1,064 people) were
age 25 or older.
72%
7%
21%
Persons age 25 or older
Persons age 18 or 24
Persons age 17 or younger
Homeless Persons by Age
2017
N=1,476
44%
68%
64%
56%
14%
18%
0.4%
17.8%
18.3%
Persons age 17 or
younger
Persons age 18 or 24
Persons age 25 or older
Age by Shelter Type
2017
Emergency & Seasonal Transitional Housing Unsheltered
N=1,476

Adults & Children | 33
Households with
Adults & Children
Given changes in methodology for the unsheltered count since 2013, historical trends should
be interpreted with caution.
The HUD definition of homelessness used in the PIT Count differs from the definition used by
U.S. Department of Education to identify students experiencing homelessness and housing
instability that qualify for McKinney-Vento services. Due to this difference in definition,
comparisons cannot be made between the two numbers. See “Limitations” section for more
details. For McKinney-Vento data refer to the Charlotte-Mecklenburg Family Homelessness
Snapshot report.
DEFINITION
People who are homeless as part of households that have at least one adult and one child. Also referred
to as “families.”

34 | Adults & Children
Shelter Type, 2017
78% (359 people) identified in
households with adults and children
were in emergency and seasonal
shelter.
99% (146) of households with adults and children were sheltered.
460 Homeless persons in
households with adults and children
9%
From 2016 to 2017
On A Single Night in January 2017
There were 460 homeless people identified in 148 households with adults and children,
representing 31% of all homeless people on a single night.
31% Of all people experiencing
homelessness were identified in a household with adults and
children
148 Households identified with
adults and children
78.0%
21.1%
0.9%
Emergency & Seasonal
Transitional Housing
Unsheltered
People in Homeless Households
with Adults and Children by Shelter
Type
2017
N=460

Adults & Children | 35
Age of Homeless People in
Households with Adults and
Children, 2017
66% (305) of all homeless people identified in households with adults and children were under the age of 18.
6% (29) of all homeless people in households with adults and children were between the ages of 18 and 24.
27% (126) of people in households with adults and children were 25 years or older.
98% (305) of homeless children were part of a homeless household with adults and children.
Gender of Homeless People in
Households with Adults and
Children, 2017
64% (296) of people in homeless households with adults and children
were females. 36% (164 people) of people in households with adults and children were males.
Females made up 66% (or 64 people) of those in transitional housing and
64% (or 230 people) of those in emergency and seasonal shelter. An even share of males and females were unsheltered.
There were 0 people in households with adults and children who identified as transgender.
22% (or 64 people) of females were in
transitional housing and 78% (or 230 people) were in emergency and seasonal shelter.
66%
6%
27%
Persons age 17 or younger
Persons age 18-24
Persons age 25 or older
Age of People in Homeless Households
with Adults and Children
2017
N=460
64%
66%
50%
36%
34%
50%
Emergency & Seasonal
Transitional Housing
Unsheltered
Total People in Homeless Households
with Adults and Children by Gender
2017
Female Male
N=460

36 | Adults & Children
Since 2016
The number of people in households with adults and children decreased by 9% (47 people). This decrease from 2016 to 2017 was mostly due to a decrease in the number of people in
households with adults and children in transitional housing, which decreased by 25% (32
people), compared to emergency shelter which decreased 4.5% (16 people).
The number of unsheltered people in households with adults and children increased from 3
people in 2016 to 4 people in 2017 and the number of sheltered people in households with adults
and children decreased by 10% (48 people).
375359
129
97
3 4
507
460
2016 2017
People in Households with Adults and Children
2016-2017
Total
ES
TH
Unsheltered
Adults Only | 37
Households with
Adults Only
Given changes in methodology for the unsheltered count since 2013, historical trends
should be interpreted with caution.
From 2014 to 2017, community initiatives and policies that include efforts to decrease the
number of individuals experiencing homelessness include: Acceleration to Housing 100 in
100 Days campaign, Housing First Charlotte-Mecklenburg effort to end chronic
homelessness, Housing Our Heroes effort to end veteran homelessness, and expansion of
low barrier permanent supportive housing and low barrier rapid re-housing initiatives. See
“Local Context” section for more details.
DEFINITION
Single adults and adult couples unaccompanied by
children. Also referred to as “individuals” or
“households without children.”

38 | Adults Only
On A Single Night in January 2017
1,011 people were homeless in households with adults only in Mecklenburg County, representing
68.5% of all homeless people on a single night.
Shelter Type, 2017
People in households with adults only
comprised 68.5% (1,011) of the total homeless population.
62% (627 people) of individuals were in emergency and seasonal shelters,
17% (173 people) were in transitional housing.
More homeless individuals were
sheltered (79% or 800 people) than
unsheltered (21% or 211 people).
1,011 Homeless people in
households with adults only
68.5% Of all people experiencing
homelessness were
identified in a household
with adults only
13% From 2016 to 2017
N=1,011
62%
17%
21%
Emergency & Seasonal
Transitional Housing
Unsheltered
People in Homeless Households with
Adults Only by Shelter Type
2017

Adults Only | 39
Age of Homeless People in
Households with Adults Only, 2017
Approximately 8% (or 78) of people in households with adults only were between the ages of 18 and 24.
92% (or 933) of people in households with adults only were 25 years or older.
Gender of Homeless People in
Households with Adults Only, 2017
66% (or 663) of people in households with adults only identified as male and
34% (or 345 people) identified as
female. Two people identified as transgender. One person did not identify with a gender.
The majority (85.3% or 180 people) of unsheltered individuals identified as male.
Males were more likely to be
unsheltered (27% or 180 people) or in emergency and seasonal shelters
(61% or 404 people) than in
transitional housing (12% or 79 people).
Females were more likely to be
counted in transitional housing (27% or 94 people) or in emergency and
seasonal shelters (64% or 222 people)
than in unsheltered locations (8% or
29 people).
92%
8%
Persons age 25 or older
Persons age 18-24
Age of Homeless Households with
Adults Only
2017
64.4%
45.7%
85.3%
35.4%
54.3%
13.7%
0.2%
0.5%
0.5%
Emergency & Seasonal
Transitional Housing
Unsheltered
Total Homeless Households with Adults Only
by Gender and Shelter Type
2017
Male Female Transgender Do not identify
N=1,011
N=1,011

40 | Adults Only
Since 2016
The number of homeless individuals decreased by 13% (from 1,160 people in 2016 to 1,011 people in 2017).
The number of sheltered homeless individuals decreased by 18% (from 975 individuals in
2016 to 800 individuals in 2017).
The number of homeless individuals in emergency and seasonal shelters decreased by
10% (from 693 individuals in 2016 to 627 individuals in 2017), while the number in
transitional housing decreased by 39% (from 282 individuals in 2016 to 173 individuals in 2017).
The number of unsheltered homeless individuals increased 15% (from 184 individuals in 2016 to 211 individuals in 2017).
693
627
282
173184211
1160
1011
2016 2017
People in Homeless Adult Only Households by Shelter Type
2017
ES
Total
TH
Unsheltered

Child Only | 41
Child Only
Households
As part of the 2015, 2016, and 2017 PIT Counts, organizations that work with child only
households were involved with PIT Count planning in an effort to improve the count.
Homeless unaccompanied children and youth are especially hard to identify. As a result,
this population is likely undercounted. Additionally, unaccompanied children and youth
often do not meet the PIT Count definition of “homeless” but may be considered homeless
under other definitions. See “Methodology” section for more details.
Given changes in the unsheltered count methodology since 2013, historical trends should
be interpreted with caution.
DEFINITION
People who are not part of a family during their
episode of homelessness and who are under the age
of 18.

42 | Child Only
On A Single Night in January 2017
There were 5 children in 5 child only households on a single night in January 2017—less than 1% of the total homeless population.
Shelter Type, 2017
None of the child only households were
unsheltered in 2017. All (100%) of the child only households were in emergency and seasonal shelters.
5 Homeless children in child
only households <1%
Of all people experiencing
homelessness were identified in
child only households
100%
0%
0%
Emergency & Seasonal
Transitional Housing
Unsheltered
Homeless Child Only Households by
Shelter Type
2017
N=5

Child Only | 43
Since 2016
The number of people in child only
households decreased 37.5% (from 8 in 2016 to 5 children in 2017).
The number of people in child only households in transitional housing was
zero.
The number of unsheltered people in
child only households was zero.
Gender of Homeless People in Child
Only Households, 2017
Three (60%) people in child only
households were females. Two (40%) people in child only households were males.
Zero people in child only households identified as transgender.
60%
40%
0%
Female
Male
Transgender
Total People in Homeless Child Only
Households by Gender
2017
N=5
8
5
2016 2017
Child Only Household Shelter Status
2017
ES

44 | Unaccompanied & Parenting Youth
Unaccompanied &
Parenting Youth
Households
As part of the PIT Count, special events were held at organizations that work with
unaccompanied youth in an effort to improve the count of unaccompanied youth
experiencing homelessness.
Homeless unaccompanied children and youth are especially hard to identify. As a result,
this population is likely undercounted. Additionally, unaccompanied children and youth
often do not meet the PIT Count definition of “homeless” but may be considered homeless
under other definitions. See “Methodology” section for more details.
Given changes in the unsheltered count methodology since 2013, historical trends should
be interpreted with caution.
Prior to 2011, unaccompanied youth were not considered a separate household type, so
changes since 2010 cannot be analyzed.
DEFINITION
Unaccompanied youth: People who are not part of a family during
their episode of homelessness and who are under the age of 25.
Parenting youth: Youth (under age 25) who identify as the parent or legal guardian of one or more children who are present with or
sleeping in the same place as that youth parent.

Unaccompanied & Parenting Youth | 45
On a Single Night in January 2017
There were 66 unaccompanied youth on a single night in January 2017—
approximately 4% of the total homeless population.
24% (24) of all youth were parents.
Shelter Type, 2017
61% (40 people) of the unaccompanied homeless youth were in emergency and seasonal shelters.
12% (8 people) were in transitional housing.
27% (18 people) of the unaccompanied youth were unsheltered in 2017.
66 Homeless persons
in unaccompanied
youth households 4% Of all people experiencing
homelessness were identified
in unaccompanied youth
households
24 Parenting youth in
households with adults
and children
61%
12%
27%
Emergency & Seasonal
Transitional Housing
Unsheltered
Unaccompanied Homeless Youth by Shelter
Type
2017
N=66

46 | Unaccompanied & Parenting Youth
Due to adjustments to the 2010-2016 data, no historical comparisons can be made in this category.
Gender of Homeless People in
Unaccompanied Youth Households,
2017
59% (39) of people in unaccompanied
youth households were males and 39% (26) were females.
One (2%) person in an unaccompanied youth household did not identify with a gender.
Unaccompanied youth that identified as female were predominantly in emergency and seasonal shelters
(65% or 17 people) or in transitional
housing (31% or 8 people).
59%
39%
2%
Male
Female
Do not Identify
Total People in Homeless
Unaccompanied Youth Households by
Gender
2017
N=66

Chronically Homeless | 47
Chronically Homeless
From 2015 to 2017, community initiatives and policies that specifically targeted decreasing
the number of people experiencing chronic homelessness included: Housing First
Charlotte-Mecklenburg effort to end chronic homelessness and a focus on permanent
supportive housing and housing first models. See “Local Context” section for more details.
In 2014 HUD strengthened data reporting requirements for identifying the chronically
homeless, resulting in changes in how the chronically homeless were identified in HMIS.
In 2016, HUD modified the definition of chronically homeless. This change in definition
could have contributed to changes observed in the number of sheltered chronically
homeless in 2015 and the number of unsheltered homeless in 2016. See “Methodology”
section for more details.
Given changes in the unsheltered count methodology since 2013, historical trends should
be interpreted with caution.
DEFINITION
Individual or head of household with a disability who lives in a place not meant for
human habitation or in an emergency shelter; and who has either been continuously
homeless for at least 12 months or has experienced at least four episodes of
homelessness in the last 3 years where the combined occasions total at least 12
months. Occasions are separated by a break of at least seven nights and stays in
institutions of fewer than 90 days do not constitute a break.

48 | Chronically Homeless
On a Single Night in January 2017
147 people were identified in
chronically homeless households,
representing 10% of all homeless
people on a single night.
53% (78) of the 147 chronically
homeless people experiencing
homelessness were individuals and
47% (69) were in households with
other adults. There were 0 chronically
homeless households with adults and
children.
Chronically homeless individuals in
adult only households represented
15% of the total number of people in
adult only households and 10% of all
homeless people.
Shelter Type, 2017
53% (78 people) of chronically
homeless people were identified in
emergency and seasonal shelters. The
other 47% (69 people) were
unsheltered.
147 Chronically homeless people experiencing
homelessness 10%
Of all homeless people
14% From 2016 to 2017
53%
0%
47%
Emergency & Seasonal
Transitional Housing
Unsheltered
Chronically Homeless Persons by
Shelter Type
2017
N=147

Chronically Homeless | 49
110
78
5969
170
147
2016 2017
Total Chronically Homeless Persons by Shelter Type
2017
ES
Total
Unsheltered
Since 2016
The number of chronically homeless people decreased by 14% (from 170 people in 2016 to 147 people in 2017).
The number of unsheltered chronically homeless people increased by 17% (from 59 people in 2016 to 69 people in 2017) and the number of sheltered chronically homeless people in
emergency and seasonal shelters decreased by 29% (from 110 people in 2016 to 78 people in 2017).

50 | Veteran Households
Veteran Households
From 2015 to 2017, community initiatives and policies that specifically targeted decreasing
the number of homeless veterans included the Housing Our Heroes effort to end veteran
homelessness and the A Way Home Housing Endowment, which prioritizes veteran
households with adults and children. See “Local Context” section for more details.
Given changes in the unsheltered count methodology since 2013, historical trends should
be interpreted with caution.
DEFINITION
Someone who has served on active duty in the
Armed Forces of the United States.

Veteran Households | 51
Shelter Type, 2017
The majority of homeless veterans were sheltered in emergency
shelters (46% or 63 people) or
transitional housing (36% or 50
people). The remaining 18% (24 people) were in unsheltered locations.
Homeless veterans comprised
about 9% (113 people) of the overall sheltered homeless
population and 11% (24 people) of the overall unsheltered population.
137 Veterans experiencing
homelessness
8% From 2016 to 2017
On A Single Night in January 2017
There were 137 homeless veterans in Mecklenburg County. Homeless
veterans accounted for nearly 12% of all homeless adults.
12% (17 people) of veterans are chronically homeless.
12% Of all adults experiencing
homelessness were
veterans
18%
36%
46%
Unsheltered
Transitional
Housing
Emergency &
Seasonal
Homeless Veterans by Shelter Type
2017
N=137

52 | Veteran Households
Race of Homeless Veterans, 2017
Approximately 70% (96 people) of
homeless veterans were Black, 24%
(33 people) were White, 6% (8 people) were American Indian
49% (47 people) of Black homeless veterans were in emergency and
seasonal shelter compared to 38.5% (37 people) in transitional housing.
42% (14 people) of White homeless veterans were in emergency and seasonal shelters. A slightly lower
proportion 27% (or 9 people) were in transitional housing.
30% (10 out of 33) of White homeless veterans were counted in unsheltered
locations, while 12.5% (12 out of the 96) of Black veterans were counted in
unsheltered locations and 25% (2 out of the 8) of American Indian veterans were counted in unsheltered locations
2% (3 people) of the homeless veterans identified as Hispanic/Latino.
6%
24%
70%
American Indian
White
Black
Homeless Veterans by Race
2017
N=137
2%
98%
Hispanic/Latino
Non-Hispanic/Latino
Number of Homeless Veterans by Ethnicity
2017
N=137

Veteran Households | 53
Household Type of Homeless
Veterans, 2017
4% (6 people) were in veteran households with adults and children
and 96% (131 people) of homeless veterans were in veteran households with adults only.
37.4% (49 people) of homeless veterans in veteran households with adults only were in transitional
housing. The remaining 44.3% (58 people) were in emergency and
seasonal shelter and 18.3% (24 people) were unsheltered.
Gender of Homeless Veterans, 2017
87% (119 people) of homeless
veterans were males and 13% (18 people) were females.
80% of homeless male veterans (95
people) and 100% of homeless female veterans (18 people) were sheltered.
13%
87%
Female
Male
Homeless Veterans by Gender
2017
N=137
96%
4%
Adults Only
Adults and Children
Homeless Veterans by Household
Type
2017
N=137
54 | Veteran Households
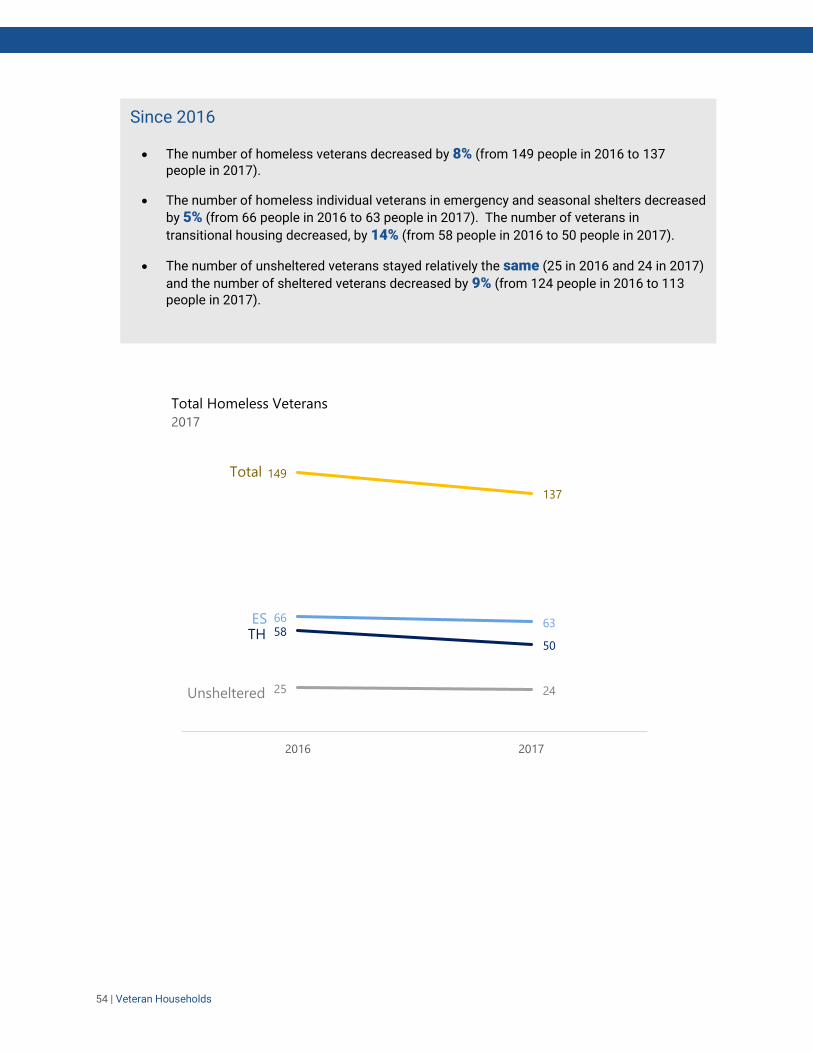
Since 2016
The number of homeless veterans decreased by 8% (from 149 people in 2016 to 137 people in 2017).
The number of homeless individual veterans in emergency and seasonal shelters decreased
by 5% (from 66 people in 2016 to 63 people in 2017). The number of veterans in
transitional housing decreased, by 14% (from 58 people in 2016 to 50 people in 2017).
The number of unsheltered veterans stayed relatively the same (25 in 2016 and 24 in 2017)
and the number of sheltered veterans decreased by 9% (from 124 people in 2016 to 113 people in 2017).
66 6358
50
25 24
149
137
2016 2017
Total Homeless Veterans
2017
Total
ESTH
Unsheltered

Additional Unsheltered Survey Questions | 55
Additional Unsheltered
Survey Questions
In 2016 and 2017, the PIT Count Steering Committee added additional questions to the
unsheltered count survey in order to better understand additional characteristics of this
population. These are not questions required by HUD.
Because answering these survey questions was not required, response rates may vary for each
question depending on whether the person chose to answer the question.
DESCRIPTION
A person sleeping in a place unfit for human
habitation
56 | Additional Unsheltered Survey Questions
0.5%
0.5%
14.4%
84.7%
Transgender
Do not identify
Female
Male
Gender of of Unsheltered Persons
2017
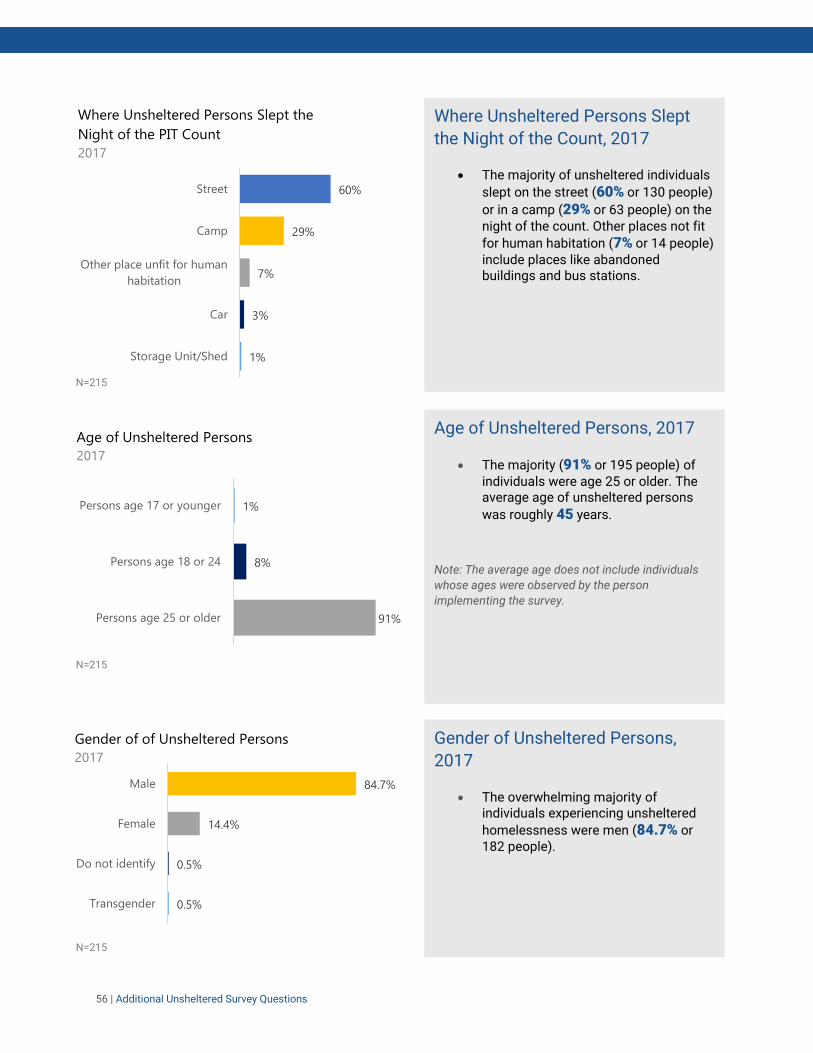
Gender of Unsheltered Persons,
2017
The overwhelming majority of individuals experiencing unsheltered
homelessness were men (84.7% or 182 people).
1%
8%
91%
Persons age 17 or younger
Persons age 18 or 24
Persons age 25 or older
Age of Unsheltered Persons
2017
Age of Unsheltered Persons, 2017
The majority (91% or 195 people) of individuals were age 25 or older. The average age of unsheltered persons
was roughly 45 years.
Note: The average age does not include individuals
whose ages were observed by the person
implementing the survey.
1%
3%
7%
29%
60%
Storage Unit/Shed
Car
Other place unfit for human
habitation
Camp
Street
Where Unsheltered Persons Slept the
Night of the PIT Count
2017
Where Unsheltered Persons Slept
the Night of the Count, 2017
The majority of unsheltered individuals
slept on the street (60% or 130 people)
or in a camp (29% or 63 people) on the night of the count. Other places not fit
for human habitation (7% or 14 people) include places like abandoned buildings and bus stations.
N=215
N=215
N=215

Additional Unsheltered Survey Questions | 57
89%
11%
No
Yes
Veteran Status of Unsheltered Persons
2017
Veteran Status of Unsheltered
Persons, 2017
11% (or 24 people) of the unsheltered individuals were veterans.
0.5%
4%
61%
34%
Asian
American Indian
Black
White
Race of Unsheltered Persons
2017Race of Unsheltered Persons, 2017
Race of unsheltered individuals differed from the larger homeless population. Unsheltered individuals
were 34% (or 74 people) White and
61% (or 132 people) Black compared
18% (or 272 people) White and 79% (1,170 people) Black in the larger homeless population.
4%
96%
Hispanic/Latino
Non-Hispanic/Latino
Ethnicity of Unsheltered Persons
2017
Ethnicity of Unsheltered Persons,
2017
The ethnicity of unsheltered individuals is the same as the larger homeless population. Unsheltered individuals
were 4% (9 people) Hispanic/Latino.
N=215
N=215
N=215

58 | Additional Unsheltered Survey Questions
30%
70%
Do not have source of
income
Have a source of income
Income of Unsheltered Persons
2017
N=185
1% (1)
2% (2)
2% (3)
3% (4)
13% (17)
24% (31)
55% (72)
Sex work
Family/friends
Donating plasma
Other
Panhandling
Disability income
Employment
Source of Income of Unsheltered Persons
2017
N=130
Income of Unsheltered Persons,
2017
The majority (70% or 130 people) of individuals have a source of income.
Source of Income of Unsheltered Persons, 2017
The majority of individuals received income from employment (55% or 72 people) or disability
income (24% or 31 people).

Additional Unsheltered Survey Questions | 59
68% 32%
Chronic Homelessness Status of
Unsheltered Persons
2017
Non-chronic Chronic
Chronic Homelessness Status of
People Experiencing Unsheltered
Homelessness, 2017
68% (146) of those unsheltered were
not chronically homeless and 32% (69) were chronically homeless.
3%
6%
7%
9%
13%
62%
A week or less
7-30 days
7 - 11 months
1 - 3 months
4 -6 months
12+ months
Length of Current Homelessness Episode of Unsheltered Persons
2017
Length of Current Homelessness Episode of Unsheltered Persons, 2017
The overwhelming majority (62% or 101 people) of unsheltered individuals' current episode of homelessness was more than 12 months.
Note: While unsheltered persons’ current length of homelessness may be for more than 12 months, they are not
classified as chronically homeless unless they also have a disability.
N=215
N=163
60 | Additional Unsheltered Survey Questions
1%
2%
3%
6%
7%
7%
7%
10%
11%
13%
15%
17%
Shelter does not allow substance use
Hours do not work with job schedule
I do not want to be separated from companion/pet
Lack of privacy / fear of crowds
Too structured/Lack of control
Banned/not eligible
Too many people to feel comfortable
I am afraid my things will be stolen
I do not feel safe
Unclean shelters
Other
Shelter is full
Why Unsheltered Persons were not in a Shelter
2017
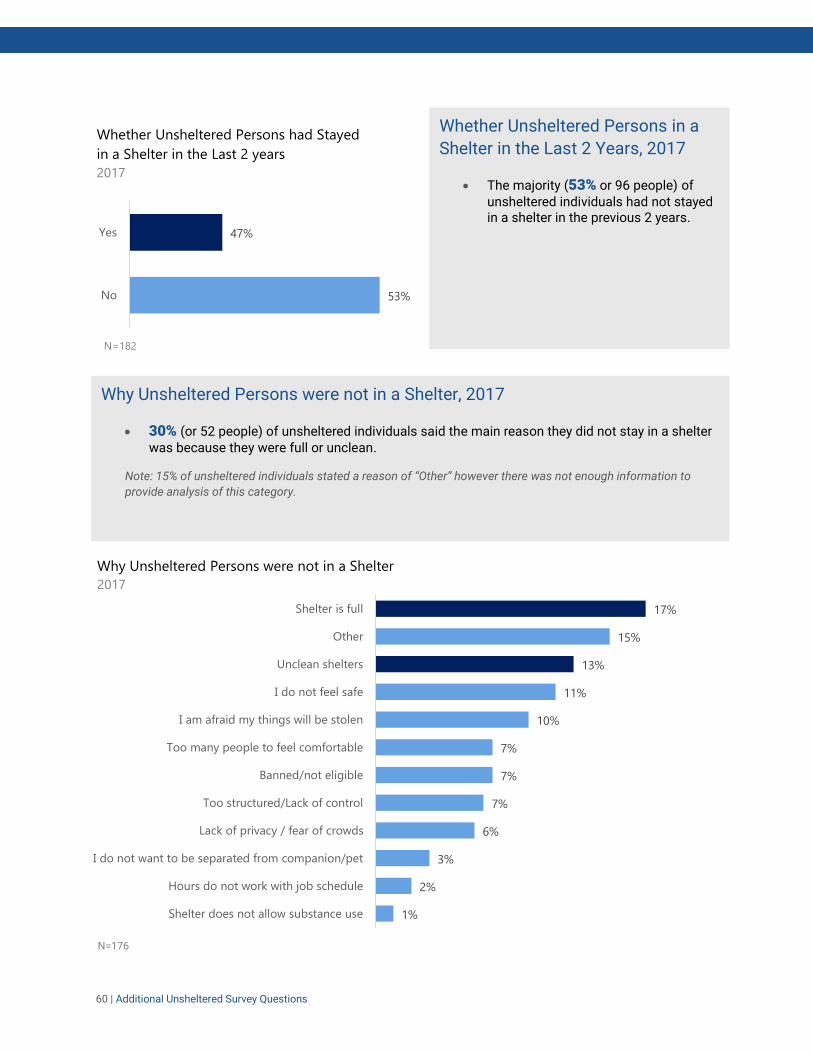
Why Unsheltered Persons were not in a Shelter, 2017
30% (or 52 people) of unsheltered individuals said the main reason they did not stay in a shelter was because they were full or unclean.
Note: 15% of unsheltered individuals stated a reason of “Other” however there was not enough information to
provide analysis of this category.
Whether Unsheltered Persons in a
Shelter in the Last 2 Years, 2017
The majority (53% or 96 people) of unsheltered individuals had not stayed in a shelter in the previous 2 years.
53%
47%
No
Yes
Whether Unsheltered Persons had Stayed
in a Shelter in the Last 2 years
2017
N=182
N=176
Additional Unsheltered Survey Questions | 61
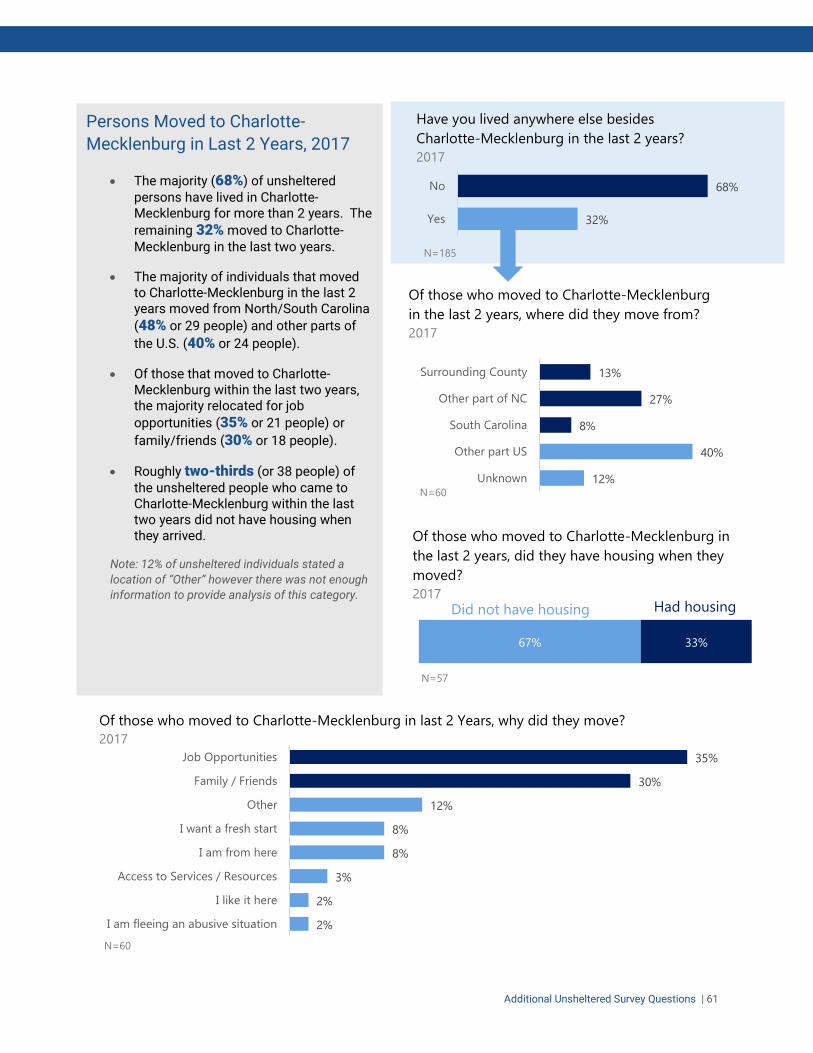
Persons Moved to Charlotte-
Mecklenburg in Last 2 Years, 2017
The majority (68%) of unsheltered persons have lived in Charlotte-Mecklenburg for more than 2 years. The
remaining 32% moved to Charlotte-Mecklenburg in the last two years.
The majority of individuals that moved to Charlotte-Mecklenburg in the last 2 years moved from North/South Carolina
(48% or 29 people) and other parts of
the U.S. (40% or 24 people).
Of those that moved to Charlotte-Mecklenburg within the last two years, the majority relocated for job
opportunities (35% or 21 people) or
family/friends (30% or 18 people).
Roughly two-thirds (or 38 people) of the unsheltered people who came to Charlotte-Mecklenburg within the last two years did not have housing when they arrived.
Note: 12% of unsheltered individuals stated a
location of “Other” however there was not enough
information to provide analysis of this category.
2%
2%
3%
8%
8%
12%
30%
35%
I am fleeing an abusive situation
I like it here
Access to Services / Resources
I am from here
I want a fresh start
Other
Family / Friends
Job Opportunities
Of those who moved to Charlotte-Mecklenburg in last 2 Years, why did they move?
2017
N=60
12%
40%
8%
27%
13%
Other
Other part US
South Carolina
Other part of NC
Surrounding County
Of those who moved to Charlotte-Mecklenburg
in the last 2 years, where did they move from?
2017
N=60
Unknown
32%
68%
Yes
No
Have you lived anywhere else besides
Charlotte-Mecklenburg in the last 2 years?
2017
N=185
67% 33%
Of those who moved to Charlotte-Mecklenburg in
the last 2 years, did they have housing when they
moved?
2017
Did not have housing Had housing
N=57

62 | Appendix
Appendix DATA & METHODOLOGY
Unsheltered PIT Count The unsheltered portion of the PIT Count attempts to estimate the number of
persons living in places unfit for human habitation on the night of Wednesday,
January 25, 2017.
The 2017 PIT Count occurred with the assistance of over 170 volunteers on 24
survey teams. Volunteers went out Thursday morning to ask people where they
had slept the night before to identify people sleeping in places unfit for human
habitation.
Two volunteer training sessions were held to familiarize volunteers with the PIT
Count and survey. Survey locations included uptown streets, homeless camps,
greenways, soup kitchens, libraries, and hospital waiting rooms.
As part of a nationwide effort to establish baseline data for youth, special data
collection strategies were employed to address the unique data collection needs
of unsheltered homeless youth. Strategies included targeting known locations
for unsheltered youth, utilizing youth-specific providers and including screening
questions that differentiate between youth who are homeless under non-HUD
definitions and those homeless under the HUD definition.
Data collection For the unsheltered data collection in 2017, volunteers collected data on a
printed form. Volunteers were divided into teams that were headed by a captain.
Each team was assigned to a specific geographic area within Mecklenburg
County and received a map to ensure maximum coverage of the geographic
area. Street outreach staff from Urban Ministry Center with assistance from the
Charlotte-Mecklenburg Police Department coordinated the unsheltered count
and provided information of where camps are located throughout the county so
that teams could target those areas.
Recognizing that verifying chronic homeless status requires multiple responses
to survey questions, volunteers had access to a hotline during the count in order
to verify chronic homelessness status of unsheltered persons in the Homeless
Management Information System (HMIS). The unsheltered persons being
interviewed provided consent before HMIS records were checked. If a person
was homeless but unwilling to answer all the questions for the PIT Count,
volunteers were allowed to answer the following items through observation: age,
gender, race, and ethnicity.
Once collected, the data were entered into an Excel spreadsheet by a staff
person. These data were cross-referenced with HMIS data to improve accuracy
and prevent duplicate entries for the sheltered and unsheltered count. Final data
sets were reviewed by a data quality review committee comprised of local
agency volunteers.
UNSHELTERED
COUNT
Estimates the number of
unsheltered persons living in
places unfit for human
habitation on
January 25, 2017
LOCATIONS
Uptown streets, homeless
camps, greenways, soup
kitchens, the library, and
hospital waiting rooms
WEATHER
Low 57°, High 66° Light rain and overcast
The weather was warmer than
last year’s PIT Count when there
was a low of 32°
24
teams
170+
volunteers

Appendix | 63
Weather
The 2017 PIT Count occurred on a night that was warmer than normal, which may have resulted in a higher
number of people sleeping in unsheltered locations. 1F2
Overnight Low 2014 2015 2016 2017
10° 27° 32° 57°
Sheltered PIT Count The sheltered count provides census data on all households with adults and
children, households with adults only, and child only households sleeping in “a
supervised publicly or privately operated shelter designated to provide
temporary living arrangements (including congregate shelters, transitional
housing, and hotels and motels paid for by charitable organizations or by
federal, state, or local government programs for low-income individuals) on
the night designated for the count.” 2F3
The sheltered count excludes persons who are precariously housed, such as
staying with family or friends, living in a motel or hotel paid for without a
voucher, living in permanent housing units, receiving temporary assistance
while living in conventional housing, or staying at a hospital, residential
treatment facility, foster care, or detention facility.
Data collection
For the sheltered count data in 2017, all agencies in the Charlotte-
Mecklenburg Continuum of Care (CoC) were required to submit their census
data for the PIT Count.
The Charlotte-Mecklenburg HMIS database was used to compile the sheltered count data for CoC agencies
that use HMIS. Reports pulled from HMIS were checked for data quality issues and to verify that data were
accurate. For CoC agencies that do not use HMIS and domestic violence agencies, forms were provided for
data entry. Once the forms were collected, the data in the forms were reviewed for completeness and
accuracy before being entered into HMIS as project entries. In total, 14 agencies, representing 21 projects,
participated in the sheltered count.
HIC The housing inventory count provides a one-night snapshot of the capacity to
house people experiencing or formerly experiencing homelessness. The HIC
includes the number of beds designated for people experiencing
homelessness (emergency and seasonal shelter and transitional housing)
and formerly experiencing homelessness (rapid re-housing, permanent
supportive housing, and other permanent housing).
Data collection
All agencies in the Charlotte-Mecklenburg Continuum of Care (CoC) were
required to participate in the HIC. The Charlotte-Mecklenburg HMIS Database
was used to compile the data for CoC agencies that use HMIS. Data were
checked by CoC staff and reviewed by the PIT Count Steering Committee. 23
agencies and 57 projects are represented in the HIC. The number of agencies
and programs included in the HIC is larger than the number included in the PIT
Count because the PIT does not include permanent housing, while the HIC
does.
2 Source: https://www.timeanddate.com/weather/usa/charlotte/historic?month=1&year=2017
3 https://www.hudexchange.info/resources/documents/Notice-CPD-16-060-2017-HIC-PIT-Data-Collection-Notice.pdf
SHELTERED
COUNT
A census of households
sleeping in a shelter
designated to provide
temporary living
arrangements on
January 25, 2017
HIC
A snapshot of the number
of beds dedicated to
serving people experiencing
or formerly experiencing
homelessness on
January 25, 2017
21 projects
14 agencies
SOURCE HMIS Data
57 projects
23 agencies

64 | Appendix
Changes in data and methodology in 2017 Data requirements and definitions are established by HUD and have changed from year to year as the HUD
PIT Count data collection requirements have expanded, and as the Charlotte-Mecklenburg community makes
enhancements to the data collection methodology. See Table 1 for a summary of changes made to the PIT
Count data and methodology from 2009 to 2016. The following changes to data collection occurred in 2017:
Chronically homeless: Chronic homelessness is now reported by household type. For households with multiple individuals, all members of the household should be counted as chronically homeless. 3F
Gender: The response categories for gender expanded to include “Don’t identify as male, female, or transgender.”
Methodology
Additional survey questions added: Based on community feedback, the PIT Count Steering Committee decided to collect additional information on people experiencing unsheltered homelessness, specifically related to: source of income and whether the person or household had ever stayed in a shelter in Mecklenburg County in the past 2 years.
Adjustments to historical data: Historical PIT Count sheltered data and HIC data from 2010 to 2016 were adjusted to use consistent project type classifications. Since 2010, HUD has provided additional guidance on how to define project types and what project types should be included or excluded from the PIT and HIC. The result is that project types were historically included in the PIT and HIC that would not be included under HUD’s current guidelines. The adjusted data uses consistent project type classifications, allowing for more accurate analysis of historical trends. The adjusted PIT data from 2010 to 2015 are available by shelter type but are not available by household type. Data at the household type level are only available for 2016 and 2017. While this limits the ability to look further back historically, it allows for more accurate trend data from 2016 to 2017 and creates the foundation for more accurate historical data moving forward. The result of the adjustments is that the overall homeless count decreased for each year, as did the inventory. Over time, the trend is still a decrease in the number of people experiencing homelessness, however the decrease is at a slower rate compared to the unadjusted numbers. See the Appendix for more details on the differences between the original and adjusted numbers.
Data verification: Both sheltered and unsheltered count data were cross-referenced with the chronic and veteran homelessness registries to verify status for each.
Planning: The planning process for the PIT Count was informed by a feedback session held in 2016. Infrastructure for the PIT Count was also established that included a steering committee and five working groups: sheltered count, unsheltered count, data/HMIS, communication, and volunteer recruitment and training.
Agencies that participated in the 2017 PIT and HIC
1. ABCCM (HIC only) 2. Another Choice for Black Children (HIC
only) 3. Carlolinas CARE Partnership (HIC only) 4. Charlotte Family Housing 5. Community Link (HIC only) 6. Community Support Services (HIC only) 7. Family Endeavors (HIC only) 8. Family Forum, Inc. 9. Florence Crittendon 10. Friendship Missionary Community
Development Corporation 11. HomeCare of the Carolinas
12. Hope Haven (HIC only) 13. Hope House Foundation 14. Men's Shelter of Charlotte 15. Safe Alliance 16. Salvation Army Center of Hope 17. Samaritan's House of Charlotte 18. Sunshine Village 19. Supportive Housing Communities (HIC only) 20. The Relatives 21. Urban Ministry Center 22. Veterans Administration (HIC only) 23. YWCA of the Central Carolinas
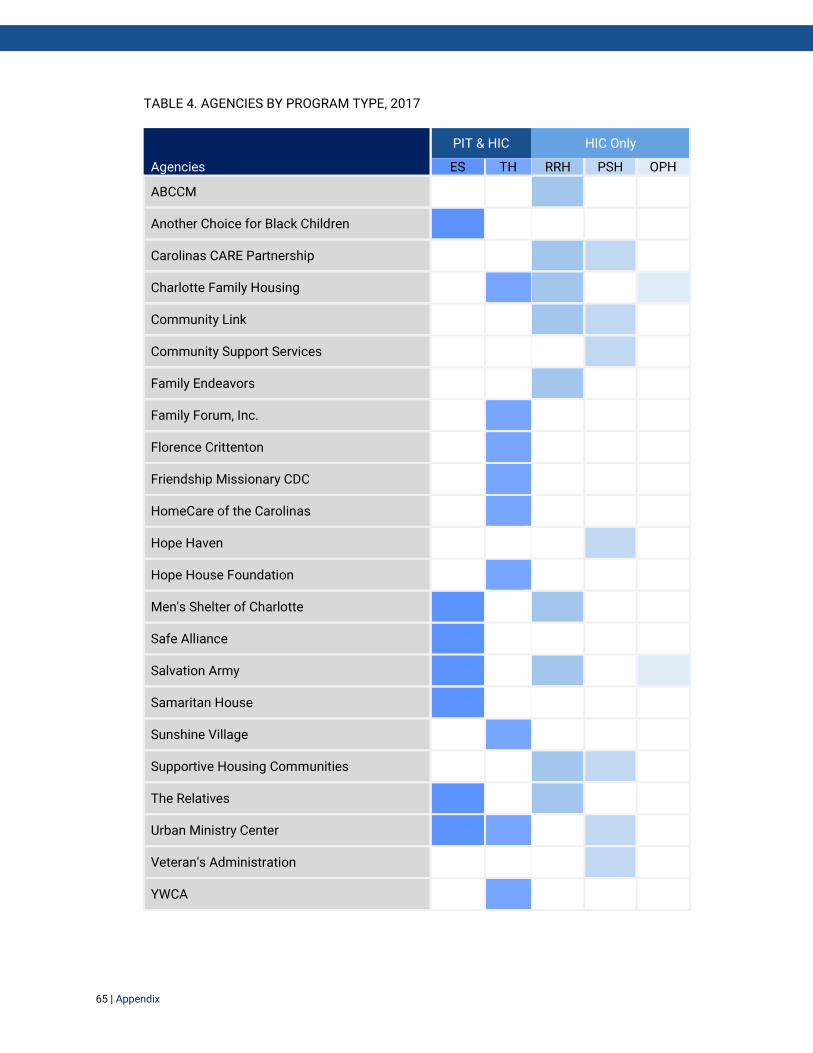
65 | Appendix
TABLE 4. AGENCIES BY PROGRAM TYPE, 2017
Agencies
PIT & HIC HIC Only
ES TH RRH PSH OPH
ABCCM
Another Choice for Black Children
Carolinas CARE Partnership
Charlotte Family Housing 1
Community Link
Community Support Services
Family Endeavors
Family Forum, Inc.
Florence Crittenton
Friendship Missionary CDC
HomeCare of the Carolinas
Hope Haven
Hope House Foundation
Men's Shelter of Charlotte
Safe Alliance
Salvation Army 1
Samaritan House
Sunshine Village
Supportive Housing Communities
The Relatives
Urban Ministry Center
Veteran's Administration
YWCA

66 | Appendix
Changes in data and methodology 2009 - 2016
2009-2013
Prior to 2014, the unsheltered count used estimates of homeless persons living in places unfit for human
habitation that were provided by the Charlotte-Mecklenburg Police Department. This approach was used
because police officers are often very familiar with the locations of homeless people within their service areas.
The North Tryon, Central, and Metro service areas were excluded from the unsheltered count since the persons
identified in those areas were often simultaneously being served in shelters. In addition, outreach volunteers
interviewed people experiencing homelessness in uptown Charlotte and at a local soup kitchen the following
day to collect demographic data.
2014-2016
Beginning in 2014, the unsheltered methodology was expanded to include a larger outreach effort by service
providers and volunteers. Prior to the Count, there was outreach to community members in an effort to gather
information on the locations where they believed there might be homeless persons. Police officers also
provided information for each of their districts on where homeless people might reside. Teams of volunteers
were organized to cover each police district and went out the day of the PIT Count to identify (and count)
people experiencing homelessness at services centers, soup kitchens, and places unfit for human habitation.
In an effort to improve the count of unaccompanied youth, in 2015 the PIT Count Planning Committee
coordinated with The Relatives’ On Ramp Center and Time Out Youth to have events on the date of the PIT
Count in an effort to attract unaccompanied youth that may not have been found through traditional outreach
efforts. For the first time, two volunteer training sessions were held to better equip volunteers in administering
the PIT Count and to gain comfort with approaching people and asking sensitive questions.
Unique to the 2015 count was that it coincided with a Chronically Homeless Registry (the Registry) effort by
Housing First Charlotte-Mecklenburg. Housing First Charlotte-Mecklenburg is a collaborative initiative to end
chronic homelessness. Whereas the annual PIT Count identifies people experiencing homelessness on one
night, the Registry sought to connect with chronically homeless individuals over the course of three days and
administer the Vulnerability Index and Service Prioritization Decision Assistance Tool (VI-SPDAT). It is
important to note that the number of people counted as chronically homeless through the PIT Count differed
from the number of chronically homeless people identified in the Registry. This is because the PIT Count is a
snapshot of those experiencing homelessness on a given night, whereas the Registry was developed over
three days and continues to add individuals as they are identified as chronically homeless. The PIT Count is
used to help identify trends and is a static number each year, whereas the Registry will grow and change as
more chronically homeless people are identified and housed over the course of the year.
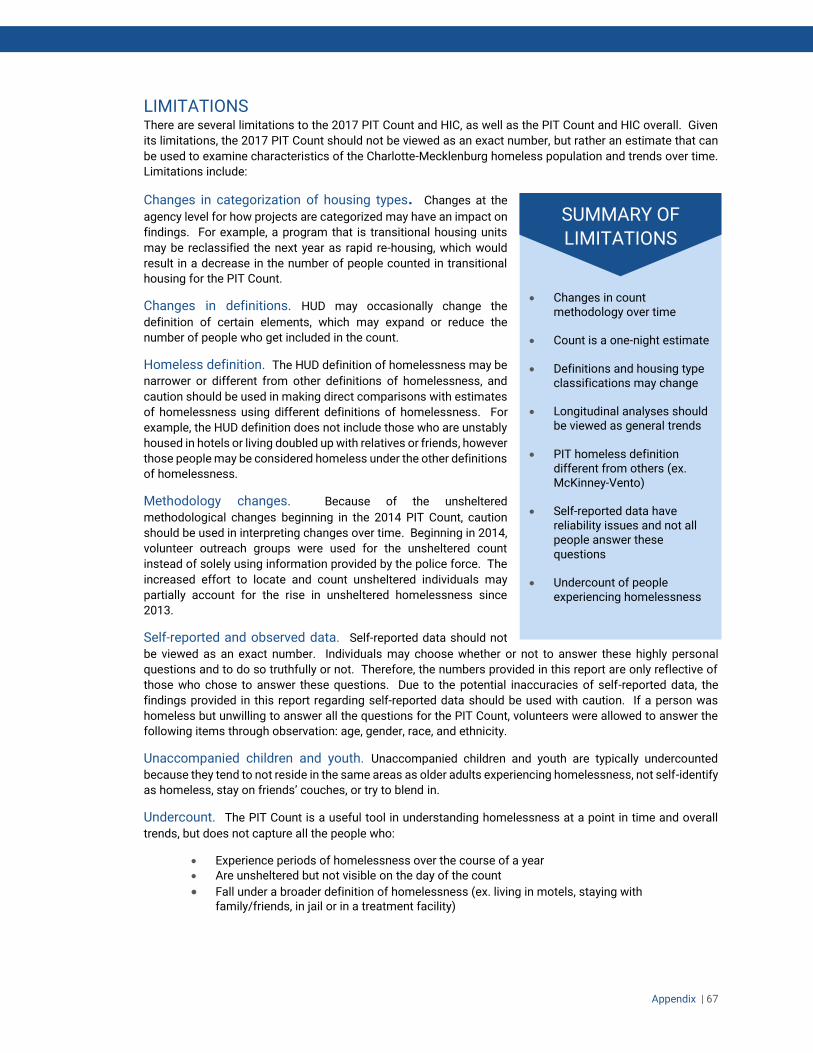
Appendix | 67
LIMITATIONS There are several limitations to the 2017 PIT Count and HIC, as well as the PIT Count and HIC overall. Given
its limitations, the 2017 PIT Count should not be viewed as an exact number, but rather an estimate that can
be used to examine characteristics of the Charlotte-Mecklenburg homeless population and trends over time.
Limitations include:
Changes in categorization of housing types. Changes at the
agency level for how projects are categorized may have an impact on
findings. For example, a program that is transitional housing units
may be reclassified the next year as rapid re-housing, which would
result in a decrease in the number of people counted in transitional
housing for the PIT Count.
Changes in definitions. HUD may occasionally change the
definition of certain elements, which may expand or reduce the
number of people who get included in the count.
Homeless definition. The HUD definition of homelessness may be
narrower or different from other definitions of homelessness, and
caution should be used in making direct comparisons with estimates
of homelessness using different definitions of homelessness. For
example, the HUD definition does not include those who are unstably
housed in hotels or living doubled up with relatives or friends, however
those people may be considered homeless under the other definitions
of homelessness.
Methodology changes. Because of the unsheltered
methodological changes beginning in the 2014 PIT Count, caution
should be used in interpreting changes over time. Beginning in 2014,
volunteer outreach groups were used for the unsheltered count
instead of solely using information provided by the police force. The
increased effort to locate and count unsheltered individuals may
partially account for the rise in unsheltered homelessness since
2013.
Self-reported and observed data. Self-reported data should not
be viewed as an exact number. Individuals may choose whether or not to answer these highly personal
questions and to do so truthfully or not. Therefore, the numbers provided in this report are only reflective of
those who chose to answer these questions. Due to the potential inaccuracies of self-reported data, the
findings provided in this report regarding self-reported data should be used with caution. If a person was
homeless but unwilling to answer all the questions for the PIT Count, volunteers were allowed to answer the
following items through observation: age, gender, race, and ethnicity.
Unaccompanied children and youth. Unaccompanied children and youth are typically undercounted
because they tend to not reside in the same areas as older adults experiencing homelessness, not self-identify
as homeless, stay on friends’ couches, or try to blend in.
Undercount. The PIT Count is a useful tool in understanding homelessness at a point in time and overall
trends, but does not capture all the people who:
Experience periods of homelessness over the course of a year
Are unsheltered but not visible on the day of the count
Fall under a broader definition of homelessness (ex. living in motels, staying with family/friends, in jail or in a treatment facility)
SUMMARY OF
LIMITATIONS
Changes in count methodology over time
Count is a one-night estimate
Definitions and housing type classifications may change
Longitudinal analyses should be viewed as general trends
PIT homeless definition different from others (ex. McKinney-Vento)
Self-reported data have reliability issues and not all people answer these questions
Undercount of people experiencing homelessness

68 | Appendix
ADJUSTMENTS TO THE HISTORICAL PIT COUNT NUMBERS Historical PIT Count sheltered data and HIC data from 2010 to 2016 were adjusted to use consistent project
type classifications. Since 2010, HUD has provided additional guidance on how to define project types and
what project types should be included or excluded from the PIT and HIC. The result is that project types were
historically included in the PIT and HIC that would not be included under HUD’s current guidelines. The
adjusted data uses consistent project type classifications, allowing for more accurate analysis of historical
trends. The adjusted PIT data from 2010 to 2015 are available by shelter type but are not available by
household type. Data at the household type level are only available for 2016 and 2017. While this limits the
ability to look further back historically, it allows for more accurate trend data from 2016 to 2017 and creates
the foundation for more accurate historical data moving forward. The result of the adjustments is that the
overall homeless count decreased for each year, as did the inventory. Over time, the trend is still a decrease
in the number of people experiencing homelessness, however the decrease is at a slower rate compared to
the unadjusted numbers. Table 5 summarizes the differences between the original PIT Count numbers and
the adjusted numbers.
TABLE 5. ORIGINAL AND ADJUSTED PIT COUNT NUMBERS
Year Original Adjusted Difference
2010 2824 1244 -1580
2011 2848 1983 -865
2012 2567 1739 -828
2013 2418 1454 -964
2014 2014 1551 -463
2015 2001 1530 -471
2016 1818 1487 -331
NATIONAL CONTEXT In the last eight years, federal policy governing the national response to homelessness has shifted from a
focus on programs that manage the problem of homelessness to local systems that prevent and end the
problem of homelessness.
Homeless Emergency Assistance and Rapid Transition (HEARTH) Act of 2009
The HEARTH Act reauthorized McKinney-Vento Homeless Assistance Programs that provide funding to states
and local communities to address homelessness. The Act requires local Continuums of Care to incorporate
a number of changes that will impact local service-delivery, including:
System responses instead of program responses to homelessness
As a system, communities that receive federal funding will have to coordinate their response to
homelessness and use system and program level data to inform decision-making.
Measuring outcomes instead of reporting activities Communities that receive federal funding will be expected to show progress on key outcomes
including the reduction in overall homelessness, the reduction of people who return to
homelessness, increased access to housing and services through outreach, and job and income
growth.
Permanent housing instead of shelter
Funding decisions will be weighted toward housing solutions, specifically Permanent Supportive
Housing opportunities for chronically homeless households and rapid re-housing opportunities for
those who are not chronically homeless.

Appendix | 69
Opening Doors: Federal Strategic Plan to End and Prevent Homelessness
In 2010, the United States Interagency Council on Homelessness (USICH) launched the Federal Strategic Plan
to End and Prevent Homelessness “as a roadmap for joint action” by 19 member agencies and state and local
partners. The plan, which was amended in 2015, established the following goals:
Finish the job of ending chronic homelessness in five years. 4F4
Prevent and end homelessness among veterans in five years.
Prevent and end family homelessness in 10 years.
Set a path toward ending all types of homelessness.
The plan also established strategies for meeting its goals, including increased leadership, collaboration, and
civic engagement; increased access to and provision of stable and affordable housing; expanding
opportunities for sustainable employment; improving health by linking health care with homeless assistance
and housing programs; and, transforming homeless service systems into crisis response systems that
prevent homelessness and return people quickly to stable housing.
LOCAL CONTEXT
2016-2017 community initiatives
A Way Home Housing Endowment
In 2013, the City of Charlotte and Foundation For The Carolinas established the A Way Home housing
endowment, which will be fully funded in 2018. This $20 million endowment, funded through public and private
dollars, will be aimed at providing housing and rental assistance for families at-risk of or currently experiencing
homelessness, with veteran households receiving priority. In 2014, a group of local faith leaders raised
operational funds, along with grant dollars from the Foundation For The Carolinas, to begin a pilot program
until the endowment is fully funded.
As of January 2017, four agencies receive funds through the pilot program: Charlotte Family Housing, Crisis
Assistance Ministry, Salvation Army Center of Hope, and Renaissance West Community Initiative. In addition,
Mecklenburg County Community Support Services partnered with A Way Home by providing grants to
Charlotte Family Housing and Salvation Army that cover the cost of supportive services for families receiving
housing subsidies through A Way Home.
Charlotte-Mecklenburg Housing Our Heroes
On Veterans Day 2014, the City of Charlotte, Mecklenburg County and the W.G. (Bill) Hefner VA Medical Center
accepted the Mayors Challenge with a goal of housing 204 Veterans by the end of 2015. As part of this
initiative, best practices adopted in Charlotte-Mecklenburg include:
Creating a by-name registry of homeless veterans in our community
Case management meetings to expedite veteran housing
Accelerating and streamlining existing operational processes
Agency coordination and outreach
Active engagement of landlords
Expediting determination of veteran status
Charlotte-Mecklenburg continues to work with the United States Interagency Council on Homelessness to
meet the federal criteria of ending veteran homelessness.
Housing First Charlotte-Mecklenburg
Housing First Charlotte-Mecklenburg, launched in January 2015, is a collaboration between business, city,
county and non-profit agencies to end chronic homelessness, focusing on the Housing First model.
4 The original goal for ending chronic homelessness was 2016. In February 2015, the USICH extended this goal to 2017.

70 | Appendix
As part of this effort, a by-name registry of the chronically homeless coincided with the PIT Count in January
2015. This registry is used to help target outreach efforts and interventions, as well as prioritize housing
placements to the most vulnerable. Housing First Charlotte-Mecklenburg is also working to expand outreach
efforts, create more permanent supportive housing units, and develop additional leadership and staff support
for the Housing First model.
2016-2017 community strategies
Coordinated Assessment
Coordinated Assessment seeks to better connect households currently experiencing or at risk of experiencing
homelessness with the services that are best able to serve them. The Charlotte-Mecklenburg Continuum of
Care launched Coordinated Assessment in 2014, with funding from Wells Fargo through the United Way of
Central Carolinas and funding from Mecklenburg County Community Support Services for five positions. The
National Alliance to End Homelessness and the North Carolina Coalition to End Homelessness provided
assistance in developing and implementing the new system. Social workers stationed at three sites
administer a standardized assessment that helps identify the services that can best address the housing
needs of households experiencing or at risk of experiencing homelessness within 72 hours (or within 14 days
in the case of families). For people identified as experiencing chronic homelessness, an additional
assessment called the Vulnerability Index - Service Prioritization Decision Assistance Tool (VI-SPDAT) is
administered. In 2016, social workers began administering a VI-SPDAT assessment specific to families that
are literally homeless or at risk of homelessness within 14 days.
Low Barrier Rapid Re-Housing Initiatives
The Charlotte-Mecklenburg community is shifting to fund rapid re-housing initiatives with low barriers to
program entry. These initiatives help households with adults and children successfully exit homelessness
and maintain permanent housing by integrating employment assistance, case management and housing
services. Community Link, Men’s Shelter of Charlotte and the Salvation Army of Greater Charlotte’s Center of
Hope are currently engaged in low-barrier rapid re-housing programs.
Permanent Supportive Housing (PSH)
The community is using a system-wide Housing First model, which creates permanent supportive housing for
a household that is experiencing homelessness and has a condition of disability such as mental illness,
substance abuse, chronic health issues or other conditions that create multiple and serious ongoing barriers
to housing stability. PSH units are provided through community agencies and scattered-site programs located
throughout the community.
Data, Research, and Best Practice Informed Decision-Making
Housing Advisory Board of Charlotte-Mecklenburg’s Research and Evaluation Committee
The Housing Advisory Board of Charlotte-Mecklenburg’s Research and Evaluation committee
coordinates and advocates on issues concerning data collection, research on homelessness and
housing instability, and system level outcomes to measure progress.
Housing Data Consortium
In 2013, the UNC Charlotte Urban Institute received funding from Foundation For The Carolinas
through a Catalyst Grant to create a Homeless and Housing Data Consortium within the Institute for
Social Capital (ISC). ISC houses Homeless Management Information Systems (HMIS) data along
with other key data from agencies that serve people experiencing homelessness or housing
instability.
Research and Evaluation efforts
Both the public and private sectors of Charlotte-Mecklenburg are investing in and working to
strengthen research and evaluation efforts to better understand homelessness and housing
instability.
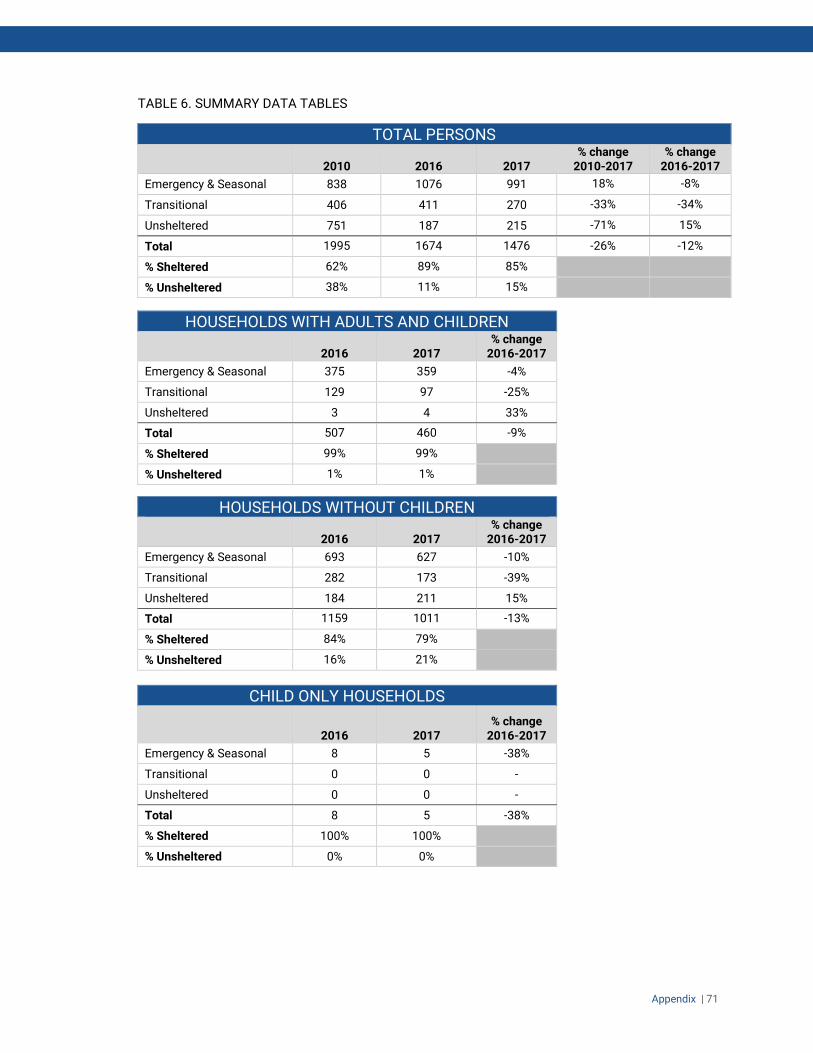
Appendix | 71
TABLE 6. SUMMARY DATA TABLES
TOTAL PERSONS
2010 2016 2017 % change
2010-2017 % change
2016-2017
Emergency & Seasonal 838 1076 991 18% -8%
Transitional 406 411 270 -33% -34%
Unsheltered 751 187 215 -71% 15%
Total 1995 1674 1476 -26% -12%
% Sheltered 62% 89% 85%
% Unsheltered 38% 11% 15%
HOUSEHOLDS WITH ADULTS AND CHILDREN
2016 2017 % change
2016-2017
Emergency & Seasonal 375 359 -4%
Transitional 129 97 -25%
Unsheltered 3 4 33%
Total 507 460 -9%
% Sheltered 99% 99%
% Unsheltered 1% 1%
HOUSEHOLDS WITHOUT CHILDREN
2016 2017 % change
2016-2017
Emergency & Seasonal 693 627 -10%
Transitional 282 173 -39%
Unsheltered 184 211 15%
Total 1159 1011 -13%
% Sheltered 84% 79%
% Unsheltered 16% 21%
CHILD ONLY HOUSEHOLDS
2016 2017 % change
2016-2017
Emergency & Seasonal 8 5 -38%
Transitional 0 0 -
Unsheltered 0 0 -
Total 8 5 -38%
% Sheltered 100% 100%
% Unsheltered 0% 0%

72 | Appendix
UNACCOMPANIED YOUTH
2016 2017 % change
2016-2017
Emergency & Seasonal - 40 -
Transitional - 8 -
Unsheltered - 18 -
Total - 66 -
% Sheltered - 73% -
% Unsheltered - 27% -
PARENTING YOUTH
2016 2017
% change
2016-2017
Emergency & Seasonal - 19 -
Transitional - 5 -
Unsheltered - 0 -
Total - 24 -
% Sheltered - 79% -
% Unsheltered - 21% -
CHRONICALLY HOMELESS
2016 2017 % change
2016-2017
Emergency & Seasonal 110 78 -29%
Transitional
Unsheltered 59 69 17%
Total 169 147 -13%
% Sheltered 65% 53%
% Unsheltered 35% 47%
VETERANS
2016 2017 % change
2016-2017
Emergency & Seasonal 66 63 -5%
Transitional 58 50 -14%
Unsheltered 25 24 -4%
Total 149 137 -8%
% Sheltered 83% 83%
% Unsheltered 17% 17%

Appendix | 73
AGE - 2017
Emergency & Seasonal Transitional Unsheltered Total
Persons age 25 or older 680 189 195 1064
Persons age 18-24 69 14 18 101
Persons age 17 or younger 242 67 2 311
GENDER - 2017
Emergency & Seasonal Transitional Unsheltered Total
Male 535 112 182 829
Female 455 158 31 644
Transgender 1 0 1 2
Did not identify 0 0 1 1
RACE/ETHNICITY – 2017
Emergency & Seasonal Transitional Unsheltered Total
Ethnicity
Hispanic/Non-Latino 39 12 9 60
Non-Hispanic/Latino 952 258 206 1416
Race
White 160 221 74 455
Black or African American 817 38 132 987
American Indian 8 8 8 24
Asian or Pacific Islander 6 3 1 10