charting outcomes in the match - the match, national
TRANSCRIPT
Charting Outcomes in the Match:Senior Students of U.S. MD Medical Schools
Characteristics of U.S. MD Seniors Who Matched to Their Preferred Specialty in the 2020 Main Residency Match
2nd Edition
Prepared by:National Resident Matching Programwww.nrmp.org
July 2020
Questions about the contents of this publication may be directed to National Resident Matching Program, (202) 400-2233 or [email protected].
Questions about the NRMP should be directed to Donna L. Lamb, D.HSc., M.B.A., B.S.N., President and CEO, National Resident Matching Program, (202) 400-2233 or [email protected].
Copyright ©2020 National Resident Matching Program, 2121 K Street, NW, Suite 1000, Washington, DC 20037 USA. All rights reserved. Permission to use, copy and/or distribute any documentation and/or related images from this publication shall be expressly obtained from the
NRMP.
National Resident Matching Program, Charting Outcomes in the Match: Senior Students of U.S. Medical Schools, 2020. National Resident Matching Program, Washington, DC 2020.

2020 Table of Contents
Introduction ..................................................................................................................................................... ii
Tables and Charts for All Specialties
Chart 1. Active Applicants in the 2020 Main Residency Match ............................................................... 2
Table 1. Number of Applicants and Positions in the 2020 Main Residency Match.................................. 3
Chart 2. Ratio of U.S. MD Seniors Ranking Specialty First / Available Positions .................................. 4
Chart 3. Match Rates of U.S. MD Seniors ................................................................................................ 5
Table 2. Summary Statistics on U.S. MD Seniors .................................................................................... 6
Chart 4. Median Number of Contiguous Ranks of U.S. MD Seniors ....................................................... 7
Chart 5. Mean Number of Different Specialties Ranked of U.S. MD Seniors ......................................... 8
Chart 6. USMLE Step 1 Scores of U.S. MD Seniors ................................................................................ 9
Chart 7. USMLE Step 2 CK Scores of U.S. MD Seniors ....................................................................... 10
Chart 8. Mean Number of Research Experiences of U.S. MD Seniors .................................................. 11
Chart 9. Mean Number of Abstracts, Presentations, and Publications of U.S. MD Seniors ................... 12
Chart 10. Mean Number of Work Experiences of U.S. MD Seniors ........................................................ 13
Chart 11. Mean Number of Volunteer Experiences of U.S. MD Seniors ................................................. 14
Chart 12. Percentage of U.S. MD Seniors Who are Members of AOA .................................................... 15
Chart 13. Percentage of U.S. MD Seniors Graduating from One of the 40 Medical Schools
with the Highest NIH Funding .................................................................................................. 16
Chart 14. Percentage of U.S. MD Seniors Who Have a Graduate Degree ............................................... 17
Tables and Charts for Individual Specialties Anesthesiology .......................................................................................................................................... 18 Child Neurology ........................................................................................................................................ 27 Dermatology ............................................................................................................................................. 36 Diagnostic Radiology ............................................................................................................................... 45 Emergency Medicine ................................................................................................................................ 54 Family Medicine ....................................................................................................................................... 63 General Surgery ........................................................................................................................................ 72 Internal Medicine ...................................................................................................................................... 81 Internal Medicine/Pediatrics ..................................................................................................................... 90 Interventional Radiology ........................................................................................................................... 99 Neurological Surgery .............................................................................................................................. 108 Neurology .............................................................................................................................................. 117 Obstetrics and Gynecology ..................................................................................................................... 123 Orthopaedic Surgery ............................................................................................................................... 135 Otolaryngology ....................................................................................................................................... 144 Pathology ................................................................................................................................................ 153 Pediatrics ................................................................................................................................................ 162 Physical Medicine and Rehabilitation .................................................................................................... 171 Plastic Surgery ........................................................................................................................................ 180
Psychiatry ............................................................................................................................................... 189 Radiation Oncology ................................................................................................................................. 198 Vascular Surgery ..................................................................................................................................... 207
iCopyright ©2020 NRMP. Reproduction prohibited without the written permission of the NRMP.
Charting Outcomes in the Match: MD Seniors, 2020
2020 Introduction
iiCopyright ©2020 NRMP. Reproduction prohibited without the written permission of the NRMP.
BackgroundThe first edition of Charting Outcomes in the Match was published in August 2006 to document how applicant qualifications affectsuccess in the Main Residency Match®. The report was published biennially between 2007 and 2011 and was a collaboration of theNational Resident Matching Program® (NRMP®) and the Association of American Medical Colleges® (AAMC®). Match outcome data from the NRMP were combined with applicant characteristics from the AAMC’s Electronic Residency Application Service (ERAS®) and United States Medical Licensing Examination (USMLE®) scores from the AAMC data warehouse. Starting with the 2014 MainResidency Match, the NRMP added a Professional Profile section to its Match registration process to collect the USMLE scores and otherapplicant characteristics, and those have been used to independently produce all subsequent Charting Outcomes in the Match reports.
Prior to 2016, this report examined the Match success of only two applicant groups: senior students from U.S. MD medical schools ("U.S. seniors" or "U.S. MD seniors") and independent applicants. Independent applicants included all applicant types other than U.S. seniors: graduates of U.S. MD medical schools, students/graduates of U.S. DO medical schools, students/graduates of Fifth Pathway programs, students/graduates of Canadian medical schools, and U.S. citizen and non U.S. citizen students/graduates of international medical schools (IMGs). Because independent applicants are a heterogeneous group, a decision was made in 2016 to report data separately for U.S. MD medical school seniors, students/graduates of U.S. DO medical schools, U.S. citizen students/graduates of international medical schools, and non U.S. citizen students/graduates of international medical schools. In 2018, upon requests from U.S. DO medical schools, the Charting Outcomes in the Match report was redesigned to including only senior students of U.S. DO medical schools ("U.S. DO seniors"), eliminating the reporting on U.S. DO graduates because their numbers are so small. The 2020 Charting Outcomes in the Match reports marks the second iteration of publications for U.S. MD Seniors, U.D. DO seniors and U.S. citizen/nonn-U.S. citizen IMGs. This report examines the characteristics of U.S. MD seniors.
DataMatch success, specialty preference, and ranking information were collected through the Main Residency Match. The 40 U.S. medical schools receiving the highest totals of National Institutes of Health (NIH) grants were obtained from the NIH website. Other applicant characteristics, including USMLE Step 1 and Step 2 Clinical Knowledge (CK) scores, academic degrees, publications, Alpha Omega Alpha Honor Medical Society (AOA) membership, and research, and work and volunteer experiences, were self-reported through the Professional Profile section of the NRMP’s Applicant Registration Form for the Match. To complete the form, applicants were asked to answer the questions as they did in their ERAS Common Application Form (CAF). Completion of the form was optional, and applicants who completed the form could consent or decline to participate in NRMP research. Data collection for the self-reported Professional Profile section was granted exemption by the Chesapeake (now Advarra) Institutional Review Board (IRB).
A total of 19,326 U.S. MD seniors submitted certified rank order lists in the 2020 Main Residency Match. After excluding the 7.2 percent of U.S. MD seniors who did not give consent to participate in NRMP research, 17,932 applicants were included in the final dataset. Missing data were found in Step 1 scores (0.9% missing), Step 2 CK scores (1.7%), number of research experiences (10.7%), number of abstracts, presentations, and publications (10.7%), number of work experiences (11.5%), number of volunteer experiences (11.6%), Ph.D. degree (4.8%), other graduate degree (5.4%), and AOA membership (5.9%).
To ensure that USMLE Step scores were not misreported, the NRMP asked medical schools to verify the scores of their U.S. MD seniors. In 2020, 91 percent of the Step 1 scores and Step 2 CK scores used in this report were verified, corrected, or supplied by U.S. medical schools. Because the self-reported scores are highly accurate (the intracorrelation coefficient (ICC) between the self-reported scores and school-verified scores was 0.992 (99% CI [0.992, 0.992]) for Step 1 scores and 0.988 (99% CI [0.988, 0.989]) for Step 2 CK scores), both verified and unverified scores were used to prepare this report.
MethodsSpecialties that offered 50 or more positions in the 2020 Main Residency Match are included in this report. Over the years, specialties have been added to the report, including Otolaryngology and Neurology in 2007, Neurological Surgery in 2009, Child Neurology and Vascular Surgery in 2014, and Interventional Radiology in 2018. Transitional Year programs were excluded beginning with the 2011 report because they are not viewed as a preferred specialty choice.
Charting Outcomes in the Match: U.S. MD Seniors, 2020
iiiCopyright ©2020 NRMP. Reproduction prohibited without the written permission of the NRMP.
Twelve measures are incorporated in this report. Probability analysis using a simple logistic regression model was introduced in 2009 to evaluate the relationship between Match success and contiguous ranks and USMLE Step 1 scores. Probability analyses in this report used data on U.S. MD seniors who participated in the Match in 2018, 2019, and 2020.
It is important to note that for purposes of this report, Match success is defined as a match to the specialty of the applicant’s first-ranked program, or "preferred specialty," because that is assumed to be the specialty of choice. Lack of success includes matching to another specialty as well as failure to match at all. No distinction was made based on whether applicants matched to the first, second, third, or lower choice program.
SummarySome general observations apply to all specialties in this report. U.S. MD seniors who are successful in matching to their preferred specialty are more likely to: Rank more programs within their preferred specialty Have higher USMLE Step 1 and Step 2 scores Be members of Alpha Omega Alpha Honor Medical Society
Although other measures seem to be related to Match success for some specialties, the relationships are not consistent enough to draw broad conclusions across specialties. In addition, the data sources used for Charting Outcomes in the Match do not include other important applicant factors such as course evaluations, reference letters, and the Medical School Performance Evaluation (MSPE).
Despite the fairly strong relationship between USMLE Step scores and Match success, the distributions of scores show that program directors consider other qualifications. A high score is not a guarantee of success, and a low score is not a bar to success. Even in the most competitive specialties a few individuals with high scores are not successful. In the less competitive specialties, U.S. MD seniors with scores slightly above passing usually match to their preferred specialties. The data also are reassuring because they indicate that at least some programs do not employ an arbitrary cutoff or decline to consider applicants with less than excellent test performance.
The data in this report support the following straightforward advice one should give to an applicant: Rank all of the programs you really want, without regard to your estimate of your chances with those programs. Include a mix of both highly competitive and less competitive programs within your preferred specialty. Include all of the programs on your list where the program has expressed an interest in you and where you would accept a position. If you are applying to a competitive specialty and you want to have a residency position in the event you are unsuccessful in
matching to a program in your preferred specialty, also rank your most preferred programs in an alternate specialty. Include all of your qualifications in your application, but know that you do not have to be AOA, have the highest USMLE scores,
have publications, or have participated in research projects to match successfully.
Program directors and applicants will find the tables and charts for the specialty of their particular interest later in this report.
For questions, comments or more information, please contact:
National Resident Matching Program2121 K Street, NW, Suite 1000Washington, DC 20037Tel: (202) 400-2233Email: [email protected]
2020 Introduction (continued)
Charting Outcomes in the Match: U.S. MD Seniors, 2020
Tables and Charts for All Specialties
1Copyright ©2020 NRMP. Reproduction prohibited without the written permission of the NRMP.
Charting Outcomes in the Match: U.S. MD Seniors, 2020
2
Chart1
Active Applicants in the 2020 Main Residency Matchby Applicant Type
5,167
U.S. CitizenStudents/Graduates
of InternationalMedical Schools
573
Graduates of U.S. DOMedical Schools
1,519
Graduates of U.S. MDMedical Schools
6,907
Non-U.S. CitizenStudents/Graduates ofInternational Medical
Schools
6,581
Senior students of U.S.DO Medical Schools
19,326
Senior students of U.S.MD Medical Schools
11
Students/Graduates ofCanadian MedicalSchools and Fifth
Pathway Programs
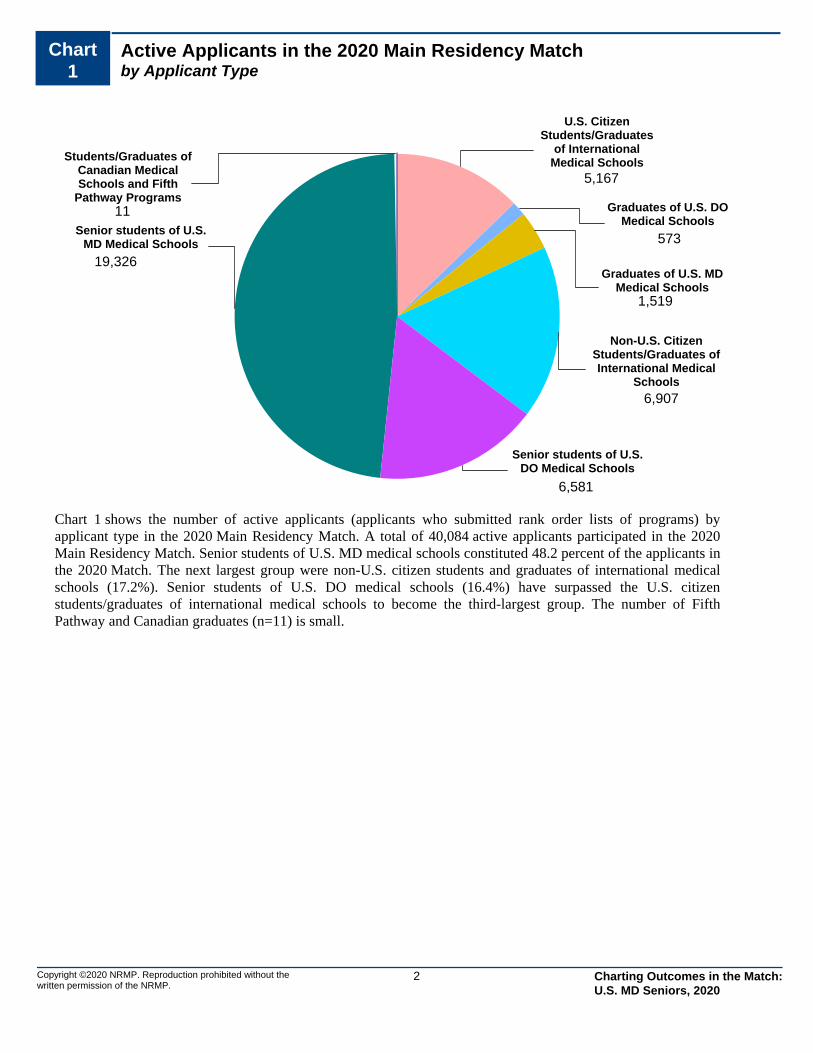
Chart 1 shows the number of active applicants (applicants who submitted rank order lists of programs) by applicant type in the 2020 Main Residency Match. A total of 40,084 active applicants participated in the 2020 Main Residency Match. Senior students of U.S. MD medical schools constituted 48.2 percent of the applicants in the 2020 Match. The next largest group were non-U.S. citizen students and graduates of international medicalschools (17.2%). Senior students of U.S. DO medical schools (16.4%) have surpassed the U.S. citizen students/graduates of international medical schools to become the third-largest group. The number of Fifth Pathway and Canadian graduates (n=11) is small.
Copyright ©2020 NRMP. Reproduction prohibited without the written permission of the NRMP.
Charting Outcomes in the Match: U.S. MD Seniors, 2020
3
Table1
Number of Applicants and Positions in the 2020 Main Residency Matchby Preferred Specialty*
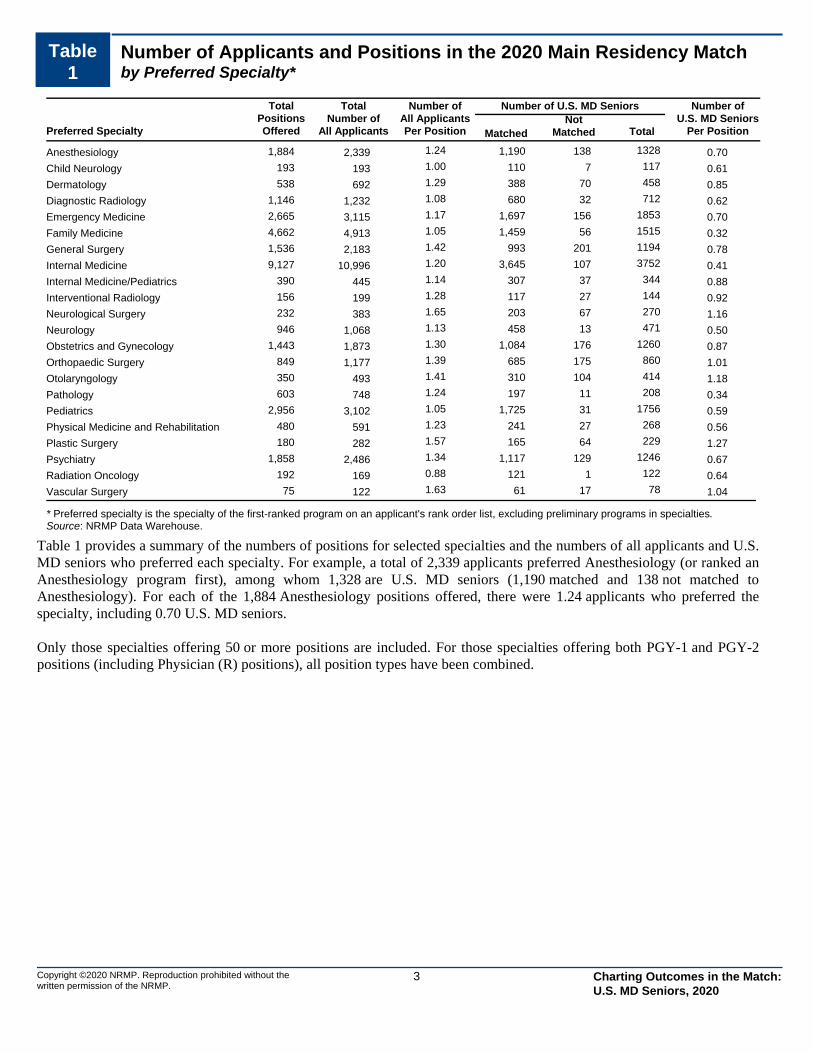
Table 1 provides a summary of the numbers of positions for selected specialties and the numbers of all applicants and U.S. MD seniors who preferred each specialty. For example, a total of 2,339 applicants preferred Anesthesiology (or ranked anAnesthesiology program first), among whom 1,328 are U.S. MD seniors (1,190 matched and 138 not matched to Anesthesiology). For each of the 1,884 Anesthesiology positions offered, there were 1.24 applicants who preferred thespecialty, including 0.70 U.S. MD seniors.
Only those specialties offering 50 or more positions are included. For those specialties offering both PGY-1 and PGY-2positions (including Physician (R) positions), all position types have been combined.
TotalPositionsOfferedPreferred Specialty
TotalNumber of
All Applicants
Number ofAll ApplicantsPer Position Matched
NotMatched
Number of U.S. MD Seniors
Total
Number ofU.S. MD Seniors
Per Position
Anesthesiology 1,884 2,339 1.24 1,190 138 1328 0.70
Child Neurology 193 193 1.00 110 7 117 0.61
Dermatology 538 692 1.29 388 70 458 0.85
Diagnostic Radiology 1,146 1,232 1.08 680 32 712 0.62
Emergency Medicine 2,665 3,115 1.17 1,697 156 1853 0.70
Family Medicine 4,662 4,913 1.05 1,459 56 1515 0.32
General Surgery 1,536 2,183 1.42 993 201 1194 0.78
Internal Medicine 9,127 10,996 1.20 3,645 107 3752 0.41
Internal Medicine/Pediatrics 390 445 1.14 307 37 344 0.88
Interventional Radiology 156 199 1.28 117 27 144 0.92
Neurological Surgery 232 383 1.65 203 67 270 1.16
Neurology 946 1,068 1.13 458 13 471 0.50
Obstetrics and Gynecology 1,443 1,873 1.30 1,084 176 1260 0.87
Orthopaedic Surgery 849 1,177 1.39 685 175 860 1.01
Otolaryngology 350 493 1.41 310 104 414 1.18
Pathology 603 748 1.24 197 11 208 0.34
Pediatrics 2,956 3,102 1.05 1,725 31 1756 0.59
Physical Medicine and Rehabilitation 480 591 1.23 241 27 268 0.56
Plastic Surgery 180 282 1.57 165 64 229 1.27
Psychiatry 1,858 2,486 1.34 1,117 129 1246 0.67
Radiation Oncology 192 169 0.88 121 1 122 0.64
Vascular Surgery 75 122 1.63 61 17 78 1.04
* Preferred specialty is the specialty of the first-ranked program on an applicant's rank order list, excluding preliminary programs in specialties.Source: NRMP Data Warehouse.
Copyright ©2020 NRMP. Reproduction prohibited without the written permission of the NRMP.
Charting Outcomes in the Match: U.S. MD Seniors, 2020

4
Chart2
Ratio of U.S. MD Seniors Ranking Specialty First / Available Positionsby Preferred Specialty
0.0
0.5
1.0
1.5
2.0
2.5
Anesth
esiol
ogy
Child
Neuro
logy
Derm
atolo
gy
Diagno
stic R
adiol
ogy
Emer
genc
y Med
icine
Family
Med
icine
Gener
al Sur
gery
Inte
rnal
Med
icine
Inte
rnal
Med
icine
/Ped
iatric
s
Inte
rven
tiona
l Rad
iolog
y
Neuro
logica
l Sur
gery
Neuro
logy
Obste
trics
and
Gyn
ecolo
gy
Orthop
aedic
Sur
gery
Otolar
yngo
logy
Patho
logy
Pediat
rics
Physic
al M
edici
ne a
nd R
ehab
ilitat
ion
Plastic
Sur
gery
Psych
iatry
Radiat
ion O
ncolo
gy
Vascu
lar S
urge
ry
0.700.61
0.85
0.620.70
0.32
0.78
0.41
0.88 0.92
1.16
0.50
0.871.01
1.18
0.34
0.59 0.56
1.27
0.67 0.64
1.04
0.54
0.39
0.43
0.450.47
0.73
0.64
0.79 0.260.35
0.49
0.630.42
0.37 0.230.90
0.460.67
0.29
0.67
0.24
0.59
All Other Applicants U.S. MD Seniors
Source: NRMP Data Warehouse
Copyright ©2020 NRMP. Reproduction prohibited without the written permission of the NRMP.
Chart 2 shows the ratios of U.S. MD seniors and all applicants who preferred each specialty to available positions in thatspecialty. All specialties except Neurological Surgery, Orthopaedic Surgery, Otolaryngology, Plastic Surgery, and Vascular Surgery had enough positions to accommodate all U.S. MD seniors who preferred that specialty. The ratio was lowest for Family Medicine, Pathology, and Internal Medicine.
Charting Outcomes in the Match: U.S. MD Seniors, 2020
5
Chart3
Match Rates of U.S. MD SeniorsPercent Matched by Preferred Specialty
0
20
40
60
80
100
Anesth
esiol
ogy
Child
Neuro
logy
Derm
atolo
gy
Diagno
stic R
adiol
ogy
Emer
genc
y Med
icine
Family
Med
icine
Gener
al Sur
gery
Inte
rnal
Med
icine
Inte
rnal
Med
icine
/Ped
iatric
s
Inte
rven
tiona
l Rad
iolog
y
Neuro
logica
l Sur
gery
Neuro
logy
Obste
trics
and
Gyn
ecolo
gy
Orthop
aedic
Sur
gery
Otolar
yngo
logy
Patho
logy
Pediat
rics
Physic
al M
edici
ne a
nd R
ehab
ilitat
ion
Plastic
Sur
gery
Psych
iatry
Radiat
ion O
ncolo
gy
Vascu
lar S
urge
ry
89.694.0
84.7
95.591.6
96.3
83.2
97.1
89.2
81.375.2
97.2
86.079.7
74.9
94.798.2
89.9
72.1
89.6
99.2
78.2
Source: NRMP Data Warehouse
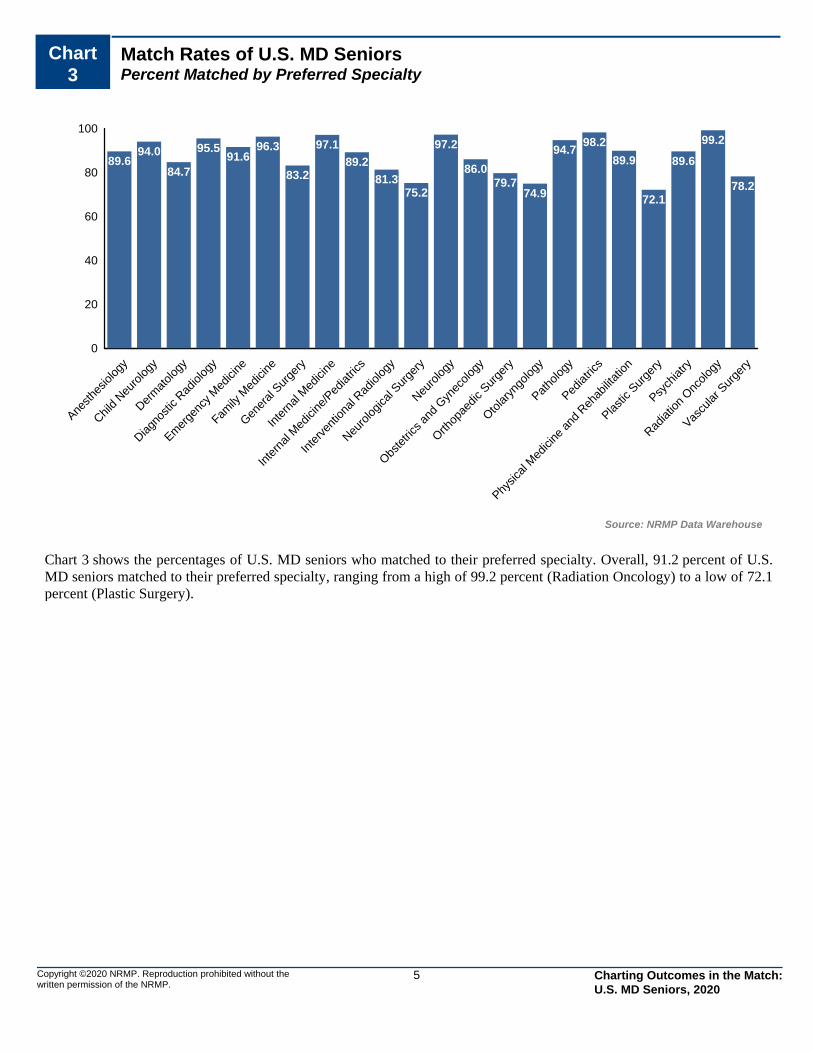
Chart 3 shows the percentages of U.S. MD seniors who matched to their preferred specialty. Overall, 91.2 percent of U.S. MD seniors matched to their preferred specialty, ranging from a high of 99.2 percent (Radiation Oncology) to a low of 72.1 percent (Plastic Surgery).
Copyright ©2020 NRMP. Reproduction prohibited without the written permission of the NRMP.
Charting Outcomes in the Match: U.S. MD Seniors, 2020
6
Table2
Summary Statistics on U.S. MD SeniorsAll Specialties Combined
Measure (n=16,058) (n=1,527)
Matched Not Matched
1. 12.5 5.8Mean number of contiguous ranks
2. 1.2 1.5Mean number of distinct specialties ranked
3. 234 226Mean USMLE Step 1 score
4. 247 238Mean USMLE Step 2 CK score
5. 3.5 3.8Mean number of research experiences
6. 6.9 6.8Mean number of abstracts, presentations, and publications
7. 3.5 3.5Mean number of work experiences
8. 7.9 7.5Mean number of volunteer experiences
9. 16.7 7.8Percentage who are AOA members
10. 31.0 22.2Percentage who graduated from one of the 40 U.S. medical schools with the highest NIH funding
11. 3.7 3.1Percentage who have Ph.D. degree
12. 17.8 22.4Percentage who have another graduate degree
Sources. NRMP Data Warehouse; Top 40 U.S. medical schools with the highest NIH funding in measure 10 is from the NIH website (http://report.nih.gov/award/index.cfm).
Copyright ©2020 NRMP. Reproduction prohibited without the written permission of the NRMP.
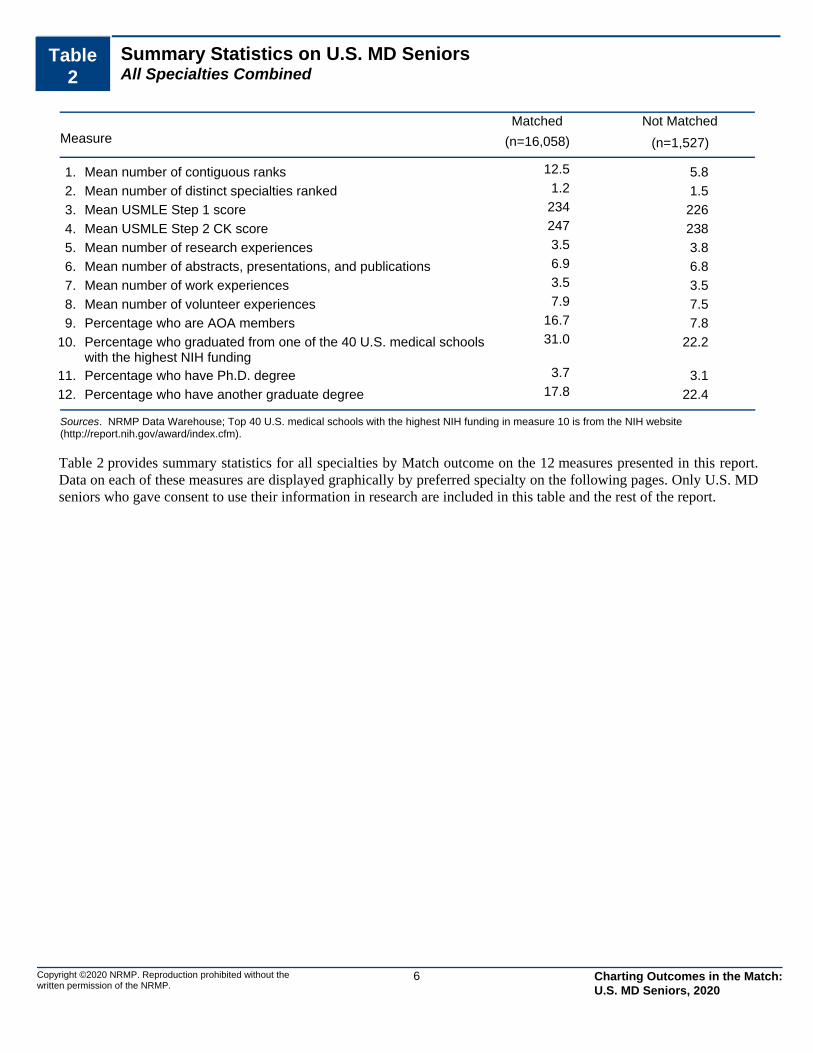
Table 2 provides summary statistics for all specialties by Match outcome on the 12 measures presented in this report.Data on each of these measures are displayed graphically by preferred specialty on the following pages. Only U.S. MDseniors who gave consent to use their information in research are included in this table and the rest of the report.
Charting Outcomes in the Match: U.S. MD Seniors, 2020
7
Chart4
Median Number of Contiguous Ranks of U.S. MD Seniorsby Preferred Specialty and Match Status
0
3
6
9
12
15
18
Anesth
esiol
ogy
Child
Neuro
logy
Derm
atolo
gy
Diagno
stic R
adiol
ogy
Emer
genc
y Med
icine
Family
Med
icine
Gener
al Sur
gery
Inte
rnal
Med
icine
Inte
rnal
Med
icine
/Ped
iatric
s
Inte
rven
tiona
l Rad
iolog
y
Neuro
logica
l Sur
gery
Neuro
logy
Obste
trics
and
Gyn
ecolo
gy
Orthop
aedic
Sur
gery
Otolar
yngo
logy
Patho
logy
Pediat
rics
Physic
al M
edici
ne a
nd R
ehab
ilitat
ion
Plastic
Sur
gery
Psych
iatry
Radiat
ion O
ncolo
gy
Vascu
lar S
urge
ry
15
1110
1413
12
14
12 12
7
16
1312 12
13
11
1314 14
11
14
17
4 4 4 4
6
3
5
21 1
10
56 6 6
4
2
6 65 5
10
Matched Not Matched
Source: NRMP Data Warehouse
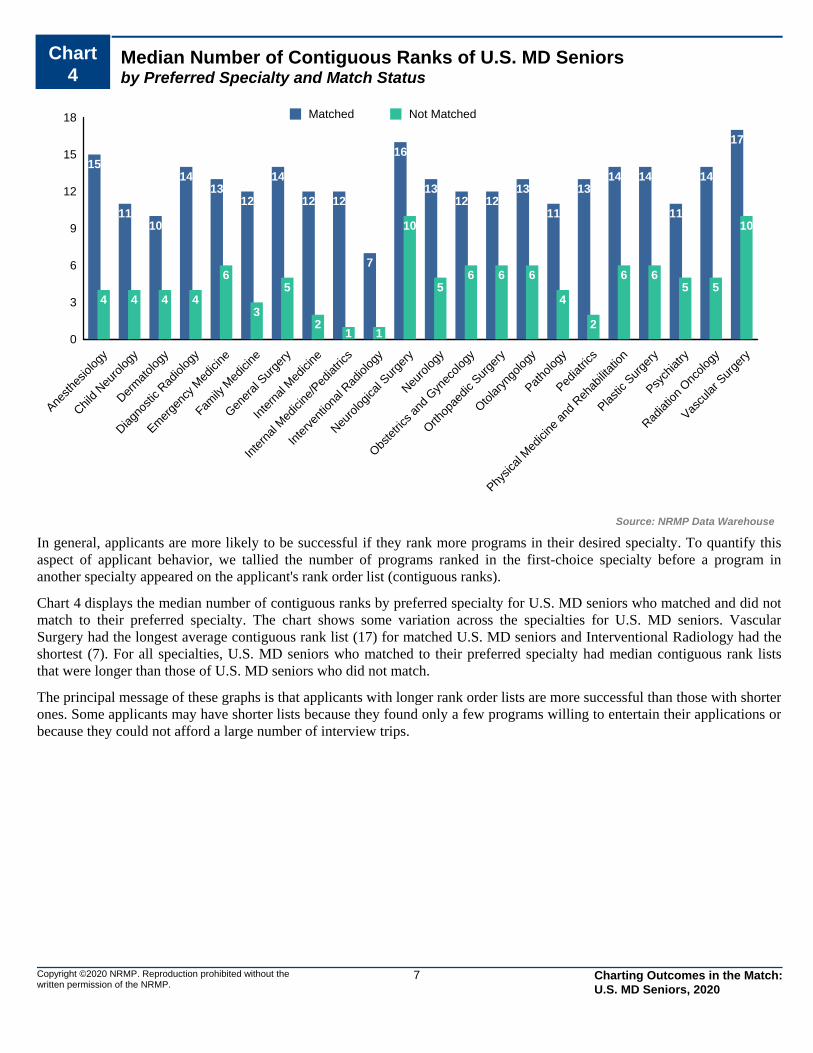
In general, applicants are more likely to be successful if they rank more programs in their desired specialty. To quantify this aspect of applicant behavior, we tallied the number of programs ranked in the first-choice specialty before a program inanother specialty appeared on the applicant's rank order list (contiguous ranks).
Chart 4 displays the median number of contiguous ranks by preferred specialty for U.S. MD seniors who matched and did notmatch to their preferred specialty. The chart shows some variation across the specialties for U.S. MD seniors. VascularSurgery had the longest average contiguous rank list (17) for matched U.S. MD seniors and Interventional Radiology had theshortest (7). For all specialties, U.S. MD seniors who matched to their preferred specialty had median contiguous rank liststhat were longer than those of U.S. MD seniors who did not match.
The principal message of these graphs is that applicants with longer rank order lists are more successful than those with shorterones. Some applicants may have shorter lists because they found only a few programs willing to entertain their applications orbecause they could not afford a large number of interview trips.
Copyright ©2020 NRMP. Reproduction prohibited without the written permission of the NRMP.
Charting Outcomes in the Match: U.S. MD Seniors, 2020
8
Chart5
Mean Number of Different Specialties Ranked by U.S. MD Seniorsby Preferred Specialty and Match Status
0.0
0.5
1.0
1.5
2.0
2.5
3.0
Anesth
esiol
ogy
Child
Neuro
logy
Derm
atolo
gy
Diagno
stic R
adiol
ogy
Emer
genc
y Med
icine
Family
Med
icine
Gener
al Sur
gery
Inte
rnal
Med
icine
Inte
rnal
Med
icine
/Ped
iatric
s
Inte
rven
tiona
l Rad
iolog
y
Neuro
logica
l Sur
gery
Neuro
logy
Obste
trics
and
Gyn
ecolo
gy
Orthop
aedic
Sur
gery
Otolar
yngo
logy
Patho
logy
Pediat
rics
Physic
al M
edici
ne a
nd R
ehab
ilitat
ion
Plastic
Sur
gery
Psych
iatry
Radiat
ion O
ncolo
gy
Vascu
lar S
urge
ry
1.3
1.2
2.2
1.5
1.1
1.1
1.0
1.0
1.3
2.1
1.1
1.1
1.1
1.0 1.
1
1.0
1.0
1.7
1.2
1.1 1.
3 1.4
1.9
1.6
2.4
2.2
1.4
1.3
1.1 1.
3
2.1 2.
3
1.1
1.5
1.3
1.2
1.2
1.1
1.6
2.3
1.4
1.3
3.0
1.7
Matched Not Matched
Source: NRMP Data Warehouse
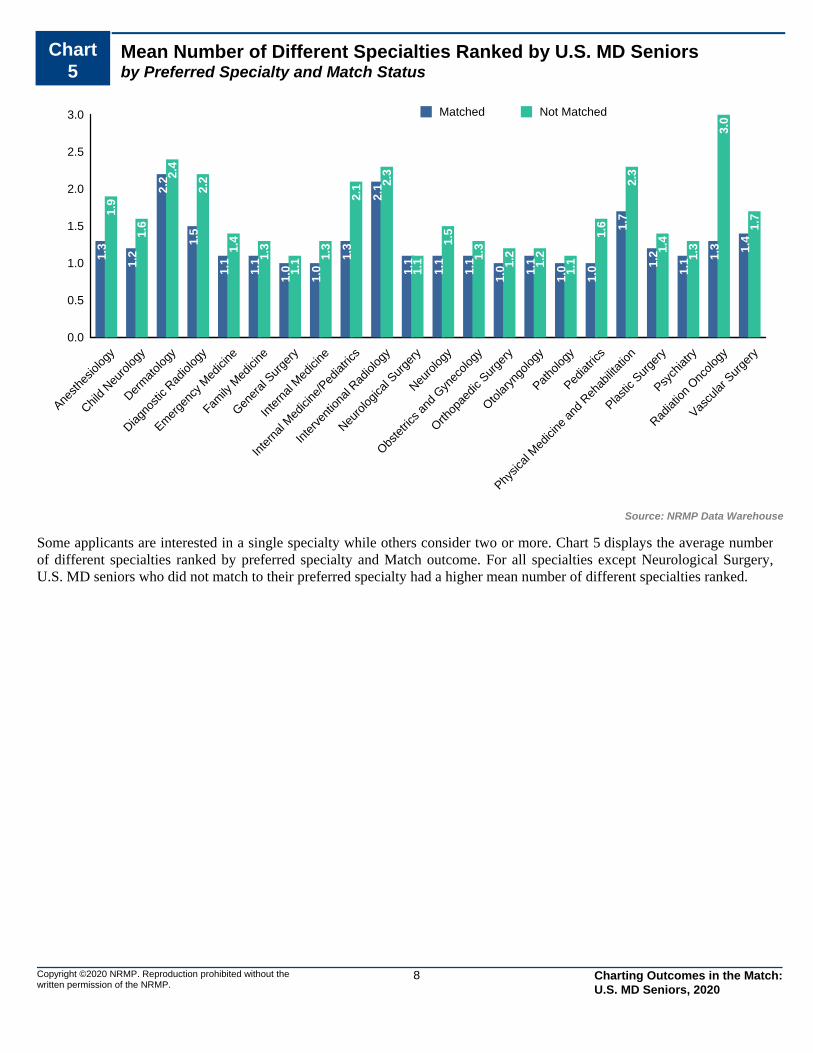
Some applicants are interested in a single specialty while others consider two or more. Chart 5 displays the average numberof different specialties ranked by preferred specialty and Match outcome. For all specialties except Neurological Surgery,U.S. MD seniors who did not match to their preferred specialty had a higher mean number of different specialties ranked.
Copyright ©2020 NRMP. Reproduction prohibited without the written permission of the NRMP.
Charting Outcomes in the Match: U.S. MD Seniors, 2020
9
Chart6
USMLE Step 1 Scores of U.S. MD Seniorsby Preferred Specialty and Match Status
180
190
200
210
220
230
240
250
260
270
Anesth
esiol
ogy
Child
Neuro
logy
Derm
atolo
gy
Diagno
stic R
adiol
ogy
Emer
genc
y Med
icine
Family
Med
icine
Gener
al Sur
gery
Inte
rnal
Med
icine
Inte
rnal
Med
icine
/Ped
iatric
s
Inte
rven
tiona
l Rad
iolog
y
Neuro
logica
l Sur
gery
Neuro
logy
Obste
trics
and
Gyn
ecolo
gy
Orthop
aedic
Sur
gery
Otolar
yngo
logy
Patho
logy
Pediat
rics
Physic
al M
edici
ne a
nd R
ehab
ilitat
ion
Plastic
Sur
gery
Psych
iatry
Radiat
ion O
ncolo
gy
Vascu
lar S
urge
ry
Source: NRMP Data Warehouse
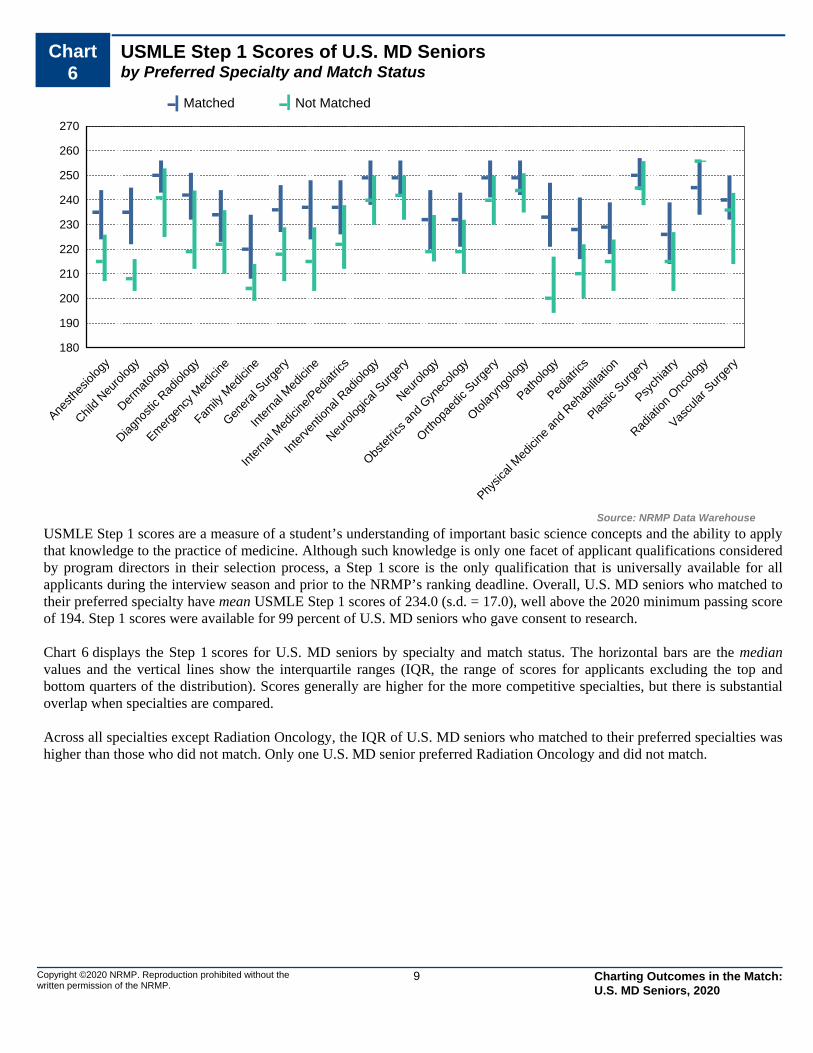
USMLE Step 1 scores are a measure of a student’s understanding of important basic science concepts and the ability to applythat knowledge to the practice of medicine. Although such knowledge is only one facet of applicant qualifications consideredby program directors in their selection process, a Step 1 score is the only qualification that is universally available for allapplicants during the interview season and prior to the NRMP’s ranking deadline. Overall, U.S. MD seniors who matched totheir preferred specialty have mean USMLE Step 1 scores of 234.0 (s.d. = 17.0), well above the 2020 minimum passing score of 194. Step 1 scores were available for 99 percent of U.S. MD seniors who gave consent to research.
Chart 6 displays the Step 1 scores for U.S. MD seniors by specialty and match status. The horizontal bars are the medianvalues and the vertical lines show the interquartile ranges (IQR, the range of scores for applicants excluding the top andbottom quarters of the distribution). Scores generally are higher for the more competitive specialties, but there is substantialoverlap when specialties are compared.
Across all specialties except Radiation Oncology, the IQR of U.S. MD seniors who matched to their preferred specialties was higher than those who did not match. Only one U.S. MD senior preferred Radiation Oncology and did not match.
Copyright ©2020 NRMP. Reproduction prohibited without the written permission of the NRMP.
Matched Not Matched
Charting Outcomes in the Match: U.S. MD Seniors, 2020
10
Chart7
USMLE Step 2 CK Scores of U.S. MD Seniorsby Preferred Specialty and Match Status
180
190
200
210
220
230
240
250
260
270
Anesth
esiol
ogy
Child
Neuro
logy
Derm
atolo
gy
Diagno
stic R
adiol
ogy
Emer
genc
y Med
icine
Family
Med
icine
Gener
al Sur
gery
Inte
rnal
Med
icine
Inte
rnal
Med
icine
/Ped
iatric
s
Inte
rven
tiona
l Rad
iolog
y
Neuro
logica
l Sur
gery
Neuro
logy
Obste
trics
and
Gyn
ecolo
gy
Orthop
aedic
Sur
gery
Otolar
yngo
logy
Patho
logy
Pediat
rics
Physic
al M
edici
ne a
nd R
ehab
ilitat
ion
Plastic
Sur
gery
Psych
iatry
Radiat
ion O
ncolo
gy
Vascu
lar S
urge
ry
Source: NRMP Data Warehouse
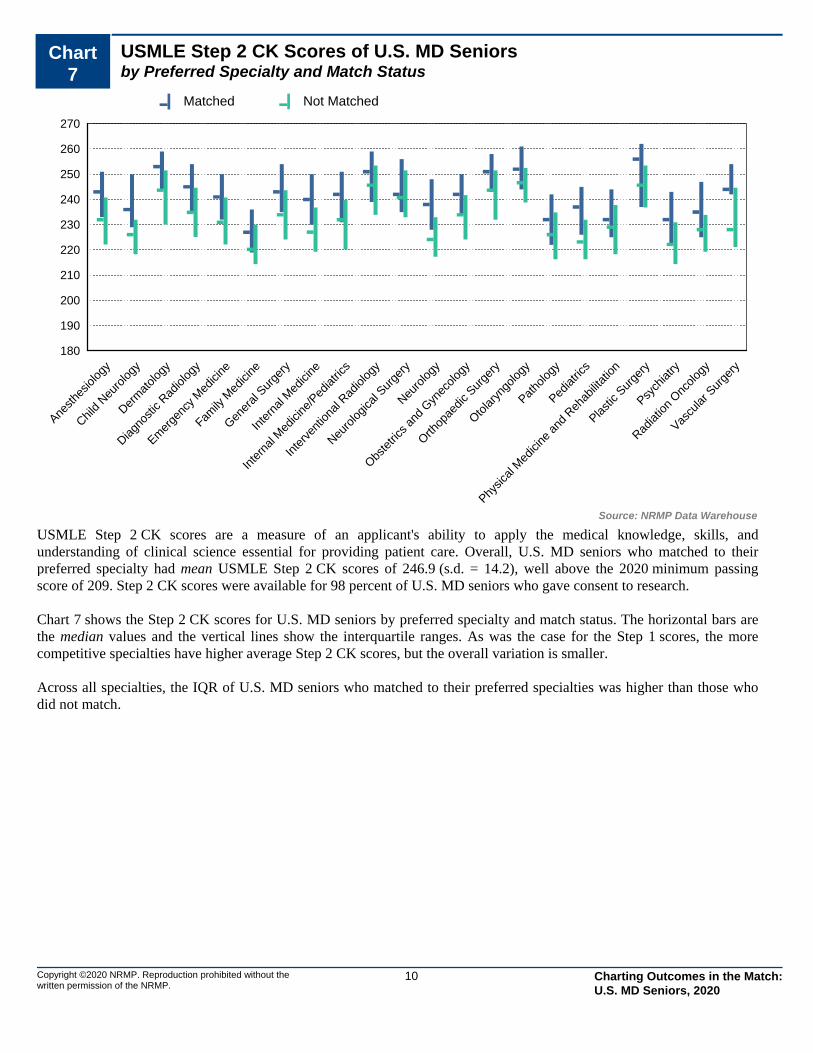
USMLE Step 2 CK scores are a measure of an applicant's ability to apply the medical knowledge, skills, and understanding of clinical science essential for providing patient care. Overall, U.S. MD seniors who matched to their preferred specialty had mean USMLE Step 2 CK scores of 246.9 (s.d. = 14.2), well above the 2020 minimum passing score of 209. Step 2 CK scores were available for 98 percent of U.S. MD seniors who gave consent to research.
Chart 7 shows the Step 2 CK scores for U.S. MD seniors by preferred specialty and match status. The horizontal bars are the median values and the vertical lines show the interquartile ranges. As was the case for the Step 1 scores, the more competitive specialties have higher average Step 2 CK scores, but the overall variation is smaller.
Across all specialties, the IQR of U.S. MD seniors who matched to their preferred specialties was higher than those who did not match.
Copyright ©2020 NRMP. Reproduction prohibited without the written permission of the NRMP.
Matched Not Matched
Charting Outcomes in the Match: U.S. MD Seniors, 2020

11
Chart8
Mean Number of Research Experiences of U.S. MD Seniorsby Preferred Specialty and Match Status
0.0
1.0
2.0
3.0
4.0
5.0
6.0
7.0
Anesth
esiol
ogy
Child
Neuro
logy
Derm
atolo
gy
Diagno
stic R
adiol
ogy
Emer
genc
y Med
icine
Family
Med
icine
Gener
al Sur
gery
Inte
rnal
Med
icine
Inte
rnal
Med
icine
/Ped
iatric
s
Inte
rven
tiona
l Rad
iolog
y
Neuro
logica
l Sur
gery
Neuro
logy
Obste
trics
and
Gyn
ecolo
gy
Orthop
aedic
Sur
gery
Otolar
yngo
logy
Patho
logy
Pediat
rics
Physic
al M
edici
ne a
nd R
ehab
ilitat
ion
Plastic
Sur
gery
Psych
iatry
Radiat
ion O
ncolo
gy
Vascu
lar S
urge
ry
3.2 3.
5
5.8
3.8
2.8
2.2
4.0
3.3
3.1
5.2
6.1
3.6 3.
9
5.4
6.1
3.3
2.9 3.1
5.9
3.1
5.7
4.7
2.8 3.
3
4.9
4.5
2.6
2.1
3.4
3.0
2.5
4.4
5.2
3.6
3.5
5.7
5.5
2.3 2.
6 3.0
5.9
2.9
3.0 3.
4
Matched Not Matched
Source: NRMP Data Warehouse
Applicants were asked to report the number of research experiences entered in their Electronic Residency ApplicationService (ERAS) applications. The experiences are not verified or evaluated and quality may vary greatly. Chart 8 shows theaverage number of research experiences by preferred specialty and Match outcome. U.S. MD seniors averaged 3.6 research experiences, with 85.4 percent reporting this information. For all specialties except Diagnostic Radiology and OrthopaedicSurgery, matched U.S. MD seniors had on average more or equal numbers of research experiences.
Copyright ©2020 NRMP. Reproduction prohibited without the written permission of the NRMP.
Charting Outcomes in the Match: U.S. MD Seniors, 2020
0.0
4.0
8.0
12.0
16.0
20.0
24.0
Anesth
esiol
ogy
Child
Neuro
logy
Derm
atolo
gy
Diagno
stic R
adiol
ogy
Emer
genc
y Med
icine
Family
Med
icine
Gener
al Sur
gery
Inte
rnal
Med
icine
Inte
rnal
Med
icine
/Ped
iatric
s
Inte
rven
tiona
l Rad
iolog
y
Neuro
logica
l Sur
gery
Neuro
logy
Obste
trics
and
Gyn
ecolo
gy
Orthop
aedic
Sur
gery
Otolar
yngo
logy
Patho
logy
Pediat
rics
Physic
al M
edici
ne a
nd R
ehab
ilitat
ion
Plastic
Sur
gery
Psych
iatry
Radiat
ion O
ncolo
gy
Vascu
lar S
urge
ry
5.2
7.0
19.0
6.4
4.3
3.3
7.1
6.2
4.8
10.3
23.4
7.2
6.0
14.3
13.7
7.3
4.9 5.5
19.1
5.6
18.3
10.5
3.7
7.3
10.8
8.6
3.7
2.5
4.8
5.1
3.9
8.0
11.8
7.0
4.2
14.2
9.5
3.7 4.
6 5.5
11.6
4.1
13.0
6.0
Matched Not Matched
Source: NRMP Data Warehouse
12
Chart9
Mean Number of Abstracts, Presentations, and Publications of U.S. MD Seniorsby Preferred Specialty and Match Status
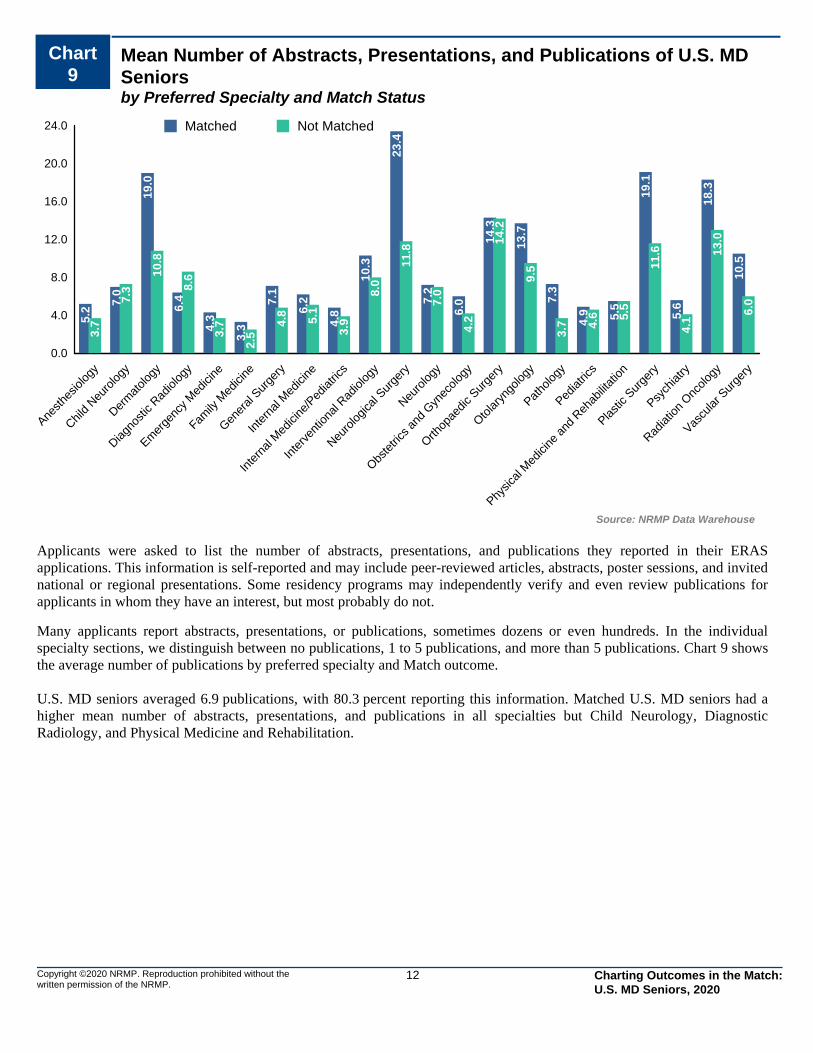
Applicants were asked to list the number of abstracts, presentations, and publications they reported in their ERASapplications. This information is self-reported and may include peer-reviewed articles, abstracts, poster sessions, and invited national or regional presentations. Some residency programs may independently verify and even review publications forapplicants in whom they have an interest, but most probably do not.
Many applicants report abstracts, presentations, or publications, sometimes dozens or even hundreds. In the individual specialty sections, we distinguish between no publications, 1 to 5 publications, and more than 5 publications. Chart 9 showsthe average number of publications by preferred specialty and Match outcome.
U.S. MD seniors averaged 6.9 publications, with 80.3 percent reporting this information. Matched U.S. MD seniors had ahigher mean number of abstracts, presentations, and publications in all specialties but Child Neurology, DiagnosticRadiology, and Physical Medicine and Rehabilitation.
Copyright ©2020 NRMP. Reproduction prohibited without the written permission of the NRMP.
Charting Outcomes in the Match: U.S. MD Seniors, 2020
13
Chart10
Mean Number of Work Experiences of U.S. MD Seniorsby Preferred Specialty and Match Status
0.0
1.0
2.0
3.0
4.0
5.0
Anesth
esiol
ogy
Child
Neuro
logy
Derm
atolo
gy
Diagno
stic R
adiol
ogy
Emer
genc
y Med
icine
Family
Med
icine
Gener
al Sur
gery
Inte
rnal
Med
icine
Inte
rnal
Med
icine
/Ped
iatric
s
Inte
rven
tiona
l Rad
iolog
y
Neuro
logica
l Sur
gery
Neuro
logy
Obste
trics
and
Gyn
ecolo
gy
Orthop
aedic
Sur
gery
Otolar
yngo
logy
Patho
logy
Pediat
rics
Physic
al M
edici
ne a
nd R
ehab
ilitat
ion
Plastic
Sur
gery
Psych
iatry
Radiat
ion O
ncolo
gy
Vascu
lar S
urge
ry
3.3 3.
6 3.7
3.3
3.8
3.5 3.6
3.3
3.8
3.5 3.6
3.1
3.8
3.6
3.5
3.4
3.3 3.
5 3.7
3.6
3.5
3.33.
5
3.5
3.4 3.
6
3.3 3.4 3.
6
2.3
3.5
2.7
4.0
2.7
3.6 3.
8
3.6
3.0
3.0 3.
3
3.7
3.3
3.0 3.
3
Matched Not Matched
Source: NRMP Data Warehouse
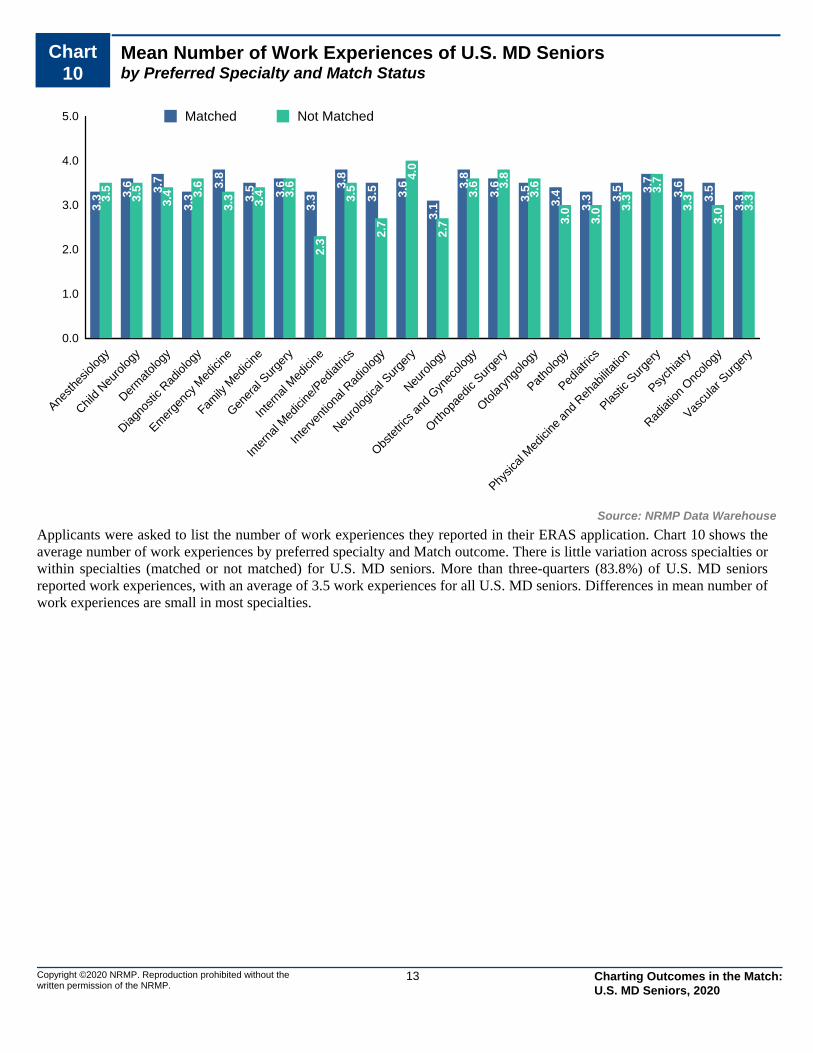
Applicants were asked to list the number of work experiences they reported in their ERAS application. Chart 10 shows the average number of work experiences by preferred specialty and Match outcome. There is little variation across specialties orwithin specialties (matched or not matched) for U.S. MD seniors. More than three-quarters (83.8%) of U.S. MD seniors reported work experiences, with an average of 3.5 work experiences for all U.S. MD seniors. Differences in mean number ofwork experiences are small in most specialties.
Copyright ©2020 NRMP. Reproduction prohibited without the written permission of the NRMP.
Charting Outcomes in the Match: U.S. MD Seniors, 2020
14
Chart11
Mean Number of Volunteer Experiences of U.S. MD Seniorsby Preferred Specialty and Match Status
0.0
2.0
4.0
6.0
8.0
10.0
12.0
Anesth
esiol
ogy
Child
Neuro
logy
Derm
atolo
gy
Diagno
stic R
adiol
ogy
Emer
genc
y Med
icine
Family
Med
icine
Gener
al Sur
gery
Inte
rnal
Med
icine
Inte
rnal
Med
icine
/Ped
iatric
s
Inte
rven
tiona
l Rad
iolog
y
Neuro
logica
l Sur
gery
Neuro
logy
Obste
trics
and
Gyn
ecolo
gy
Orthop
aedic
Sur
gery
Otolar
yngo
logy
Patho
logy
Pediat
rics
Physic
al M
edici
ne a
nd R
ehab
ilitat
ion
Plastic
Sur
gery
Psych
iatry
Radiat
ion O
ncolo
gy
Vascu
lar S
urge
ry
6.9
8.3
9.4
6.9
7.8 8.0 8.3
7.3
9.1
7.2 7.
8
7.6
9.1
8.0 8.
6
6.2
8.8
8.3 8.
7
7.7
6.6
6.5
5.6
7.3
8.8
5.9
6.9
5.1
8.2
5.8
8.1 8.3
7.2
6.1
7.8
7.6
10.0
4.1
9.3
8.5
7.4
6.4
6.0
6.9
Matched Not Matched
Source: NRMP Data Warehouse
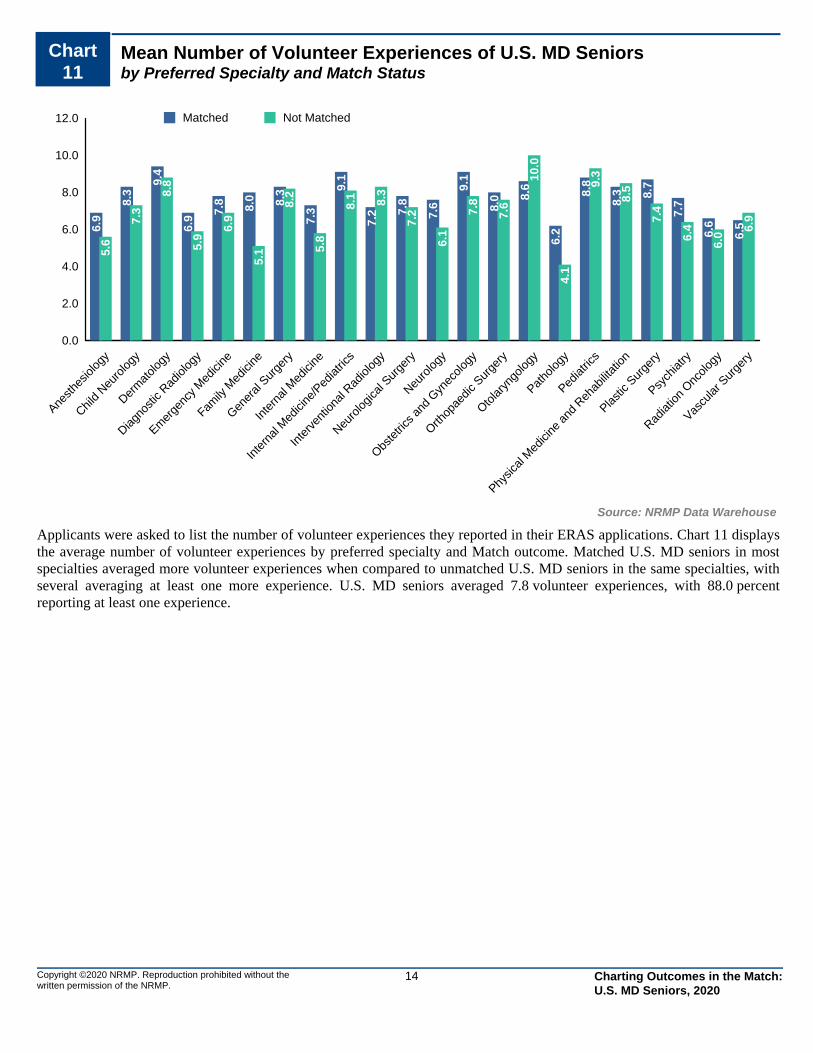
Applicants were asked to list the number of volunteer experiences they reported in their ERAS applications. Chart 11 displays the average number of volunteer experiences by preferred specialty and Match outcome. Matched U.S. MD seniors in most specialties averaged more volunteer experiences when compared to unmatched U.S. MD seniors in the same specialties, withseveral averaging at least one more experience. U.S. MD seniors averaged 7.8 volunteer experiences, with 88.0 percent reporting at least one experience.
Copyright ©2020 NRMP. Reproduction prohibited without the written permission of the NRMP.
Charting Outcomes in the Match: U.S. MD Seniors, 2020
15
Chart12
Percentage of U.S. MD Seniors Who Are Members of AOAby Preferred Specialty and Match Status
0
20
40
60
80
100
Anesth
esiol
ogy
Child
Neuro
logy
Derm
atolo
gy
Diagno
stic R
adiol
ogy
Emer
genc
y Med
icine
Family
Med
icine
Gener
al Sur
gery
Inte
rnal
Med
icine
Inte
rnal
Med
icine
/Ped
iatric
s
Inte
rven
tiona
l Rad
iolog
y
Neuro
logica
l Sur
gery
Neuro
logy
Obste
trics
and
Gyn
ecolo
gy
Orthop
aedic
Sur
gery
Otolar
yngo
logy
Patho
logy
Pediat
rics
Physic
al M
edici
ne a
nd R
ehab
ilitat
ion
Plastic
Sur
gery
Psych
iatry
Radiat
ion O
ncolo
gy
Vascu
lar S
urge
ry
9
19
47
1812
6
19 1724
29
39
14 17
40 38
11 125
43
7
22
13
0 0
28
4 2 5 2 3
137
19
04
11
22
04
0
20
2
100
20
Matched Not Matched
Source: NRMP Data Warehouse
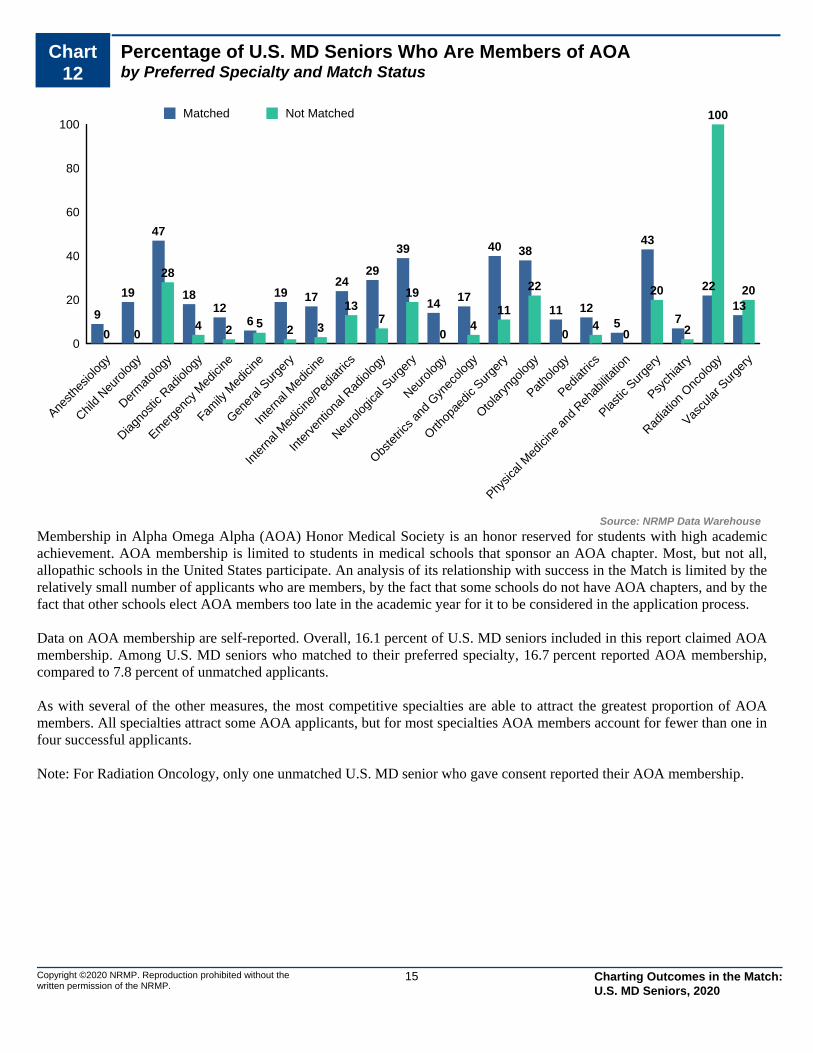
Membership in Alpha Omega Alpha (AOA) Honor Medical Society is an honor reserved for students with high academicachievement. AOA membership is limited to students in medical schools that sponsor an AOA chapter. Most, but not all,allopathic schools in the United States participate. An analysis of its relationship with success in the Match is limited by therelatively small number of applicants who are members, by the fact that some schools do not have AOA chapters, and by thefact that other schools elect AOA members too late in the academic year for it to be considered in the application process.
Data on AOA membership are self-reported. Overall, 16.1 percent of U.S. MD seniors included in this report claimed AOAmembership. Among U.S. MD seniors who matched to their preferred specialty, 16.7 percent reported AOA membership, compared to 7.8 percent of unmatched applicants.
As with several of the other measures, the most competitive specialties are able to attract the greatest proportion of AOAmembers. All specialties attract some AOA applicants, but for most specialties AOA members account for fewer than one infour successful applicants.
Note: For Radiation Oncology, only one unmatched U.S. MD senior who gave consent reported their AOA membership.
Copyright ©2020 NRMP. Reproduction prohibited without the written permission of the NRMP.
Charting Outcomes in the Match: U.S. MD Seniors, 2020

16
Chart13
Percentage of U.S. MD Seniors Graduating from One of the 40 U.S. Medical Schools with the Highest NIH Funding*by Preferred Specialty and Match Status
0
10
20
30
40
50
Anesth
esiol
ogy
Child
Neuro
logy
Derm
atolo
gy
Diagno
stic R
adiol
ogy
Emer
genc
y Med
icine
Family
Med
icine
Gener
al Sur
gery
Inte
rnal
Med
icine
Inte
rnal
Med
icine
/Ped
iatric
s
Inte
rven
tiona
l Rad
iolog
y
Neuro
logica
l Sur
gery
Neuro
logy
Obste
trics
and
Gyn
ecolo
gy
Orthop
aedic
Sur
gery
Otolar
yngo
logy
Patho
logy
Pediat
rics
Physic
al M
edici
ne a
nd R
ehab
ilitat
ion
Plastic
Sur
gery
Psych
iatry
Radiat
ion O
ncolo
gy
Vascu
lar S
urge
ry
31 3
3
41
26 2
8
27 3
0
34 35
28
39
35
30
34
41
36
27
22
34
30
46
39
23
0
34
27
19
16 17
22
22
37
28
20
18
26
22
11
15
20
29
21
0
13
Matched Not Matched
Source: NRMP Data Warehouse
Some program directors may give preference to applicants with research experience or who graduated from aresearch-intensive medical school. To test that assumption, we obtained data on the amount of NIH grant awards andidentified the 40 schools with the highest NIH funding. This measure, by definition, is limited to students of U.S. medical schools. Overall, 31.0 percent of matched and 22.2 percent of unmatched MD seniors were graduates of one of the 40medical schools with the highest NIH funding.
Chart 13 shows the percentage of U.S. MD seniors who graduated from those schools by specialty and Match outcome. For example, 31 percent of U.S. MD seniors who matched in Anesthesiology were graduates of one of the 40 medical schools with the highest NIH funding, and 23 percent of U.S. MD seniors who did not match in Anesthesiology were graduates ofthose schools.
Radiation Oncology had the highest percentage of matched U.S. MD seniors who were graduates of a medical school withthe highest NIH funding. Child Neurology, Dermatology, Otolaryngology, Neurological Surgery, and Vascular Surgery alsohad higher percentages of matched applicants from those schools compared to the other specialties. For all specialties except Diagnostic Radiology and Interventional Radiology, smaller percentages of MD seniors who did not match to theirpreferred specialty were graduates of a medical school with the highest NIH funding compared to MD seniors who matched.
*NIH funding information was obtained from NIH website: http://report.nih.gov/award/index.cfm.
Copyright ©2020 NRMP. Reproduction prohibited without the written permission of the NRMP.
Charting Outcomes in the Match: U.S. MD Seniors, 2020
17
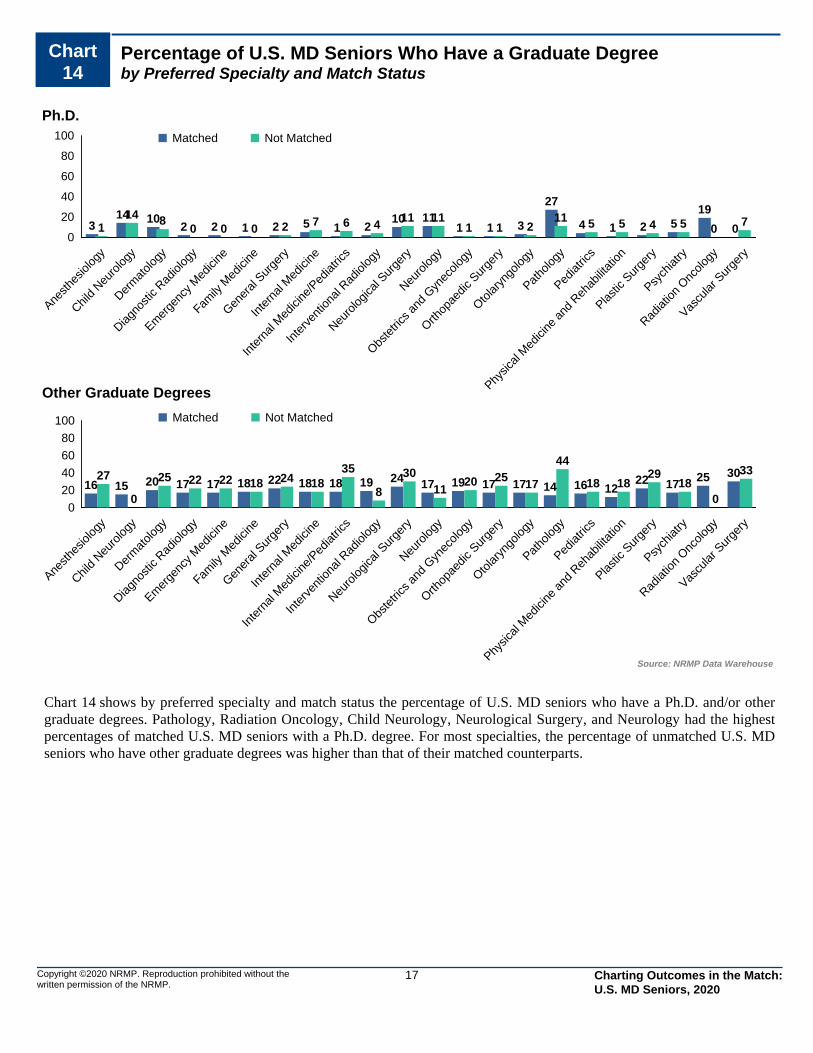
Chart 14 shows by preferred specialty and match status the percentage of U.S. MD seniors who have a Ph.D. and/or other graduate degrees. Pathology, Radiation Oncology, Child Neurology, Neurological Surgery, and Neurology had the highestpercentages of matched U.S. MD seniors with a Ph.D. degree. For most specialties, the percentage of unmatched U.S. MD seniors who have other graduate degrees was higher than that of their matched counterparts.
Chart14
Percentage of U.S. MD Seniors Who Have a Graduate Degreeby Preferred Specialty and Match Status
0
20
40
60
80
100
Anesth
esiol
ogy
Child
Neuro
logy
Derm
atolo
gy
Diagno
stic R
adiol
ogy
Emer
genc
y Med
icine
Family
Med
icine
Gener
al Sur
gery
Inte
rnal
Med
icine
Inte
rnal
Med
icine
/Ped
iatric
s
Inte
rven
tiona
l Rad
iolog
y
Neuro
logica
l Sur
gery
Neuro
logy
Obste
trics
and
Gyn
ecolo
gy
Orthop
aedic
Sur
gery
Otolar
yngo
logy
Patho
logy
Pediat
rics
Physic
al M
edici
ne a
nd R
ehab
ilitat
ion
Plastic
Sur
gery
Psych
iatry
Radiat
ion O
ncolo
gy
Vascu
lar S
urge
ry
314 10
2 2 1 2 5 1 210 11
1 1 3
27
4 1 2 519
0114 8
0 0 0 2 7 6 411 11
1 1 211 5 5 4 5 0
7
Matched Not Matched
0
20
40
60
80
100
Anesth
esiol
ogy
Child
Neuro
logy
Derm
atolo
gy
Diagno
stic R
adiol
ogy
Emer
genc
y Med
icine
Family
Med
icine
Gener
al Sur
gery
Inte
rnal
Med
icine
Inte
rnal
Med
icine
/Ped
iatric
s
Inte
rven
tiona
l Rad
iolog
y
Neuro
logica
l Sur
gery
Neuro
logy
Obste
trics
and
Gyn
ecolo
gy
Orthop
aedic
Sur
gery
Otolar
yngo
logy
Patho
logy
Pediat
rics
Physic
al M
edici
ne a
nd R
ehab
ilitat
ion
Plastic
Sur
gery
Psych
iatry
Radiat
ion O
ncolo
gy
Vascu
lar S
urge
ry
16 15 20 17 17 18 22 18 18 19 24 17 19 17 17 14 16 1222 17
25 3027
0
25 22 22 18 24 1835
8
3011
20 2517
44
18 1829
180
33
Matched Not Matched
Source: NRMP Data Warehouse
Ph.D.
Other Graduate Degrees
Copyright ©2020 NRMP. Reproduction prohibited without the written permission of the NRMP.
Charting Outcomes in the Match: U.S. MD Seniors, 2020
AN Anesthesiology
Copyright ©2020 NRMP. Reproduction prohibited without the written permission of the NRMP.
18 Charting Outcomes in the Match: U.S. MD Seniors, 2020

Table AN-1
Summary Statistics on U.S. MD SeniorsAnesthesiology
Measure (n=1,112) (n=117)
Matched Unmatched
15.1 5.1Mean number of contiguous ranks1.
1.3 1.9Mean number of distinct specialties ranked2.
234 217Mean USMLE Step 1 score3.
246 227Mean USMLE Step 2 score4.
3.2 2.8Mean number of research experiences5.
5.2 3.7Mean number of abstracts, presentations, and publications6.
3.3 3.5Mean number of work experiences7.
6.9 5.6Mean number of volunteer experiences8.
9.4 0.0Percentage who are AOA members9.
30.6 23.1Percentage who graduated from one of the 40 U.S. medical schools with the highest NIH funding
10.
3.0 0.9Percentage who have Ph.D. degree11.
16.0 26.6Percentage who have another graduate degree12.
Note: Only U.S. MD seniors who gave consent to use their information in research are included. Sources. NRMP Data Warehouse; Top 40 U.S. medical schools with the highest NIH funding in measure 10 is from the NIH website (http://report.nih.gov/award/index.cfm).
Copyright ©2020 NRMP. Reproduction prohibited without the written permission of the NRMP.
19 Charting Outcomes in the Match: U.S. MD Seniors, 2020
0
200
400
600
800
1,000
1 2 3 4 or More
887
147
641242 50 21 4
Matched Not Matched
Distinct Specialties Ranked
Nu
mb
er o
f A
pp
lican
ts
0
100
200
300
400
500
600
1 2 3 4 5 6 7 8 9 10 11 12 13 14 15 16 orMore
7 13 13 11 27 22 2649 54 58 55 61 58 67 62
529
23 23 10 14 5 9 3 5 5 3 6 2 4 0 3 2
Matched Not Matched
Contiguous Ranks
Nu
mb
er o
f A
pp
lican
ts
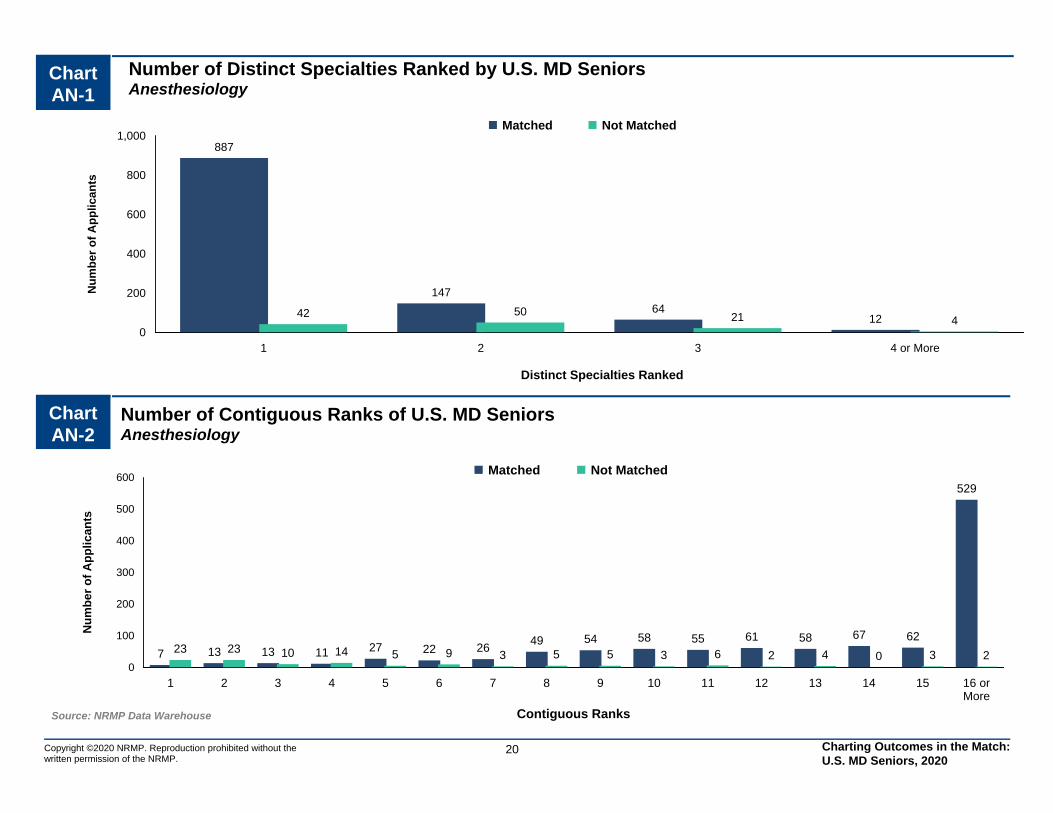
Chart AN-2
Number of Contiguous Ranks of U.S. MD SeniorsAnesthesiology
Source: NRMP Data Warehouse
Copyright ©2020 NRMP. Reproduction prohibited without the written permission of the NRMP.
20
Chart AN-1
Number of Distinct Specialties Ranked by U.S. MD SeniorsAnesthesiology
Charting Outcomes in the Match: U.S. MD Seniors, 2020

Probability of U.S. MD Seniors Matching to Preferred Specialty by Number of Contiguous RanksAnesthesiology
Graph AN-1
0.00
0.10
0.20
0.30
0.40
0.50
0.60
0.70
0.80
0.90
1.00
0 1 2 3 4 5 6 7 8 9 10 11 12 13 14 15 16 17 18 19 20
Number of Contiguous Ranks
Probability of Matching
Source: NRMP Data Warehouse. Note: Probabilities calculated based on 2018-2020 applicants
21Copyright ©2020 NRMP. Reproduction prohibited without the written permission of the NRMP.
Charting Outcomes in the Match: U.S. MD Seniors, 2020
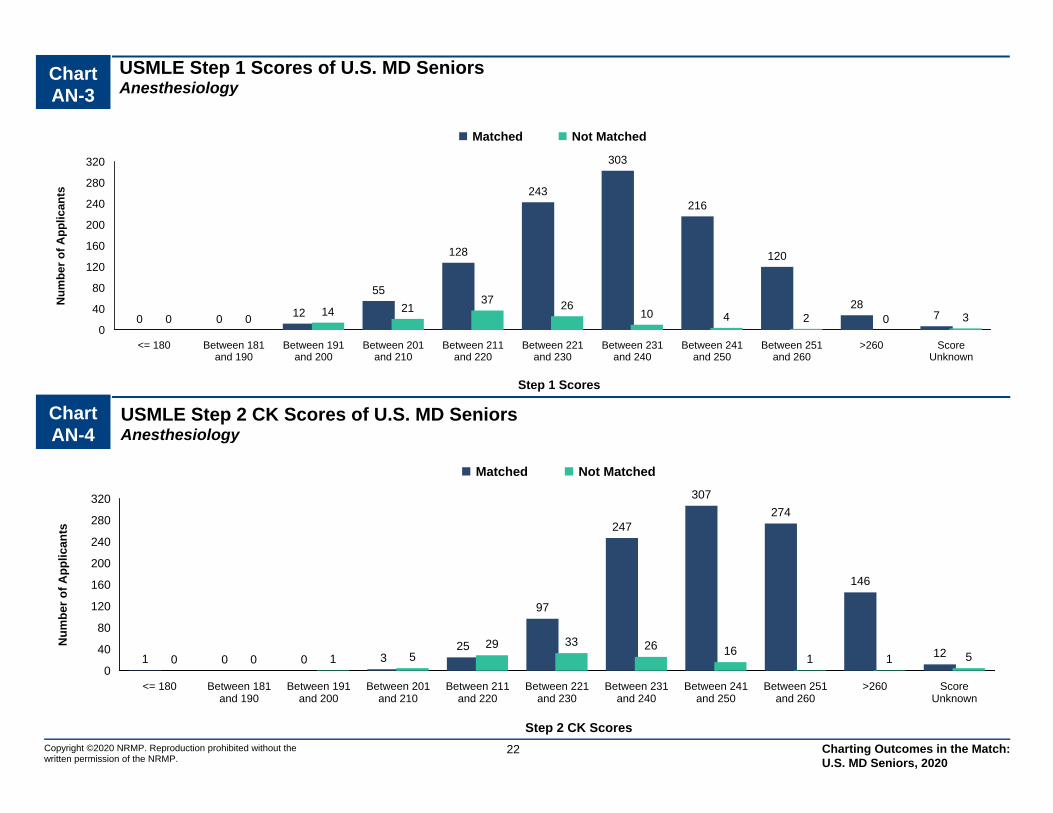
Chart AN-3
USMLE Step 1 Scores of U.S. MD SeniorsAnesthesiology
0
40
80
120
160
200
240
280
320
<= 180 Between 181and 190
Between 191and 200
Between 201and 210
Between 211and 220
Between 221and 230
Between 231and 240
Between 241and 250
Between 251and 260
>260 ScoreUnknown
0 0 12
55
128
243
303
216
120
2870 0
14 2137 26
10 4 2 0 3
Matched Not Matched
Step 1 Scores
Nu
mb
er
of
Ap
pli
ca
nts
Source: NRMP Data Warehouse
22Copyright ©2020 NRMP. Reproduction prohibited without the written permission of the NRMP.
Chart AN-4
USMLE Step 2 CK Scores of U.S. MD SeniorsAnesthesiology
0
40
80
120
160
200
240
280
320
<= 180 Between 181and 190
Between 191and 200
Between 201and 210
Between 211and 220
Between 221and 230
Between 231and 240
Between 241and 250
Between 251and 260
>260 ScoreUnknown
1 0 0 325
97
247
307
274
146
120 0 1 529 33 26 16
1 1 5
Matched Not Matched
Step 2 CK Scores
Nu
mb
er o
f A
pp
lican
ts
Charting Outcomes in the Match: U.S. MD Seniors, 2020
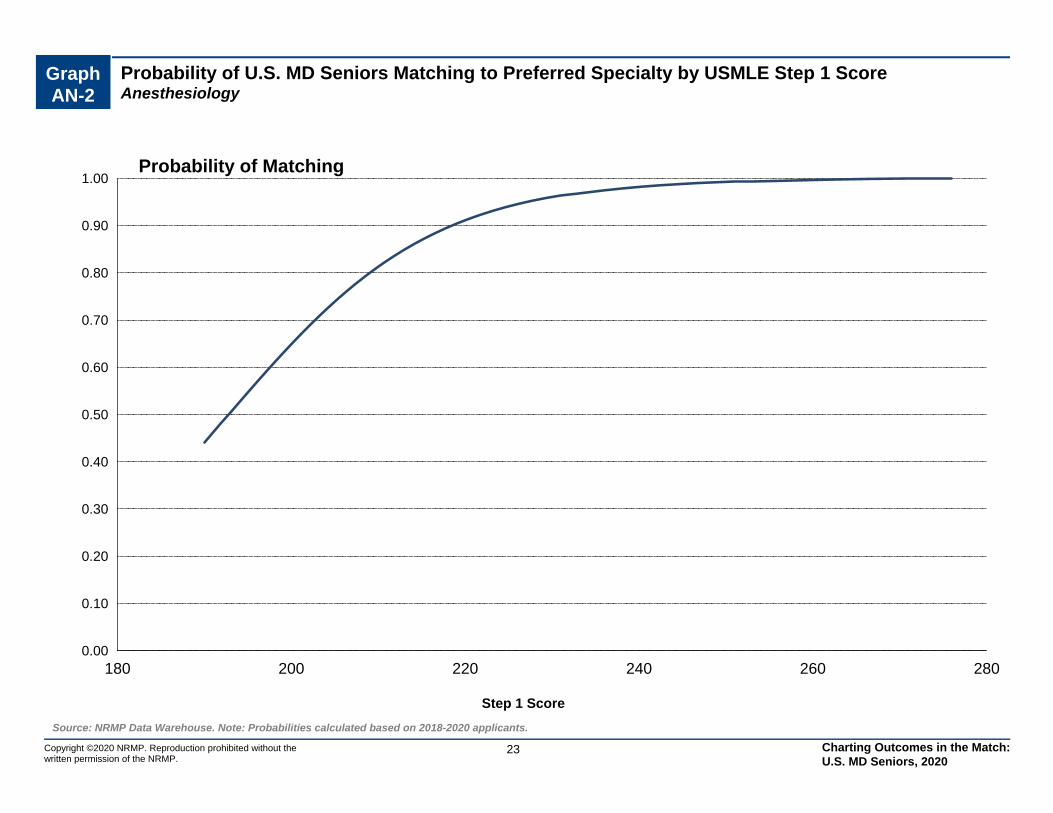
Graph AN-2
Probability of U.S. MD Seniors Matching to Preferred Specialty by USMLE Step 1 ScoreAnesthesiology
0.00
0.10
0.20
0.30
0.40
0.50
0.60
0.70
0.80
0.90
1.00
180 200 220 240 260 280
Step 1 Score
Probability of Matching
Source: NRMP Data Warehouse. Note: Probabilities calculated based on 2018-2020 applicants.
23Copyright ©2020 NRMP. Reproduction prohibited without the written permission of the NRMP.
Charting Outcomes in the Match: U.S. MD Seniors, 2020
0
50
100
150
200
250
300
350
400
450
None 1 2 3 4 5 or More
108133 133 119
104
414
17 22 19 16 625
Matched Not Matched
Publications
Nu
mb
er o
f A
pp
lican
ts
0
40
80
120
160
200
240
280
None 1 2 3 4 5 or More
36
122
241258
144
207
717
32 2312 11
Matched Not Matched
Research Projects
Nu
mb
er o
f A
pp
lican
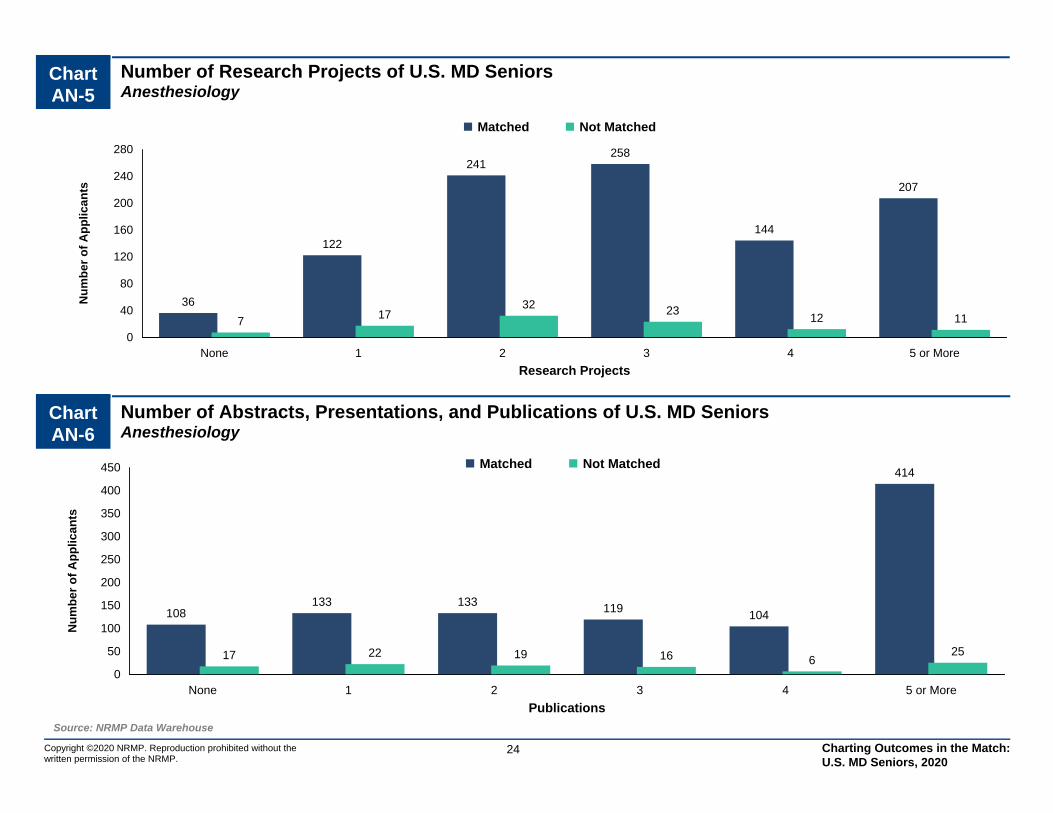
tsChart AN-5
Number of Research Projects of U.S. MD SeniorsAnesthesiology
Source: NRMP Data Warehouse
24Copyright ©2020 NRMP. Reproduction prohibited without the written permission of the NRMP.
Chart AN-6
Number of Abstracts, Presentations, and Publications of U.S. MD SeniorsAnesthesiology
Charting Outcomes in the Match: U.S. MD Seniors, 2020
0
40
80
120
160
200
None 1 2 3 4 5 6 7 8 9 10 or More
218
48
76
115
138131
116
8468
200
3 313
227
14 10 4 6 11 13
Matched Not Matched
Volunteer Experiences
Nu
mb
er o
f A
pp
lican
ts
0
40
80
120
160
200
240
None 1 2 3 4 5 or More
54
134
222
186
158
238
4 1126 19 16
29
Matched Not Matched
Work Experiences
Nu
mb
er o
f A
pp
lican
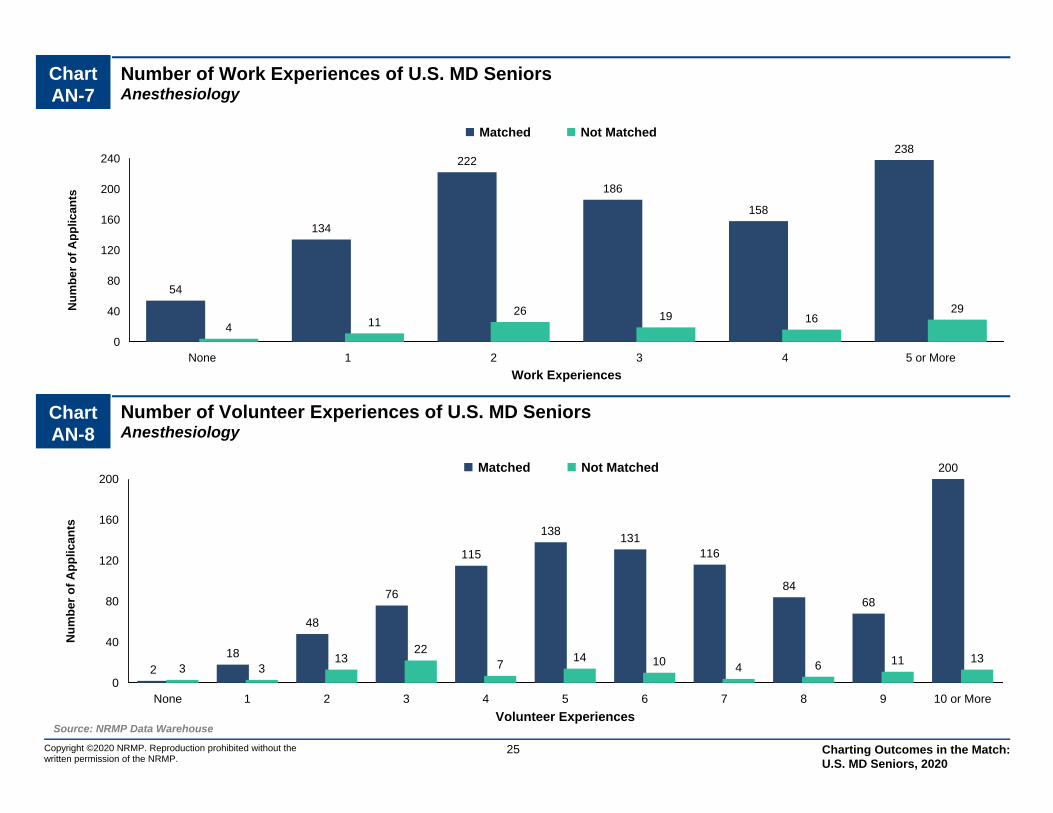
tsChart AN-7
Number of Work Experiences of U.S. MD SeniorsAnesthesiology
Source: NRMP Data Warehouse
25Copyright ©2020 NRMP. Reproduction prohibited without the written permission of the NRMP.
Chart AN-8
Number of Volunteer Experiences of U.S. MD SeniorsAnesthesiology
Charting Outcomes in the Match: U.S. MD Seniors, 2020

Chart AN-9
Other Characteristics of U.S. MD SeniorsAnesthesiology
Copyright ©2020 NRMP. Reproduction prohibited without the written permission of the NRMP.
Source: NRMP Data Warehouse. Top 40 U.S. medical schools with the highest NIH funding from NIH: http://report.nih.gov/award/index.cfm
26
0
200
400
600
800
1,000
Yes No
104
941
0
109
Nu
mb
er
of
Ap
pli
ca
nts
AOA Membership
0
200
400
600
800
Yes No
340
772
2790
Nu
mb
er o
f A
pp
lican
ts
Graduate of One of the 40 U.S. MedicalSchools with the Highest NIH Funding
0
200
400
600
800
1,000
1,200
Yes No
32
1,023
1
108
Nu
mb
er o
f A
pp
lican
ts
Ph.D. Degree
0
200
400
600
800
1,000
Yes No
169
884
2980
Nu
mb
er o
f A
pp
lican
ts
Other Graduate Degree
Matched Not Matched
Charting Outcomes in the Match: U.S. MD Seniors, 2020

CN Child Neurology
Copyright ©2020 NRMP. Reproduction prohibited without the written permission of the NRMP.
27 Charting Outcomes in the Match: U.S. MD Seniors, 2020

Table CN-1
Summary Statistics on U.S. MD SeniorsChild Neurology
Measure (n=108) (n=7)
Matched Unmatched
11.2 5.0Mean number of contiguous ranks1.
1.2 1.6Mean number of distinct specialties ranked2.
233 210Mean USMLE Step 1 score3.
246 224Mean USMLE Step 2 score4.
3.5 3.3Mean number of research experiences5.
7.0 7.3Mean number of abstracts, presentations, and publications6.
3.6 3.5Mean number of work experiences7.
8.3 7.3Mean number of volunteer experiences8.
18.5 0.0Percentage who are AOA members9.
33.3 0.0Percentage who graduated from one of the 40 U.S. medical schools with the highest NIH funding
10.
14.2 14.3Percentage who have Ph.D. degree11.
14.6 0.0Percentage who have another graduate degree12.
Note: Only U.S. MD seniors who gave consent to use their information in research are included. Sources. NRMP Data Warehouse; Top 40 U.S. medical schools with the highest NIH funding in measure 10 is from the NIH website (http://report.nih.gov/award/index.cfm).
Copyright ©2020 NRMP. Reproduction prohibited without the written permission of the NRMP.
28 Charting Outcomes in the Match: U.S. MD Seniors, 2020
0
20
40
60
80
100
1 2 3 4 or More
84
22
2 03 40 0
Matched Not Matched
Distinct Specialties Ranked
Nu
mb
er o
f A
pp
lican
ts
0
2
4
6
8
10
12
14
16
1 2 3 4 5 6 7 8 9 10 11 12 13 14 15 16 orMore
2
5
2
01
34
56
13
16 16
4
11
7
13
1 1 1 10
10 0
1 10 0 0 0 0 0
Matched Not Matched
Contiguous Ranks
Nu
mb
er o
f A
pp
lican
ts
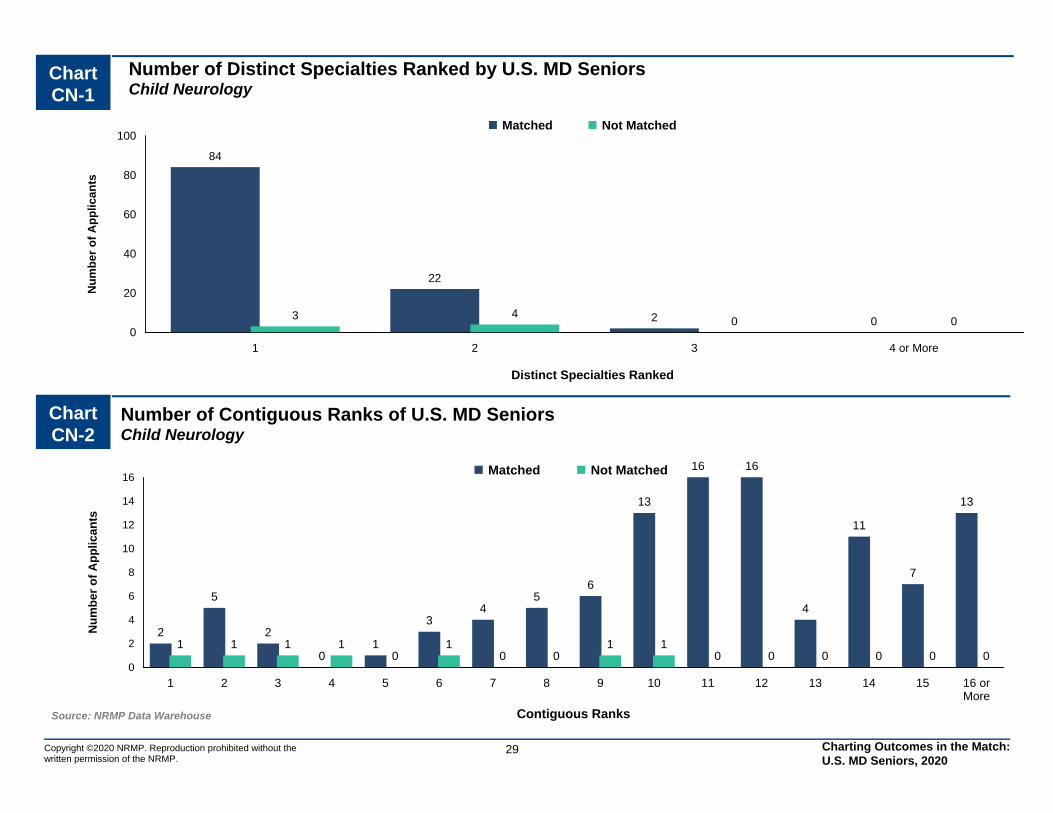
Chart CN-2
Number of Contiguous Ranks of U.S. MD SeniorsChild Neurology
Source: NRMP Data Warehouse
Copyright ©2020 NRMP. Reproduction prohibited without the written permission of the NRMP.
29
Chart CN-1
Number of Distinct Specialties Ranked by U.S. MD SeniorsChild Neurology
Charting Outcomes in the Match: U.S. MD Seniors, 2020
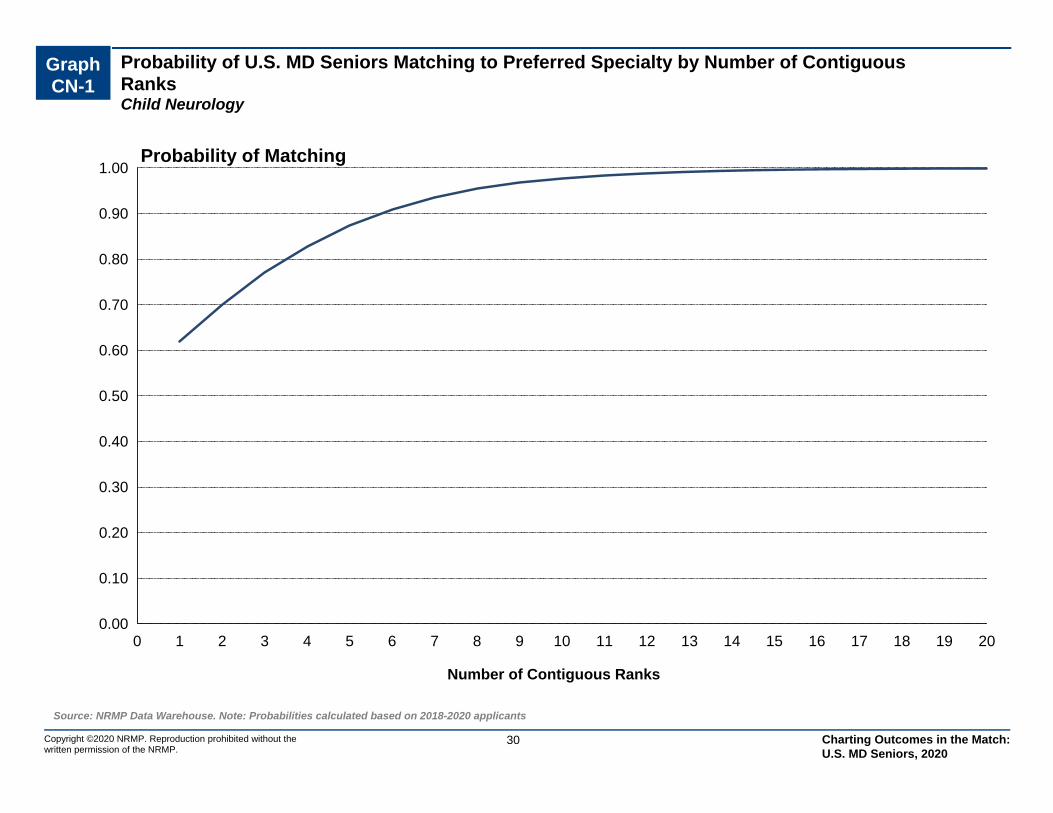
Probability of U.S. MD Seniors Matching to Preferred Specialty by Number of Contiguous RanksChild Neurology
Graph CN-1
0.00
0.10
0.20
0.30
0.40
0.50
0.60
0.70
0.80
0.90
1.00
0 1 2 3 4 5 6 7 8 9 10 11 12 13 14 15 16 17 18 19 20
Number of Contiguous Ranks
Probability of Matching
Source: NRMP Data Warehouse. Note: Probabilities calculated based on 2018-2020 applicants
30Copyright ©2020 NRMP. Reproduction prohibited without the written permission of the NRMP.
Charting Outcomes in the Match: U.S. MD Seniors, 2020
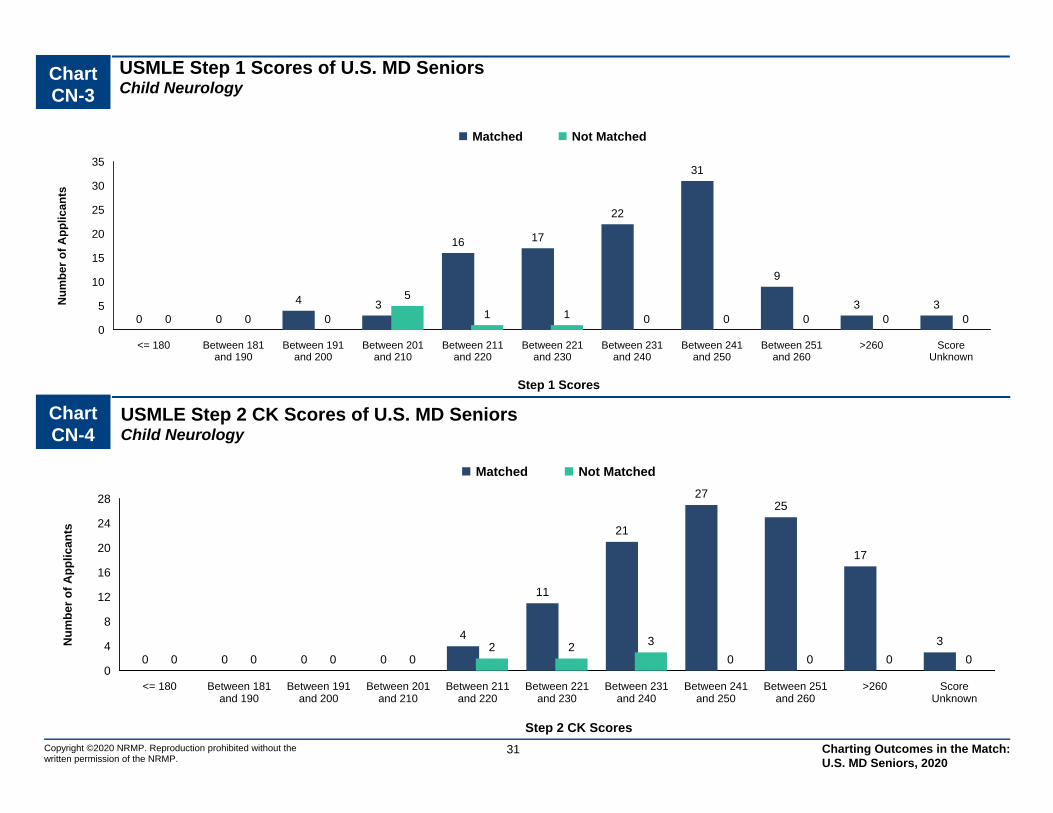
Chart CN-3
USMLE Step 1 Scores of U.S. MD SeniorsChild Neurology
0
5
10
15
20
25
30
35
<= 180 Between 181and 190
Between 191and 200
Between 201and 210
Between 211and 220
Between 221and 230
Between 231and 240
Between 241and 250
Between 251and 260
>260 ScoreUnknown
0 0
4 3
16 17
22
31
9
3 30 0 0
5
1 1 0 0 0 0 0
Matched Not Matched
Step 1 Scores
Nu
mb
er
of
Ap
pli
ca
nts
Source: NRMP Data Warehouse
31Copyright ©2020 NRMP. Reproduction prohibited without the written permission of the NRMP.
Chart CN-4
USMLE Step 2 CK Scores of U.S. MD SeniorsChild Neurology
0
4
8
12
16
20
24
28
<= 180 Between 181and 190
Between 191and 200
Between 201and 210
Between 211and 220
Between 221and 230
Between 231and 240
Between 241and 250
Between 251and 260
>260 ScoreUnknown
0 0 0 0
4
11
21
2725
17
3
0 0 0 02 2 3
0 0 0 0
Matched Not Matched
Step 2 CK Scores
Nu
mb
er o
f A
pp
lican
ts
Charting Outcomes in the Match: U.S. MD Seniors, 2020

Graph CN-2
Probability of U.S. MD Seniors Matching to Preferred Specialty by USMLE Step 1 ScoreChild Neurology
0.00
0.10
0.20
0.30
0.40
0.50
0.60
0.70
0.80
0.90
1.00
190 200 210 220 230 240 250 260 270
Step 1 Score
Probability of Matching
Source: NRMP Data Warehouse. Note: Probabilities calculated based on 2018-2020 applicants.
32Copyright ©2020 NRMP. Reproduction prohibited without the written permission of the NRMP.
Charting Outcomes in the Match: U.S. MD Seniors, 2020
0
10
20
30
40
50
60
None 1 2 3 4 5 or More
7
1310
58
58
02
0 0 0
5
Matched Not Matched
Publications
Nu
mb
er o
f A
pp
lican
ts
0
5
10
15
20
25
30
35
40
None 1 2 3 4 5 or More
4 4
13
38
18
23
0 0 14
1 1
Matched Not Matched
Research Projects
Nu
mb
er o
f A
pp
lican
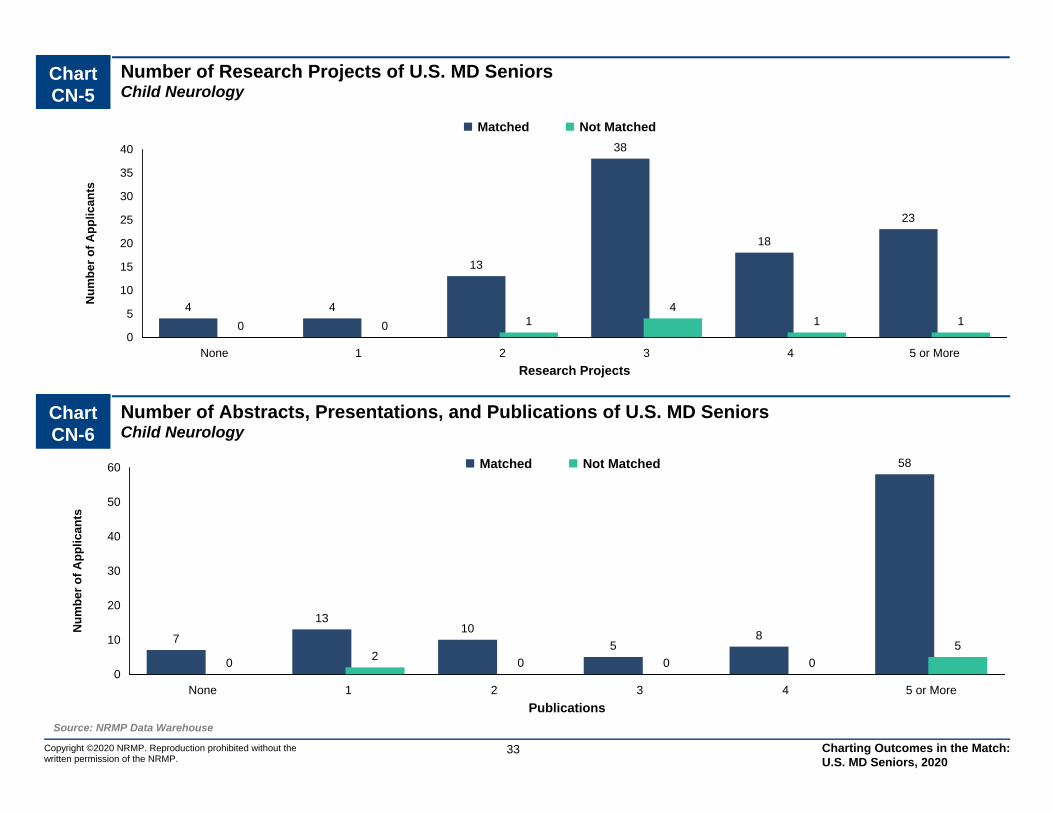
tsChart CN-5
Number of Research Projects of U.S. MD SeniorsChild Neurology
Source: NRMP Data Warehouse
33Copyright ©2020 NRMP. Reproduction prohibited without the written permission of the NRMP.
Chart CN-6
Number of Abstracts, Presentations, and Publications of U.S. MD SeniorsChild Neurology
Charting Outcomes in the Match: U.S. MD Seniors, 2020
0
5
10
15
20
25
30
35
None 1 2 3 4 5 6 7 8 9 10 or More
0 1
4 3
9 9
13
8
1210
31
0 02
0 0 0 1 1 1 02
Matched Not Matched
Volunteer Experiences
Nu
mb
er o
f A
pp
lican
ts
0
4
8
12
16
20
24
28
None 1 2 3 4 5 or More
5
15
12
23
18
27
01
20
12
Matched Not Matched
Work Experiences
Nu
mb
er o
f A
pp
lican
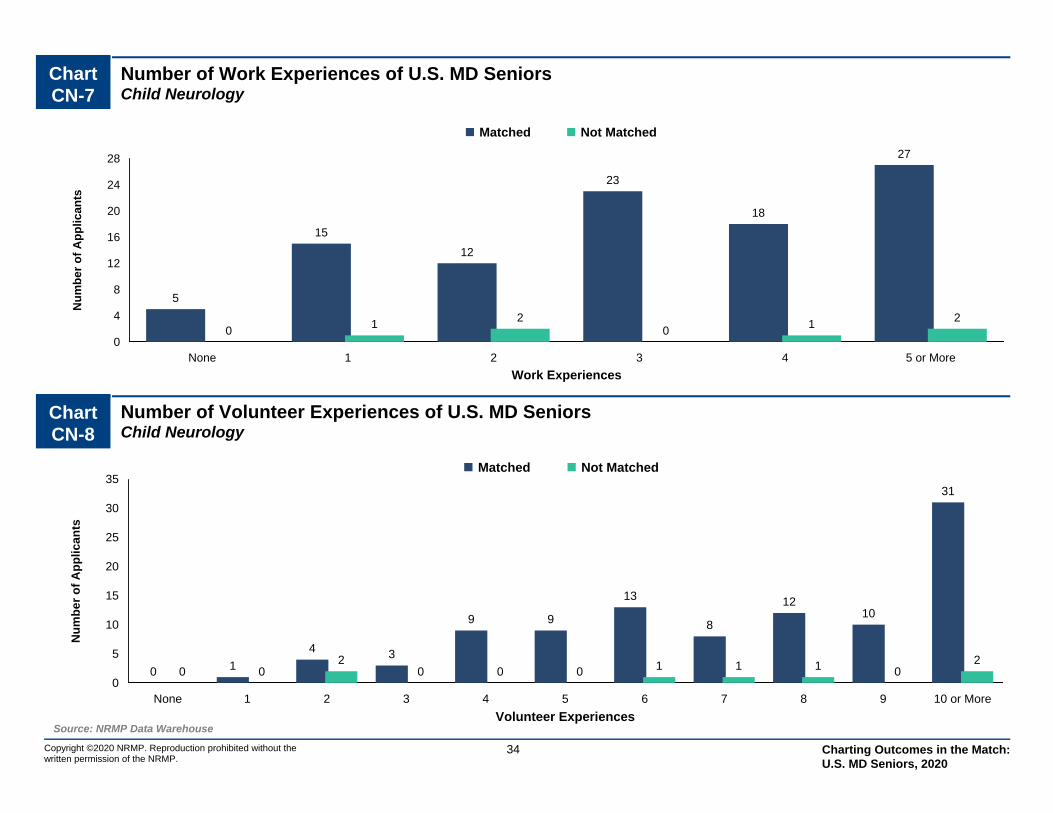
tsChart CN-7
Number of Work Experiences of U.S. MD SeniorsChild Neurology
Source: NRMP Data Warehouse
34Copyright ©2020 NRMP. Reproduction prohibited without the written permission of the NRMP.
Chart CN-8
Number of Volunteer Experiences of U.S. MD SeniorsChild Neurology
Charting Outcomes in the Match: U.S. MD Seniors, 2020
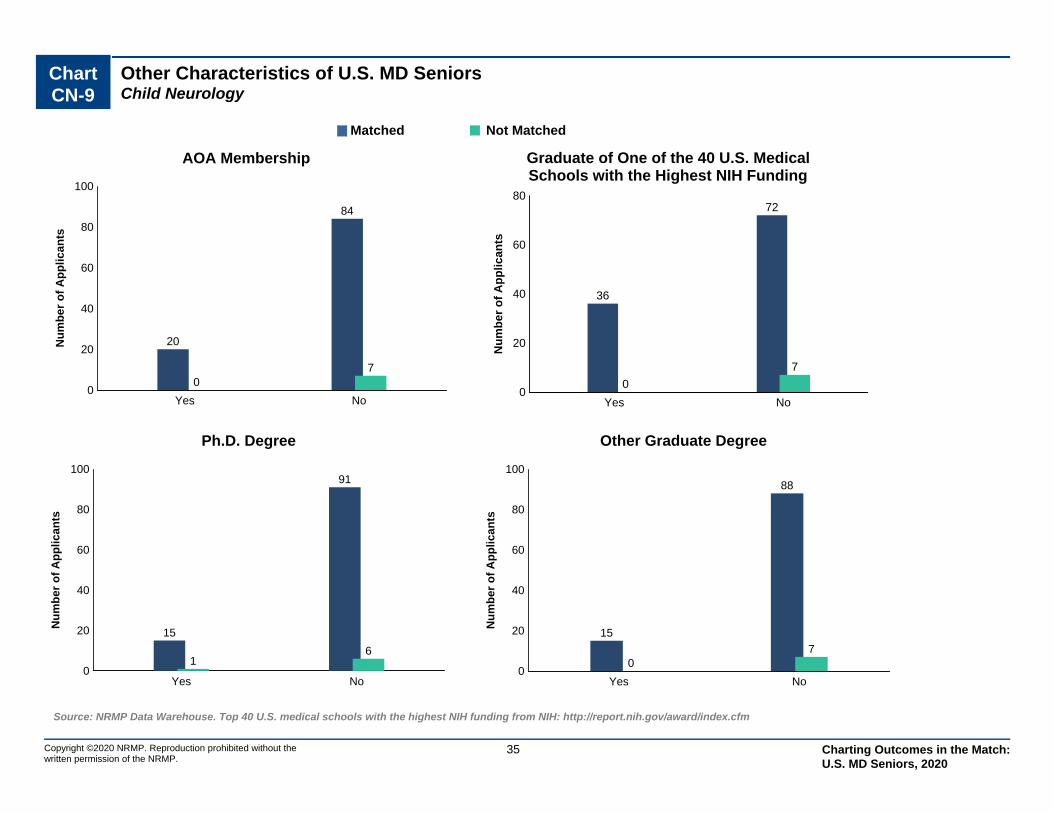
Chart CN-9
Other Characteristics of U.S. MD SeniorsChild Neurology
Copyright ©2020 NRMP. Reproduction prohibited without the written permission of the NRMP.
Source: NRMP Data Warehouse. Top 40 U.S. medical schools with the highest NIH funding from NIH: http://report.nih.gov/award/index.cfm
35
0
20
40
60
80
100
Yes No
20
84
07
Nu
mb
er
of
Ap
pli
ca
nts
AOA Membership
0
20
40
60
80
Yes No
36
72
0
7
Nu
mb
er o
f A
pp
lican
ts
Graduate of One of the 40 U.S. MedicalSchools with the Highest NIH Funding
0
20
40
60
80
100
Yes No
15
91
16
Nu
mb
er o
f A
pp
lican
ts
Ph.D. Degree
0
20
40
60
80
100
Yes No
15
88
07
Nu
mb
er o
f A
pp
lican
ts
Other Graduate Degree
Matched Not Matched
Charting Outcomes in the Match: U.S. MD Seniors, 2020
DM Dermatology
Copyright ©2020 NRMP. Reproduction prohibited without the written permission of the NRMP.
36 Charting Outcomes in the Match: U.S. MD Seniors, 2020
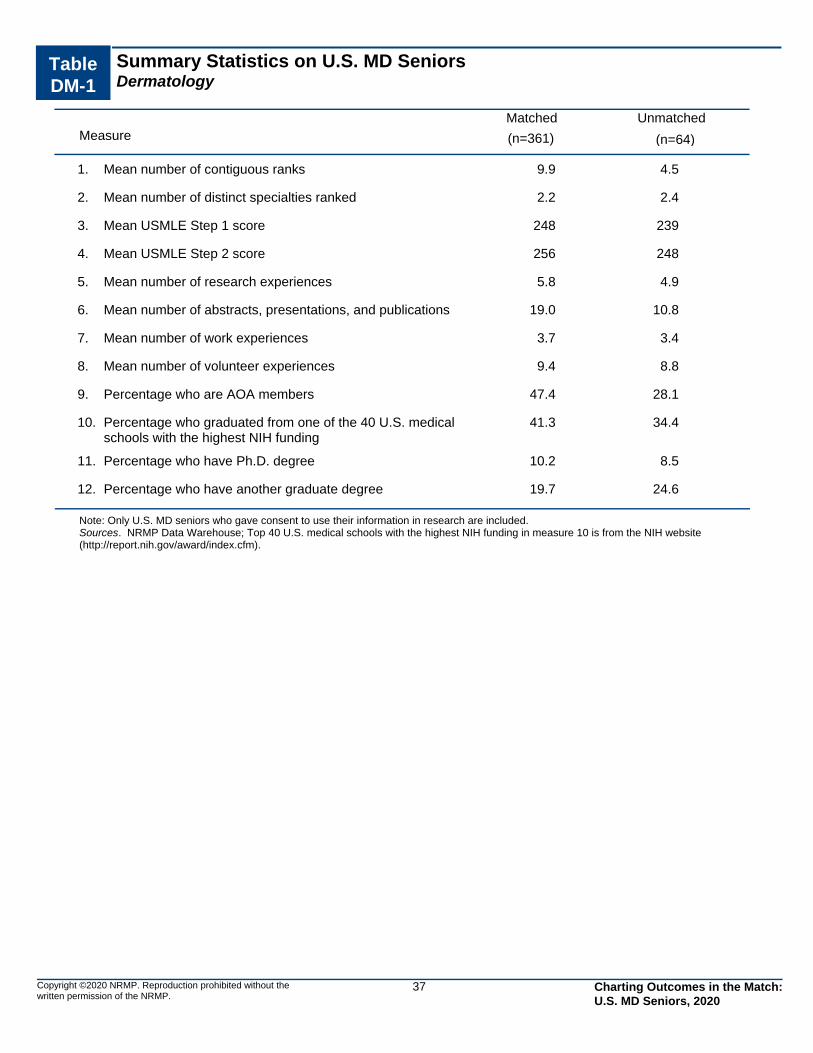
Table DM-1
Summary Statistics on U.S. MD SeniorsDermatology
Measure (n=361) (n=64)
Matched Unmatched
9.9 4.5Mean number of contiguous ranks1.
2.2 2.4Mean number of distinct specialties ranked2.
248 239Mean USMLE Step 1 score3.
256 248Mean USMLE Step 2 score4.
5.8 4.9Mean number of research experiences5.
19.0 10.8Mean number of abstracts, presentations, and publications6.
3.7 3.4Mean number of work experiences7.
9.4 8.8Mean number of volunteer experiences8.
47.4 28.1Percentage who are AOA members9.
41.3 34.4Percentage who graduated from one of the 40 U.S. medical schools with the highest NIH funding
10.
10.2 8.5Percentage who have Ph.D. degree11.
19.7 24.6Percentage who have another graduate degree12.
Note: Only U.S. MD seniors who gave consent to use their information in research are included. Sources. NRMP Data Warehouse; Top 40 U.S. medical schools with the highest NIH funding in measure 10 is from the NIH website (http://report.nih.gov/award/index.cfm).
Copyright ©2020 NRMP. Reproduction prohibited without the written permission of the NRMP.
37 Charting Outcomes in the Match: U.S. MD Seniors, 2020
0
20
40
60
80
100
120
140
1 2 3 4 or More
89
136128
81122
27
4
Matched Not Matched
Distinct Specialties Ranked
Nu
mb
er o
f A
pp
lican
ts
0
5
10
15
20
25
30
35
40
1 2 3 4 5 6 7 8 9 10 11 12 13 14 15 16 orMore
4
911
19 1820
34 33
19
36
3032
28
1513
40
810
7
13
86
2 3 2 31 0 0 0 1 0
Matched Not Matched
Contiguous Ranks
Nu
mb
er o
f A
pp
lican
ts
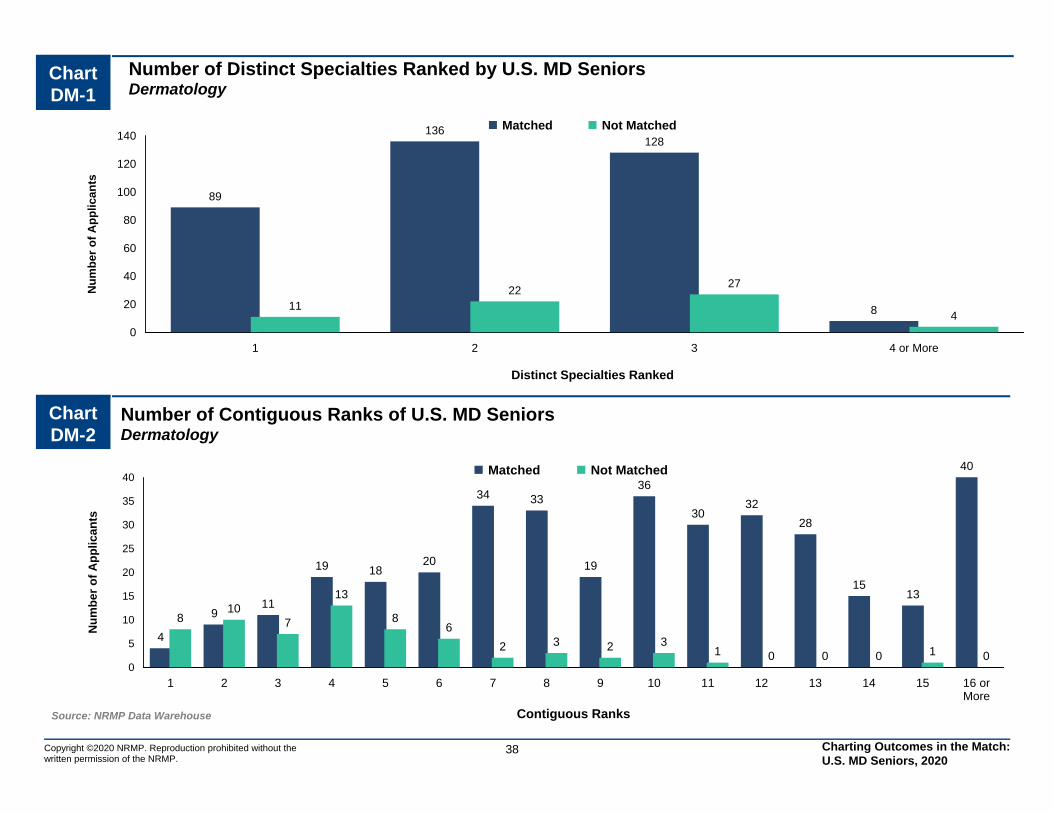
Chart DM-2
Number of Contiguous Ranks of U.S. MD SeniorsDermatology
Source: NRMP Data Warehouse
Copyright ©2020 NRMP. Reproduction prohibited without the written permission of the NRMP.
38
Chart DM-1
Number of Distinct Specialties Ranked by U.S. MD SeniorsDermatology
Charting Outcomes in the Match: U.S. MD Seniors, 2020
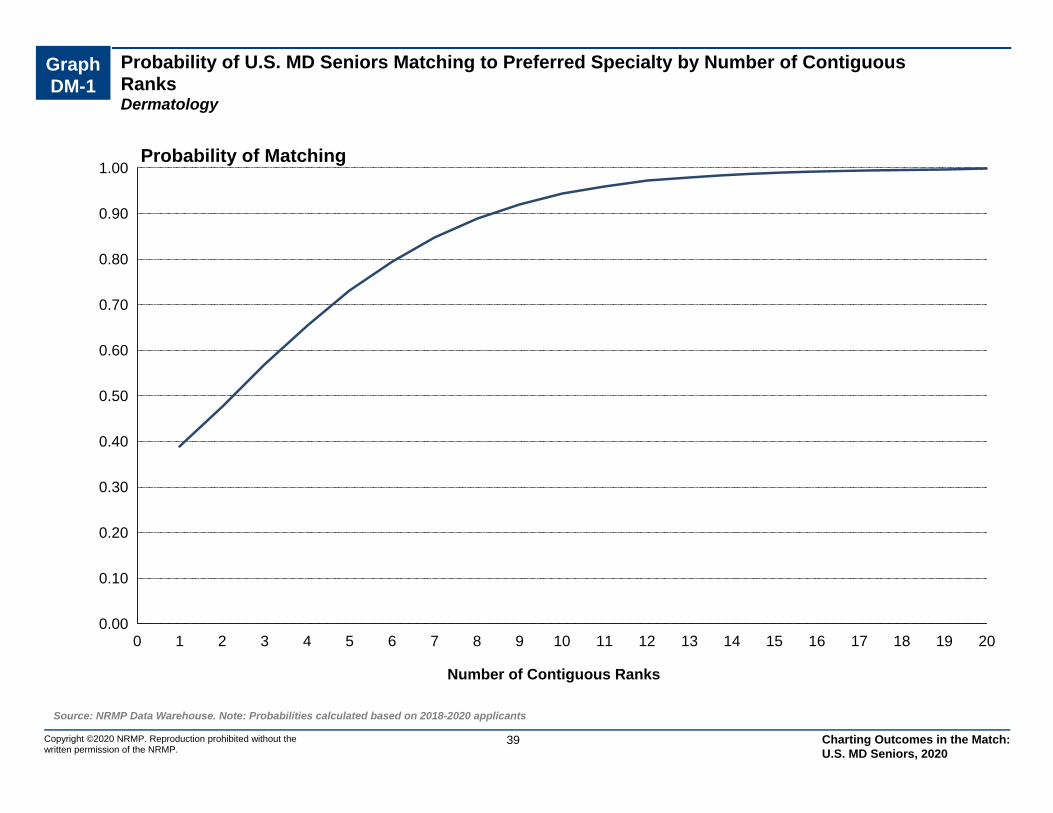
Probability of U.S. MD Seniors Matching to Preferred Specialty by Number of Contiguous RanksDermatology
Graph DM-1
0.00
0.10
0.20
0.30
0.40
0.50
0.60
0.70
0.80
0.90
1.00
0 1 2 3 4 5 6 7 8 9 10 11 12 13 14 15 16 17 18 19 20
Number of Contiguous Ranks
Probability of Matching
Source: NRMP Data Warehouse. Note: Probabilities calculated based on 2018-2020 applicants
39Copyright ©2020 NRMP. Reproduction prohibited without the written permission of the NRMP.
Charting Outcomes in the Match: U.S. MD Seniors, 2020
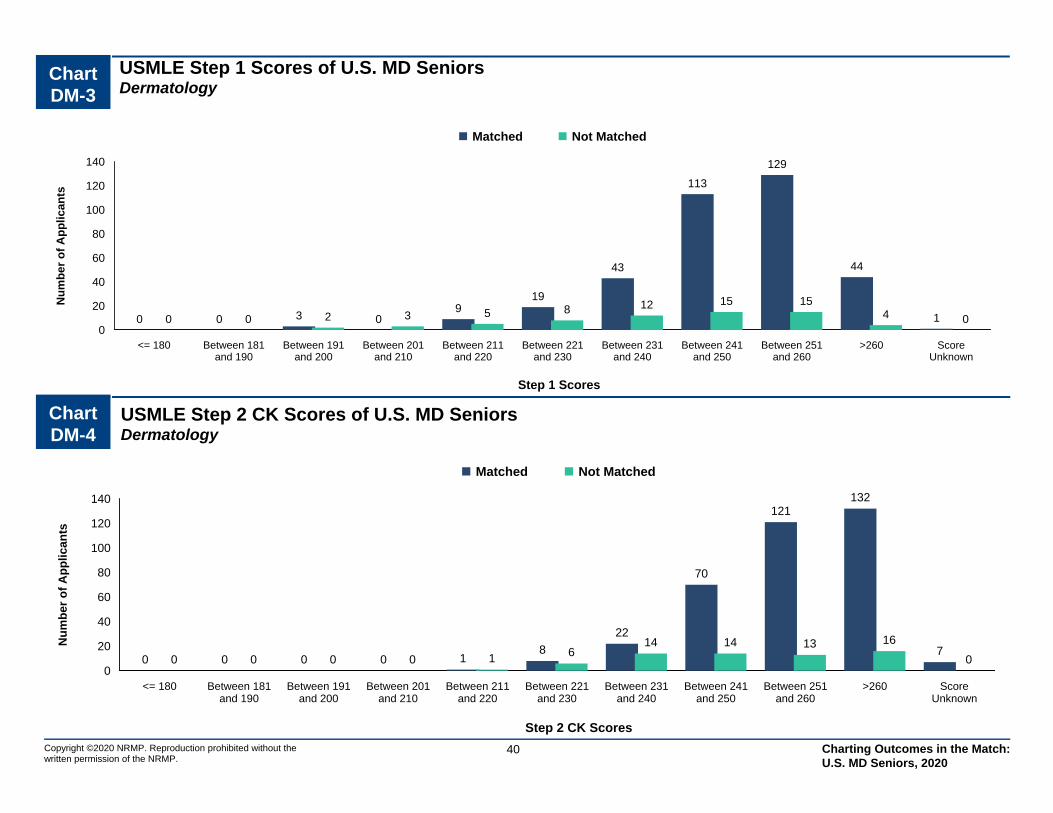
Chart DM-3
USMLE Step 1 Scores of U.S. MD SeniorsDermatology
0
20
40
60
80
100
120
140
<= 180 Between 181and 190
Between 191and 200
Between 201and 210
Between 211and 220
Between 221and 230
Between 231and 240
Between 241and 250
Between 251and 260
>260 ScoreUnknown
0 0 3 09
19
43
113
129
44
10 0 2 3 5 8 12 15 154 0
Matched Not Matched
Step 1 Scores
Nu
mb
er
of
Ap
pli
ca
nts
Source: NRMP Data Warehouse
40Copyright ©2020 NRMP. Reproduction prohibited without the written permission of the NRMP.
Chart DM-4
USMLE Step 2 CK Scores of U.S. MD SeniorsDermatology
0
20
40
60
80
100
120
140
<= 180 Between 181and 190
Between 191and 200
Between 201and 210
Between 211and 220
Between 221and 230
Between 231and 240
Between 241and 250
Between 251and 260
>260 ScoreUnknown
0 0 0 0 18
22
70
121132
70 0 0 0 1 6
14 14 13 16
0
Matched Not Matched
Step 2 CK Scores
Nu
mb
er o
f A
pp
lican
ts
Charting Outcomes in the Match: U.S. MD Seniors, 2020
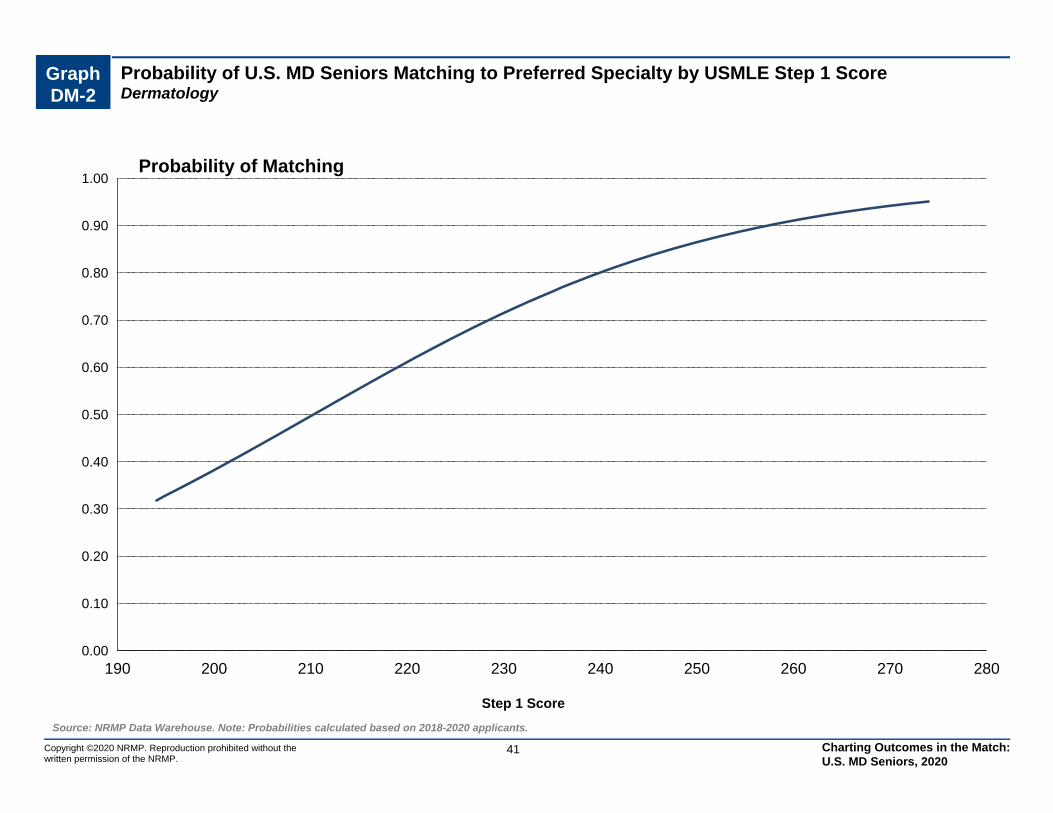
Graph DM-2
Probability of U.S. MD Seniors Matching to Preferred Specialty by USMLE Step 1 ScoreDermatology
0.00
0.10
0.20
0.30
0.40
0.50
0.60
0.70
0.80
0.90
1.00
190 200 210 220 230 240 250 260 270 280
Step 1 Score
Probability of Matching
Source: NRMP Data Warehouse. Note: Probabilities calculated based on 2018-2020 applicants.
41Copyright ©2020 NRMP. Reproduction prohibited without the written permission of the NRMP.
Charting Outcomes in the Match: U.S. MD Seniors, 2020
0
40
80
120
160
200
240
280
320
None 1 2 3 4 5 or More
1 6 3 6 8
298
2 3 3 3 5
39
Matched Not Matched
Publications
Nu
mb
er o
f A
pp
lican
ts
0
40
80
120
160
200
None 1 2 3 4 5 or More
4 926
4357
181
1 3 7 413
28
Matched Not Matched
Research Projects
Nu
mb
er o
f A
pp
lican
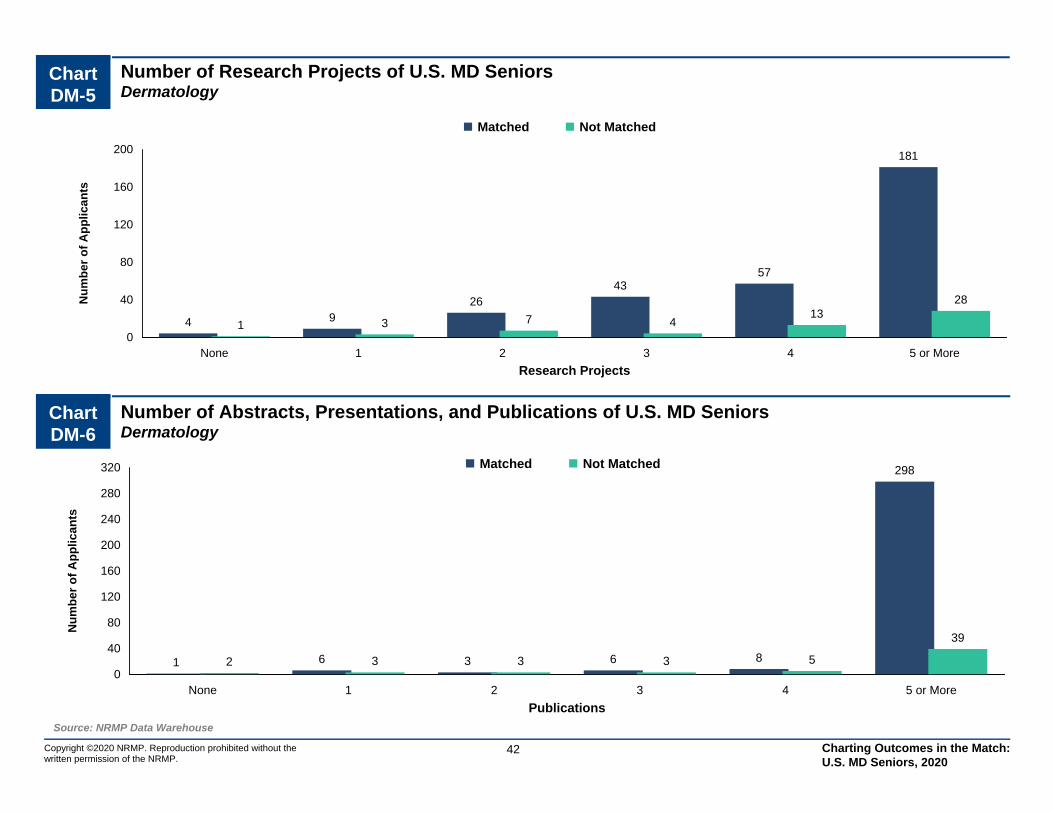
tsChart DM-5
Number of Research Projects of U.S. MD SeniorsDermatology
Source: NRMP Data Warehouse
42Copyright ©2020 NRMP. Reproduction prohibited without the written permission of the NRMP.
Chart DM-6
Number of Abstracts, Presentations, and Publications of U.S. MD SeniorsDermatology
Charting Outcomes in the Match: U.S. MD Seniors, 2020

0
20
40
60
80
100
120
140
None 1 2 3 4 5 6 7 8 9 10 or More
0 27 9
25 2820 24
33 31
139
0 0 3 2 16 6 6 3 7
22
Matched Not Matched
Volunteer Experiences
Nu
mb
er o
f A
pp
lican
ts
0
20
40
60
80
100
None 1 2 3 4 5 or More
9
5551
65
45
93
39 9 8
14 13
Matched Not Matched
Work Experiences
Nu
mb
er o
f A
pp
lican
tsChart DM-7
Number of Work Experiences of U.S. MD SeniorsDermatology
Source: NRMP Data Warehouse
43Copyright ©2020 NRMP. Reproduction prohibited without the written permission of the NRMP.
Chart DM-8
Number of Volunteer Experiences of U.S. MD SeniorsDermatology
Charting Outcomes in the Match: U.S. MD Seniors, 2020
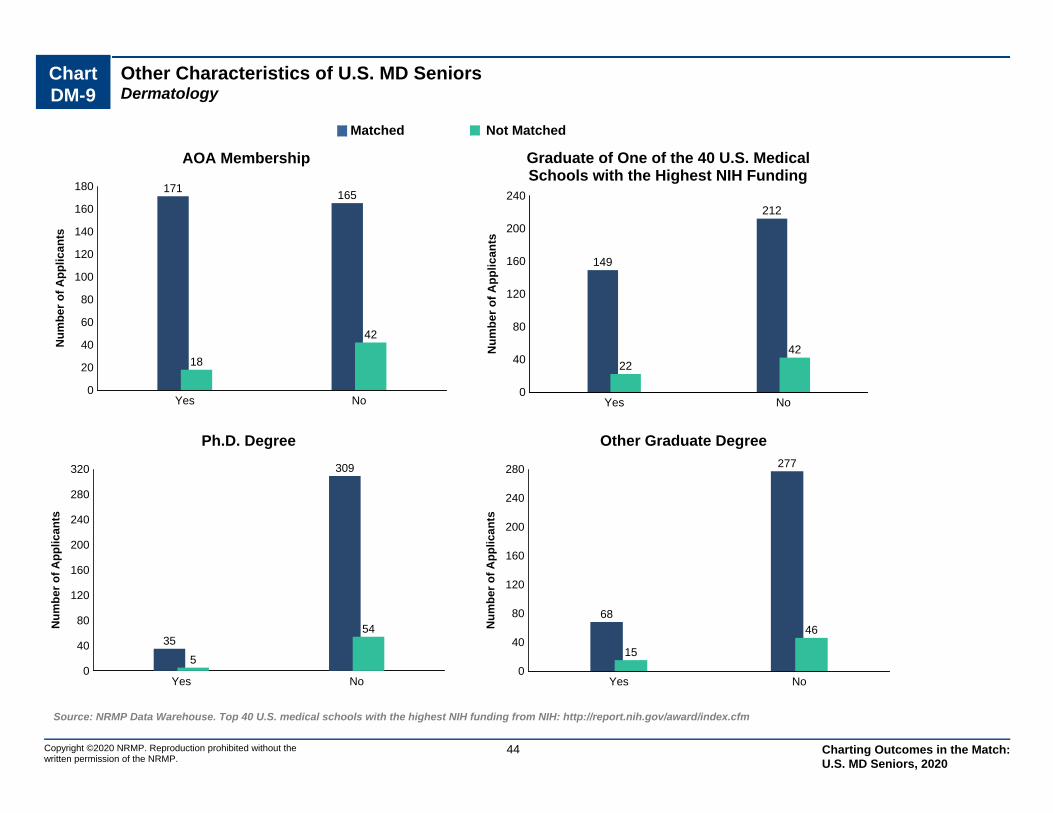
Chart DM-9
Other Characteristics of U.S. MD SeniorsDermatology
Copyright ©2020 NRMP. Reproduction prohibited without the written permission of the NRMP.
Source: NRMP Data Warehouse. Top 40 U.S. medical schools with the highest NIH funding from NIH: http://report.nih.gov/award/index.cfm
44
0
20
40
60
80
100
120
140
160
180
Yes No
171165
18
42
Nu
mb
er
of
Ap
pli
ca
nts
AOA Membership
0
40
80
120
160
200
240
Yes No
149
212
22
42Nu
mb
er o
f A
pp
lican
ts
Graduate of One of the 40 U.S. MedicalSchools with the Highest NIH Funding
0
40
80
120
160
200
240
280
320
Yes No
35
309
5
54Nu
mb
er o
f A
pp
lican
ts
Ph.D. Degree
0
40
80
120
160
200
240
280
Yes No
68
277
15
46Nu
mb
er o
f A
pp
lican
ts
Other Graduate Degree
Matched Not Matched
Charting Outcomes in the Match: U.S. MD Seniors, 2020

DR Diagnostic Radiology
Copyright ©2020 NRMP. Reproduction prohibited without the written permission of the NRMP.
45 Charting Outcomes in the Match: U.S. MD Seniors, 2020
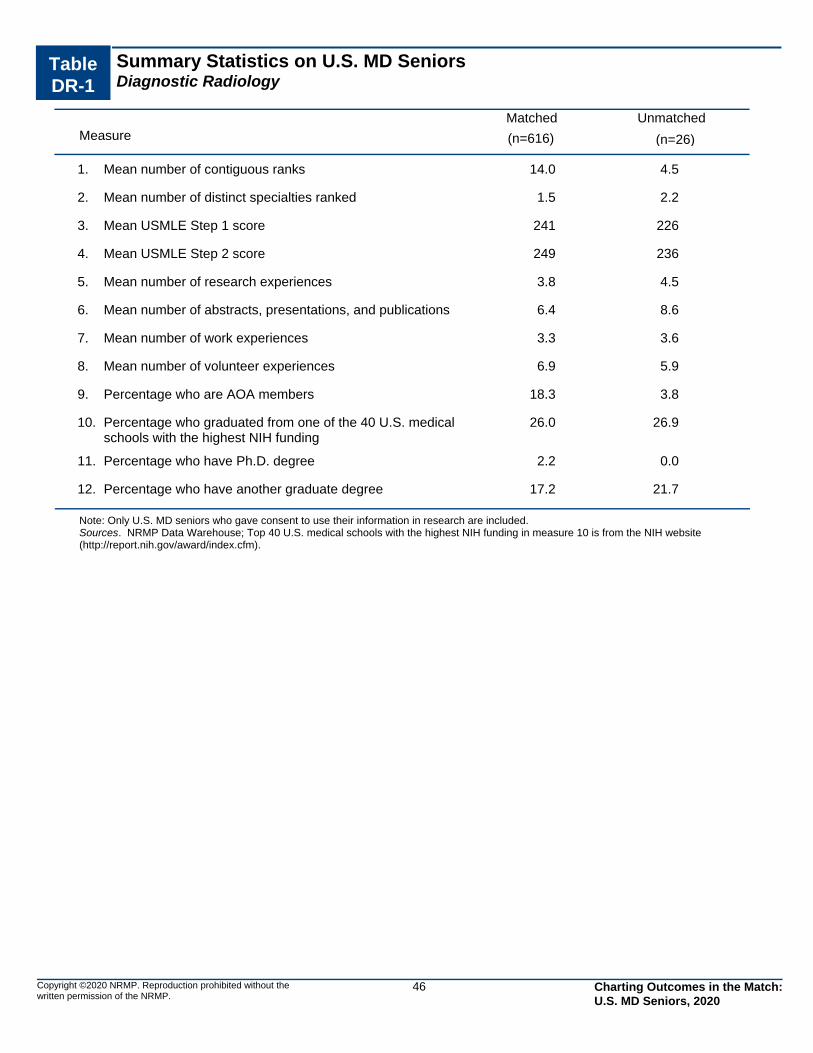
Table DR-1
Summary Statistics on U.S. MD SeniorsDiagnostic Radiology
Measure (n=616) (n=26)
Matched Unmatched
14.0 4.5Mean number of contiguous ranks1.
1.5 2.2Mean number of distinct specialties ranked2.
241 226Mean USMLE Step 1 score3.
249 236Mean USMLE Step 2 score4.
3.8 4.5Mean number of research experiences5.
6.4 8.6Mean number of abstracts, presentations, and publications6.
3.3 3.6Mean number of work experiences7.
6.9 5.9Mean number of volunteer experiences8.
18.3 3.8Percentage who are AOA members9.
26.0 26.9Percentage who graduated from one of the 40 U.S. medical schools with the highest NIH funding
10.
2.2 0.0Percentage who have Ph.D. degree11.
17.2 21.7Percentage who have another graduate degree12.
Note: Only U.S. MD seniors who gave consent to use their information in research are included. Sources. NRMP Data Warehouse; Top 40 U.S. medical schools with the highest NIH funding in measure 10 is from the NIH website (http://report.nih.gov/award/index.cfm).
Copyright ©2020 NRMP. Reproduction prohibited without the written permission of the NRMP.
46 Charting Outcomes in the Match: U.S. MD Seniors, 2020
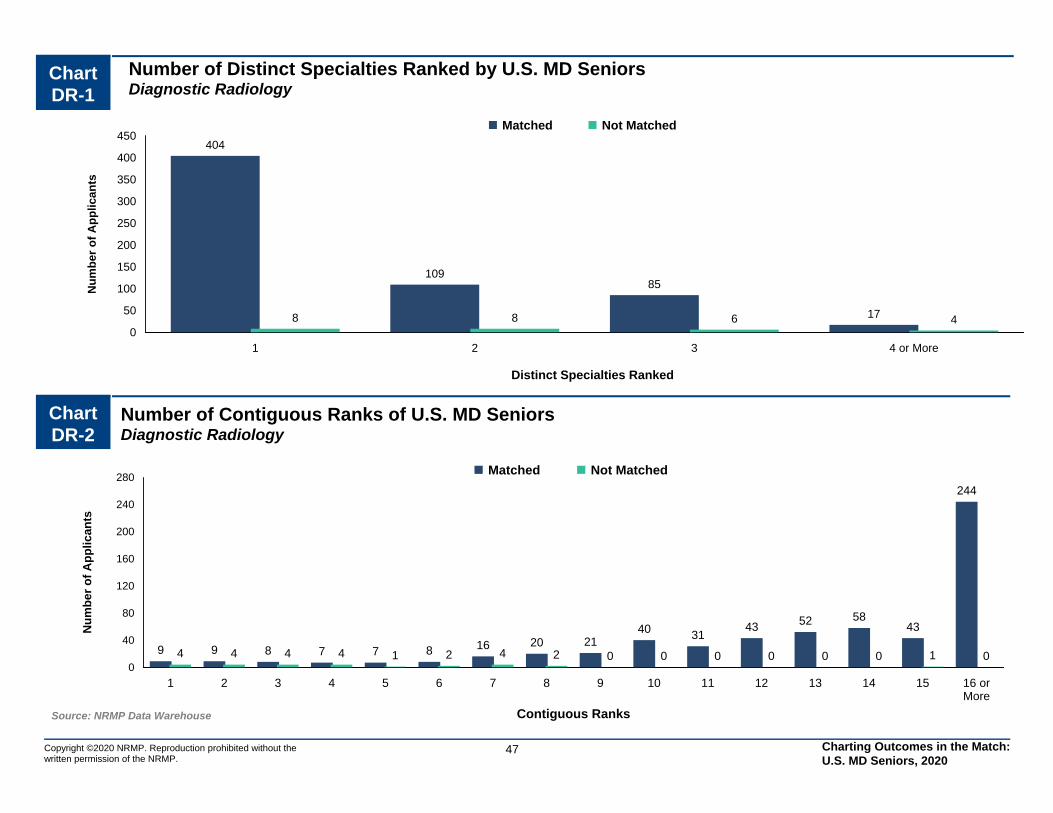
0
50
100
150
200
250
300
350
400
450
1 2 3 4 or More
404
10985
178 8 6 4
Matched Not Matched
Distinct Specialties Ranked
Nu
mb
er o
f A
pp
lican
ts
0
40
80
120
160
200
240
280
1 2 3 4 5 6 7 8 9 10 11 12 13 14 15 16 orMore
9 9 8 7 7 8 16 20 2140 31
43 52 5843
244
4 4 4 4 1 2 4 2 0 0 0 0 0 0 1 0
Matched Not Matched
Contiguous Ranks
Nu
mb
er o
f A
pp
lican
ts
Chart DR-2
Number of Contiguous Ranks of U.S. MD SeniorsDiagnostic Radiology
Source: NRMP Data Warehouse
Copyright ©2020 NRMP. Reproduction prohibited without the written permission of the NRMP.
47
Chart DR-1
Number of Distinct Specialties Ranked by U.S. MD SeniorsDiagnostic Radiology
Charting Outcomes in the Match: U.S. MD Seniors, 2020
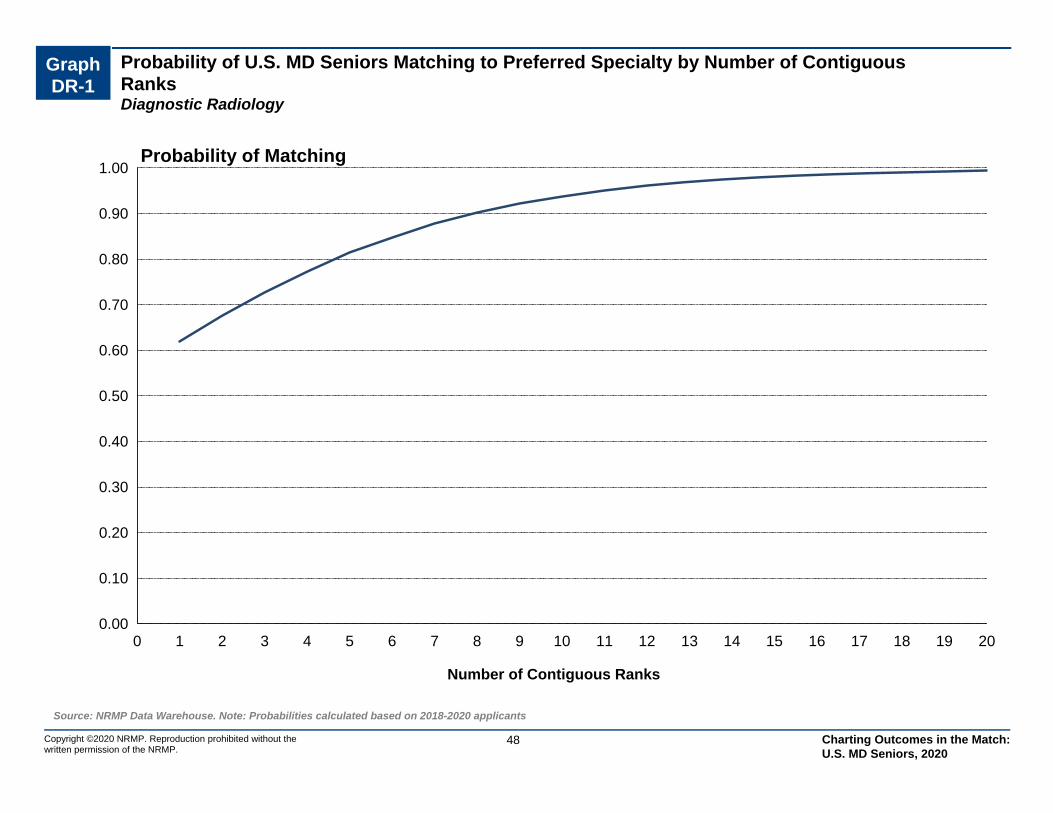
Probability of U.S. MD Seniors Matching to Preferred Specialty by Number of Contiguous RanksDiagnostic Radiology
Graph DR-1
0.00
0.10
0.20
0.30
0.40
0.50
0.60
0.70
0.80
0.90
1.00
0 1 2 3 4 5 6 7 8 9 10 11 12 13 14 15 16 17 18 19 20
Number of Contiguous Ranks
Probability of Matching
Source: NRMP Data Warehouse. Note: Probabilities calculated based on 2018-2020 applicants
48Copyright ©2020 NRMP. Reproduction prohibited without the written permission of the NRMP.
Charting Outcomes in the Match: U.S. MD Seniors, 2020
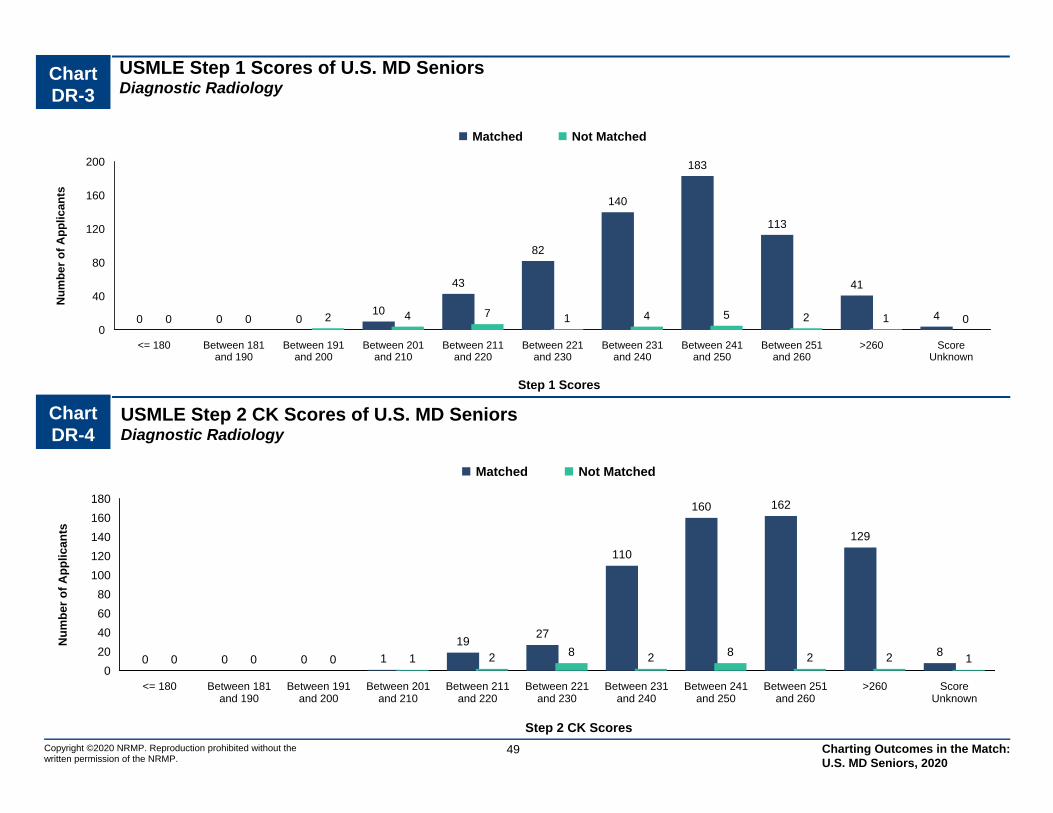
Chart DR-3
USMLE Step 1 Scores of U.S. MD SeniorsDiagnostic Radiology
0
40
80
120
160
200
<= 180 Between 181and 190
Between 191and 200
Between 201and 210
Between 211and 220
Between 221and 230
Between 231and 240
Between 241and 250
Between 251and 260
>260 ScoreUnknown
0 0 010
43
82
140
183
113
41
40 0 2 4 7 1 4 5 2 1 0
Matched Not Matched
Step 1 Scores
Nu
mb
er
of
Ap
pli
ca
nts
Source: NRMP Data Warehouse
49Copyright ©2020 NRMP. Reproduction prohibited without the written permission of the NRMP.
Chart DR-4
USMLE Step 2 CK Scores of U.S. MD SeniorsDiagnostic Radiology
0
20
40
60
80
100
120
140
160
180
<= 180 Between 181and 190
Between 191and 200
Between 201and 210
Between 211and 220
Between 221and 230
Between 231and 240
Between 241and 250
Between 251and 260
>260 ScoreUnknown
0 0 0 1
1927
110
160 162
129
80 0 0 1 2 8 2 8 2 2 1
Matched Not Matched
Step 2 CK Scores
Nu
mb
er o
f A
pp
lican
ts
Charting Outcomes in the Match: U.S. MD Seniors, 2020
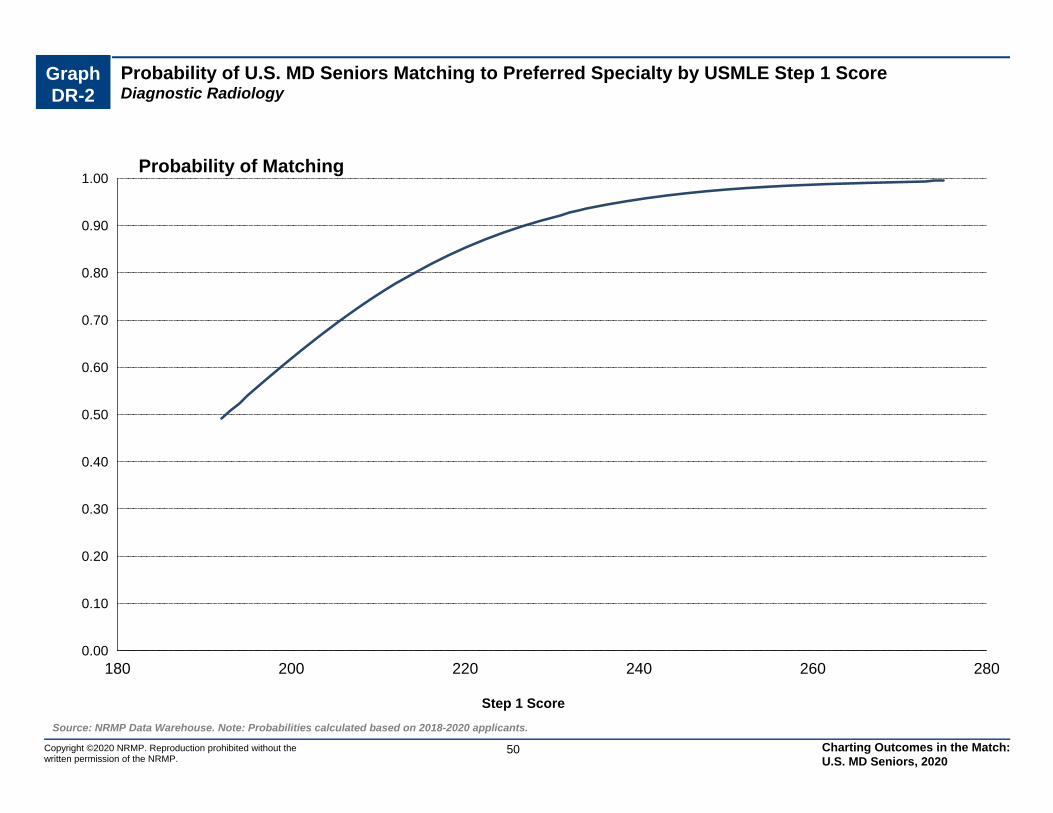
Graph DR-2
Probability of U.S. MD Seniors Matching to Preferred Specialty by USMLE Step 1 ScoreDiagnostic Radiology
0.00
0.10
0.20
0.30
0.40
0.50
0.60
0.70
0.80
0.90
1.00
180 200 220 240 260 280
Step 1 Score
Probability of Matching
Source: NRMP Data Warehouse. Note: Probabilities calculated based on 2018-2020 applicants.
50Copyright ©2020 NRMP. Reproduction prohibited without the written permission of the NRMP.
Charting Outcomes in the Match: U.S. MD Seniors, 2020

0
40
80
120
160
200
240
280
320
None 1 2 3 4 5 or More
41 4859 53
69
282
3 1 1 3 2 12
Matched Not Matched
Publications
Nu
mb
er o
f A
pp
lican
ts
0
20
40
60
80
100
120
140
160
180
None 1 2 3 4 5 or More
9
58
85
120 117
166
0 2 4 3 5 9
Matched Not Matched
Research Projects
Nu
mb
er o
f A
pp
lican
tsChart DR-5
Number of Research Projects of U.S. MD SeniorsDiagnostic Radiology
Source: NRMP Data Warehouse
51Copyright ©2020 NRMP. Reproduction prohibited without the written permission of the NRMP.
Chart DR-6
Number of Abstracts, Presentations, and Publications of U.S. MD SeniorsDiagnostic Radiology
Charting Outcomes in the Match: U.S. MD Seniors, 2020

0
20
40
60
80
100
120
None 1 2 3 4 5 6 7 8 9 10 or More
0
13
45 47
6572
60 57
39 40
112
0 3 0 2 4 3 1 3 1 1 3
Matched Not Matched
Volunteer Experiences
Nu
mb
er o
f A
pp
lican
ts
0
20
40
60
80
100
120
140
None 1 2 3 4 5 or More
30
84
130
102
76
132
3 4 2 3 18
Matched Not Matched
Work Experiences
Nu
mb
er o
f A
pp
lican
tsChart DR-7
Number of Work Experiences of U.S. MD SeniorsDiagnostic Radiology
Source: NRMP Data Warehouse
52Copyright ©2020 NRMP. Reproduction prohibited without the written permission of the NRMP.
Chart DR-8
Number of Volunteer Experiences of U.S. MD SeniorsDiagnostic Radiology
Charting Outcomes in the Match: U.S. MD Seniors, 2020
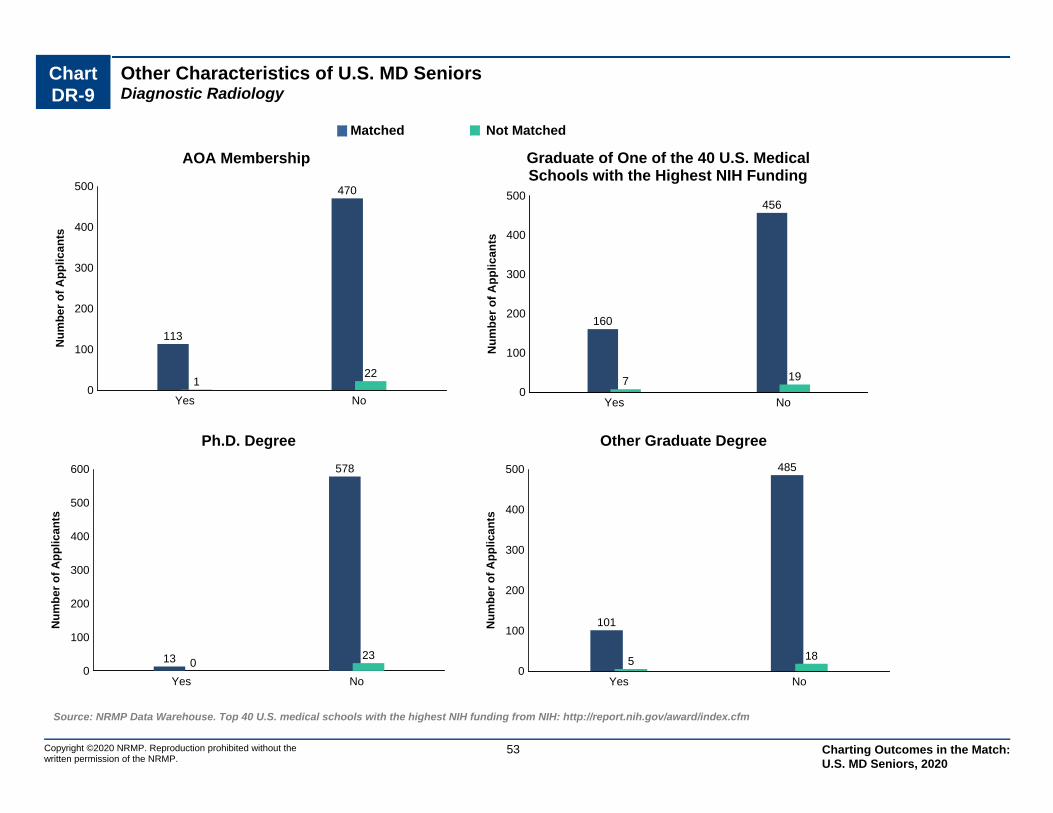
Chart DR-9
Other Characteristics of U.S. MD SeniorsDiagnostic Radiology
Copyright ©2020 NRMP. Reproduction prohibited without the written permission of the NRMP.
Source: NRMP Data Warehouse. Top 40 U.S. medical schools with the highest NIH funding from NIH: http://report.nih.gov/award/index.cfm
53
0
100
200
300
400
500
Yes No
113
470
122
Nu
mb
er
of
Ap
pli
ca
nts
AOA Membership
0
100
200
300
400
500
Yes No
160
456
7 19
Nu
mb
er o
f A
pp
lican
ts
Graduate of One of the 40 U.S. MedicalSchools with the Highest NIH Funding
0
100
200
300
400
500
600
Yes No
13
578
023
Nu
mb
er o
f A
pp
lican
ts
Ph.D. Degree
0
100
200
300
400
500
Yes No
101
485
5 18
Nu
mb
er o
f A
pp
lican
ts
Other Graduate Degree
Matched Not Matched
Charting Outcomes in the Match: U.S. MD Seniors, 2020

EM Emergency Medicine
Copyright ©2020 NRMP. Reproduction prohibited without the written permission of the NRMP.
54 Charting Outcomes in the Match: U.S. MD Seniors, 2020

Table EM-1
Summary Statistics on U.S. MD SeniorsEmergency Medicine
Measure (n=1,598) (n=141)
Matched Unmatched
12.8 6.1Mean number of contiguous ranks1.
1.1 1.4Mean number of distinct specialties ranked2.
233 223Mean USMLE Step 1 score3.
247 235Mean USMLE Step 2 score4.
2.8 2.6Mean number of research experiences5.
4.3 3.7Mean number of abstracts, presentations, and publications6.
3.8 3.3Mean number of work experiences7.
7.8 6.9Mean number of volunteer experiences8.
11.8 2.1Percentage who are AOA members9.
27.7 19.1Percentage who graduated from one of the 40 U.S. medical schools with the highest NIH funding
10.
1.5 0.0Percentage who have Ph.D. degree11.
17.2 22.2Percentage who have another graduate degree12.
Note: Only U.S. MD seniors who gave consent to use their information in research are included. Sources. NRMP Data Warehouse; Top 40 U.S. medical schools with the highest NIH funding in measure 10 is from the NIH website (http://report.nih.gov/award/index.cfm).
Copyright ©2020 NRMP. Reproduction prohibited without the written permission of the NRMP.
55 Charting Outcomes in the Match: U.S. MD Seniors, 2020
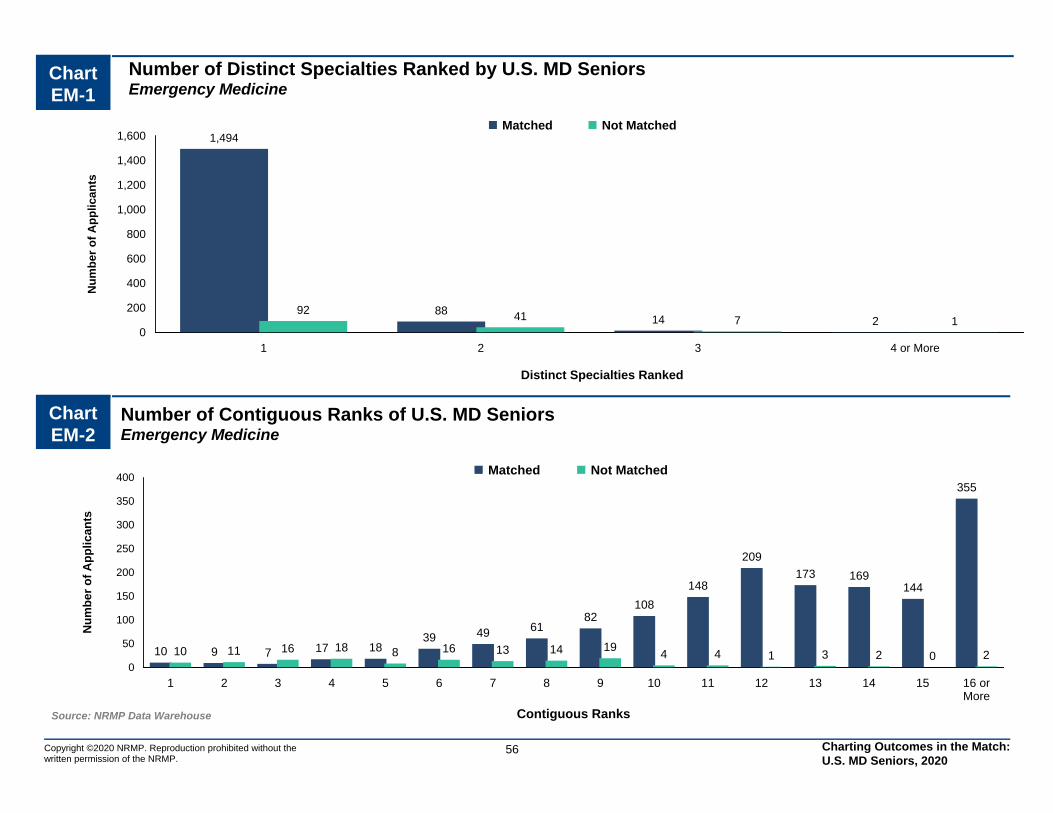
0
200
400
600
800
1,000
1,200
1,400
1,600
1 2 3 4 or More
1,494
8814 2
92 41 7 1
Matched Not Matched
Distinct Specialties Ranked
Nu
mb
er o
f A
pp
lican
ts
0
50
100
150
200
250
300
350
400
1 2 3 4 5 6 7 8 9 10 11 12 13 14 15 16 orMore
10 9 7 17 1839 49 61
82108
148
209
173 169144
355
10 11 16 18 8 16 13 14 194 4 1 3 2 0 2
Matched Not Matched
Contiguous Ranks
Nu
mb
er o
f A
pp
lican
ts
Chart EM-2
Number of Contiguous Ranks of U.S. MD SeniorsEmergency Medicine
Source: NRMP Data Warehouse
Copyright ©2020 NRMP. Reproduction prohibited without the written permission of the NRMP.
56
Chart EM-1
Number of Distinct Specialties Ranked by U.S. MD SeniorsEmergency Medicine
Charting Outcomes in the Match: U.S. MD Seniors, 2020
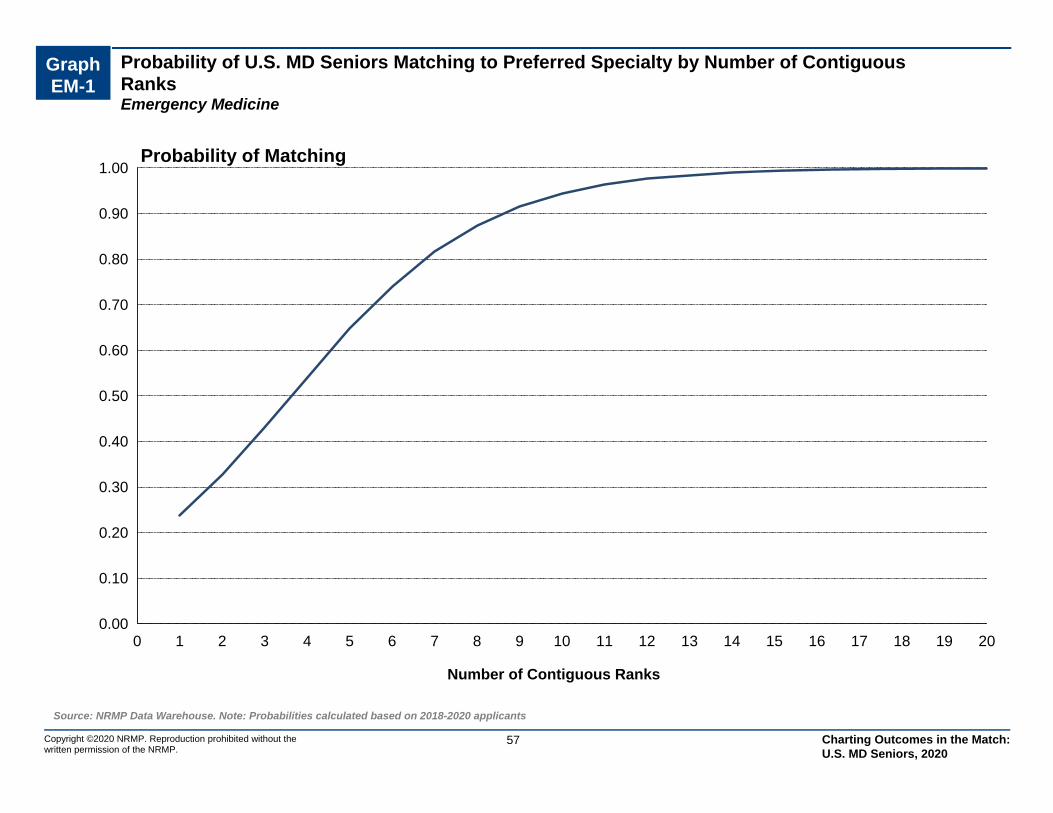
Probability of U.S. MD Seniors Matching to Preferred Specialty by Number of Contiguous RanksEmergency Medicine
Graph EM-1
0.00
0.10
0.20
0.30
0.40
0.50
0.60
0.70
0.80
0.90
1.00
0 1 2 3 4 5 6 7 8 9 10 11 12 13 14 15 16 17 18 19 20
Number of Contiguous Ranks
Probability of Matching
Source: NRMP Data Warehouse. Note: Probabilities calculated based on 2018-2020 applicants
57Copyright ©2020 NRMP. Reproduction prohibited without the written permission of the NRMP.
Charting Outcomes in the Match: U.S. MD Seniors, 2020
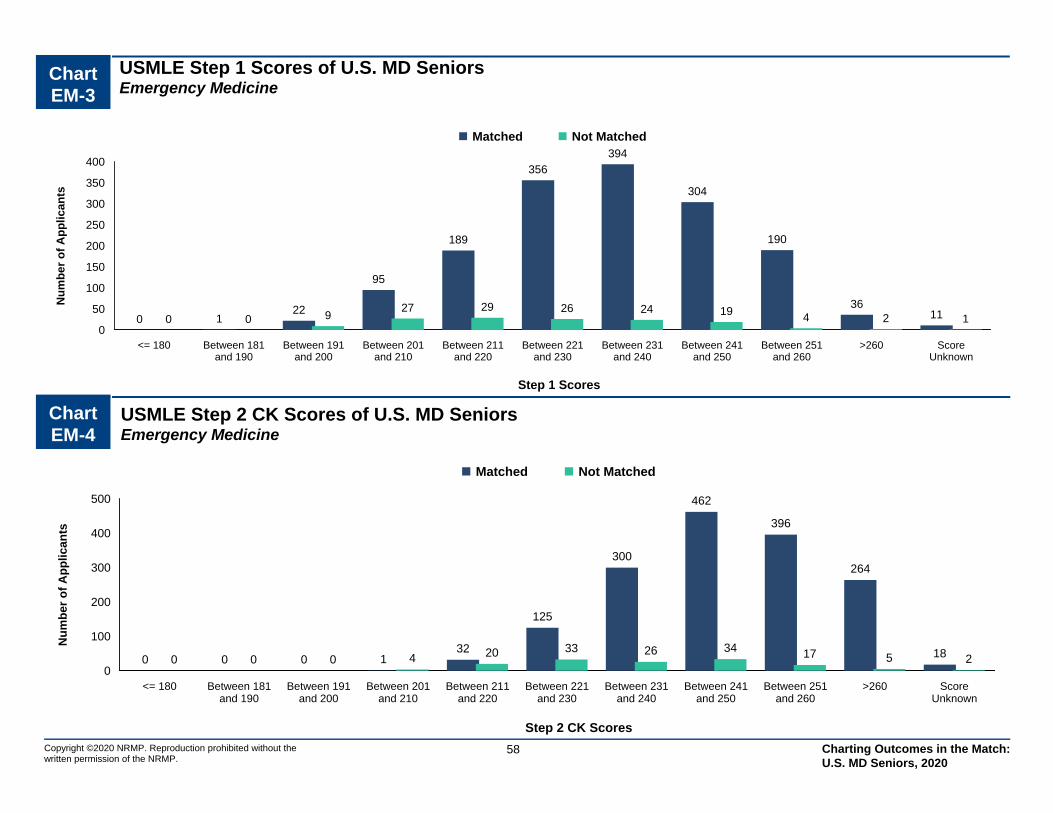
Chart EM-3
USMLE Step 1 Scores of U.S. MD SeniorsEmergency Medicine
0
50
100
150
200
250
300
350
400
<= 180 Between 181and 190
Between 191and 200
Between 201and 210
Between 211and 220
Between 221and 230
Between 231and 240
Between 241and 250
Between 251and 260
>260 ScoreUnknown
0 122
95
189
356
394
304
190
36110 0 9
27 29 26 24 19 4 2 1
Matched Not Matched
Step 1 Scores
Nu
mb
er
of
Ap
pli
ca
nts
Source: NRMP Data Warehouse
58Copyright ©2020 NRMP. Reproduction prohibited without the written permission of the NRMP.
Chart EM-4
USMLE Step 2 CK Scores of U.S. MD SeniorsEmergency Medicine
0
100
200
300
400
500
<= 180 Between 181and 190
Between 191and 200
Between 201and 210
Between 211and 220
Between 221and 230
Between 231and 240
Between 241and 250
Between 251and 260
>260 ScoreUnknown
0 0 0 132
125
300
462
396
264
180 0 0 4 20 33 26 34 17 5 2
Matched Not Matched
Step 2 CK Scores
Nu
mb
er o
f A
pp
lican
ts
Charting Outcomes in the Match: U.S. MD Seniors, 2020

Graph EM-2
Probability of U.S. MD Seniors Matching to Preferred Specialty by USMLE Step 1 ScoreEmergency Medicine
0.00
0.10
0.20
0.30
0.40
0.50
0.60
0.70
0.80
0.90
1.00
180 200 220 240 260 280
Step 1 Score
Probability of Matching
Source: NRMP Data Warehouse. Note: Probabilities calculated based on 2018-2020 applicants.
59Copyright ©2020 NRMP. Reproduction prohibited without the written permission of the NRMP.
Charting Outcomes in the Match: U.S. MD Seniors, 2020
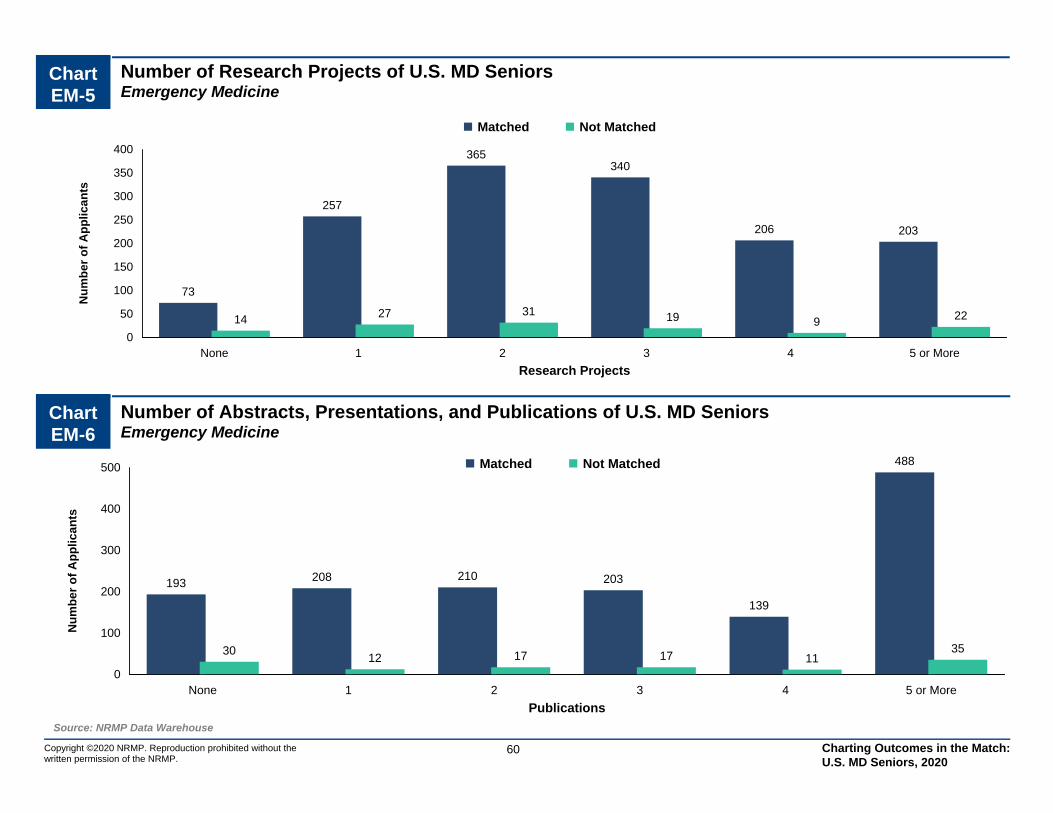
0
100
200
300
400
500
None 1 2 3 4 5 or More
193 208 210 203
139
488
3012 17 17 11
35
Matched Not Matched
Publications
Nu
mb
er o
f A
pp
lican
ts
0
50
100
150
200
250
300
350
400
None 1 2 3 4 5 or More
73
257
365340
206 203
14 27 31 19 9 22
Matched Not Matched
Research Projects
Nu
mb
er o
f A
pp
lican
tsChart EM-5
Number of Research Projects of U.S. MD SeniorsEmergency Medicine
Source: NRMP Data Warehouse
60Copyright ©2020 NRMP. Reproduction prohibited without the written permission of the NRMP.
Chart EM-6
Number of Abstracts, Presentations, and Publications of U.S. MD SeniorsEmergency Medicine
Charting Outcomes in the Match: U.S. MD Seniors, 2020

0
50
100
150
200
250
300
350
400
None 1 2 3 4 5 6 7 8 9 10 or More
3 12
5473
128
176 168152 160
112
394
2 6 7 13 11 13 15 10 14 628
Matched Not Matched
Volunteer Experiences
Nu
mb
er o
f A
pp
lican
ts
0
50
100
150
200
250
300
350
400
450
None 1 2 3 4 5 or More
46
152
258290
246
443
7 20 28 25 15 28
Matched Not Matched
Work Experiences
Nu
mb
er o
f A
pp
lican
tsChart EM-7
Number of Work Experiences of U.S. MD SeniorsEmergency Medicine
Source: NRMP Data Warehouse
61Copyright ©2020 NRMP. Reproduction prohibited without the written permission of the NRMP.
Chart EM-8
Number of Volunteer Experiences of U.S. MD SeniorsEmergency Medicine
Charting Outcomes in the Match: U.S. MD Seniors, 2020
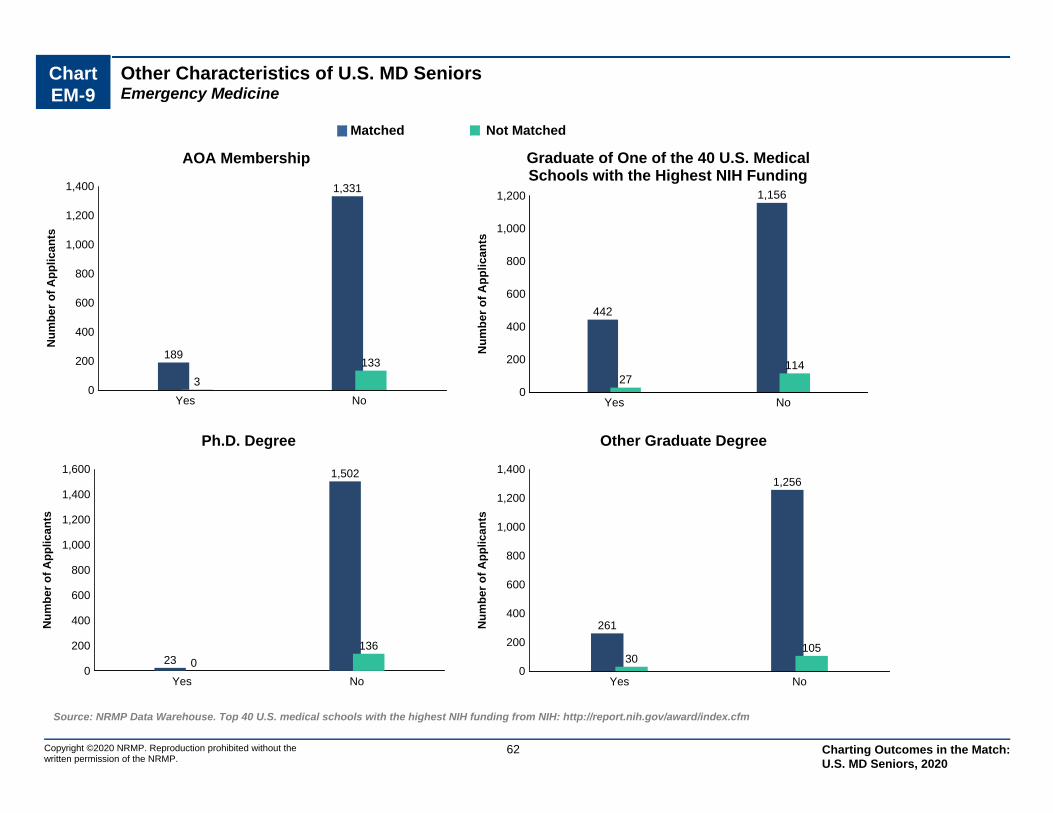
Chart EM-9
Other Characteristics of U.S. MD SeniorsEmergency Medicine
Copyright ©2020 NRMP. Reproduction prohibited without the written permission of the NRMP.
Source: NRMP Data Warehouse. Top 40 U.S. medical schools with the highest NIH funding from NIH: http://report.nih.gov/award/index.cfm
62
0
200
400
600
800
1,000
1,200
1,400
Yes No
189
1,331
3
133
Nu
mb
er
of
Ap
pli
ca
nts
AOA Membership
0
200
400
600
800
1,000
1,200
Yes No
442
1,156
27114
Nu
mb
er o
f A
pp
lican
ts
Graduate of One of the 40 U.S. MedicalSchools with the Highest NIH Funding
0
200
400
600
800
1,000
1,200
1,400
1,600
Yes No
23
1,502
0
136
Nu
mb
er o
f A
pp
lican
ts
Ph.D. Degree
0
200
400
600
800
1,000
1,200
1,400
Yes No
261
1,256
30105
Nu
mb
er o
f A
pp
lican
ts
Other Graduate Degree
Matched Not Matched
Charting Outcomes in the Match: U.S. MD Seniors, 2020

FM Family Medicine
Copyright ©2020 NRMP. Reproduction prohibited without the written permission of the NRMP.
63 Charting Outcomes in the Match: U.S. MD Seniors, 2020

Table FM-1
Summary Statistics on U.S. MD SeniorsFamily Medicine
Measure (n=1,341) (n=44)
Matched Unmatched
12.1 4.8Mean number of contiguous ranks1.
1.1 1.3Mean number of distinct specialties ranked2.
221 209Mean USMLE Step 1 score3.
238 222Mean USMLE Step 2 score4.
2.2 2.1Mean number of research experiences5.
3.3 2.5Mean number of abstracts, presentations, and publications6.
3.5 3.4Mean number of work experiences7.
8.0 5.1Mean number of volunteer experiences8.
6.4 4.5Percentage who are AOA members9.
26.7 15.9Percentage who graduated from one of the 40 U.S. medical schools with the highest NIH funding
10.
0.7 0.0Percentage who have Ph.D. degree11.
17.5 18.4Percentage who have another graduate degree12.
Note: Only U.S. MD seniors who gave consent to use their information in research are included. Sources. NRMP Data Warehouse; Top 40 U.S. medical schools with the highest NIH funding in measure 10 is from the NIH website (http://report.nih.gov/award/index.cfm).
Copyright ©2020 NRMP. Reproduction prohibited without the written permission of the NRMP.
64 Charting Outcomes in the Match: U.S. MD Seniors, 2020
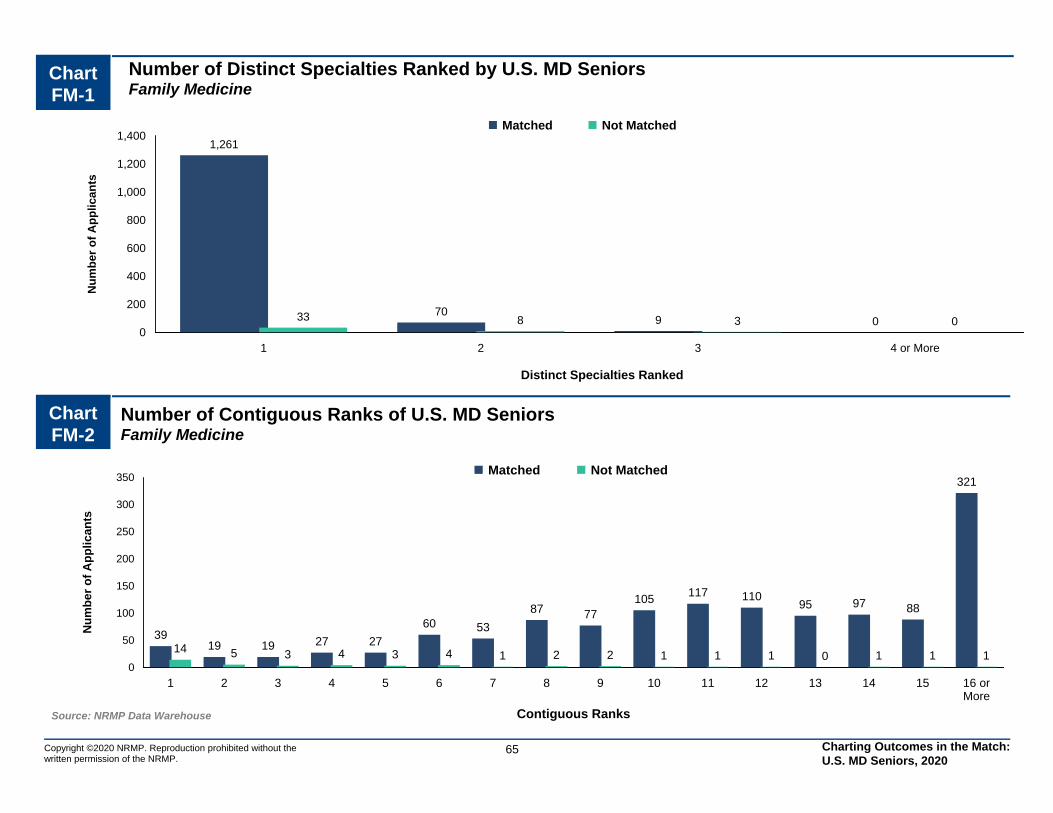
0
200
400
600
800
1,000
1,200
1,400
1 2 3 4 or More
1,261
709 033 8 3 0
Matched Not Matched
Distinct Specialties Ranked
Nu
mb
er o
f A
pp
lican
ts
0
50
100
150
200
250
300
350
1 2 3 4 5 6 7 8 9 10 11 12 13 14 15 16 orMore
3919 19 27 27
60 53
87 77105 117 110
95 97 88
321
14 5 3 4 3 4 1 2 2 1 1 1 0 1 1 1
Matched Not Matched
Contiguous Ranks
Nu
mb
er o
f A
pp
lican
ts
Chart FM-2
Number of Contiguous Ranks of U.S. MD SeniorsFamily Medicine
Source: NRMP Data Warehouse
Copyright ©2020 NRMP. Reproduction prohibited without the written permission of the NRMP.
65
Chart FM-1
Number of Distinct Specialties Ranked by U.S. MD SeniorsFamily Medicine
Charting Outcomes in the Match: U.S. MD Seniors, 2020

Probability of U.S. MD Seniors Matching to Preferred Specialty by Number of Contiguous RanksFamily Medicine
Graph FM-1
0.00
0.10
0.20
0.30
0.40
0.50
0.60
0.70
0.80
0.90
1.00
0 1 2 3 4 5 6 7 8 9 10 11 12 13 14 15 16 17 18 19 20
Number of Contiguous Ranks
Probability of Matching
Source: NRMP Data Warehouse. Note: Probabilities calculated based on 2018-2020 applicants
66Copyright ©2020 NRMP. Reproduction prohibited without the written permission of the NRMP.
Charting Outcomes in the Match: U.S. MD Seniors, 2020
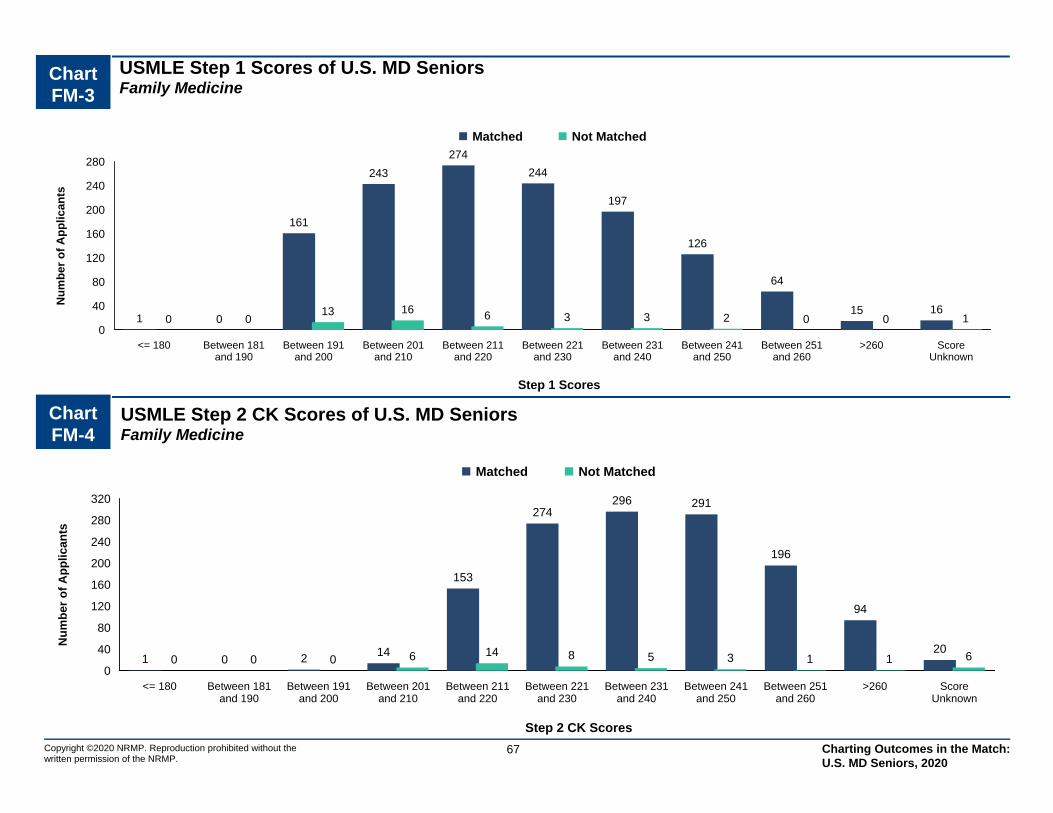
Chart FM-3
USMLE Step 1 Scores of U.S. MD SeniorsFamily Medicine
0
40
80
120
160
200
240
280
<= 180 Between 181and 190
Between 191and 200
Between 201and 210
Between 211and 220
Between 221and 230
Between 231and 240
Between 241and 250
Between 251and 260
>260 ScoreUnknown
1 0
161
243
274
244
197
126
64
15 160 0
13 16 6 3 3 2 0 0 1
Matched Not Matched
Step 1 Scores
Nu
mb
er
of
Ap
pli
ca
nts
Source: NRMP Data Warehouse
67Copyright ©2020 NRMP. Reproduction prohibited without the written permission of the NRMP.
Chart FM-4
USMLE Step 2 CK Scores of U.S. MD SeniorsFamily Medicine
0
40
80
120
160
200
240
280
320
<= 180 Between 181and 190
Between 191and 200
Between 201and 210
Between 211and 220
Between 221and 230
Between 231and 240
Between 241and 250
Between 251and 260
>260 ScoreUnknown
1 0 2 14
153
274296 291
196
94
200 0 0 6 14 8 5 3 1 1 6
Matched Not Matched
Step 2 CK Scores
Nu
mb
er o
f A
pp
lican
ts
Charting Outcomes in the Match: U.S. MD Seniors, 2020

Graph FM-2
Probability of U.S. MD Seniors Matching to Preferred Specialty by USMLE Step 1 ScoreFamily Medicine
0.00
0.10
0.20
0.30
0.40
0.50
0.60
0.70
0.80
0.90
1.00
180 200 220 240 260 280
Step 1 Score
Probability of Matching
Source: NRMP Data Warehouse. Note: Probabilities calculated based on 2018-2020 applicants.
68Copyright ©2020 NRMP. Reproduction prohibited without the written permission of the NRMP.
Charting Outcomes in the Match: U.S. MD Seniors, 2020
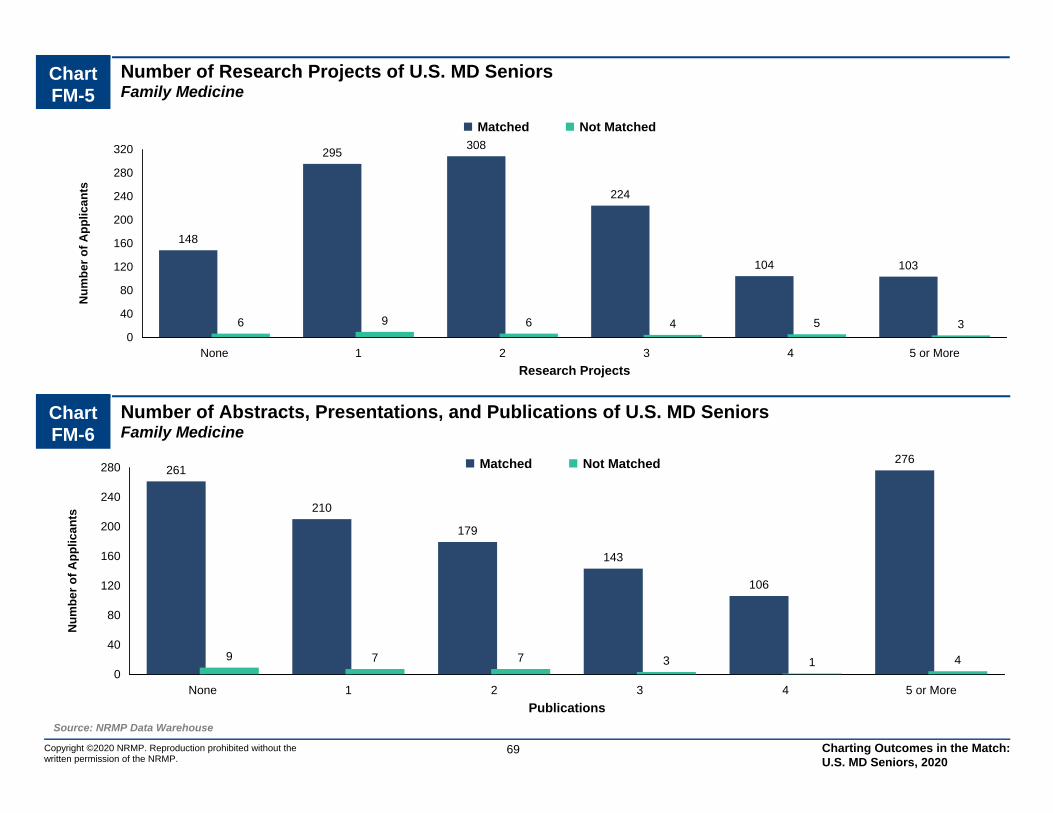
0
40
80
120
160
200
240
280
None 1 2 3 4 5 or More
261
210
179
143
106
276
9 7 7 3 1 4
Matched Not Matched
Publications
Nu
mb
er o
f A
pp
lican
ts
0
40
80
120
160
200
240
280
320
None 1 2 3 4 5 or More
148
295308
224
104 103
6 9 6 4 5 3
Matched Not Matched
Research Projects
Nu
mb
er o
f A
pp
lican
tsChart FM-5
Number of Research Projects of U.S. MD SeniorsFamily Medicine
Source: NRMP Data Warehouse
69Copyright ©2020 NRMP. Reproduction prohibited without the written permission of the NRMP.
Chart FM-6
Number of Abstracts, Presentations, and Publications of U.S. MD SeniorsFamily Medicine
Charting Outcomes in the Match: U.S. MD Seniors, 2020

0
50
100
150
200
250
300
350
400
None 1 2 3 4 5 6 7 8 9 10 or More
519
4170
94
149125 123 117
84
358
2 1 7 2 3 3 2 5 0 2 4
Matched Not Matched
Volunteer Experiences
Nu
mb
er o
f A
pp
lican
ts
0
50
100
150
200
250
300
350
None 1 2 3 4 5 or More
64
165
223 233
172
326
1 8 9 2 3 9
Matched Not Matched
Work Experiences
Nu
mb
er o
f A
pp
lican
tsChart FM-7
Number of Work Experiences of U.S. MD SeniorsFamily Medicine
Source: NRMP Data Warehouse
70Copyright ©2020 NRMP. Reproduction prohibited without the written permission of the NRMP.
Chart FM-8
Number of Volunteer Experiences of U.S. MD SeniorsFamily Medicine
Charting Outcomes in the Match: U.S. MD Seniors, 2020
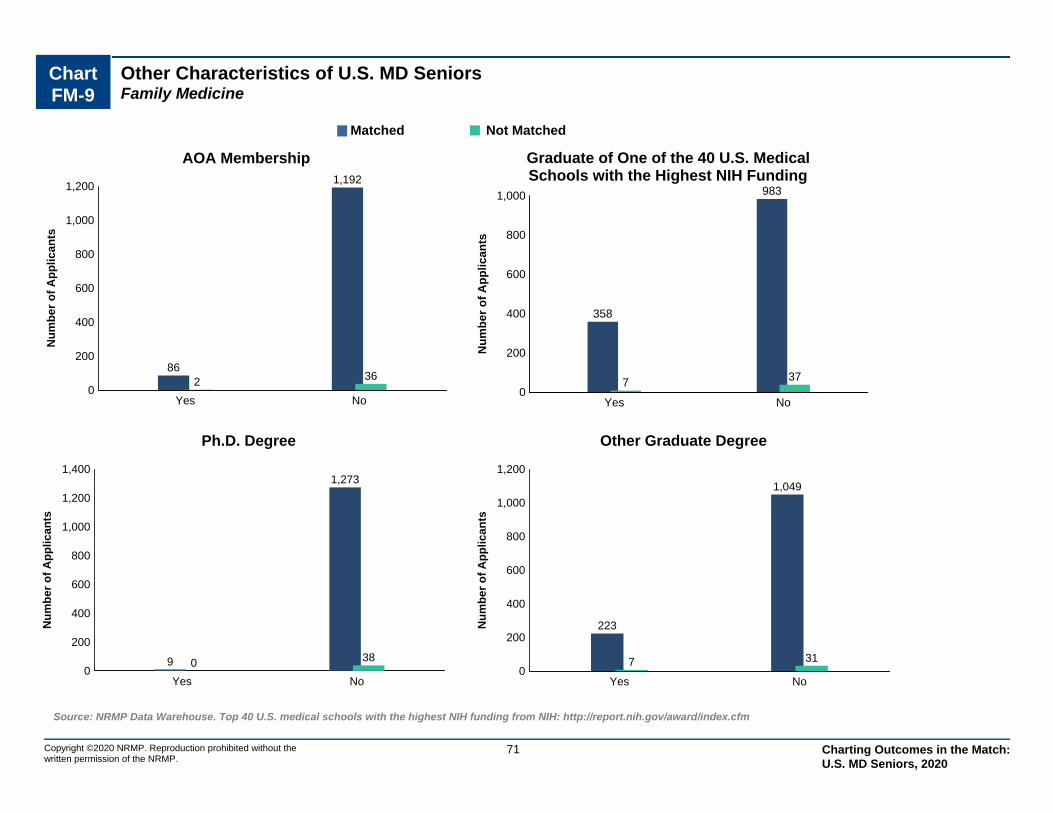
Chart FM-9
Other Characteristics of U.S. MD SeniorsFamily Medicine
Copyright ©2020 NRMP. Reproduction prohibited without the written permission of the NRMP.
Source: NRMP Data Warehouse. Top 40 U.S. medical schools with the highest NIH funding from NIH: http://report.nih.gov/award/index.cfm
71
0
200
400
600
800
1,000
1,200
Yes No
86
1,192
2 36
Nu
mb
er
of
Ap
pli
ca
nts
AOA Membership
0
200
400
600
800
1,000
Yes No
358
983
7 37
Nu
mb
er o
f A
pp
lican
ts
Graduate of One of the 40 U.S. MedicalSchools with the Highest NIH Funding
0
200
400
600
800
1,000
1,200
1,400
Yes No
9
1,273
0 38
Nu
mb
er o
f A
pp
lican
ts
Ph.D. Degree
0
200
400
600
800
1,000
1,200
Yes No
223
1,049
7 31
Nu
mb
er o
f A
pp
lican
ts
Other Graduate Degree
Matched Not Matched
Charting Outcomes in the Match: U.S. MD Seniors, 2020

GS General Surgery
Copyright ©2020 NRMP. Reproduction prohibited without the written permission of the NRMP.
72 Charting Outcomes in the Match: U.S. MD Seniors, 2020

Table GS-1
Summary Statistics on U.S. MD SeniorsGeneral Surgery
Measure (n=939) (n=172)
Matched Unmatched
13.2 6.1Mean number of contiguous ranks1.
1.0 1.1Mean number of distinct specialties ranked2.
237 219Mean USMLE Step 1 score3.
249 234Mean USMLE Step 2 score4.
4.0 3.4Mean number of research experiences5.
7.1 4.8Mean number of abstracts, presentations, and publications6.
3.6 3.6Mean number of work experiences7.
8.3 8.2Mean number of volunteer experiences8.
18.5 1.7Percentage who are AOA members9.
29.9 17.4Percentage who graduated from one of the 40 U.S. medical schools with the highest NIH funding
10.
1.7 1.9Percentage who have Ph.D. degree11.
22.3 24.4Percentage who have another graduate degree12.
Note: Only U.S. MD seniors who gave consent to use their information in research are included. Sources. NRMP Data Warehouse; Top 40 U.S. medical schools with the highest NIH funding in measure 10 is from the NIH website (http://report.nih.gov/award/index.cfm).
Copyright ©2020 NRMP. Reproduction prohibited without the written permission of the NRMP.
73 Charting Outcomes in the Match: U.S. MD Seniors, 2020
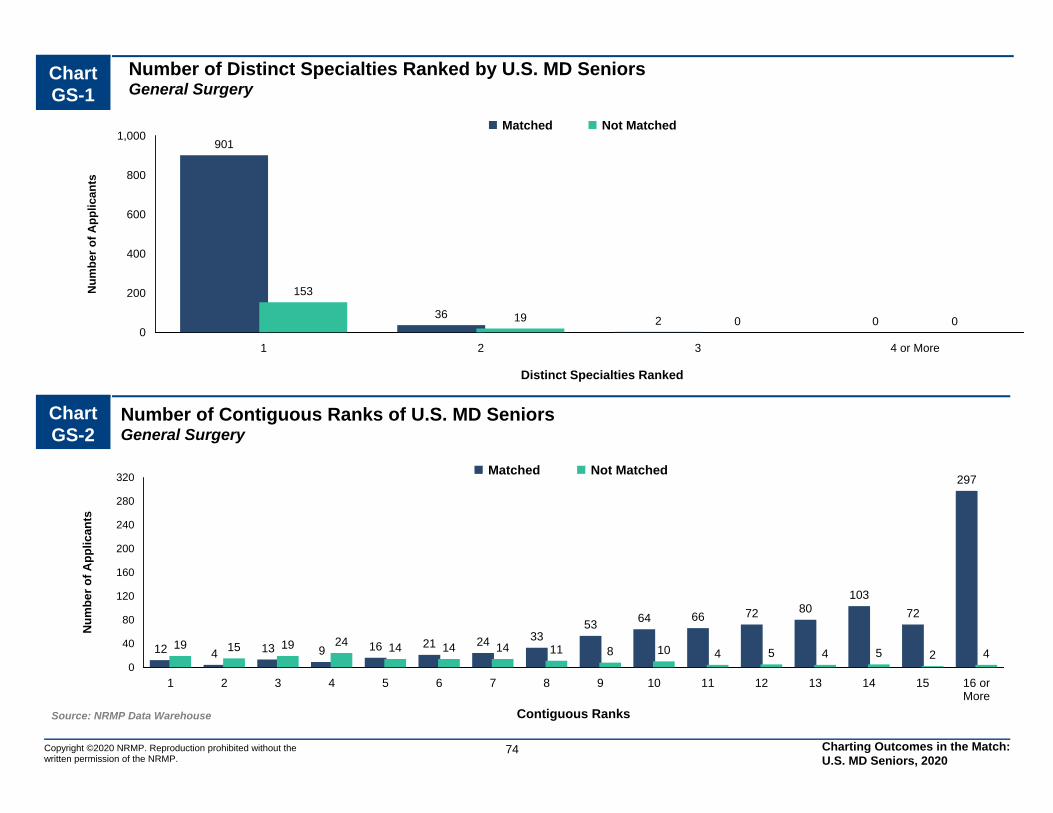
0
200
400
600
800
1,000
1 2 3 4 or More
901
362 0
153
19 0 0
Matched Not Matched
Distinct Specialties Ranked
Nu
mb
er o
f A
pp
lican
ts
0
40
80
120
160
200
240
280
320
1 2 3 4 5 6 7 8 9 10 11 12 13 14 15 16 orMore
12 4 13 9 16 21 24 3353 64 66 72 80
103
72
297
19 15 19 24 14 14 14 11 8 10 4 5 4 5 2 4
Matched Not Matched
Contiguous Ranks
Nu
mb
er o
f A
pp
lican
ts
Chart GS-2
Number of Contiguous Ranks of U.S. MD SeniorsGeneral Surgery
Source: NRMP Data Warehouse
Copyright ©2020 NRMP. Reproduction prohibited without the written permission of the NRMP.
74
Chart GS-1
Number of Distinct Specialties Ranked by U.S. MD SeniorsGeneral Surgery
Charting Outcomes in the Match: U.S. MD Seniors, 2020

Probability of U.S. MD Seniors Matching to Preferred Specialty by Number of Contiguous RanksGeneral Surgery
Graph GS-1
0.00
0.10
0.20
0.30
0.40
0.50
0.60
0.70
0.80
0.90
1.00
0 1 2 3 4 5 6 7 8 9 10 11 12 13 14 15 16 17 18 19 20
Number of Contiguous Ranks
Probability of Matching
Source: NRMP Data Warehouse. Note: Probabilities calculated based on 2018-2020 applicants
75Copyright ©2020 NRMP. Reproduction prohibited without the written permission of the NRMP.
Charting Outcomes in the Match: U.S. MD Seniors, 2020
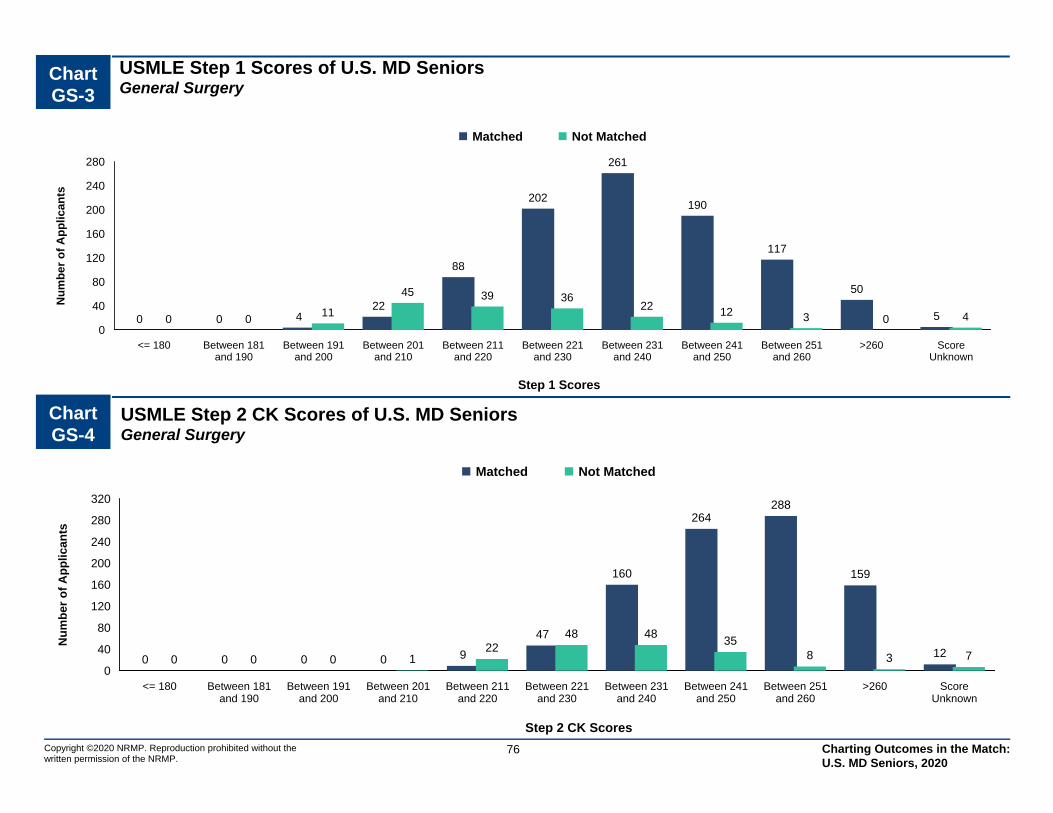
Chart GS-3
USMLE Step 1 Scores of U.S. MD SeniorsGeneral Surgery
0
40
80
120
160
200
240
280
<= 180 Between 181and 190
Between 191and 200
Between 201and 210
Between 211and 220
Between 221and 230
Between 231and 240
Between 241and 250
Between 251and 260
>260 ScoreUnknown
0 0 422
88
202
261
190
117
50
50 011
45 39 3622 12 3 0 4
Matched Not Matched
Step 1 Scores
Nu
mb
er
of
Ap
pli
ca
nts
Source: NRMP Data Warehouse
76Copyright ©2020 NRMP. Reproduction prohibited without the written permission of the NRMP.
Chart GS-4
USMLE Step 2 CK Scores of U.S. MD SeniorsGeneral Surgery
0
40
80
120
160
200
240
280
320
<= 180 Between 181and 190
Between 191and 200
Between 201and 210
Between 211and 220
Between 221and 230
Between 231and 240
Between 241and 250
Between 251and 260
>260 ScoreUnknown
0 0 0 0 9
47
160
264288
159
120 0 0 122
48 4835
8 3 7
Matched Not Matched
Step 2 CK Scores
Nu
mb
er o
f A
pp
lican
ts
Charting Outcomes in the Match: U.S. MD Seniors, 2020
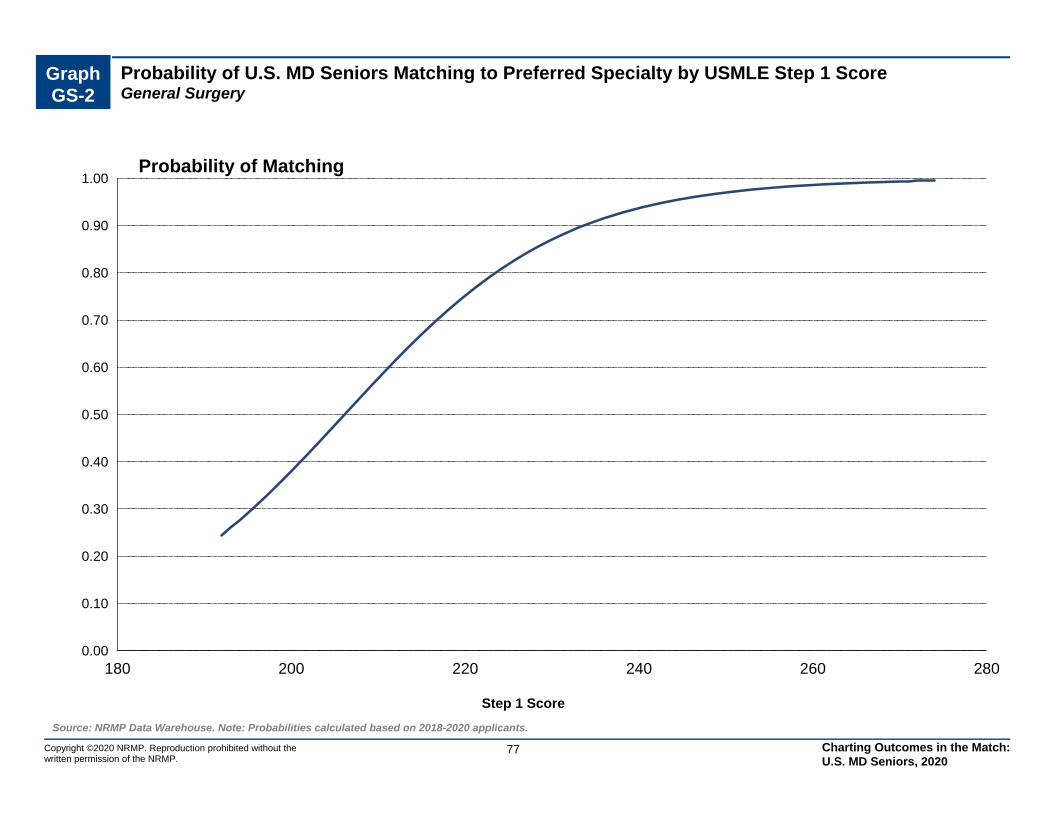
Graph GS-2
Probability of U.S. MD Seniors Matching to Preferred Specialty by USMLE Step 1 ScoreGeneral Surgery
0.00
0.10
0.20
0.30
0.40
0.50
0.60
0.70
0.80
0.90
1.00
180 200 220 240 260 280
Step 1 Score
Probability of Matching
Source: NRMP Data Warehouse. Note: Probabilities calculated based on 2018-2020 applicants.
77Copyright ©2020 NRMP. Reproduction prohibited without the written permission of the NRMP.
Charting Outcomes in the Match: U.S. MD Seniors, 2020

0
100
200
300
400
500
None 1 2 3 4 5 or More
60 5686 96 82
469
15 25 23 17 9
63
Matched Not Matched
Publications
Nu
mb
er o
f A
pp
lican
ts
0
40
80
120
160
200
240
280
320
None 1 2 3 4 5 or More
9
67
149164 170
288
420
34 3523
37
Matched Not Matched
Research Projects
Nu
mb
er o
f A
pp
lican
tsChart GS-5
Number of Research Projects of U.S. MD SeniorsGeneral Surgery
Source: NRMP Data Warehouse
78Copyright ©2020 NRMP. Reproduction prohibited without the written permission of the NRMP.
Chart GS-6
Number of Abstracts, Presentations, and Publications of U.S. MD SeniorsGeneral Surgery
Charting Outcomes in the Match: U.S. MD Seniors, 2020
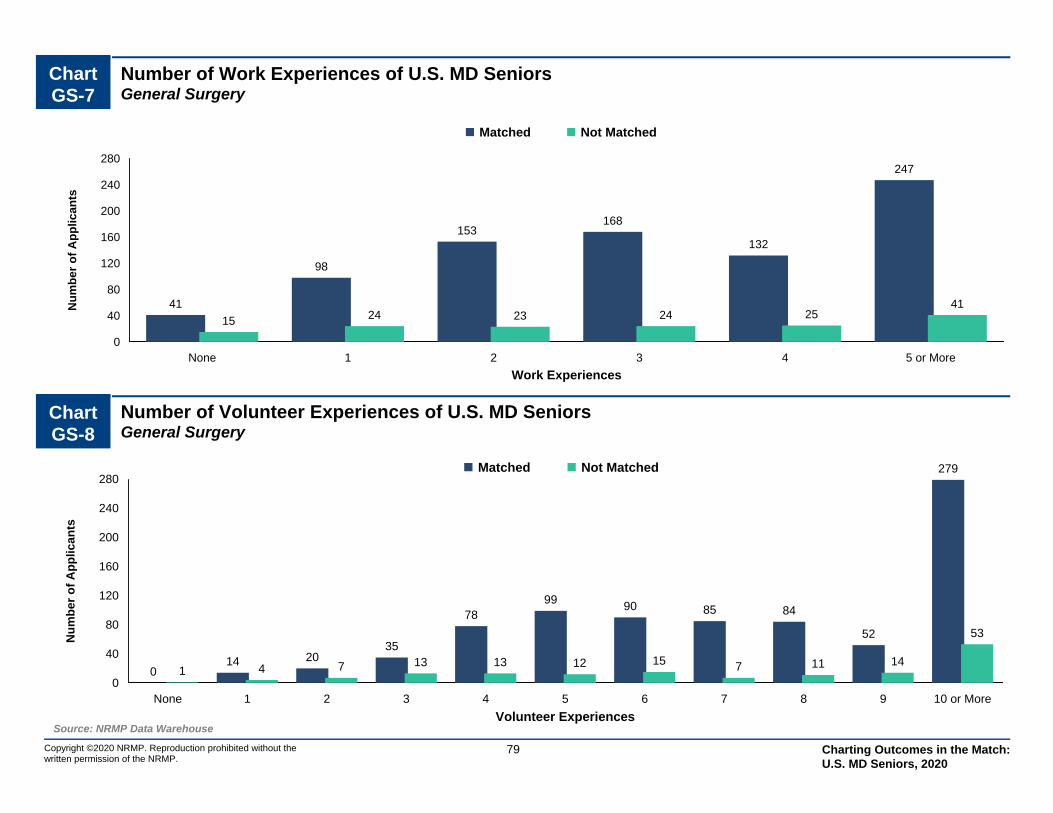
0
40
80
120
160
200
240
280
None 1 2 3 4 5 6 7 8 9 10 or More
014 20
35
7899 90 85 84
52
279
1 4 7 13 13 12 15 7 11 14
53
Matched Not Matched
Volunteer Experiences
Nu
mb
er o
f A
pp
lican
ts
0
40
80
120
160
200
240
280
None 1 2 3 4 5 or More
41
98
153168
132
247
15 24 23 24 2541
Matched Not Matched
Work Experiences
Nu
mb
er o
f A
pp
lican
tsChart GS-7
Number of Work Experiences of U.S. MD SeniorsGeneral Surgery
Source: NRMP Data Warehouse
79Copyright ©2020 NRMP. Reproduction prohibited without the written permission of the NRMP.
Chart GS-8
Number of Volunteer Experiences of U.S. MD SeniorsGeneral Surgery
Charting Outcomes in the Match: U.S. MD Seniors, 2020

Chart GS-9
Other Characteristics of U.S. MD SeniorsGeneral Surgery
Copyright ©2020 NRMP. Reproduction prohibited without the written permission of the NRMP.
Source: NRMP Data Warehouse. Top 40 U.S. medical schools with the highest NIH funding from NIH: http://report.nih.gov/award/index.cfm
80
0
100
200
300
400
500
600
700
800
Yes No
174
722
3
157Nu
mb
er
of
Ap
pli
ca
nts
AOA Membership
0
100
200
300
400
500
600
700
Yes No
281
658
30
142Nu
mb
er o
f A
pp
lican
ts
Graduate of One of the 40 U.S. MedicalSchools with the Highest NIH Funding
0
200
400
600
800
1,000
Yes No
15
888
3
158Nu
mb
er o
f A
pp
lican
ts
Ph.D. Degree
0
100
200
300
400
500
600
700
Yes No
200
697
39
121Nu
mb
er o
f A
pp
lican
ts
Other Graduate Degree
Matched Not Matched
Charting Outcomes in the Match: U.S. MD Seniors, 2020

IM Internal Medicine
Copyright ©2020 NRMP. Reproduction prohibited without the written permission of the NRMP.
81 Charting Outcomes in the Match: U.S. MD Seniors, 2020
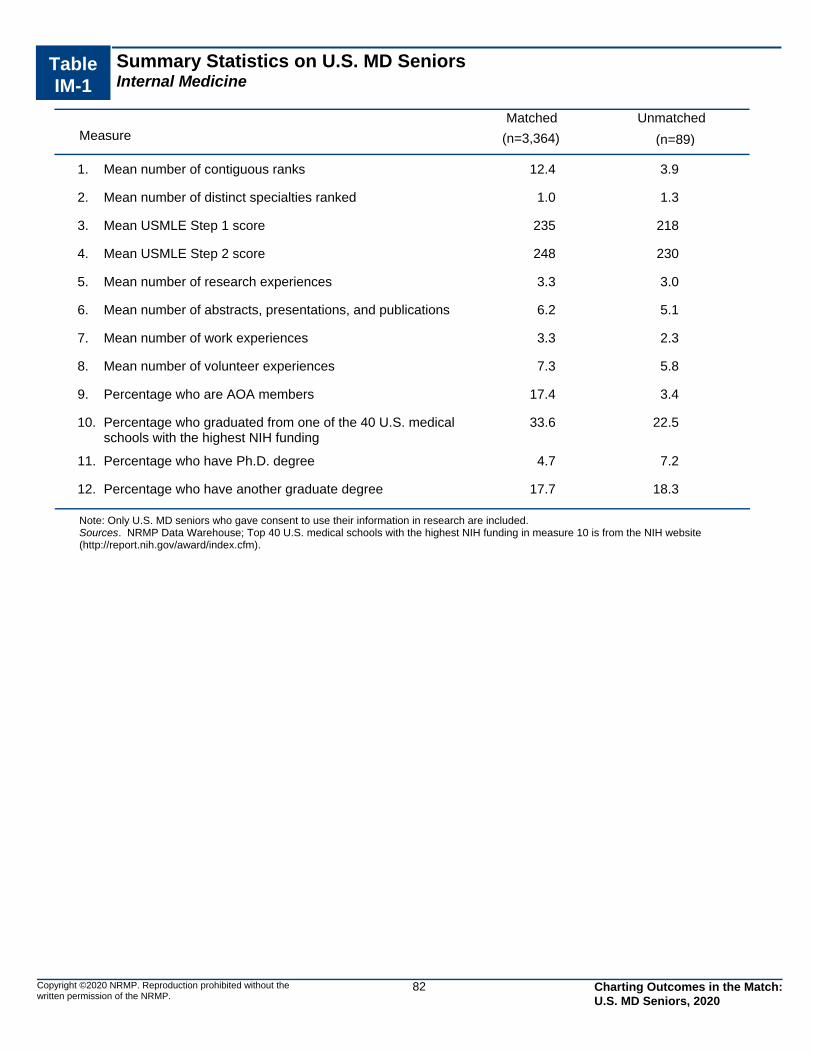
Table IM-1
Summary Statistics on U.S. MD SeniorsInternal Medicine
Measure (n=3,364) (n=89)
Matched Unmatched
12.4 3.9Mean number of contiguous ranks1.
1.0 1.3Mean number of distinct specialties ranked2.
235 218Mean USMLE Step 1 score3.
248 230Mean USMLE Step 2 score4.
3.3 3.0Mean number of research experiences5.
6.2 5.1Mean number of abstracts, presentations, and publications6.
3.3 2.3Mean number of work experiences7.
7.3 5.8Mean number of volunteer experiences8.
17.4 3.4Percentage who are AOA members9.
33.6 22.5Percentage who graduated from one of the 40 U.S. medical schools with the highest NIH funding
10.
4.7 7.2Percentage who have Ph.D. degree11.
17.7 18.3Percentage who have another graduate degree12.
Note: Only U.S. MD seniors who gave consent to use their information in research are included. Sources. NRMP Data Warehouse; Top 40 U.S. medical schools with the highest NIH funding in measure 10 is from the NIH website (http://report.nih.gov/award/index.cfm).
Copyright ©2020 NRMP. Reproduction prohibited without the written permission of the NRMP.
82 Charting Outcomes in the Match: U.S. MD Seniors, 2020
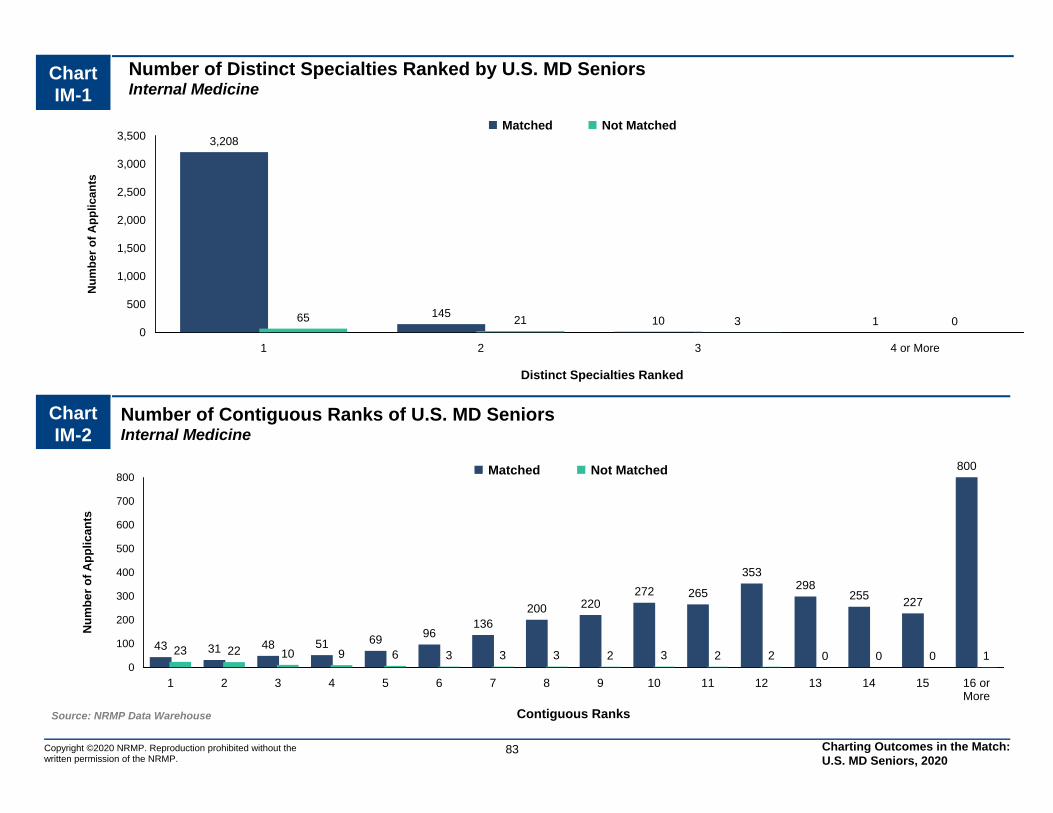
0
500
1,000
1,500
2,000
2,500
3,000
3,500
1 2 3 4 or More
3,208
14510 165 21 3 0
Matched Not Matched
Distinct Specialties Ranked
Nu
mb
er o
f A
pp
lican
ts
0
100
200
300
400
500
600
700
800
1 2 3 4 5 6 7 8 9 10 11 12 13 14 15 16 orMore
43 31 48 51 69 96136
200 220272 265
353298
255227
800
23 22 10 9 6 3 3 3 2 3 2 2 0 0 0 1
Matched Not Matched
Contiguous Ranks
Nu
mb
er o
f A
pp
lican
ts
Chart IM-2
Number of Contiguous Ranks of U.S. MD SeniorsInternal Medicine
Source: NRMP Data Warehouse
Copyright ©2020 NRMP. Reproduction prohibited without the written permission of the NRMP.
83
Chart IM-1
Number of Distinct Specialties Ranked by U.S. MD SeniorsInternal Medicine
Charting Outcomes in the Match: U.S. MD Seniors, 2020

Probability of U.S. MD Seniors Matching to Preferred Specialty by Number of Contiguous RanksInternal Medicine
Graph IM-1
0.00
0.10
0.20
0.30
0.40
0.50
0.60
0.70
0.80
0.90
1.00
0 1 2 3 4 5 6 7 8 9 10 11 12 13 14 15 16 17 18 19 20
Number of Contiguous Ranks
Probability of Matching
Source: NRMP Data Warehouse. Note: Probabilities calculated based on 2018-2020 applicants
84Copyright ©2020 NRMP. Reproduction prohibited without the written permission of the NRMP.
Charting Outcomes in the Match: U.S. MD Seniors, 2020
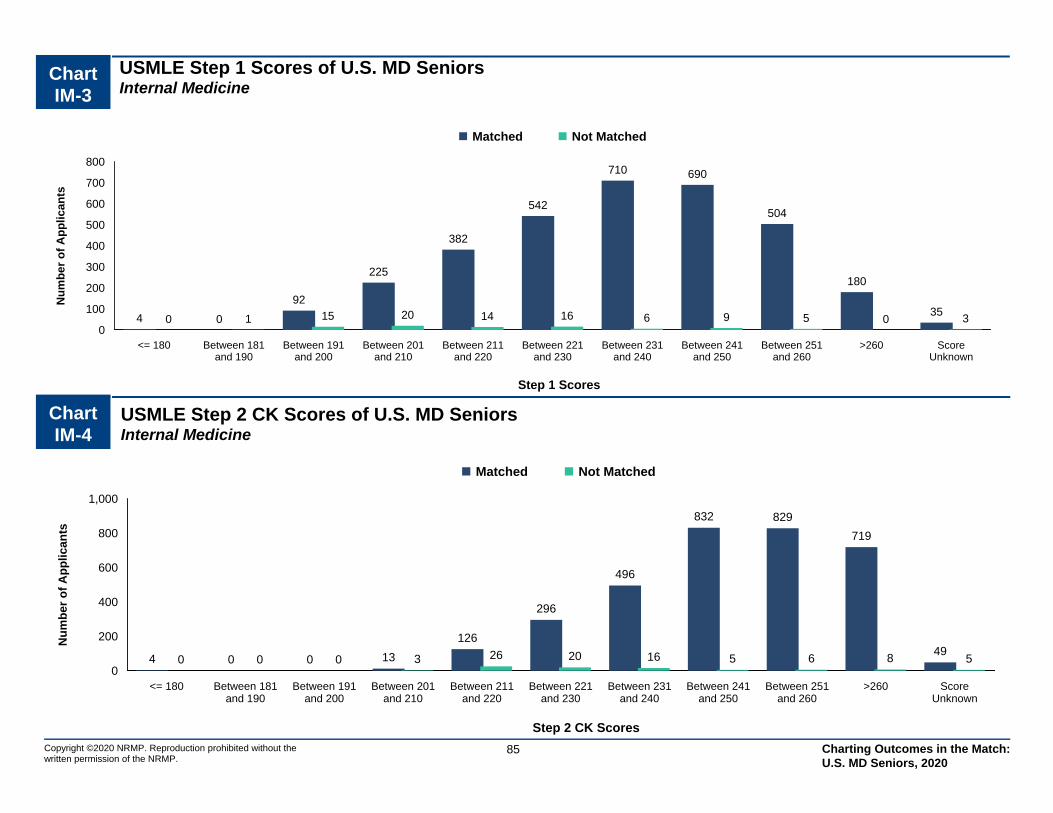
Chart IM-3
USMLE Step 1 Scores of U.S. MD SeniorsInternal Medicine
0
100
200
300
400
500
600
700
800
<= 180 Between 181and 190
Between 191and 200
Between 201and 210
Between 211and 220
Between 221and 230
Between 231and 240
Between 241and 250
Between 251and 260
>260 ScoreUnknown
4 0
92
225
382
542
710 690
504
180
350 1 15 20 14 16 6 9 5 0 3
Matched Not Matched
Step 1 Scores
Nu
mb
er
of
Ap
pli
ca
nts
Source: NRMP Data Warehouse
85Copyright ©2020 NRMP. Reproduction prohibited without the written permission of the NRMP.
Chart IM-4
USMLE Step 2 CK Scores of U.S. MD SeniorsInternal Medicine
0
200
400
600
800
1,000
<= 180 Between 181and 190
Between 191and 200
Between 201and 210
Between 211and 220
Between 221and 230
Between 231and 240
Between 241and 250
Between 251and 260
>260 ScoreUnknown
4 0 0 13
126
296
496
832 829
719
490 0 0 3 26 20 16 5 6 8 5
Matched Not Matched
Step 2 CK Scores
Nu
mb
er o
f A
pp
lican
ts
Charting Outcomes in the Match: U.S. MD Seniors, 2020

Graph IM-2
Probability of U.S. MD Seniors Matching to Preferred Specialty by USMLE Step 1 ScoreInternal Medicine
0.00
0.10
0.20
0.30
0.40
0.50
0.60
0.70
0.80
0.90
1.00
140 160 180 200 220 240 260 280
Step 1 Score
Probability of Matching
Source: NRMP Data Warehouse. Note: Probabilities calculated based on 2018-2020 applicants.
86Copyright ©2020 NRMP. Reproduction prohibited without the written permission of the NRMP.
Charting Outcomes in the Match: U.S. MD Seniors, 2020
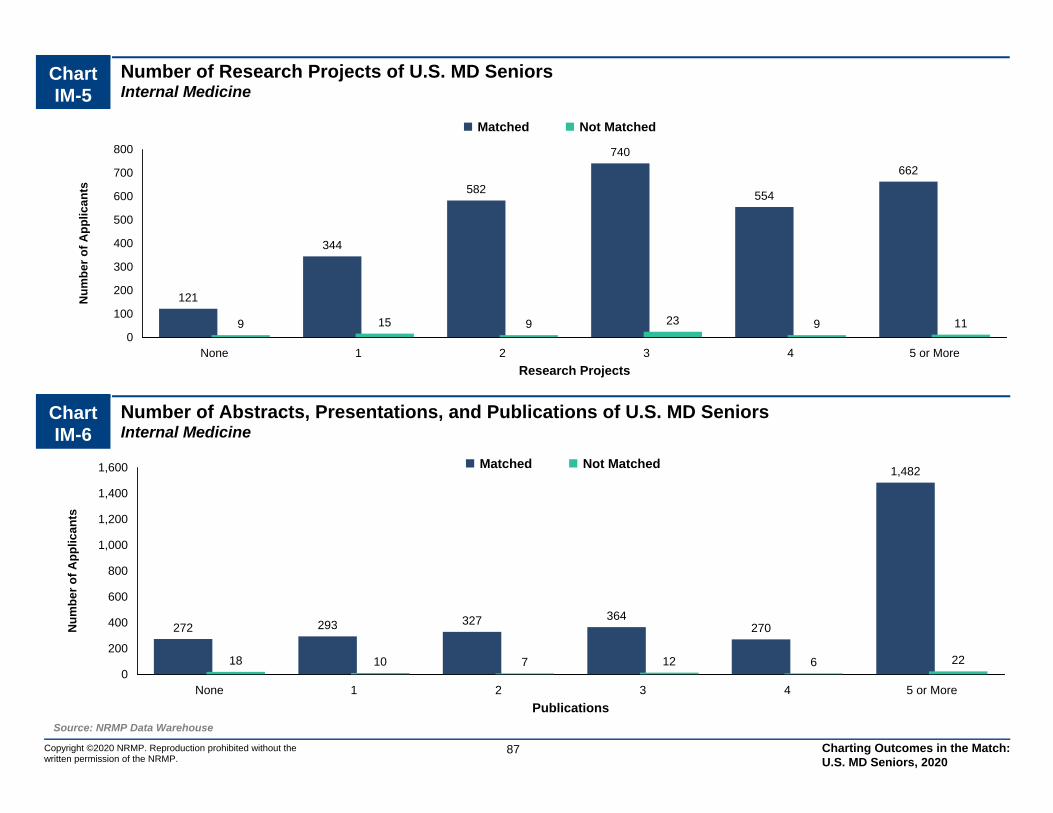
0
200
400
600
800
1,000
1,200
1,400
1,600
None 1 2 3 4 5 or More
272 293 327 364270
1,482
18 10 7 12 6 22
Matched Not Matched
Publications
Nu
mb
er o
f A
pp
lican
ts
0
100
200
300
400
500
600
700
800
None 1 2 3 4 5 or More
121
344
582
740
554
662
9 15 9 23 9 11
Matched Not Matched
Research Projects
Nu
mb
er o
f A
pp
lican
tsChart IM-5
Number of Research Projects of U.S. MD SeniorsInternal Medicine
Source: NRMP Data Warehouse
87Copyright ©2020 NRMP. Reproduction prohibited without the written permission of the NRMP.
Chart IM-6
Number of Abstracts, Presentations, and Publications of U.S. MD SeniorsInternal Medicine
Charting Outcomes in the Match: U.S. MD Seniors, 2020

0
100
200
300
400
500
600
700
None 1 2 3 4 5 6 7 8 9 10 or More
1655
141
239293
385360
292 285
213
700
3 4 12 7 4 10 8 3 8 5 11
Matched Not Matched
Volunteer Experiences
Nu
mb
er o
f A
pp
lican
ts
0
100
200
300
400
500
600
700
None 1 2 3 4 5 or More
203
453
643
579
455
632
12 18 19 15 1 8
Matched Not Matched
Work Experiences
Nu
mb
er o
f A
pp
lican
tsChart IM-7
Number of Work Experiences of U.S. MD SeniorsInternal Medicine
Source: NRMP Data Warehouse
88Copyright ©2020 NRMP. Reproduction prohibited without the written permission of the NRMP.
Chart IM-8
Number of Volunteer Experiences of U.S. MD SeniorsInternal Medicine
Charting Outcomes in the Match: U.S. MD Seniors, 2020

Chart IM-9
Other Characteristics of U.S. MD SeniorsInternal Medicine
Copyright ©2020 NRMP. Reproduction prohibited without the written permission of the NRMP.
Source: NRMP Data Warehouse. Top 40 U.S. medical schools with the highest NIH funding from NIH: http://report.nih.gov/award/index.cfm
89
0
400
800
1,200
1,600
2,000
2,400
2,800
Yes No
587
2,555
3 80
Nu
mb
er
of
Ap
pli
ca
nts
AOA Membership
0
400
800
1,200
1,600
2,000
2,400
Yes No
1,131
2,233
20 69
Nu
mb
er o
f A
pp
lican
ts
Graduate of One of the 40 U.S. MedicalSchools with the Highest NIH Funding
0
400
800
1,200
1,600
2,000
2,400
2,800
3,200
Yes No
149
3,042
6 77
Nu
mb
er o
f A
pp
lican
ts
Ph.D. Degree
0
400
800
1,200
1,600
2,000
2,400
2,800
Yes No
560
2,602
15 67
Nu
mb
er o
f A
pp
lican
ts
Other Graduate Degree
Matched Not Matched
Charting Outcomes in the Match: U.S. MD Seniors, 2020
IP Internal Medicine/Pediatrics
Copyright ©2020 NRMP. Reproduction prohibited without the written permission of the NRMP.
90 Charting Outcomes in the Match: U.S. MD Seniors, 2020
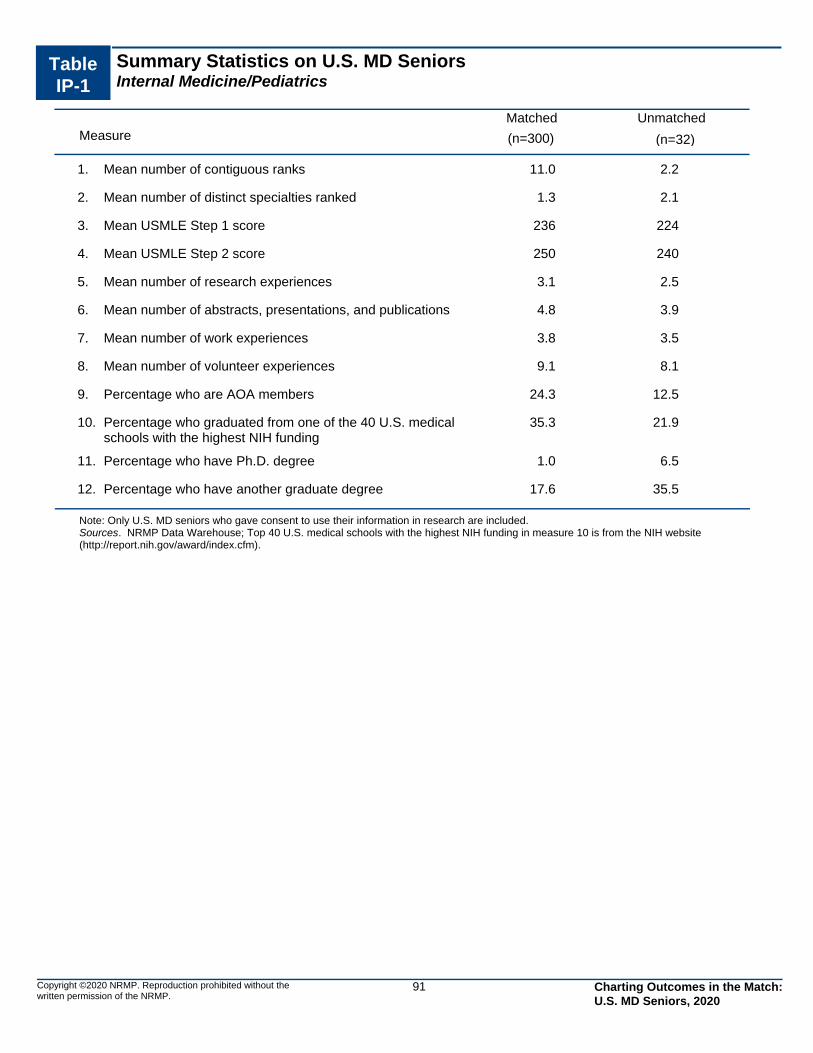
Table IP-1
Summary Statistics on U.S. MD SeniorsInternal Medicine/Pediatrics
Measure (n=300) (n=32)
Matched Unmatched
11.0 2.2Mean number of contiguous ranks1.
1.3 2.1Mean number of distinct specialties ranked2.
236 224Mean USMLE Step 1 score3.
250 240Mean USMLE Step 2 score4.
3.1 2.5Mean number of research experiences5.
4.8 3.9Mean number of abstracts, presentations, and publications6.
3.8 3.5Mean number of work experiences7.
9.1 8.1Mean number of volunteer experiences8.
24.3 12.5Percentage who are AOA members9.
35.3 21.9Percentage who graduated from one of the 40 U.S. medical schools with the highest NIH funding
10.
1.0 6.5Percentage who have Ph.D. degree11.
17.6 35.5Percentage who have another graduate degree12.
Note: Only U.S. MD seniors who gave consent to use their information in research are included. Sources. NRMP Data Warehouse; Top 40 U.S. medical schools with the highest NIH funding in measure 10 is from the NIH website (http://report.nih.gov/award/index.cfm).
Copyright ©2020 NRMP. Reproduction prohibited without the written permission of the NRMP.
91 Charting Outcomes in the Match: U.S. MD Seniors, 2020

0
40
80
120
160
200
240
1 2 3 4 or More
227
68
5 03
236 0
Matched Not Matched
Distinct Specialties Ranked
Nu
mb
er o
f A
pp
lican
ts
0
5
10
15
20
25
30
35
40
1 2 3 4 5 6 7 8 9 10 11 12 13 14 15 16 orMore
14
7 79
64
7
14
18
27
33
37
26
35
23
33
18
3 35
1 1 1 0 0 0 0 0 0 0 0 0
Matched Not Matched
Contiguous Ranks
Nu
mb
er o
f A
pp
lican
ts
Chart IP-2
Number of Contiguous Ranks of U.S. MD SeniorsInternal Medicine/Pediatrics
Source: NRMP Data Warehouse
Copyright ©2020 NRMP. Reproduction prohibited without the written permission of the NRMP.
92
Chart IP-1
Number of Distinct Specialties Ranked by U.S. MD SeniorsInternal Medicine/Pediatrics
Charting Outcomes in the Match: U.S. MD Seniors, 2020
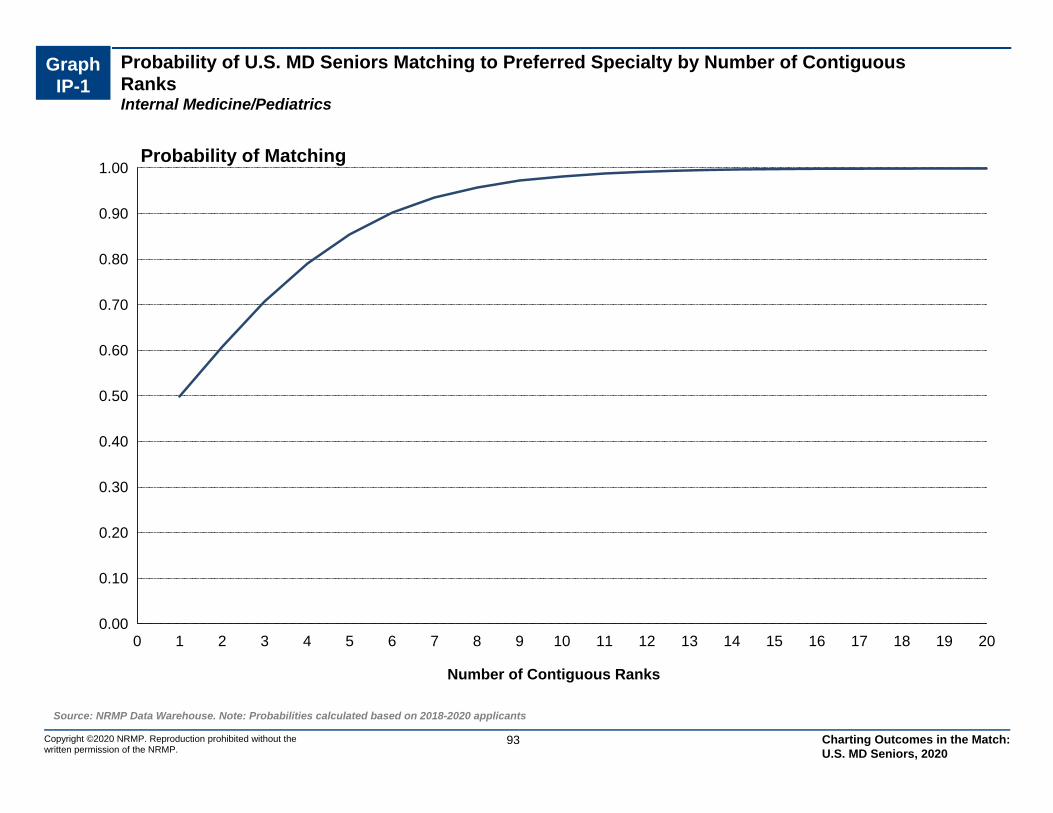
Probability of U.S. MD Seniors Matching to Preferred Specialty by Number of Contiguous RanksInternal Medicine/Pediatrics
Graph IP-1
0.00
0.10
0.20
0.30
0.40
0.50
0.60
0.70
0.80
0.90
1.00
0 1 2 3 4 5 6 7 8 9 10 11 12 13 14 15 16 17 18 19 20
Number of Contiguous Ranks
Probability of Matching
Source: NRMP Data Warehouse. Note: Probabilities calculated based on 2018-2020 applicants
93Copyright ©2020 NRMP. Reproduction prohibited without the written permission of the NRMP.
Charting Outcomes in the Match: U.S. MD Seniors, 2020

Chart IP-3
USMLE Step 1 Scores of U.S. MD SeniorsInternal Medicine/Pediatrics
0
10
20
30
40
50
60
70
80
<= 180 Between 181and 190
Between 191and 200
Between 201and 210
Between 211and 220
Between 221and 230
Between 231and 240
Between 241and 250
Between 251and 260
>260 ScoreUnknown
0 05
11
37
52
7366
43
12
10 04 3
7 7 5 4 2 0 0
Matched Not Matched
Step 1 Scores
Nu
mb
er
of
Ap
pli
ca
nts
Source: NRMP Data Warehouse
94Copyright ©2020 NRMP. Reproduction prohibited without the written permission of the NRMP.
Chart IP-4
USMLE Step 2 CK Scores of U.S. MD SeniorsInternal Medicine/Pediatrics
0
20
40
60
80
100
<= 180 Between 181and 190
Between 191and 200
Between 201and 210
Between 211and 220
Between 221and 230
Between 231and 240
Between 241and 250
Between 251and 260
>260 ScoreUnknown
0 0 0 1 3
14
50
7987
64
20 0 0 2 04
124 7
2 1
Matched Not Matched
Step 2 CK Scores
Nu
mb
er o
f A
pp
lican
ts
Charting Outcomes in the Match: U.S. MD Seniors, 2020

Graph IP-2
Probability of U.S. MD Seniors Matching to Preferred Specialty by USMLE Step 1 ScoreInternal Medicine/Pediatrics
0.00
0.10
0.20
0.30
0.40
0.50
0.60
0.70
0.80
0.90
1.00
190 200 210 220 230 240 250 260 270 280
Step 1 Score
Probability of Matching
Source: NRMP Data Warehouse. Note: Probabilities calculated based on 2018-2020 applicants.
95Copyright ©2020 NRMP. Reproduction prohibited without the written permission of the NRMP.
Charting Outcomes in the Match: U.S. MD Seniors, 2020
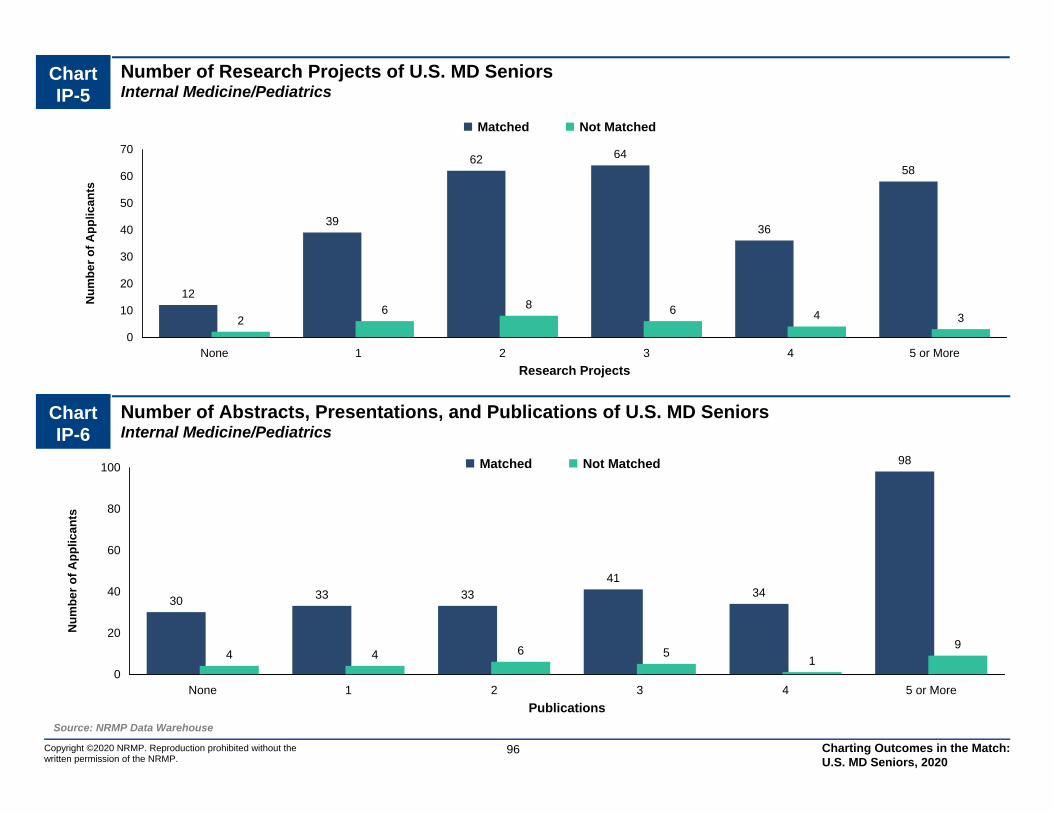
0
20
40
60
80
100
None 1 2 3 4 5 or More
30 33 33
4134
98
4 4 6 51
9
Matched Not Matched
Publications
Nu
mb
er o
f A
pp
lican
ts
0
10
20
30
40
50
60
70
None 1 2 3 4 5 or More
12
39
62 64
36
58
26 8 6 4 3
Matched Not Matched
Research Projects
Nu
mb
er o
f A
pp
lican
tsChart IP-5
Number of Research Projects of U.S. MD SeniorsInternal Medicine/Pediatrics
Source: NRMP Data Warehouse
96Copyright ©2020 NRMP. Reproduction prohibited without the written permission of the NRMP.
Chart IP-6
Number of Abstracts, Presentations, and Publications of U.S. MD SeniorsInternal Medicine/Pediatrics
Charting Outcomes in the Match: U.S. MD Seniors, 2020
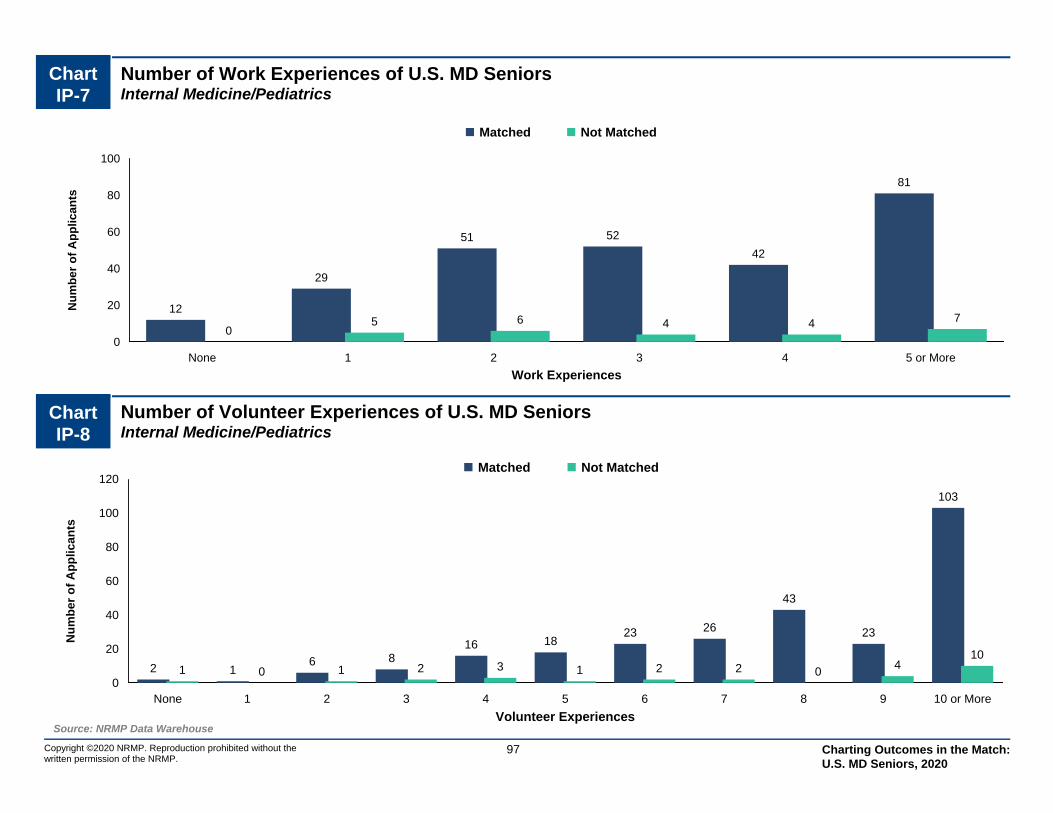
0
20
40
60
80
100
120
None 1 2 3 4 5 6 7 8 9 10 or More
2 16 8
16 1823 26
43
23
103
1 0 1 2 3 1 2 2 04
10
Matched Not Matched
Volunteer Experiences
Nu
mb
er o
f A
pp
lican
ts
0
20
40
60
80
100
None 1 2 3 4 5 or More
12
29
51 52
42
81
05 6 4 4 7
Matched Not Matched
Work Experiences
Nu
mb
er o
f A
pp
lican
tsChart IP-7
Number of Work Experiences of U.S. MD SeniorsInternal Medicine/Pediatrics
Source: NRMP Data Warehouse
97Copyright ©2020 NRMP. Reproduction prohibited without the written permission of the NRMP.
Chart IP-8
Number of Volunteer Experiences of U.S. MD SeniorsInternal Medicine/Pediatrics
Charting Outcomes in the Match: U.S. MD Seniors, 2020

Chart IP-9
Other Characteristics of U.S. MD SeniorsInternal Medicine/Pediatrics
Copyright ©2020 NRMP. Reproduction prohibited without the written permission of the NRMP.
Source: NRMP Data Warehouse. Top 40 U.S. medical schools with the highest NIH funding from NIH: http://report.nih.gov/award/index.cfm
98
0
40
80
120
160
200
240
Yes No
73
216
4
27
Nu
mb
er
of
Ap
pli
ca
nts
AOA Membership
0
40
80
120
160
200
Yes No
106
194
7
25
Nu
mb
er o
f A
pp
lican
ts
Graduate of One of the 40 U.S. MedicalSchools with the Highest NIH Funding
0
40
80
120
160
200
240
280
320
Yes No
3
288
2
29
Nu
mb
er o
f A
pp
lican
ts
Ph.D. Degree
0
40
80
120
160
200
240
Yes No
51
238
1120
Nu
mb
er o
f A
pp
lican
ts
Other Graduate Degree
Matched Not Matched
Charting Outcomes in the Match: U.S. MD Seniors, 2020

IR Interventional Radiology
Copyright ©2020 NRMP. Reproduction prohibited without the written permission of the NRMP.
99 Charting Outcomes in the Match: U.S. MD Seniors, 2020
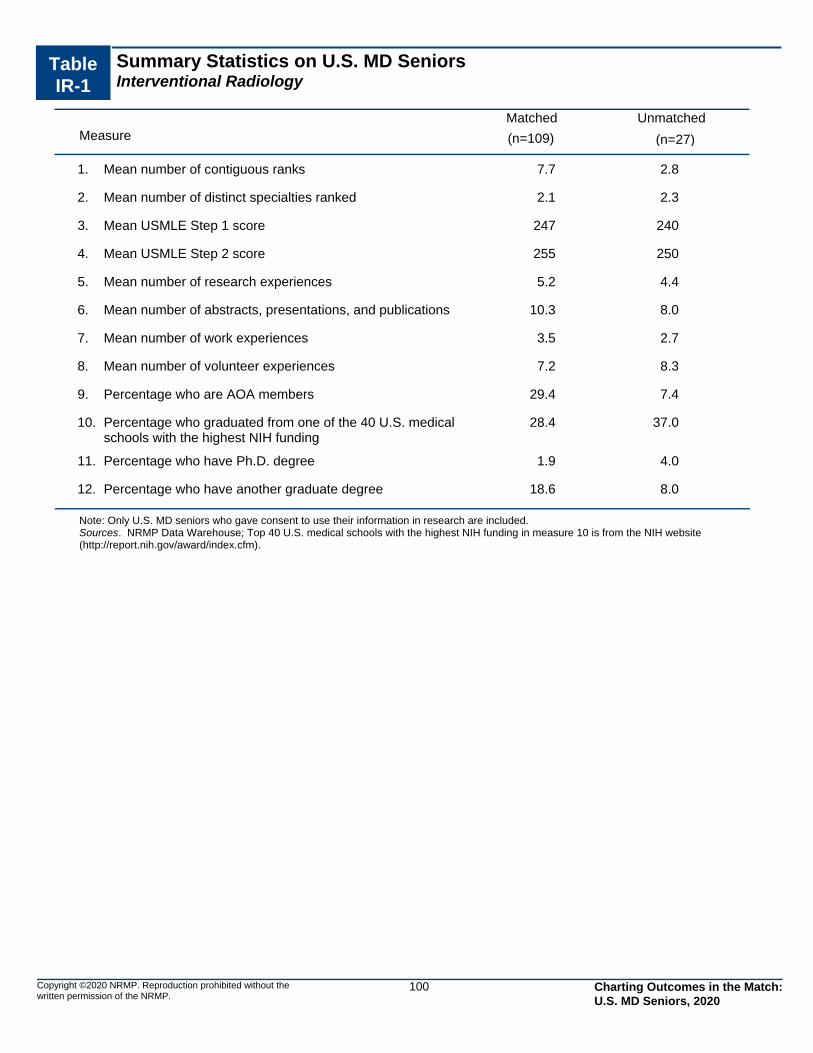
Table IR-1
Summary Statistics on U.S. MD SeniorsInterventional Radiology
Measure (n=109) (n=27)
Matched Unmatched
7.7 2.8Mean number of contiguous ranks1.
2.1 2.3Mean number of distinct specialties ranked2.
247 240Mean USMLE Step 1 score3.
255 250Mean USMLE Step 2 score4.
5.2 4.4Mean number of research experiences5.
10.3 8.0Mean number of abstracts, presentations, and publications6.
3.5 2.7Mean number of work experiences7.
7.2 8.3Mean number of volunteer experiences8.
29.4 7.4Percentage who are AOA members9.
28.4 37.0Percentage who graduated from one of the 40 U.S. medical schools with the highest NIH funding
10.
1.9 4.0Percentage who have Ph.D. degree11.
18.6 8.0Percentage who have another graduate degree12.
Note: Only U.S. MD seniors who gave consent to use their information in research are included. Sources. NRMP Data Warehouse; Top 40 U.S. medical schools with the highest NIH funding in measure 10 is from the NIH website (http://report.nih.gov/award/index.cfm).
Copyright ©2020 NRMP. Reproduction prohibited without the written permission of the NRMP.
100 Charting Outcomes in the Match: U.S. MD Seniors, 2020
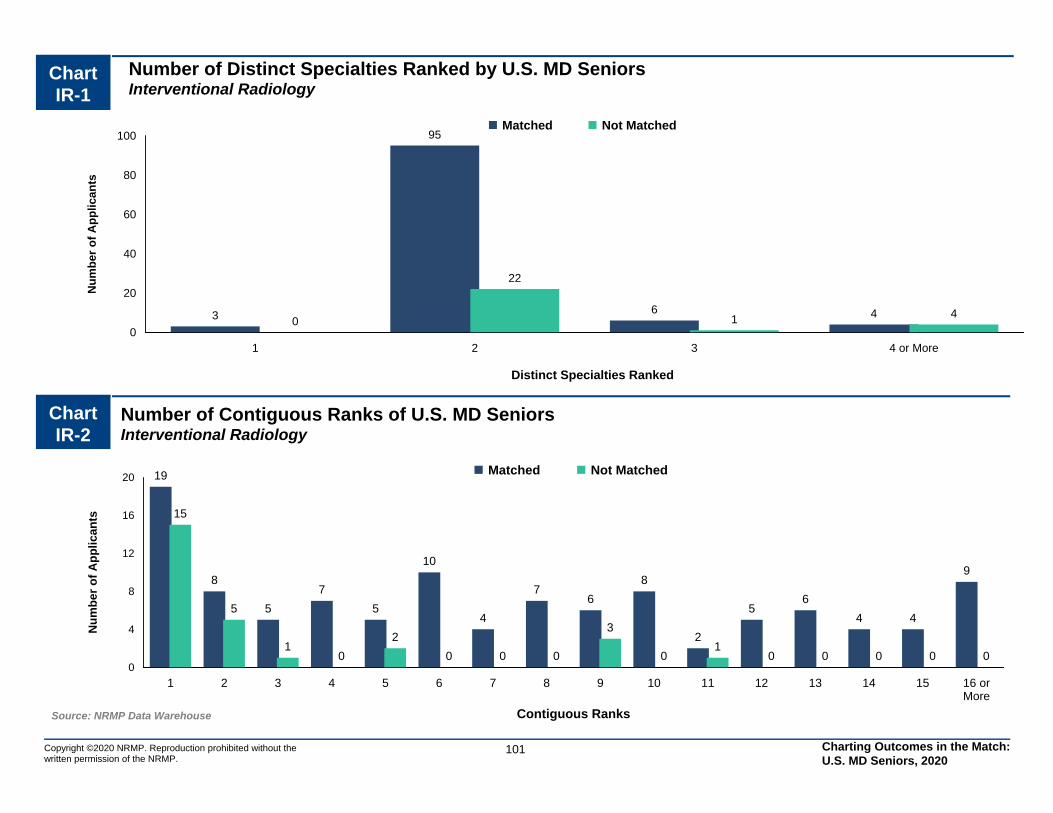
0
20
40
60
80
100
1 2 3 4 or More
3
95
6 40
22
1 4
Matched Not Matched
Distinct Specialties Ranked
Nu
mb
er o
f A
pp
lican
ts
0
4
8
12
16
20
1 2 3 4 5 6 7 8 9 10 11 12 13 14 15 16 orMore
19
8
5
7
5
10
4
76
8
2
56
4 4
9
15
5
10
2
0 0 0
3
01
0 0 0 0 0
Matched Not Matched
Contiguous Ranks
Nu
mb
er o
f A
pp
lican
ts
Chart IR-2
Number of Contiguous Ranks of U.S. MD SeniorsInterventional Radiology
Source: NRMP Data Warehouse
Copyright ©2020 NRMP. Reproduction prohibited without the written permission of the NRMP.
101
Chart IR-1
Number of Distinct Specialties Ranked by U.S. MD SeniorsInterventional Radiology
Charting Outcomes in the Match: U.S. MD Seniors, 2020
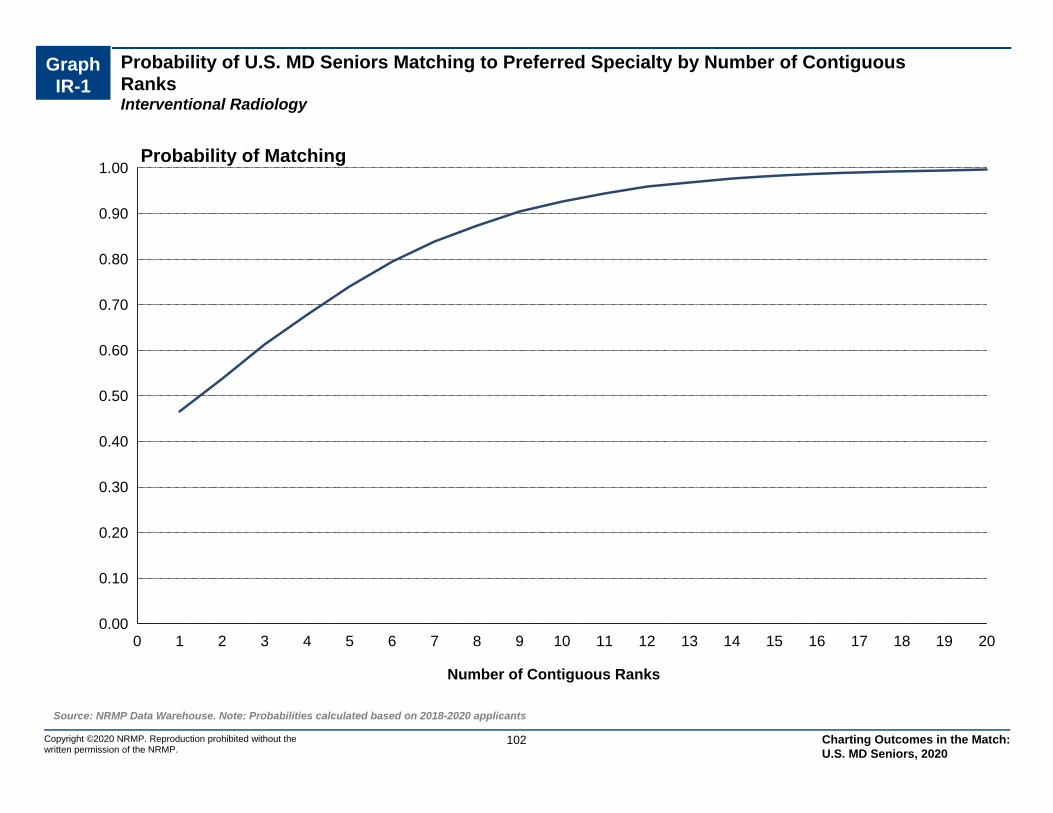
Probability of U.S. MD Seniors Matching to Preferred Specialty by Number of Contiguous RanksInterventional Radiology
Graph IR-1
0.00
0.10
0.20
0.30
0.40
0.50
0.60
0.70
0.80
0.90
1.00
0 1 2 3 4 5 6 7 8 9 10 11 12 13 14 15 16 17 18 19 20
Number of Contiguous Ranks
Probability of Matching
Source: NRMP Data Warehouse. Note: Probabilities calculated based on 2018-2020 applicants
102Copyright ©2020 NRMP. Reproduction prohibited without the written permission of the NRMP.
Charting Outcomes in the Match: U.S. MD Seniors, 2020
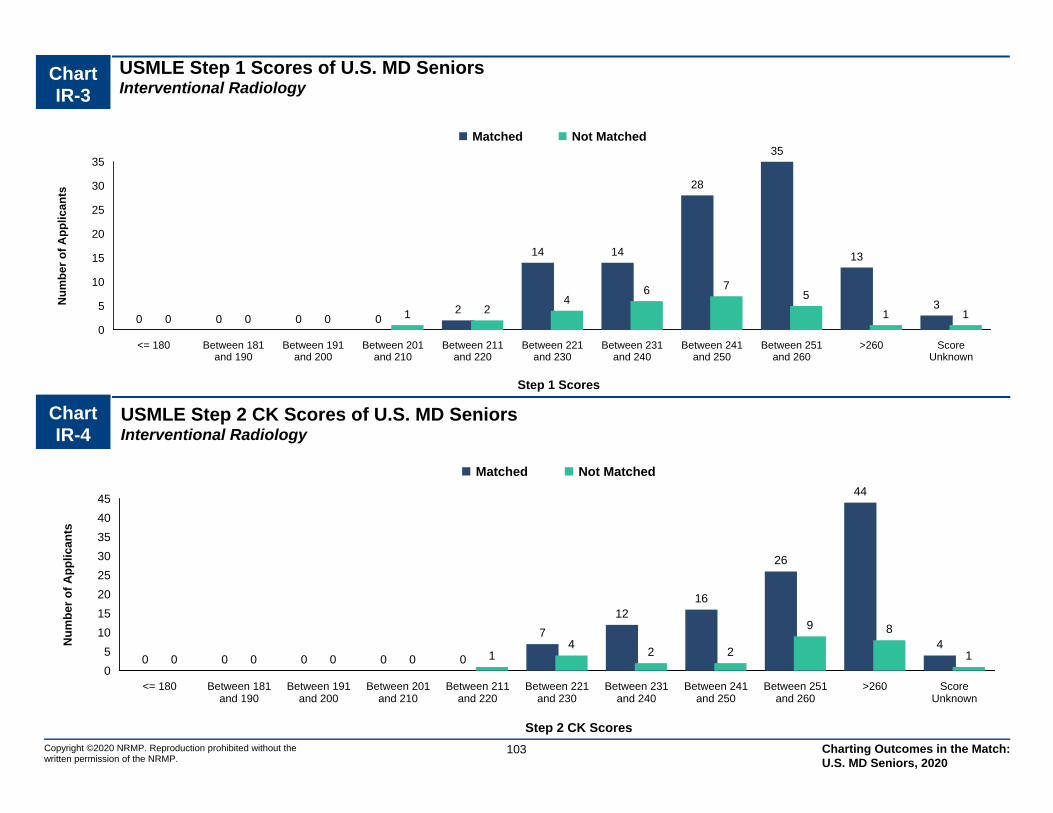
Chart IR-3
USMLE Step 1 Scores of U.S. MD SeniorsInterventional Radiology
0
5
10
15
20
25
30
35
<= 180 Between 181and 190
Between 191and 200
Between 201and 210
Between 211and 220
Between 221and 230
Between 231and 240
Between 241and 250
Between 251and 260
>260 ScoreUnknown
0 0 0 02
14 14
28
35
13
30 0 0 1 2
46 7
5
1 1
Matched Not Matched
Step 1 Scores
Nu
mb
er
of
Ap
pli
ca
nts
Source: NRMP Data Warehouse
103Copyright ©2020 NRMP. Reproduction prohibited without the written permission of the NRMP.
Chart IR-4
USMLE Step 2 CK Scores of U.S. MD SeniorsInterventional Radiology
0
5
10
15
20
25
30
35
40
45
<= 180 Between 181and 190
Between 191and 200
Between 201and 210
Between 211and 220
Between 221and 230
Between 231and 240
Between 241and 250
Between 251and 260
>260 ScoreUnknown
0 0 0 0 0
7
1216
26
44
40 0 0 0 1
42 2
9 8
1
Matched Not Matched
Step 2 CK Scores
Nu
mb
er o
f A
pp
lican
ts
Charting Outcomes in the Match: U.S. MD Seniors, 2020
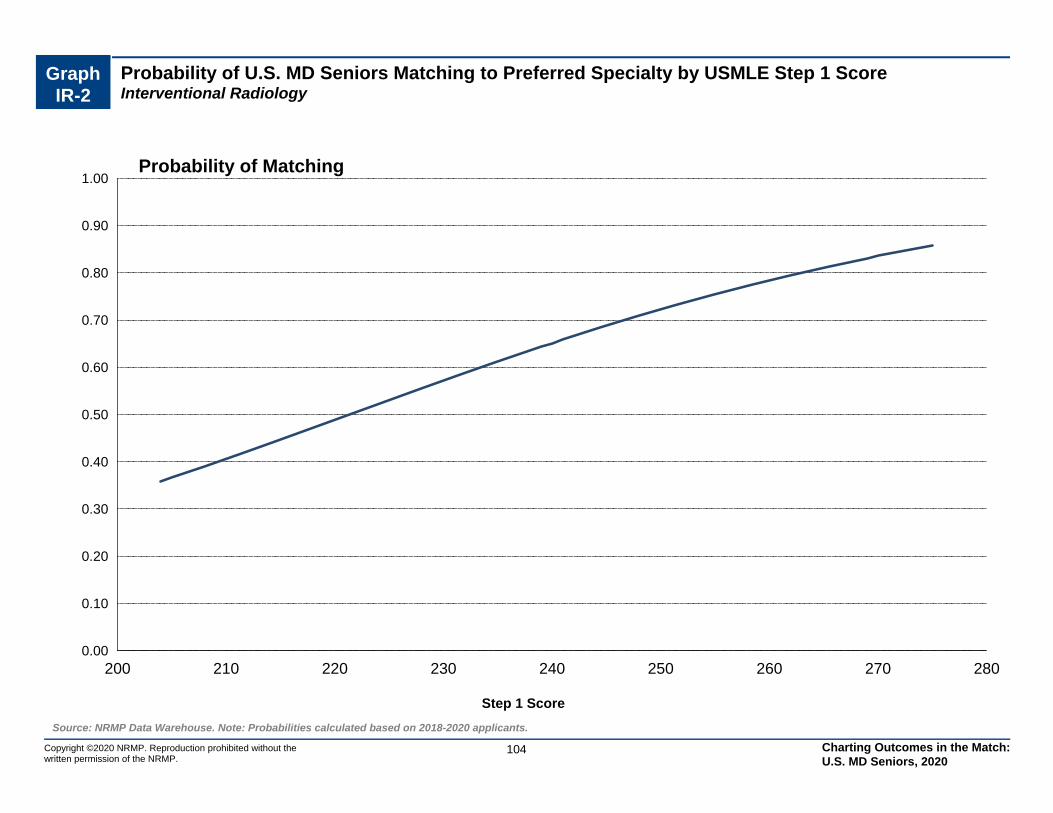
Graph IR-2
Probability of U.S. MD Seniors Matching to Preferred Specialty by USMLE Step 1 ScoreInterventional Radiology
0.00
0.10
0.20
0.30
0.40
0.50
0.60
0.70
0.80
0.90
1.00
200 210 220 230 240 250 260 270 280
Step 1 Score
Probability of Matching
Source: NRMP Data Warehouse. Note: Probabilities calculated based on 2018-2020 applicants.
104Copyright ©2020 NRMP. Reproduction prohibited without the written permission of the NRMP.
Charting Outcomes in the Match: U.S. MD Seniors, 2020
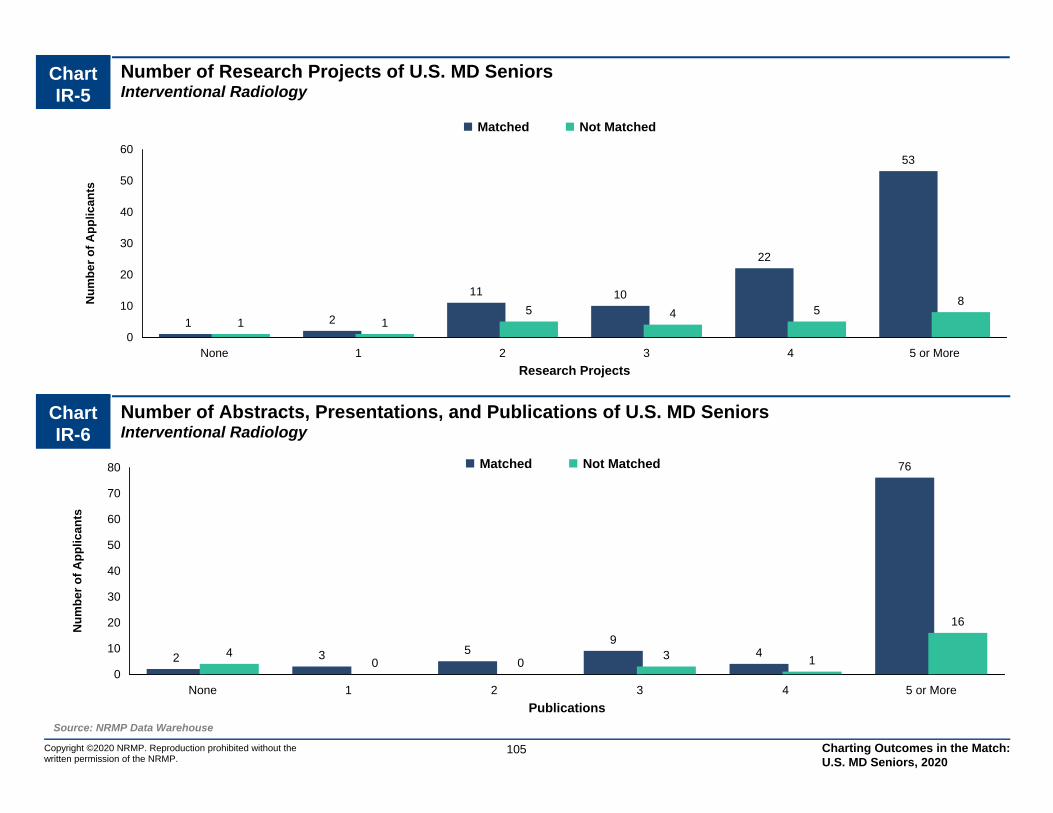
0
10
20
30
40
50
60
70
80
None 1 2 3 4 5 or More
2 3 59
4
76
40 0
3 1
16
Matched Not Matched
Publications
Nu
mb
er o
f A
pp
lican
ts
0
10
20
30
40
50
60
None 1 2 3 4 5 or More
1 2
11 10
22
53
1 15 4 5
8
Matched Not Matched
Research Projects
Nu
mb
er o
f A
pp
lican
tsChart IR-5
Number of Research Projects of U.S. MD SeniorsInterventional Radiology
Source: NRMP Data Warehouse
105Copyright ©2020 NRMP. Reproduction prohibited without the written permission of the NRMP.
Chart IR-6
Number of Abstracts, Presentations, and Publications of U.S. MD SeniorsInterventional Radiology
Charting Outcomes in the Match: U.S. MD Seniors, 2020

0
4
8
12
16
20
24
28
None 1 2 3 4 5 6 7 8 9 10 or More
02
75
10
1513
11
46
25
01 1
5
1 12 2
13
7
Matched Not Matched
Volunteer Experiences
Nu
mb
er o
f A
pp
lican
ts
0
4
8
12
16
20
24
28
None 1 2 3 4 5 or More
10 10
20
16 16
26
4 46
2 2
6
Matched Not Matched
Work Experiences
Nu
mb
er o
f A
pp
lican
tsChart IR-7
Number of Work Experiences of U.S. MD SeniorsInterventional Radiology
Source: NRMP Data Warehouse
106Copyright ©2020 NRMP. Reproduction prohibited without the written permission of the NRMP.
Chart IR-8
Number of Volunteer Experiences of U.S. MD SeniorsInterventional Radiology
Charting Outcomes in the Match: U.S. MD Seniors, 2020

Chart IR-9
Other Characteristics of U.S. MD SeniorsInterventional Radiology
Copyright ©2020 NRMP. Reproduction prohibited without the written permission of the NRMP.
Source: NRMP Data Warehouse. Top 40 U.S. medical schools with the highest NIH funding from NIH: http://report.nih.gov/award/index.cfm
107
0
10
20
30
40
50
60
70
Yes No
32
68
2
23
Nu
mb
er
of
Ap
pli
ca
nts
AOA Membership
10
20
30
40
50
60
70
80
Yes No
31
78
10
17
Nu
mb
er o
f A
pp
lican
ts
Graduate of One of the 40 U.S. MedicalSchools with the Highest NIH Funding
0
20
40
60
80
100
120
Yes No
2
102
1
24Nu
mb
er o
f A
pp
lican
ts
Ph.D. Degree
0
20
40
60
80
100
Yes No
19
83
2
23
Nu
mb
er o
f A
pp
lican
ts
Other Graduate Degree
Matched Not Matched
Charting Outcomes in the Match: U.S. MD Seniors, 2020
NS Neurological Surgery
Copyright ©2020 NRMP. Reproduction prohibited without the written permission of the NRMP.
108 Charting Outcomes in the Match: U.S. MD Seniors, 2020

Table NS-1
Summary Statistics on U.S. MD SeniorsNeurological Surgery
Measure (n=195) (n=58)
Matched Unmatched
15.8 10.0Mean number of contiguous ranks1.
1.1 1.1Mean number of distinct specialties ranked2.
248 241Mean USMLE Step 1 score3.
252 248Mean USMLE Step 2 score4.
6.1 5.2Mean number of research experiences5.
23.4 11.8Mean number of abstracts, presentations, and publications6.
3.6 4.0Mean number of work experiences7.
7.8 7.2Mean number of volunteer experiences8.
39.0 19.0Percentage who are AOA members9.
39.0 27.6Percentage who graduated from one of the 40 U.S. medical schools with the highest NIH funding
10.
9.5 10.9Percentage who have Ph.D. degree11.
24.1 29.6Percentage who have another graduate degree12.
Note: Only U.S. MD seniors who gave consent to use their information in research are included. Sources. NRMP Data Warehouse; Top 40 U.S. medical schools with the highest NIH funding in measure 10 is from the NIH website (http://report.nih.gov/award/index.cfm).
Copyright ©2020 NRMP. Reproduction prohibited without the written permission of the NRMP.
109 Charting Outcomes in the Match: U.S. MD Seniors, 2020
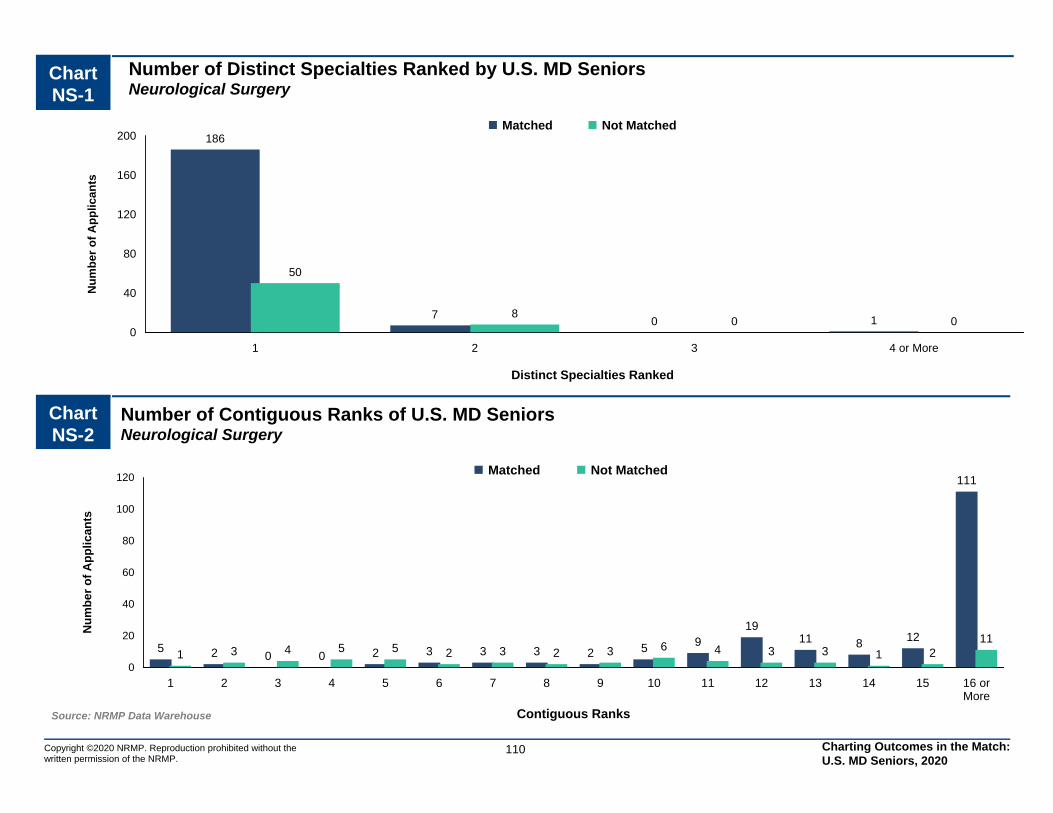
0
40
80
120
160
200
1 2 3 4 or More
186
70 1
50
80 0
Matched Not Matched
Distinct Specialties Ranked
Nu
mb
er o
f A
pp
lican
ts
0
20
40
60
80
100
120
1 2 3 4 5 6 7 8 9 10 11 12 13 14 15 16 orMore
5 2 0 0 2 3 3 3 2 5 919
11 8 12
111
1 3 4 5 5 2 3 2 3 6 4 3 3 1 211
Matched Not Matched
Contiguous Ranks
Nu
mb
er o
f A
pp
lican
ts
Chart NS-2
Number of Contiguous Ranks of U.S. MD SeniorsNeurological Surgery
Source: NRMP Data Warehouse
Copyright ©2020 NRMP. Reproduction prohibited without the written permission of the NRMP.
110
Chart NS-1
Number of Distinct Specialties Ranked by U.S. MD SeniorsNeurological Surgery
Charting Outcomes in the Match: U.S. MD Seniors, 2020
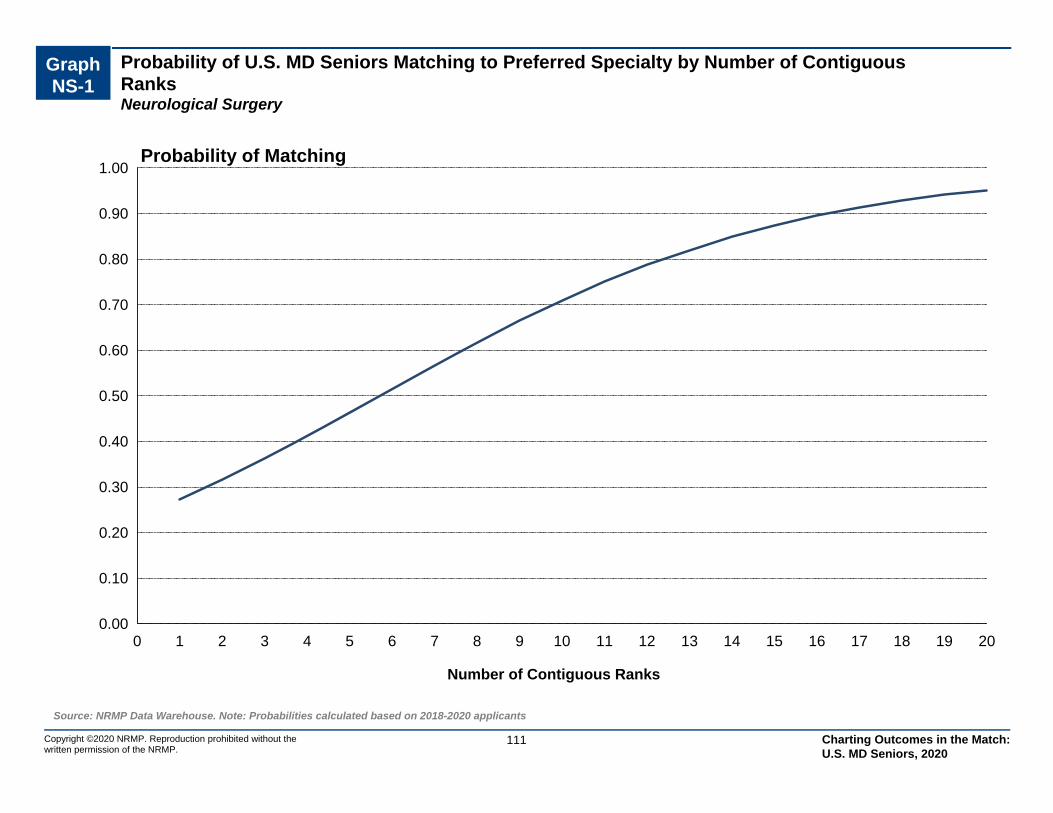
Probability of U.S. MD Seniors Matching to Preferred Specialty by Number of Contiguous RanksNeurological Surgery
Graph NS-1
0.00
0.10
0.20
0.30
0.40
0.50
0.60
0.70
0.80
0.90
1.00
0 1 2 3 4 5 6 7 8 9 10 11 12 13 14 15 16 17 18 19 20
Number of Contiguous Ranks
Probability of Matching
Source: NRMP Data Warehouse. Note: Probabilities calculated based on 2018-2020 applicants
111Copyright ©2020 NRMP. Reproduction prohibited without the written permission of the NRMP.
Charting Outcomes in the Match: U.S. MD Seniors, 2020
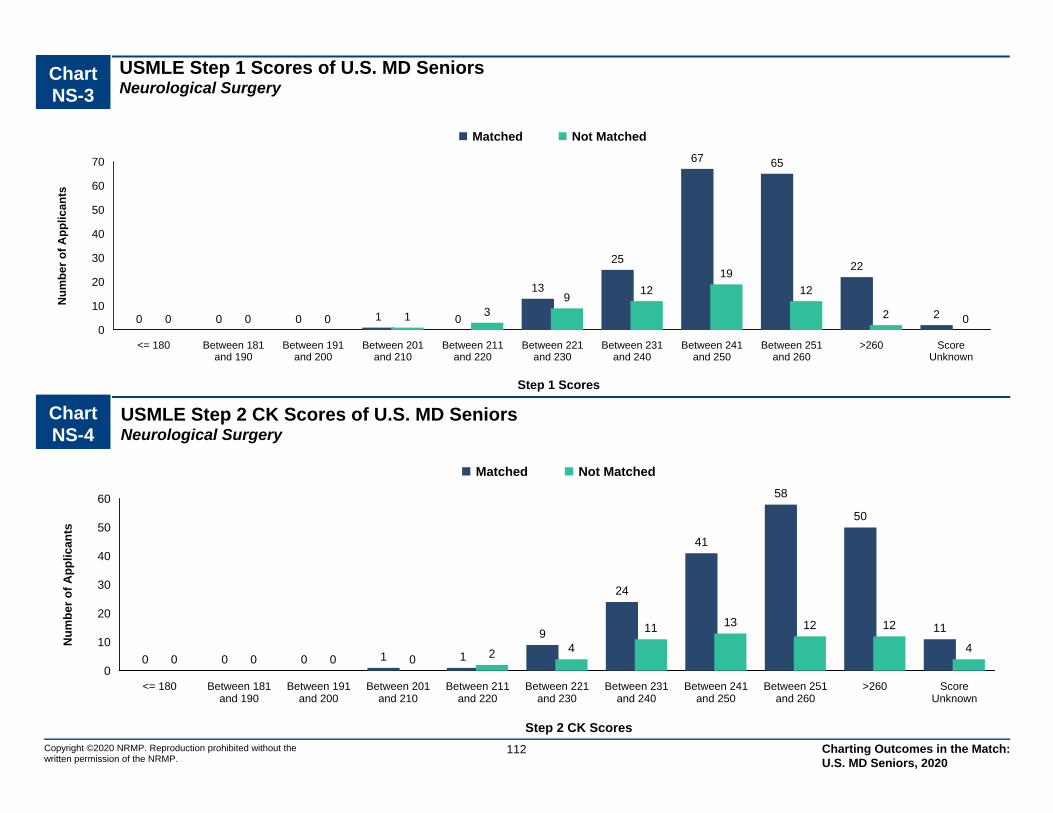
Chart NS-3
USMLE Step 1 Scores of U.S. MD SeniorsNeurological Surgery
0
10
20
30
40
50
60
70
<= 180 Between 181and 190
Between 191and 200
Between 201and 210
Between 211and 220
Between 221and 230
Between 231and 240
Between 241and 250
Between 251and 260
>260 ScoreUnknown
0 0 0 1 0
13
25
67 65
22
20 0 0 1 39
12
19
12
2 0
Matched Not Matched
Step 1 Scores
Nu
mb
er
of
Ap
pli
ca
nts
Source: NRMP Data Warehouse
112Copyright ©2020 NRMP. Reproduction prohibited without the written permission of the NRMP.
Chart NS-4
USMLE Step 2 CK Scores of U.S. MD SeniorsNeurological Surgery
0
10
20
30
40
50
60
<= 180 Between 181and 190
Between 191and 200
Between 201and 210
Between 211and 220
Between 221and 230
Between 231and 240
Between 241and 250
Between 251and 260
>260 ScoreUnknown
0 0 0 1 1
9
24
41
58
50
11
0 0 0 0 2 4
11 13 12 12
4
Matched Not Matched
Step 2 CK Scores
Nu
mb
er o
f A
pp
lican
ts
Charting Outcomes in the Match: U.S. MD Seniors, 2020

Graph NS-2
Probability of U.S. MD Seniors Matching to Preferred Specialty by USMLE Step 1 ScoreNeurological Surgery
0.00
0.10
0.20
0.30
0.40
0.50
0.60
0.70
0.80
0.90
1.00
180 200 220 240 260 280
Step 1 Score
Probability of Matching
Source: NRMP Data Warehouse. Note: Probabilities calculated based on 2018-2020 applicants.
113Copyright ©2020 NRMP. Reproduction prohibited without the written permission of the NRMP.
Charting Outcomes in the Match: U.S. MD Seniors, 2020

0
20
40
60
80
100
120
140
160
180
None 1 2 3 4 5 or More
2 0 2 2 3
168
2 1 2 3 6
36
Matched Not Matched
Publications
Nu
mb
er o
f A
pp
lican
ts
0
20
40
60
80
100
120
None 1 2 3 4 5 or More
1 2
19 18 21
114
0 06
12 10
22
Matched Not Matched
Research Projects
Nu
mb
er o
f A
pp
lican
tsChart NS-5
Number of Research Projects of U.S. MD SeniorsNeurological Surgery
Source: NRMP Data Warehouse
114Copyright ©2020 NRMP. Reproduction prohibited without the written permission of the NRMP.
Chart NS-6
Number of Abstracts, Presentations, and Publications of U.S. MD SeniorsNeurological Surgery
Charting Outcomes in the Match: U.S. MD Seniors, 2020
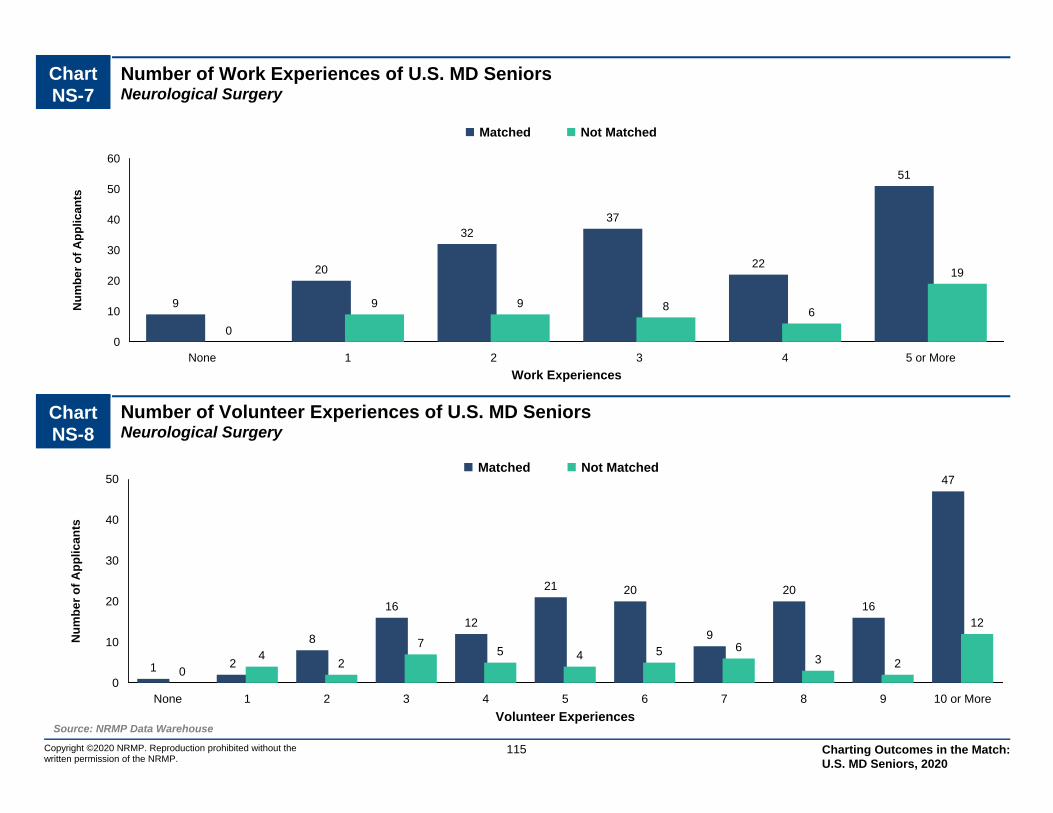
0
10
20
30
40
50
None 1 2 3 4 5 6 7 8 9 10 or More
1 2
8
1612
21 20
9
2016
47
04
2
75 4 5 6
3 2
12
Matched Not Matched
Volunteer Experiences
Nu
mb
er o
f A
pp
lican
ts
0
10
20
30
40
50
60
None 1 2 3 4 5 or More
9
20
3237
22
51
0
9 9 8 6
19
Matched Not Matched
Work Experiences
Nu
mb
er o
f A
pp
lican
tsChart NS-7
Number of Work Experiences of U.S. MD SeniorsNeurological Surgery
Source: NRMP Data Warehouse
115Copyright ©2020 NRMP. Reproduction prohibited without the written permission of the NRMP.
Chart NS-8
Number of Volunteer Experiences of U.S. MD SeniorsNeurological Surgery
Charting Outcomes in the Match: U.S. MD Seniors, 2020

Chart NS-9
Other Characteristics of U.S. MD SeniorsNeurological Surgery
Copyright ©2020 NRMP. Reproduction prohibited without the written permission of the NRMP.
Source: NRMP Data Warehouse. Top 40 U.S. medical schools with the highest NIH funding from NIH: http://report.nih.gov/award/index.cfm
116
0
20
40
60
80
100
120
Yes No
76
108
11
45
Nu
mb
er
of
Ap
pli
ca
nts
AOA Membership
0
20
40
60
80
100
120
Yes No
76
119
16
42
Nu
mb
er o
f A
pp
lican
ts
Graduate of One of the 40 U.S. MedicalSchools with the Highest NIH Funding
0
20
40
60
80
100
120
140
160
180
Yes No
18
171
6
49
Nu
mb
er o
f A
pp
lican
ts
Ph.D. Degree
0
20
40
60
80
100
120
140
160
Yes No
45
142
16
38
Nu
mb
er o
f A
pp
lican
ts
Other Graduate Degree
Matched Not Matched
Charting Outcomes in the Match: U.S. MD Seniors, 2020
N Neurology
Copyright ©2020 NRMP. Reproduction prohibited without the written permission of the NRMP.
117 Charting Outcomes in the Match: U.S. MD Seniors, 2020

Table N-1
Summary Statistics on U.S. MD SeniorsNeurology
Measure (n=421) (n=10)
Matched Unmatched
12.8 5.5Mean number of contiguous ranks1.
1.1 1.5Mean number of distinct specialties ranked2.
232 223Mean USMLE Step 1 score3.
245 234Mean USMLE Step 2 score4.
3.6 3.6Mean number of research experiences5.
7.2 7.0Mean number of abstracts, presentations, and publications6.
3.1 2.7Mean number of work experiences7.
7.6 6.1Mean number of volunteer experiences8.
14.3 0.0Percentage who are AOA members9.
35.2 20.0Percentage who graduated from one of the 40 U.S. medical schools with the highest NIH funding
10.
11.1 11.1Percentage who have Ph.D. degree11.
16.6 11.1Percentage who have another graduate degree12.
Note: Only U.S. MD seniors who gave consent to use their information in research are included. Sources. NRMP Data Warehouse; Top 40 U.S. medical schools with the highest NIH funding in measure 10 is from the NIH website (http://report.nih.gov/award/index.cfm).
Copyright ©2020 NRMP. Reproduction prohibited without the written permission of the NRMP.
118 Charting Outcomes in the Match: U.S. MD Seniors, 2020
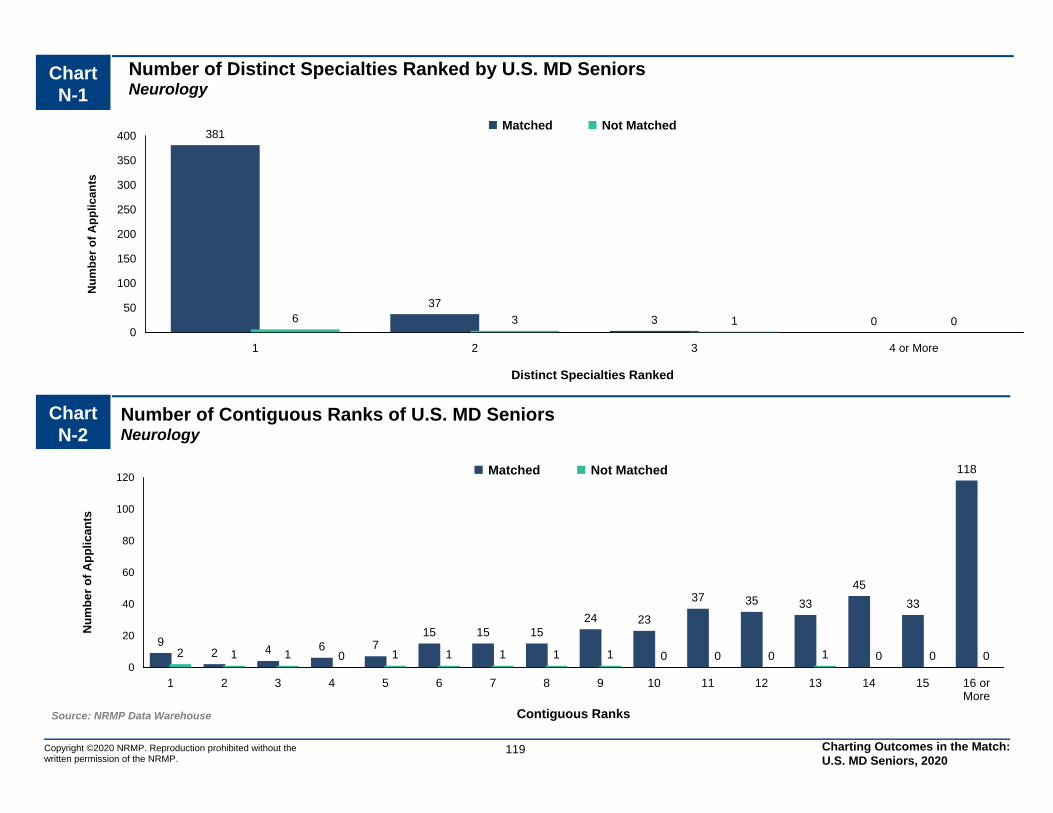
0
50
100
150
200
250
300
350
400
1 2 3 4 or More
381
37
3 06 3 1 0
Matched Not Matched
Distinct Specialties Ranked
Nu
mb
er o
f A
pp
lican
ts
0
20
40
60
80
100
120
1 2 3 4 5 6 7 8 9 10 11 12 13 14 15 16 orMore
92 4 6 7
15 15 1524 23
37 35 33
45
33
118
2 1 1 0 1 1 1 1 1 0 0 0 1 0 0 0
Matched Not Matched
Contiguous Ranks
Nu
mb
er o
f A
pp
lican
ts
Chart N-2
Number of Contiguous Ranks of U.S. MD SeniorsNeurology
Source: NRMP Data Warehouse
Copyright ©2020 NRMP. Reproduction prohibited without the written permission of the NRMP.
119
Chart N-1
Number of Distinct Specialties Ranked by U.S. MD SeniorsNeurology
Charting Outcomes in the Match: U.S. MD Seniors, 2020
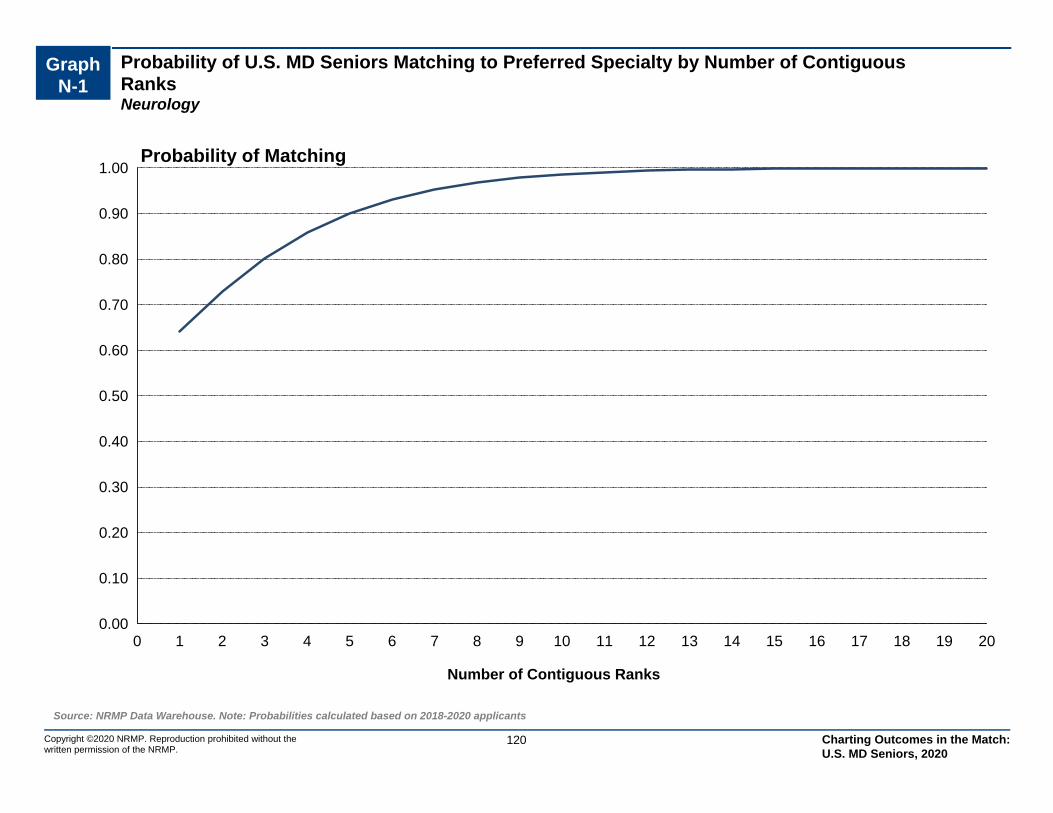
Probability of U.S. MD Seniors Matching to Preferred Specialty by Number of Contiguous RanksNeurology
Graph N-1
0.00
0.10
0.20
0.30
0.40
0.50
0.60
0.70
0.80
0.90
1.00
0 1 2 3 4 5 6 7 8 9 10 11 12 13 14 15 16 17 18 19 20
Number of Contiguous Ranks
Probability of Matching
Source: NRMP Data Warehouse. Note: Probabilities calculated based on 2018-2020 applicants
120Copyright ©2020 NRMP. Reproduction prohibited without the written permission of the NRMP.
Charting Outcomes in the Match: U.S. MD Seniors, 2020

Chart N-3
USMLE Step 1 Scores of U.S. MD SeniorsNeurology
0
20
40
60
80
100
<= 180 Between 181and 190
Between 191and 200
Between 201and 210
Between 211and 220
Between 221and 230
Between 231and 240
Between 241and 250
Between 251and 260
>260 ScoreUnknown
0 0
13
32
63
9182
77
43
16
40 0 0 2 3 1 3 1 0 0 0
Matched Not Matched
Step 1 Scores
Nu
mb
er
of
Ap
pli
ca
nts
Source: NRMP Data Warehouse
121Copyright ©2020 NRMP. Reproduction prohibited without the written permission of the NRMP.
Chart N-4
USMLE Step 2 CK Scores of U.S. MD SeniorsNeurology
0
20
40
60
80
100
120
<= 180 Between 181and 190
Between 191and 200
Between 201and 210
Between 211and 220
Between 221and 230
Between 231and 240
Between 241and 250
Between 251and 260
>260 ScoreUnknown
0 0 0 2
22
46
72
115
100
59
50 0 0 0 2 0
70 1 0 0
Matched Not Matched
Step 2 CK Scores
Nu
mb
er o
f A
pp
lican
ts
Charting Outcomes in the Match: U.S. MD Seniors, 2020
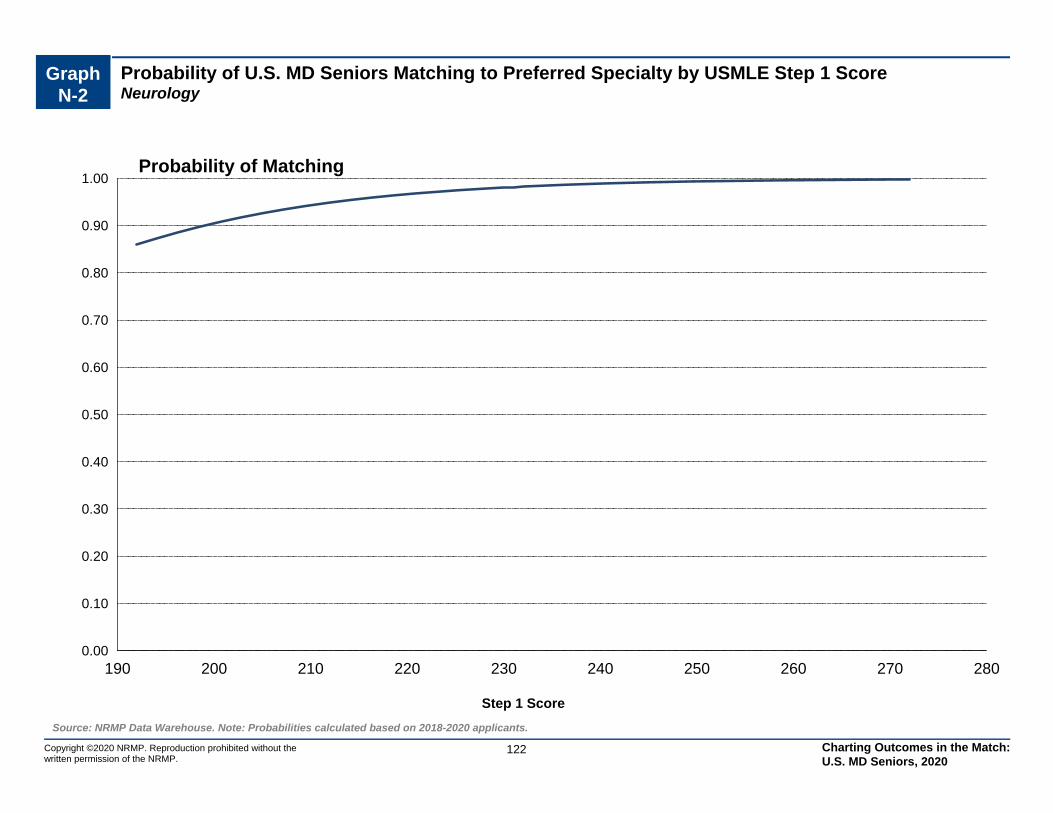
Graph N-2
Probability of U.S. MD Seniors Matching to Preferred Specialty by USMLE Step 1 ScoreNeurology
0.00
0.10
0.20
0.30
0.40
0.50
0.60
0.70
0.80
0.90
1.00
190 200 210 220 230 240 250 260 270 280
Step 1 Score
Probability of Matching
Source: NRMP Data Warehouse. Note: Probabilities calculated based on 2018-2020 applicants.
122Copyright ©2020 NRMP. Reproduction prohibited without the written permission of the NRMP.
Charting Outcomes in the Match: U.S. MD Seniors, 2020
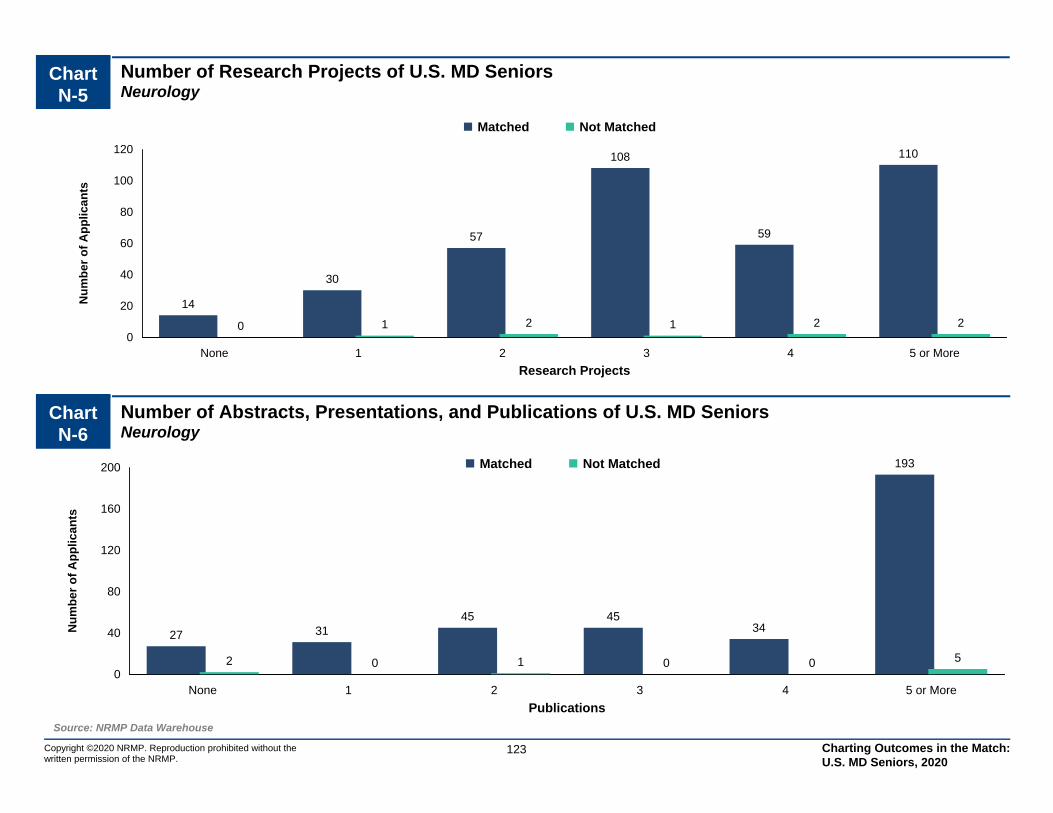
0
40
80
120
160
200
None 1 2 3 4 5 or More
27 3145 45
34
193
2 0 1 0 0 5
Matched Not Matched
Publications
Nu
mb
er o
f A
pp
lican
ts
0
20
40
60
80
100
120
None 1 2 3 4 5 or More
14
30
57
108
59
110
0 1 2 1 2 2
Matched Not Matched
Research Projects
Nu
mb
er o
f A
pp
lican
tsChart N-5
Number of Research Projects of U.S. MD SeniorsNeurology
Source: NRMP Data Warehouse
123Copyright ©2020 NRMP. Reproduction prohibited without the written permission of the NRMP.
Chart N-6
Number of Abstracts, Presentations, and Publications of U.S. MD SeniorsNeurology
Charting Outcomes in the Match: U.S. MD Seniors, 2020
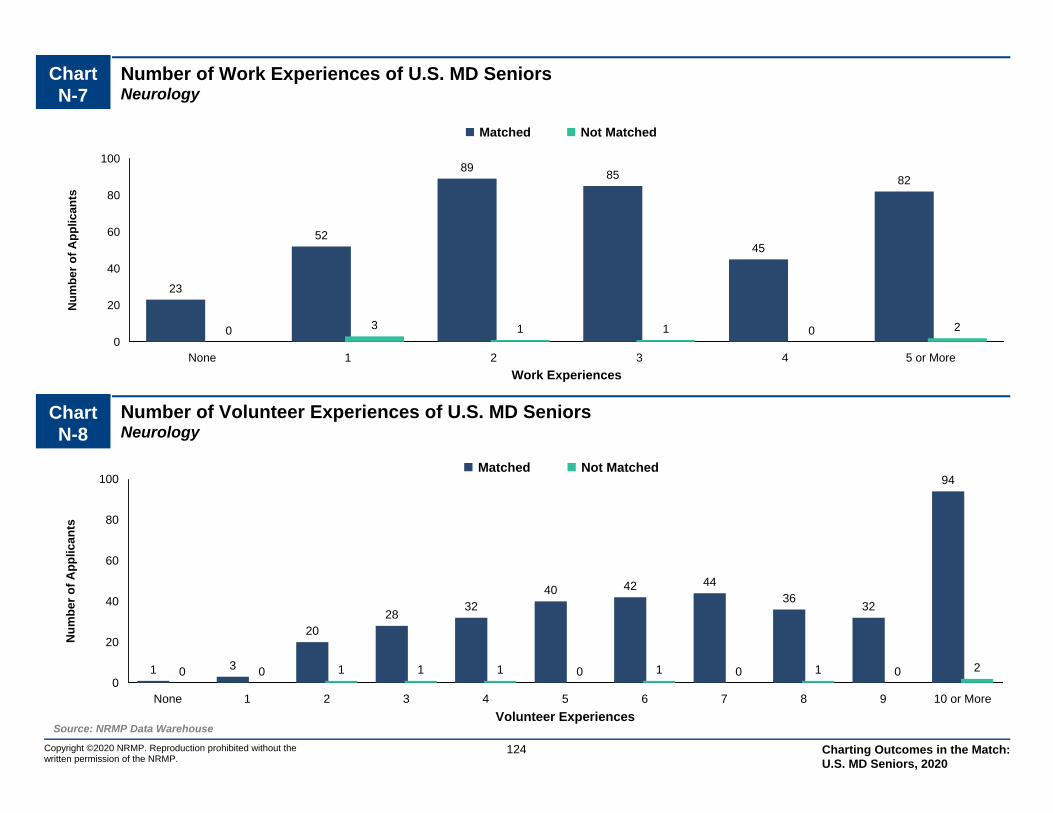
0
20
40
60
80
100
None 1 2 3 4 5 6 7 8 9 10 or More
1 3
2028
3240 42 44
3632
94
0 0 1 1 1 0 1 0 1 0 2
Matched Not Matched
Volunteer Experiences
Nu
mb
er o
f A
pp
lican
ts
0
20
40
60
80
100
None 1 2 3 4 5 or More
23
52
8985
45
82
0 3 1 1 0 2
Matched Not Matched
Work Experiences
Nu
mb
er o
f A
pp
lican
tsChart N-7
Number of Work Experiences of U.S. MD SeniorsNeurology
Source: NRMP Data Warehouse
124Copyright ©2020 NRMP. Reproduction prohibited without the written permission of the NRMP.
Chart N-8
Number of Volunteer Experiences of U.S. MD SeniorsNeurology
Charting Outcomes in the Match: U.S. MD Seniors, 2020

Chart N-9
Other Characteristics of U.S. MD SeniorsNeurology
Copyright ©2020 NRMP. Reproduction prohibited without the written permission of the NRMP.
Source: NRMP Data Warehouse. Top 40 U.S. medical schools with the highest NIH funding from NIH: http://report.nih.gov/award/index.cfm
125
0
50
100
150
200
250
300
350
Yes No
60
335
0 9
Nu
mb
er
of
Ap
pli
ca
nts
AOA Membership
0
40
80
120
160
200
240
280
Yes No
148
273
2 8
Nu
mb
er o
f A
pp
lican
ts
Graduate of One of the 40 U.S. MedicalSchools with the Highest NIH Funding
0
50
100
150
200
250
300
350
400
Yes No
44
353
1 8
Nu
mb
er o
f A
pp
lican
ts
Ph.D. Degree
0
50
100
150
200
250
300
350
Yes No
65
327
1 8
Nu
mb
er o
f A
pp
lican
ts
Other Graduate Degree
Matched Not Matched
Charting Outcomes in the Match: U.S. MD Seniors, 2020
OB Obstetrics and Gynecology
Copyright ©2020 NRMP. Reproduction prohibited without the written permission of the NRMP.
126 Charting Outcomes in the Match: U.S. MD Seniors, 2020
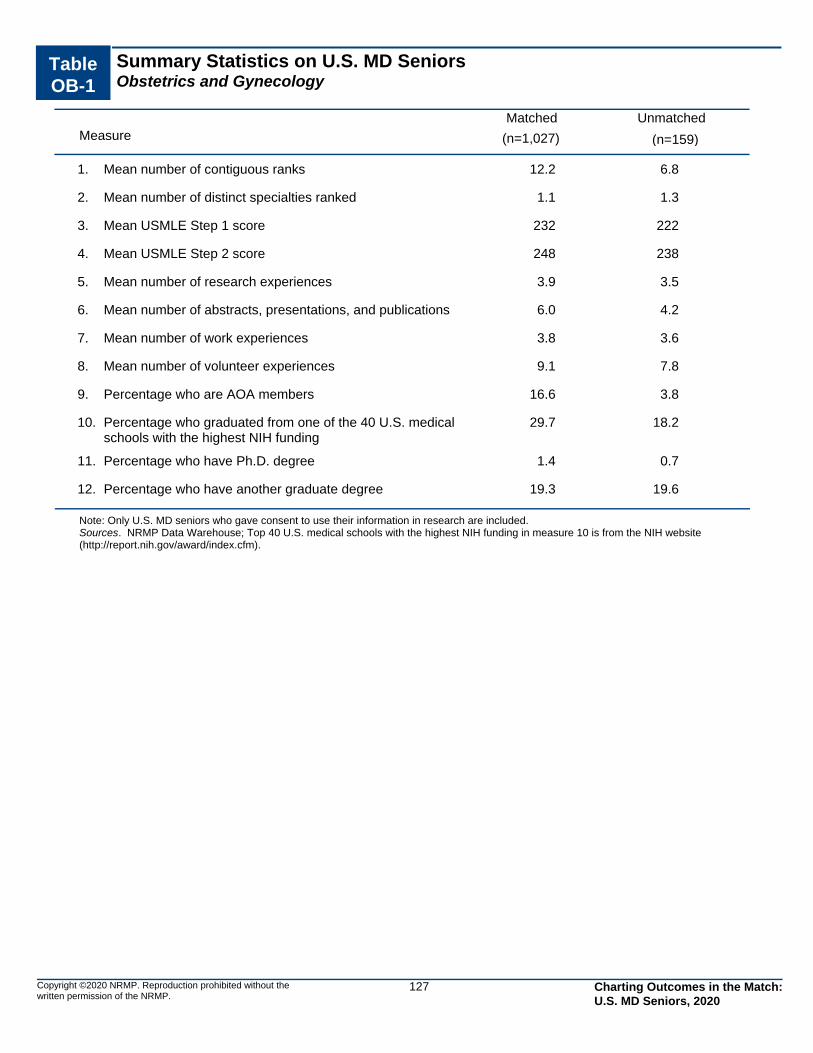
Table OB-1
Summary Statistics on U.S. MD SeniorsObstetrics and Gynecology
Measure (n=1,027) (n=159)
Matched Unmatched
12.2 6.8Mean number of contiguous ranks1.
1.1 1.3Mean number of distinct specialties ranked2.
232 222Mean USMLE Step 1 score3.
248 238Mean USMLE Step 2 score4.
3.9 3.5Mean number of research experiences5.
6.0 4.2Mean number of abstracts, presentations, and publications6.
3.8 3.6Mean number of work experiences7.
9.1 7.8Mean number of volunteer experiences8.
16.6 3.8Percentage who are AOA members9.
29.7 18.2Percentage who graduated from one of the 40 U.S. medical schools with the highest NIH funding
10.
1.4 0.7Percentage who have Ph.D. degree11.
19.3 19.6Percentage who have another graduate degree12.
Note: Only U.S. MD seniors who gave consent to use their information in research are included. Sources. NRMP Data Warehouse; Top 40 U.S. medical schools with the highest NIH funding in measure 10 is from the NIH website (http://report.nih.gov/award/index.cfm).
Copyright ©2020 NRMP. Reproduction prohibited without the written permission of the NRMP.
127 Charting Outcomes in the Match: U.S. MD Seniors, 2020

0
200
400
600
800
1,000
1 2 3 4 or More
968
554 0
11343
2 1
Matched Not Matched
Distinct Specialties Ranked
Nu
mb
er o
f A
pp
lican
ts
0
40
80
120
160
200
240
1 2 3 4 5 6 7 8 9 10 11 12 13 14 15 16 orMore
7 7 11 19 2135 39
68 65 7188 93
114
8093
216
16 14 14 16 13 12 12 8 10 7 7 11 5 5 5 4
Matched Not Matched
Contiguous Ranks
Nu
mb
er o
f A
pp
lican
ts
Chart OB-2
Number of Contiguous Ranks of U.S. MD SeniorsObstetrics and Gynecology
Source: NRMP Data Warehouse
Copyright ©2020 NRMP. Reproduction prohibited without the written permission of the NRMP.
128
Chart OB-1
Number of Distinct Specialties Ranked by U.S. MD SeniorsObstetrics and Gynecology
Charting Outcomes in the Match: U.S. MD Seniors, 2020

Probability of U.S. MD Seniors Matching to Preferred Specialty by Number of Contiguous RanksObstetrics and Gynecology
Graph OB-1
0.00
0.10
0.20
0.30
0.40
0.50
0.60
0.70
0.80
0.90
1.00
0 1 2 3 4 5 6 7 8 9 10 11 12 13 14 15 16 17 18 19 20
Number of Contiguous Ranks
Probability of Matching
Source: NRMP Data Warehouse. Note: Probabilities calculated based on 2018-2020 applicants
129Copyright ©2020 NRMP. Reproduction prohibited without the written permission of the NRMP.
Charting Outcomes in the Match: U.S. MD Seniors, 2020
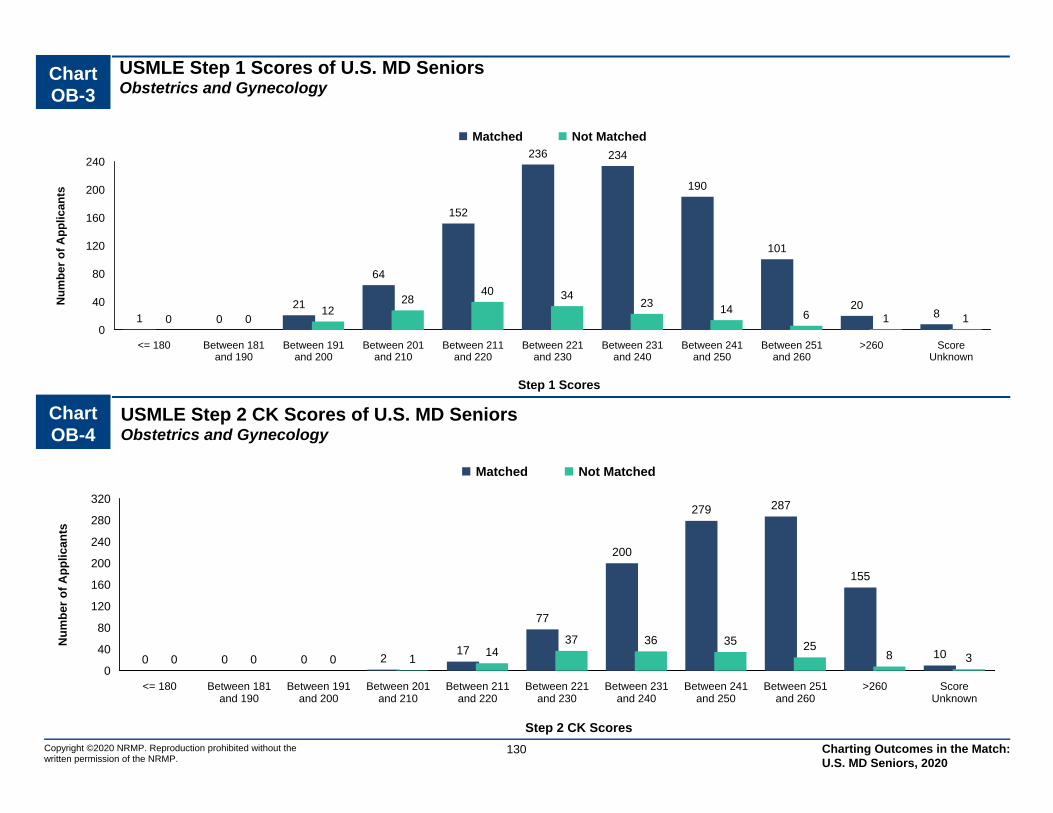
Chart OB-3
USMLE Step 1 Scores of U.S. MD SeniorsObstetrics and Gynecology
0
40
80
120
160
200
240
<= 180 Between 181and 190
Between 191and 200
Between 201and 210
Between 211and 220
Between 221and 230
Between 231and 240
Between 241and 250
Between 251and 260
>260 ScoreUnknown
1 021
64
152
236 234
190
101
2080 0
1228
40 3423 14 6 1 1
Matched Not Matched
Step 1 Scores
Nu
mb
er
of
Ap
pli
ca
nts
Source: NRMP Data Warehouse
130Copyright ©2020 NRMP. Reproduction prohibited without the written permission of the NRMP.
Chart OB-4
USMLE Step 2 CK Scores of U.S. MD SeniorsObstetrics and Gynecology
0
40
80
120
160
200
240
280
320
<= 180 Between 181and 190
Between 191and 200
Between 201and 210
Between 211and 220
Between 221and 230
Between 231and 240
Between 241and 250
Between 251and 260
>260 ScoreUnknown
0 0 0 217
77
200
279 287
155
100 0 0 114
37 36 35 258 3
Matched Not Matched
Step 2 CK Scores
Nu
mb
er o
f A
pp
lican
ts
Charting Outcomes in the Match: U.S. MD Seniors, 2020
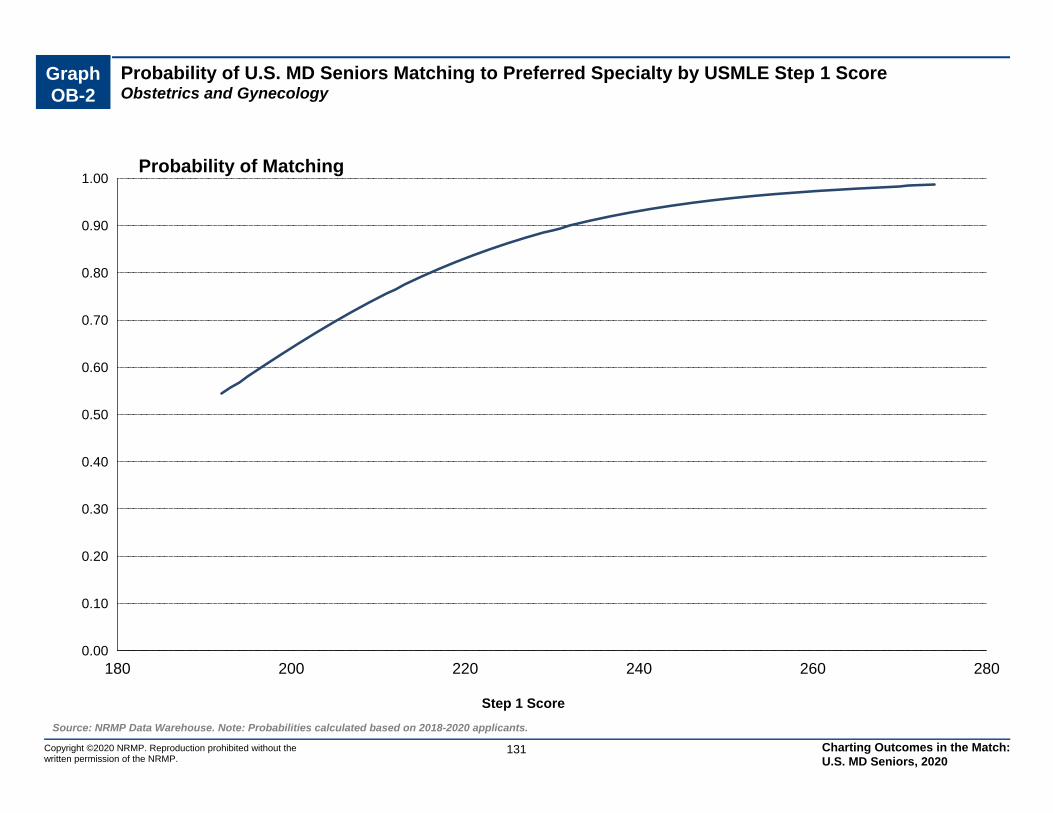
Graph OB-2
Probability of U.S. MD Seniors Matching to Preferred Specialty by USMLE Step 1 ScoreObstetrics and Gynecology
0.00
0.10
0.20
0.30
0.40
0.50
0.60
0.70
0.80
0.90
1.00
180 200 220 240 260 280
Step 1 Score
Probability of Matching
Source: NRMP Data Warehouse. Note: Probabilities calculated based on 2018-2020 applicants.
131Copyright ©2020 NRMP. Reproduction prohibited without the written permission of the NRMP.
Charting Outcomes in the Match: U.S. MD Seniors, 2020
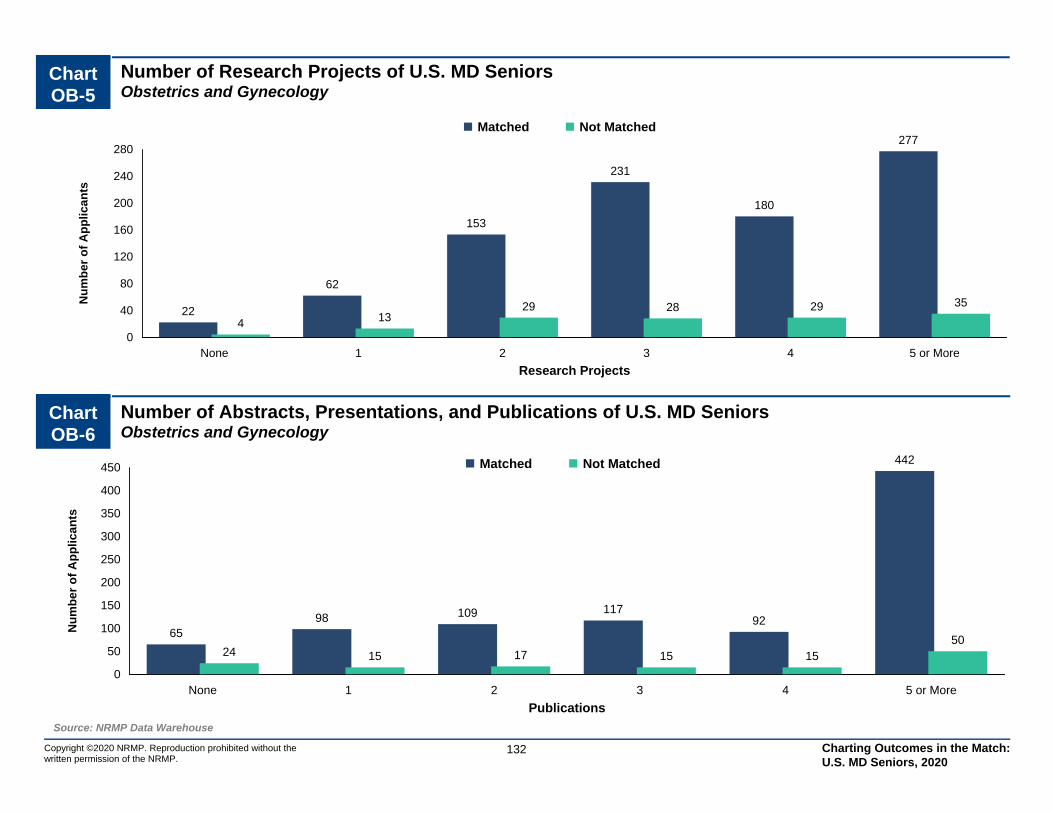
0
50
100
150
200
250
300
350
400
450
None 1 2 3 4 5 or More
6598 109 117
92
442
24 15 17 15 1550
Matched Not Matched
Publications
Nu
mb
er o
f A
pp
lican
ts
0
40
80
120
160
200
240
280
None 1 2 3 4 5 or More
22
62
153
231
180
277
4 1329 28 29 35
Matched Not Matched
Research Projects
Nu
mb
er o
f A
pp
lican
tsChart OB-5
Number of Research Projects of U.S. MD SeniorsObstetrics and Gynecology
Source: NRMP Data Warehouse
132Copyright ©2020 NRMP. Reproduction prohibited without the written permission of the NRMP.
Chart OB-6
Number of Abstracts, Presentations, and Publications of U.S. MD SeniorsObstetrics and Gynecology
Charting Outcomes in the Match: U.S. MD Seniors, 2020
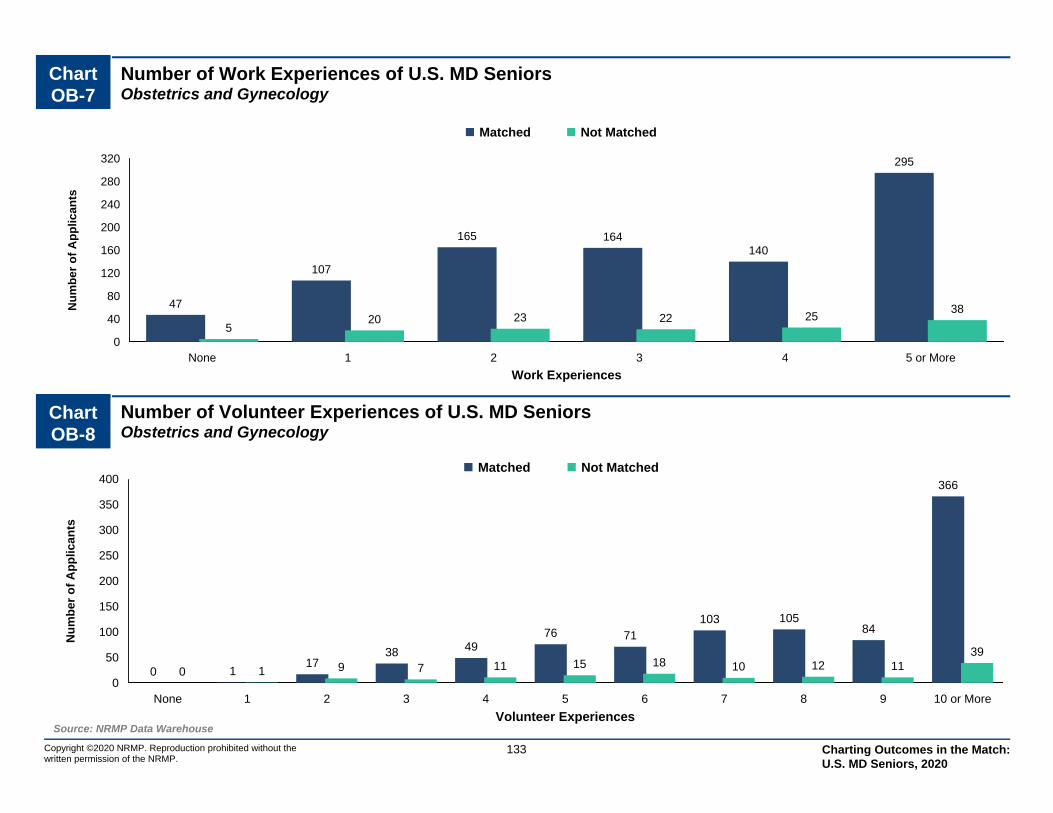
0
50
100
150
200
250
300
350
400
None 1 2 3 4 5 6 7 8 9 10 or More
0 117
38 4976 71
103 10584
366
0 1 9 7 11 15 18 10 12 1139
Matched Not Matched
Volunteer Experiences
Nu
mb
er o
f A
pp
lican
ts
0
40
80
120
160
200
240
280
320
None 1 2 3 4 5 or More
47
107
165 164140
295
520 23 22 25
38
Matched Not Matched
Work Experiences
Nu
mb
er o
f A
pp
lican
tsChart OB-7
Number of Work Experiences of U.S. MD SeniorsObstetrics and Gynecology
Source: NRMP Data Warehouse
133Copyright ©2020 NRMP. Reproduction prohibited without the written permission of the NRMP.
Chart OB-8
Number of Volunteer Experiences of U.S. MD SeniorsObstetrics and Gynecology
Charting Outcomes in the Match: U.S. MD Seniors, 2020
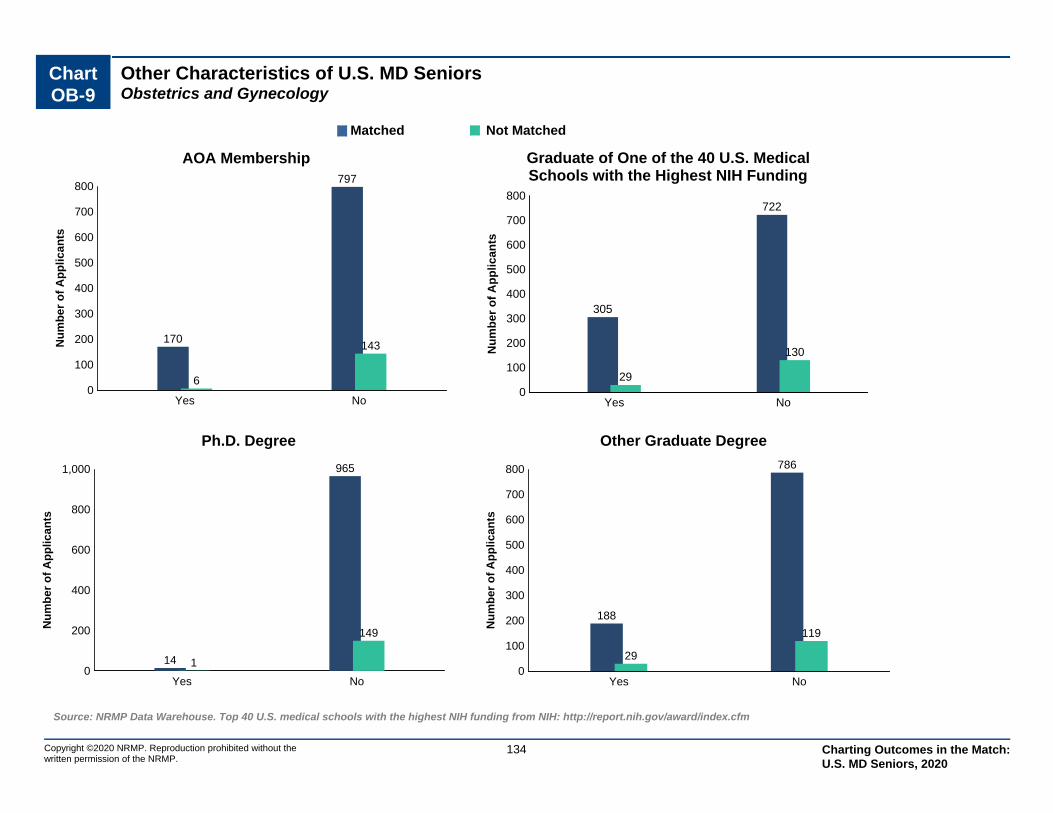
Chart OB-9
Other Characteristics of U.S. MD SeniorsObstetrics and Gynecology
Copyright ©2020 NRMP. Reproduction prohibited without the written permission of the NRMP.
Source: NRMP Data Warehouse. Top 40 U.S. medical schools with the highest NIH funding from NIH: http://report.nih.gov/award/index.cfm
134
0
100
200
300
400
500
600
700
800
Yes No
170
797
6
143Nu
mb
er
of
Ap
pli
ca
nts
AOA Membership
0
100
200
300
400
500
600
700
800
Yes No
305
722
29
130Nu
mb
er o
f A
pp
lican
ts
Graduate of One of the 40 U.S. MedicalSchools with the Highest NIH Funding
0
200
400
600
800
1,000
Yes No
14
965
1
149
Nu
mb
er o
f A
pp
lican
ts
Ph.D. Degree
0
100
200
300
400
500
600
700
800
Yes No
188
786
29
119
Nu
mb
er o
f A
pp
lican
ts
Other Graduate Degree
Matched Not Matched
Charting Outcomes in the Match: U.S. MD Seniors, 2020
ORS Orthopaedic Surgery
Copyright ©2020 NRMP. Reproduction prohibited without the written permission of the NRMP.
135 Charting Outcomes in the Match: U.S. MD Seniors, 2020

Table ORS-1
Summary Statistics on U.S. MD SeniorsOrthopaedic Surgery
Measure (n=645) (n=159)
Matched Unmatched
12.3 7.0Mean number of contiguous ranks1.
1.0 1.2Mean number of distinct specialties ranked2.
248 239Mean USMLE Step 1 score3.
255 246Mean USMLE Step 2 score4.
5.4 5.7Mean number of research experiences5.
14.3 14.2Mean number of abstracts, presentations, and publications6.
3.6 3.8Mean number of work experiences7.
8.0 7.6Mean number of volunteer experiences8.
40.3 11.3Percentage who are AOA members9.
33.6 25.8Percentage who graduated from one of the 40 U.S. medical schools with the highest NIH funding
10.
0.8 0.7Percentage who have Ph.D. degree11.
16.7 25.2Percentage who have another graduate degree12.
Note: Only U.S. MD seniors who gave consent to use their information in research are included. Sources. NRMP Data Warehouse; Top 40 U.S. medical schools with the highest NIH funding in measure 10 is from the NIH website (http://report.nih.gov/award/index.cfm).
Copyright ©2020 NRMP. Reproduction prohibited without the written permission of the NRMP.
136 Charting Outcomes in the Match: U.S. MD Seniors, 2020

0
100
200
300
400
500
600
700
1 2 3 4 or More
619
241 1
131
24 2 2
Matched Not Matched
Distinct Specialties Ranked
Nu
mb
er o
f A
pp
lican
ts
0
20
40
60
80
100
120
140
160
1 2 3 4 5 6 7 8 9 10 11 12 13 14 15 16 orMore
0 28
1420 24
43 38 4248 44 47 45
6051
159
10 7 919 20 24
13 11 612
6 8 4 4 2 4
Matched Not Matched
Contiguous Ranks
Nu
mb
er o
f A
pp
lican
ts
Chart ORS-2
Number of Contiguous Ranks of U.S. MD SeniorsOrthopaedic Surgery
Source: NRMP Data Warehouse
Copyright ©2020 NRMP. Reproduction prohibited without the written permission of the NRMP.
137
Chart ORS-1
Number of Distinct Specialties Ranked by U.S. MD SeniorsOrthopaedic Surgery
Charting Outcomes in the Match: U.S. MD Seniors, 2020
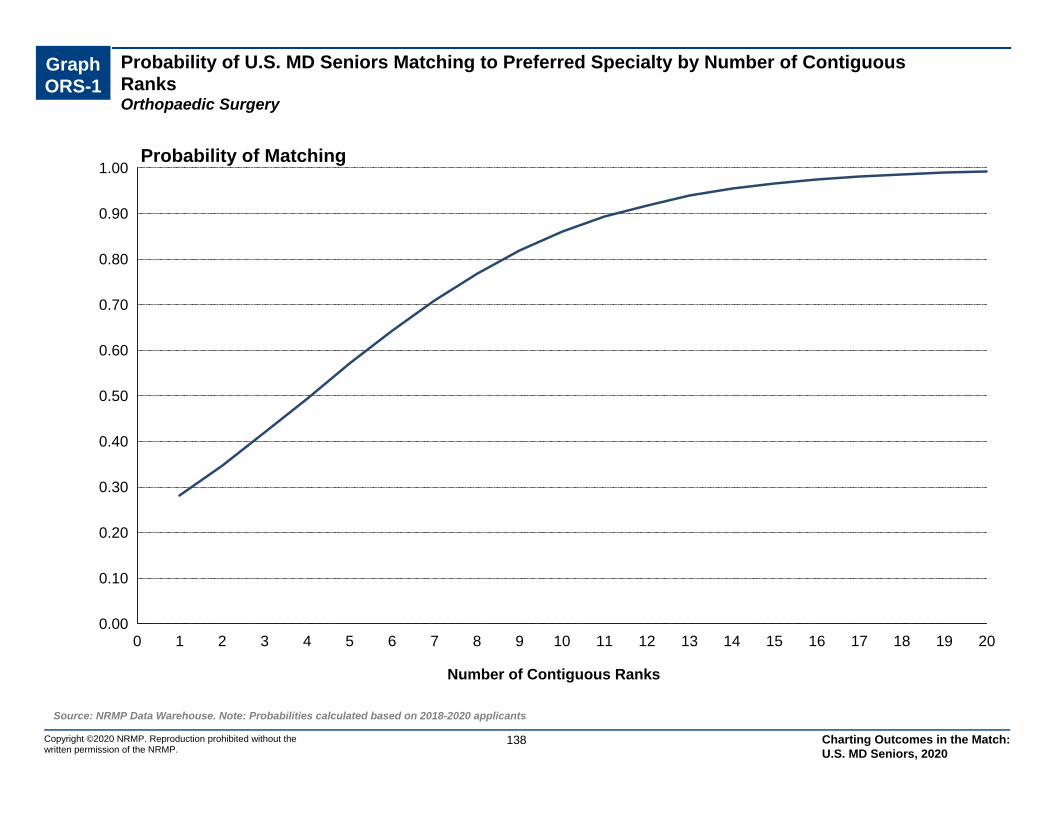
Probability of U.S. MD Seniors Matching to Preferred Specialty by Number of Contiguous RanksOrthopaedic Surgery
Graph ORS-1
0.00
0.10
0.20
0.30
0.40
0.50
0.60
0.70
0.80
0.90
1.00
0 1 2 3 4 5 6 7 8 9 10 11 12 13 14 15 16 17 18 19 20
Number of Contiguous Ranks
Probability of Matching
Source: NRMP Data Warehouse. Note: Probabilities calculated based on 2018-2020 applicants
138Copyright ©2020 NRMP. Reproduction prohibited without the written permission of the NRMP.
Charting Outcomes in the Match: U.S. MD Seniors, 2020

Chart ORS-3
USMLE Step 1 Scores of U.S. MD SeniorsOrthopaedic Surgery
0
40
80
120
160
200
240
<= 180 Between 181and 190
Between 191and 200
Between 201and 210
Between 211and 220
Between 221and 230
Between 231and 240
Between 241and 250
Between 251and 260
>260 ScoreUnknown
0 0 0 3 1127
108
209224
60
30 0 3 8 10 19
42 38 32
7 0
Matched Not Matched
Step 1 Scores
Nu
mb
er
of
Ap
pli
ca
nts
Source: NRMP Data Warehouse
139Copyright ©2020 NRMP. Reproduction prohibited without the written permission of the NRMP.
Chart ORS-4
USMLE Step 2 CK Scores of U.S. MD SeniorsOrthopaedic Surgery
0
40
80
120
160
200
240
280
<= 180 Between 181and 190
Between 191and 200
Between 201and 210
Between 211and 220
Between 221and 230
Between 231and 240
Between 241and 250
Between 251and 260
>260 ScoreUnknown
0 0 0 0 2 12
46
131
246
202
60 0 0 1 10 14 18
5241
203
Matched Not Matched
Step 2 CK Scores
Nu
mb
er o
f A
pp
lican
ts
Charting Outcomes in the Match: U.S. MD Seniors, 2020
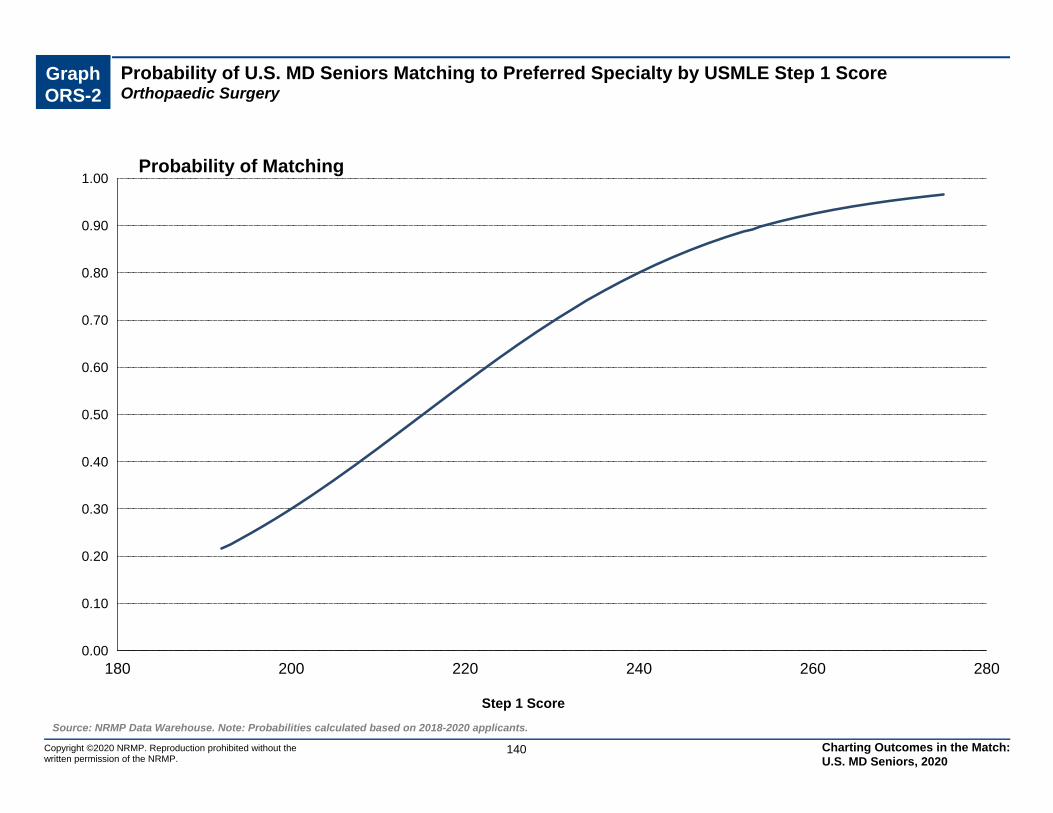
Graph ORS-2
Probability of U.S. MD Seniors Matching to Preferred Specialty by USMLE Step 1 ScoreOrthopaedic Surgery
0.00
0.10
0.20
0.30
0.40
0.50
0.60
0.70
0.80
0.90
1.00
180 200 220 240 260 280
Step 1 Score
Probability of Matching
Source: NRMP Data Warehouse. Note: Probabilities calculated based on 2018-2020 applicants.
140Copyright ©2020 NRMP. Reproduction prohibited without the written permission of the NRMP.
Charting Outcomes in the Match: U.S. MD Seniors, 2020
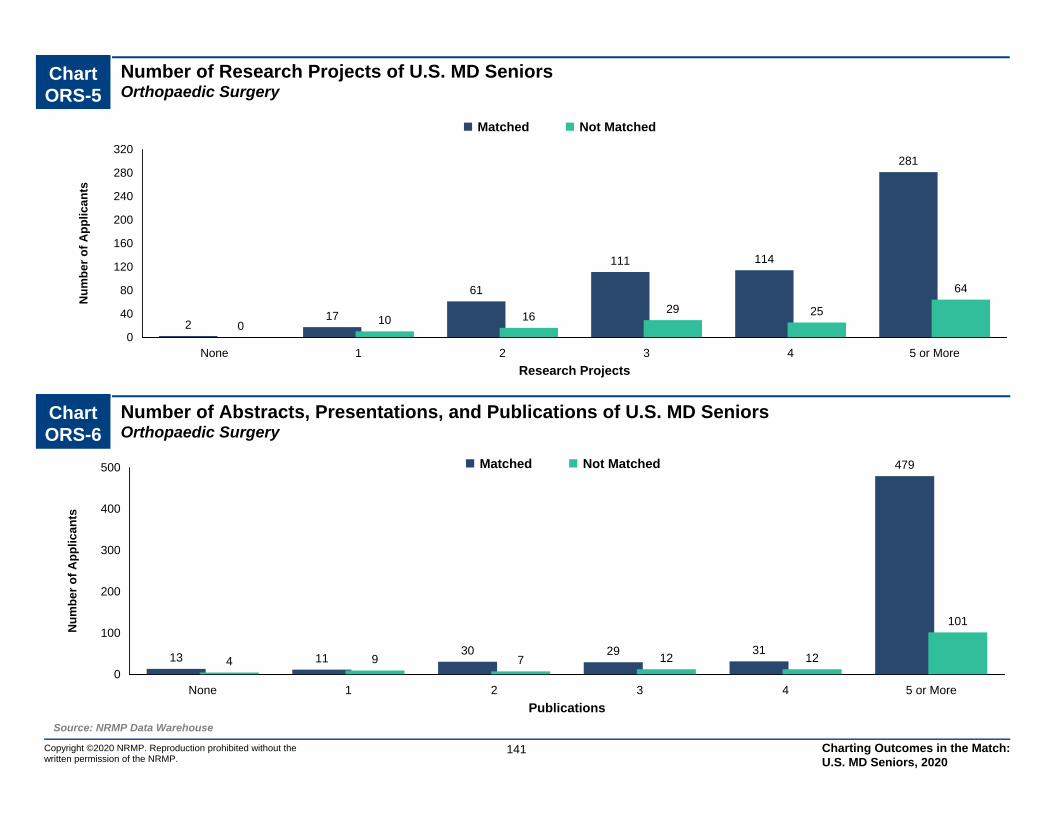
0
100
200
300
400
500
None 1 2 3 4 5 or More
13 1130 29 31
479
4 9 7 12 12
101
Matched Not Matched
Publications
Nu
mb
er o
f A
pp
lican
ts
0
40
80
120
160
200
240
280
320
None 1 2 3 4 5 or More
217
61
111 114
281
0 10 1629 25
64
Matched Not Matched
Research Projects
Nu
mb
er o
f A
pp
lican
tsChart ORS-5
Number of Research Projects of U.S. MD SeniorsOrthopaedic Surgery
Source: NRMP Data Warehouse
141Copyright ©2020 NRMP. Reproduction prohibited without the written permission of the NRMP.
Chart ORS-6
Number of Abstracts, Presentations, and Publications of U.S. MD SeniorsOrthopaedic Surgery
Charting Outcomes in the Match: U.S. MD Seniors, 2020
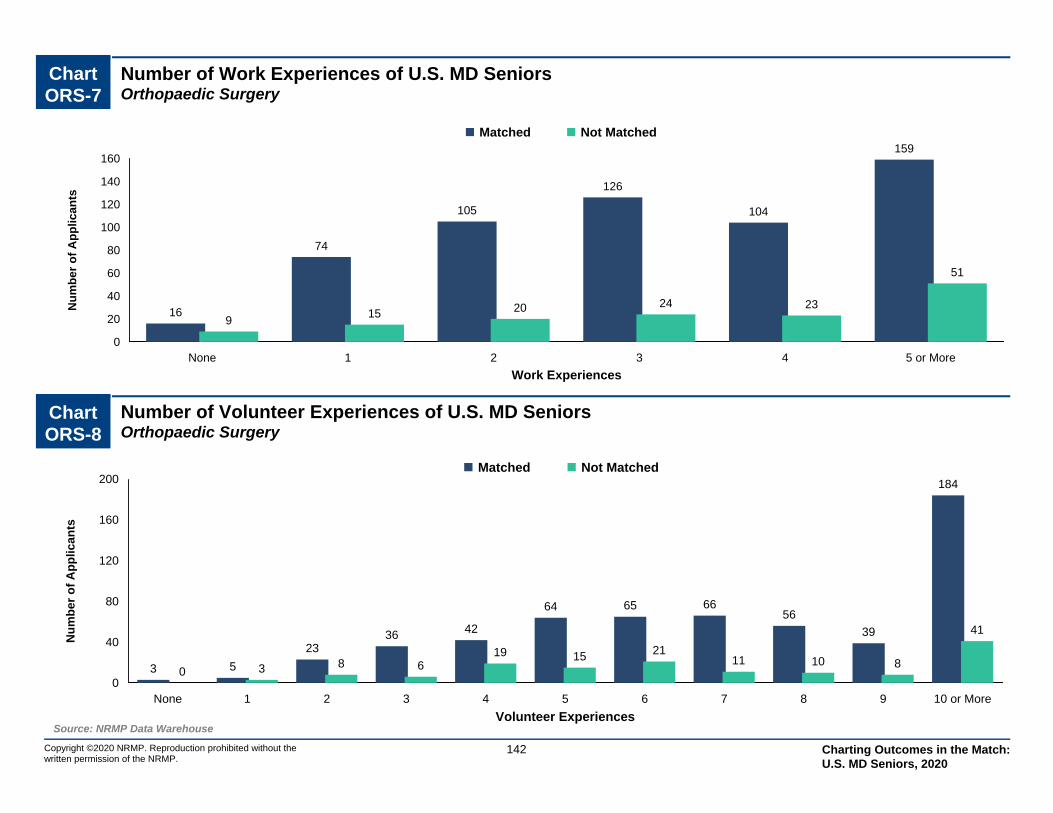
0
40
80
120
160
200
None 1 2 3 4 5 6 7 8 9 10 or More
3 5
2336 42
64 65 6656
39
184
0 3 8 619 15 21
11 10 8
41
Matched Not Matched
Volunteer Experiences
Nu
mb
er o
f A
pp
lican
ts
0
20
40
60
80
100
120
140
160
None 1 2 3 4 5 or More
16
74
105
126
104
159
915 20 24 23
51
Matched Not Matched
Work Experiences
Nu
mb
er o
f A
pp
lican
tsChart ORS-7
Number of Work Experiences of U.S. MD SeniorsOrthopaedic Surgery
Source: NRMP Data Warehouse
142Copyright ©2020 NRMP. Reproduction prohibited without the written permission of the NRMP.
Chart ORS-8
Number of Volunteer Experiences of U.S. MD SeniorsOrthopaedic Surgery
Charting Outcomes in the Match: U.S. MD Seniors, 2020

Chart ORS-9
Other Characteristics of U.S. MD SeniorsOrthopaedic Surgery
Copyright ©2020 NRMP. Reproduction prohibited without the written permission of the NRMP.
Source: NRMP Data Warehouse. Top 40 U.S. medical schools with the highest NIH funding from NIH: http://report.nih.gov/award/index.cfm
143
0
50
100
150
200
250
300
350
400
Yes No
260
351
18
131
Nu
mb
er
of
Ap
pli
ca
nts
AOA Membership
0
50
100
150
200
250
300
350
400
450
Yes No
217
428
41
118
Nu
mb
er o
f A
pp
lican
ts
Graduate of One of the 40 U.S. MedicalSchools with the Highest NIH Funding
0
100
200
300
400
500
600
700
Yes No
5
619
1
150Nu
mb
er o
f A
pp
lican
ts
Ph.D. Degree
0
100
200
300
400
500
600
Yes No
104
520
38
113Nu
mb
er o
f A
pp
lican
ts
Other Graduate Degree
Matched Not Matched
Charting Outcomes in the Match: U.S. MD Seniors, 2020
OTO Otolaryngology
Copyright ©2020 NRMP. Reproduction prohibited without the written permission of the NRMP.
144 Charting Outcomes in the Match: U.S. MD Seniors, 2020

Table OTO-1
Summary Statistics on U.S. MD SeniorsOtolaryngology
Measure (n=299) (n=96)
Matched Unmatched
13.1 7.1Mean number of contiguous ranks1.
1.1 1.2Mean number of distinct specialties ranked2.
248 243Mean USMLE Step 1 score3.
256 249Mean USMLE Step 2 score4.
6.1 5.5Mean number of research experiences5.
13.7 9.5Mean number of abstracts, presentations, and publications6.
3.5 3.6Mean number of work experiences7.
8.6 10.0Mean number of volunteer experiences8.
38.1 21.9Percentage who are AOA members9.
40.8 21.9Percentage who graduated from one of the 40 U.S. medical schools with the highest NIH funding
10.
2.8 2.1Percentage who have Ph.D. degree11.
16.7 17.0Percentage who have another graduate degree12.
Note: Only U.S. MD seniors who gave consent to use their information in research are included. Sources. NRMP Data Warehouse; Top 40 U.S. medical schools with the highest NIH funding in measure 10 is from the NIH website (http://report.nih.gov/award/index.cfm).
Copyright ©2020 NRMP. Reproduction prohibited without the written permission of the NRMP.
145 Charting Outcomes in the Match: U.S. MD Seniors, 2020
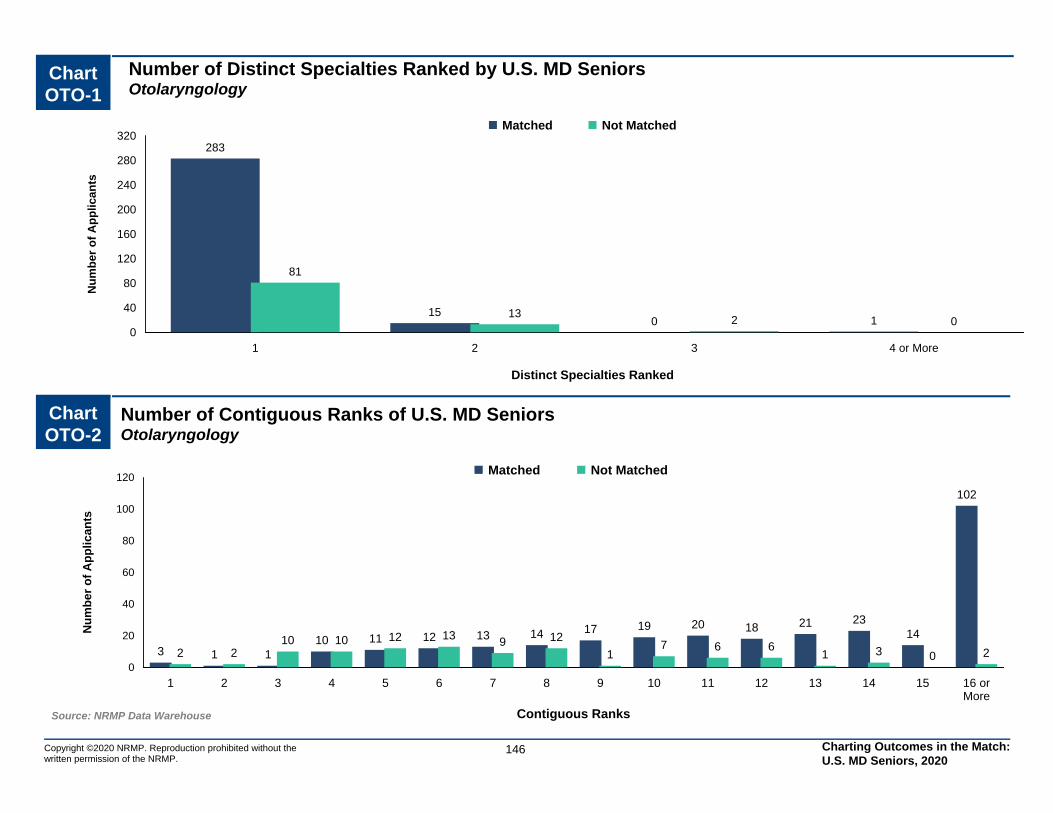
0
40
80
120
160
200
240
280
320
1 2 3 4 or More
283
150 1
81
132 0
Matched Not Matched
Distinct Specialties Ranked
Nu
mb
er o
f A
pp
lican
ts
0
20
40
60
80
100
120
1 2 3 4 5 6 7 8 9 10 11 12 13 14 15 16 orMore
3 1 110 11 12 13 14 17 19 20 18 21 23
14
102
2 210 10 12 13 9 12
17 6 6
1 3 0 2
Matched Not Matched
Contiguous Ranks
Nu
mb
er o
f A
pp
lican
ts
Chart OTO-2
Number of Contiguous Ranks of U.S. MD SeniorsOtolaryngology
Source: NRMP Data Warehouse
Copyright ©2020 NRMP. Reproduction prohibited without the written permission of the NRMP.
146
Chart OTO-1
Number of Distinct Specialties Ranked by U.S. MD SeniorsOtolaryngology
Charting Outcomes in the Match: U.S. MD Seniors, 2020
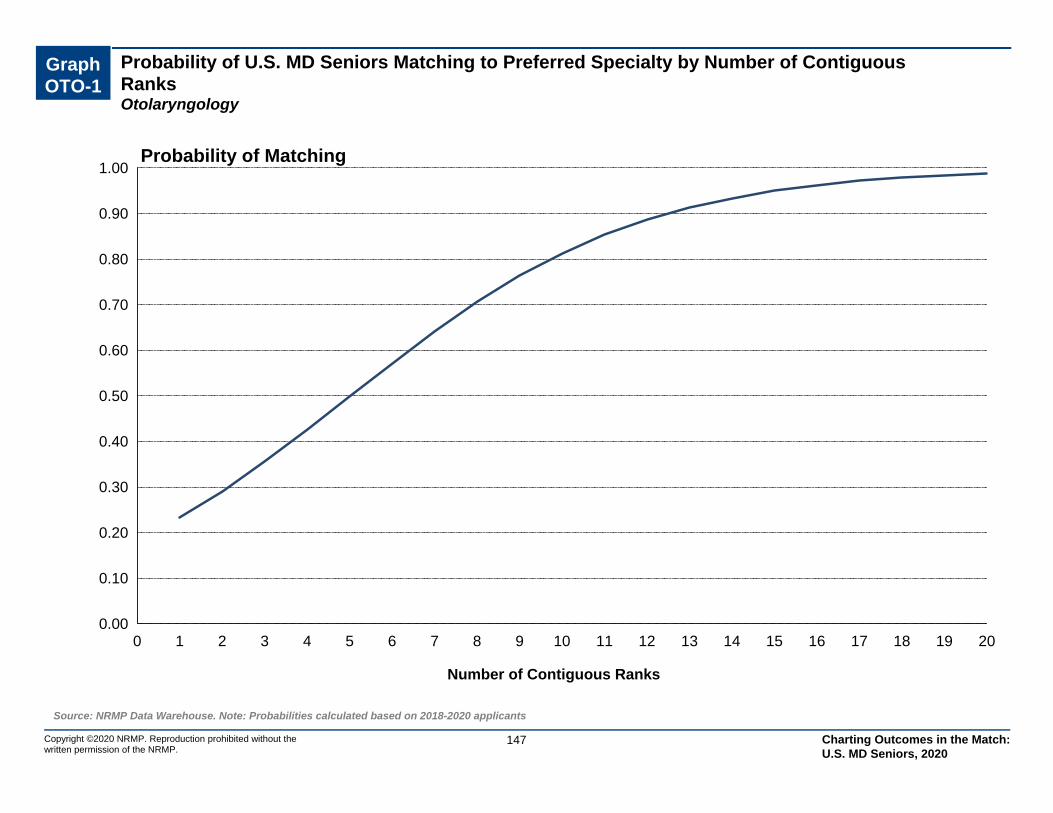
Probability of U.S. MD Seniors Matching to Preferred Specialty by Number of Contiguous RanksOtolaryngology
Graph OTO-1
0.00
0.10
0.20
0.30
0.40
0.50
0.60
0.70
0.80
0.90
1.00
0 1 2 3 4 5 6 7 8 9 10 11 12 13 14 15 16 17 18 19 20
Number of Contiguous Ranks
Probability of Matching
Source: NRMP Data Warehouse. Note: Probabilities calculated based on 2018-2020 applicants
147Copyright ©2020 NRMP. Reproduction prohibited without the written permission of the NRMP.
Charting Outcomes in the Match: U.S. MD Seniors, 2020
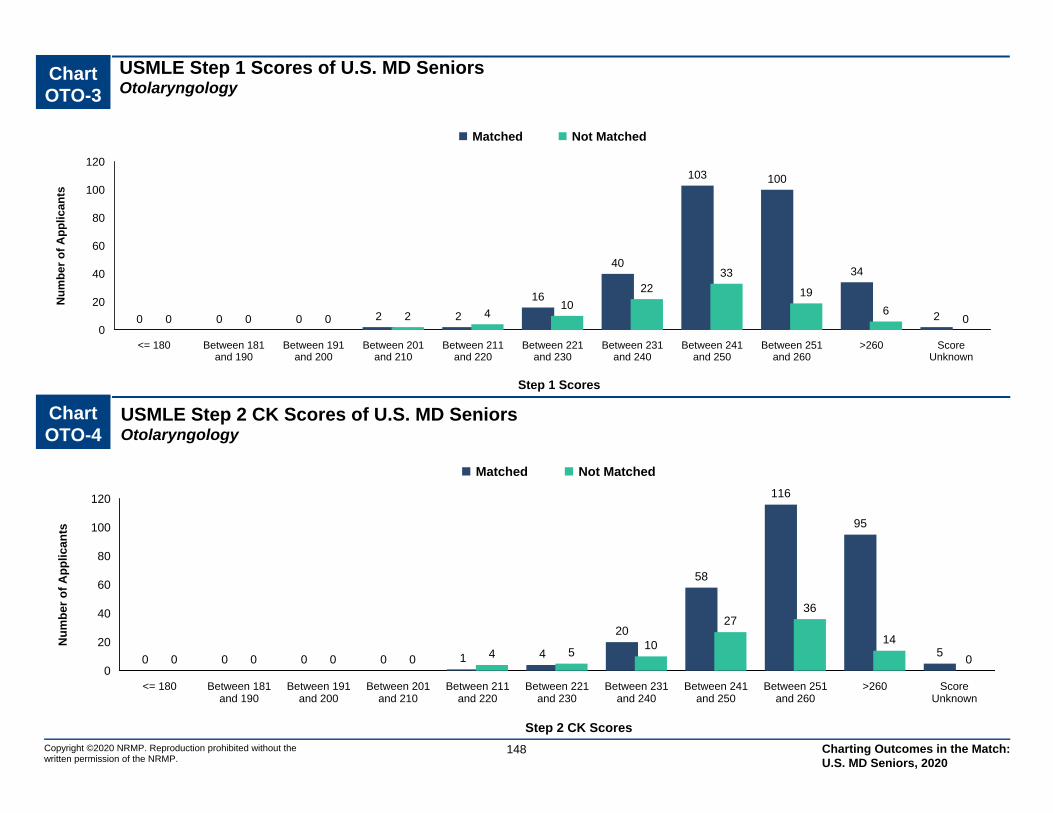
Chart OTO-3
USMLE Step 1 Scores of U.S. MD SeniorsOtolaryngology
0
20
40
60
80
100
120
<= 180 Between 181and 190
Between 191and 200
Between 201and 210
Between 211and 220
Between 221and 230
Between 231and 240
Between 241and 250
Between 251and 260
>260 ScoreUnknown
0 0 0 2 2
16
40
103 100
34
20 0 0 2 410
2233
19
60
Matched Not Matched
Step 1 Scores
Nu
mb
er
of
Ap
pli
ca
nts
Source: NRMP Data Warehouse
148Copyright ©2020 NRMP. Reproduction prohibited without the written permission of the NRMP.
Chart OTO-4
USMLE Step 2 CK Scores of U.S. MD SeniorsOtolaryngology
0
20
40
60
80
100
120
<= 180 Between 181and 190
Between 191and 200
Between 201and 210
Between 211and 220
Between 221and 230
Between 231and 240
Between 241and 250
Between 251and 260
>260 ScoreUnknown
0 0 0 0 1 4
20
58
116
95
50 0 0 0 4 5
10
2736
14
0
Matched Not Matched
Step 2 CK Scores
Nu
mb
er o
f A
pp
lican
ts
Charting Outcomes in the Match: U.S. MD Seniors, 2020
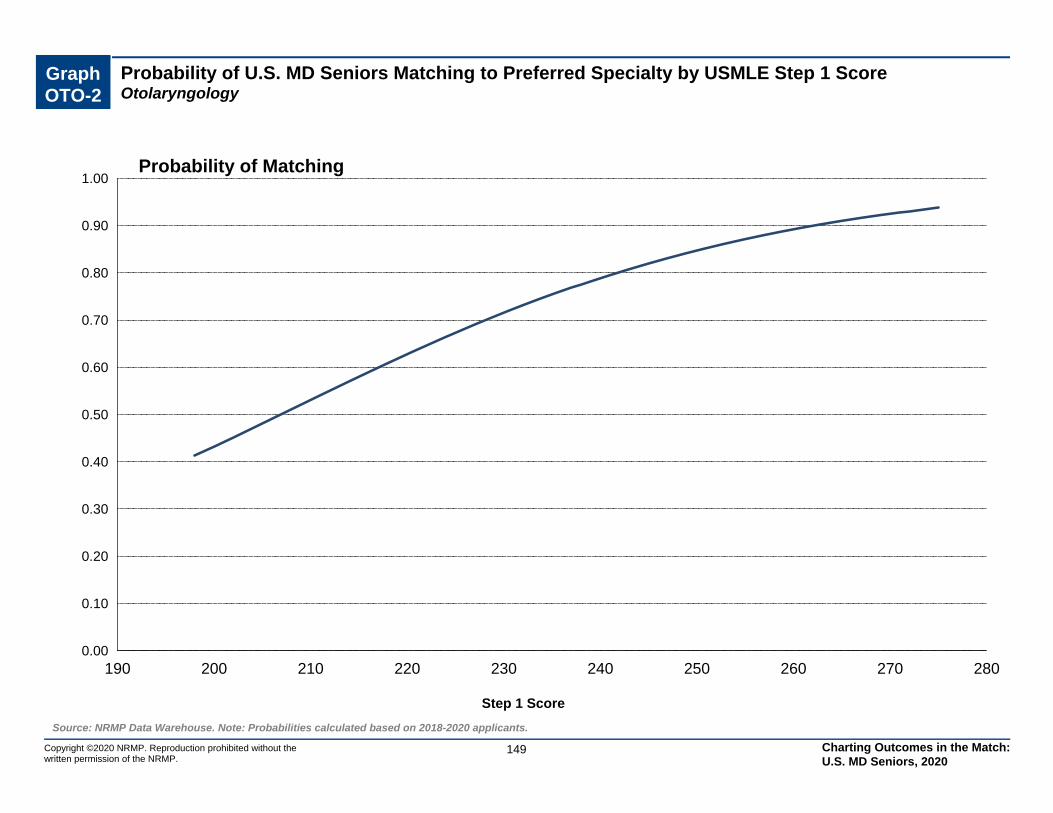
Graph OTO-2
Probability of U.S. MD Seniors Matching to Preferred Specialty by USMLE Step 1 ScoreOtolaryngology
0.00
0.10
0.20
0.30
0.40
0.50
0.60
0.70
0.80
0.90
1.00
190 200 210 220 230 240 250 260 270 280
Step 1 Score
Probability of Matching
Source: NRMP Data Warehouse. Note: Probabilities calculated based on 2018-2020 applicants.
149Copyright ©2020 NRMP. Reproduction prohibited without the written permission of the NRMP.
Charting Outcomes in the Match: U.S. MD Seniors, 2020
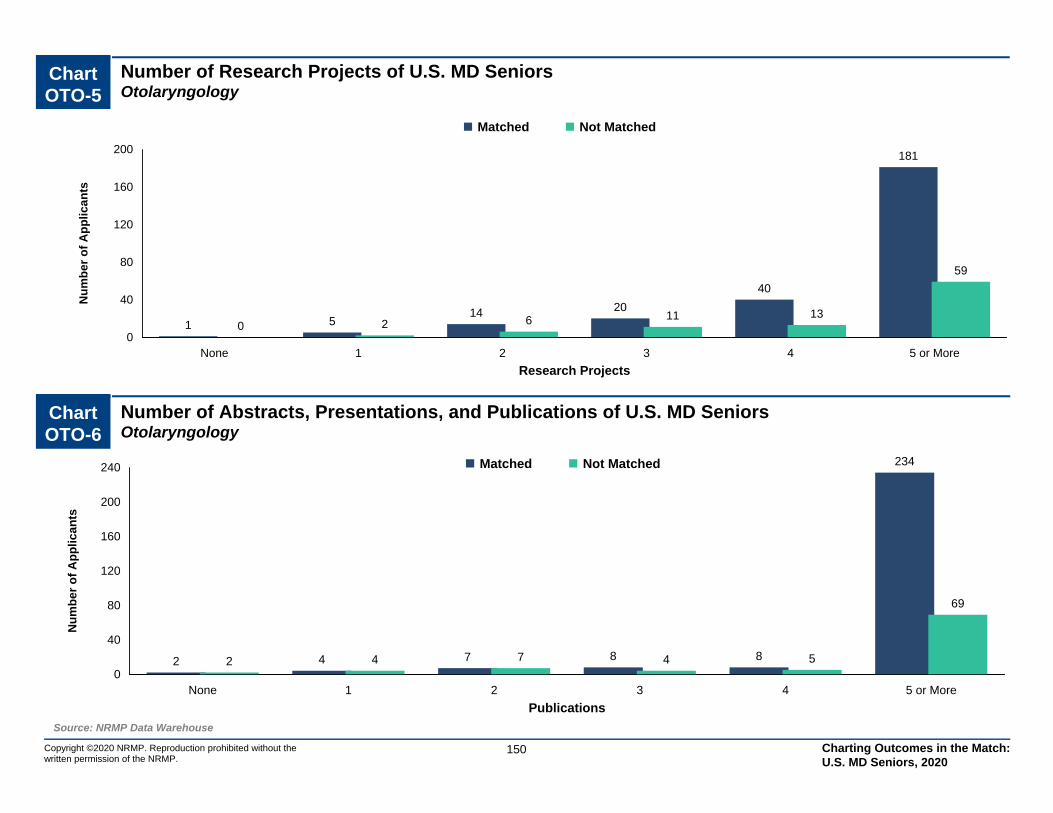
0
40
80
120
160
200
240
None 1 2 3 4 5 or More
2 4 7 8 8
234
2 4 7 4 5
69
Matched Not Matched
Publications
Nu
mb
er o
f A
pp
lican
ts
0
40
80
120
160
200
None 1 2 3 4 5 or More
1 514 20
40
181
0 2 6 11 13
59
Matched Not Matched
Research Projects
Nu
mb
er o
f A
pp
lican
tsChart OTO-5
Number of Research Projects of U.S. MD SeniorsOtolaryngology
Source: NRMP Data Warehouse
150Copyright ©2020 NRMP. Reproduction prohibited without the written permission of the NRMP.
Chart OTO-6
Number of Abstracts, Presentations, and Publications of U.S. MD SeniorsOtolaryngology
Charting Outcomes in the Match: U.S. MD Seniors, 2020
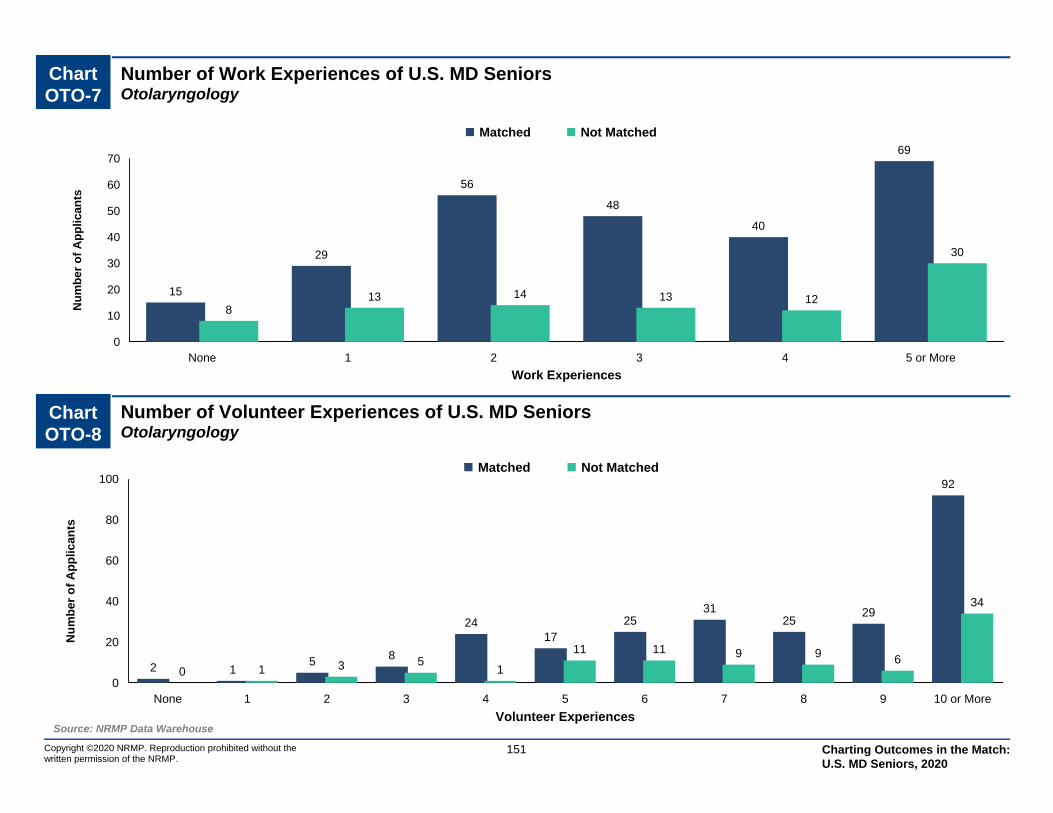
0
20
40
60
80
100
None 1 2 3 4 5 6 7 8 9 10 or More
2 15 8
2417
2531
2529
92
0 1 3 51
11 11 9 9 6
34
Matched Not Matched
Volunteer Experiences
Nu
mb
er o
f A
pp
lican
ts
0
10
20
30
40
50
60
70
None 1 2 3 4 5 or More
15
29
56
48
40
69
813 14 13 12
30
Matched Not Matched
Work Experiences
Nu
mb
er o
f A
pp
lican
tsChart OTO-7
Number of Work Experiences of U.S. MD SeniorsOtolaryngology
Source: NRMP Data Warehouse
151Copyright ©2020 NRMP. Reproduction prohibited without the written permission of the NRMP.
Chart OTO-8
Number of Volunteer Experiences of U.S. MD SeniorsOtolaryngology
Charting Outcomes in the Match: U.S. MD Seniors, 2020
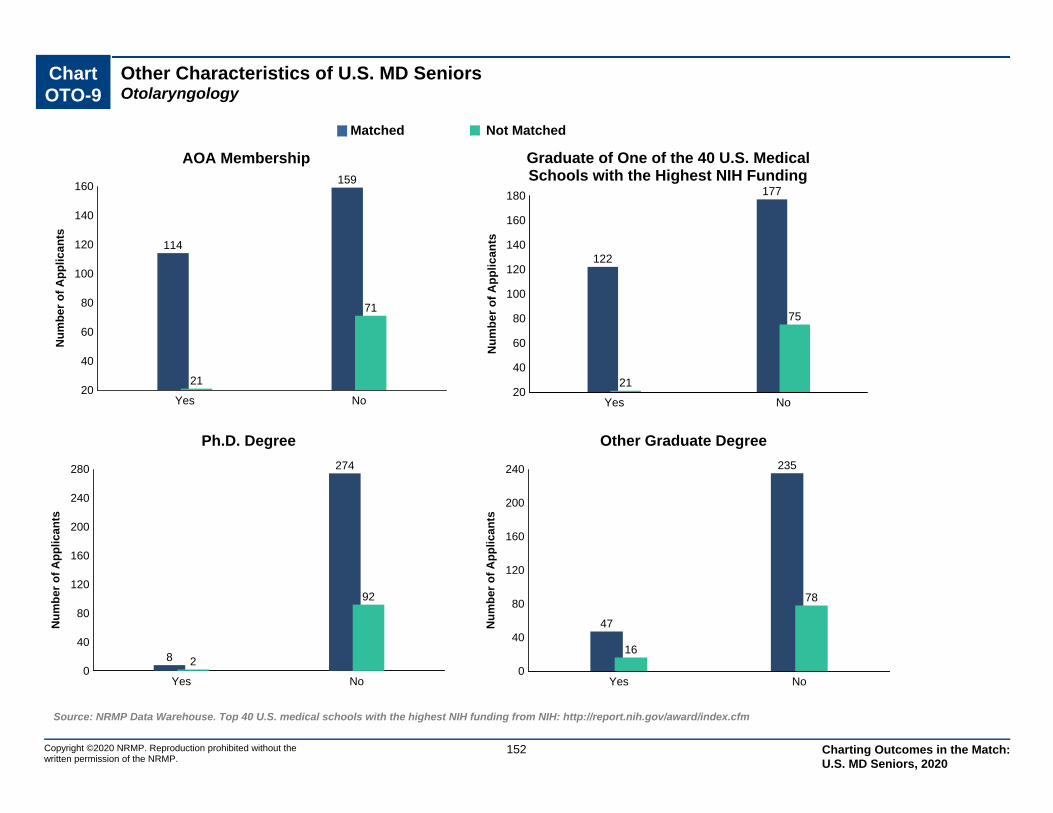
Chart OTO-9
Other Characteristics of U.S. MD SeniorsOtolaryngology
Copyright ©2020 NRMP. Reproduction prohibited without the written permission of the NRMP.
Source: NRMP Data Warehouse. Top 40 U.S. medical schools with the highest NIH funding from NIH: http://report.nih.gov/award/index.cfm
152
20
40
60
80
100
120
140
160
Yes No
114
159
21
71
Nu
mb
er
of
Ap
pli
ca
nts
AOA Membership
20
40
60
80
100
120
140
160
180
Yes No
122
177
21
75
Nu
mb
er o
f A
pp
lican
ts
Graduate of One of the 40 U.S. MedicalSchools with the Highest NIH Funding
0
40
80
120
160
200
240
280
Yes No
8
274
2
92
Nu
mb
er o
f A
pp
lican
ts
Ph.D. Degree
0
40
80
120
160
200
240
Yes No
47
235
16
78
Nu
mb
er o
f A
pp
lican
ts
Other Graduate Degree
Matched Not Matched
Charting Outcomes in the Match: U.S. MD Seniors, 2020
PTH Pathology
Copyright ©2020 NRMP. Reproduction prohibited without the written permission of the NRMP.
153 Charting Outcomes in the Match: U.S. MD Seniors, 2020

Table PTH-1
Summary Statistics on U.S. MD SeniorsPathology
Measure (n=182) (n=9)
Matched Unmatched
10.9 5.1Mean number of contiguous ranks1.
1.0 1.1Mean number of distinct specialties ranked2.
233 210Mean USMLE Step 1 score3.
242 225Mean USMLE Step 2 score4.
3.3 2.3Mean number of research experiences5.
7.3 3.7Mean number of abstracts, presentations, and publications6.
3.4 3.0Mean number of work experiences7.
6.2 4.1Mean number of volunteer experiences8.
11.0 0.0Percentage who are AOA members9.
36.3 11.1Percentage who graduated from one of the 40 U.S. medical schools with the highest NIH funding
10.
27.3 11.1Percentage who have Ph.D. degree11.
14.2 44.4Percentage who have another graduate degree12.
Note: Only U.S. MD seniors who gave consent to use their information in research are included. Sources. NRMP Data Warehouse; Top 40 U.S. medical schools with the highest NIH funding in measure 10 is from the NIH website (http://report.nih.gov/award/index.cfm).
Copyright ©2020 NRMP. Reproduction prohibited without the written permission of the NRMP.
154 Charting Outcomes in the Match: U.S. MD Seniors, 2020
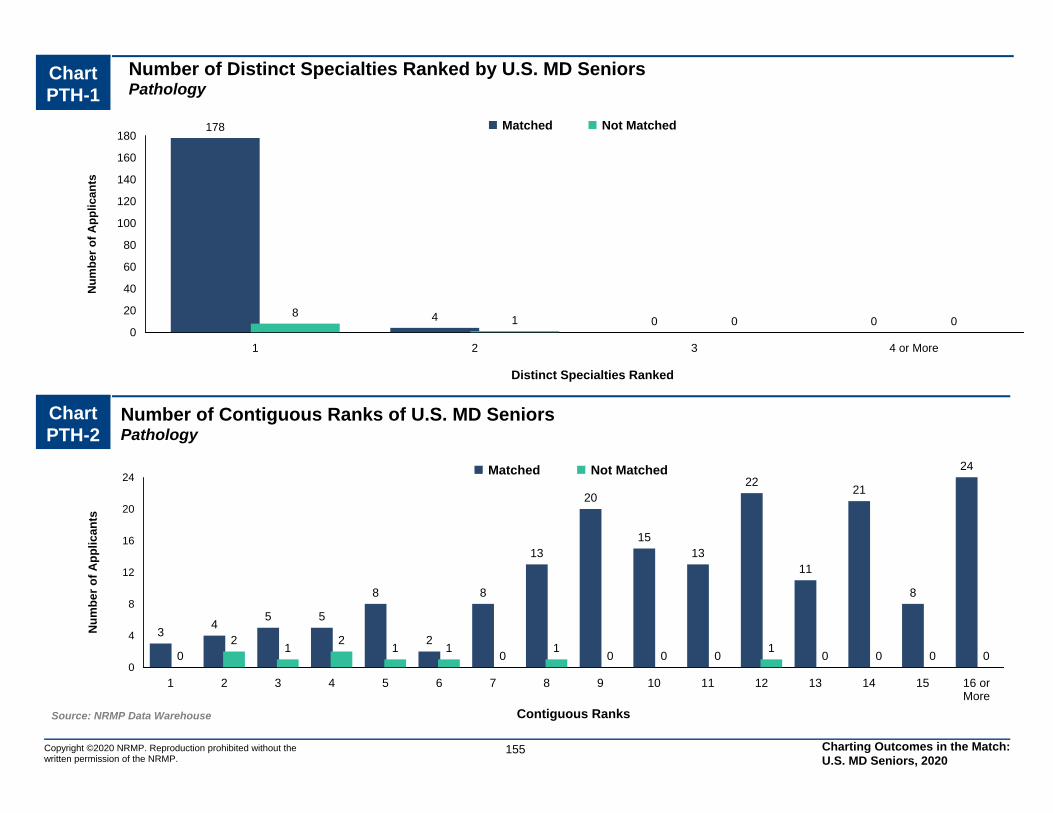
0
20
40
60
80
100
120
140
160
180
1 2 3 4 or More
178
4 0 08
1 0 0
Matched Not Matched
Distinct Specialties Ranked
Nu
mb
er o
f A
pp
lican
ts
0
4
8
12
16
20
24
1 2 3 4 5 6 7 8 9 10 11 12 13 14 15 16 orMore
34
5 5
8
2
8
13
20
1513
22
11
21
8
24
02
12
1 10
10 0 0
10 0 0 0
Matched Not Matched
Contiguous Ranks
Nu
mb
er o
f A
pp
lican
ts
Chart PTH-2
Number of Contiguous Ranks of U.S. MD SeniorsPathology
Source: NRMP Data Warehouse
Copyright ©2020 NRMP. Reproduction prohibited without the written permission of the NRMP.
155
Chart PTH-1
Number of Distinct Specialties Ranked by U.S. MD SeniorsPathology
Charting Outcomes in the Match: U.S. MD Seniors, 2020
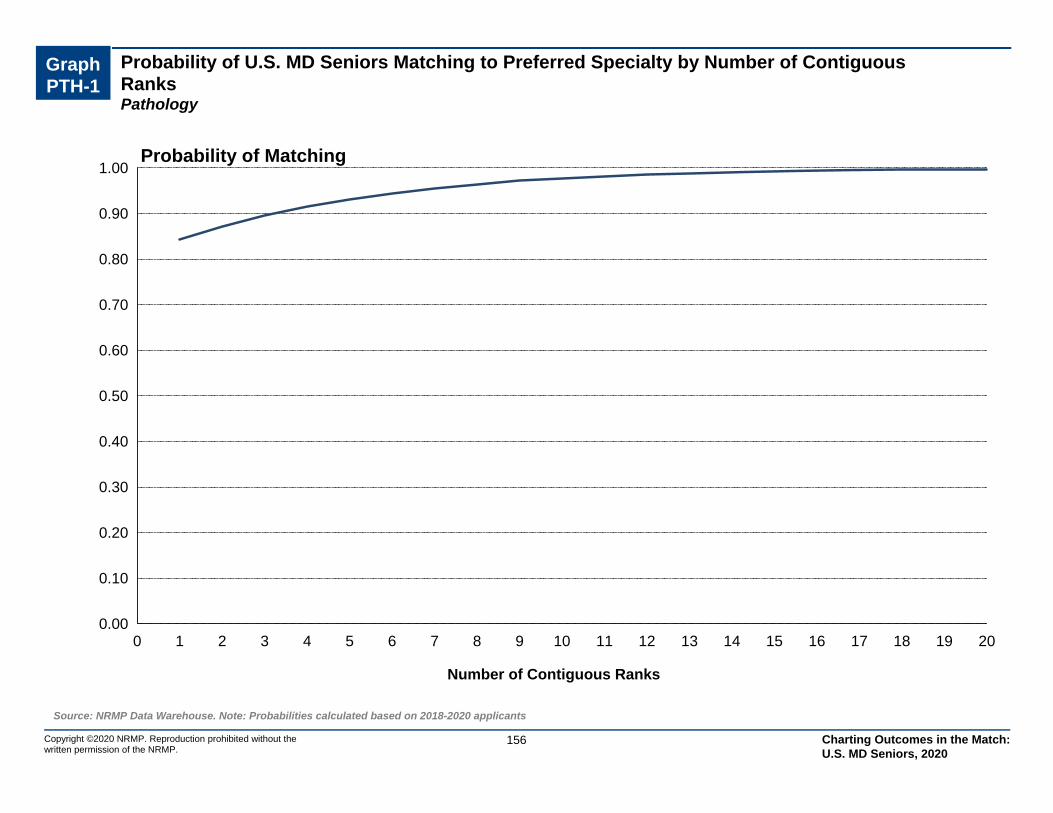
Probability of U.S. MD Seniors Matching to Preferred Specialty by Number of Contiguous RanksPathology
Graph PTH-1
0.00
0.10
0.20
0.30
0.40
0.50
0.60
0.70
0.80
0.90
1.00
0 1 2 3 4 5 6 7 8 9 10 11 12 13 14 15 16 17 18 19 20
Number of Contiguous Ranks
Probability of Matching
Source: NRMP Data Warehouse. Note: Probabilities calculated based on 2018-2020 applicants
156Copyright ©2020 NRMP. Reproduction prohibited without the written permission of the NRMP.
Charting Outcomes in the Match: U.S. MD Seniors, 2020
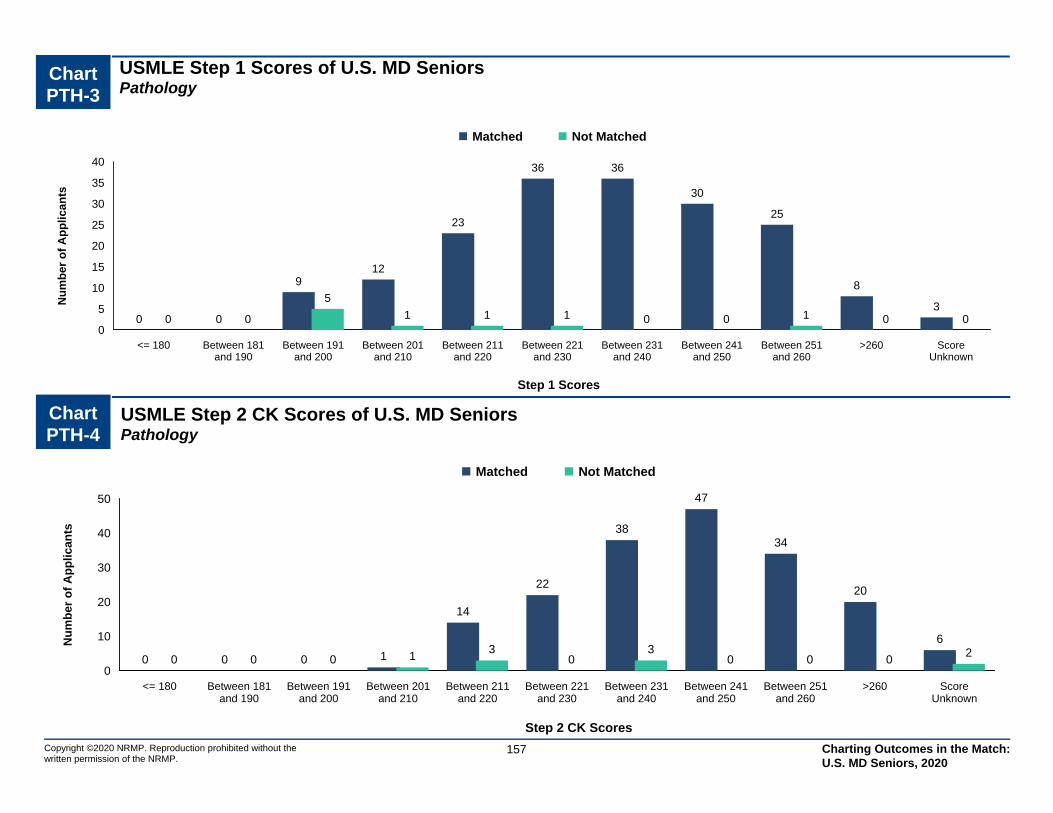
Chart PTH-3
USMLE Step 1 Scores of U.S. MD SeniorsPathology
0
5
10
15
20
25
30
35
40
<= 180 Between 181and 190
Between 191and 200
Between 201and 210
Between 211and 220
Between 221and 230
Between 231and 240
Between 241and 250
Between 251and 260
>260 ScoreUnknown
0 0
912
23
36 36
30
25
8
30 0
5
1 1 1 0 0 1 0 0
Matched Not Matched
Step 1 Scores
Nu
mb
er
of
Ap
pli
ca
nts
Source: NRMP Data Warehouse
157Copyright ©2020 NRMP. Reproduction prohibited without the written permission of the NRMP.
Chart PTH-4
USMLE Step 2 CK Scores of U.S. MD SeniorsPathology
0
10
20
30
40
50
<= 180 Between 181and 190
Between 191and 200
Between 201and 210
Between 211and 220
Between 221and 230
Between 231and 240
Between 241and 250
Between 251and 260
>260 ScoreUnknown
0 0 0 1
14
22
38
47
34
20
6
0 0 0 13
03
0 0 02
Matched Not Matched
Step 2 CK Scores
Nu
mb
er o
f A
pp
lican
ts
Charting Outcomes in the Match: U.S. MD Seniors, 2020

Graph PTH-2
Probability of U.S. MD Seniors Matching to Preferred Specialty by USMLE Step 1 ScorePathology
0.00
0.10
0.20
0.30
0.40
0.50
0.60
0.70
0.80
0.90
1.00
190 200 210 220 230 240 250 260 270 280
Step 1 Score
Probability of Matching
Source: NRMP Data Warehouse. Note: Probabilities calculated based on 2018-2020 applicants.
158Copyright ©2020 NRMP. Reproduction prohibited without the written permission of the NRMP.
Charting Outcomes in the Match: U.S. MD Seniors, 2020

0
10
20
30
40
50
60
70
80
None 1 2 3 4 5 or More
2115
1914 12
77
1 1 2 1 0 2
Matched Not Matched
Publications
Nu
mb
er o
f A
pp
lican
ts
0
5
10
15
20
25
30
35
40
None 1 2 3 4 5 or More
13
2124
37
26
37
13
1 1 02
Matched Not Matched
Research Projects
Nu
mb
er o
f A
pp
lican
tsChart PTH-5
Number of Research Projects of U.S. MD SeniorsPathology
Source: NRMP Data Warehouse
159Copyright ©2020 NRMP. Reproduction prohibited without the written permission of the NRMP.
Chart PTH-6
Number of Abstracts, Presentations, and Publications of U.S. MD SeniorsPathology
Charting Outcomes in the Match: U.S. MD Seniors, 2020
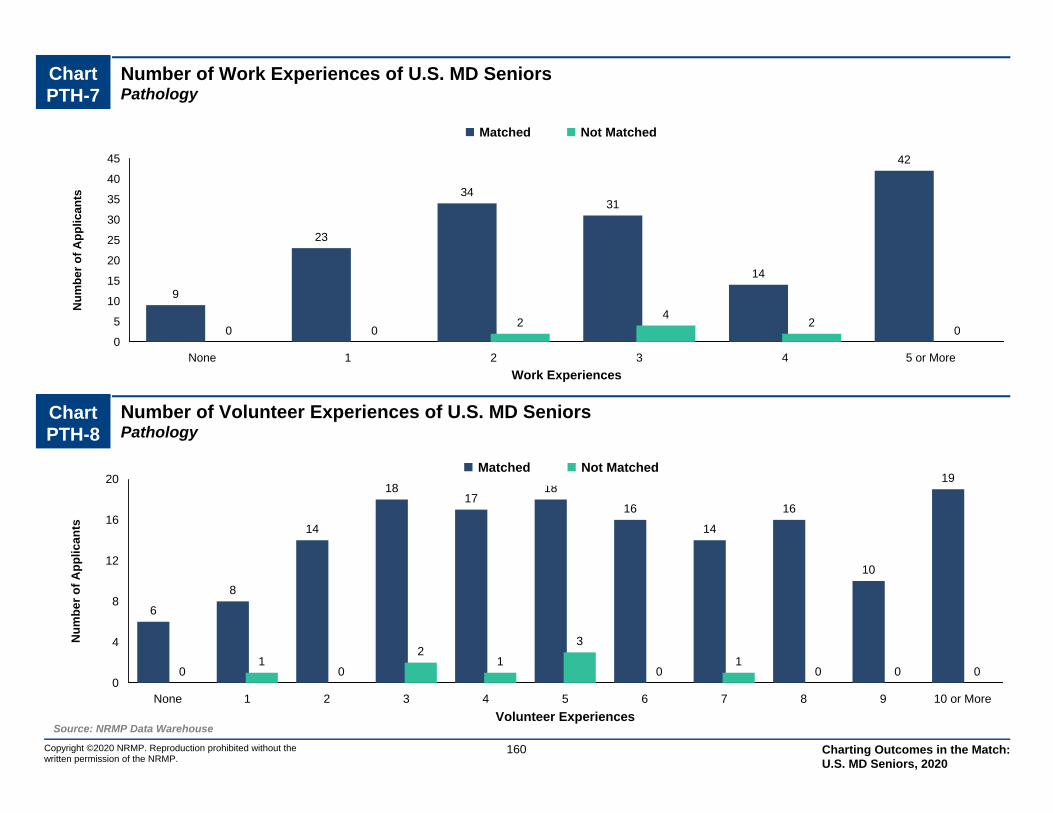
0
4
8
12
16
20
None 1 2 3 4 5 6 7 8 9 10 or More
6
8
14
1817
18
16
14
16
10
19
01
0
21
3
01
0 0 0
Matched Not Matched
Volunteer Experiences
Nu
mb
er o
f A
pp
lican
ts
0
5
10
15
20
25
30
35
40
45
None 1 2 3 4 5 or More
9
23
3431
14
42
0 02
42
0
Matched Not Matched
Work Experiences
Nu
mb
er o
f A
pp
lican
tsChart PTH-7
Number of Work Experiences of U.S. MD SeniorsPathology
Source: NRMP Data Warehouse
160Copyright ©2020 NRMP. Reproduction prohibited without the written permission of the NRMP.
Chart PTH-8
Number of Volunteer Experiences of U.S. MD SeniorsPathology
Charting Outcomes in the Match: U.S. MD Seniors, 2020
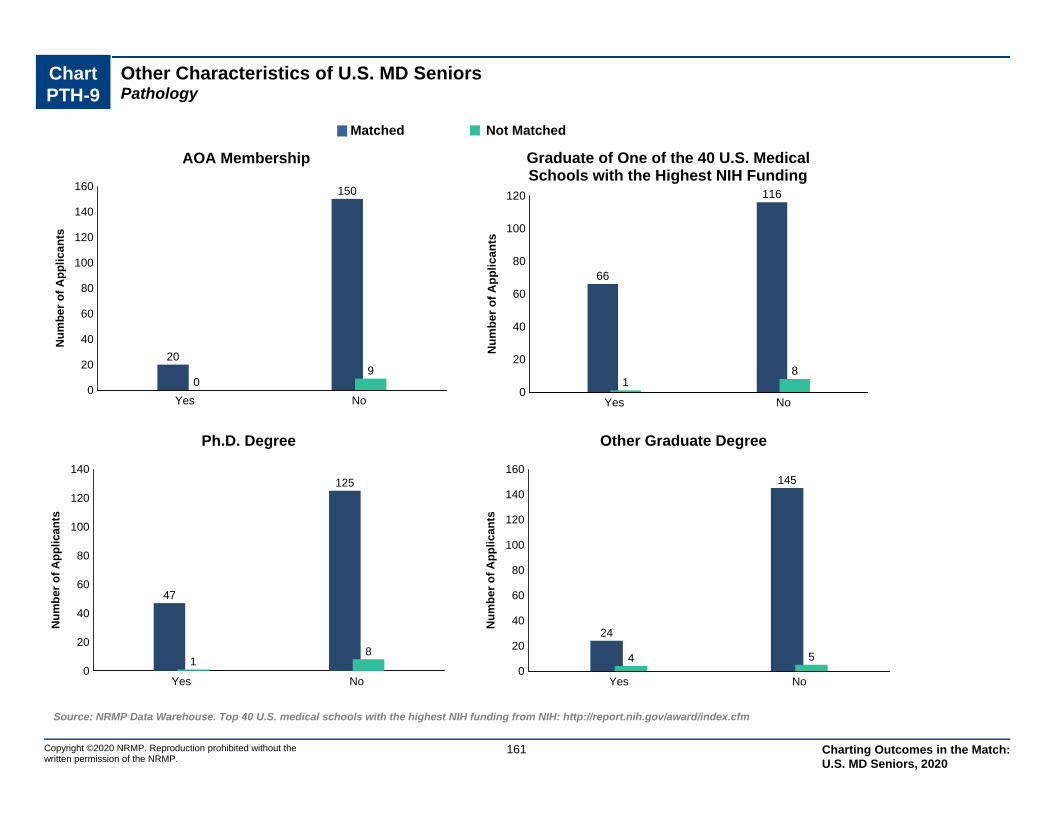
Chart PTH-9
Other Characteristics of U.S. MD SeniorsPathology
Copyright ©2020 NRMP. Reproduction prohibited without the written permission of the NRMP.
Source: NRMP Data Warehouse. Top 40 U.S. medical schools with the highest NIH funding from NIH: http://report.nih.gov/award/index.cfm
161
0
20
40
60
80
100
120
140
160
Yes No
20
150
09
Nu
mb
er
of
Ap
pli
ca
nts
AOA Membership
0
20
40
60
80
100
120
Yes No
66
116
18
Nu
mb
er o
f A
pp
lican
ts
Graduate of One of the 40 U.S. MedicalSchools with the Highest NIH Funding
0
20
40
60
80
100
120
140
Yes No
47
125
18
Nu
mb
er o
f A
pp
lican
ts
Ph.D. Degree
0
20
40
60
80
100
120
140
160
Yes No
24
145
4 5
Nu
mb
er o
f A
pp
lican
ts
Other Graduate Degree
Matched Not Matched
Charting Outcomes in the Match: U.S. MD Seniors, 2020
PD Pediatrics
Copyright ©2020 NRMP. Reproduction prohibited without the written permission of the NRMP.
162 Charting Outcomes in the Match: U.S. MD Seniors, 2020

Table PD-1
Summary Statistics on U.S. MD SeniorsPediatrics
Measure (n=1,633) (n=27)
Matched Unmatched
12.9 4.6Mean number of contiguous ranks1.
1.0 1.6Mean number of distinct specialties ranked2.
228 215Mean USMLE Step 1 score3.
245 232Mean USMLE Step 2 score4.
2.9 2.6Mean number of research experiences5.
4.9 4.6Mean number of abstracts, presentations, and publications6.
3.3 3.0Mean number of work experiences7.
8.8 9.3Mean number of volunteer experiences8.
12.3 3.7Percentage who are AOA members9.
26.9 14.8Percentage who graduated from one of the 40 U.S. medical schools with the highest NIH funding
10.
3.8 4.5Percentage who have Ph.D. degree11.
15.9 18.2Percentage who have another graduate degree12.
Note: Only U.S. MD seniors who gave consent to use their information in research are included. Sources. NRMP Data Warehouse; Top 40 U.S. medical schools with the highest NIH funding in measure 10 is from the NIH website (http://report.nih.gov/award/index.cfm).
Copyright ©2020 NRMP. Reproduction prohibited without the written permission of the NRMP.
163 Charting Outcomes in the Match: U.S. MD Seniors, 2020

0
200
400
600
800
1,000
1,200
1,400
1,600
1 2 3 4 or More
1,589
40 4 012 13 2 0
Matched Not Matched
Distinct Specialties Ranked
Nu
mb
er o
f A
pp
lican
ts
0
50
100
150
200
250
300
350
400
450
1 2 3 4 5 6 7 8 9 10 11 12 13 14 15 16 orMore
3311 13 12 20 28 37
5788
130150
192169
145128
420
8 6 3 0 2 0 2 2 2 0 0 0 0 0 0 2
Matched Not Matched
Contiguous Ranks
Nu
mb
er o
f A
pp
lican
ts
Chart PD-2
Number of Contiguous Ranks of U.S. MD SeniorsPediatrics
Source: NRMP Data Warehouse
Copyright ©2020 NRMP. Reproduction prohibited without the written permission of the NRMP.
164
Chart PD-1
Number of Distinct Specialties Ranked by U.S. MD SeniorsPediatrics
Charting Outcomes in the Match: U.S. MD Seniors, 2020
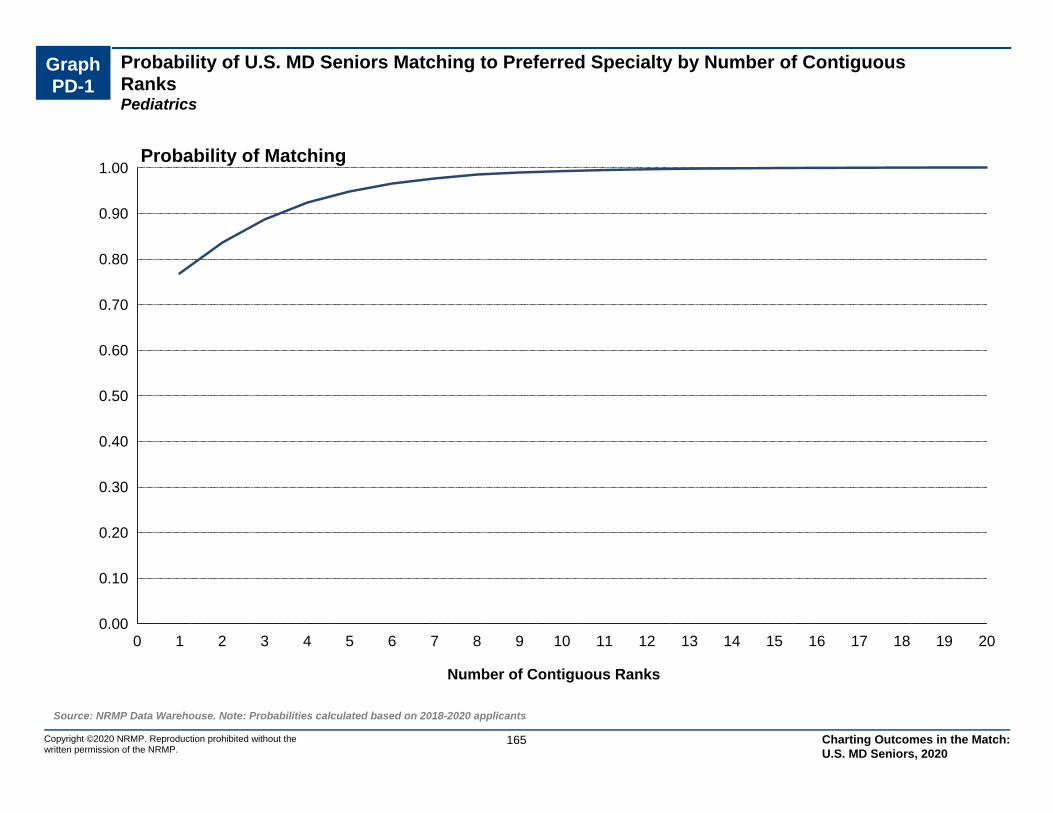
Probability of U.S. MD Seniors Matching to Preferred Specialty by Number of Contiguous RanksPediatrics
Graph PD-1
0.00
0.10
0.20
0.30
0.40
0.50
0.60
0.70
0.80
0.90
1.00
0 1 2 3 4 5 6 7 8 9 10 11 12 13 14 15 16 17 18 19 20
Number of Contiguous Ranks
Probability of Matching
Source: NRMP Data Warehouse. Note: Probabilities calculated based on 2018-2020 applicants
165Copyright ©2020 NRMP. Reproduction prohibited without the written permission of the NRMP.
Charting Outcomes in the Match: U.S. MD Seniors, 2020

Chart PD-3
USMLE Step 1 Scores of U.S. MD SeniorsPediatrics
0
50
100
150
200
250
300
350
<= 180 Between 181and 190
Between 191and 200
Between 201and 210
Between 211and 220
Between 221and 230
Between 231and 240
Between 241and 250
Between 251and 260
>260 ScoreUnknown
0 0
72
195
281
343
303
264
130
3114
0 0 6 6 5 3 3 0 0 1 3
Matched Not Matched
Step 1 Scores
Nu
mb
er
of
Ap
pli
ca
nts
Source: NRMP Data Warehouse
166Copyright ©2020 NRMP. Reproduction prohibited without the written permission of the NRMP.
Chart PD-4
USMLE Step 2 CK Scores of U.S. MD SeniorsPediatrics
0
50
100
150
200
250
300
350
400
450
<= 180 Between 181and 190
Between 191and 200
Between 201and 210
Between 211and 220
Between 221and 230
Between 231and 240
Between 241and 250
Between 251and 260
>260 ScoreUnknown
0 0 0 4
78
180
329
438
363
219
220 0 0 0 9 3 3 5 2 2 3
Matched Not Matched
Step 2 CK Scores
Nu
mb
er o
f A
pp
lican
ts
Charting Outcomes in the Match: U.S. MD Seniors, 2020
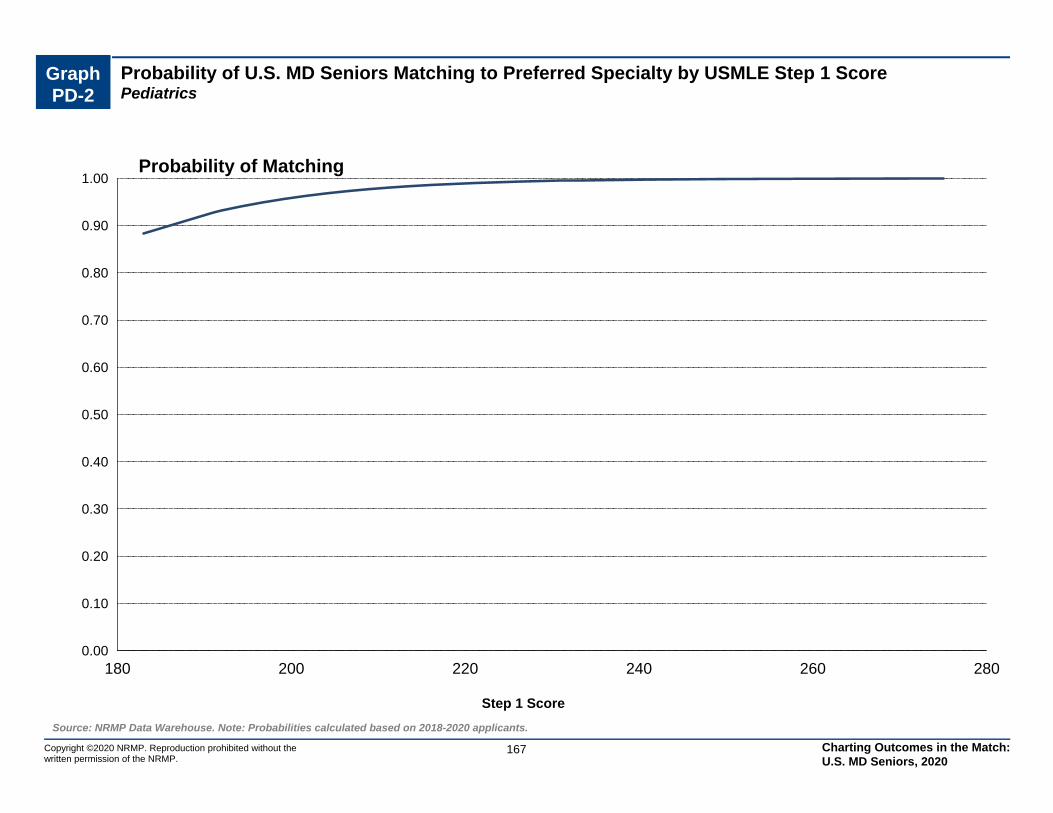
Graph PD-2
Probability of U.S. MD Seniors Matching to Preferred Specialty by USMLE Step 1 ScorePediatrics
0.00
0.10
0.20
0.30
0.40
0.50
0.60
0.70
0.80
0.90
1.00
180 200 220 240 260 280
Step 1 Score
Probability of Matching
Source: NRMP Data Warehouse. Note: Probabilities calculated based on 2018-2020 applicants.
167Copyright ©2020 NRMP. Reproduction prohibited without the written permission of the NRMP.
Charting Outcomes in the Match: U.S. MD Seniors, 2020
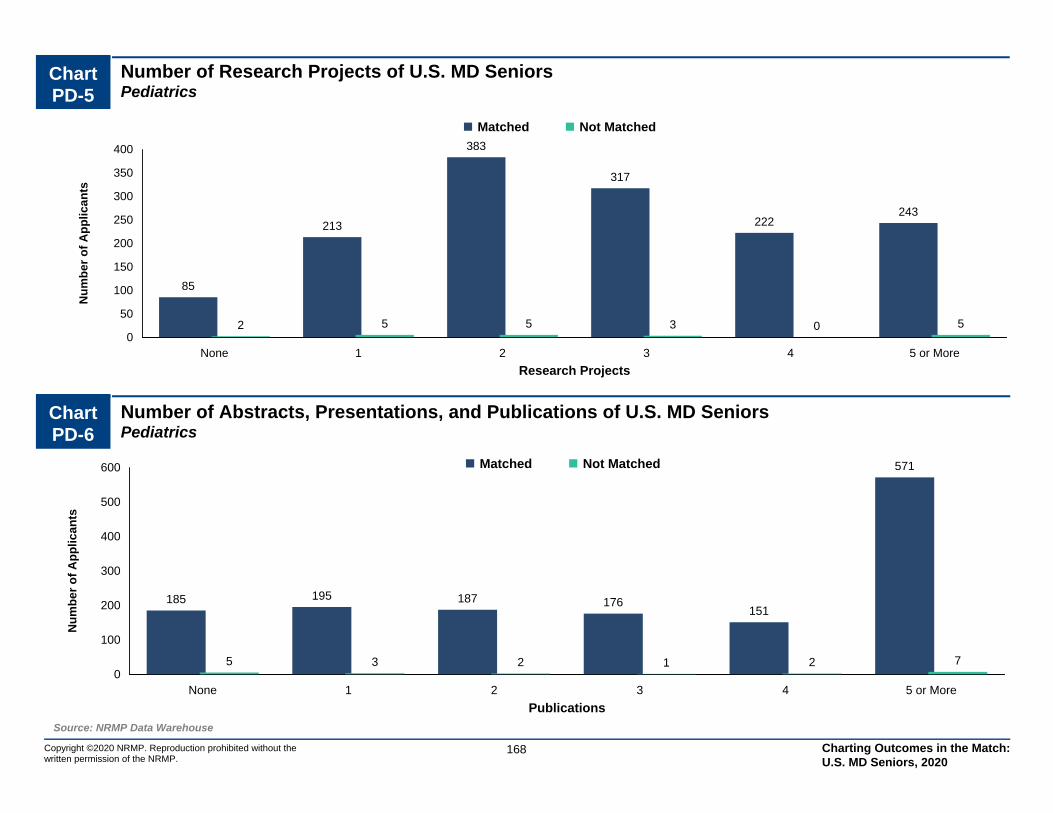
0
100
200
300
400
500
600
None 1 2 3 4 5 or More
185 195 187 176151
571
5 3 2 1 2 7
Matched Not Matched
Publications
Nu
mb
er o
f A
pp
lican
ts
0
50
100
150
200
250
300
350
400
None 1 2 3 4 5 or More
85
213
383
317
222243
2 5 5 3 0 5
Matched Not Matched
Research Projects
Nu
mb
er o
f A
pp
lican
tsChart PD-5
Number of Research Projects of U.S. MD SeniorsPediatrics
Source: NRMP Data Warehouse
168Copyright ©2020 NRMP. Reproduction prohibited without the written permission of the NRMP.
Chart PD-6
Number of Abstracts, Presentations, and Publications of U.S. MD SeniorsPediatrics
Charting Outcomes in the Match: U.S. MD Seniors, 2020
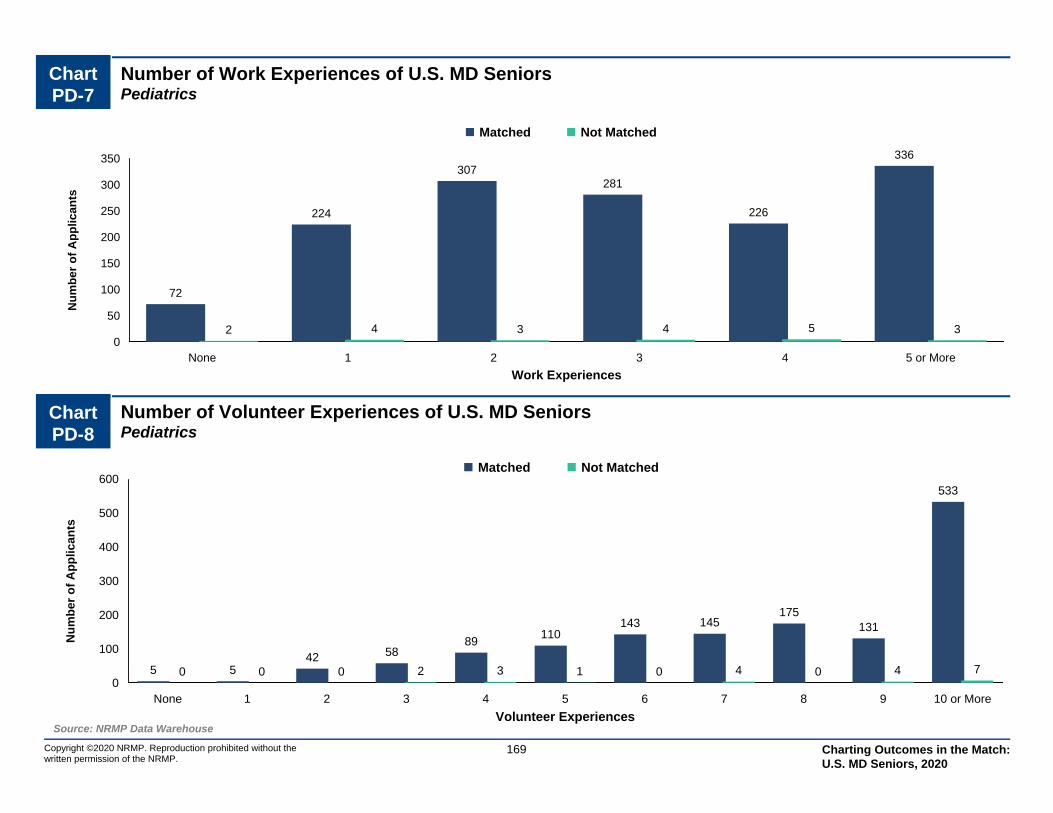
0
100
200
300
400
500
600
None 1 2 3 4 5 6 7 8 9 10 or More
5 542 58
89110
143 145175
131
533
0 0 0 2 3 1 0 4 0 4 7
Matched Not Matched
Volunteer Experiences
Nu
mb
er o
f A
pp
lican
ts
0
50
100
150
200
250
300
350
None 1 2 3 4 5 or More
72
224
307281
226
336
2 4 3 4 5 3
Matched Not Matched
Work Experiences
Nu
mb
er o
f A
pp
lican
tsChart PD-7
Number of Work Experiences of U.S. MD SeniorsPediatrics
Source: NRMP Data Warehouse
169Copyright ©2020 NRMP. Reproduction prohibited without the written permission of the NRMP.
Chart PD-8
Number of Volunteer Experiences of U.S. MD SeniorsPediatrics
Charting Outcomes in the Match: U.S. MD Seniors, 2020
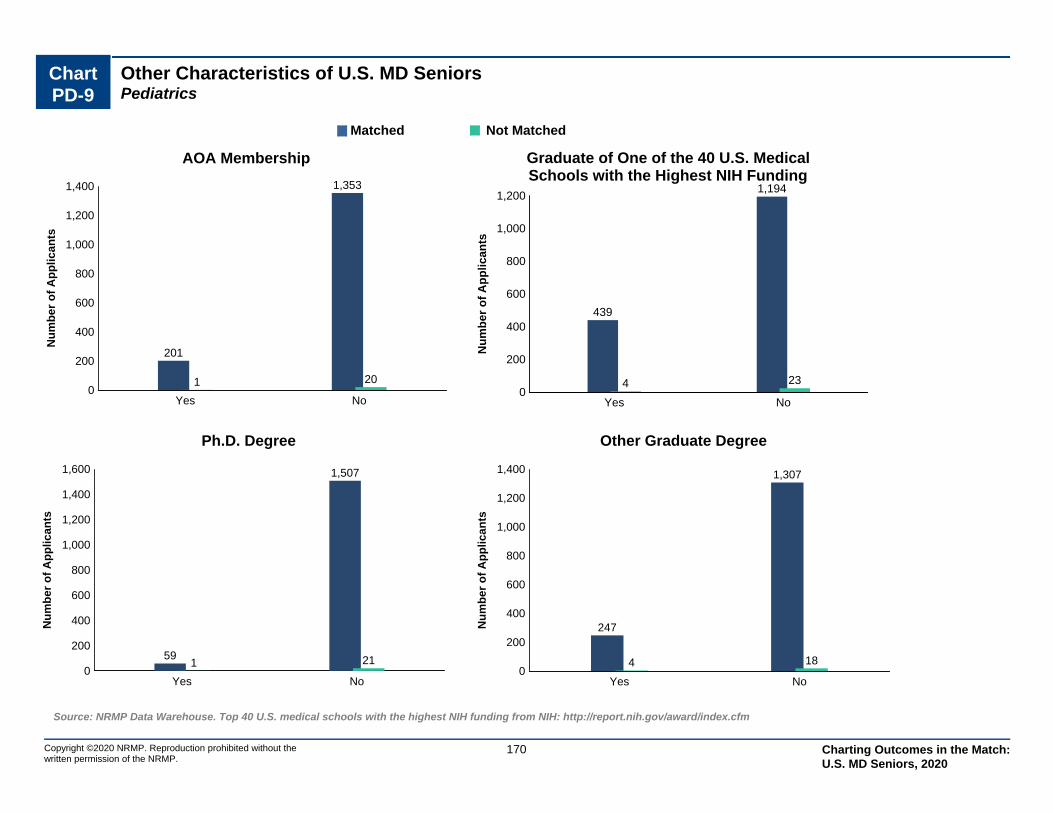
Chart PD-9
Other Characteristics of U.S. MD SeniorsPediatrics
Copyright ©2020 NRMP. Reproduction prohibited without the written permission of the NRMP.
Source: NRMP Data Warehouse. Top 40 U.S. medical schools with the highest NIH funding from NIH: http://report.nih.gov/award/index.cfm
170
0
200
400
600
800
1,000
1,200
1,400
Yes No
201
1,353
1 20
Nu
mb
er
of
Ap
pli
ca
nts
AOA Membership
0
200
400
600
800
1,000
1,200
Yes No
439
1,194
4 23
Nu
mb
er o
f A
pp
lican
ts
Graduate of One of the 40 U.S. MedicalSchools with the Highest NIH Funding
0
200
400
600
800
1,000
1,200
1,400
1,600
Yes No
59
1,507
1 21
Nu
mb
er o
f A
pp
lican
ts
Ph.D. Degree
0
200
400
600
800
1,000
1,200
1,400
Yes No
247
1,307
4 18
Nu
mb
er o
f A
pp
lican
ts
Other Graduate Degree
Matched Not Matched
Charting Outcomes in the Match: U.S. MD Seniors, 2020
PM Physical Medicine and Rehabilitation
Copyright ©2020 NRMP. Reproduction prohibited without the written permission of the NRMP.
171 Charting Outcomes in the Match: U.S. MD Seniors, 2020

Table PM-1
Summary Statistics on U.S. MD SeniorsPhysical Medicine and Rehabilitation
Measure (n=221) (n=25)
Matched Unmatched
13.5 6.2Mean number of contiguous ranks1.
1.7 2.3Mean number of distinct specialties ranked2.
228 216Mean USMLE Step 1 score3.
241 228Mean USMLE Step 2 score4.
3.1 3.0Mean number of research experiences5.
5.5 5.5Mean number of abstracts, presentations, and publications6.
3.5 3.3Mean number of work experiences7.
8.3 8.5Mean number of volunteer experiences8.
5.0 0.0Percentage who are AOA members9.
21.7 20.0Percentage who graduated from one of the 40 U.S. medical schools with the highest NIH funding
10.
1.4 4.5Percentage who have Ph.D. degree11.
12.2 18.2Percentage who have another graduate degree12.
Note: Only U.S. MD seniors who gave consent to use their information in research are included. Sources. NRMP Data Warehouse; Top 40 U.S. medical schools with the highest NIH funding in measure 10 is from the NIH website (http://report.nih.gov/award/index.cfm).
Copyright ©2020 NRMP. Reproduction prohibited without the written permission of the NRMP.
172 Charting Outcomes in the Match: U.S. MD Seniors, 2020
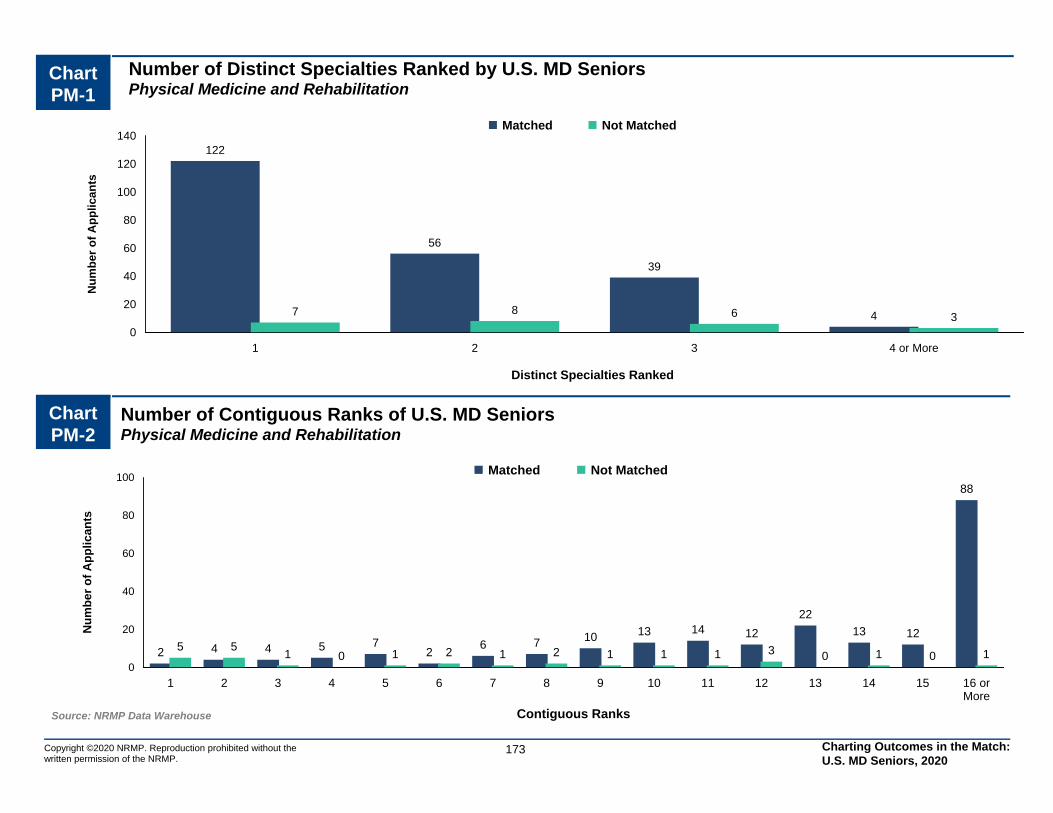
0
20
40
60
80
100
120
140
1 2 3 4 or More
122
56
39
47 8 6 3
Matched Not Matched
Distinct Specialties Ranked
Nu
mb
er o
f A
pp
lican
ts
0
20
40
60
80
100
1 2 3 4 5 6 7 8 9 10 11 12 13 14 15 16 orMore
2 4 4 5 72
6 7 10 13 14 12
22
13 12
88
5 51 0 1 2 1 2 1 1 1 3 0 1 0 1
Matched Not Matched
Contiguous Ranks
Nu
mb
er o
f A
pp
lican
ts
Chart PM-2
Number of Contiguous Ranks of U.S. MD SeniorsPhysical Medicine and Rehabilitation
Source: NRMP Data Warehouse
Copyright ©2020 NRMP. Reproduction prohibited without the written permission of the NRMP.
173
Chart PM-1
Number of Distinct Specialties Ranked by U.S. MD SeniorsPhysical Medicine and Rehabilitation
Charting Outcomes in the Match: U.S. MD Seniors, 2020
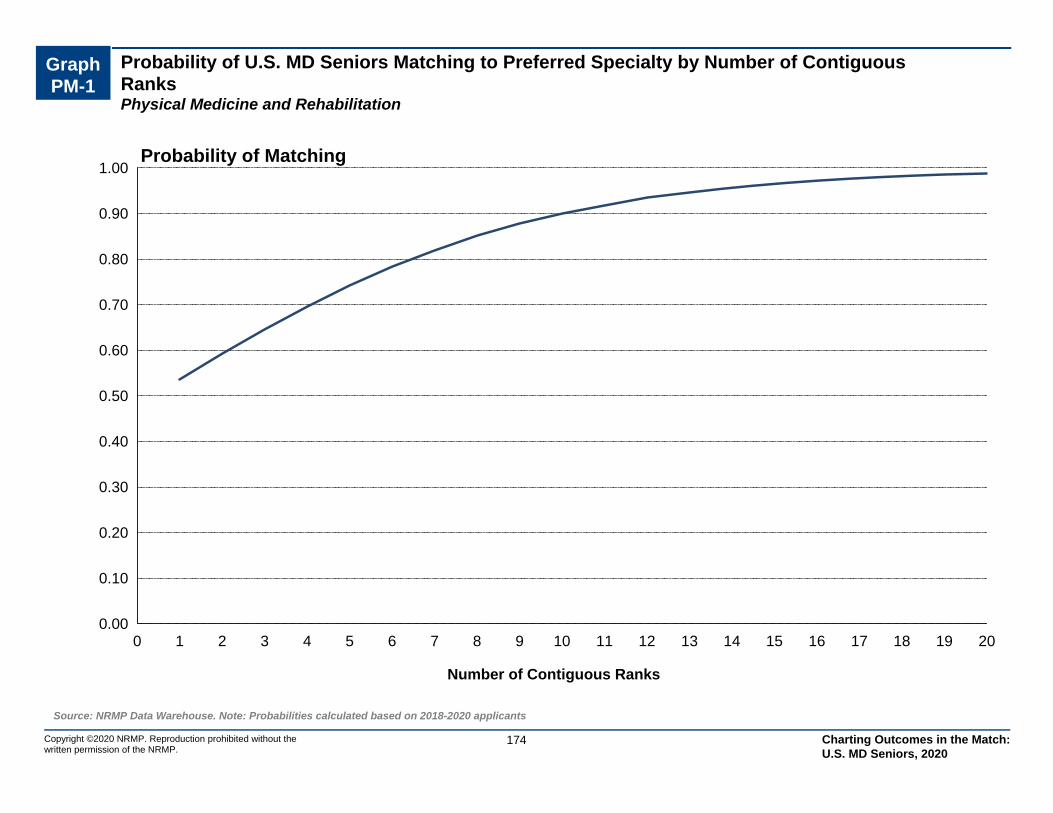
Probability of U.S. MD Seniors Matching to Preferred Specialty by Number of Contiguous RanksPhysical Medicine and Rehabilitation
Graph PM-1
0.00
0.10
0.20
0.30
0.40
0.50
0.60
0.70
0.80
0.90
1.00
0 1 2 3 4 5 6 7 8 9 10 11 12 13 14 15 16 17 18 19 20
Number of Contiguous Ranks
Probability of Matching
Source: NRMP Data Warehouse. Note: Probabilities calculated based on 2018-2020 applicants
174Copyright ©2020 NRMP. Reproduction prohibited without the written permission of the NRMP.
Charting Outcomes in the Match: U.S. MD Seniors, 2020

Chart PM-3
USMLE Step 1 Scores of U.S. MD SeniorsPhysical Medicine and Rehabilitation
0
10
20
30
40
50
60
<= 180 Between 181and 190
Between 191and 200
Between 201and 210
Between 211and 220
Between 221and 230
Between 231and 240
Between 241and 250
Between 251and 260
>260 ScoreUnknown
0 0
7
24
39
45
59
27
13
520 0
4 63 5
2 1 1 03
Matched Not Matched
Step 1 Scores
Nu
mb
er
of
Ap
pli
ca
nts
Source: NRMP Data Warehouse
175Copyright ©2020 NRMP. Reproduction prohibited without the written permission of the NRMP.
Chart PM-4
USMLE Step 2 CK Scores of U.S. MD SeniorsPhysical Medicine and Rehabilitation
0
10
20
30
40
50
60
<= 180 Between 181and 190
Between 191and 200
Between 201and 210
Between 211and 220
Between 221and 230
Between 231and 240
Between 241and 250
Between 251and 260
>260 ScoreUnknown
0 0 0 0
15
40
55 55
35
17
40 0 0
3 36 7
0 2 04
Matched Not Matched
Step 2 CK Scores
Nu
mb
er o
f A
pp
lican
ts
Charting Outcomes in the Match: U.S. MD Seniors, 2020
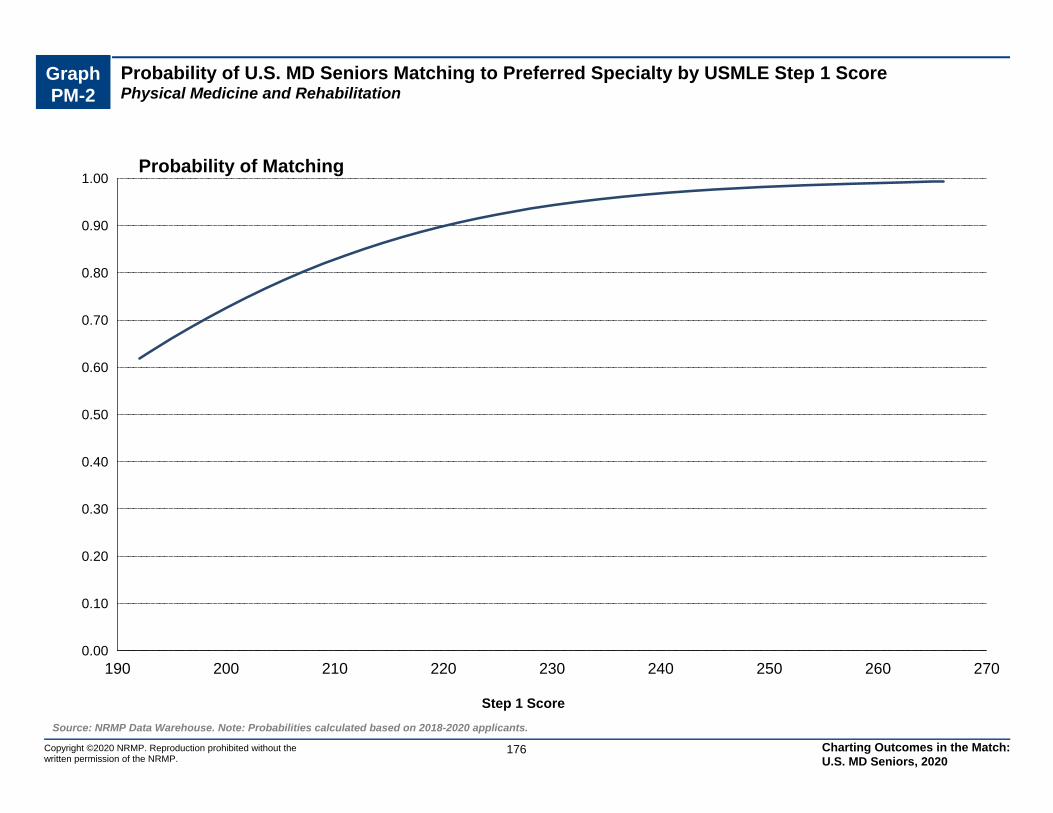
Graph PM-2
Probability of U.S. MD Seniors Matching to Preferred Specialty by USMLE Step 1 ScorePhysical Medicine and Rehabilitation
0.00
0.10
0.20
0.30
0.40
0.50
0.60
0.70
0.80
0.90
1.00
190 200 210 220 230 240 250 260 270
Step 1 Score
Probability of Matching
Source: NRMP Data Warehouse. Note: Probabilities calculated based on 2018-2020 applicants.
176Copyright ©2020 NRMP. Reproduction prohibited without the written permission of the NRMP.
Charting Outcomes in the Match: U.S. MD Seniors, 2020
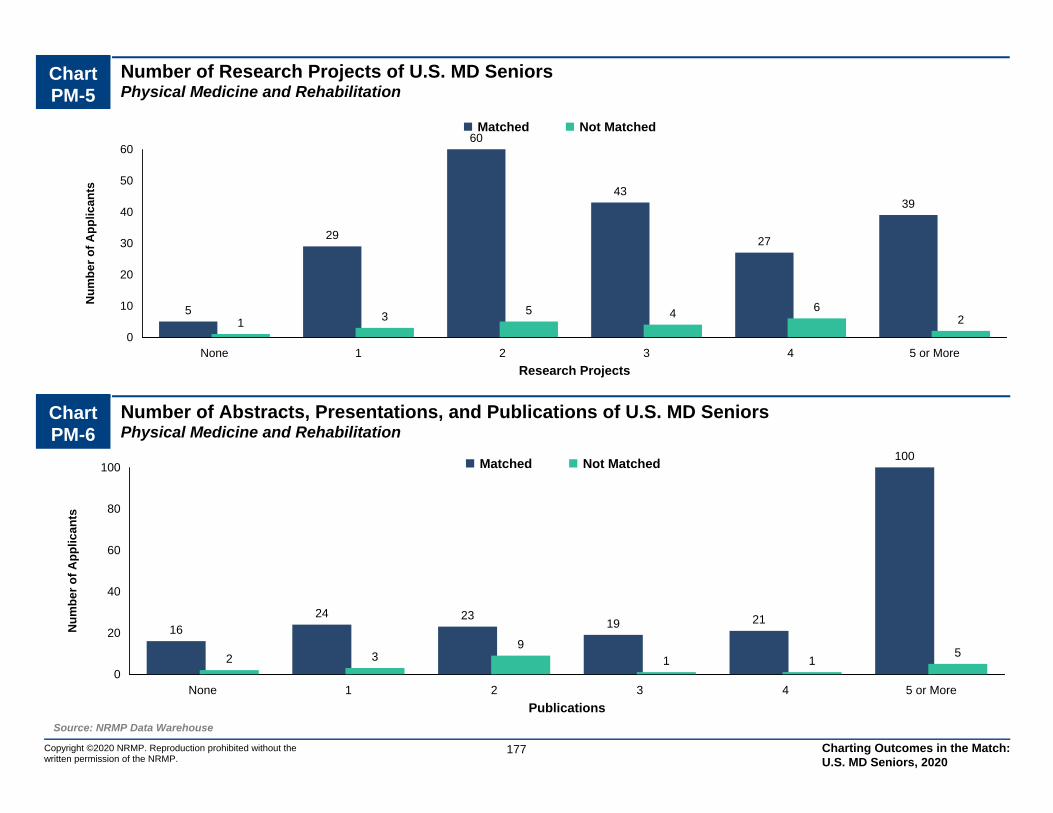
0
20
40
60
80
100
None 1 2 3 4 5 or More
1624 23
19 21
100
2 39
1 15
Matched Not Matched
Publications
Nu
mb
er o
f A
pp
lican
ts
0
10
20
30
40
50
60
None 1 2 3 4 5 or More
5
29
60
43
27
39
1 3 5 4 62
Matched Not Matched
Research Projects
Nu
mb
er o
f A
pp
lican
tsChart PM-5
Number of Research Projects of U.S. MD SeniorsPhysical Medicine and Rehabilitation
Source: NRMP Data Warehouse
177Copyright ©2020 NRMP. Reproduction prohibited without the written permission of the NRMP.
Chart PM-6
Number of Abstracts, Presentations, and Publications of U.S. MD SeniorsPhysical Medicine and Rehabilitation
Charting Outcomes in the Match: U.S. MD Seniors, 2020
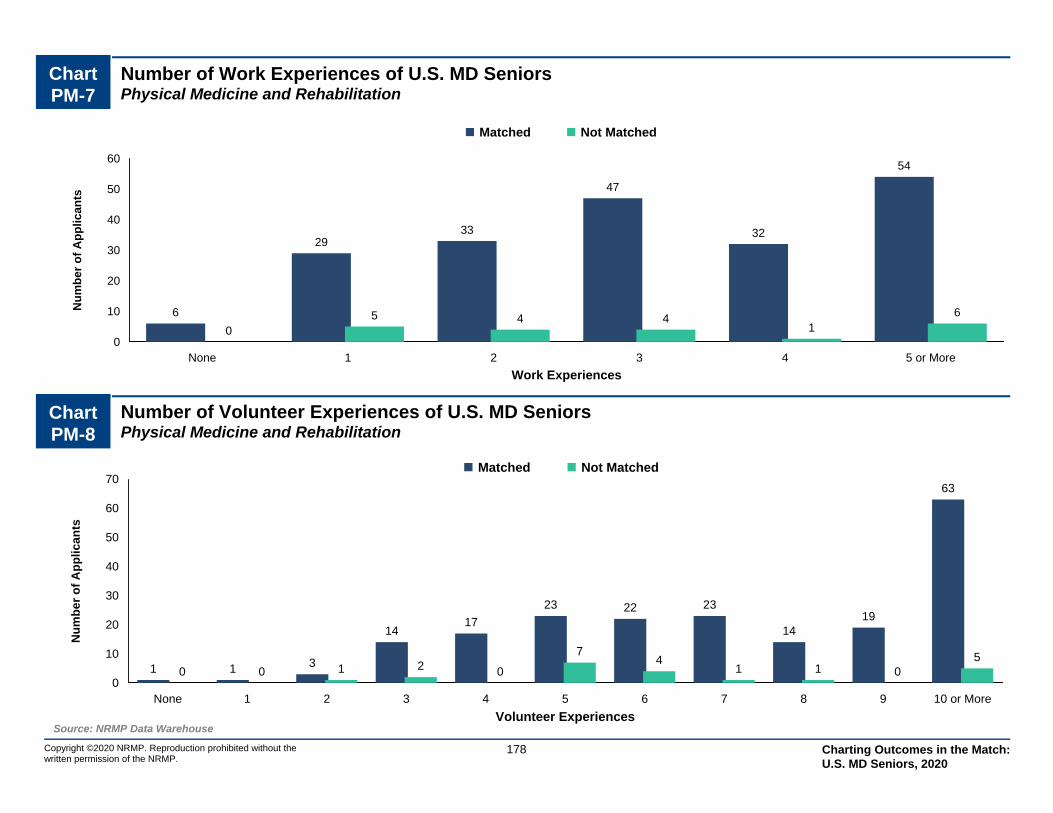
0
10
20
30
40
50
60
70
None 1 2 3 4 5 6 7 8 9 10 or More
1 1 3
1417
23 22 23
1419
63
0 0 1 2 0
74
1 1 05
Matched Not Matched
Volunteer Experiences
Nu
mb
er o
f A
pp
lican
ts
0
10
20
30
40
50
60
None 1 2 3 4 5 or More
6
2933
47
32
54
05 4 4
16
Matched Not Matched
Work Experiences
Nu
mb
er o
f A
pp
lican
tsChart PM-7
Number of Work Experiences of U.S. MD SeniorsPhysical Medicine and Rehabilitation
Source: NRMP Data Warehouse
178Copyright ©2020 NRMP. Reproduction prohibited without the written permission of the NRMP.
Chart PM-8
Number of Volunteer Experiences of U.S. MD SeniorsPhysical Medicine and Rehabilitation
Charting Outcomes in the Match: U.S. MD Seniors, 2020
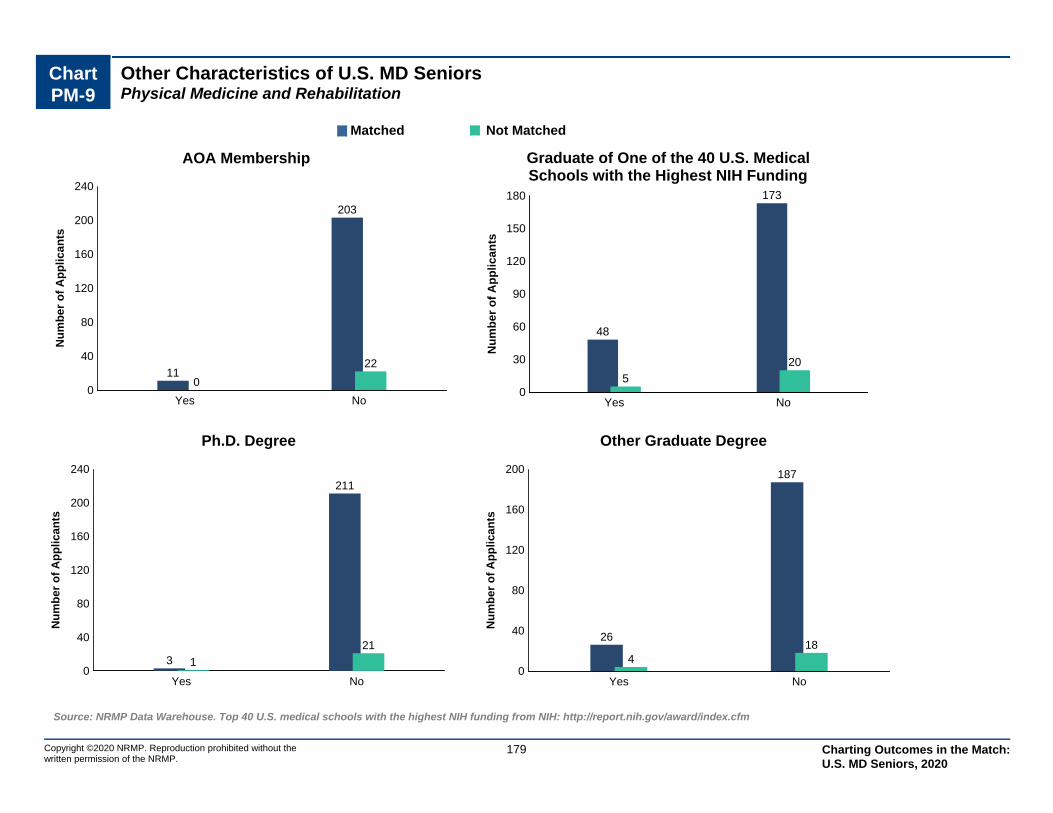
Chart PM-9
Other Characteristics of U.S. MD SeniorsPhysical Medicine and Rehabilitation
Copyright ©2020 NRMP. Reproduction prohibited without the written permission of the NRMP.
Source: NRMP Data Warehouse. Top 40 U.S. medical schools with the highest NIH funding from NIH: http://report.nih.gov/award/index.cfm
179
0
40
80
120
160
200
240
Yes No
11
203
0
22
Nu
mb
er
of
Ap
pli
ca
nts
AOA Membership
0
30
60
90
120
150
180
Yes No
48
173
5
20
Nu
mb
er o
f A
pp
lican
ts
Graduate of One of the 40 U.S. MedicalSchools with the Highest NIH Funding
0
40
80
120
160
200
240
Yes No
3
211
1
21
Nu
mb
er o
f A
pp
lican
ts
Ph.D. Degree
0
40
80
120
160
200
Yes No
26
187
418
Nu
mb
er o
f A
pp
lican
ts
Other Graduate Degree
Matched Not Matched
Charting Outcomes in the Match: U.S. MD Seniors, 2020
PS Plastic Surgery
Copyright ©2020 NRMP. Reproduction prohibited without the written permission of the NRMP.
180 Charting Outcomes in the Match: U.S. MD Seniors, 2020

Table PS-1
Summary Statistics on U.S. MD SeniorsPlastic Surgery
Measure (n=158) (n=56)
Matched Unmatched
13.7 7.3Mean number of contiguous ranks1.
1.2 1.4Mean number of distinct specialties ranked2.
249 245Mean USMLE Step 1 score3.
256 250Mean USMLE Step 2 score4.
5.9 5.9Mean number of research experiences5.
19.1 11.6Mean number of abstracts, presentations, and publications6.
3.7 3.7Mean number of work experiences7.
8.7 7.4Mean number of volunteer experiences8.
43.0 19.6Percentage who are AOA members9.
34.2 28.6Percentage who graduated from one of the 40 U.S. medical schools with the highest NIH funding
10.
2.0 3.8Percentage who have Ph.D. degree11.
22.2 28.8Percentage who have another graduate degree12.
Note: Only U.S. MD seniors who gave consent to use their information in research are included. Sources. NRMP Data Warehouse; Top 40 U.S. medical schools with the highest NIH funding in measure 10 is from the NIH website (http://report.nih.gov/award/index.cfm).
Copyright ©2020 NRMP. Reproduction prohibited without the written permission of the NRMP.
181 Charting Outcomes in the Match: U.S. MD Seniors, 2020
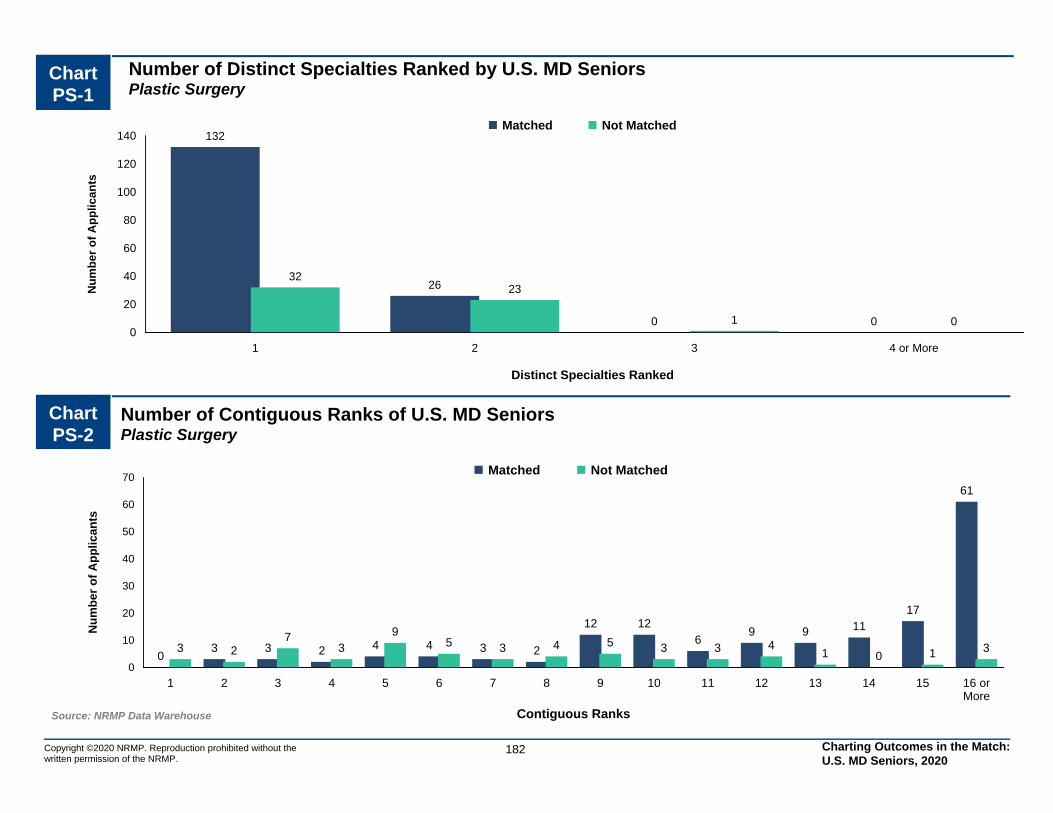
0
20
40
60
80
100
120
140
1 2 3 4 or More
132
26
0 0
3223
1 0
Matched Not Matched
Distinct Specialties Ranked
Nu
mb
er o
f A
pp
lican
ts
0
10
20
30
40
50
60
70
1 2 3 4 5 6 7 8 9 10 11 12 13 14 15 16 orMore
03 3 2 4 4 3 2
12 126
9 9 1117
61
3 27
39
5 3 4 5 3 3 41 0 1 3
Matched Not Matched
Contiguous Ranks
Nu
mb
er o
f A
pp
lican
ts
Chart PS-2
Number of Contiguous Ranks of U.S. MD SeniorsPlastic Surgery
Source: NRMP Data Warehouse
Copyright ©2020 NRMP. Reproduction prohibited without the written permission of the NRMP.
182
Chart PS-1
Number of Distinct Specialties Ranked by U.S. MD SeniorsPlastic Surgery
Charting Outcomes in the Match: U.S. MD Seniors, 2020

Probability of U.S. MD Seniors Matching to Preferred Specialty by Number of Contiguous RanksPlastic Surgery
Graph PS-1
0.00
0.10
0.20
0.30
0.40
0.50
0.60
0.70
0.80
0.90
1.00
0 1 2 3 4 5 6 7 8 9 10 11 12 13 14 15 16 17 18 19 20
Number of Contiguous Ranks
Probability of Matching
Source: NRMP Data Warehouse. Note: Probabilities calculated based on 2018-2020 applicants
183Copyright ©2020 NRMP. Reproduction prohibited without the written permission of the NRMP.
Charting Outcomes in the Match: U.S. MD Seniors, 2020
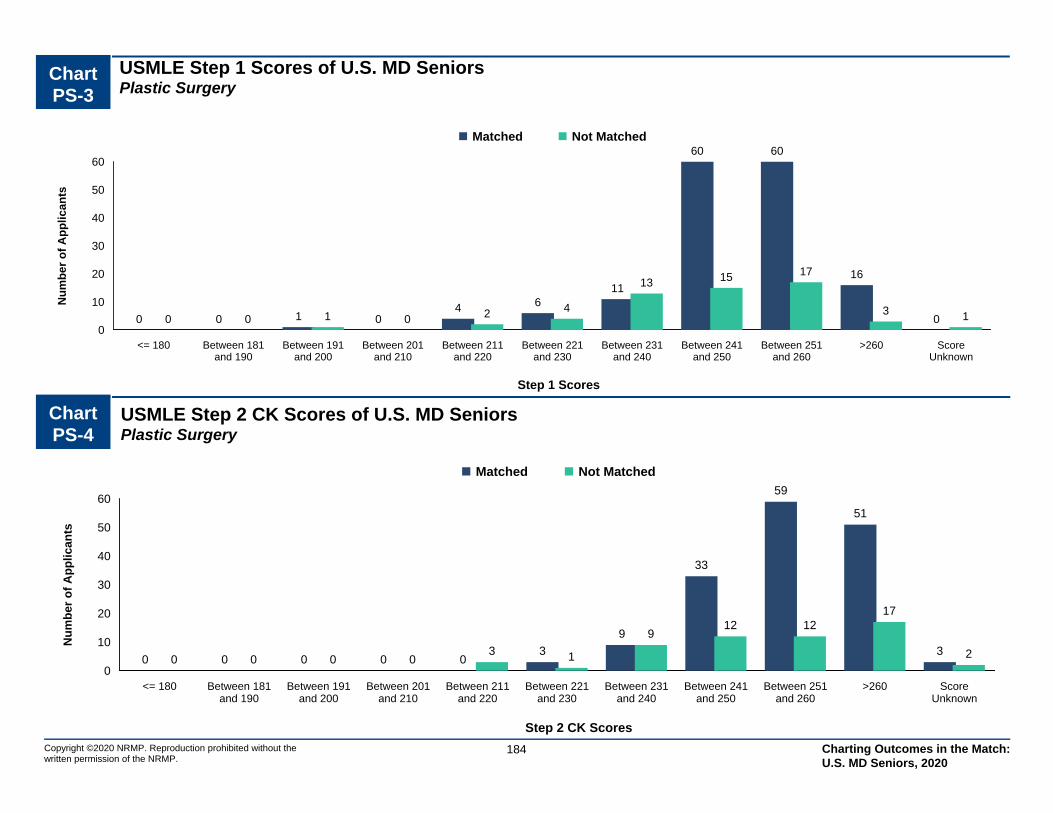
Chart PS-3
USMLE Step 1 Scores of U.S. MD SeniorsPlastic Surgery
0
10
20
30
40
50
60
<= 180 Between 181and 190
Between 191and 200
Between 201and 210
Between 211and 220
Between 221and 230
Between 231and 240
Between 241and 250
Between 251and 260
>260 ScoreUnknown
0 0 1 04 6
11
60 60
16
00 0 1 0 2 4
13 15 17
3 1
Matched Not Matched
Step 1 Scores
Nu
mb
er
of
Ap
pli
ca
nts
Source: NRMP Data Warehouse
184Copyright ©2020 NRMP. Reproduction prohibited without the written permission of the NRMP.
Chart PS-4
USMLE Step 2 CK Scores of U.S. MD SeniorsPlastic Surgery
0
10
20
30
40
50
60
<= 180 Between 181and 190
Between 191and 200
Between 201and 210
Between 211and 220
Between 221and 230
Between 231and 240
Between 241and 250
Between 251and 260
>260 ScoreUnknown
0 0 0 0 03
9
33
59
51
30 0 0 0
3 1
912 12
17
2
Matched Not Matched
Step 2 CK Scores
Nu
mb
er o
f A
pp
lican
ts
Charting Outcomes in the Match: U.S. MD Seniors, 2020
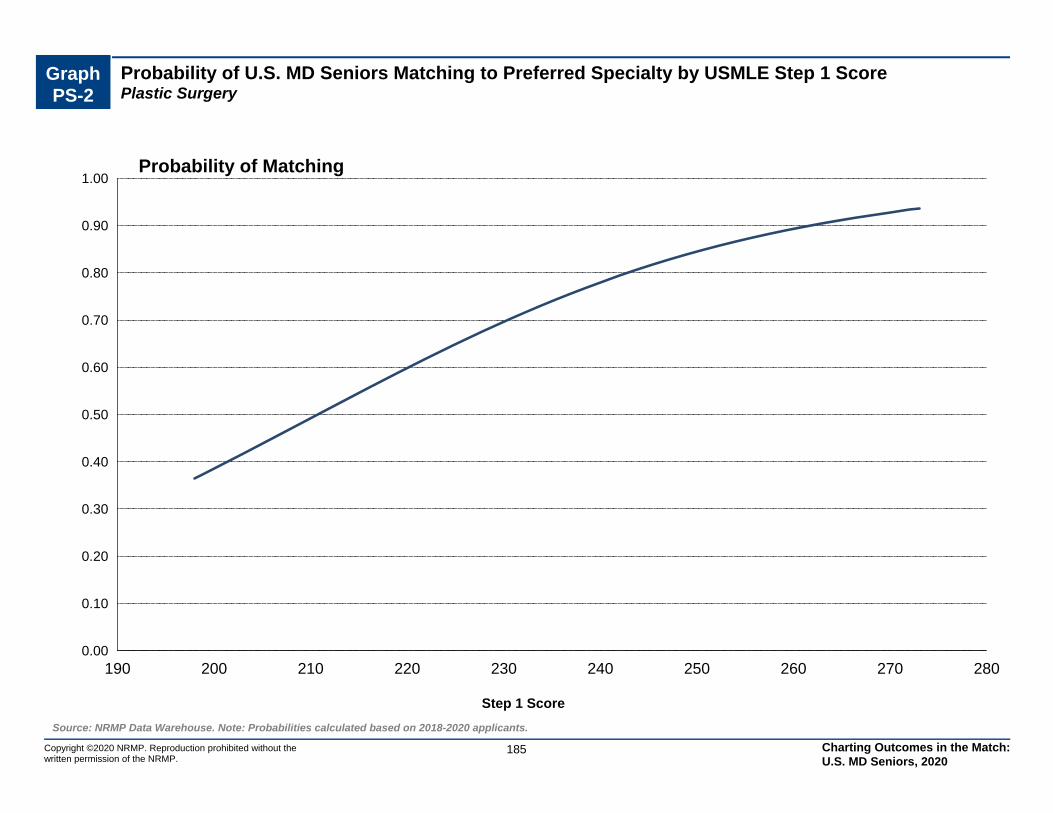
Graph PS-2
Probability of U.S. MD Seniors Matching to Preferred Specialty by USMLE Step 1 ScorePlastic Surgery
0.00
0.10
0.20
0.30
0.40
0.50
0.60
0.70
0.80
0.90
1.00
190 200 210 220 230 240 250 260 270 280
Step 1 Score
Probability of Matching
Source: NRMP Data Warehouse. Note: Probabilities calculated based on 2018-2020 applicants.
185Copyright ©2020 NRMP. Reproduction prohibited without the written permission of the NRMP.
Charting Outcomes in the Match: U.S. MD Seniors, 2020
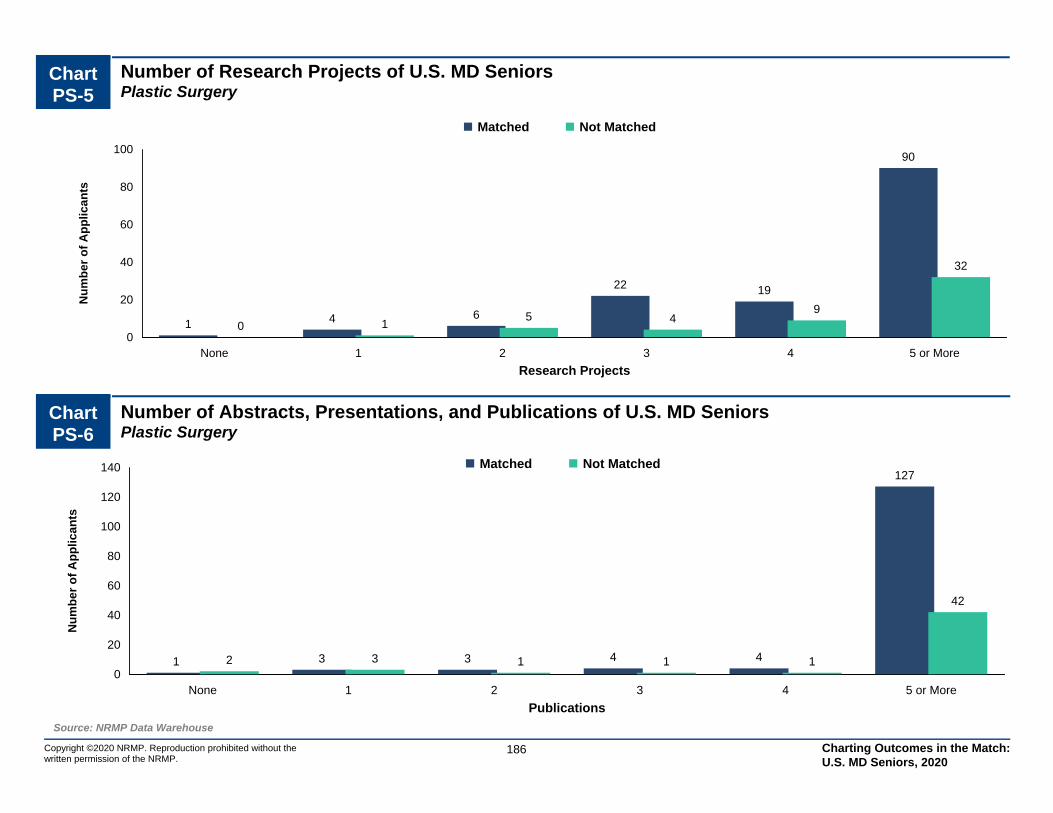
0
20
40
60
80
100
120
140
None 1 2 3 4 5 or More
1 3 3 4 4
127
2 3 1 1 1
42
Matched Not Matched
Publications
Nu
mb
er o
f A
pp
lican
ts
0
20
40
60
80
100
None 1 2 3 4 5 or More
1 4 6
22 19
90
0 15 4
9
32
Matched Not Matched
Research Projects
Nu
mb
er o
f A
pp
lican
tsChart PS-5
Number of Research Projects of U.S. MD SeniorsPlastic Surgery
Source: NRMP Data Warehouse
186Copyright ©2020 NRMP. Reproduction prohibited without the written permission of the NRMP.
Chart PS-6
Number of Abstracts, Presentations, and Publications of U.S. MD SeniorsPlastic Surgery
Charting Outcomes in the Match: U.S. MD Seniors, 2020
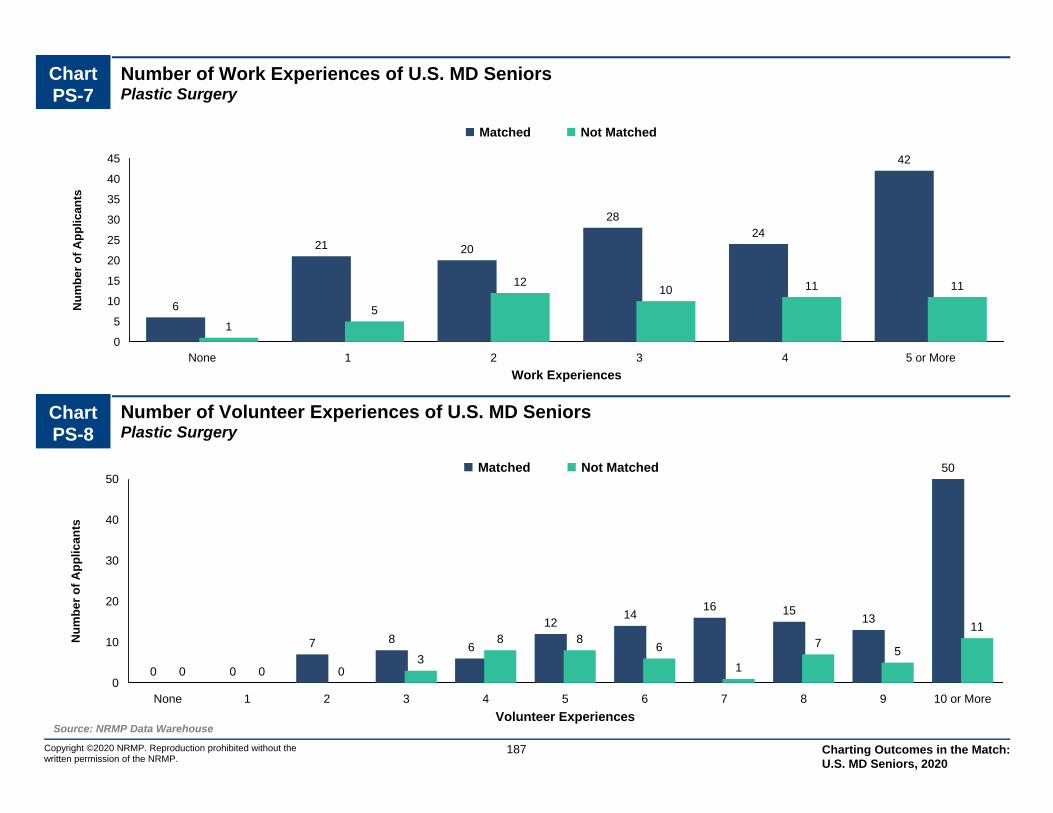
0
10
20
30
40
50
None 1 2 3 4 5 6 7 8 9 10 or More
0 0
7 86
1214
16 1513
50
0 0 03
8 86
1
75
11
Matched Not Matched
Volunteer Experiences
Nu
mb
er o
f A
pp
lican
ts
0
5
10
15
20
25
30
35
40
45
None 1 2 3 4 5 or More
6
21 20
28
24
42
1
5
1210 11 11
Matched Not Matched
Work Experiences
Nu
mb
er o
f A
pp
lican
tsChart PS-7
Number of Work Experiences of U.S. MD SeniorsPlastic Surgery
Source: NRMP Data Warehouse
187Copyright ©2020 NRMP. Reproduction prohibited without the written permission of the NRMP.
Chart PS-8
Number of Volunteer Experiences of U.S. MD SeniorsPlastic Surgery
Charting Outcomes in the Match: U.S. MD Seniors, 2020
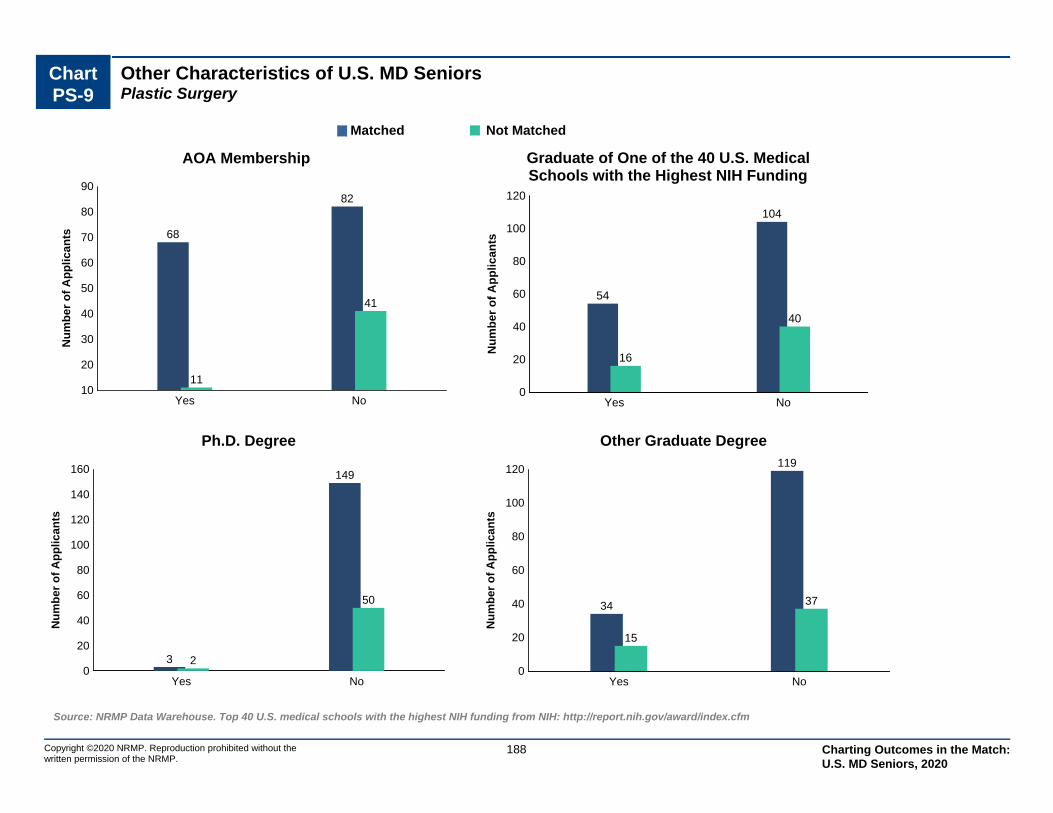
Chart PS-9
Other Characteristics of U.S. MD SeniorsPlastic Surgery
Copyright ©2020 NRMP. Reproduction prohibited without the written permission of the NRMP.
Source: NRMP Data Warehouse. Top 40 U.S. medical schools with the highest NIH funding from NIH: http://report.nih.gov/award/index.cfm
188
10
20
30
40
50
60
70
80
90
Yes No
68
82
11
41
Nu
mb
er
of
Ap
pli
ca
nts
AOA Membership
0
20
40
60
80
100
120
Yes No
54
104
16
40
Nu
mb
er o
f A
pp
lican
ts
Graduate of One of the 40 U.S. MedicalSchools with the Highest NIH Funding
0
20
40
60
80
100
120
140
160
Yes No
3
149
2
50
Nu
mb
er o
f A
pp
lican
ts
Ph.D. Degree
0
20
40
60
80
100
120
Yes No
34
119
15
37
Nu
mb
er o
f A
pp
lican
ts
Other Graduate Degree
Matched Not Matched
Charting Outcomes in the Match: U.S. MD Seniors, 2020

P Psychiatry
Copyright ©2020 NRMP. Reproduction prohibited without the written permission of the NRMP.
189 Charting Outcomes in the Match: U.S. MD Seniors, 2020

Table P-1
Summary Statistics on U.S. MD SeniorsPsychiatry
Measure (n=1,029) (n=106)
Matched Unmatched
11.0 5.3Mean number of contiguous ranks1.
1.1 1.3Mean number of distinct specialties ranked2.
227 216Mean USMLE Step 1 score3.
241 229Mean USMLE Step 2 score4.
3.1 2.9Mean number of research experiences5.
5.6 4.1Mean number of abstracts, presentations, and publications6.
3.6 3.3Mean number of work experiences7.
7.7 6.4Mean number of volunteer experiences8.
6.8 1.9Percentage who are AOA members9.
29.6 20.8Percentage who graduated from one of the 40 U.S. medical schools with the highest NIH funding
10.
4.7 5.4Percentage who have Ph.D. degree11.
17.4 18.1Percentage who have another graduate degree12.
Note: Only U.S. MD seniors who gave consent to use their information in research are included. Sources. NRMP Data Warehouse; Top 40 U.S. medical schools with the highest NIH funding in measure 10 is from the NIH website (http://report.nih.gov/award/index.cfm).
Copyright ©2020 NRMP. Reproduction prohibited without the written permission of the NRMP.
190 Charting Outcomes in the Match: U.S. MD Seniors, 2020

0
200
400
600
800
1,000
1 2 3 4 or More
943
6818 0
8415 6 1
Matched Not Matched
Distinct Specialties Ranked
Nu
mb
er o
f A
pp
lican
ts
0
20
40
60
80
100
120
140
160
1 2 3 4 5 6 7 8 9 10 11 12 13 14 15 16 orMore
1522
16
34 31
46
62
8275
108
8477
8777
68
145
15 15 12 9 12 12 8 3 2 6 2 4 1 3 0 2
Matched Not Matched
Contiguous Ranks
Nu
mb
er o
f A
pp
lican
ts
Chart P-2
Number of Contiguous Ranks of U.S. MD SeniorsPsychiatry
Source: NRMP Data Warehouse
Copyright ©2020 NRMP. Reproduction prohibited without the written permission of the NRMP.
191
Chart P-1
Number of Distinct Specialties Ranked by U.S. MD SeniorsPsychiatry
Charting Outcomes in the Match: U.S. MD Seniors, 2020
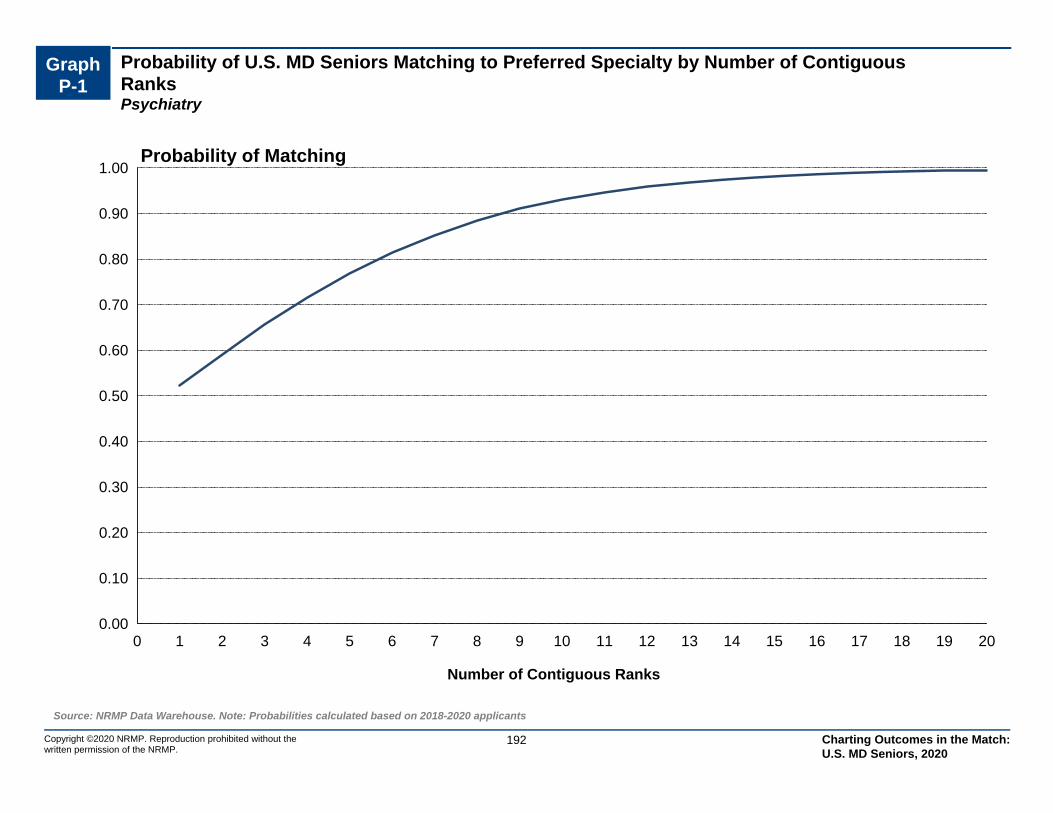
Probability of U.S. MD Seniors Matching to Preferred Specialty by Number of Contiguous RanksPsychiatry
Graph P-1
0.00
0.10
0.20
0.30
0.40
0.50
0.60
0.70
0.80
0.90
1.00
0 1 2 3 4 5 6 7 8 9 10 11 12 13 14 15 16 17 18 19 20
Number of Contiguous Ranks
Probability of Matching
Source: NRMP Data Warehouse. Note: Probabilities calculated based on 2018-2020 applicants
192Copyright ©2020 NRMP. Reproduction prohibited without the written permission of the NRMP.
Charting Outcomes in the Match: U.S. MD Seniors, 2020
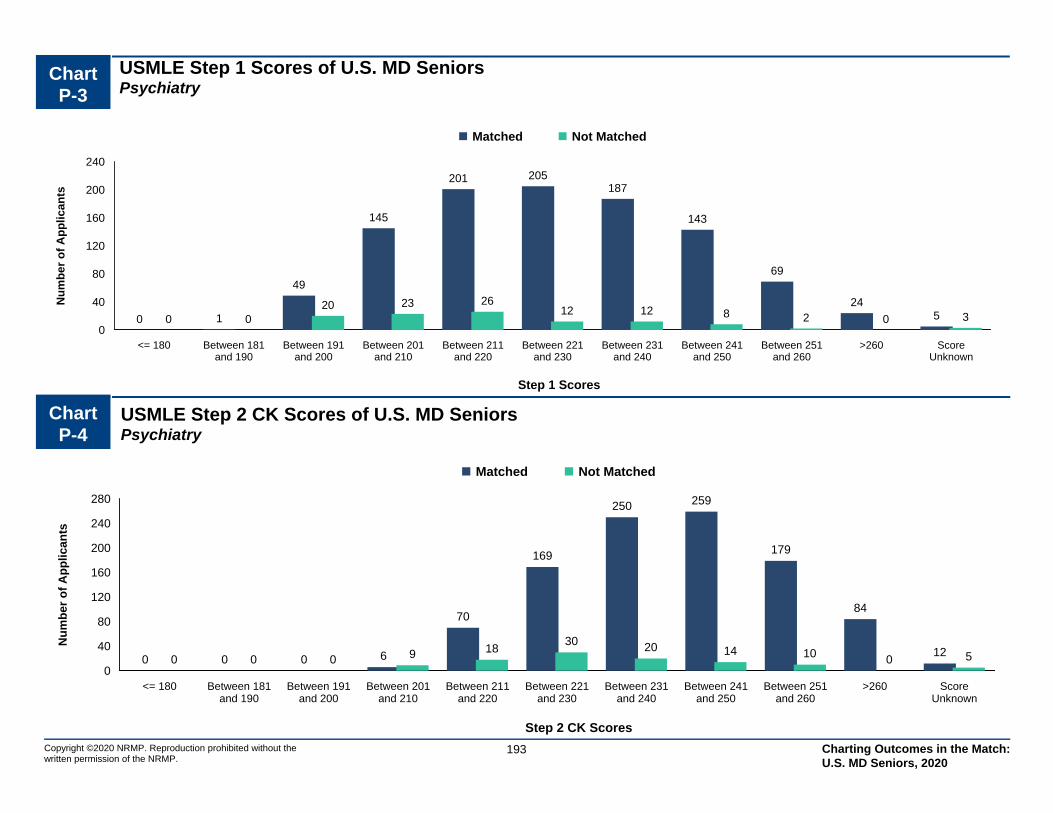
Chart P-3
USMLE Step 1 Scores of U.S. MD SeniorsPsychiatry
0
40
80
120
160
200
240
<= 180 Between 181and 190
Between 191and 200
Between 201and 210
Between 211and 220
Between 221and 230
Between 231and 240
Between 241and 250
Between 251and 260
>260 ScoreUnknown
0 1
49
145
201 205187
143
69
2450 0
20 23 2612 12 8 2 0 3
Matched Not Matched
Step 1 Scores
Nu
mb
er
of
Ap
pli
ca
nts
Source: NRMP Data Warehouse
193Copyright ©2020 NRMP. Reproduction prohibited without the written permission of the NRMP.
Chart P-4
USMLE Step 2 CK Scores of U.S. MD SeniorsPsychiatry
0
40
80
120
160
200
240
280
<= 180 Between 181and 190
Between 191and 200
Between 201and 210
Between 211and 220
Between 221and 230
Between 231and 240
Between 241and 250
Between 251and 260
>260 ScoreUnknown
0 0 0 6
70
169
250 259
179
84
120 0 0 9 18
30 20 14 10 0 5
Matched Not Matched
Step 2 CK Scores
Nu
mb
er o
f A
pp
lican
ts
Charting Outcomes in the Match: U.S. MD Seniors, 2020
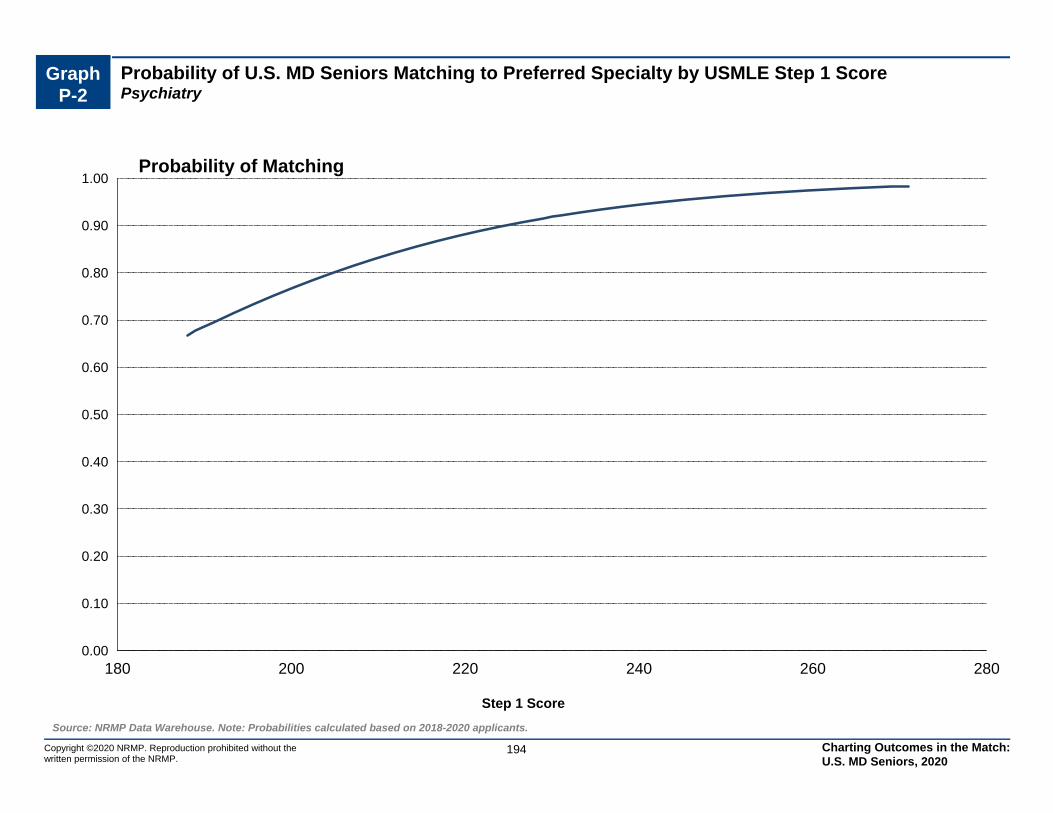
Graph P-2
Probability of U.S. MD Seniors Matching to Preferred Specialty by USMLE Step 1 ScorePsychiatry
0.00
0.10
0.20
0.30
0.40
0.50
0.60
0.70
0.80
0.90
1.00
180 200 220 240 260 280
Step 1 Score
Probability of Matching
Source: NRMP Data Warehouse. Note: Probabilities calculated based on 2018-2020 applicants.
194Copyright ©2020 NRMP. Reproduction prohibited without the written permission of the NRMP.
Charting Outcomes in the Match: U.S. MD Seniors, 2020
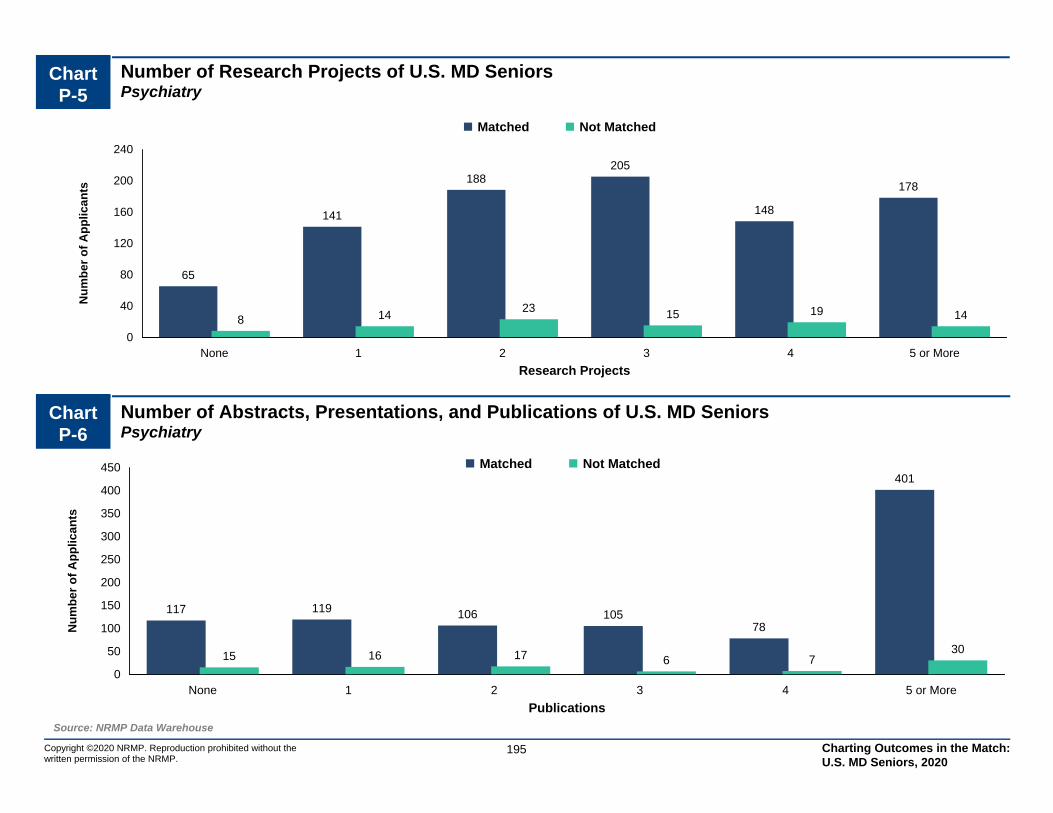
0
50
100
150
200
250
300
350
400
450
None 1 2 3 4 5 or More
117 119 106 10578
401
15 16 17 6 730
Matched Not Matched
Publications
Nu
mb
er o
f A
pp
lican
ts
0
40
80
120
160
200
240
None 1 2 3 4 5 or More
65
141
188205
148
178
8 1423 15 19 14
Matched Not Matched
Research Projects
Nu
mb
er o
f A
pp
lican
tsChart P-5
Number of Research Projects of U.S. MD SeniorsPsychiatry
Source: NRMP Data Warehouse
195Copyright ©2020 NRMP. Reproduction prohibited without the written permission of the NRMP.
Chart P-6
Number of Abstracts, Presentations, and Publications of U.S. MD SeniorsPsychiatry
Charting Outcomes in the Match: U.S. MD Seniors, 2020
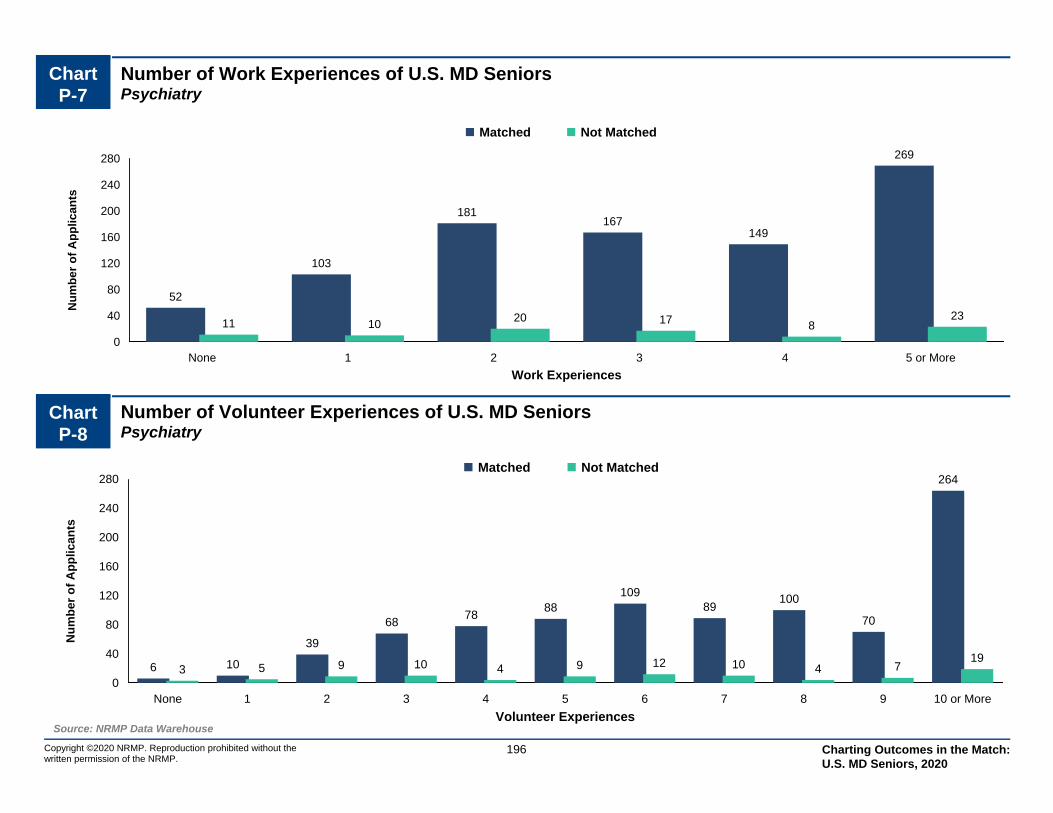
0
40
80
120
160
200
240
280
None 1 2 3 4 5 6 7 8 9 10 or More
6 10
39
6878
88109
89100
70
264
3 5 9 10 4 9 12 10 4 719
Matched Not Matched
Volunteer Experiences
Nu
mb
er o
f A
pp
lican
ts
0
40
80
120
160
200
240
280
None 1 2 3 4 5 or More
52
103
181167
149
269
11 1020 17 8
23
Matched Not Matched
Work Experiences
Nu
mb
er o
f A
pp
lican
tsChart P-7
Number of Work Experiences of U.S. MD SeniorsPsychiatry
Source: NRMP Data Warehouse
196Copyright ©2020 NRMP. Reproduction prohibited without the written permission of the NRMP.
Chart P-8
Number of Volunteer Experiences of U.S. MD SeniorsPsychiatry
Charting Outcomes in the Match: U.S. MD Seniors, 2020
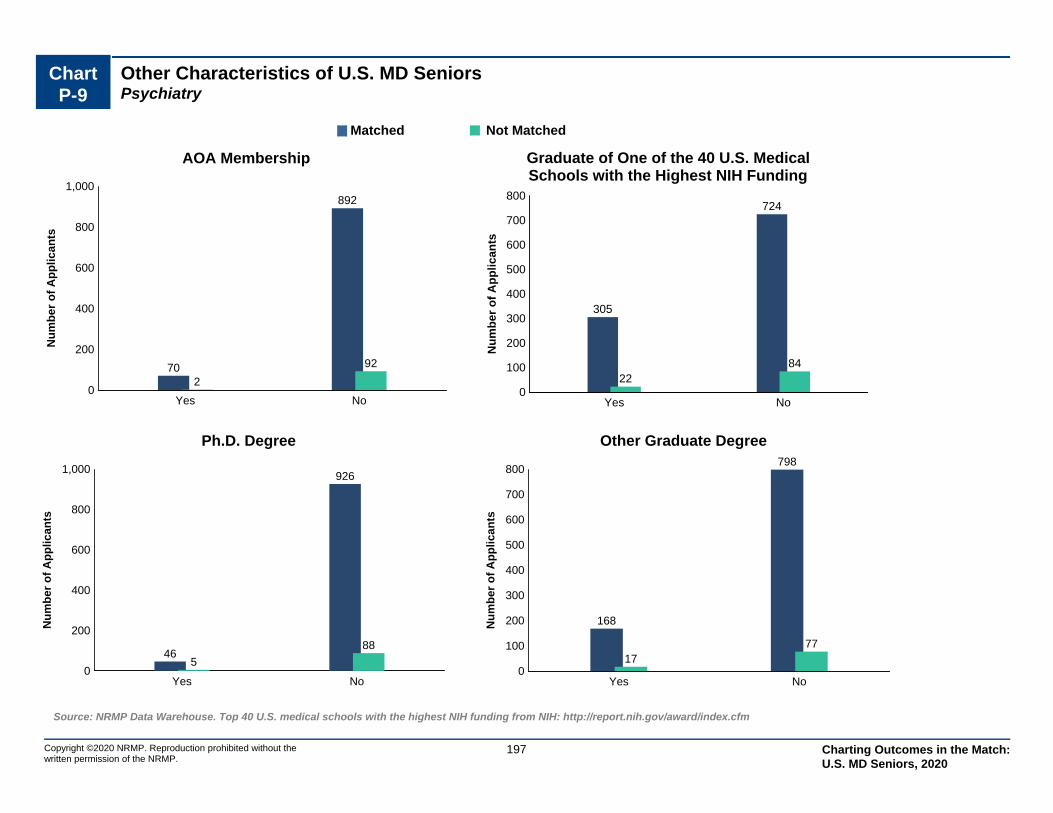
Chart P-9
Other Characteristics of U.S. MD SeniorsPsychiatry
Copyright ©2020 NRMP. Reproduction prohibited without the written permission of the NRMP.
Source: NRMP Data Warehouse. Top 40 U.S. medical schools with the highest NIH funding from NIH: http://report.nih.gov/award/index.cfm
197
0
200
400
600
800
1,000
Yes No
70
892
2
92
Nu
mb
er
of
Ap
pli
ca
nts
AOA Membership
0
100
200
300
400
500
600
700
800
Yes No
305
724
2284
Nu
mb
er o
f A
pp
lican
ts
Graduate of One of the 40 U.S. MedicalSchools with the Highest NIH Funding
0
200
400
600
800
1,000
Yes No
46
926
5
88
Nu
mb
er o
f A
pp
lican
ts
Ph.D. Degree
0
100
200
300
400
500
600
700
800
Yes No
168
798
1777
Nu
mb
er o
f A
pp
lican
ts
Other Graduate Degree
Matched Not Matched
Charting Outcomes in the Match: U.S. MD Seniors, 2020
RO Radiation Oncology
Copyright ©2020 NRMP. Reproduction prohibited without the written permission of the NRMP.
198 Charting Outcomes in the Match: U.S. MD Seniors, 2020

Table RO-1
Summary Statistics on U.S. MD SeniorsRadiation Oncology
Measure (n=112) (n=1)
Matched Unmatched
14.0 5.0Mean number of contiguous ranks1.
1.3 3.0Mean number of distinct specialties ranked2.
243 256Mean USMLE Step 1 score3.
250 260Mean USMLE Step 2 score4.
5.7 3.0Mean number of research experiences5.
18.3 13.0Mean number of abstracts, presentations, and publications6.
3.5 3.0Mean number of work experiences7.
6.6 6.0Mean number of volunteer experiences8.
22.3 100.0Percentage who are AOA members9.
46.4 0.0Percentage who graduated from one of the 40 U.S. medical schools with the highest NIH funding
10.
19.2 0.0Percentage who have Ph.D. degree11.
25.2 0.0Percentage who have another graduate degree12.
Note: Only U.S. MD seniors who gave consent to use their information in research are included. Sources. NRMP Data Warehouse; Top 40 U.S. medical schools with the highest NIH funding in measure 10 is from the NIH website (http://report.nih.gov/award/index.cfm).
Copyright ©2020 NRMP. Reproduction prohibited without the written permission of the NRMP.
199 Charting Outcomes in the Match: U.S. MD Seniors, 2020
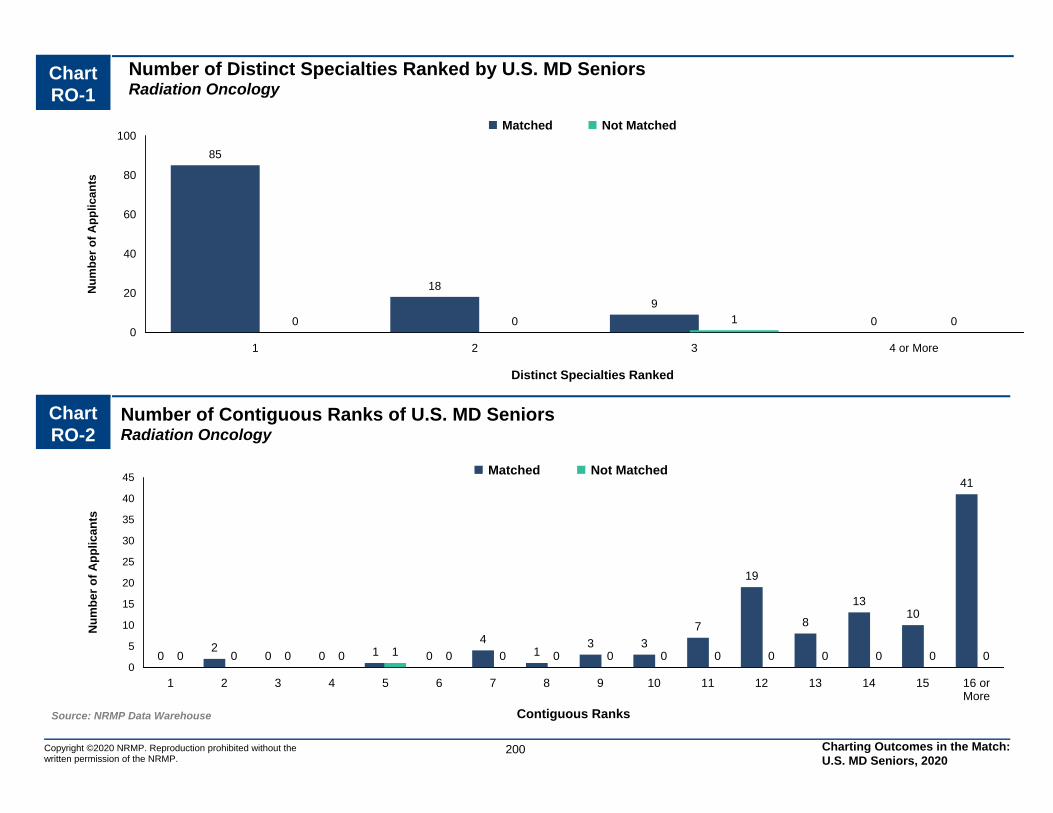
0
20
40
60
80
100
1 2 3 4 or More
85
18
9
00 0 1 0
Matched Not Matched
Distinct Specialties Ranked
Nu
mb
er o
f A
pp
lican
ts
0
5
10
15
20
25
30
35
40
45
1 2 3 4 5 6 7 8 9 10 11 12 13 14 15 16 orMore
02
0 0 1 0
41
3 3
7
19
8
1310
41
0 0 0 0 1 0 0 0 0 0 0 0 0 0 0 0
Matched Not Matched
Contiguous Ranks
Nu
mb
er o
f A
pp
lican
ts
Chart RO-2
Number of Contiguous Ranks of U.S. MD SeniorsRadiation Oncology
Source: NRMP Data Warehouse
Copyright ©2020 NRMP. Reproduction prohibited without the written permission of the NRMP.
200
Chart RO-1
Number of Distinct Specialties Ranked by U.S. MD SeniorsRadiation Oncology
Charting Outcomes in the Match: U.S. MD Seniors, 2020
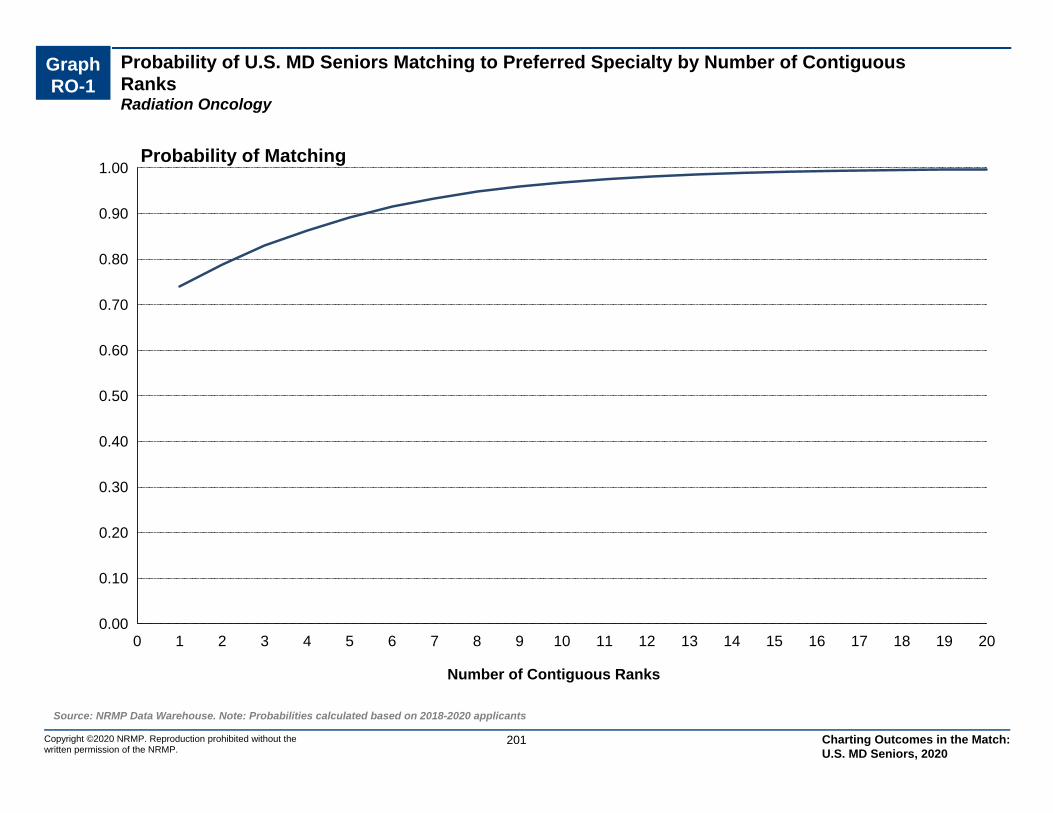
Probability of U.S. MD Seniors Matching to Preferred Specialty by Number of Contiguous RanksRadiation Oncology
Graph RO-1
0.00
0.10
0.20
0.30
0.40
0.50
0.60
0.70
0.80
0.90
1.00
0 1 2 3 4 5 6 7 8 9 10 11 12 13 14 15 16 17 18 19 20
Number of Contiguous Ranks
Probability of Matching
Source: NRMP Data Warehouse. Note: Probabilities calculated based on 2018-2020 applicants
201Copyright ©2020 NRMP. Reproduction prohibited without the written permission of the NRMP.
Charting Outcomes in the Match: U.S. MD Seniors, 2020
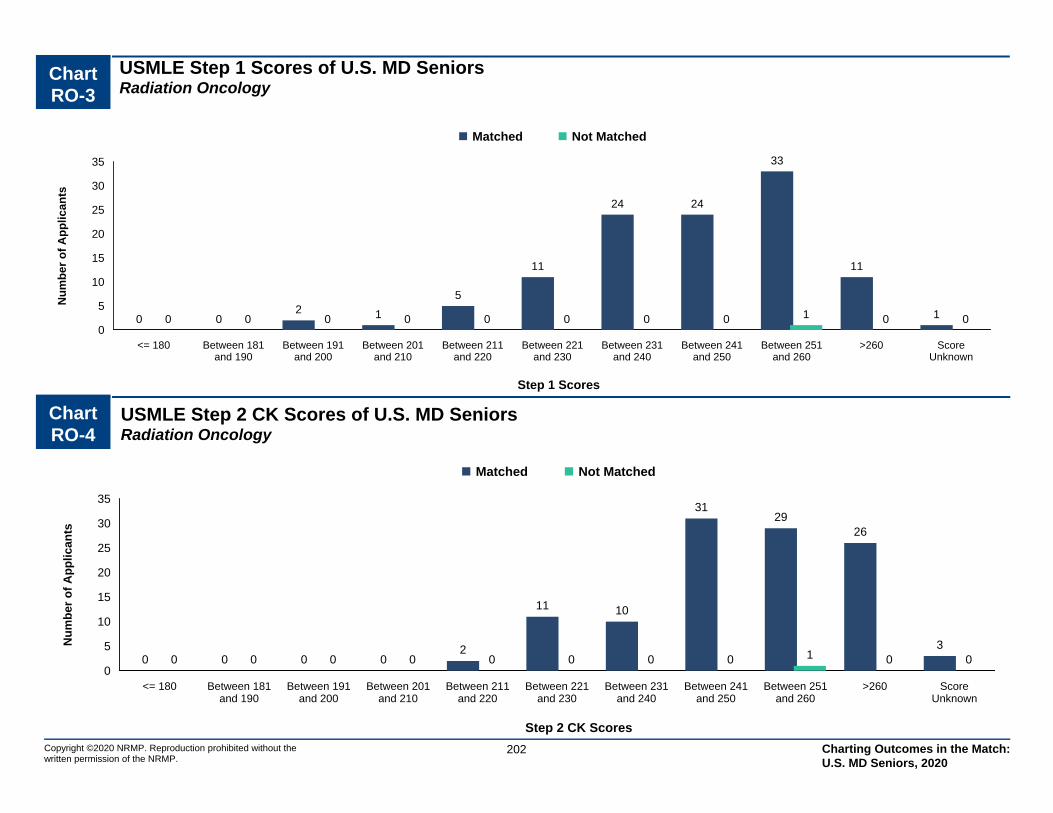
Chart RO-3
USMLE Step 1 Scores of U.S. MD SeniorsRadiation Oncology
0
5
10
15
20
25
30
35
<= 180 Between 181and 190
Between 191and 200
Between 201and 210
Between 211and 220
Between 221and 230
Between 231and 240
Between 241and 250
Between 251and 260
>260 ScoreUnknown
0 02 1
5
11
24 24
33
11
10 0 0 0 0 0 0 0 1 0 0
Matched Not Matched
Step 1 Scores
Nu
mb
er
of
Ap
pli
ca
nts
Source: NRMP Data Warehouse
202Copyright ©2020 NRMP. Reproduction prohibited without the written permission of the NRMP.
Chart RO-4
USMLE Step 2 CK Scores of U.S. MD SeniorsRadiation Oncology
0
5
10
15
20
25
30
35
<= 180 Between 181and 190
Between 191and 200
Between 201and 210
Between 211and 220
Between 221and 230
Between 231and 240
Between 241and 250
Between 251and 260
>260 ScoreUnknown
0 0 0 02
11 10
3129
26
30 0 0 0 0 0 0 0 1 0 0
Matched Not Matched
Step 2 CK Scores
Nu
mb
er o
f A
pp
lican
ts
Charting Outcomes in the Match: U.S. MD Seniors, 2020
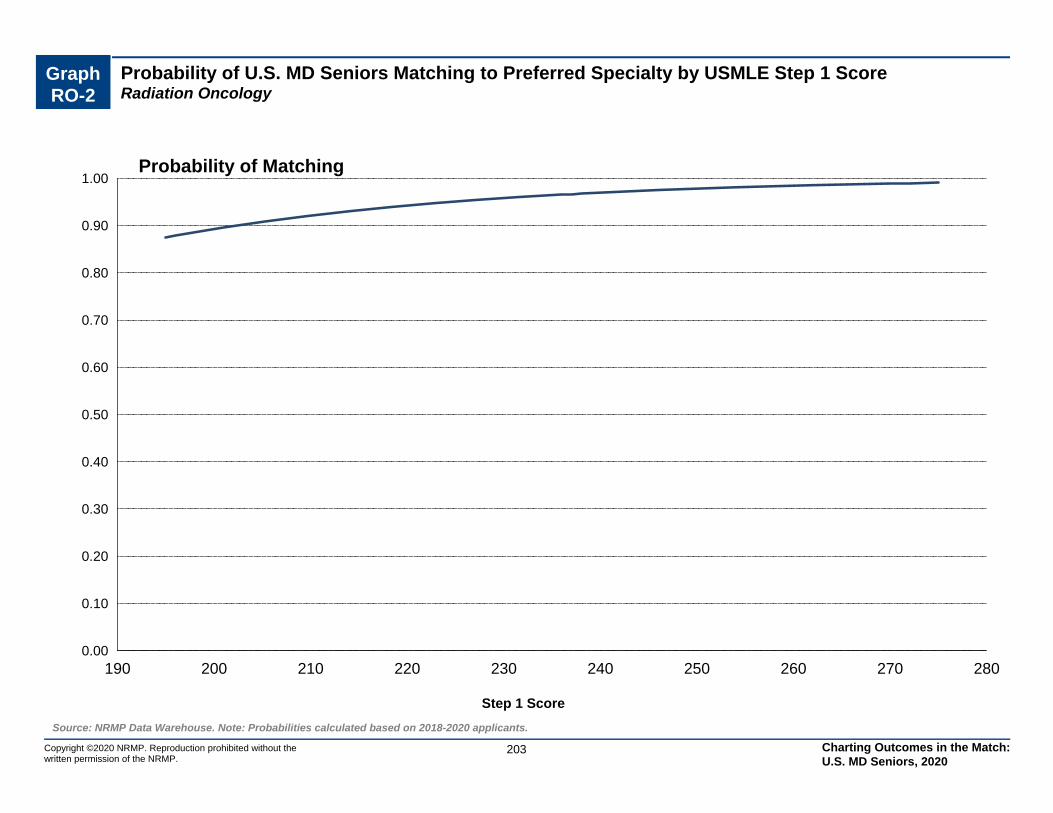
Graph RO-2
Probability of U.S. MD Seniors Matching to Preferred Specialty by USMLE Step 1 ScoreRadiation Oncology
0.00
0.10
0.20
0.30
0.40
0.50
0.60
0.70
0.80
0.90
1.00
190 200 210 220 230 240 250 260 270 280
Step 1 Score
Probability of Matching
Source: NRMP Data Warehouse. Note: Probabilities calculated based on 2018-2020 applicants.
203Copyright ©2020 NRMP. Reproduction prohibited without the written permission of the NRMP.
Charting Outcomes in the Match: U.S. MD Seniors, 2020
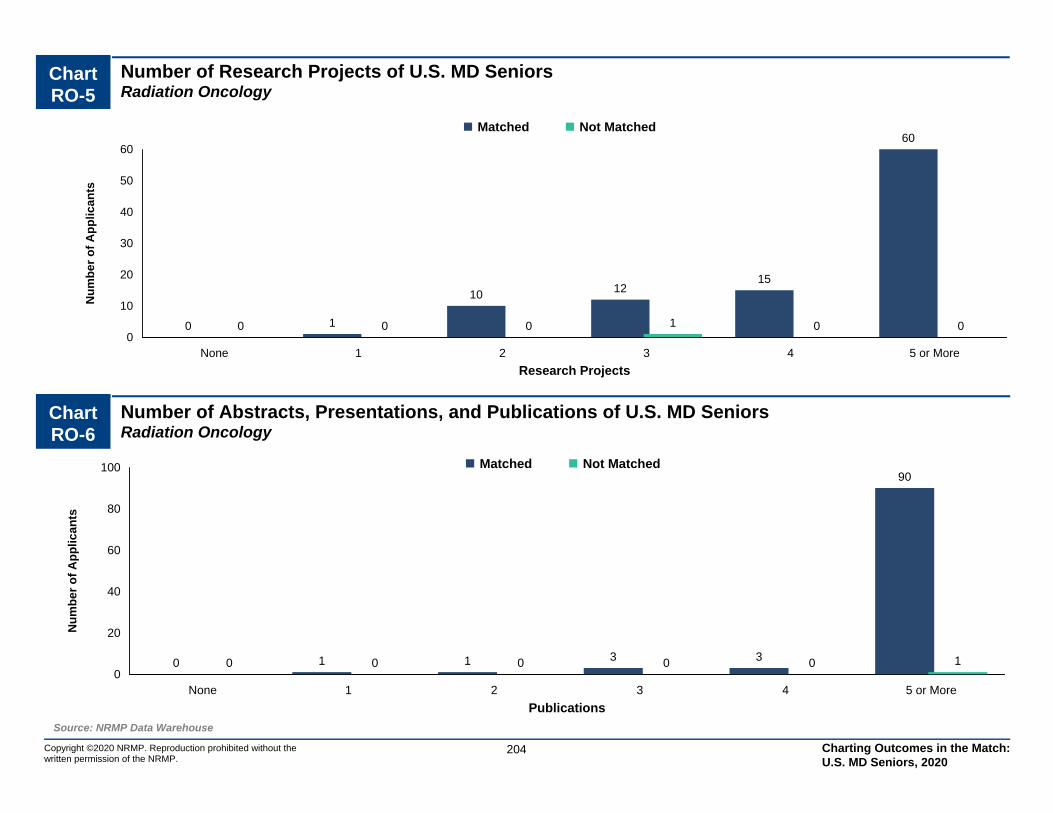
0
20
40
60
80
100
None 1 2 3 4 5 or More
0 1 1 3 3
90
0 0 0 0 0 1
Matched Not Matched
Publications
Nu
mb
er o
f A
pp
lican
ts
0
10
20
30
40
50
60
None 1 2 3 4 5 or More
0 1
10 1215
60
0 0 0 1 0 0
Matched Not Matched
Research Projects
Nu
mb
er o
f A
pp
lican
tsChart RO-5
Number of Research Projects of U.S. MD SeniorsRadiation Oncology
Source: NRMP Data Warehouse
204Copyright ©2020 NRMP. Reproduction prohibited without the written permission of the NRMP.
Chart RO-6
Number of Abstracts, Presentations, and Publications of U.S. MD SeniorsRadiation Oncology
Charting Outcomes in the Match: U.S. MD Seniors, 2020

0
4
8
12
16
20
None 1 2 3 4 5 6 7 8 9 10 or More
0
2
7
10
8
11
13
9
11
9
18
0 0 0 0 0 01
0 0 0 0
Matched Not Matched
Volunteer Experiences
Nu
mb
er o
f A
pp
lican
ts
0
4
8
12
16
20
24
28
32
None 1 2 3 4 5 or More
3
14
18 17 17
29
0 0 0 1 0 0
Matched Not Matched
Work Experiences
Nu
mb
er o
f A
pp
lican
tsChart RO-7
Number of Work Experiences of U.S. MD SeniorsRadiation Oncology
Source: NRMP Data Warehouse
205Copyright ©2020 NRMP. Reproduction prohibited without the written permission of the NRMP.
Chart RO-8
Number of Volunteer Experiences of U.S. MD SeniorsRadiation Oncology
Charting Outcomes in the Match: U.S. MD Seniors, 2020

Chart RO-9
Other Characteristics of U.S. MD SeniorsRadiation Oncology
Copyright ©2020 NRMP. Reproduction prohibited without the written permission of the NRMP.
Source: NRMP Data Warehouse. Top 40 U.S. medical schools with the highest NIH funding from NIH: http://report.nih.gov/award/index.cfm
206
0
10
20
30
40
50
60
70
Yes No
25
70
1 0
Nu
mb
er
of
Ap
pli
ca
nts
AOA Membership
0
10
20
30
40
50
60
Yes No
52
60
0 1
Nu
mb
er o
f A
pp
lican
ts
Graduate of One of the 40 U.S. MedicalSchools with the Highest NIH Funding
0
20
40
60
80
100
Yes No
20
84
0 1
Nu
mb
er o
f A
pp
lican
ts
Ph.D. Degree
0
10
20
30
40
50
60
70
80
Yes No
26
77
0 1
Nu
mb
er o
f A
pp
lican
ts
Other Graduate Degree
Matched Not Matched
Charting Outcomes in the Match: U.S. MD Seniors, 2020
VS Vascular Surgery
Copyright ©2020 NRMP. Reproduction prohibited without the written permission of the NRMP.
207 Charting Outcomes in the Match: U.S. MD Seniors, 2020

Table VS-1
Summary Statistics on U.S. MD SeniorsVascular Surgery
Measure (n=61) (n=15)
Matched Unmatched
15.2 10.3Mean number of contiguous ranks1.
1.4 1.7Mean number of distinct specialties ranked2.
239 230Mean USMLE Step 1 score3.
247 238Mean USMLE Step 2 score4.
4.7 3.4Mean number of research experiences5.
10.5 6.0Mean number of abstracts, presentations, and publications6.
3.3 3.3Mean number of work experiences7.
6.5 6.9Mean number of volunteer experiences8.
13.1 20.0Percentage who are AOA members9.
39.3 13.3Percentage who graduated from one of the 40 U.S. medical schools with the highest NIH funding
10.
0.0 6.7Percentage who have Ph.D. degree11.
30.0 33.3Percentage who have another graduate degree12.
Note: Only U.S. MD seniors who gave consent to use their information in research are included. Sources. NRMP Data Warehouse; Top 40 U.S. medical schools with the highest NIH funding in measure 10 is from the NIH website (http://report.nih.gov/award/index.cfm).
Copyright ©2020 NRMP. Reproduction prohibited without the written permission of the NRMP.
208 Charting Outcomes in the Match: U.S. MD Seniors, 2020
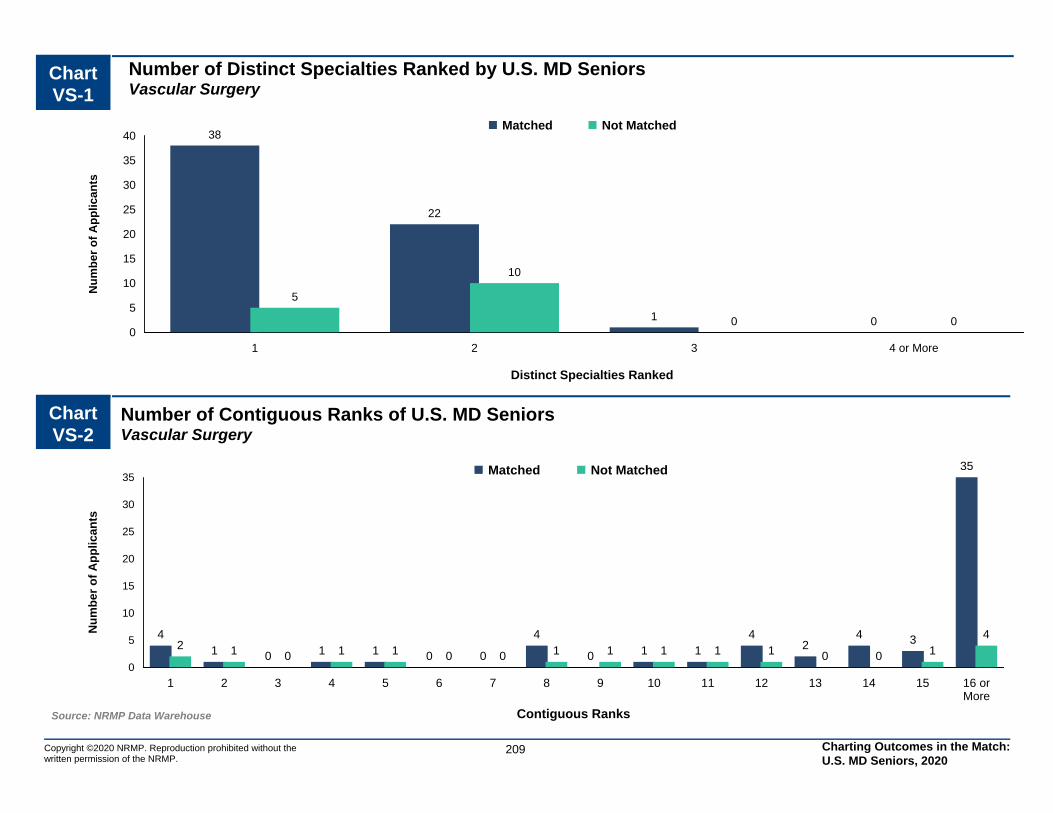
0
5
10
15
20
25
30
35
40
1 2 3 4 or More
38
22
1 0
5
10
0 0
Matched Not Matched
Distinct Specialties Ranked
Nu
mb
er o
f A
pp
lican
ts
0
5
10
15
20
25
30
35
1 2 3 4 5 6 7 8 9 10 11 12 13 14 15 16 orMore
41 0 1 1 0 0
4
0 1 14
24 3
35
2 1 0 1 1 0 0 1 1 1 1 1 0 0 14
Matched Not Matched
Contiguous Ranks
Nu
mb
er o
f A
pp
lican
ts
Chart VS-2
Number of Contiguous Ranks of U.S. MD SeniorsVascular Surgery
Source: NRMP Data Warehouse
Copyright ©2020 NRMP. Reproduction prohibited without the written permission of the NRMP.
209
Chart VS-1
Number of Distinct Specialties Ranked by U.S. MD SeniorsVascular Surgery
Charting Outcomes in the Match: U.S. MD Seniors, 2020

Probability of U.S. MD Seniors Matching to Preferred Specialty by Number of Contiguous RanksVascular Surgery
Graph VS-1
0.00
0.10
0.20
0.30
0.40
0.50
0.60
0.70
0.80
0.90
1.00
0 1 2 3 4 5 6 7 8 9 10 11 12 13 14 15 16 17 18 19 20
Number of Contiguous Ranks
Probability of Matching
Source: NRMP Data Warehouse. Note: Probabilities calculated based on 2018-2020 applicants
210Copyright ©2020 NRMP. Reproduction prohibited without the written permission of the NRMP.
Charting Outcomes in the Match: U.S. MD Seniors, 2020
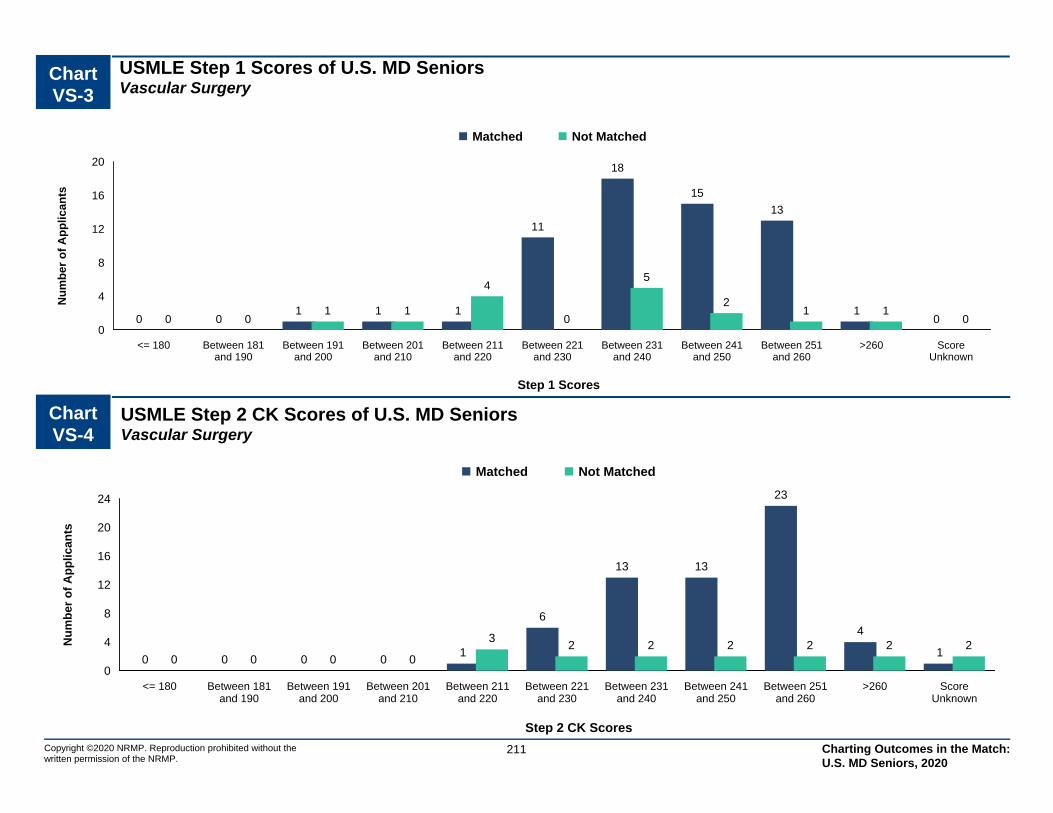
Chart VS-3
USMLE Step 1 Scores of U.S. MD SeniorsVascular Surgery
0
4
8
12
16
20
<= 180 Between 181and 190
Between 191and 200
Between 201and 210
Between 211and 220
Between 221and 230
Between 231and 240
Between 241and 250
Between 251and 260
>260 ScoreUnknown
0 01 1 1
11
18
15
13
100 0
1 1
4
0
5
21 1
0
Matched Not Matched
Step 1 Scores
Nu
mb
er
of
Ap
pli
ca
nts
Source: NRMP Data Warehouse
211Copyright ©2020 NRMP. Reproduction prohibited without the written permission of the NRMP.
Chart VS-4
USMLE Step 2 CK Scores of U.S. MD SeniorsVascular Surgery
0
4
8
12
16
20
24
<= 180 Between 181and 190
Between 191and 200
Between 201and 210
Between 211and 220
Between 221and 230
Between 231and 240
Between 241and 250
Between 251and 260
>260 ScoreUnknown
0 0 0 01
6
13 13
23
4
10 0 0 0
32 2 2 2 2 2
Matched Not Matched
Step 2 CK Scores
Nu
mb
er o
f A
pp
lican
ts
Charting Outcomes in the Match: U.S. MD Seniors, 2020
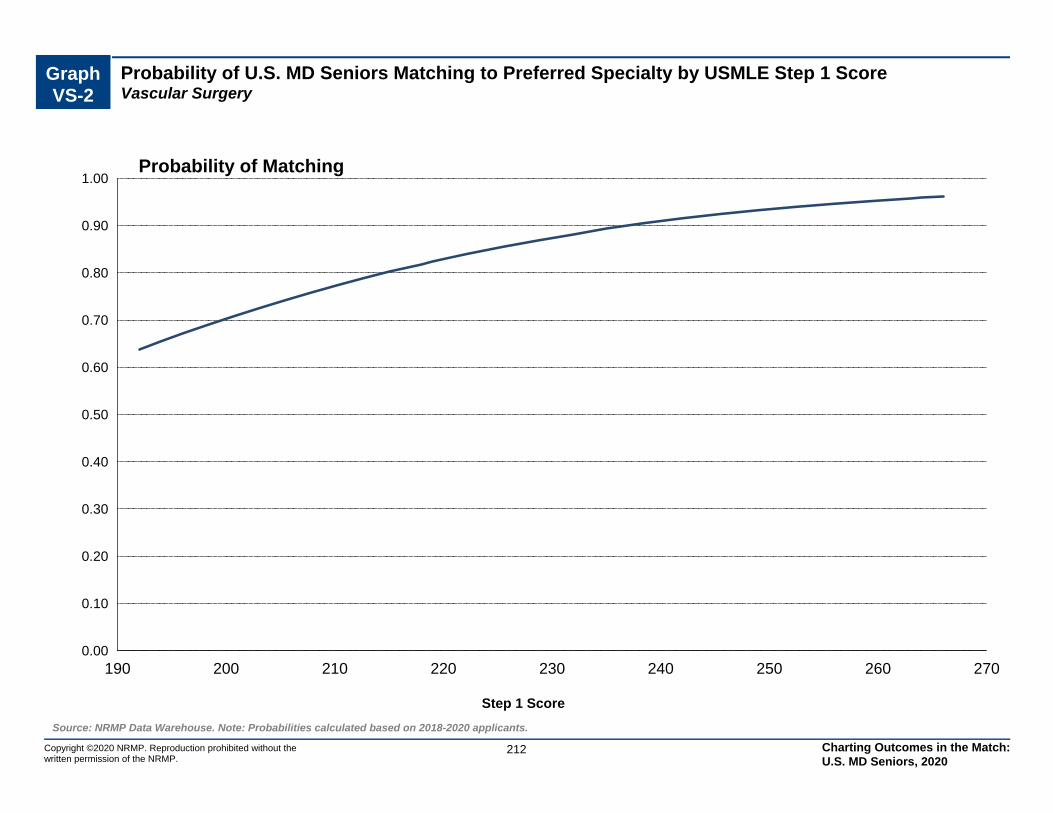
Graph VS-2
Probability of U.S. MD Seniors Matching to Preferred Specialty by USMLE Step 1 ScoreVascular Surgery
0.00
0.10
0.20
0.30
0.40
0.50
0.60
0.70
0.80
0.90
1.00
190 200 210 220 230 240 250 260 270
Step 1 Score
Probability of Matching
Source: NRMP Data Warehouse. Note: Probabilities calculated based on 2018-2020 applicants.
212Copyright ©2020 NRMP. Reproduction prohibited without the written permission of the NRMP.
Charting Outcomes in the Match: U.S. MD Seniors, 2020

0
10
20
30
40
50
None 1 2 3 4 5 or More
02
62 3
47
31 1 0 1
9
Matched Not Matched
Publications
Nu
mb
er o
f A
pp
lican
ts
0
4
8
12
16
20
24
28
None 1 2 3 4 5 or More
0
3
89
15
25
13
1 1
53
Matched Not Matched
Research Projects
Nu
mb
er o
f A
pp
lican
tsChart VS-5
Number of Research Projects of U.S. MD SeniorsVascular Surgery
Source: NRMP Data Warehouse
213Copyright ©2020 NRMP. Reproduction prohibited without the written permission of the NRMP.
Chart VS-6
Number of Abstracts, Presentations, and Publications of U.S. MD SeniorsVascular Surgery
Charting Outcomes in the Match: U.S. MD Seniors, 2020
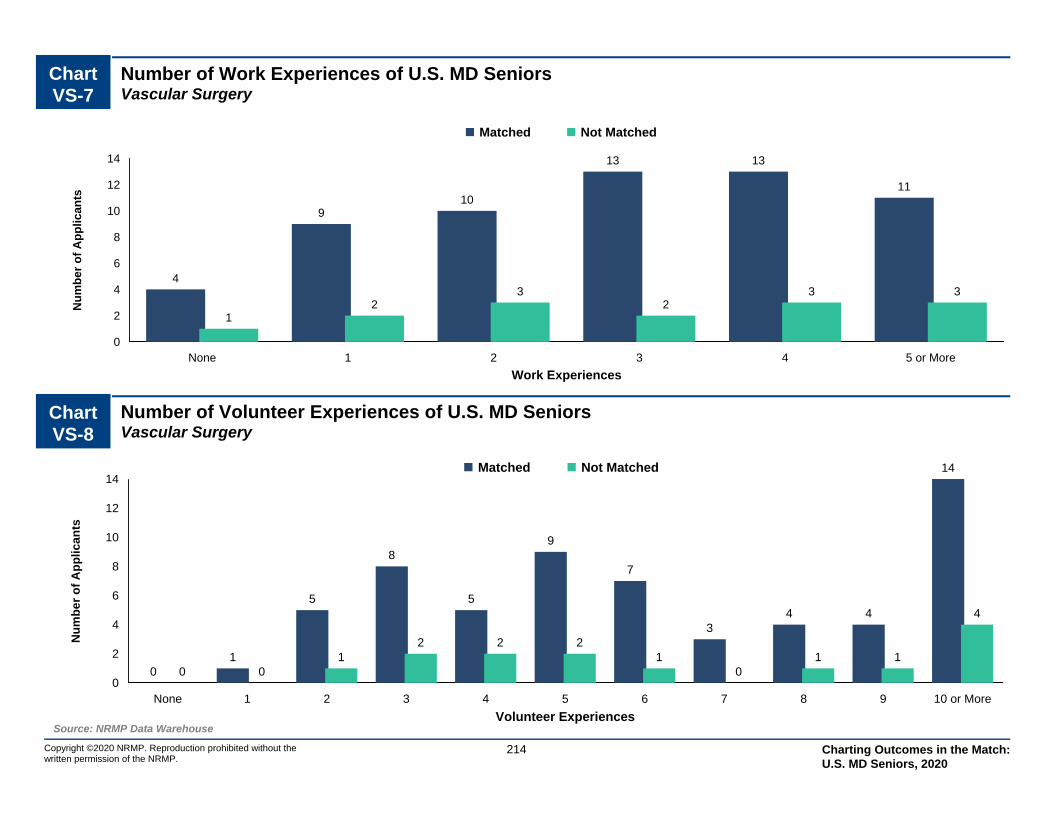
0
2
4
6
8
10
12
14
None 1 2 3 4 5 6 7 8 9 10 or More
01
5
8
5
9
7
34 4
14
0 01
2 2 21
01 1
4
Matched Not Matched
Volunteer Experiences
Nu
mb
er o
f A
pp
lican
ts
0
2
4
6
8
10
12
14
None 1 2 3 4 5 or More
4
910
13 13
11
12
32
3 3
Matched Not Matched
Work Experiences
Nu
mb
er o
f A
pp
lican
tsChart VS-7
Number of Work Experiences of U.S. MD SeniorsVascular Surgery
Source: NRMP Data Warehouse
214Copyright ©2020 NRMP. Reproduction prohibited without the written permission of the NRMP.
Chart VS-8
Number of Volunteer Experiences of U.S. MD SeniorsVascular Surgery
Charting Outcomes in the Match: U.S. MD Seniors, 2020
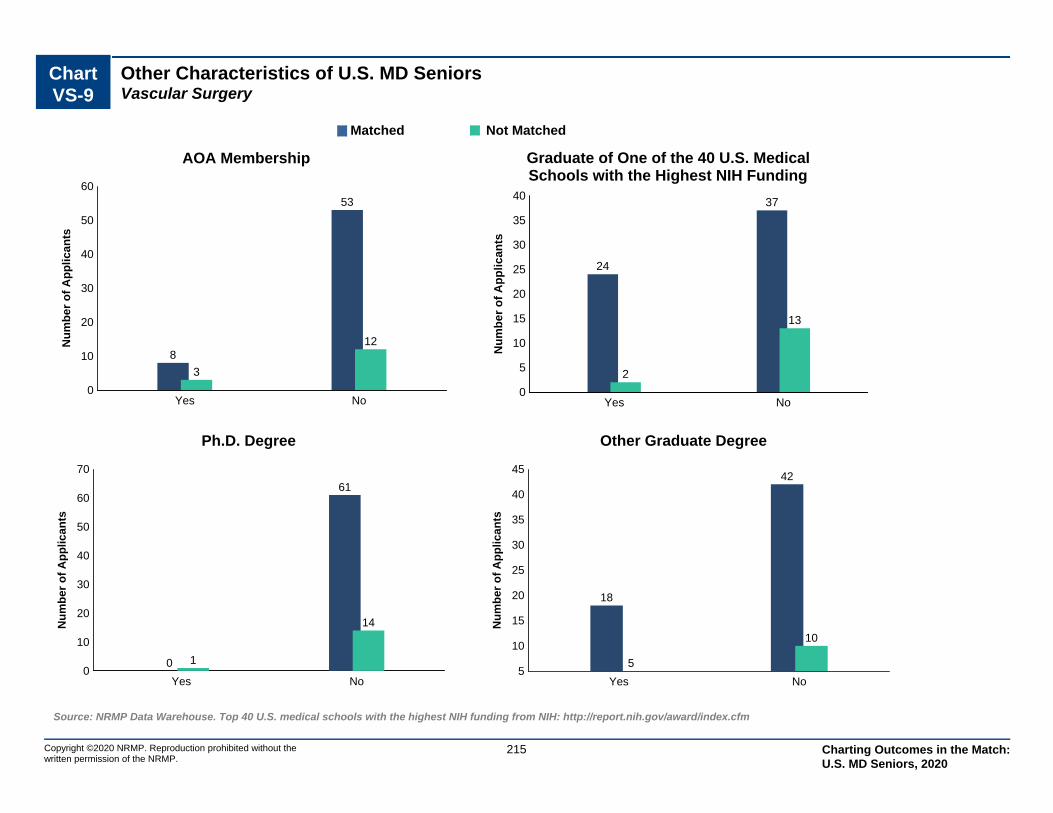
Chart VS-9
Other Characteristics of U.S. MD SeniorsVascular Surgery
Copyright ©2020 NRMP. Reproduction prohibited without the written permission of the NRMP.
Source: NRMP Data Warehouse. Top 40 U.S. medical schools with the highest NIH funding from NIH: http://report.nih.gov/award/index.cfm
215
0
10
20
30
40
50
60
Yes No
8
53
3
12Nu
mb
er
of
Ap
pli
ca
nts
AOA Membership
0
5
10
15
20
25
30
35
40
Yes No
24
37
2
13
Nu
mb
er o
f A
pp
lican
ts
Graduate of One of the 40 U.S. MedicalSchools with the Highest NIH Funding
0
10
20
30
40
50
60
70
Yes No
0
61
1
14Nu
mb
er o
f A
pp
lican
ts
Ph.D. Degree
5
10
15
20
25
30
35
40
45
Yes No
18
42
5
10
Nu
mb
er o
f A
pp
lican
ts
Other Graduate Degree
Matched Not Matched
Charting Outcomes in the Match: U.S. MD Seniors, 2020