charting results so we can understand and...
TRANSCRIPT

ISPI 2004 Carl Binder, PhD, CPTCharting Results So We Can Understand and Communicate Them
© 2004 Carl Binder, Ph.D. Binder Riha Associates www.Binder-Riha.com (707 578-7850 1
© Binder Riha Associates 2004 ISPI Tampa 2004
Charting Results So We CanUnderstand and Communicate Them
The Standard Celeration Chart in Examples
Charting Results So We CanUnderstand and Communicate Them
The Standard Celeration Chart in Examples
Carl Binder, PhD, CPTBinder Riha Associates
4966 Wilshire Dr. Santa Rosa, CA 95404
WWW.Binder-Riha.com
© Binder Riha Associates 2004 ISPI Tampa 2004
AgendaAgenda
Introduction and Background Rationale and Principles Illustrative Examples Questions and Discussion

ISPI 2004 Carl Binder, PhD, CPTCharting Results So We Can Understand and Communicate Them
© 2004 Carl Binder, Ph.D. Binder Riha Associates www.Binder-Riha.com (707 578-7850 2
© Binder Riha Associates 2004 ISPI Tampa 2004
Reasons for MeasurementAlso TYPES of Measurement
Reasons for MeasurementAlso TYPES of Measurement
Validation
Accountability
Decision-making
If you have data for making decisions, you’vegenerally got the other two covered.
If you have data for making decisions, you’vegenerally got the other two covered.
© Binder Riha Associates 2004 ISPI Tampa 2004
The Foundation of Measurement isCounting with Standard Units!
The Foundation of Measurement isCounting with Standard Units!

ISPI 2004 Carl Binder, PhD, CPTCharting Results So We Can Understand and Communicate Them
© 2004 Carl Binder, Ph.D. Binder Riha Associates www.Binder-Riha.com (707 578-7850 3
© Binder Riha Associates 2004 ISPI Tampa 2004
All Performance Occurs in TimeSo Don’t Ignore The Time Dimension
All Performance Occurs in TimeSo Don’t Ignore The Time Dimension
© Binder Riha Associates 2004 ISPI Tampa 2004
Choose Time Intervals to SupportYour Decision-making Frequency
Choose Time Intervals to SupportYour Decision-making Frequency
Count per minute each day to monitor skill learning
Count per day to monitor on-the-job behavior
Count per week to manage at the front line
Count per month for executive decision-making
Count per year for macro economics and long-termstrategic planning.

ISPI 2004 Carl Binder, PhD, CPTCharting Results So We Can Understand and Communicate Them
© 2004 Carl Binder, Ph.D. Binder Riha Associates www.Binder-Riha.com (707 578-7850 4
© Binder Riha Associates 2004 ISPI Tampa 2004
Percentages are Dangerous!Percentages are Dangerous!
Can you show me a performance of 100% correct?
100 + 20% = 120.
Percentage is NOT a measure of Performance.
A given percentage increase is not equal to the same percentage decrease.
Percentage is NOT a measure of Performance.
A given percentage increase is not equal to the same percentage decrease.
What is 120 - 20%?
(The answer is 96!)
© Binder Riha Associates 2004 ISPI Tampa 2004
100% Accuracy or QualityAs Good as It Gets?
100% Accuracy or QualityAs Good as It Gets?
100%
0%
Days
?? “Overlearning” ??
Percent correct is not ameasure of performance.
It is a dimensionless quantity!
Percent correct is not ameasure of performance.
It is a dimensionless quantity!
Acc
urac
y or
Qua
lity
We can’t see changes in behavior beyond accuracy-only
We can’t see changes in behavior beyond accuracy-only
ISPI 2004 Carl Binder, PhD, CPTCharting Results So We Can Understand and Communicate Them
© 2004 Carl Binder, Ph.D. Binder Riha Associates www.Binder-Riha.com (707 578-7850 5
© Binder Riha Associates 2004 ISPI Tampa 2004
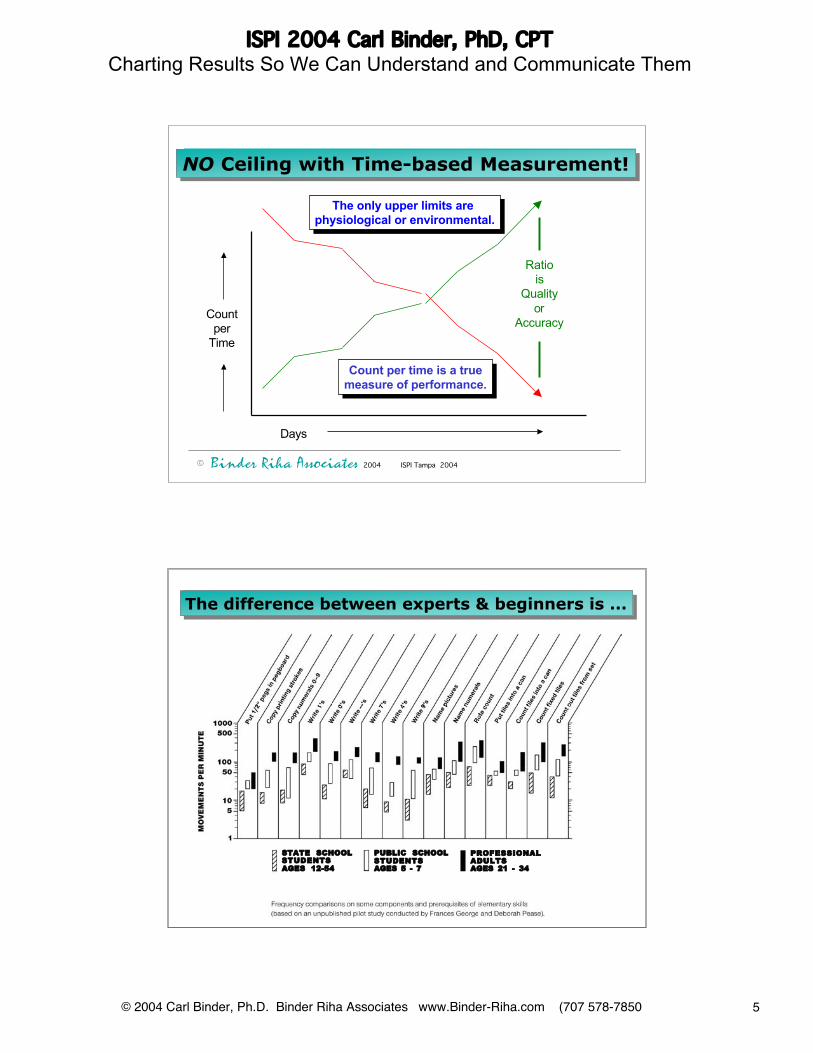
NO Ceiling with Time-based Measurement!NO Ceiling with Time-based Measurement!
Days
The only upper limits are physiological or environmental.
The only upper limits are physiological or environmental.
Count per time is a truemeasure of performance.
Count per time is a truemeasure of performance.
Countper
Time
Ratiois
Qualityor
Accuracy
© Binder Riha Associates 2004 ISPI Tampa 2004
STATE SCHOOLSTUDENTSAGES 12-54
PUBLIC SCHOOLSTUDENTSAGES 5 - 7
PROFESSIONALADULTSAGES 21 - 34
The difference between experts & beginners is ...The difference between experts & beginners is ...

ISPI 2004 Carl Binder, PhD, CPTCharting Results So We Can Understand and Communicate Them
© 2004 Carl Binder, Ph.D. Binder Riha Associates www.Binder-Riha.com (707 578-7850 6
© Binder Riha Associates 2004 ISPI Tampa 2004
STATESCHOOLSTUDENTSAGES 12-54
PUBLICSCHOOLSTUDENTSAGES 5 - 7
PROFESSIONALADULTSAGES 21 - 34
But we can’t tell the differencewith percent correct!
But we can’t tell the differencewith percent correct!
© Binder Riha Associates 2004 ISPI Tampa 2004
Rule About PercentagesRule About Percentages
If you use percentages or ratios,ALWAYS show the original counts, too.
If you use percentages or ratios,ALWAYS show the original counts, too.
Have you ever seen a budget or a balancesheet without the actual dollar amounts?

ISPI 2004 Carl Binder, PhD, CPTCharting Results So We Can Understand and Communicate Them
© 2004 Carl Binder, Ph.D. Binder Riha Associates www.Binder-Riha.com (707 578-7850 7
© Binder Riha Associates 2004 ISPI Tampa 2004
Multiply / Divide Charts Work BestMultiply / Divide Charts Work Best
Performance multiplies, it does not add.
Multiply/Divide charts allow us to see and quantifytrends independent of levels.
Multiply/Divide allows us to see and quantify ratiosand variability (bounce, range) independent of levels.
Multiply/Divide allows us to see accuracy andproductivity independently, but simultaneously.
Ogden Lindsley invented theStandard Change Chart
(aka Standard Celeration Chart)
© Binder Riha Associates 2004 ISPI Tampa 2004
.001
.01
.1
1
10
100
1000
COUN
T PE
R M
INUT
E
0 14 28 42 56 70 84 98 112 126 140SUCCESSIVE CALENDAR DAYS
0 4
CALENDAR WEEKS
8 12 16 20
___|___|___ ___|___|___ ___|___|___ ___|___|___ ___|___|___ ___|___|___Dy Mo Yr Dy Mo Yr Dy Mo Yr Dy Mo Yr Dy Mo Yr Dy Mo Yr
•••
•••••••••
The multiply/divide chart straightens curvesto allow accurate description/projection of trends.
(practically equal to statistical “least squares” regression lines)
It also allows us to quantify “bounce” (variability)and show it as an envelope parallel to the trend line.

ISPI 2004 Carl Binder, PhD, CPTCharting Results So We Can Understand and Communicate Them
© 2004 Carl Binder, Ph.D. Binder Riha Associates www.Binder-Riha.com (707 578-7850 8
© Binder Riha Associates 2004 ISPI Tampa 2004
.001
.01
.1
1
10
100
1000
COUN
T PE
R M
INUT
E
0 14 28 42 56 70 84 98 112 126 140SUCCESSIVE CALENDAR DAYS
0 4
CALENDAR WEEKS
8 12 16 20
___|___|___ ___|___|___ ___|___|___ ___|___|___ ___|___|___ ___|___|___Dy Mo Yr Dy Mo Yr Dy Mo Yr Dy Mo Yr Dy Mo Yr Dy Mo Yr
X 2.0 per week
X 4.0
per
wee
k
X 8
.0 p
er w
eek
Accelerating trends multiplyper week (or month, year, etc.
(ac- or de-)celeration period
© Binder Riha Associates 2004 ISPI Tampa 2004
.001
.01
.1
1
10
100
1000
COUN
T PE
R M
INUT
E
0 14 28 42 56 70 84 98 112 126 140SUCCESSIVE CALENDAR DAYS
0 4
CALENDAR WEEKS
8 12 16 20
___|___|___ ___|___|___ ___|___|___ ___|___|___ ___|___|___ ___|___|___Dy Mo Yr Dy Mo Yr Dy Mo Yr Dy Mo Yr Dy Mo Yr Dy Mo Yr
÷ 8.0 per week
÷ 2.0 per week÷ 4.0 per week
Decelerating trends divide perweek (or month, year, etc.

ISPI 2004 Carl Binder, PhD, CPTCharting Results So We Can Understand and Communicate Them
© 2004 Carl Binder, Ph.D. Binder Riha Associates www.Binder-Riha.com (707 578-7850 9
© Binder Riha Associates 2004 ISPI Tampa 2004
.001
.01
.1
1
10
100
1000
COUN
T PE
R M
INUT
E
0 14 28 42 56 70 84 98 112 126 140SUCCESSIVE CALENDAR DAYS
0 4
CALENDAR WEEKS
8 12 16 20
___|___|___ ___|___|___ ___|___|___ ___|___|___ ___|___|___ ___|___|___Dy Mo Yr Dy Mo Yr Dy Mo Yr Dy Mo Yr Dy Mo Yr Dy Mo Yr
X2.0 x5.0 x10.0 x 100.0
Ratios look the same independent of level.Use them to describe accuracy, bounce,
deficits, PIPs, spread, change, or businessratios.
© Binder Riha Associates 2004 ISPI Tampa 2004
.001
.01
.1
1
10
100
1000
COUN
T PE
R M
INUT
E
0 14 28 42 56 70 84 98 112 126 140SUCCESSIVE CALENDAR DAYS
0 4
CALENDAR WEEKS
8 12 16 20
___|___|___ ___|___|___ ___|___|___ ___|___|___ ___|___|___ ___|___|___Dy Mo Yr Dy Mo Yr Dy Mo Yr Dy Mo Yr Dy Mo Yr Dy Mo Yr
X2.0 x5.0 x10.0 x 100.0

ISPI 2004 Carl Binder, PhD, CPTCharting Results So We Can Understand and Communicate Them
© 2004 Carl Binder, Ph.D. Binder Riha Associates www.Binder-Riha.com (707 578-7850 10
© Binder Riha Associates 2004 ISPI Tampa 2004
.001
.01
.1
1
10
100
1000
COUN
T PE
R M
INUT
E
0 14 28 42 56 70 84 98 112 126 140SUCCESSIVE CALENDAR DAYS
0 4
CALENDAR WEEKS
8 12 16 20
___|___|___ ___|___|___ ___|___|___ ___|___|___ ___|___|___ ___|___|___Dy Mo Yr Dy Mo Yr Dy Mo Yr Dy Mo Yr Dy Mo Yr Dy Mo Yr
X2.0 x5.0 x10.0 x 100.0
ISPI 2004 Carl Binder, PhD, CPTCharting Results So We Can Understand and Communicate Them
© 2004 Carl Binder, Ph.D. Binder Riha Associates www.Binder-Riha.com (707 578-7850 11
© Binder Riha Associates 2004 ISPI Tampa 2004
.001
.01
.1
1
10
100
1000
COUN
T PE
R M
INUT
E
0 14 28 42 56 70 84 98 112 126 140SUCCESSIVE CALENDAR DAYS
0 4
CALENDAR WEEKS
8 12 16 20
___|___|___ ___|___|___ ___|___|___ ___|___|___ ___|___|___ ___|___|___Dy Mo Yr Dy Mo Yr Dy Mo Yr Dy Mo Yr Dy Mo Yr Dy Mo Yr
● ✖●
●
✖ ✖
● ●●✖
✖
✖● ✖●
●
✖ ✖
● ✖●
●
✖ ✖
● ●●✖
✖
✖
● ●●✖
✖
✖
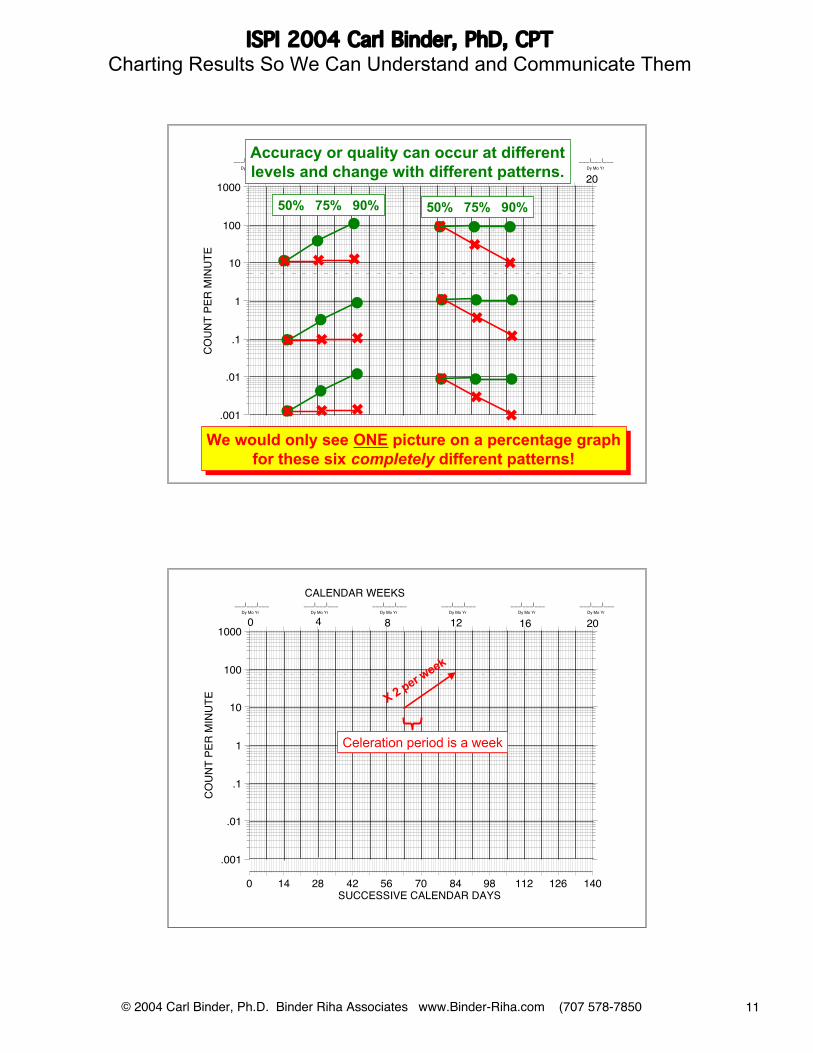
50% 75% 90% 50% 75% 90%
Accuracy or quality can occur at differentlevels and change with different patterns.
We would only see ONE picture on a percentage graphfor these six completely different patterns!
We would only see ONE picture on a percentage graphfor these six completely different patterns!
© Binder Riha Associates 2004 ISPI Tampa 2004
.001
.01
.1
1
10
100
1000
COUN
T PE
R M
INUT
E
0 14 28 42 56 70 84 98 112 126 140SUCCESSIVE CALENDAR DAYS
0 4
CALENDAR WEEKS
8 12 16 20
___|___|___ ___|___|___ ___|___|___ ___|___|___ ___|___|___ ___|___|___Dy Mo Yr Dy Mo Yr Dy Mo Yr Dy Mo Yr Dy Mo Yr Dy Mo Yr
Celeration period is a week
X 2 per week

ISPI 2004 Carl Binder, PhD, CPTCharting Results So We Can Understand and Communicate Them
© 2004 Carl Binder, Ph.D. Binder Riha Associates www.Binder-Riha.com (707 578-7850 12
© Binder Riha Associates 2004 ISPI Tampa 2004
1
10
100
1000
10000
100000
1000000Co
unt P
er W
eek
0 5 10 15 20 25 30 35 40 45 50 55 60 65 70 75 80 85 90 95 100Weeks
CALENDAR MONTHS
per month
™
/ 2
/ 4
/ 1.4
x 4
x 16
x 1.0
x 2x 1.4
/ 16
Standard Celeration
___YEAR
_______
MONTH
_______
MONTH
_______
MONTH
_______
MONTH
_______
MONTH
_______
MONTH
_______
MONTH
_______
MONTH
_______
MONTH
_______
MONTH
_______
MONTH
_______
MONTH
_______
MONTH
_______
MONTH
_______
MONTH
_______
MONTH
_______
MONTH
_______
MONTH
_______
MONTH
_______
MONTH
0 2 4 6 8 10 12 14 16 18 20
Celeration period is a month
X 2 per month
© Binder Riha Associates 2004 ISPI Tampa 2004
JF
MA
MJ
JA
SO
ND
1
10
100
1000
10000
100000
1000000
Coun
t Per
Mon
th
0 12 24 36 48 60 72 84 96 108 120Months
CALENDAR YEARS0 1 2 3 4 5 6 7 8 9 10
_____YEAR
Celeration period is six months
X 2 per 6 m
onths

ISPI 2004 Carl Binder, PhD, CPTCharting Results So We Can Understand and Communicate Them
© 2004 Carl Binder, Ph.D. Binder Riha Associates www.Binder-Riha.com (707 578-7850 13
© Binder Riha Associates 2004 ISPI Tampa 2004
0 20
CALENDAR YEARS
40 60 80 100per 5 yrs
1
10
100
1000
10000
100000
1000000
Coun
t Per
Yea
r
1950 1960 1970 1980 1990 2000 2010 2020 2030 2040 2050
Celeration period is five years
X 2 per 5 years
© Binder Riha Associates 2004 ISPI Tampa 2004
.001
.01
.1
1
10
100
1000
Coun
t per
Min
ute
0 14 28 42 56 70 84 98 112 126 140Calendar Days
0 4 8 12 16 20
x1.0x1.4
x 4x 16
x 2
/1.4
/ 4/16
/ 2
Multiplyor Divideper week
Calendar Weeks
Sample of individual practice cardlearning using 30-second measure -ment timings each day for twoweeks. Correct responses (•) perminute accelerated by about x3.0per week while errors plus skips ( x)decelerated by about /2.6 per weekover the course of the program.
By the end of the program, thetrainee was making about 40 correctresponses for every 1 error and wasresponding at over 80 correct perminute – a fluent level of perfor -mance on basic facts.
• Correct responsesx Errors + skips
A Learning Chart
X3 per week
/ 2.6 per week

ISPI 2004 Carl Binder, PhD, CPTCharting Results So We Can Understand and Communicate Them
© 2004 Carl Binder, Ph.D. Binder Riha Associates www.Binder-Riha.com (707 578-7850 14
© Binder Riha Associates 2004 ISPI Tampa 2004
Practice Accelerates Performance
.001
.01
.1
1
10
100
1000
Coun
t Per
Min
ute
0 14 28 42 56 70 84 98 112 126 140 Calendar Days
(start-day was 06/15/1980)
RFloorCount Per Minute
™
per weekx 1.0
x 1.4
x 4
x 16
x 2
x1.3 x1.4 x3.0 x5.0
12-16 year-olds write digits (control for total time per week)
One drillper day
Two drillsper day
Four drillsper day
Eight drillsper day
(learning per week)
© Binder Riha Associates 2004 ISPI Tampa 2004.001
.01
.1
1
10
100
1000
0 14 28 42 56 70 84 98 112 126 140Successive Calendar Days
0 4
CALENDAR WEEKS
8 12 16 2023 09 79 21 10 79 18 11 79 16 12 79 13 01 8026 08 79
Kim A. See/Write by 2‘s
10 minutes
2 minutes2 minutes
Performance duration can affectboth frequency and celeration.

ISPI 2004 Carl Binder, PhD, CPTCharting Results So We Can Understand and Communicate Them
© 2004 Carl Binder, Ph.D. Binder Riha Associates www.Binder-Riha.com (707 578-7850 15
© Binder Riha Associates 2004 ISPI Tampa 2004
01 12 02 20 04 0323 03 0323 02 0326 01 0329 12 02
Scheduling Errors per Day in a Casino
x 1.0x 1.4
x 4x 16
x 2
/ 1.4
/ 4
/ 16
/ 2
Multiplyor Divideper week
© Binder Riha Associates 2004 ISPI Tampa 2004
0
5
10
15
20
25
30
35
40
DAY1
DAY2
DAY3
DAY4
DAY5
DAY6
DAY7
DAY8
DAY9
DAY10
DAY11
DAY12
DAY13
DAY14
DAY15
PART-TIMEFLUENCY TRAINED
GROUP 2
TARGET
PART-TIME NON FLUENCY
TRAINED GROUP 1
Impact on Job ProductivityImpact on Job Productivity

ISPI 2004 Carl Binder, PhD, CPTCharting Results So We Can Understand and Communicate Them
© 2004 Carl Binder, Ph.D. Binder Riha Associates www.Binder-Riha.com (707 578-7850 16
© Binder Riha Associates 2004 ISPI Tampa 2004
.001
.01
.1
1
10
100
1000
Calls
Per
Hou
r
0 14 28 42 56 70 84 98 112 126 140Calendar Days
• Calls per hr. after fluency training Calls per hr. without fluency training
Group productivity measures in acustomer call center with (•) andwithout ( ) fluency-based new-hire training.
The new-hire group trained usinga fluency-based program acceler -ated call handling by about x1.4per week for the two weeks aftertraining, while those trained with-out the fluency program were flat(x1.0) or decelerated slightly (/1.1)over the two-week measurementperiod. By the end of the two-week period, the fluency-trainedrepresentatives performed atabout x1.6 (or 60%) higher thanthe nonfluency group.
0 4 8 12 16 20Calendar Weeks
x1.0x1.4
x 4x 16
x 2
/1.4
/ 4/16
/ 2
Multiplyor Divideper week
Productivity on the Job
X 1.4 per week
/ 1.2 per week
© Binder Riha Associates 2004 ISPI Tampa 2004

ISPI 2004 Carl Binder, PhD, CPTCharting Results So We Can Understand and Communicate Them
© 2004 Carl Binder, Ph.D. Binder Riha Associates www.Binder-Riha.com (707 578-7850 17
© Binder Riha Associates 2004 ISPI Tampa 2004
1
10
100
1000
10000
100000
1000000
0 12 24 36 48 60 72 84 96 108 120Calendar Months
Calendar Years0 1 2 3 4 5 6 7 8 9 10
FIGURE 3
Revenues per month for anindependent consultant’spractice over a period of thirtymonths.
Revenues multiplied by aboutx1.4 (or increased by 40%) persixmonths on average. Duringthe second year, changes in thesales process divided monthlyvariability from more than x50.0to about x3.2, resulting inmorepredictable cash flow.
Over the course of the thirtymonths, revenues multipliedby around x4.0 from around$8,000 per month to over $30,000per month.
Revenues per month fora Consulting Start-up
© Binder Riha Associates 2004 ISPI Tampa 2004
1
10
100
1000
10000
100000
1000000
0 12 24 36 48 60 72 84 96 108 120Calendar Months
Calendar Years0 1 2 3 4 5 6 7 8 9 10
x 1.0x 1.4
x 4
x 16
x 2Multiplyor Divideper sixmonths/ 1.4
/ 4
/ 16
/ 2
FIGURE 3
Revenues per month for anindependent consultant’spractice over a period of thirtymonths.
Revenues multiplied by aboutx1.4 (or increased by 40%) persixmonths on average. Duringthe second year, changes in thesales process divided monthlyvariability from more than x50.0to about x3.2, resulting inmorepredictable cash flow.
Over the course of the thirtymonths, revenues multipliedby around x4.0 from around$8,000 per month to over $30,000per month.
Revenues per month fora Consulting Start-up
Growing x1.4 (+40%) per 6 months

ISPI 2004 Carl Binder, PhD, CPTCharting Results So We Can Understand and Communicate Them
© 2004 Carl Binder, Ph.D. Binder Riha Associates www.Binder-Riha.com (707 578-7850 18
© Binder Riha Associates 2004 ISPI Tampa 2004
1
10
100
1000
10000
100000
1000000
0 12 24 36 48 60 72 84 96 108 120Calendar Months
Calendar Years0 1 2 3 4 5 6 7 8 9 10
x 1.0x 1.4
x 4
x 16
x 2Multiplyor Divideper sixmonths/ 1.4
/ 4
/ 16
/ 2
FIGURE 3
Revenues per month for anindependent consultant’spractice over a period of thirtymonths.
Revenues multiplied by aboutx1.4 (or increased by 40%) persixmonths on average. Duringthe second year, changes in thesales process divided monthlyvariability from more than x50.0to about x3.2, resulting inmorepredictable cash flow.
Over the course of the thirtymonths, revenues multipliedby around x4.0 from around$8,000 per month to over $30,000per month.
X 52.0 “bounce”
X 3.2 “bounce”
Revenues per month fora Consulting Start-up
© Binder Riha Associates 2004 ISPI Tampa 2004

ISPI 2004 Carl Binder, PhD, CPTCharting Results So We Can Understand and Communicate Them
© 2004 Carl Binder, Ph.D. Binder Riha Associates www.Binder-Riha.com (707 578-7850 19
© Binder Riha Associates 2004 ISPI Tampa 2004
© Binder Riha Associates 2004 ISPI Tampa 2004

ISPI 2004 Carl Binder, PhD, CPTCharting Results So We Can Understand and Communicate Them
© 2004 Carl Binder, Ph.D. Binder Riha Associates www.Binder-Riha.com (707 578-7850 20
© Binder Riha Associates 2004 ISPI Tampa 2004
20012000 2002 2003 2004 2005
New
Pro
-act
ive
Man
ager
Ch
ang
e in
Mar
ket
focu
s
© Binder Riha Associates 2004 ISPI Tampa 2004
20012000 2002 2003 2004 2005
New
Bo
ok

ISPI 2004 Carl Binder, PhD, CPTCharting Results So We Can Understand and Communicate Them
© 2004 Carl Binder, Ph.D. Binder Riha Associates www.Binder-Riha.com (707 578-7850 21
© Binder Riha Associates 2004 ISPI Tampa 2004
20012000 2002 2003 2004 2005
© Binder Riha Associates 2004 ISPI Tampa 2004
20012000 2002 2003 2004 2005

ISPI 2004 Carl Binder, PhD, CPTCharting Results So We Can Understand and Communicate Them
© 2004 Carl Binder, Ph.D. Binder Riha Associates www.Binder-Riha.com (707 578-7850 22
© Binder Riha Associates 2004 ISPI Tampa 2004
SummarySummary
The foundation of measurement is counting.
We need standard units to count –like science and accounting.
All performance occurs in time, so don’t ignore it. (Frequency -count/time - is a universal measure.)
Percentages are dangerous.
We look for changes in trends, levels, and/or variability (“bounce”).We should be able to see them separately.
Most graphs (and tools that produce them) are stretch-to-fill orfill-the-frame. This leads to distortion, inefficient and even biasedcommunication. (“Lying with graphs”?)
The Standard Chart family allows us to rapidly visualize and makedecisions about trends, levels, and bounce.
© Binder Riha Associates 2004 ISPI Tampa 2004
Thank You!
And please check the handout for more information.

© 2004 Carl Binder, PhD, CPT ISPI 2004 Handout www.Binder-Riha.com [email protected] 1
Value of the Standard Celeration (Change) Chart
Ogden Lindsley invented the Standard Celeration Chart (also known as the Standard Change Chart)during the 1960’s to improve analysis and sharing of results among educators who used systematicdata-based teaching methods. By creating a single graphic format that could be used to monitor thefrequency and trend of any countable behavior, accomplishment/output, or organizational result, hereduced the time needed to share a chart from around 20 minutes to 2-3 minutes. This was a hugeimprovement in communication efficiency and it also turned out to be a big advance in analytic power.
The chart has been used in scientific research, teaching, and organizational management by tens ofthousands of people since that time. “Celeration” is a term referring to either acceleration ordeceleration – the rate of change in whatever is being measured. What is standard about these chartsis that they represent trends or rates of change (accelerating or decelerating) as standard visual angles.And because they are “multiply/divide” charts up the left (versus “add/subtract” or equal interval), theydepict ratios or multiply/divide relationships between levels as standard visual distances. One need notknow the technical details underlying the Standard Celeration Chart to use it. Once you becomeaccustomed to its standard visual features, directly reading trends, levels, and variability (“bounce”)becomes simple and intuitively obvious.
We are in a sort of transition now, from paper versions of the charts, which have been used fordecades, and computerized versions of various kinds that are not quite ready for prime time. Excel andother computerized charting tools produce “fill-the-frame” or“stretch-to-fill” graphs by adjusting bothscales up the left and across the bottom based on the particular set of data being displayed. Thisdistorts the data and prevents simple visual evaluation of changes and trends – even allowing “lyingwith charts” for those so inclined. The distances and angles that represent differences in level and ratesof change, respectively, vary from one such fill-the-frame chart to another. We are working on easier-to-use computerized versions of the standard chart and they should be available in the coming months.
Read Measurement Counts!
The double meaning of my column’s name at www.PerformanceXpress.org is that measurement isimportant, and that the foundation of measurement is counting standard units of things or dimensions.Over the last two years I have included a number of standard chart examples, and lots of rationale, inthe column. You can see past columns by going to the site and clicking “Back Issues” at the lower left.
What to Count
To measure performance improvement we can count three kinds of things:
• Behavior: We can count instances of behavior that we define as important to measure. (A goodguideline for defining behavior, by the way, is that it is a repeatable action – a verb.) For example,we can count instances of customer service people saying “Thank you” to their customers (positive)or instances in which they use inappropriate language (negative). We can count occurrences ofspecific types of safe or unsafe behavior in the workplace. We can count correct and incorrectresponses in testing, certification, or other learning or assessment situations. We can count manydifferent types of behavior. However, for us Human Performance Technologists, it’s essential thatthat the behavior we count produces or contributes to valuable accomplishments or job outputs.

© 2004 Carl Binder, PhD, CPT ISPI 2004 Handout www.Binder-Riha.com [email protected] 2
• Accomplishments or Job Outputs: As Human Performance Technologists we’re interested in thevaluable accomplishments or job outputs that contribute to organizational or business results. (Agood guideline for defining an accomplishment, by the way, is that it is a thing produced by behavior– a noun.) For example, we can count accepted and rejected proposals, transactions completed,widgets, handled calls, tables served, items that meet quality standards and those that don’t, as so on.We can also count certain types of intangible job outputs such as decisions, which are harder tocapture but nonetheless valuable outputs of jobs or processes. For us Human PerformanceTechnologists, it’s essential that the accomplishments or job outputs that we choose to count(including the outputs such as poor quality products that we want to reduce or eliminate) produce orcontribute to the desired results for the business or organization.
• Business Results: When we speak of business results we usually mean things like dollars inrevenues or profits, customers, people who say they like our company, and so on. These measuresrepresent goals of the organization or of its major sub-organizations and processes that indicatesuccess in the market or in financial or operational terms. In the end, improving these counts is ourreason for existence since increasing behavior or accomplishments is not valuable unless it ultimatelyimproves business results. In many cases, after we count these things, we then create derivativecalculations such as market share or profit margins – ratios or percentages of the original counts. Butit’s always important to remember that the counts themselves are what’s important, and that we willnot fully understand those ratios or percentages if we are not also looking at the original counts.(For example, profit as a percentage of revenue changes over the lifetime of the organization as itgrows from start-up to maturity, usually in direct relation to the actual dollar amount. So knowingthe actual revenues is critical for evaluating profit percentages or ratios.)
References / Web Links
Binder, C. (2001,March). Measurement: A Few Important Ideas. Master’s Series article inPerformance Improvement, 40(3), 20-28. Available as PDF for downloading at www.Binder-Riha.com/publications.htm
Binder, C. (April 2002 – ongoing). Measurement Counts! In ISPI’s monthly online newsletter,www.PerformanceXpress.org (Find back issues by scrolling down the left-hand navigation bar.)
Esque, Timm. Making an Impact. This great little book is available online from the ISPI book store athttp://www.ispi.org/bookstore/pc/5219.htm. Although Timm is not a champion of the Standard Chart,his elegant approach to performance improvement provides a context for using the chart to monitorresults and make decisions for managing and improving performance.
Pennypacker, H.S., Gutierrez Jr., A., and Lindsley, O.R. (2003) Handbook of the Standard CelerationChart. Cambridge Center for Behavioral Studies. Available from www.Behavior.org at the CCBSStore, on page 3 of the “Behavior Analysis Topics and Tools” section of the online catalog.
Standard Celeration Society web site: www.Celeration.org. Other useful links appear on that site,including links to various types of computer-based charting tools.
To purchase paper charts: Behavior Research Company, P.O. Box 3351, Kansas City, Kansas 66103,Fax orders or to request price list 913-362-5900

© 2004 Carl Binder, PhD, CPT ISPI 2004 Cracker Barrel Handout www.Binder-Riha.com [email protected]
Things I Can Count and Chart
Behavior(specify counting period)
Accomplishments / Job Outputs(specify counting period)
Business Results(specify counting period)


J F M A M J J A S O N D J F M A M J J A
