che research paper 21 - university of york
TRANSCRIPT

Circulatory Disease in the NHS: Measuring Trends in Hospital
Costs and Output
CHE Research Paper 21

Circulatory Disease in the NHS: Measuring Trends in Hospital Costs and Output
Adriana Castelli * Peter C Smith * *Centre for Health Economics University of York December 2006


Background CHE Discussion Papers (DPs) began publication in 1983 as a means of making current research material more widely available to health economists and other potential users. So as to speed up the dissemination process, papers were originally published by CHE and distributed by post to a worldwide readership. The new CHE Research Paper series takes over that function and provides access to current research output via web-based publication, although hard copy will continue to be available (but subject to charge). Acknowledgements This study was undertaken as part of the Quest for Quality and Improved Performance, a five-year initiative of The Health Foundation. Disclaimer Papers published in the CHE Research Paper (RP) series are intended as a contribution to current research. Work and ideas reported in RPs may not always represent the final position and as such may sometimes need to be treated as work in progress. The material and views expressed in RPs are solely those of the authors and should not be interpreted as representing the collective views of CHE research staff or their research funders. Further copies Copies of this paper are freely available to download from the CHE website http://www.york.ac.uk/inst/che/publications/publications.htm. Access to downloaded material is provided on the understanding that it is intended for personal use. Copies of downloaded papers may be distributed to third-parties subject to the proviso that the CHE publication source is properly acknowledged and that such distribution is not subject to any payment. Printed copies are available on request at a charge of £5.00 per copy. Please contact the CHE Publications Office, email [email protected], telephone 01904 321458 for further details.
Centre for Health Economics Alcuin College University of York York, UK www.york.ac.uk/inst/che © Adriana Castelli, Peter C Smith


Circulatory disease in the NHS: measuring trends in hospital costs and output
Contents
Executive summary....................................................................................................................1 1. Introduction ............................................................................................................................3 2. Background ............................................................................................................................4
2.1 Literature review and analytic framework ........................................................................4 2.2 Circulatory disease: broad trends for England and international comparisons ...............5
3. Data sources for this study...................................................................................................16 4. Data on Circulatory Diseases ..............................................................................................19
4.1 Data and methodology...................................................................................................19 Outputs ............................................................................................................................19 Inputs...............................................................................................................................24
5. Trends in Activity, Unit Costs and Survival Rates for selected treatments..........................27 5.1 Stroke.............................................................................................................................27 5.2 Coronary Heart Disease (CHD).....................................................................................31 5.3 Symptoms of heart conditions .......................................................................................39
6. Cost weighted output measures of Circulatory diseases.....................................................44 6.1 Cost weighted output growth indices.............................................................................45 6.2 Introducing ‘health improvement’ into output measures................................................46 6.3 Concluding comments ...................................................................................................48
7. Implications for policy and future research ..........................................................................49 References...............................................................................................................................51 Appendix 1: Literature Review .................................................................................................53
A.1 Most recent contributions to the UK debate on NHS output and productivity measurement ....................................................................................................................53
A.1.1 Atkinson Review and its recommendations on the measurement of quality change in health care ......................................................................................................53 A.1.2 Developing new measures of output growth and productivity: the CHE/NIESR approach..........................................................................................................................55 A.1.3 The Department of Health contribution to healthcare sector productivity measurement .................................................................................................................58 A.1.4 The Office for National Statistics work on measuring public service productivity on health .........................................................................................................................61 A.1.5 A diagnosis-based approach to measure output growth .......................................61
A.2 US developments and contributions to the literature on price indices ..........................63 Appendix 2: Technical Appendix..............................................................................................66

CHE Research Paper 21

Circulatory disease in the NHS: measuring trends in hospital costs and output 1
Executive summary 1. Following the publication of the Atkinson Review of the measurement of government outputs in
the National Accounts, there has been great interest in measuring the productivity growth of the National Health Service. Such macro measures of productivity are important when deciding how much public money to devote to the NHS, and in holding the NHS to account. However, it is also important to gain an understanding of the productivity of individual programmes of care, so as to ensure that resources are allocated efficiently within the NHS. Hitherto, such information has not been available. This report is an exploratory study of the feasibility and usefulness of developing measures of growth in outputs, costs and productivity of a single programme of care within the NHS: hospital treatment of circulatory diseases.
2. In this context, productivity is defined as the ratio of an aggregate measure of outputs to an
aggregate measure of inputs for the chosen programme of care. The key methodological challenges are (i) choosing the appropriate measures of NHS activities, (ii) adjusting those measures for the ‘quality’ of care, (iii) aggregating the measures into a single measure of output, (iv) identifying the associated inputs, in the form of a single measure of costs, (v) tracking these measures consistently over time.
3. The building blocks of the study are the measures of hospital ‘continuous inpatient spells’ (CIPs)
of hospital treatment, which include emergency, elective and day case treatment. These capture trends in the volume of activity of the NHS over a six year period, 1998/99 to 2003/04. The type of spell is indicated by diagnosis, as indicated by the Hospital Resource Group (HRG) for the spell. The analysis embraces all HRGs relevant to circulatory disease, including cerebrovascular disease, coronary heart disease, and associated investigations.
4. The value to the patient of these activities is crucially dependent on the quality of the outcome
achieved. The only consistent, universal and reliable measures of outcome currently available in the NHS relate to mortality, either within the hospital spell, or within 30 days of admission. Where appropriate, we therefore use these outcome measures to adjust the crude measures of activity for the quality of outcome achieved.
5. Ideally, we should also like to incorporate other measures of health outcome into the analysis,
such as gains in the quality of life following treatment. Unfortunately, the NHS does not routinely collect health outcome data. However, using a small sample of outcome data for two procedures collected by BUPA, we demonstrate how health outcome data could be used to augment measures of NHS output, and argue that the NHS should move rapidly towards routine collection of such data.
6. The diverse activities (CIPs) that make up this programme of care do not confer equal patient
benefits. They must therefore be aggregated using some system of weights that reflects their relative contribution to aggregate NHS output. In principle, these weights should reflect the average ‘health gain’ of the treatment. In practice, this is rarely available. We therefore follow conventional practice in aggregating treatments according to their estimated costs, acknowledging that this is far from ideal.
7. It is relatively straightforward to identify the total physical inputs consumed by the NHS as a whole,
for example in the form of capital, labour and drugs. However, identifying the part of these inputs that is attributable to an individual programme of care is a major challenge. In particular, specific measures of the physical inputs used by the circulatory disease hospital programme are not available. Instead, as an indicator of inputs consumed, we had to use the measures of reference costs developed by the NHS for the HRGs under consideration. These offer some insights into trends in the volume of physical resources consumed, but may suffer from arbitrary accounting choices and variations in methodology over time.
8. Chapter 5 of the report presents a large amount of material from the datasets used in this study,
in particular trends in the volume of activity, costs and survival rates for selected high-volume HRGs. The general pattern is for activity to remain static or decline in the early years of the study, but to recover by the end of the six year period. Trends in costs are more difficult to describe, as

2 CHE Research Paper 21
much depends on how account is taken of price inflation over the period. For those treatments with significant mortality rates, there is generally an improvement in outcome over the study period.
9. Chapter 6 presents estimates of aggregate measures of outputs and inputs for the programme of
care. Over the study period, activity alone (as measured by the cost-weighted activity index) has increased by 3.90% per annum. Adjusting this for the improvement in 30 day mortality rates increases the annual growth to 4.48%, reflecting the major improvement in outcomes over the study period. The experimental use of BUPA health outcome measures for coronary artery bypass surgery (CABG) and percutaneous transluminal coronary angioplasty (PTCA) suggests a further improvement of about 0.2% per annum, but we emphasize that these are highly speculative and partial estimates.
10. Although we are unable to develop measures of physical input growth, we have calculated total
reference costs for the programme over the study period. These increased from £1.381 billion to £1.960 billion. Using the GDP index of price change, this implies real growth in expenditure of 5.3% per annum, whilst use of a specific NHS index of price change suggests more modest growth of 2.5% per annum.
11. Measures of productivity change in the hospital treatment of circulatory disease are therefore
highly dependent on the measure of input growth used. A very tentative conclusion is that the NHS has used its physical resources more efficiently (to secure annual improvements in physical productivity of up to 2% per annum). However, because of the increased prices it has paid for its inputs, the cost-effectiveness of this programme has declined by anything up to 0.8% over the study period.
12. This study has demonstrated that it is feasible to develop models of productivity growth for a
programme of NHS care. This is an important undertaking for informing resource allocation and purchasing decisions in the NHS. Our tentative conclusion is that, whilst there will always be uncertainty in the estimates derived, this represents an important extension of the work in progress at the Office for National Statistics in measuring whole system productivity change, and we advocate further investigation of other programmes of care, in particular those embracing significant community and prescribing activities.
Circulatory disease in the NHS: measuring trends in hospital costs and output 3
1. Introduction There is increased interest in measuring the productivity of health systems, defined as the ratio of certain outputs to the associated levels of inputs. In the English NHS this has been manifest at the micro level in the work of the National Institute for Health and Clinical Excellence (NICE); at the meso level in the increased attention to programme budgeting in primary care trusts; and at the macro level in the work of the Office for National Statistics in the development of whole system productivity measures. This report examines ‘macro’ level productivity at the national level for a single programme of care – circulatory disease – in the hospital setting. Circulatory disease is defined as problems relating to the heart and the circulation of blood in central and peripheral vessels. It includes both coronary heart disease (problems relating to atheroma of the coronary arteries) and cerebrovascular disease (problems due to interruptions to the blood supply of the brain). The intention is to track recent NHS trends in the inputs, activities and outputs in this programme of care. The report is organised as follows. In the next section we set the background to our investigation. Firstly we summarise the existing literature on measurement of healthcare output and productivity, including recent UK publications by the Office for National Statistics and US developments on price indices. We then provide some background data on national trends and international comparisons of mortality rates associated with a selection of diseases diagnoses that fall under the broad category of “circulatory diseases”. The rest of the report focuses on England only. In Section 3 we present an overview of the datasets that were used to produce measures of costs and output growth for circulatory diseases, explaining how the available data have been collected and collated, along with explanations of the variables used. In section 4 we describe the study methodology, in particular the measurement of inputs and outputs. Section 5 describes recent trends in activity levels, unit costs and survival rates for some of the major treatments of circulatory disease. Section 6 presents aggregate measures of NHS hospital output and costs for circulatory disease, and the report ends with an assessment of the scope for further work on disease specific productivity measurement in the NHS.

4 CHE Research Paper 21
2. Background
2.1 Literature review and analytic framework There is now considerable research and policy interest in the notion of ‘value for money’ in health care. In particular, following the publication in 2005 of the Atkinson Review of the measurement of government output in the National Accounts, the Office for National Statistics (ONS) has published a series of reports on the aggregate productivity of the NHS. These have been summarised in a previous QQuIP report (Martin, Smith and Leatherman, 2006). As a prelude to this work, we reviewed existing literature on productivity measurement, with particular reference to programmes of health care. The results of the review are reported in Appendix 1. In summary, it discusses:
• the Atkinson Review of the measurement of government output in the National Accounts; • research by the Centre for Health Economics and the National Institute for Economic
Research on NHS productivity; • the associated work of the Department of Health on productivity measurement, and
specifically its detailed work relevant to circulatory disease on the increased use of statins, the effect of improved blood pressure control and reduced cholesterol levels amongst patients in primary care, the effect of improved surgical and medical management of angina, and the effect of improved survival for patients who have been admitted to hospital with a myocardial infarction;
• the work of the Office for National Statistics, which is seeking to synthesise best practice in productivity measurement;
• experimental UK work on ‘disease based’ productivity measurement; • experience in the United States, where there has been an emphasis on disease based
measures of productivity growth. In contrast to most previous UK research, this report is concerned with developing measures of output and productivity for a specific programme of health care, relating to the hospital treatment of circulatory disease. Our intention is to follow the methodology developed in previous macro-level productivity measurement, but to adapt it for use within a specific disease category, and to assess the usefulness of the information it yields. The intention is to seek out a ‘single number’ measure of the output and productivity of a large and complex system – hospital-based care of circulatory disease. The conventional accounting framework for discussing value for money is shown in Figure 2.1. First financial inputs (in the form of costs) are converted into physical inputs (such as labour and capital). The success of this conversion is often referred to as the ‘economy’ with which inputs are purchased. Physical inputs are in turn converted into physical outputs, such as an episode of hospital care. The relationship between physical inputs and outputs is often referred to as ‘efficiency’. Depending on the quality of care, the physical outputs then create eventual outcomes, for example in the form of increases to the quality and length of life. The success of this conversion is referred to as effectiveness.

Circulatory disease in the NHS: measuring trends in hospital costs and output 5
Costs PhysicalInputs
PhysicalOutputs Outcomes
{Economy {Effectiveness{Efficiency
Cost-effectiveness
Figure 2.1: The components of value for money It is conventional to consider various value for money measures under these headings. For example, the traditional measure of ‘length of stay’ for a hospital episode is an efficiency measure, as it indicates the level of physical inputs (bed days) required to produce a physical output (an episode). In contrast, the post-operative mortality rate is a measure of the quality of that output, and therefore a signal of effectiveness. The holy grail of value for money is cost-effectiveness, the ratio of outcomes to inputs. For example, the ‘cost per quality adjusted life year’ used by NICE to assess new technologies is a cost-effectiveness ratio. Of more relevance to this report, the recent interest in developing a single number measure of NHS productivity represents an attempt to move from the piecemeal assessment of indicators of economy, efficiency and effectiveness towards a more comprehensive measure of cost-effectiveness.
2.2 Circulatory disease: broad trends for England and international comparisons The World Health Organization (WHO, 1997) states that ‘Diseases of the heart and circulation - cardiovascular and cerebrovascular - such as heart attacks and stroke, kill more people than any others, accounting for over 15 million deaths, or about 30% of the global total, every year. Many more millions of people are disabled by them. Many who die are under the age of 65, and given today's increased life span, these deaths are premature’. Coronary heart disease (CHD) is the leading cause of death in the United Kingdom, followed in third place by cerebrovascular disease. CHD is responsible for 19.6 per cent of total annual deaths, whilst cerebrovascular disease is responsible for 9.6 per cent of total annual deaths in the whole of the United Kingdom (Compendium for Health Statistics, 2003/04). As Fig. 2.2 shows, mortality rates (directly standardised) for all circulatory diseases have been decreasing in England for the time period 1993 – 2004. Overall mortality rates have been cut by about 40 per cent for men and about 36 per cent for women, equivalent to an average decrease of 4.5 per cent and about 4 per cent per year, respectively for men and women.

6 CHE Research Paper 21
0.00
50.00
100.00
150.00
200.00
250.00
300.00
350.00
400.00
450.00
500.00
1993 1994 1995 1996 1997 1998 1999 2000 2001 2002 2003 2004
Ye ar
DM
R
Males Females All
Figure 2.2 Directly Standardised Mortality Rates (DMR) for all Circulatory Diseases – all ages- per 100,000 European Standard Population, England Source: NHS Information Centre for Health and Social Care – National Centre for Health Outcomes Development.
0.00
50.00
100.00
150.00
200.00
250.00
1993 1994 1995 1996 1997 1998 1999 2000 2001 2002 2003 2004
Ye ar
DM
R
Males Females All
Figure 2.3 Directly Standardised Mortality Rates (DMR) for all Circulatory Diseases – ind. under 75 years of age - per 100,000 European Standard Population, England Source: NHS Information Centre for Health and Social Care – National Centre for Health Outcomes Development. Fig. 2.3 shows trends in directly standardised mortality rates for all circulatory diseases in England for individuals under 75 years of age. This figure is of particular importance as it is one of the target indicators set by the Department of Health in ‘Saving Lives: Our Healthier Nation’ (DH, 1999). The target set by the DH is ‘to reduce death rate from coronary heart disease and stroke and related diseases in people under 75 years by at least two fifths by 2010’.
Circulatory disease in the NHS: measuring trends in hospital costs and output 7
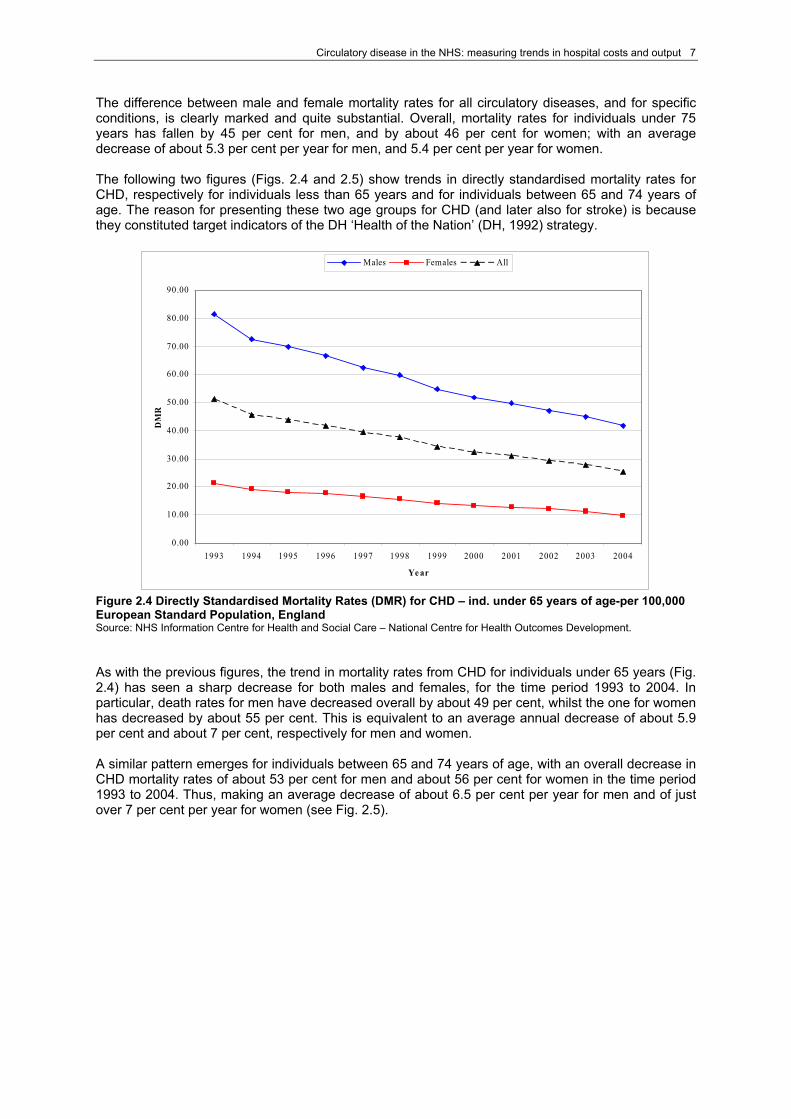
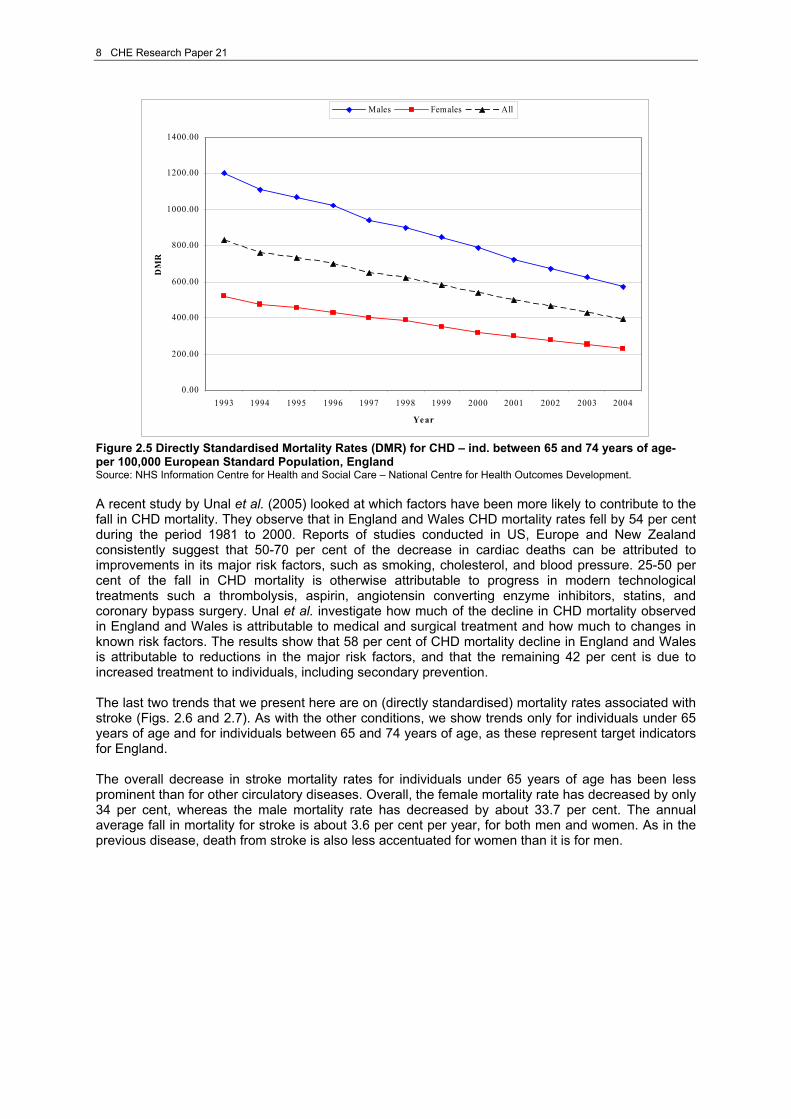
The difference between male and female mortality rates for all circulatory diseases, and for specific conditions, is clearly marked and quite substantial. Overall, mortality rates for individuals under 75 years has fallen by 45 per cent for men, and by about 46 per cent for women; with an average decrease of about 5.3 per cent per year for men, and 5.4 per cent per year for women. The following two figures (Figs. 2.4 and 2.5) show trends in directly standardised mortality rates for CHD, respectively for individuals less than 65 years and for individuals between 65 and 74 years of age. The reason for presenting these two age groups for CHD (and later also for stroke) is because they constituted target indicators of the DH ‘Health of the Nation’ (DH, 1992) strategy.
0.00
10.00
20.00
30.00
40.00
50.00
60.00
70.00
80.00
90.00
1993 1994 1995 1996 1997 1998 1999 2000 2001 2002 2003 2004
Ye ar
DM
R
Males Females All
Figure 2.4 Directly Standardised Mortality Rates (DMR) for CHD – ind. under 65 years of age-per 100,000 European Standard Population, England Source: NHS Information Centre for Health and Social Care – National Centre for Health Outcomes Development. As with the previous figures, the trend in mortality rates from CHD for individuals under 65 years (Fig. 2.4) has seen a sharp decrease for both males and females, for the time period 1993 to 2004. In particular, death rates for men have decreased overall by about 49 per cent, whilst the one for women has decreased by about 55 per cent. This is equivalent to an average annual decrease of about 5.9 per cent and about 7 per cent, respectively for men and women. A similar pattern emerges for individuals between 65 and 74 years of age, with an overall decrease in CHD mortality rates of about 53 per cent for men and about 56 per cent for women in the time period 1993 to 2004. Thus, making an average decrease of about 6.5 per cent per year for men and of just over 7 per cent per year for women (see Fig. 2.5).
8 CHE Research Paper 21
0.00
200.00
400.00
600.00
800.00
1000.00
1200.00
1400.00
1993 1994 1995 1996 1997 1998 1999 2000 2001 2002 2003 2004
Ye ar
DM
R
Males Females All
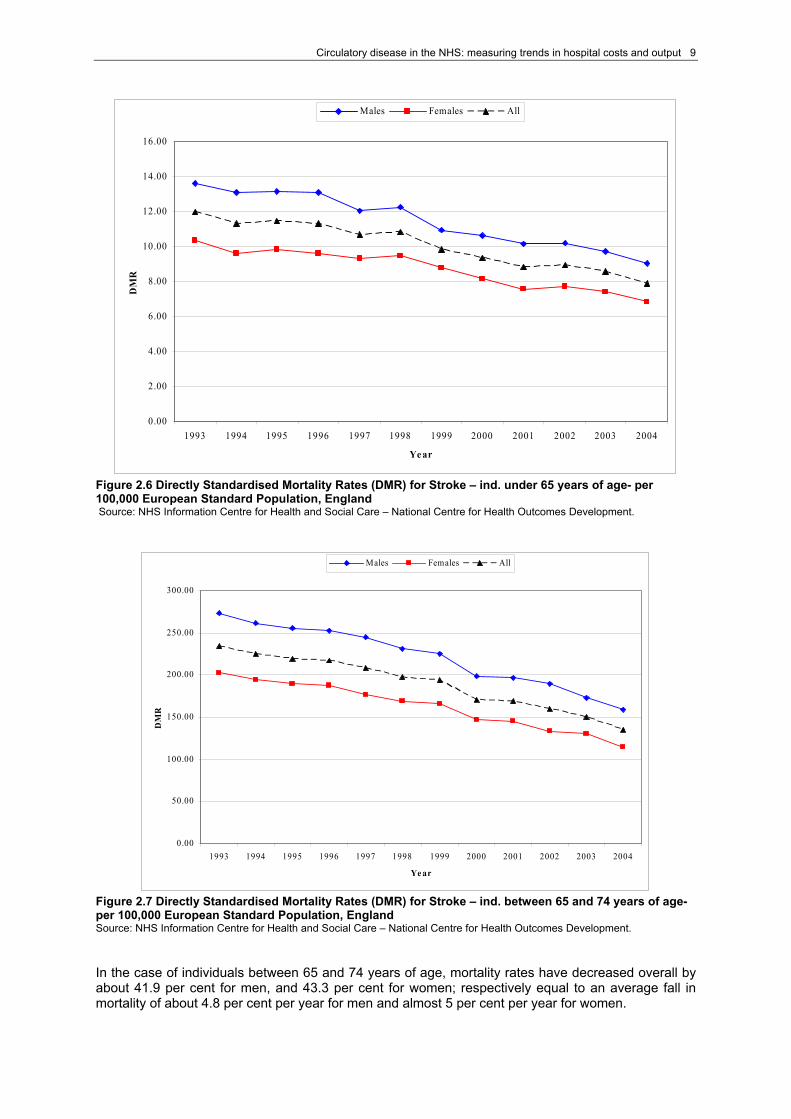
Figure 2.5 Directly Standardised Mortality Rates (DMR) for CHD – ind. between 65 and 74 years of age- per 100,000 European Standard Population, England Source: NHS Information Centre for Health and Social Care – National Centre for Health Outcomes Development. A recent study by Unal et al. (2005) looked at which factors have been more likely to contribute to the fall in CHD mortality. They observe that in England and Wales CHD mortality rates fell by 54 per cent during the period 1981 to 2000. Reports of studies conducted in US, Europe and New Zealand consistently suggest that 50-70 per cent of the decrease in cardiac deaths can be attributed to improvements in its major risk factors, such as smoking, cholesterol, and blood pressure. 25-50 per cent of the fall in CHD mortality is otherwise attributable to progress in modern technological treatments such a thrombolysis, aspirin, angiotensin converting enzyme inhibitors, statins, and coronary bypass surgery. Unal et al. investigate how much of the decline in CHD mortality observed in England and Wales is attributable to medical and surgical treatment and how much to changes in known risk factors. The results show that 58 per cent of CHD mortality decline in England and Wales is attributable to reductions in the major risk factors, and that the remaining 42 per cent is due to increased treatment to individuals, including secondary prevention. The last two trends that we present here are on (directly standardised) mortality rates associated with stroke (Figs. 2.6 and 2.7). As with the other conditions, we show trends only for individuals under 65 years of age and for individuals between 65 and 74 years of age, as these represent target indicators for England. The overall decrease in stroke mortality rates for individuals under 65 years of age has been less prominent than for other circulatory diseases. Overall, the female mortality rate has decreased by only 34 per cent, whereas the male mortality rate has decreased by about 33.7 per cent. The annual average fall in mortality for stroke is about 3.6 per cent per year, for both men and women. As in the previous disease, death from stroke is also less accentuated for women than it is for men.
Circulatory disease in the NHS: measuring trends in hospital costs and output 9
0.00
2.00
4.00
6.00
8.00
10.00
12.00
14.00
16.00
1993 1994 1995 1996 1997 1998 1999 2000 2001 2002 2003 2004
Ye ar
DM
R
Males Females All
Figure 2.6 Directly Standardised Mortality Rates (DMR) for Stroke – ind. under 65 years of age- per 100,000 European Standard Population, England Source: NHS Information Centre for Health and Social Care – National Centre for Health Outcomes Development.
0.00
50.00
100.00
150.00
200.00
250.00
300.00
1993 1994 1995 1996 1997 1998 1999 2000 2001 2002 2003 2004
Ye ar
DM
R
Males Females All
Figure 2.7 Directly Standardised Mortality Rates (DMR) for Stroke – ind. between 65 and 74 years of age- per 100,000 European Standard Population, England Source: NHS Information Centre for Health and Social Care – National Centre for Health Outcomes Development. In the case of individuals between 65 and 74 years of age, mortality rates have decreased overall by about 41.9 per cent for men, and 43.3 per cent for women; respectively equal to an average fall in mortality of about 4.8 per cent per year for men and almost 5 per cent per year for women.

10 CHE Research Paper 21
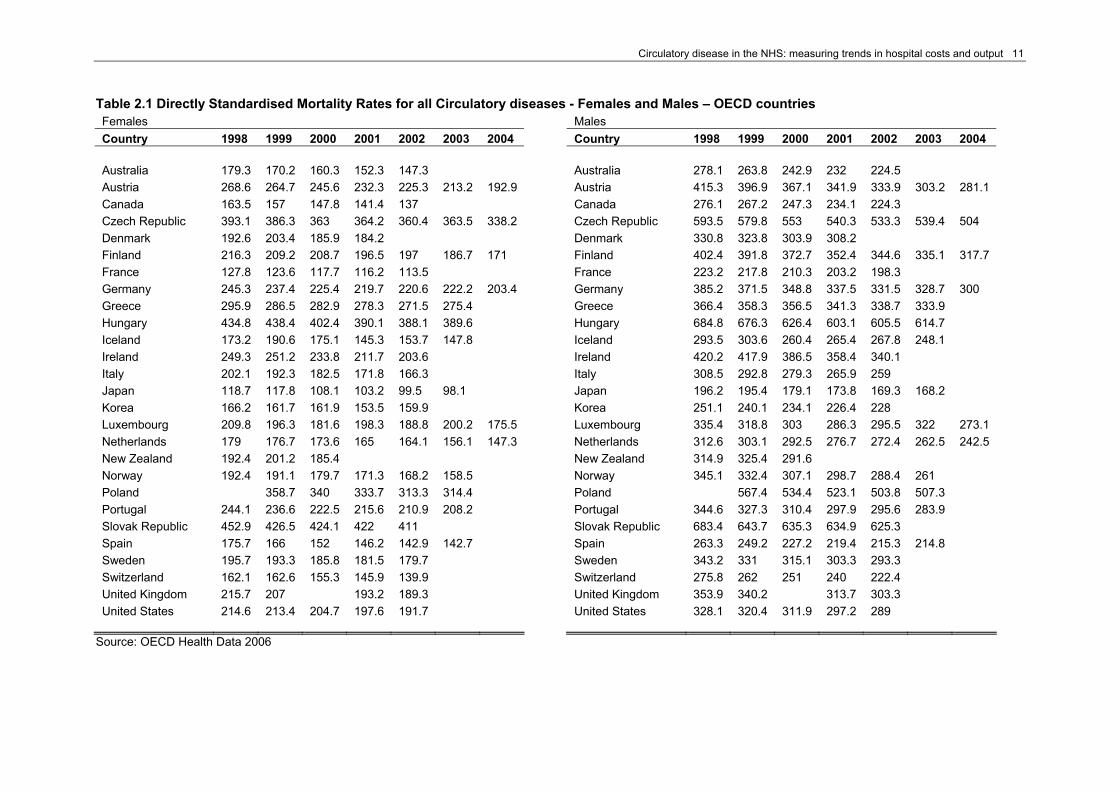
The Organisation for Economic Co-operation and Development (OECD) collates information on a series of a health and healthcare related data from its member countries, with the aim of producing internationally comparable data. The latest available database is OECD Health 2006. Data are collated on a variety of key health and healthcare areas, such as health status (mortality and morbidity); health care resources (e.g. employment); health care utilisation (e.g. in-patient utilisation); expenditure on health just to mention a few. Further details of areas covered and its availability can be obtained from www.oecd.org. Unfortunately, the OECD Health 2006 database does not provide information on the incidence in the population of conditions related to circulatory diseases. This kind of information would have allowed us to understand how widespread a condition is in a country, and whether and how its incidence varies over time. Changes in the incidence of, say, CHD, may well be associated with increased prevention activity, performed both at primary and secondary care level, as well as with improved life-style activities (exercise, reduction in smoking, etc) of the population. Our use of the OECD Health 2006 database is therefore limited to examining trends in mortality data rather than morbidity. This exercise helps us to set our analysis in an international context. In particular, we will present some international comparisons in trends for mortality rates for all circulatory diseases,1 and for the following conditions that fall under the circulatory disease definition: acute myocardial infarction (AMI), ischaemic heart diseases and cerebrovascular diseases. These trends are drawn for all OECD countries2 and for the time period 1998 to 2004.3 Table 2.1 shows directly standardised 4 mortality rates for all circulatory diseases in all OECD countries, separately for females and males. Firstly, figures show a continuous decrease in mortality rate over time for all countries. The country with the greatest decrease in mortality rate for both females and males in circulatory diseases is Austria. United Kingdom is placed in the bottom half of countries for both females and males in terms of decrease in mortality rates for all circulatory diseases. Table 2.2 shows directly standardised mortality rates for acute myocardial infarction (AMI) in all OECD countries, separately for females and males. A similar pattern to that for all circulatory diseases emerges here as well. Slovak Republic is now the country with the greatest decrease in its mortality rate for AMI, managing to more than halve the rate for females mortality rate and almost halve the one for males, in the time period 1998 to 2002. The United Kingdom has reduced its mortality rate by just over 27 per cent for females, and by just over 28 per cent for males. Denmark and Korea for females and Denmark, Luxembourg and Korea for males register an increase in mortality rates for AMI. In particular, for both females and males, mortality rates for AMI in Denmark have increased sharply from 1998 to 1999, followed by a decrease which they have not fully recovered yet; whereas it is continuous for Korea for both female and males mortality rates for AMI, except one year drop in both in 2001. As regards Luxembourg the increase in male mortality rate for AMI does not follow a particular pattern; and similarly for its female mortality rate.
1 The OECD terminology is ‘Diseases of the Circulatory System’. 2 Mortality data for Belgium, Mexico and Turkey are not available for our selected diseases. 3 Please note that data availability varies for each country. OECD time series are available as far back as the 1960s; however, most data are available for the 1980s and 1990s. Many series are available up to 2002, 2003 and some up to 2004. 4 Age-standardised death rates per 100,000 population are calculated by the OECD Secretariat, using the total OECD population for 1980 as the reference population. Please see Appendix 2 for a break down of the population’s age structure.
Circulatory disease in the NHS: measuring trends in hospital costs and output 11
Table 2.1 Directly Standardised Mortality Rates for all Circulatory diseases - Females and Males – OECD countries Females Males Country 1998 1999 2000 2001 2002 2003 2004 Country 1998 1999 2000 2001 2002 2003 2004 Australia 179.3 170.2 160.3 152.3 147.3 Australia 278.1 263.8 242.9 232 224.5 Austria 268.6 264.7 245.6 232.3 225.3 213.2 192.9 Austria 415.3 396.9 367.1 341.9 333.9 303.2 281.1 Canada 163.5 157 147.8 141.4 137 Canada 276.1 267.2 247.3 234.1 224.3 Czech Republic 393.1 386.3 363 364.2 360.4 363.5 338.2 Czech Republic 593.5 579.8 553 540.3 533.3 539.4 504 Denmark 192.6 203.4 185.9 184.2 Denmark 330.8 323.8 303.9 308.2 Finland 216.3 209.2 208.7 196.5 197 186.7 171 Finland 402.4 391.8 372.7 352.4 344.6 335.1 317.7 France 127.8 123.6 117.7 116.2 113.5 France 223.2 217.8 210.3 203.2 198.3 Germany 245.3 237.4 225.4 219.7 220.6 222.2 203.4 Germany 385.2 371.5 348.8 337.5 331.5 328.7 300 Greece 295.9 286.5 282.9 278.3 271.5 275.4 Greece 366.4 358.3 356.5 341.3 338.7 333.9 Hungary 434.8 438.4 402.4 390.1 388.1 389.6 Hungary 684.8 676.3 626.4 603.1 605.5 614.7 Iceland 173.2 190.6 175.1 145.3 153.7 147.8 Iceland 293.5 303.6 260.4 265.4 267.8 248.1 Ireland 249.3 251.2 233.8 211.7 203.6 Ireland 420.2 417.9 386.5 358.4 340.1 Italy 202.1 192.3 182.5 171.8 166.3 Italy 308.5 292.8 279.3 265.9 259 Japan 118.7 117.8 108.1 103.2 99.5 98.1 Japan 196.2 195.4 179.1 173.8 169.3 168.2 Korea 166.2 161.7 161.9 153.5 159.9 Korea 251.1 240.1 234.1 226.4 228 Luxembourg 209.8 196.3 181.6 198.3 188.8 200.2 175.5 Luxembourg 335.4 318.8 303 286.3 295.5 322 273.1 Netherlands 179 176.7 173.6 165 164.1 156.1 147.3 Netherlands 312.6 303.1 292.5 276.7 272.4 262.5 242.5 New Zealand 192.4 201.2 185.4 New Zealand 314.9 325.4 291.6 Norway 192.4 191.1 179.7 171.3 168.2 158.5 Norway 345.1 332.4 307.1 298.7 288.4 261 Poland 358.7 340 333.7 313.3 314.4 Poland 567.4 534.4 523.1 503.8 507.3 Portugal 244.1 236.6 222.5 215.6 210.9 208.2 Portugal 344.6 327.3 310.4 297.9 295.6 283.9 Slovak Republic 452.9 426.5 424.1 422 411 Slovak Republic 683.4 643.7 635.3 634.9 625.3 Spain 175.7 166 152 146.2 142.9 142.7 Spain 263.3 249.2 227.2 219.4 215.3 214.8 Sweden 195.7 193.3 185.8 181.5 179.7 Sweden 343.2 331 315.1 303.3 293.3 Switzerland 162.1 162.6 155.3 145.9 139.9 Switzerland 275.8 262 251 240 222.4 United Kingdom 215.7 207 193.2 189.3 United Kingdom 353.9 340.2 313.7 303.3 United States 214.6 213.4 204.7 197.6 191.7 United States 328.1 320.4 311.9 297.2 289
Source: OECD Health Data 2006

12 CHE Research Paper 21
Table 2.2 Directly Standardised Mortality Rates for AMI - Females and Males – OECD countries Females Males Country 1998 1999 2000 2001 2002 2003 2004 Country 1998 1999 2000 2001 2002 2003 2004 Australia 51.7 47.4 45 42.1 39.1 Australia 94.6 85.7 78.5 73.8 70 Austria 48.3 46.1 41.9 40.3 36.2 35.5 31.8 Austria 110.7 102.1 94.3 88.4 81.6 77.6 69.4 Canada 40.2 38.2 35.5 33 31.3 Canada 85.3 80.1 73.5 68.4 65.4 Czech Republic 61.6 63.1 58.7 55.6 51 46.7 40.3 Czech Republic 139.7 135.5 129.5 120.4 107.7 101.6 86.8 Denmark 33.9 41.3 35.8 38.7 Denmark 75.5 86.7 77.3 76.7 Finland 68.8 64.6 63.3 57.7 56.7 51.7 44.1 Finland 149.3 150.5 135.7 126.8 122.8 112 105.8 France 17.9 17 16.4 16.3 15.5 France 43.6 42.5 42 40.4 38.8 Germany 42.9 39.3 36.9 34.7 33.6 33.3 31.6 Germany 100.2 92.7 85.4 80.9 76.7 74.7 70.5 Greece 38.5 36.4 35.9 35 34.9 34.7 Greece 90.1 87 83.1 82.3 82.3 81.1 Hungary 66.6 62.1 56.9 55.5 52.2 50.3 Hungary 150.5 142.4 126.6 121.5 112.9 112.5 Iceland 38.8 42.6 38.5 29.9 36.1 35.7 Iceland 88 87.2 82.2 71.4 82 74 Ireland 78.8 75.5 67.6 61.2 58.6 Ireland 166.2 153.7 134.8 123.3 112.8 Italy 25.6 23.8 22.6 21.9 22.4 Italy 62.3 58 53.7 52.4 53.2 Japan 17.6 17.4 15.3 14.7 13.7 13.5 Japan 35.3 34.3 30.7 29.8 28.7 28 Korea 14.8 16.5 18.5 17.7 19 Korea 29.9 32.7 34 33.1 34.9 Luxembourg 21.6 21.7 20.2 18.9 19.3 25.1 20 Luxembourg 53.8 49.4 50.3 33.9 42.2 53.5 59.4 Netherlands 46.3 42.9 41.4 37.5 36.4 33.8 30.2 Netherlands 100.9 94.9 88.7 79.4 74 73.2 62 New Zealand 51.2 53.8 48.8 New Zealand 104.3 104.2 92.3 Norway 50.7 52.8 50.2 45.9 45.9 41.6 Norway 120.8 113.9 101.8 101.8 99.8 88.2 Poland 43.2 41.4 40 34.8 34.5 Poland 115.4 108.1 102.1 93.5 92.4 Portugal 31.7 30.5 28.9 28.5 28.6 30 Portugal 69.2 64.8 61.5 60.7 62.6 59.3 Slovak Republic 50.3 36.3 30.4 24.9 23.3 Slovak Republic 110.6 84.6 72.3 60.5 57.5 Spain 27.5 26 24.7 23.8 23.1 22.9 Spain 67.6 65.6 61.1 57.4 56.2 55.5 Sweden 51.4 48.5 46.5 45.1 43.6 Sweden 116.1 110.8 102.4 98.1 94.5 United Kingdom 55.7 51.1 41.9 40.5 United Kingdom 114.8 105.9 86.4 82.5 United States 43.6 42.2 39.9 37.3 35.3 United States 80.2 76.3 72.3 67.1 63.8
Source: OECD Health Data 2006

Circulatory disease in the NHS: measuring trends in hospital costs and output 13
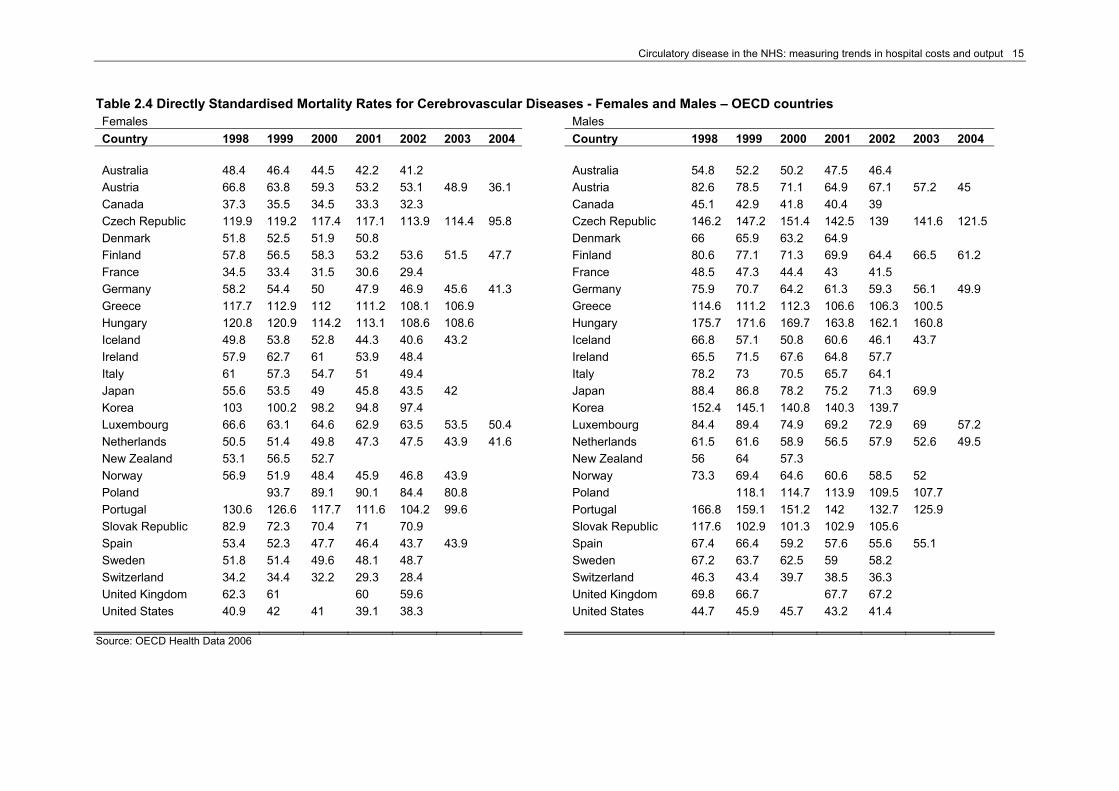
The following two tables show trends in the mortality rates for ischaemic heart diseases (Table 2.3) and cerebrovascular diseases (Table 2.4). Mortality rates for both ischaemic heart diseases and cerebrovascular diseases are uniformly lower for women than for men, in every country and for every year in the time series considered. In both cases, mortality rates have constantly been decreasing over the time period considered, for both men and women. The Netherlands is the country with the overall largest decrease in mortality rates for ischaemic heart diseases of about 34 per cent for women and of about 35 per cent for men. The United Kingdom is among the ten highest achievers in reducing mortality for ischaemic heart disease for both men and women. In the case of cerebrovascular diseases, Austria registers the overall largest decrease in mortality rates of 46 per cent for women and 45.5 per cent for men for the time period 1998 - 2004. The United Kingdom performs very poorly with only a 4.3 per cent decrease in mortality for women, and 3.7 per cent for men, making it to the third place from the bottom for both men and women.

14 CHE Research Paper 21
Table 2.3 Directly Standardised Mortality Rates for Ischaemic Heart Diseases - Females and Males – OECD countries Females Males Country 1998 1999 2000 2001 2002 2003 2004 Country 1998 1999 2000 2001 2002 2003 2004 Australia 167.6 158.3 143.8 136.8 129.8 Australia 167.6 158.3 143.8 136.8 129.8 Austria 197.4 188.1 174.5 162.4 166.8 154.1 144.5 Austria 197.4 188.1 174.5 162.4 166.8 154.1 144.5 Canada 163.6 158.4 151.7 142.6 134.8 Canada 163.6 158.4 151.7 142.6 134.8 Czech Republic 264.2 259.5 245.1 240.5 230.9 226.3 209.4 Czech Republic 264.2 259.5 245.1 240.5 230.9 226.3 209.4 Denmark 171.7 162.6 148 148.6 Denmark 171.7 162.6 148 148.6 Finland 257.1 254.7 244 227.2 223.9 211.4 201.3 Finland 257.1 254.7 244 227.2 223.9 211.4 201.3 France 74.9 72.7 72.1 68.6 66.3 France 74.9 72.7 72.1 68.6 66.3 Germany 190.2 182 169.7 163 158.6 154.8 142.9 Germany 190.2 182 169.7 163 158.6 154.8 142.9 Greece 114.2 117 115.9 115.9 113.5 118.4 Greece 114.2 117 115.9 115.9 113.5 118.4 Hungary 315.8 310.5 285.4 281.9 276.3 292.4 Hungary 315.8 310.5 285.4 281.9 276.3 292.4 Iceland 159.8 190.4 156.9 153.9 163.1 154.8 Iceland 159.8 190.4 156.9 153.9 163.1 154.8 Ireland 255.5 242 225.6 204.6 194.9 Ireland 255.5 242 225.6 204.6 194.9 Italy 114.2 107.4 101.4 97.5 97.7 Italy 114.2 107.4 101.4 97.5 97.7 Japan 51.3 50.9 46.6 45.6 44.8 44.4 Japan 51.3 50.9 46.6 45.6 44.8 44.4 Korea 35 38.6 43.1 42.9 47.3 Korea 35 38.6 43.1 42.9 47.3 Luxembourg 133.7 112.9 120.5 104.4 105.1 128.7 110 Luxembourg 133.7 112.9 120.5 104.4 105.1 128.7 110 Netherlands 138.1 130.5 121.4 113.3 105.5 102.2 89.6 Netherlands 138.1 130.5 121.4 113.3 105.5 102.2 89.6 New Zealand 201.4 204.8 178.1 New Zealand 201.4 204.8 178.1 Norway 184.6 174.9 158.6 154 148 132.9 Norway 184.6 174.9 158.6 154 148 132.9 Poland 200.2 189.3 181 171.9 170.4 Poland 200.2 189.3 181 171.9 170.4 Portugal 91.2 86.6 81.7 80.2 83.8 78.8 Portugal 91.2 86.6 81.7 80.2 83.8 78.8 Slovak Republic 341.8 336.7 352.3 348.5 341.3 Slovak Republic 341.8 336.7 352.3 348.5 341.3 Spain 99.2 97.3 91 87.4 85.4 85.3 Spain 99.2 97.3 91 87.4 85.4 85.3 Sweden 188.6 182.4 168.7 162.6 159.1 Sweden 188.6 182.4 168.7 162.6 159.1 Switzerland 138.6 127.7 122.9 113.5 106.2 Switzerland 138.6 127.7 122.9 113.5 106.2 United Kingdom 217 206.7 183.6 174.7 United Kingdom 217 206.7 183.6 174.7 United States 173.6 194.3 186.6 176.6 170.3 United States 173.6 194.3 186.6 176.6 170.3
Source: OECD Health Data 2006
Circulatory disease in the NHS: measuring trends in hospital costs and output 15
Table 2.4 Directly Standardised Mortality Rates for Cerebrovascular Diseases - Females and Males – OECD countries Females Males Country 1998 1999 2000 2001 2002 2003 2004 Country 1998 1999 2000 2001 2002 2003 2004 Australia 48.4 46.4 44.5 42.2 41.2 Australia 54.8 52.2 50.2 47.5 46.4 Austria 66.8 63.8 59.3 53.2 53.1 48.9 36.1 Austria 82.6 78.5 71.1 64.9 67.1 57.2 45 Canada 37.3 35.5 34.5 33.3 32.3 Canada 45.1 42.9 41.8 40.4 39 Czech Republic 119.9 119.2 117.4 117.1 113.9 114.4 95.8 Czech Republic 146.2 147.2 151.4 142.5 139 141.6 121.5 Denmark 51.8 52.5 51.9 50.8 Denmark 66 65.9 63.2 64.9 Finland 57.8 56.5 58.3 53.2 53.6 51.5 47.7 Finland 80.6 77.1 71.3 69.9 64.4 66.5 61.2 France 34.5 33.4 31.5 30.6 29.4 France 48.5 47.3 44.4 43 41.5 Germany 58.2 54.4 50 47.9 46.9 45.6 41.3 Germany 75.9 70.7 64.2 61.3 59.3 56.1 49.9 Greece 117.7 112.9 112 111.2 108.1 106.9 Greece 114.6 111.2 112.3 106.6 106.3 100.5 Hungary 120.8 120.9 114.2 113.1 108.6 108.6 Hungary 175.7 171.6 169.7 163.8 162.1 160.8 Iceland 49.8 53.8 52.8 44.3 40.6 43.2 Iceland 66.8 57.1 50.8 60.6 46.1 43.7 Ireland 57.9 62.7 61 53.9 48.4 Ireland 65.5 71.5 67.6 64.8 57.7 Italy 61 57.3 54.7 51 49.4 Italy 78.2 73 70.5 65.7 64.1 Japan 55.6 53.5 49 45.8 43.5 42 Japan 88.4 86.8 78.2 75.2 71.3 69.9 Korea 103 100.2 98.2 94.8 97.4 Korea 152.4 145.1 140.8 140.3 139.7 Luxembourg 66.6 63.1 64.6 62.9 63.5 53.5 50.4 Luxembourg 84.4 89.4 74.9 69.2 72.9 69 57.2 Netherlands 50.5 51.4 49.8 47.3 47.5 43.9 41.6 Netherlands 61.5 61.6 58.9 56.5 57.9 52.6 49.5 New Zealand 53.1 56.5 52.7 New Zealand 56 64 57.3 Norway 56.9 51.9 48.4 45.9 46.8 43.9 Norway 73.3 69.4 64.6 60.6 58.5 52 Poland 93.7 89.1 90.1 84.4 80.8 Poland 118.1 114.7 113.9 109.5 107.7 Portugal 130.6 126.6 117.7 111.6 104.2 99.6 Portugal 166.8 159.1 151.2 142 132.7 125.9 Slovak Republic 82.9 72.3 70.4 71 70.9 Slovak Republic 117.6 102.9 101.3 102.9 105.6 Spain 53.4 52.3 47.7 46.4 43.7 43.9 Spain 67.4 66.4 59.2 57.6 55.6 55.1 Sweden 51.8 51.4 49.6 48.1 48.7 Sweden 67.2 63.7 62.5 59 58.2 Switzerland 34.2 34.4 32.2 29.3 28.4 Switzerland 46.3 43.4 39.7 38.5 36.3 United Kingdom 62.3 61 60 59.6 United Kingdom 69.8 66.7 67.7 67.2 United States 40.9 42 41 39.1 38.3 United States 44.7 45.9 45.7 43.2 41.4
Source: OECD Health Data 2006

16 CHE Research Paper 21
3. Data sources for this study Our main sources of data for activity and costs are respectively the Hospital Episode Statistics (HES) database and the National Schedule of Reference Costs database (see Box 1 and 2 for further details). We present data on elective and day cases inpatient stays and non-elective (emergency) inpatients stays. The National Schedule of Reference Costs’ unit costs data for elective and day cases and non electives inpatient stays is organised and presented by Healthcare Resource Group (HRG) (see box 3). HRGs will, therefore, represent the base type of unit for our analysis for these two types of activity. Reference Costs data have been available since 1997/98. However, the quality of data collected as well as the number of NHS activities covered has increased over time. Box 1 – Hospital Episode Statistics (HES)
Hospital Episode Statistics (HES) is the national statistical data warehouse for England of the care provided by NHS hospitals and for NHS hospital patients treated elsewhere. […] The HES database is a record level database of hospital admissions and is currently populated by taking snapshots of a sub-set of the data submitted by NHS Trusts to the NHS-Wide Clearing Service (NWCS). […] A separate database table is held for each financial year containing approximately 11 million admitted patient records from all NHS Trusts in England. HES is the data source for a wide range of healthcare analysis for the NHS, Government and many other organisations and individuals. It contains admitted patient care data from 1989 onwards, with more than 12 million new records added each year, and outpatient attendance data from 2003 onwards, with more than 40 million new records added each year. HES information is stored as a large collection of separate records – one for each period of care – in a secure data warehouse. Each HES record contains a wide range of information about an individual patient admitted to an NHS hospital. For example:
Clinical information about diagnoses and operations Information about the patient, such as age group, gender and ethnic category Administrative information, such as time waited and date of admission Geographical information on where the patient was treated and the area in which they lived.
Source: www.hesonline.nhs.uk http://www.dh.gov.uk/PublicationsAndStatistics/Statistics/HospitalEpisodeStatistics/fs/en
Box 2 – National Schedule of Reference Costs The “[…] Reference Costs publication is the richest source of financial data on the NHS ever produced. Year on year the depth and breadth of information has improved and this year is no exception”. They provide a “basis for comparison between organisations, and data at the level of Healthcare Resource Group. Trusts and PCT Boards will want to understand any significant variations affecting their organisations and to take appropriate action”. “In particular, Reference Costs form the basis for calculating the national tariff for Payment by Results”. Reference costs data cover activity and cost at NHS Hospital Trust and Primary Care Trusts level. Data for so called Personal Medical Services and Pilots are also recorded. Source : National schedule of Reference Cost, March 2006 Page 2 of 8
Circulatory disease in the NHS: measuring trends in hospital costs and output 17
Our data set is based up to the year 2002-03 on the HRG Version 3. As from year 2003-04, the new version 3.5 of the HRG classification system has been introduced. Both series are based on ICD-10 (for diagnosis) and OPCS-4 (for procedures). ICD-10 stands for International Classification of Disease codes version 10 and are produced by the World Health Organisation (WHO). ICD-10 codes are used for the recording of disease and health related problems. It comprises of primary, subsidiary and secondary diagnosis that are usually listed in a patient episode of health care. These codes are used within the acute sector of the NHS and its use is mandatory across England. ICD-10 codes are also used by the Department of Health (DH) to construct HRGs; the latter in turn form the basis for the DH Payment by Result programme, as well as constituting the unit of measure for the National Schedule of Reference Costs. OPCS-4 stands for Office of Population Censuses and Surveys Tabular List of the Classification of Surgical Operations and Procedures, 4th revision. It is a statistical classification developed to translate and classify all surgical operations and procedures that are carried out on a patient during an episode of health care in the NHS acute sector. The classification consists of anatomically based chapters mostly related to the whole or part of a system of the body. OPCS-4 forms a part of the data flows for the national HES database as well as for Commissioning Data Sets. Box 3 – Healthcare Resource Groups (HRGs) “Healthcare Resource Groups are designed as grouping of treatment episodes, currently applicable to the Admitted Patient Care Minimum Dataset and so covering inpatients and day cases”. “[…..] HRGs are determined from diagnostic (ICD-10) and procedural (OPCS-4) codes that are intended to capture every detail of a clinical event by simple alpha-numeric symbols”. “The grouping process requires the use of the following variables from the Inpatient Minimum Dataset:
Primary and secondary procedures Primary, subsidiary and secondary diagnoses Age Sex Method of discharge (to indicate whether the patient was dead on discharge) Legal status (indicating whether patients admitted to a psychiatric facility are compulsorily
detained) Length of stay (duration of the Finished Consultant Episode).”
The grouper assigns (attempts to) an HRG to a patient record on the basis of the OPCS-4 procedure codes. In cases where more than one procedure is listed, it will assign an HRG on the basis of the procedure hierarchy. Only in the event that no procedure is indicated in the patient record or if the hierarchy value of the dominant group is 1, or if the procedure is classified as a minor procedure and length of stay is greater than 1, the grouper will look at the primary and subsequent diagnosis (ICD-10) codes to assign an HRG to the patient record. When grouping is based on diagnosis, the primary diagnosis is used to assign the HRG. Exceptions are specifically listed, e.g. Chemotherapy. In this case, HRGs may be assigned on the basis of the secondary diagnosis. For further detail see Source. Source: Version 3.5 Healthcare Resource Groups Documentation Set – Introduction and Definitions Manuals
Further, we present data for a variety of quality indicators. Leatherman and Sutherland (2005) summarise the key areas of quality in health care. These are effectiveness, access and timeliness, safety, patient-centredness and disparities, and capacity. The World Health Organisation programme for improving quality of health system (2005) makes a list of areas that they consider as quality, these are: safety, appropriateness, effectiveness, acceptability and equity. Dawson et al. (2005) identified characteristics of healthcare that they introduced as quality adjustors in their output growth measures.
18 CHE Research Paper 21
In practice there are a limited range of reliable quality measures available over the time period we investigate. We therefore look at the following dimensions as the main quality indicators. These indicators are the same as the one used in Dawson et al. (2005).
Survival rates: both in-hospital and 30 days; Health outcome (or effect on health); Waiting times (average); and Life expectancy.
Data on survival rates and waiting times are available in the HES database. They are linked to HRGs. In principle, health outcome refers to the value added to each individual’s health as a result of a contact with the health system. The main aim of a health system being to produce/improve individuals’ health, health outcomes seem the best measure to be used to quality adjust the output produced by the public healthcare system. However, there are some measurement difficulties involved as usually an individual’s health status in the absence of intervention is rarely observed and moreover it would be ethically wrong to deny care to some individuals when in need. Hence, as Dawson et al. (2005) point out it is on pre- and post-intervention’s measure that data ought to be collected by the NHS. This is not an easy task as different measures of health are currently available (EQ5D, SF36, etc), sometimes measuring different aspects of health (physical vs. mental health). It might well be the case that different diseases need different measures to capture pre- and post-operative health status of patients. Following the CHE/NIESR recommendation, the DH has initiated a pilot study carried out by the London School of Hygiene and Tropical Medicine (LSHTM) from August 2005 till the end of 2006. The procedures on which pre- and post-intervention health outcomes measures are collected are: cataract surgery; hip replacement; knee replacement; varicose vein procedures; and hernia repairs. The pilot makes use of several patient recorded outcome measures (PROMs) with the aim of identifying the PROM(s) that could be best used for the purpose of measuring health changes before and after intervention. The CHE/NIESR have also used measures of pre- and post-operative health measures for 29 HRGs. These came from a variety of sources.5 We will be using a sub-set of these ‘before and after’ measures of health in this report. Estimates of life expectancy are compiled from mortality data, while estimates of quality adjusted life expectancy are based on self-reported health states. The Government’s actuary website provides life expectancy figures for every year.
5 Please refer to Dawson et al. (2005) et Castelli et al. (Health Economics forthcoming).
Circulatory disease in the NHS: measuring trends in hospital costs and output 19
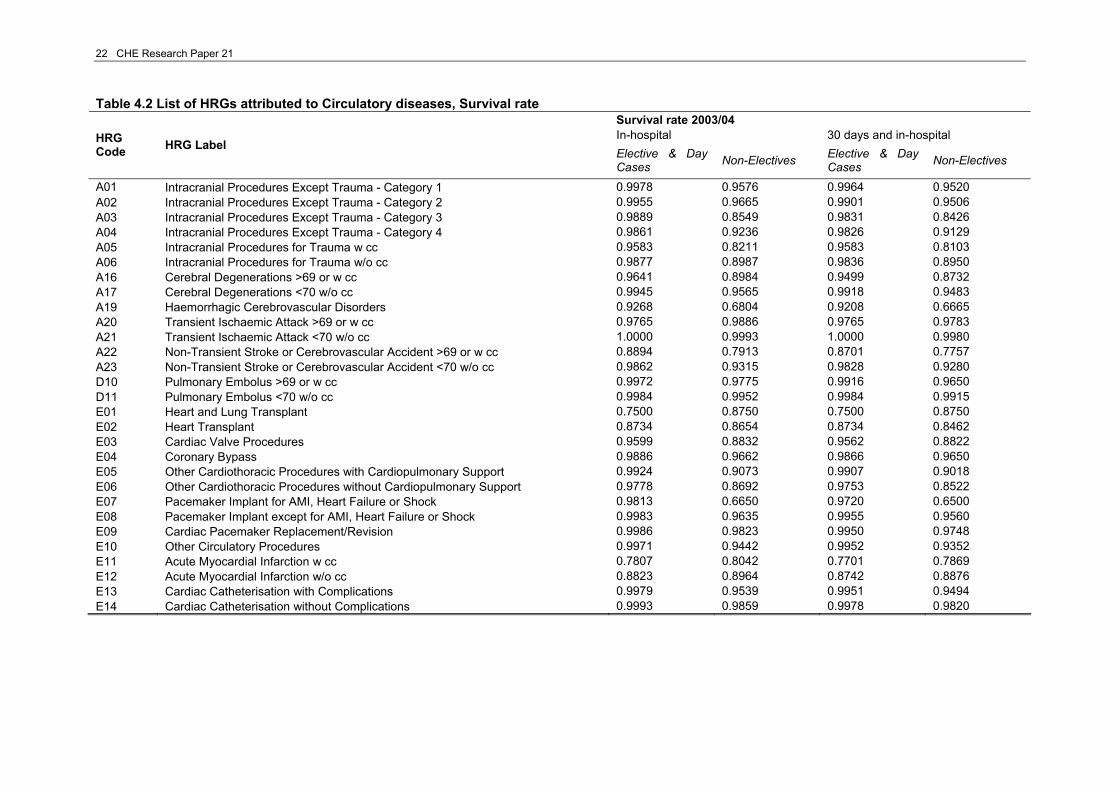
4. Data on circulatory diseases We identified a series of diagnoses and procedures that are commonly known to belong to the broad category of circulatory diseases based on the Department of Health programme budget area of “Circulation”. The Department of Health Programme Budgeting categorization presents three separate lists of diagnosis codes under ‘Circulation’ and which are: 1) Coronary Heart Disease (PB-10A), 2) Cerebrovascular Disease (PB-10B) and 3) Other Problems of Circulation (PB-10X). As activity and unit costs data are organised by HRG, the ICD codes attributed to the ‘Circulation’ Programme Budget needed to be mapped to the relevant HRGs. This was done by using the online HRG explorer. 6 The online HRG explorer maps primary diagnosis and procedures to up to 5 alternative base HRGs. The first HRG listed is the default HRG to which codes will be assigned if no exceptional factors are present on the patient record. The remaining HRGs, if listed, are given if an exceptional factor is present in the computerised patient record.7 The mapping procedure allowed us to produce a first list of HRGs, which we complemented with a further list of HRGs that we believe should fall under the broad definition of circulatory diseases. The total number of identified HRGs related to circulatory diseases is 57. All HRG codes and labels are presented in the following tables; the tables are complemented with volumes of activity and units costs (Table 4.1) and survival rates, both ‘in-hospital’ and ‘in-hospital and 30 days’, (Table 4.2), for the last year of the time series that we used in this report. 4.1 Data and methodology Outputs The main aim of the NHS is to improve patients’ health, which is achieved by providing goods and services to individuals in need of health care timely and efficiently. As Dawson et al. (2005) state in their report, the “produce” of the health care sector can be divided into activities, outputs and outcomes. The first refer to simple activities such as diagnostic tests and operative procedures; the second are the bundle of activities that are administered to patients in their journey with the NHS. Outcomes regard all the characteristics of health care services (improved health, cleanliness, waiting times, etc.) that patients value. Here we focus on activity only. Box 4 briefly summarises the four possible measures of hospital activity. Although activity data in the Reference Cost database are measured as finished consultant episodes, in this report we prefer to follow Dawson et al. (2005) and use as our unit of analysis continuous inpatient spells or CIPS for NHS care.
6 The online HRG explorer can be found at http://www.ic.nhs.uk/casemix/toolkit/sub/hrg_explorer. It allows one to identify the HRG definitions and codes associated with ICD-10 and OPCS4.2 codes or given an HRG code the underlying ICD-10 and OPCS4.2 codes. 7 The version 3.5 HRG Healthcare Resource Groups Documentation Set – Code to Group Tables (available to download at http://www.ic.nhs.uk/casemix/toolkit) presents a list of twenty-one superscripts that can be assigned to any HRG mapped to either ICD-10 codes or OPCS-4 codes.

20 CHE Research Paper 21
Table 4.1 – List of HRGs attributable to Circulatory Diseases, activity and unit costs for 2003/04 Activity 2003/04 Unit Costs 2003/04
HRG Code HRG Label
Elective & Day Cases Non-Electives Elective &
Day Cases Non-Electives
A01 Intracranial Procedures Except Trauma - Category 1 1386 542 2983 2592 A02 Intracranial Procedures Except Trauma - Category 2 3117 2327 3215 4659 A03 Intracranial Procedures Except Trauma - Category 3 2256 2533 4929 6331 A04 Intracranial Procedures Except Trauma - Category 4 2584 2064 7286 8494 A05 Intracranial Procedures for Trauma w cc 24 645 3695 6237 A06 Intracranial Procedures for Trauma w/o cc 244 2130 1805 4154 A16 Cerebral Degenerations >69 or w cc 3602 9664 2075 4166 A17 Cerebral Degenerations <70 w/o cc 5105 4526 1164 1687 A19 Haemorrhagic Cerebrovascular Disorders 672 16702 3470 2727 A20 Transient Ischaemic Attack >69 or w cc 213 13085 1896 1262 A21 Transient Ischaemic Attack <70 w/o cc 95 5442 807 725 A22 Non-Transient Stroke or Cerebrovascular Accident >69 or w cc 1351 48565 4354 3504 A23 Non-Transient Stroke or Cerebrovascular Accident <70 w/o cc 872 13965 2059 2286 D10 Pulmonary Embolus >69 or w cc 357 6657 1112 2008 D11 Pulmonary Embolus <70 w/o cc 636 6502 670 1430 E01 Heart and Lung Transplant 4 8 25472 27132 E02 Heart Transplant 79 52 12803 31198 E03 Cardiac Valve Procedures 6612 962 8530 10213 E04 Coronary Bypass 14991 2437 6359 7260 E05 Other Cardiothoracic Procedures with Cardiopulmonary Support 4856 914 3857 4991 E06 Other Cardiothoracic Procedures without Cardiopulmonary Support 812 765 4276 4970 E07 Pacemaker Implant for AMI, Heart Failure or Shock 214 733 4141 3810 E08 Pacemaker Implant except for AMI, Heart Failure or Shock 9566 7037 3594 4267 E09 Cardiac Pacemaker Replacement/Revision 5566 795 2702 3200 E10 Other Circulatory Procedures 5883 3001 925 2705 E11 Acute Myocardial Infarction w cc 187 15835 2829 2130 E12 Acute Myocardial Infarction w/o cc 367 61582 1985 1480 E13 Cardiac Catheterisation with Complications 1419 656 786 3226 E14 Cardiac Catheterisation without Complications 96093 15891 843 2886
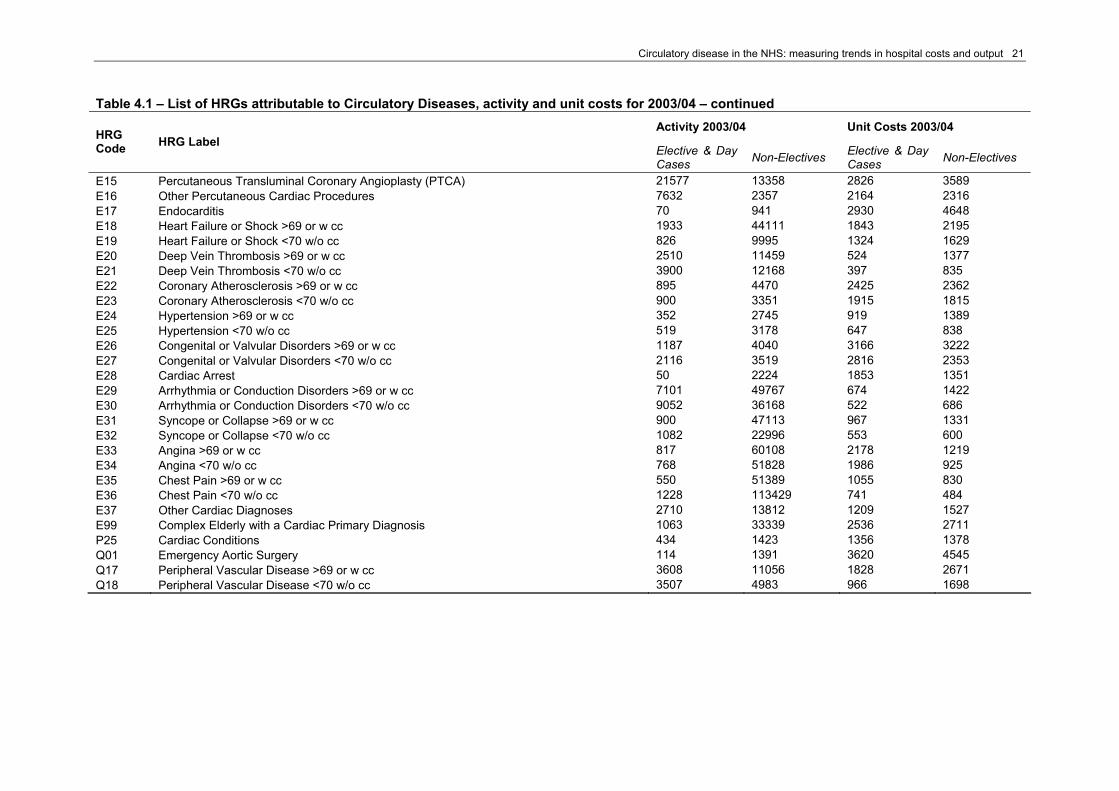
Circulatory disease in the NHS: measuring trends in hospital costs and output 21
Table 4.1 – List of HRGs attributable to Circulatory Diseases, activity and unit costs for 2003/04 – continued Activity 2003/04 Unit Costs 2003/04 HRG
Code HRG Label Elective & Day Cases Non-Electives Elective & Day
Cases Non-Electives
E15 Percutaneous Transluminal Coronary Angioplasty (PTCA) 21577 13358 2826 3589 E16 Other Percutaneous Cardiac Procedures 7632 2357 2164 2316 E17 Endocarditis 70 941 2930 4648 E18 Heart Failure or Shock >69 or w cc 1933 44111 1843 2195 E19 Heart Failure or Shock <70 w/o cc 826 9995 1324 1629 E20 Deep Vein Thrombosis >69 or w cc 2510 11459 524 1377 E21 Deep Vein Thrombosis <70 w/o cc 3900 12168 397 835 E22 Coronary Atherosclerosis >69 or w cc 895 4470 2425 2362 E23 Coronary Atherosclerosis <70 w/o cc 900 3351 1915 1815 E24 Hypertension >69 or w cc 352 2745 919 1389 E25 Hypertension <70 w/o cc 519 3178 647 838 E26 Congenital or Valvular Disorders >69 or w cc 1187 4040 3166 3222 E27 Congenital or Valvular Disorders <70 w/o cc 2116 3519 2816 2353 E28 Cardiac Arrest 50 2224 1853 1351 E29 Arrhythmia or Conduction Disorders >69 or w cc 7101 49767 674 1422 E30 Arrhythmia or Conduction Disorders <70 w/o cc 9052 36168 522 686 E31 Syncope or Collapse >69 or w cc 900 47113 967 1331 E32 Syncope or Collapse <70 w/o cc 1082 22996 553 600 E33 Angina >69 or w cc 817 60108 2178 1219 E34 Angina <70 w/o cc 768 51828 1986 925 E35 Chest Pain >69 or w cc 550 51389 1055 830 E36 Chest Pain <70 w/o cc 1228 113429 741 484 E37 Other Cardiac Diagnoses 2710 13812 1209 1527 E99 Complex Elderly with a Cardiac Primary Diagnosis 1063 33339 2536 2711 P25 Cardiac Conditions 434 1423 1356 1378 Q01 Emergency Aortic Surgery 114 1391 3620 4545 Q17 Peripheral Vascular Disease >69 or w cc 3608 11056 1828 2671 Q18 Peripheral Vascular Disease <70 w/o cc 3507 4983 966 1698
22 CHE Research Paper 21
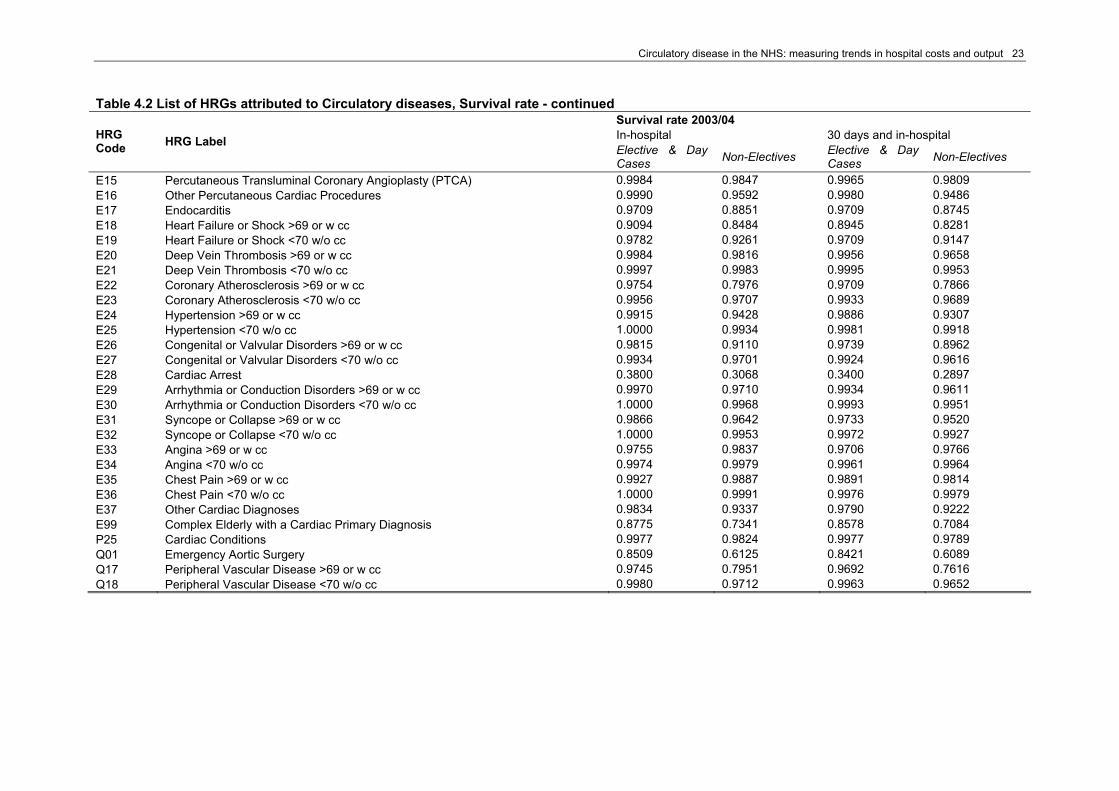
Table 4.2 List of HRGs attributed to Circulatory diseases, Survival rate Survival rate 2003/04 In-hospital 30 days and in-hospital HRG
Code HRG Label Elective & Day Cases Non-Electives Elective & Day
Cases Non-Electives
A01 Intracranial Procedures Except Trauma - Category 1 0.9978 0.9576 0.9964 0.9520 A02 Intracranial Procedures Except Trauma - Category 2 0.9955 0.9665 0.9901 0.9506 A03 Intracranial Procedures Except Trauma - Category 3 0.9889 0.8549 0.9831 0.8426 A04 Intracranial Procedures Except Trauma - Category 4 0.9861 0.9236 0.9826 0.9129 A05 Intracranial Procedures for Trauma w cc 0.9583 0.8211 0.9583 0.8103 A06 Intracranial Procedures for Trauma w/o cc 0.9877 0.8987 0.9836 0.8950 A16 Cerebral Degenerations >69 or w cc 0.9641 0.8984 0.9499 0.8732 A17 Cerebral Degenerations <70 w/o cc 0.9945 0.9565 0.9918 0.9483 A19 Haemorrhagic Cerebrovascular Disorders 0.9268 0.6804 0.9208 0.6665 A20 Transient Ischaemic Attack >69 or w cc 0.9765 0.9886 0.9765 0.9783 A21 Transient Ischaemic Attack <70 w/o cc 1.0000 0.9993 1.0000 0.9980 A22 Non-Transient Stroke or Cerebrovascular Accident >69 or w cc 0.8894 0.7913 0.8701 0.7757 A23 Non-Transient Stroke or Cerebrovascular Accident <70 w/o cc 0.9862 0.9315 0.9828 0.9280 D10 Pulmonary Embolus >69 or w cc 0.9972 0.9775 0.9916 0.9650 D11 Pulmonary Embolus <70 w/o cc 0.9984 0.9952 0.9984 0.9915 E01 Heart and Lung Transplant 0.7500 0.8750 0.7500 0.8750 E02 Heart Transplant 0.8734 0.8654 0.8734 0.8462 E03 Cardiac Valve Procedures 0.9599 0.8832 0.9562 0.8822 E04 Coronary Bypass 0.9886 0.9662 0.9866 0.9650 E05 Other Cardiothoracic Procedures with Cardiopulmonary Support 0.9924 0.9073 0.9907 0.9018 E06 Other Cardiothoracic Procedures without Cardiopulmonary Support 0.9778 0.8692 0.9753 0.8522 E07 Pacemaker Implant for AMI, Heart Failure or Shock 0.9813 0.6650 0.9720 0.6500 E08 Pacemaker Implant except for AMI, Heart Failure or Shock 0.9983 0.9635 0.9955 0.9560 E09 Cardiac Pacemaker Replacement/Revision 0.9986 0.9823 0.9950 0.9748 E10 Other Circulatory Procedures 0.9971 0.9442 0.9952 0.9352 E11 Acute Myocardial Infarction w cc 0.7807 0.8042 0.7701 0.7869 E12 Acute Myocardial Infarction w/o cc 0.8823 0.8964 0.8742 0.8876 E13 Cardiac Catheterisation with Complications 0.9979 0.9539 0.9951 0.9494 E14 Cardiac Catheterisation without Complications 0.9993 0.9859 0.9978 0.9820
Circulatory disease in the NHS: measuring trends in hospital costs and output 23
Table 4.2 List of HRGs attributed to Circulatory diseases, Survival rate - continued Survival rate 2003/04 In-hospital 30 days and in-hospital HRG
Code HRG Label Elective & Day Cases Non-Electives Elective & Day
Cases Non-Electives
E15 Percutaneous Transluminal Coronary Angioplasty (PTCA) 0.9984 0.9847 0.9965 0.9809 E16 Other Percutaneous Cardiac Procedures 0.9990 0.9592 0.9980 0.9486 E17 Endocarditis 0.9709 0.8851 0.9709 0.8745 E18 Heart Failure or Shock >69 or w cc 0.9094 0.8484 0.8945 0.8281 E19 Heart Failure or Shock <70 w/o cc 0.9782 0.9261 0.9709 0.9147 E20 Deep Vein Thrombosis >69 or w cc 0.9984 0.9816 0.9956 0.9658 E21 Deep Vein Thrombosis <70 w/o cc 0.9997 0.9983 0.9995 0.9953 E22 Coronary Atherosclerosis >69 or w cc 0.9754 0.7976 0.9709 0.7866 E23 Coronary Atherosclerosis <70 w/o cc 0.9956 0.9707 0.9933 0.9689 E24 Hypertension >69 or w cc 0.9915 0.9428 0.9886 0.9307 E25 Hypertension <70 w/o cc 1.0000 0.9934 0.9981 0.9918 E26 Congenital or Valvular Disorders >69 or w cc 0.9815 0.9110 0.9739 0.8962 E27 Congenital or Valvular Disorders <70 w/o cc 0.9934 0.9701 0.9924 0.9616 E28 Cardiac Arrest 0.3800 0.3068 0.3400 0.2897 E29 Arrhythmia or Conduction Disorders >69 or w cc 0.9970 0.9710 0.9934 0.9611 E30 Arrhythmia or Conduction Disorders <70 w/o cc 1.0000 0.9968 0.9993 0.9951 E31 Syncope or Collapse >69 or w cc 0.9866 0.9642 0.9733 0.9520 E32 Syncope or Collapse <70 w/o cc 1.0000 0.9953 0.9972 0.9927 E33 Angina >69 or w cc 0.9755 0.9837 0.9706 0.9766 E34 Angina <70 w/o cc 0.9974 0.9979 0.9961 0.9964 E35 Chest Pain >69 or w cc 0.9927 0.9887 0.9891 0.9814 E36 Chest Pain <70 w/o cc 1.0000 0.9991 0.9976 0.9979 E37 Other Cardiac Diagnoses 0.9834 0.9337 0.9790 0.9222 E99 Complex Elderly with a Cardiac Primary Diagnosis 0.8775 0.7341 0.8578 0.7084 P25 Cardiac Conditions 0.9977 0.9824 0.9977 0.9789 Q01 Emergency Aortic Surgery 0.8509 0.6125 0.8421 0.6089 Q17 Peripheral Vascular Disease >69 or w cc 0.9745 0.7951 0.9692 0.7616 Q18 Peripheral Vascular Disease <70 w/o cc 0.9980 0.9712 0.9963 0.9652
24 CHE Research Paper 21
Box 4 – Hospital Activity Consultant episodes. The basic unit in HES is the consultant episode. Each observation records the treatments provided to a patient whilst they are under the care of a particular consultant. HES contains episodes which are unfinished at the start and end of each HES year Finished consultant episodes (FCEs). A count of episodes means that an episode which spans two HES years would be counted in each year. FCEs are episodes which have finished by the end of the HES year, though they may have begun before the start of the HES year. The DH’s new Output Index use finished consultant episodes (FCEs) since unit costs are derived from the Reference Costs data and these are defined for FCEs. Provider spells (PS). Around 8% of patients have more than one FCE during a spell in a hospital. It is possible to link episodes in the same spell to count provider spells. Continuous inpatient spells (CIPS). Some patients (around 1%) are transferred to another provider at the end of an episode and it is possible to link episodes across providers to yield continuous inpatient spells. Source: Dawson et al. (2005).
The reason why we want to move from episodes to CIPS is that the latter more clearly correspond to the journey that patient undergo when meeting the NHS. Disease-based or patient-based output measures for the healthcare sector are considered by many informed commentators (Atkinson, Cutler) as the best way forward in improving the measurement of the health system output and productivity. Although current routine administrative data systems do not directly track patients, and hence the resources used up by them in their journey across NHS settings, CIPS are thought to capture ‘…most comprehensively the full package of inpatient care and they are less vulnerable to being miscounted if transfers among provides vary over time or if they are changes in how ‘being under the care of a consultant’ is defined (Dawson et al.,2005). HES data allow us to construct CIPS. In particular, ‘a HES record is generated for each episode of admitted patient care under a particular consultant within a single hospital provider; admitted patient care includes day surgery. The unit of analysis employed by HES is the finished consultant episode (FCE). Over 90% of all episodes involve a patient remaining under the care of the same consultant for the duration of their stay in hospital. In the other cases, however, the patient is discharged from the care of one consultant, but remains in hospital, and moves to the care of another consultant. This move, from the care of one consultant to another, terminates one HES episode and triggers the start of another. By grouping together all those episodes associated with a stay at a given provider (hospital) one identifies continuous inpatient provider spells of care’ (Dawson et al., 2005). It is also possible that patients may be transferred from one hospital (where the patient was firstly admitted) to another because, for example, the current condition of the patient admitted requires specialist equipment, which is available only in a highly specialised hospital. These two contacts would be captured as two distinct HES episodes, whereas they should be counted as one contact only. Hence, it is vital to track and link together these inter-hospital transfers, so rather than use episodes or provider spells as the unit of analysis, Dawson et al. (2005) suggest and employ a third unit of analysis: continuous inpatient spells of NHS care. These are defined as continuous periods of care received by a patient anywhere within the NHS. Dawson et al. (2005) acknowledge the fact that an NHS spell might consist of a number of episodes for a single patient, especially if transferred from one hospital to another or from one consultant to another within the same setting. The HES database will, hence, have more than one record for such patients. Although records within the HES database are not currently linked, it is possible to use other available information, that is admission details and patient identifier, to link continuous periods of treatment to form the so-called continuous inpatient spells of NHS care. For a full account on how to identify CIPS, we refer to Dawson et al. (2005). Inputs Inputs in the NHS constitute the resources used in the production of NHS activities and outputs. Together these contribute to the production of health outcomes.

Circulatory disease in the NHS: measuring trends in hospital costs and output 25
Inputs can be disaggregated into three different categories: labour, intermediate consumption (also called procurement) and capital consumption. Each of them contributes differently to the production of health care. Labour refers to all staff employed by the NHS, such as medical staff and nursing staff. Intermediate consumption or procurement regards the purchase of goods and services that are used up in the production of health care services, e.g. drugs, electricity. The NHS also purchases capital assets that can be used repeatedly or continuously over a longer period of time. Examples of capital assets are (hospital) buildings, machinery and vehicles. These differ from intermediate goods and services in that they last over a number of years, whilst the latter are used up in the production process in a given year. The amount of capital assets that is used up by the NHS in any given year is called capital consumption. Although data on inputs are available for the whole national health system, it proved impossible to use these data for the purpose of our analysis. Ideally, we would like to be able to apportion total volumes and expenditure on labour, intermediate consumption and capital consumption to each single diagnosis/procedure that falls under the category of ‘Circulatory Diseases’ or failing this to be able to produce a total figure for all circulatory diseases. This is not currently remotely feasible, and we are therefore left to use unit costs as produced in the National Schedule of Reference Costs to populate the input side. Unit costs produced by the DH are attached to finished consultants episodes in the Reference Cost database. Our unit of analysis for hospital activities is, however, continuous inpatient spells, which usually comprise a number of episodes. It is, therefore, necessary to calculate a series of unit costs to attach to CIPS for all available years. These calculations were performed by CHE/NIESR for their project on developing new measures for NHS output and productivity and we shall substantially refer to this work hereafter. See Box 5 for a full account on how to calculate unit costs for CIPS.

26 CHE Research Paper 21
Box 5 Unit costs of spells There are a number of ways of calculating a cost for each spell and for labelling spell types. (a) Define the spell type by the set of FCEs it contains and to simplify ignore the order of FCEs in the spell. The unit cost of a spell type is the sum of the unit costs of the HRGs of its constituent FCEs. The advantage of this approach is that output types are homogenous: each contains spells with the same set of FCEs. The disadvantage is that the number of different types of spell is potentially very large. Even if spells consist of at most two FCEs there are ½ n(n+1) types of spell if there are n types of FCE. There are over 500 elective HRGs and the same number of non-electives. Restricting attention to 2002/3 spells whose first episode was elective we found over 17,000 different types of spell. Thus calculation of the indices is cumbersome because of the great increase in the number of outputs. The procedure satisfies adding up: total costs calculated as numbers of spells of each type times their unit costs will equal total cost calculated as numbers of FCEs of each type times their Reference Cost unit costs. Thus a pure cost weighted activity index with activity measured by spells defined in this way would be very nearly equal to the pure CWAI with activity based on FCEs.2 Similarly average waits and mortality also satisfy adding up. (b) Assign each spell to a type by using the HRG of its first episode and use the cost of the HRG of the first FCE in the spell as the unit cost of the spell. Thus the spells in an HRG category may contain disparate types of spell (defined by the set of HRGs of their constituent FCEs) but all will have the same first FCE type). This will underestimate the cost of multi-FCE spells. Multiplying the number of spells by the unit costs of their first FCEs will yield a total cost which is less than actual total cost (which is the number of FCEs of different types times their unit costs). Thus the average cost for each output type is not the “true” unit cost i.e. the total cost of all spells assigned to the type divided by the number of spells. (c) Define the spell type by the HRG type of the first episode. Calculate the unit cost of the HRG as the total cost of all spells assigned to it divided by the number of spells assigned. The cost of a spell is calculated as the sum of the unit costs of the FCEs it contains. Like (a) this satisfies adding up for costs, waits and deaths. It requires more HES processing than (b) but less than (a) since the number of output types would be smaller. Since it produces the same number of output types as (b) the subsequent calculation of the indices is simpler than (a). …. Using CIPS with version (c) would give us a unit of output which was not homogenous in that different cases in each output group (by HRG of first FCE) may have different combinations of second, third etc. FCEs. But any output categorisation will have heterogeneous cases since different individuals wait different lengths of time for the same type of output. Using (c) involves averaging over waiting times, costs and mortalities but it does give an accurate answer to a meaningful question: what is the average cost, wait or mortality of a person whose first FCE was of this type. We therefore base our calculation of indices with CIPS activity measures on method (c). Source: Dawson et al. (2005) 2 There would be a slight difference because some spells which have a first FCE finishing in year t and a second FCE finishing in year t+1 would be assigned to year t+1, whereas the constituent FCEs would be assigned to different years with a FCE based index.
Circulatory disease in the NHS: measuring trends in hospital costs and output 27
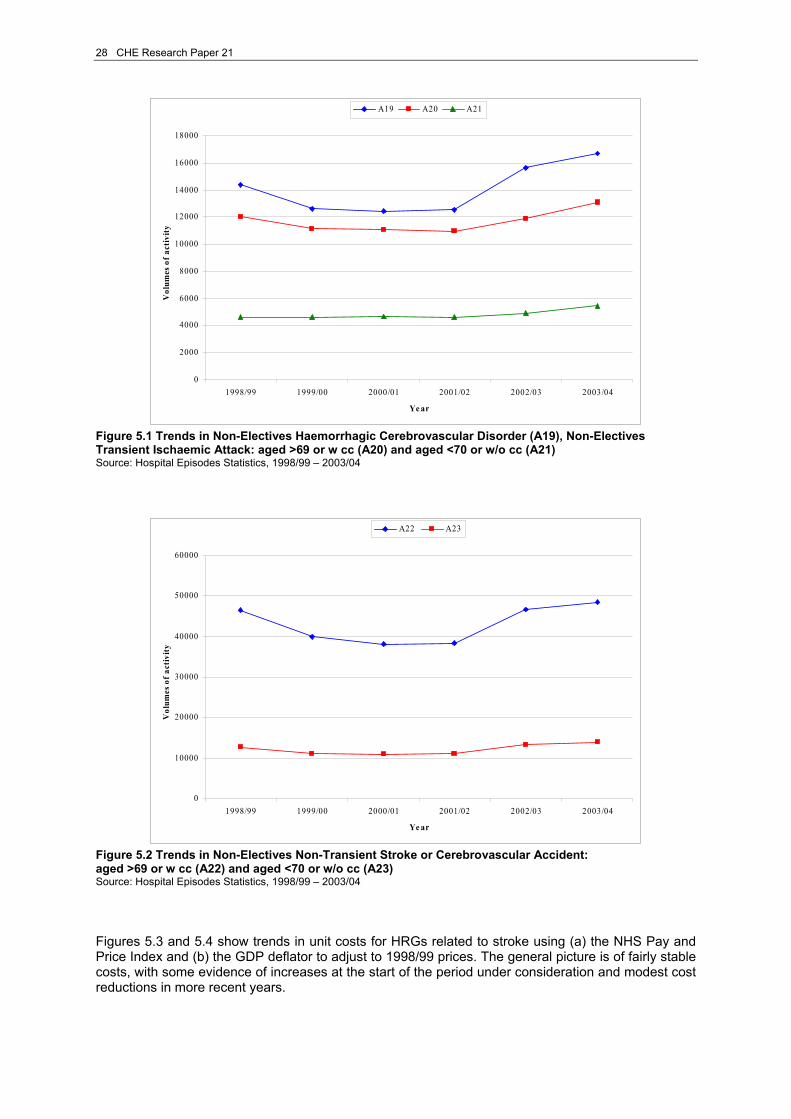
5. Trends in activity, unit costs and survival rates for selected treatments This section presents some broad trends in volume of activity (CIPS), unit costs and a quality adjustor for a selected numbers of HRGs. We choose two simple criteria8 to include HRGs in our selection: 1. they form a coherent set of diagnosis and/or form related types of procedures; and/or 2. they represent high volumes of activity. It should be emphasised that, although we only present a subsection of treatments in this section, our subsequent analytic work aggregates all HRGs related to circulatory disease. The first set of HRGs illustrated are some of the major treatments related to stroke, and comprise HRGs A19, A20 and A21, A22 and A23. A full list of HRGs associated with stroke is available at http://hcna.radcliffe-oxford.com/stroke.htm. The second set of HRGs are related to coronary heart disease, in the form of heart surgery (E04 and E15); acute myocardial infarction (AMI) (E11 and E12); cardiac catheterisation (E14); and chronic (congestive) heart failure (E18 and E19). All of the mentioned diagnosis and procedures fall under the broad category ‘coronary heart diseases or CHD’. The remaining HRGs identify symptoms of heart conditions9 that represent a high proportion of total volumes of NHS activity for circulatory diseases in 2003/04. Throughout this section, unit costs have been deflated in order to present meaningful and comparable trends. Two different deflators were used: 1) the NHS pay and prices index, which reflects trends in input prices (most especially pay and pharmaceuticals) that are specific to the NHS; and 2) the GDP deflator, which reflects general price movements in the economy (see Appendix 2 for details). Over the period considered, NHS pay and prices show higher inflation than the general economy, so the deflation always suggests higher expenditure growth using the GDP deflator. As an indication of outcomes, trends in ‘in-hospital and 30 days’ survival rates are presented. 5.1 Stroke The World Health Organisation defines stroke as ‘a focal (or at times global) neurological impairment of sudden onset, and lasting more than 24 hours (or leading to death), and of presumed vascular origin’.10 Three major sub-categories are identifiable and they are: ischaemic stroke, intracerebral haemorrhage and subarachnoid haemorrhage. We present only a handful of high volume HRGs that are assigned to the diagnosis ‘stroke’. Figures 5.1 and 5.2 show trends in volumes of output for non-elective inpatient stays. It appears that as from 2002/03, an increasing number of patients was admitted to hospital suffering from a condition related to stroke. The increase has been larger for patients either older than 69 years of age or with complications (w cc). Non-transient stroke or cerebrovascular accidents (A22) for individual of over 70 years of age is the largest in terms of activity among the HRGs presented for stroke.
8 Selection criteria were applied to activity data for 2003/04. 9 Please note that the label ‘symptoms of heart conditions’ is not a medical definition. It was chosen by the authors as a means of grouping the mentioned HRGs. 10 The WHO STEPwise approach to stroke surveillance – Manual (2006).
28 CHE Research Paper 21
0
2000
4000
6000
8000
10000
12000
14000
16000
18000
1998/99 1999/00 2000/01 2001/02 2002/03 2003/04
Ye ar
Vol
umes
of a
ctiv
ity
A19 A20 A21
Figure 5.1 Trends in Non-Electives Haemorrhagic Cerebrovascular Disorder (A19), Non-Electives Transient Ischaemic Attack: aged >69 or w cc (A20) and aged <70 or w/o cc (A21) Source: Hospital Episodes Statistics, 1998/99 – 2003/04
0
10000
20000
30000
40000
50000
60000
1998/99 1999/00 2000/01 2001/02 2002/03 2003/04
Ye ar
Vol
umes
of a
ctiv
ity
A22 A23
Figure 5.2 Trends in Non-Electives Non-Transient Stroke or Cerebrovascular Accident: aged >69 or w cc (A22) and aged <70 or w/o cc (A23) Source: Hospital Episodes Statistics, 1998/99 – 2003/04 Figures 5.3 and 5.4 show trends in unit costs for HRGs related to stroke using (a) the NHS Pay and Price Index and (b) the GDP deflator to adjust to 1998/99 prices. The general picture is of fairly stable costs, with some evidence of increases at the start of the period under consideration and modest cost reductions in more recent years.
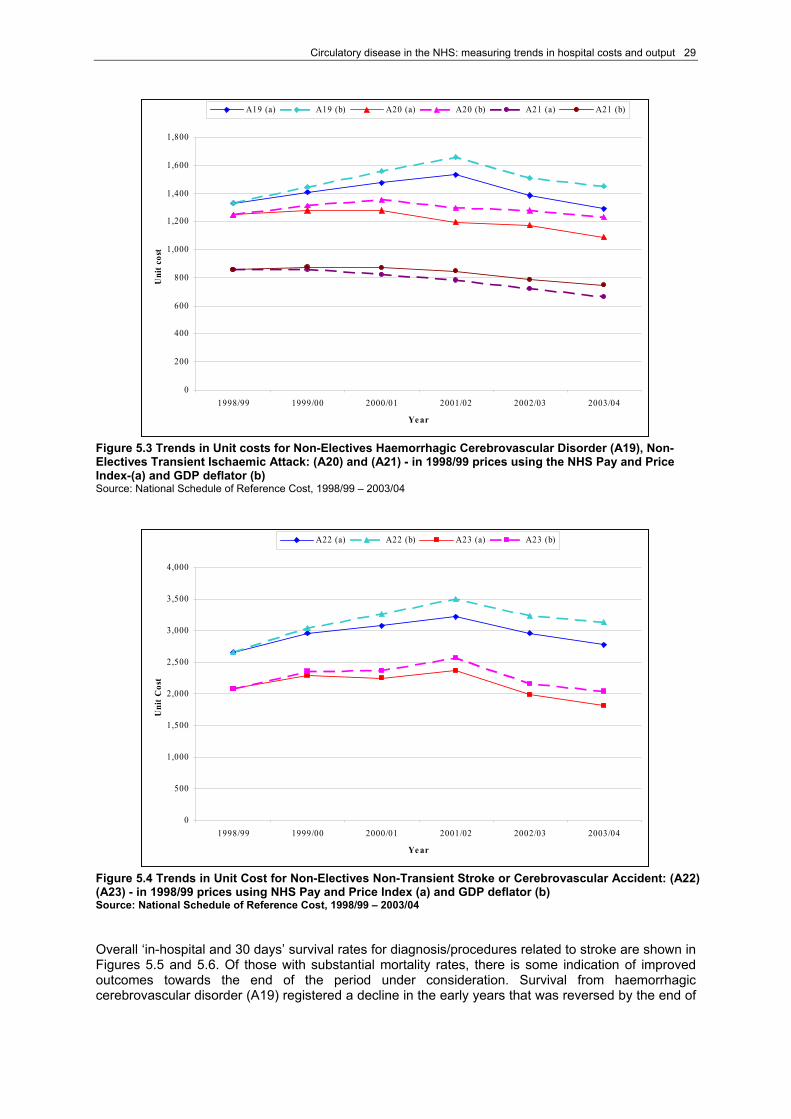
Circulatory disease in the NHS: measuring trends in hospital costs and output 29
0
200
400
600
800
1,000
1,200
1,400
1,600
1,800
1998/99 1999/00 2000/01 2001/02 2002/03 2003/04
Ye ar
Uni
t cos
t
A19 (a) A19 (b) A20 (a) A20 (b) A21 (a) A21 (b)
Figure 5.3 Trends in Unit costs for Non-Electives Haemorrhagic Cerebrovascular Disorder (A19), Non-Electives Transient Ischaemic Attack: (A20) and (A21) - in 1998/99 prices using the NHS Pay and Price Index-(a) and GDP deflator (b) Source: National Schedule of Reference Cost, 1998/99 – 2003/04
0
500
1,000
1,500
2,000
2,500
3,000
3,500
4,000
1998/99 1999/00 2000/01 2001/02 2002/03 2003/04
Ye ar
Uni
t Cos
t
A22 (a) A22 (b) A23 (a) A23 (b)
Figure 5.4 Trends in Unit Cost for Non-Electives Non-Transient Stroke or Cerebrovascular Accident: (A22) (A23) - in 1998/99 prices using NHS Pay and Price Index (a) and GDP deflator (b) Source: National Schedule of Reference Cost, 1998/99 – 2003/04 Overall ‘in-hospital and 30 days’ survival rates for diagnosis/procedures related to stroke are shown in Figures 5.5 and 5.6. Of those with substantial mortality rates, there is some indication of improved outcomes towards the end of the period under consideration. Survival from haemorrhagic cerebrovascular disorder (A19) registered a decline in the early years that was reversed by the end of
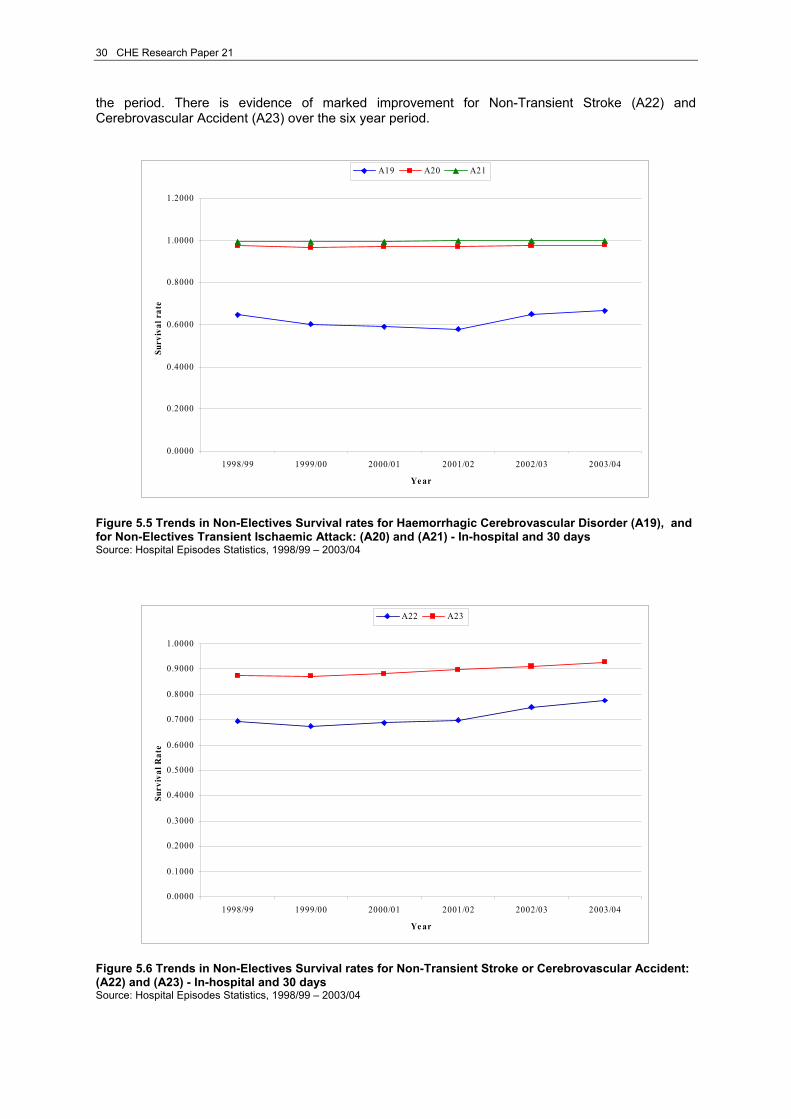
30 CHE Research Paper 21
the period. There is evidence of marked improvement for Non-Transient Stroke (A22) and Cerebrovascular Accident (A23) over the six year period.
0.0000
0.2000
0.4000
0.6000
0.8000
1.0000
1.2000
1998/99 1999/00 2000/01 2001/02 2002/03 2003/04
Ye ar
Surv
ival
rat
eA19 A20 A21
Figure 5.5 Trends in Non-Electives Survival rates for Haemorrhagic Cerebrovascular Disorder (A19), and for Non-Electives Transient Ischaemic Attack: (A20) and (A21) - In-hospital and 30 days Source: Hospital Episodes Statistics, 1998/99 – 2003/04
0.0000
0.1000
0.2000
0.3000
0.4000
0.5000
0.6000
0.7000
0.8000
0.9000
1.0000
1998/99 1999/00 2000/01 2001/02 2002/03 2003/04
Ye ar
Surv
ival
Rat
e
A22 A23
Figure 5.6 Trends in Non-Electives Survival rates for Non-Transient Stroke or Cerebrovascular Accident: (A22) and (A23) - In-hospital and 30 days Source: Hospital Episodes Statistics, 1998/99 – 2003/04

Circulatory disease in the NHS: measuring trends in hospital costs and output 31
5.2 Coronary heart disease (CHD) Coronary heart disease (CHD) is the condition that occurs when the constant supply of oxygen to the heart muscle is blocked partially or completely. Oxygen is carried to the heart muscle in the blood and flows to it through the coronary arteries (heart’s blood vessels). Coronary arteries are placed both to the left and to the right side of the aorta and supply the tissues of the heart itself. The reduced supply of oxygen can be caused either by the presence of a blood clot – thrombosis – or by the arteries becoming thick and hard – sclerosis. Different types and severity of CHD may occur according to the degree to which the coronary arteries are blocked. If they are completely blocked then the patient may experience a heart attack (myocardial infarction) and if the block is only partial, then this can cause chest pains otherwise known as angina. Acute myocardial infarction (AMI) refers to the death of the heart muscle, whilst heart failure or shock refers to a condition in which the pumping action of the heart is inadequate. Coronary artery bypass grafting (CABG) and percutaneous transluminal coronary angioplasty (PTCA) are procedures performed when patients present a chronic CHD. Figures 5.7 and 5.8 show trends for England in non-elective inpatient spells for patients diagnosed with AMI and in both elective (including day cases) and non-elective inpatient stays for patients diagnosed with heart failure or shock. AMI is a severe condition and is usually accompanied by complications (w cc). This explains the much higher volumes of activity registered for E11 (w cc) compared to E12 (w/o cc). The time series under consideration shows a rapid decrease in AMI with complications up to 2001/02, followed by an equally rapid increase from 2001/02 to 2002/03 before stabilising. Volumes of activity for AMI for patients without complications shows an increase over the time period considered.
0
10000
20000
30000
40000
50000
60000
70000
80000
1998/99 1999/00 2000/01 2001/02 2002/03 2003/04
Ye ar
Vol
ume
of a
ctiv
ity
E11 E12
Figure 5.7 Trends in Non-Electives Acute Myocardial Infarction: w cc (E11) and w/o cc (E12) Source: Hospital Episodes Statistics, 1998/99 – 2003/04 Volumes of activities for heart failure and shock performed as elective or day case inpatient stays have remained stable throughout the time period under investigation. Non-electives inpatient stays, which are much larger in volume (especially for patients over 69 years of age or with complications), show a fall up to year 2001/02, before increasing again and stabilising in the last year of the series.
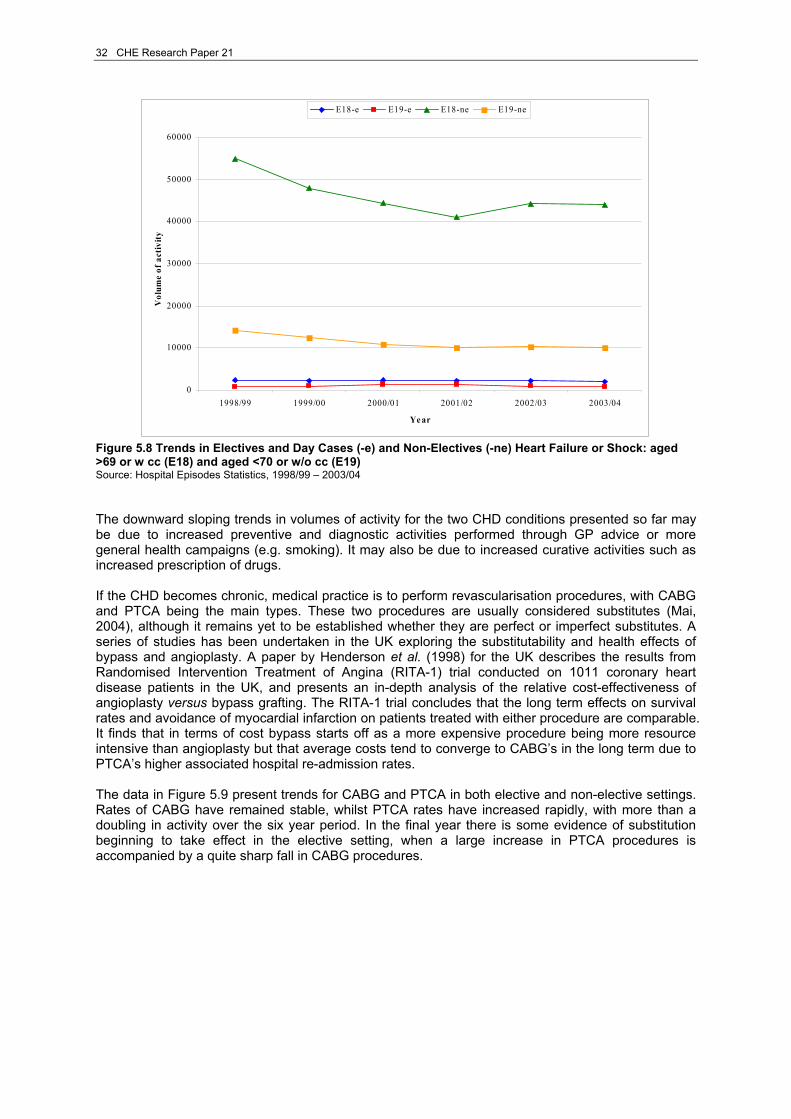
32 CHE Research Paper 21
0
10000
20000
30000
40000
50000
60000
1998/99 1999/00 2000/01 2001/02 2002/03 2003/04
Ye ar
Vol
ume
of a
ctiv
ity
E18-e E19-e E18-ne E19-ne
Figure 5.8 Trends in Electives and Day Cases (-e) and Non-Electives (-ne) Heart Failure or Shock: aged >69 or w cc (E18) and aged <70 or w/o cc (E19) Source: Hospital Episodes Statistics, 1998/99 – 2003/04 The downward sloping trends in volumes of activity for the two CHD conditions presented so far may be due to increased preventive and diagnostic activities performed through GP advice or more general health campaigns (e.g. smoking). It may also be due to increased curative activities such as increased prescription of drugs. If the CHD becomes chronic, medical practice is to perform revascularisation procedures, with CABG and PTCA being the main types. These two procedures are usually considered substitutes (Mai, 2004), although it remains yet to be established whether they are perfect or imperfect substitutes. A series of studies has been undertaken in the UK exploring the substitutability and health effects of bypass and angioplasty. A paper by Henderson et al. (1998) for the UK describes the results from Randomised Intervention Treatment of Angina (RITA-1) trial conducted on 1011 coronary heart disease patients in the UK, and presents an in-depth analysis of the relative cost-effectiveness of angioplasty versus bypass grafting. The RITA-1 trial concludes that the long term effects on survival rates and avoidance of myocardial infarction on patients treated with either procedure are comparable. It finds that in terms of cost bypass starts off as a more expensive procedure being more resource intensive than angioplasty but that average costs tend to converge to CABG’s in the long term due to PTCA’s higher associated hospital re-admission rates. The data in Figure 5.9 present trends for CABG and PTCA in both elective and non-elective settings. Rates of CABG have remained stable, whilst PTCA rates have increased rapidly, with more than a doubling in activity over the six year period. In the final year there is some evidence of substitution beginning to take effect in the elective setting, when a large increase in PTCA procedures is accompanied by a quite sharp fall in CABG procedures.
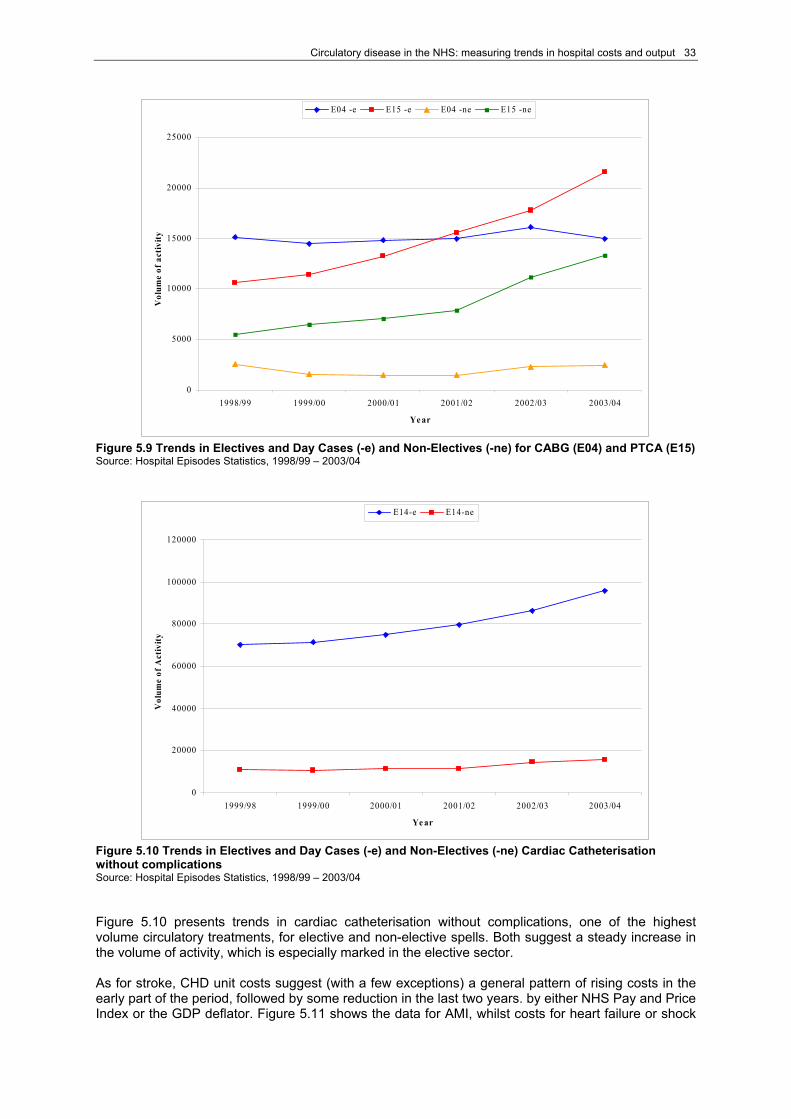
Circulatory disease in the NHS: measuring trends in hospital costs and output 33
0
5000
10000
15000
20000
25000
1998/99 1999/00 2000/01 2001/02 2002/03 2003/04
Ye ar
Vol
ume
of a
ctiv
ity
E04 -e E15 -e E04 -ne E15 -ne
Figure 5.9 Trends in Electives and Day Cases (-e) and Non-Electives (-ne) for CABG (E04) and PTCA (E15) Source: Hospital Episodes Statistics, 1998/99 – 2003/04
0
20000
40000
60000
80000
100000
120000
1999/98 1999/00 2000/01 2001/02 2002/03 2003/04
Ye ar
Vol
ume
of A
ctiv
ity
E14-e E14-ne
Figure 5.10 Trends in Electives and Day Cases (-e) and Non-Electives (-ne) Cardiac Catheterisation without complications Source: Hospital Episodes Statistics, 1998/99 – 2003/04 Figure 5.10 presents trends in cardiac catheterisation without complications, one of the highest volume circulatory treatments, for elective and non-elective spells. Both suggest a steady increase in the volume of activity, which is especially marked in the elective sector. As for stroke, CHD unit costs suggest (with a few exceptions) a general pattern of rising costs in the early part of the period, followed by some reduction in the last two years. by either NHS Pay and Price Index or the GDP deflator. Figure 5.11 shows the data for AMI, whilst costs for heart failure or shock
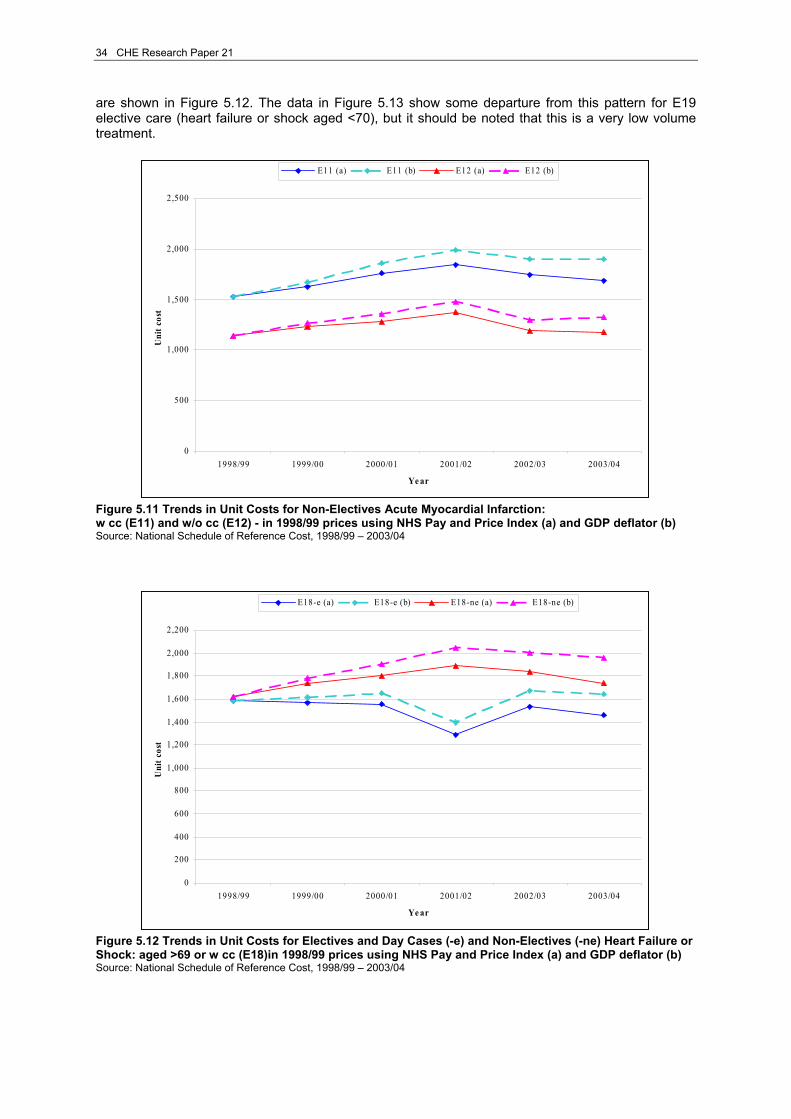
34 CHE Research Paper 21
are shown in Figure 5.12. The data in Figure 5.13 show some departure from this pattern for E19 elective care (heart failure or shock aged <70), but it should be noted that this is a very low volume treatment.
0
500
1,000
1,500
2,000
2,500
1998/99 1999/00 2000/01 2001/02 2002/03 2003/04
Ye ar
Uni
t cos
tE11 (a) E11 (b) E12 (a) E12 (b)
Figure 5.11 Trends in Unit Costs for Non-Electives Acute Myocardial Infarction: w cc (E11) and w/o cc (E12) - in 1998/99 prices using NHS Pay and Price Index (a) and GDP deflator (b) Source: National Schedule of Reference Cost, 1998/99 – 2003/04
0
200
400
600
800
1,000
1,200
1,400
1,600
1,800
2,000
2,200
1998/99 1999/00 2000/01 2001/02 2002/03 2003/04
Ye ar
Uni
t cos
t
E18-e (a) E18-e (b) E18-ne (a) E18-ne (b)
Figure 5.12 Trends in Unit Costs for Electives and Day Cases (-e) and Non-Electives (-ne) Heart Failure or Shock: aged >69 or w cc (E18)in 1998/99 prices using NHS Pay and Price Index (a) and GDP deflator (b) Source: National Schedule of Reference Cost, 1998/99 – 2003/04

Circulatory disease in the NHS: measuring trends in hospital costs and output 35
0
200
400
600
800
1,000
1,200
1,400
1,600
1,800
1998/99 1999/00 2000/01 2001/02 2002/03 2003/04
Ye ar
Uni
t cos
t
E19-e (a) E19-e (b) E19-ne (a) E19-ne (b)
Figure 5.13 Trends in Unit Costs for Electives and Day Cases (-e) and Non-Electives (-ne) Heart Failure or Shock: aged <70 or w/o cc (E19) - in 1998/99 prices using NHS Pay and Price Index (a) and GDP deflator (b) Source: National Schedule of Reference Cost, 1998/99 – 2003/04
0
1,000
2,000
3,000
4,000
5,000
6,000
7,000
8,000
1998/99 1999/00 2000/01 2001/02 2002/03 2003/04
Ye ar
Uni
t cos
t
E04-e (a) E04-e (b) E04-ne (a) E04-ne (b)
Figure 5.14 Trends in Unit Costs for Electives and Day Cases (-e) and Non-Electives (-ne) CABG (E04) - in 1998/99 prices using NHS Pay and Price Index (a) and GDP deflator (b) Source: National Schedule of Reference Cost, 1998/99 – 2003/04 Figures 5.14 and 5.15 show trends in unit costs for CABG and PTCA. It should be noted first that unit costs for non-elective procedures are consistently higher than their elective and day case counterparts. This may in some part be due to the higher dependency of patients that are admitted and operated as emergency cases. Further, PTCA is a consistently less costly procedure than CABG (for both electives and day cases and non-electives).
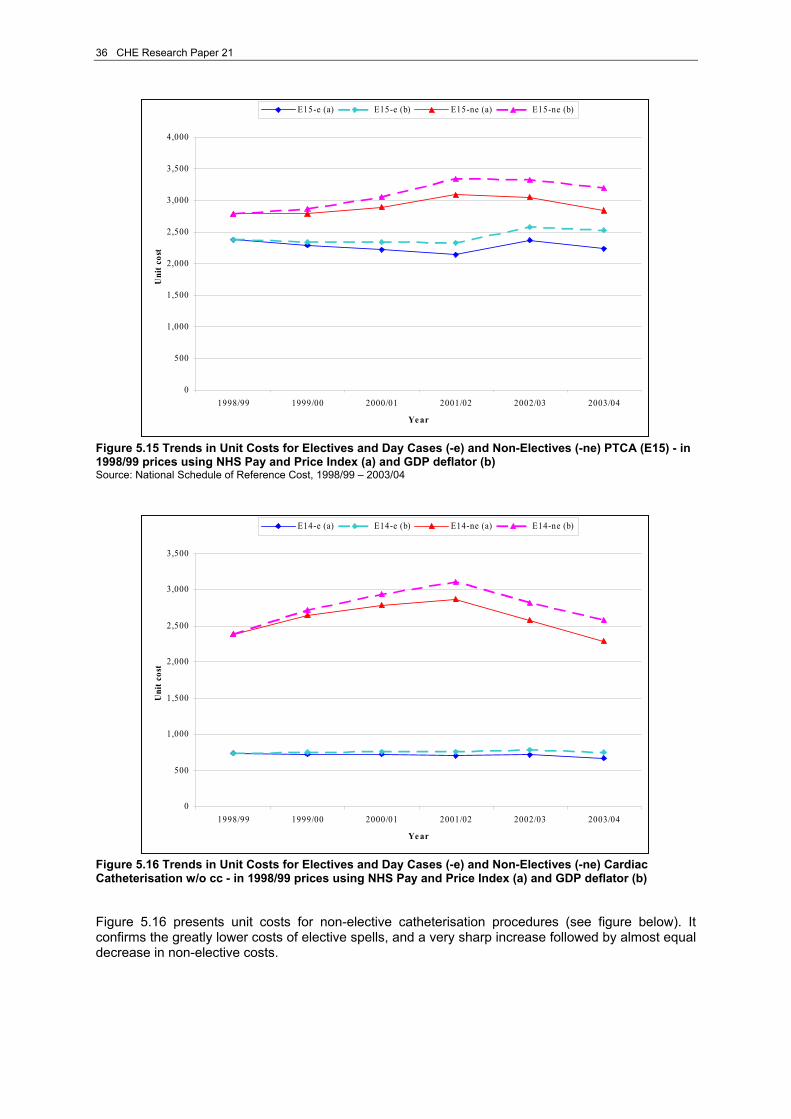
36 CHE Research Paper 21
0
500
1,000
1,500
2,000
2,500
3,000
3,500
4,000
1998/99 1999/00 2000/01 2001/02 2002/03 2003/04
Ye ar
Uni
t cos
t
E15-e (a) E15-e (b) E15-ne (a) E15-ne (b)
Figure 5.15 Trends in Unit Costs for Electives and Day Cases (-e) and Non-Electives (-ne) PTCA (E15) - in 1998/99 prices using NHS Pay and Price Index (a) and GDP deflator (b) Source: National Schedule of Reference Cost, 1998/99 – 2003/04
0
500
1,000
1,500
2,000
2,500
3,000
3,500
1998/99 1999/00 2000/01 2001/02 2002/03 2003/04
Ye ar
Uni
t cos
t
E14-e (a) E14-e (b) E14-ne (a) E14-ne (b)
Figure 5.16 Trends in Unit Costs for Electives and Day Cases (-e) and Non-Electives (-ne) Cardiac Catheterisation w/o cc - in 1998/99 prices using NHS Pay and Price Index (a) and GDP deflator (b) Figure 5.16 presents unit costs for non-elective catheterisation procedures (see figure below). It confirms the greatly lower costs of elective spells, and a very sharp increase followed by almost equal decrease in non-elective costs.
Circulatory disease in the NHS: measuring trends in hospital costs and output 37
Figure 5.17 shows trends in survival rates for patients admitted to hospital with AMI. There is a modest but noticeable improvement over the study period. It is more difficult to detect any material trend amongst the heart failure or shock HRGs, shown in Figure 5.18.
0.0000
0.1000
0.2000
0.3000
0.4000
0.5000
0.6000
0.7000
0.8000
0.9000
1.0000
1998/99 1999/00 2000/01 2001/02 2002/03 2003/04
Ye ar
Surv
ival
rat
eE11 E12
Figure 5.17 Trends in Non-Electives Survival rate for Acute Myocardial infarction: w cc (E11) and w/o cc (E12) - In-hospital and 30 days Source: Hospital Episodes Statistics, 1998/99 – 2003/04
0.0000
0.2000
0.4000
0.6000
0.8000
1.0000
1.2000
1998/99 1999/00 2000/01 2001/02 2002/03 2003/04
Year
Sur
viva
l rat
e
E18-e E19-e E18-ne E19-ne
Figure 5.18 Trends in Electives and Day Cases (-e) and Non-Electives (-ne) Survival rate for Heart Failure or Shock: aged >69 or w cc (E18) and aged <70 or w/o cc (E19) - In-hospital and 30 days Source: Hospital Episodes Statistics, 1998/99 – 2003/04
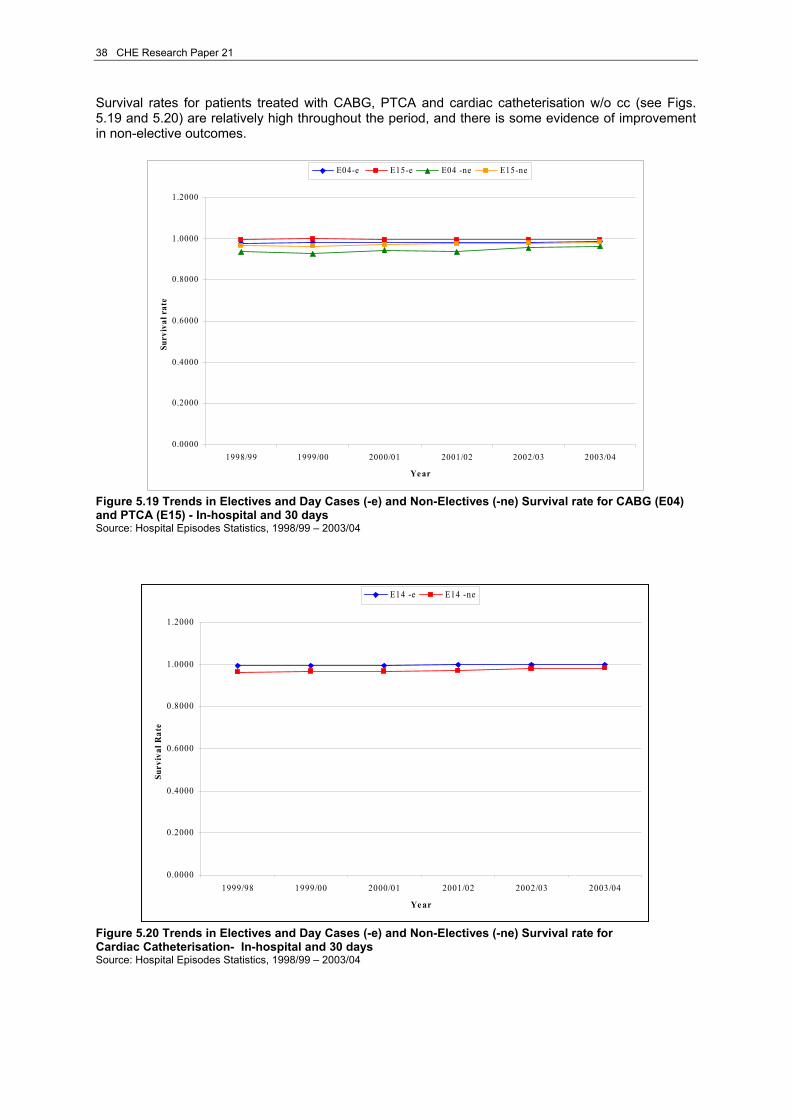
38 CHE Research Paper 21
Survival rates for patients treated with CABG, PTCA and cardiac catheterisation w/o cc (see Figs. 5.19 and 5.20) are relatively high throughout the period, and there is some evidence of improvement in non-elective outcomes.
0.0000
0.2000
0.4000
0.6000
0.8000
1.0000
1.2000
1998/99 1999/00 2000/01 2001/02 2002/03 2003/04
Ye ar
Surv
ival
rat
eE04-e E15-e E04 -ne E15-ne
Figure 5.19 Trends in Electives and Day Cases (-e) and Non-Electives (-ne) Survival rate for CABG (E04) and PTCA (E15) - In-hospital and 30 days Source: Hospital Episodes Statistics, 1998/99 – 2003/04
0.0000
0.2000
0.4000
0.6000
0.8000
1.0000
1.2000
1999/98 1999/00 2000/01 2001/02 2002/03 2003/04
Ye ar
Surv
ival
Rat
e
E14 -e E14 -ne
Figure 5.20 Trends in Electives and Day Cases (-e) and Non-Electives (-ne) Survival rate for Cardiac Catheterisation- In-hospital and 30 days Source: Hospital Episodes Statistics, 1998/99 – 2003/04

Circulatory disease in the NHS: measuring trends in hospital costs and output 39
5.3 Symptoms of heart conditions This last sub-section shows trends in activity, unit costs and survival rates for a set of HRGs that we label ‘symptoms of heart condition’. These HRGs were chosen because of their high activity volumes in 2003/04 (see tables 4.1 and 4.2). Arrhythmia or conduction disorder (E29 and E30), syncope (E31 and E32), angina11 (E33 and E34) and chest pain (E35 and E36) are diagnoses that are usually treated in an ambulatory setting by a GP through medical management, mainly drugs. However, some of these diagnosis may lead to more severe conditions and may lead to a need for painful and risky procedures if not kept under observation and treated appropriately. Figure 5.21 presents volumes of activity for arrhythmia or conduction disorder. These are predominantly emergency admissions, for which there has been a sharp increase since 2001/02.
0
10000
20000
30000
40000
50000
60000
1998/99 1999/00 2000/01 2001/02 2002/03 2003/04
Ye ar
Vol
ume
of a
ctiv
ity
E29-e E30-e E29-ne E30-ne
Figure 5.21 Trends in Electives and Day Cases (-e) and Non-Electives (-ne) Arrhythmia or Conduction Disorders: aged >69 (E29) or w cc and aged <70 or w/o cc (E30) Source: Hospital Episodes Statistics, 1998/99 – 2003/04 For other non-elective HRGs in this category, Figure 5.22 shows that the highest volume and consistently high increases in volume have been for chest pain (aged <70 without complications).
11 As from 2003/04 with the introduction of HRG version 3.5, patients that are diagnosed with angina (E33 and E34) are recorded under HRG codes E22 and E23, respectively. In Version 3.5 E22 refers to ‘Ischaemic Heart Disease without intervention aged >69 or w cc’ and E23 refers to ‘Ischaemic Heart Disease without intervention aged <70 or w/o cc’. As codes E22 (Coronary Atherosclerosis aged >69 or w cc) and E23 (Coronary Atherosclerosis aged <70 or w/o cc) were pre-existent to HRG version 3.5, the new codes are the result of merging version 3.1 codes E22 and E33; and version 3.1 codes E23 and E34.The HES database, however, allows to choose which version of the HRG system to use; and this explains why we were able to produce a time series for angina up to year 2003/04.
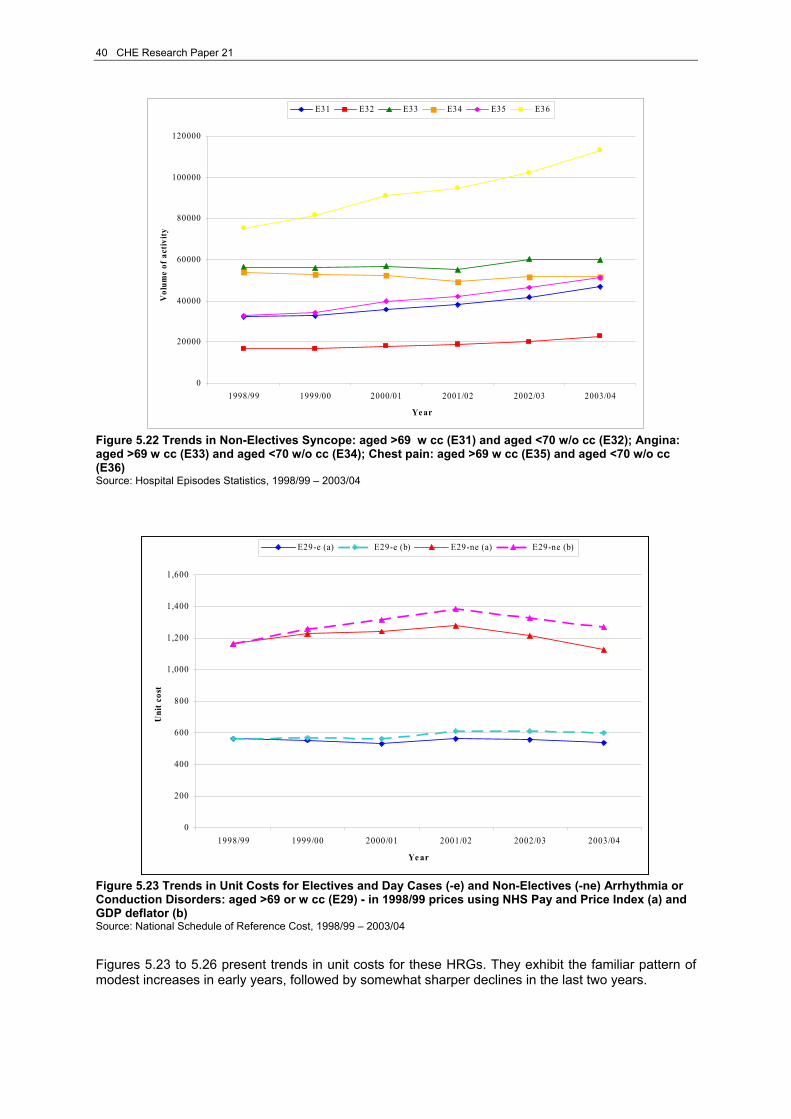
40 CHE Research Paper 21
0
20000
40000
60000
80000
100000
120000
1998/99 1999/00 2000/01 2001/02 2002/03 2003/04
Ye ar
Vol
ume
of a
ctiv
ity
E31 E32 E33 E34 E35 E36
Figure 5.22 Trends in Non-Electives Syncope: aged >69 w cc (E31) and aged <70 w/o cc (E32); Angina: aged >69 w cc (E33) and aged <70 w/o cc (E34); Chest pain: aged >69 w cc (E35) and aged <70 w/o cc (E36) Source: Hospital Episodes Statistics, 1998/99 – 2003/04
0
200
400
600
800
1,000
1,200
1,400
1,600
1998/99 1999/00 2000/01 2001/02 2002/03 2003/04
Ye ar
Uni
t cos
t
E29-e (a) E29-e (b) E29-ne (a) E29-ne (b)
Figure 5.23 Trends in Unit Costs for Electives and Day Cases (-e) and Non-Electives (-ne) Arrhythmia or Conduction Disorders: aged >69 or w cc (E29) - in 1998/99 prices using NHS Pay and Price Index (a) and GDP deflator (b) Source: National Schedule of Reference Cost, 1998/99 – 2003/04 Figures 5.23 to 5.26 present trends in unit costs for these HRGs. They exhibit the familiar pattern of modest increases in early years, followed by somewhat sharper declines in the last two years.

Circulatory disease in the NHS: measuring trends in hospital costs and output 41
0
100
200
300
400
500
600
700
800
1998/99 1999/00 2000/01 2001/02 2002/03 2003/04
Ye ar
Uni
t cos
t
E30-e (a) E30-e (b) E30-ne (a) E30-ne (b)
Figure 5.24 Trends in Unit Costs for Electives and Day Cases (-e) and Non-Electives (-ne) Arrhythmia or Conduction Disorders: aged <70 or w/o cc (E30) - in 1998/99 prices using NHS Pay and Price Index (a) and GDP deflator (b) Source: National Schedule of Reference Cost, 1998/99 – 2003/04
0
200
400
600
800
1,000
1,200
1,400
1998/99 1999/00 2000/01 2001/02 2002/03 2003/04
Ye ar
Uni
t cos
t
E31 E32 E33 E34 E35 E36
Figure 5.25 Trends in Unit Costs for Non-Electives Syncope or Collapse (E31 and E32); Angina (E33 and E34); Chest Pain (E35 and E36) - in 1998/99 prices using NHS Pay and Price Index Source: National Schedule of Reference Cost, 1998/99 – 2003/04

42 CHE Research Paper 21
0
200
400
600
800
1,000
1,200
1,400
1,600
1998/99 1999/00 2000/01 2001/02 2002/03 2003/04
Ye ar
Uni
t Cos
t
E31 E32 E33 E34 E35 E36
Figure 5.26 Trends in Unit Costs for Non-Electives Syncope or Collapse (E31 and E32); Angina (E33 and E34); Chest Pain (E35 and E36)- in 1998/99 prices using GDP deflator Source: National Schedule of Reference Cost, 1998/99 – 2003/04
0.0000
0.2000
0.4000
0.6000
0.8000
1.0000
1.2000
1998/99 1999/00 2000/01 2001/02 2002/03 2003/04
Ye ar
Surv
ival
rat
e
E29-e E30-e E29-ne E30-ne
Figure 5.27 Trends in Electives and Day Cases (-e) and Non-Electives (-ne) Arrhythmia or Conduction Disorders: E29 and E30 - In-hospital and 30 days Source: Hospital Episodes Statistics, 1998/99 – 2003/04 Figures 5.27 and 5.28 confirm that survival rates are generally high for these HRGs, offering little scope for improvement.

Circulatory disease in the NHS: measuring trends in hospital costs and output 43
0.0000
0.2000
0.4000
0.6000
0.8000
1.0000
1.2000
1998/99 1999/00 2000/01 2001/02 2002/03 2003/04
Ye ar
Surv
ival
rat
e
E31 E32 E33 E34 E35 E36
Figure 5.28 Trends in Non-Electives Survival rate Syncope or Collapse (E31 and E32); Angina (E33 and E34); Chest Pain (E35 and E36) - In-hospital and 30 days Source: Hospital Episodes Statistics, 1998/99 – 2003/04
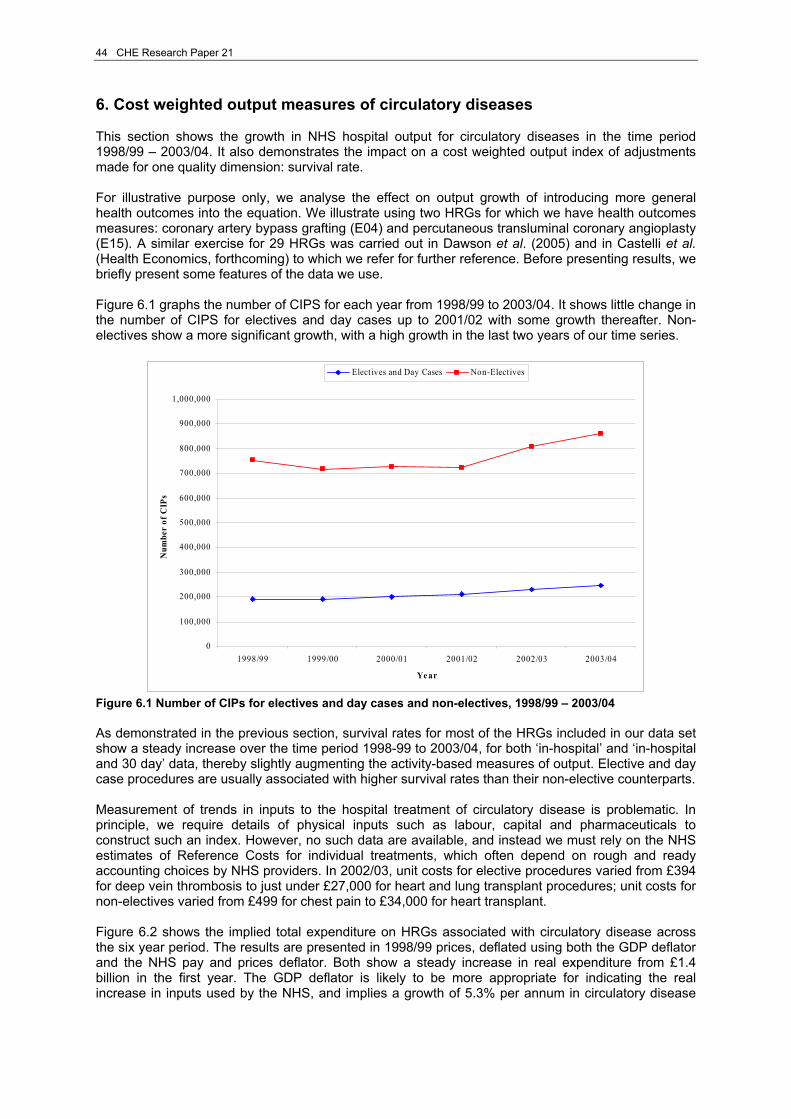
44 CHE Research Paper 21
6. Cost weighted output measures of circulatory diseases This section shows the growth in NHS hospital output for circulatory diseases in the time period 1998/99 – 2003/04. It also demonstrates the impact on a cost weighted output index of adjustments made for one quality dimension: survival rate. For illustrative purpose only, we analyse the effect on output growth of introducing more general health outcomes into the equation. We illustrate using two HRGs for which we have health outcomes measures: coronary artery bypass grafting (E04) and percutaneous transluminal coronary angioplasty (E15). A similar exercise for 29 HRGs was carried out in Dawson et al. (2005) and in Castelli et al. (Health Economics, forthcoming) to which we refer for further reference. Before presenting results, we briefly present some features of the data we use. Figure 6.1 graphs the number of CIPS for each year from 1998/99 to 2003/04. It shows little change in the number of CIPS for electives and day cases up to 2001/02 with some growth thereafter. Non-electives show a more significant growth, with a high growth in the last two years of our time series.
0
100,000
200,000
300,000
400,000
500,000
600,000
700,000
800,000
900,000
1,000,000
1998/99 1999/00 2000/01 2001/02 2002/03 2003/04
Ye ar
Num
ber
of C
IPs
Elect ives and Day Cases Non-Elect ives
Figure 6.1 Number of CIPs for electives and day cases and non-electives, 1998/99 – 2003/04 As demonstrated in the previous section, survival rates for most of the HRGs included in our data set show a steady increase over the time period 1998-99 to 2003/04, for both ‘in-hospital’ and ‘in-hospital and 30 day’ data, thereby slightly augmenting the activity-based measures of output. Elective and day case procedures are usually associated with higher survival rates than their non-elective counterparts. Measurement of trends in inputs to the hospital treatment of circulatory disease is problematic. In principle, we require details of physical inputs such as labour, capital and pharmaceuticals to construct such an index. However, no such data are available, and instead we must rely on the NHS estimates of Reference Costs for individual treatments, which often depend on rough and ready accounting choices by NHS providers. In 2002/03, unit costs for elective procedures varied from £394 for deep vein thrombosis to just under £27,000 for heart and lung transplant procedures; unit costs for non-electives varied from £499 for chest pain to £34,000 for heart transplant. Figure 6.2 shows the implied total expenditure on HRGs associated with circulatory disease across the six year period. The results are presented in 1998/99 prices, deflated using both the GDP deflator and the NHS pay and prices deflator. Both show a steady increase in real expenditure from £1.4 billion in the first year. The GDP deflator is likely to be more appropriate for indicating the real increase in inputs used by the NHS, and implies a growth of 5.3% per annum in circulatory disease
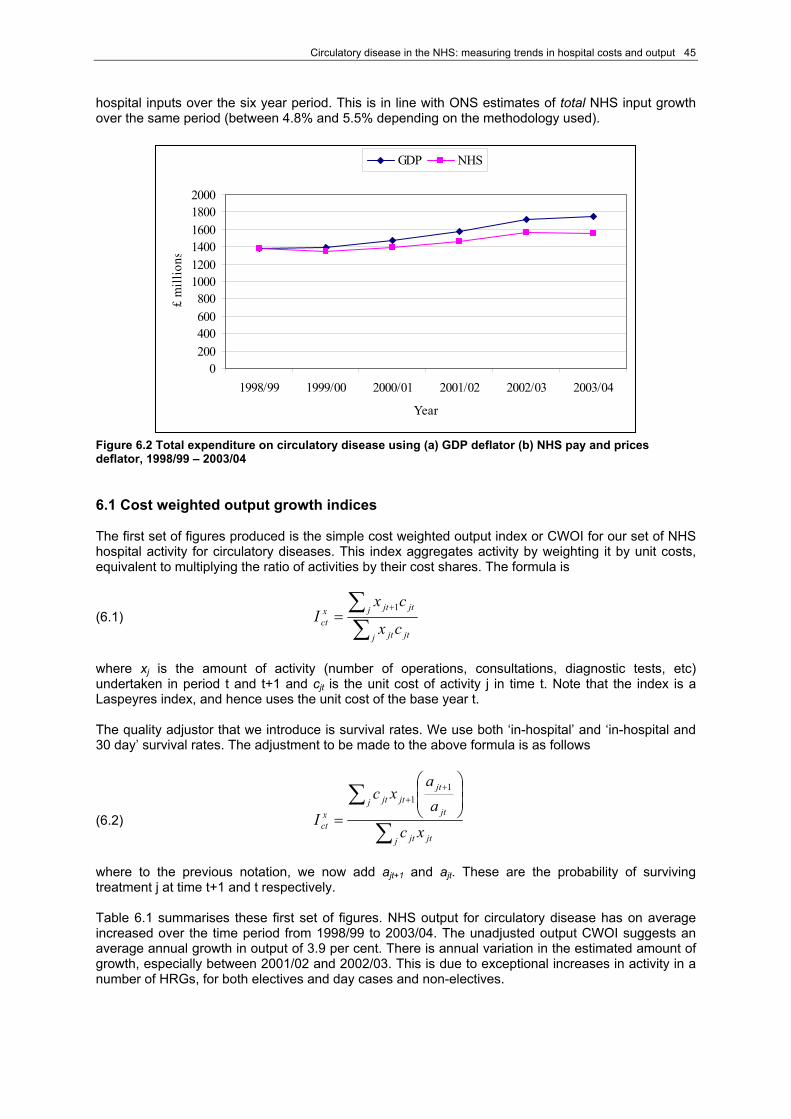
Circulatory disease in the NHS: measuring trends in hospital costs and output 45
hospital inputs over the six year period. This is in line with ONS estimates of total NHS input growth over the same period (between 4.8% and 5.5% depending on the methodology used).
0200400600800
100012001400160018002000
1998/99 1999/00 2000/01 2001/02 2002/03 2003/04
Year
£ m
illio
nsGDP NHS
Figure 6.2 Total expenditure on circulatory disease using (a) GDP deflator (b) NHS pay and prices deflator, 1998/99 – 2003/04 6.1 Cost weighted output growth indices The first set of figures produced is the simple cost weighted output index or CWOI for our set of NHS hospital activity for circulatory diseases. This index aggregates activity by weighting it by unit costs, equivalent to multiplying the ratio of activities by their cost shares. The formula is
(6.1) ∑∑ +
=j jtjt
j jtjtxct cx
cxI
1
where xj is the amount of activity (number of operations, consultations, diagnostic tests, etc) undertaken in period t and t+1 and cjt is the unit cost of activity j in time t. Note that the index is a Laspeyres index, and hence uses the unit cost of the base year t. The quality adjustor that we introduce is survival rates. We use both ‘in-hospital’ and ‘in-hospital and 30 day’ survival rates. The adjustment to be made to the above formula is as follows
(6.2) ∑
∑ ⎟⎟⎠
⎞⎜⎜⎝
⎛
=
++
j jtjt
jt
jtjtj jt
xct xc
aa
xc
I
11
where to the previous notation, we now add ajt+1 and ajt. These are the probability of surviving treatment j at time t+1 and t respectively. Table 6.1 summarises these first set of figures. NHS output for circulatory disease has on average increased over the time period from 1998/99 to 2003/04. The unadjusted output CWOI suggests an average annual growth in output of 3.9 per cent. There is annual variation in the estimated amount of growth, especially between 2001/02 and 2002/03. This is due to exceptional increases in activity in a number of HRGs, for both electives and day cases and non-electives.

46 CHE Research Paper 21
Table 6.1 Cost Weighted Output Index simple and with survival adjustment - time series
CWOI CWOI with in-hospital
survival rate CWOI with in-hospital and 30 day survival rate
1998/99 - 1999/00 2.23% 1.47% 1.36% 1999//00 - 2000/01 2.86% 3.22% 3.33% 2000/01 - 2001/02 3.24% 3.31% 3.42% 2001/02 - 2002/03 6.28% 8.03% 8.37% 2002/03 - 2003/04 4.88% 5.73% 5.93% Average growth 3.90% 4.35% 4.48% As expected, because of improved survival rates, introducing the quality adjustment produces higher growth rates in the indices, both on average and for any given year, except for 1998/99 – 1999/00. The use of ‘in-hospital and 30 day’ survival rates yields a higher adjustment than ‘in-hospital’ survival rate for all years except for 1998/99 – 1999/00. Overall, using ‘in-hospital’ survival rates leads to an average annual increase in the estimates of output growth of 0.45 per cent compared to the unadjusted CWOI, whilst the ‘in-hospital and 30 day’ measure of survival adds 0.58 per cent compared to the unadjusted CWOI. The increase reflects the gradual improvement in survival rate over the period under consideration. 6.2 Introducing ‘health improvement’ into output measures We now consider the introduction of health effects in measuring the NHS output growth. Health effects refer to the value added to each individual’s health as a result of a contact with the health system. To measure the improvement in health contributed by the NHS, one ought to have measures of health with and without treatment or at least pre- and post-treatment measures. Unfortunately, data on before and after health outcomes are not available for the full list of diagnosis and procedures for circulatory diseases. We do however have available health status SF36 data on a small number of procedures collected by BUPA over the study period. We use health outcomes data for CABG and PTCA to investigate the impact on output growth that one might obtain when taking into account health outcomes, as an illustrative example only. The latter are expected to increase the value of the output growth, over and above the effect obtained by adjusting for survival. Table 6.2 shows before (h0
j) and after (h*j) treatment measures of health outcomes for the two
procedures. The figures come from an analysis of SF36 measures from BUPA conducted by CHE/NIESR. Table 6.2 Before and after health outcomes Health outcome HRG description HRG h0
j h*j
Coronary Bypass E04 0.50 0.73 Percutaneous Transluminal Coronary Angioplasty (PTCA) E15 0.54 0.79 These health outcome data were attributed to elective inpatient and day case procedures. Before treatment health status for patients undergoing PTCA is slightly larger than that recorded for patients undergoing CABG; the health status after treatment is also higher for patients who had a PTCA procedure. We expect the before and after health status for patients treated in an emergency setting to differ quite substantially from those of patients treated as elective and day cases. Assigning an appropriate measure of before and after health outcome to non-elective cases is not a trivial exercise. We, therefore, undertake a sensitivity analysis to investigate the impact that different values of before and after health status for non-elective procedures have on the output growth index.

Circulatory disease in the NHS: measuring trends in hospital costs and output 47
We estimate the following output growth indices for these two HRGs:
Cost weighted output index (CWOI) CWOI with short-term survival adjustment (‘in-hospital and 30 day’, only) CWOI incorporating survival and health adjustment.
The formula of our index incorporating survival and health adjustments is:
(6.3) ∑
∑ ⎟⎟⎠
⎞⎜⎜⎝
⎛
−
−
=
++
j jtjt
jjt
jjtjtj jt
xct xc
kaka
xc
I
11
The notation of the index formula is unchanged, except for kj, which is equal to h0
j/h*j, where h0
j is a measure of patients’ health status before treatment and h*
j is a measure of patients’ health status after treatment. In estimating this equation it is necessary to introduce an arbitrary threshold for HRGs with poor survival rate. If survival rates are below the chosen threshold level, only the change in survival is taken into account. Not making this adjustment would result, as Dawson et al. (2005) point out, in the index being too sensitive to changes in aj for activities with small or negative (ajt+1 - kj) or (ajt - kj). The threshold chosen is 90 per cent of survival rate. Table 6.3 shows the estimates of output change for CABG and PTCA. Both the estimates for CWOI incorporating survival and health adjustments use the value of before and after treatment health status for elective and day case procedures as shown in table 6.3. Table 6.3 Cost Weighted Output Index simple, with survival and health adjustments - time series
CWOI with survival and health effect
CWOI with survival and health effect CWOI
CWOI with ‘in-hospital and 30 day’ survival rate
(i) (ii) 1998/99 - 1999/00 -0.70% -0.67% -0.46% -0.47% 1999//00 - 2000/01 5.37% 5.65% 5.83% 5.86% 2000/01 - 2001/02 7.23% 7.20% 7.14% 7.14% 2001/02 - 2002/03 15.43% 15.68% 15.80% 15.81% 2002/03 - 2003/04 4.66% 5.01% 5.57% 5.58% Average growth 6.40% 6.58% 6.77% 6.79% The unadjusted CWOI suggests an average annual growth in output for CABG and PTCA of 6.40 per cent. These results demonstrate the volatility inherent in using a small sample. In particular, there is a large increase in the index of 15.43 per cent between 2001/02 and 2002/03. This is driven by an increase in activity rather than a change in costs; in fact activity for non-electives CABG and PTCA procedures increased respectively by about 61 per cent and 42.1 per cent between 2001/02 and 2002/03. On average the introduction of survival adjustment adds 0.18 per cent to the simple CWOI. Survival rates for these two HRGs did not change much in the time period considered, as discussed in sub-section 5.2, and they are quite high. Nevertheless, the incorporation of survival rates into the index equation shows the extra value that is captured by this quality adjustor. Failure to incorporate it would have resulted in an under-estimation of the value of output and its growth added by the NHS over the time period considered. The figures in columns (i), and (ii) show estimates of CWOI adjusted for survival and health outcome, as estimated in our health status measures. Column (i) shows estimates for which we used a value
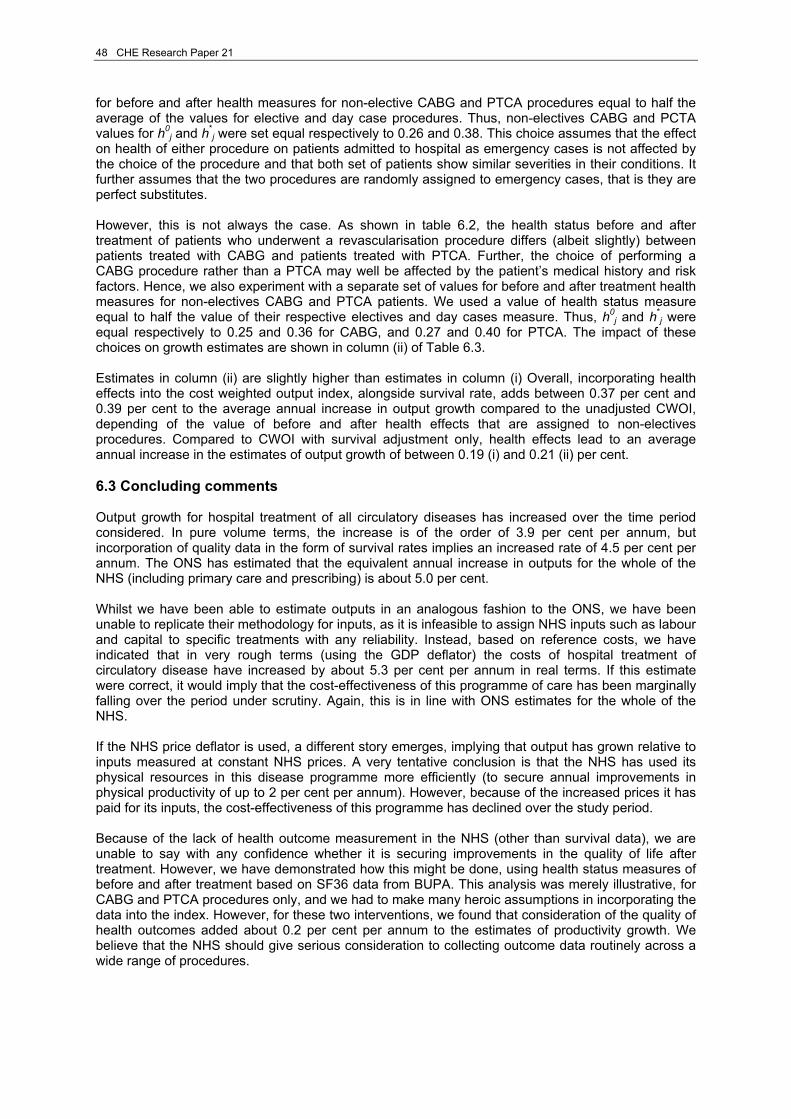
48 CHE Research Paper 21
for before and after health measures for non-elective CABG and PTCA procedures equal to half the average of the values for elective and day case procedures. Thus, non-electives CABG and PCTA values for h0
j and h*j were set equal respectively to 0.26 and 0.38. This choice assumes that the effect
on health of either procedure on patients admitted to hospital as emergency cases is not affected by the choice of the procedure and that both set of patients show similar severities in their conditions. It further assumes that the two procedures are randomly assigned to emergency cases, that is they are perfect substitutes. However, this is not always the case. As shown in table 6.2, the health status before and after treatment of patients who underwent a revascularisation procedure differs (albeit slightly) between patients treated with CABG and patients treated with PTCA. Further, the choice of performing a CABG procedure rather than a PTCA may well be affected by the patient’s medical history and risk factors. Hence, we also experiment with a separate set of values for before and after treatment health measures for non-electives CABG and PTCA patients. We used a value of health status measure equal to half the value of their respective electives and day cases measure. Thus, h0
j and h*j were
equal respectively to 0.25 and 0.36 for CABG, and 0.27 and 0.40 for PTCA. The impact of these choices on growth estimates are shown in column (ii) of Table 6.3. Estimates in column (ii) are slightly higher than estimates in column (i) Overall, incorporating health effects into the cost weighted output index, alongside survival rate, adds between 0.37 per cent and 0.39 per cent to the average annual increase in output growth compared to the unadjusted CWOI, depending of the value of before and after health effects that are assigned to non-electives procedures. Compared to CWOI with survival adjustment only, health effects lead to an average annual increase in the estimates of output growth of between 0.19 (i) and 0.21 (ii) per cent. 6.3 Concluding comments Output growth for hospital treatment of all circulatory diseases has increased over the time period considered. In pure volume terms, the increase is of the order of 3.9 per cent per annum, but incorporation of quality data in the form of survival rates implies an increased rate of 4.5 per cent per annum. The ONS has estimated that the equivalent annual increase in outputs for the whole of the NHS (including primary care and prescribing) is about 5.0 per cent. Whilst we have been able to estimate outputs in an analogous fashion to the ONS, we have been unable to replicate their methodology for inputs, as it is infeasible to assign NHS inputs such as labour and capital to specific treatments with any reliability. Instead, based on reference costs, we have indicated that in very rough terms (using the GDP deflator) the costs of hospital treatment of circulatory disease have increased by about 5.3 per cent per annum in real terms. If this estimate were correct, it would imply that the cost-effectiveness of this programme of care has been marginally falling over the period under scrutiny. Again, this is in line with ONS estimates for the whole of the NHS. If the NHS price deflator is used, a different story emerges, implying that output has grown relative to inputs measured at constant NHS prices. A very tentative conclusion is that the NHS has used its physical resources in this disease programme more efficiently (to secure annual improvements in physical productivity of up to 2 per cent per annum). However, because of the increased prices it has paid for its inputs, the cost-effectiveness of this programme has declined over the study period. Because of the lack of health outcome measurement in the NHS (other than survival data), we are unable to say with any confidence whether it is securing improvements in the quality of life after treatment. However, we have demonstrated how this might be done, using health status measures of before and after treatment based on SF36 data from BUPA. This analysis was merely illustrative, for CABG and PTCA procedures only, and we had to make many heroic assumptions in incorporating the data into the index. However, for these two interventions, we found that consideration of the quality of health outcomes added about 0.2 per cent per annum to the estimates of productivity growth. We believe that the NHS should give serious consideration to collecting outcome data routinely across a wide range of procedures.

Circulatory disease in the NHS: measuring trends in hospital costs and output 49
7. Implications for policy and future research In recent years there has been a great deal of interest in ‘macro’ measures of NHS productivity. These are important when deciding how much public money to devote to the NHS, and in holding the NHS to account. However, it is also important to gain an understanding of the productivity of individual programmes of care, so as to ensure that resources are allocated efficiently within the NHS. Hitherto, such information has not been available. This report is an exploratory study of the feasibility and usefulness of developing measures of growth in outputs, costs and productivity of a single programme of care within the NHS: hospital treatment of circulatory diseases. Productivity is the ratio of an aggregate measure of outputs to an aggregate measure of inputs for the chosen programme of care. The key methodological challenges are (i) choosing the appropriate measures of NHS activities (ii) adjusting those measures for the ‘quality’ of care, (iii) aggregating the measures into a single measure of output (iv) identifying the associated inputs, in the form of a single measure of costs (v) tracking these measures consistently over time. We have demonstrated that it is feasible, using hospital spells as the unit of activity, to develop quite refined models of the output of a programme of care. The development of healthcare resource groups (HRGs) has assisted greatly in this endeavour, yielding estimates of costs as well as counts of activities. For other programmes of care, outside the hospital setting, future challenges will include developing analogous measures of activity in a community and primary care setting, and incorporating drugs and other prescribing into the model. We have incorporated measures of the quality of care into the models, using mortality as the measure of quality. This is clearly crude, but the recent improvement in survival rates in many procedures for circulatory disease yields quite a large improvement in estimates of annual rates of output growth. Output growth based on activity alone is estimated to be on average 3.90 per cent per annum, whilst incorporation of survival data increases this to 4.48 per cent. Routine collection of measures of health outcome by the NHS is in our view an urgent priority, for numerous reasons, such as improved patient care, informing patient choice, surveillance of clinical performance, and resource allocation. In the context of this report, it would also permit the development of more secure measures of output growth, based on the health improvement experienced by patients as a result of NHS treatment. We have shown how this can be achieved, using data for just two procedures collected by BUPA over the study period. This illustration suggests a modest additional improvement in productivity, arising from improved health outcomes in the two procedures. Our view is that – at this stage of development – health outcomes are the most important elements of quality to incorporate into the model of NHS output. However, there is also a case for exploring the feasibility and usefulness of incorporating non-health aspects of NHS quality into the model, such as measures of the patient experience and waiting time. Other aspects of output that may be important in some programmes of care include the benefits of treatment to the patient’s carers, and the implications of NHS activities for implications for labour productivity and social care expenditure. A crucial methodological consideration concerns the weights to be applied to the separate NHS output activities. The diverse hospital spells that make up this programme of care do not confer equal patient benefits. We have followed the conventional practice in weighting treatments according to their estimated costs, acknowledging that this is far from ideal. In principle, the weights attached to each activity should reflect the average ‘health gain’ of the treatment. In practice, this is rarely available. Again, routine adoption by the NHS of outcome measurement would address this difficulty. Perhaps the most problematic aspect of any attempt at measuring productivity below the ‘whole system’ level is the apportionment of NHS inputs between different programmes of care. We have been forced to use NHS reference costs as the basis for input measurement, again acknowledging that this is a rough and ready solution. It is questionable whether development of new instruments for accurate input measurement is a good use of NHS information resources. Rather, we feel that the requirements of productivity measures should inform the future refinement of reference costs. This might yield estimates of physical resources used, as well as costs.

50 CHE Research Paper 21
Finally, this study has emphasized the measurement of productivity growth. There is also a need to compare the levels of productivity between different programmes. This is a more challenging and longer term research agenda. However, it would yield additional benefits, most importantly in comparing the value for money of different programmes. This study has demonstrated that it is feasible to develop models of productivity growth for programmes of NHS care. This is an important undertaking for informing resource allocation and purchasing decisions in the NHS. Our tentative conclusion is that, whilst there will always be uncertainty in the estimates derived, this represents an important extension of the work in progress at the Office for National Statistics in measuring whole system productivity change, and we advocate further investigation of other programmes of care, in particular those embracing significant community and prescribing activities.

Circulatory disease in the NHS: measuring trends in hospital costs and output 51
References Atkinson, T. (2005) Atkinson Review: Final Report – Measurement of Government Output and Productivity for the National Accounts; Palgrave Macmillan. Berndt ER, Cutler DM, Frank RG, Griliches Z, Newhouse JP, and Triplett J.(2001) ‘Price Indexes for Medical Care Goods and Services – An Overview of Measurement Issues’, Chapter 4 in David M. Cutler and Ernst R. Berndt, eds., Medical Care Output and Productivity; Chicago, Chicago University Press. Castelli A, Dawson D, Gravelle H. and Street A. ‘Improving the measurement of health system output growth’, Health Economics, forthcoming. Cockburn IM and Anis AH. (2001) ‘Hedonic Analysis of Arthritis Drugs’, Chapter 11 in David M. Cutler and Ernst R. Berndt, eds., Medical Care Output and Productivity; Chicago, Chicago University Press. Compendium for Health Statistics - 15th Edition 2003-2004, Office of Health Economics, 2003. Culyer AJ. (2005) The Dictionary of Health Economics; Edward Elgar Publishing Ltd. Cutler,DM, McClellan M, Newhouse JP and Remler D. (2001) ‘Pricing Heart Attack Treatments’, Chapter 8 in David M. Cutler and Ernst R. Berndt, eds., Medical Care Output and Productivity; Chicago, Chicago University Press. Dawson D, Gravelle H, Kind P, O'Mahony M, Street A, Weale M, with the assistance of: Castelli A, Jacobs R, Macran S, Quinn C, Stevens P, and Stokes L. (2004) ‘Developing new approaches to measuring NHS outputs and productivity’. Centre for Health Economics: York. CHE Technical Paper Series no. 31. Dawson D, Gravelle H, O'Mahony M, Street A, Weale M, Castelli A, Jacobs R, Kind P, Loveridge P, Martin S, Stevens P and Stokes L. (2005) ‘Developing new approaches to measuring NHS outputs and productivity’. Centre for Health Economics; Research paper 6. Available at http://www.york.ac.uk/inst/che/pdf/rp6.pdf Department of Health. (1992) Health of the Nation– A Strategy for Health in England. London: Her Majesty’s Stationery Office. Department of Health. (1999) Saving Lives: Our Healthier Nation. London. The Stationery Office. Department of Health. (2000) ‘National Service Framework for Coronary Heart Disease – Modern Standards & Service Models’, Department of Health. Available at www.dh.gov.uk/PolicyAndGuidance/HealthAndSocialCareTopics/CoronaryHeartDisease/CoronaryArticle/fs/en?CONTENT_ID=4108602&chk=nf93gd Department of Health. (2005) ‘The Coronary Heart Disease National Service Framework – Leading the way, Progress report’. Department of Health. Available at www.dh.gov.uk/assetRoot/04/10/52/82/04105282.pdf Department of Health. (2005a) ‘Healthcare Output and Productivity: Accounting for Quality Change’. Department of Health; Available at: www.dh.gov.uk/assetRoot/04/12/42/67/04124267.pdf Department of Health. (2005b) Technical paper 1: ‘The Routine Use of Patient Reported Health Outcome Measures (PROMs) in Short-Stay Elective Care Environments’. Department of Health. Available at www.dh.gov.uk/assetRoot/04/12/42/68/04124268.pdf Department of Health (2005c) Technical paper 2: ‘Use of statins and calculation of value weight’, Department of Health. Available at www.dh.gov.uk/assetRoot/04/12/42/69/04124269.pdf

52 CHE Research Paper 21
Department of Health (2005d) Technical paper 3: ‘Using the GP contract quality and outcomes framework for quality adjustment’. Department of Health. Available at www.dh.gov.uk/assetRoot/04/12/42/70/04124270.pdf Department of Health (2005e) Technical paper 4: ‘Management of Angina’, Department of Health. Available at http://www.dh.gov.uk/assetRoot/04/12/42/71/04124271.pdf Department of Health (2005f) Technical paper 5: ‘Survival rates for Patients Admitted to Hospital with Myocardial Infarction’. Department of Health. Available at http://www.dh.gov.uk/assetRoot/04/12/42/72/04124272.pdf Department of Health (2005g) Technical paper 6: ‘Ambulance Response Times for Patients with Cardiac Arrest’, Department of Health. Available at http://www.dh.gov.uk/assetRoot/04/12/42/73/04124273.pdf Department of Health (2005h) Technical paper 7: ‘Quality Adjustment Based on Patient Experience Surveys’, Department of Health. Available at http://www.dh.gov.uk/assetRoot/04/12/42/74/04124274.pdf Gravelle, H. and Smith D. (2001) ‘Discounting for health effects in cost-benefit and cost-effectiveness analysis’. Health Economics; vol 10, pp 587-599. Henderson RA, Pocock SJ, Sharp SJ, Nanchahal K, Sculper MJ, Buxton MJ and Hampton JR (1998) ‘Long term results of RITA-1 trial: clinical and cost comparisons of coronary angioplasty and coronary-artery bypass grafting’, The Lancet; 352. Leatherman, S and Sutherland, K. (2005) 'The quest for Quality in the NHS – A chartbook on quality of car in the UK. The Nuffield Trust. Mai, N, (2004) ‘Measuring health care output in the UK: a diagnosis based approach’, Economic Trends; 610. ONS, (2004) ‘Public Service Productivity: Health, Office for National Statistics’, October 2004. Available at http://www.statistics.gov.uk/CCI/article.asp?ID=1030&POS=2ColRanks=1&Rank=224 ONS, (2006) ‘Public Service Productivity: Health, Office for National Statistics’, February 2006. Available at http://www.statistics.gov.uk/CCI/article.asp?ID=1447&Pos=&ColRank=1&Rank=374 Pauly, MV (1999) ’Medical care cots, benefits, and effects: conceptual issues for measuring price changes’, mentioned in Dawson et al. (2005). Unal B, Critchley JA, Capewell S. (2005) ‘Modelling the decline in coronary heart disease deaths in England and Wales, 1981-2000: comparing from primary prevention and secondary prevention’, British Medical Journal; doi:10.1136/bmj.38561.633345.8F. Williams A. (1985) ‘The Economics of coronary artery bypass grafting’, British Medical Journal; 291. WHO (1997) ‘The world health report 1997 - conquering, suffering, enriching humanity’. Available at http://www.who.int/whr/1997/en/ WHO (2005) Programmes and projects, Quality of Health Systems. Available at http://www.euro.who.int/eprise/main/who/progs/qhs/Home WHO (2006) STEPwise Approach to Stroke Surveillance. Available at http://www.who.int/chp/steps/en/
Circulatory disease in the NHS: measuring trends in hospital costs and output 53
Appendix 1: Literature review A.1 Most recent contributions to the UK debate on NHS output and productivity measurement There has in recent years been increased interest in measuring the value of output produced within non-market services, such as health care and education. In the UK, this culminated in 2005 in the publication of the report by Sir Tony Atkinson on the measurement of government output in the National Accounts. This has led to the establishment within the Office for National Statistics of the UK Centre for the Measurement of Government Activity (UKCeMGA), with the remit of making operational Sir Tony’s recommendations. Specifically UKCeMGA has initiated a series of reports on measuring the productivity of the NHS. This has been informed by research carried out by the Centre for Health Economics and the National Institute for Economic and Social Research (CHE/NIESR) and the Department of Health. This section briefly summarises progress to date. A.1.1 Atkinson Review and its recommendations on the measurement of quality change in health care In 2003, Sir Tony Atkinson was asked to conduct an independent review of the measurement of government output in the National Accounts. The terms set by the National Statisticians were:
‘To advance methodologies for the measurement of government output, productivity and associated price indices in the context of National Accounts, recognising: a) the full scope of government outputs; b) differences in the nature and quality of these outputs over time; c) the relationship between government outputs and social outcomes; d) the need for comparability with measures of private sector services’ output and costs; e) the existing work of the Office for National Statistics (ONS); and f) the appropriate measurement of inputs, including quality and the distinction between resource and capital, so that, together with the measurement of output, light can be thrown on developments in government productivity’ (Atkinson, 2005).
The Review has focused both on general ways of dealing with the subject, providing a methodological framework, setting out the principles upon which National Statisticians should refer as a basis for measuring government output, inputs and productivity. Atkinson Review refers to the latter as a ‘principled framework’ made of nine principles. 12 The principles underlie the detailed recommendations of the report. The report also considers four major spending functions of government13 and moves on in providing specific recommendations for each of them. The four functions on which the Atkinson Review team focused are: Health, Education, Public Order and Safety, and Social Protection. For the purpose of this report our interest is on Health only. Principle B of Atkinson Review is of particular importance to us here as it states that ‘the output of the government sector should in principle be measured in a way that is adjusted for quality, taking account of the attributable incremental contribution of the service to the outcome’. The measurement of quality change may be achieved in three different ways (para 4.25):
Differentiating the services, in order to form homogenous groups of categories. Quality change can then be captured by changes in the proportion of different categories;
Defining the volume measure in terms of the degree of success in achieving the outcome;
and
Basing the volume measure on the level of activity, with a quality adjustment that is ‘marked up or down’ by a percentage reflecting indicators of success and the contribution of the service to that success.
12 For a full list of the nine principles, please see Atkinson (2005). 13 These are four of the ten broad functions identified in the ‘Classification of the functions of government’ or COFOG as provided in the System of National Accounts 1993 (UN, OECD, IMF, CEC and World Bank). The ten functions are: General Public Services; Defence; Public Order and Safety; Economic Affairs; Environmental Protection; Housing and Community Amenities; Health, Recreation, Culture and Religion; Education and Social Protection.

54 CHE Research Paper 21
The Atkinson Report qualifies it further when it proposes that in measuring the output of public services these should be aggregated in a way that takes account of the benefit it procures to society (social valuation) rather than the costs that are incurred in their production. Hence, the indication to use ‘value weights’ as opposed to ‘cost weights’ whenever the former are available (para 6.17 and recommendation 6.5). Another principle that seems to us of particular importance for the measurement of the output of health care sector is Principle C. It emphasises the importance of the ‘[…] complementarity between private and public output, hence allowing for increased value of public services in an economy with rising real GDP’. Translated into health, this means that health becomes an increasingly valuable characteristics of an individual in our economy. It is undeniable that ‘rising real wage rate means that we attach a higher valuation to days lost through sickness absence’. The report therefore cautiously recommended that the financial value attached to Quality Adjusted Life Years should be adjusted over time, with Gravelle and Smith (2001) estimating this increase to be 1.5 per cent (in real terms) per year. The Department of Health (see following sub-section) decided to incorporate the adjustment into its preferred measure of NHS output growth. However, UKCeMGA is still in the process of consulting on the appropriateness of the adjustment. Chapter 8 of the Atkinson report sets out recommendations specifically for the government function ‘Health’. Atkinson’s report, firstly, acknowledges that some improvements in the measurement of healthcare sector output have already been made by ONS in its National Accounts. These improvements14 mainly relate to the introduction of an extended activity based index, weighted by cost weights as collected in the DH National Schedule of Reference Costs15, It suggests, however, that further improvements (recommendations 8.1 - 8.4) are needed. Atkinson Review identifies four main dimensions for understanding quality of health care: a) saving lives and extending life span; b) preventing illness and mitigating its impact on the quality of life; c) speed of access to treatment; and d) quality of patient experience. Each of these domains is analysed separately in the report16. These domains of health care also informed the research undertaken by CHE/NIESR, (see below). The investigation of the four dimensions of quality of care in the report lead to recommendation 8.5:
a) a number of dimensions of quality should be measured, with results weighted together by marginal social valuation: more work would be required to underpin these weights;
b) a range of expertise should be used to develop quality measures, including public health
medicine, epidemiology, health service management, health informatics and health economics;
c) ONS and the health departments should assess options for collecting new information on
health outcomes resulting from NHS treatment, with particular consideration to the needs ONS has for measurement of change over time, rather than cross-sectional data sets which are useful to health departments for other purposes;
d) ONS and the health departments should consider studies of changing treatment patterns for
particular major disease groups to assess whether these could provide useful estimates of improved health outcomes resulting from changes in clinical practice;
e) ONS and the health departments should explore the data set on quality standards in general
practice, resulting from the new GP contract, to see whether this could be the basis for a measure of quality change;
f) ONS and the health departments should consider whether, with advice from the National
Institute for Clinical Excellence, it might be possible to identify treatments where marginal valuation and cost weights are very different, and explore the difference in output growth resulting from use of estimated marginal valuation instead of cost weights;
14 For current methods on output growth measurement of ONS up until the publication of the report, see Atkinson (2005) para 8.15 – 8.24. 15 For further details on the DH National Schedule of Reference Cost (also referred to as Reference Cost) see Section 3. 16 For the detailed analysis see Atkinson (2005) para 8.46 – 8.59.

Circulatory disease in the NHS: measuring trends in hospital costs and output 55
g) ONS and the health departments should develop a measure of quality change based on
speed of access to elective treatment, using the Hospital Episode Statistics data set and taking account of non-linearity, with further developments if new measures of total waiting time are introduced;
h) ONS and the health departments should explore whether measures of quality change could
be developed from information sources for time taken for admission to hospital from accident and emergency departments, time before seeing a general practitioner and ambulance emergency response times;
i) ONS and the health departments should explore whether measures of quality change over
time could be based on the national patient survey programme which measures aspects of patient experience.
A.1.2 Developing new measures of output growth and productivity: the CHE/NIESR approach The CHE/NIESR team was commissioned by the Department of Health to develop new approaches to measure NHS output and productivity and to attempt some empirical estimation of the most promising approaches to measuring productivity change subject to data availability. Traditionally, the Department of Health and the Office for National Statistics had measured health care sector output by means of a cost weighted activity index. This index had obvious drawbacks 1) it implied that costs correctly reflect the value that society places on any NHS activity at the margin; 2) a move towards cost saving treatments will reduce the value of output produced and hence not correctly reflect their true value; 3) the unit of measurement is simply activities failing to take into account of any of the characteristics (quality adjustors) of the health care process that patient may and do clearly value. The Department of Health has in the past looked for indicators of the characteristics of health care that are of importance to patients. NHS patients were interviewed to identify aspects of the process of care to which patients are particularly interested in and hence attach value. The main attributes, as Dawson et al.(2005) report, are: improvement in health state, waiting time, choice of date for treatment and certainty of date of treatment, food, physical environment just to mention a few.17 Dawson et al. (2005) developed an output measure that tries to overcome some of the limitations of the old cost weighted activity index. First of all, their index reflects the idea that the “produce” of the health care sector is not simply activities, such as diagnostic tests, outpatient visits, operative procedures, etc. They actually distinguish between activities, outputs and outcomes of the health care sector. Activities refer to counts and numbers of operations, diagnostic tests, procedures, etc. Outputs are to be understood as a bundle of activities that are required by any course of treatment provided by the health care system. Their main focus is, however, on outcomes and on how to incorporate them into a new measure of NHS output growth. Outcomes constitute all the characteristics mentioned above that are valuable to individuals in their contact with the health care sector as patients, and therefore contribute to the ‘quality’ of care. Dawson et al. (2005) suggest an ideal index (Laspeyre’s form) to capture the value produced by the NHS. This ideal index adjusts volumes of activity to take account of changes in quality. In particular, it incorporates adjustments for health outcomes, life expectancy, and it also takes into account any possible detrimental effect caused by having to wait for treatment. Weights are attached to these characteristics that reflect the marginal value that society places on them.
(A.1) ( ) ( )[ ][ ]( ) ( )[ ][ ] WjtLj h
Lrjjtjt
WjtLj hLr
jjtjtxqyt wrekax
wrekaxtL
tL
I ππ
ππ
−−−
−−−=
∑∑
−
+−
+++
/1
/1 1111
17 For a full list see Dawson et al (2004a).
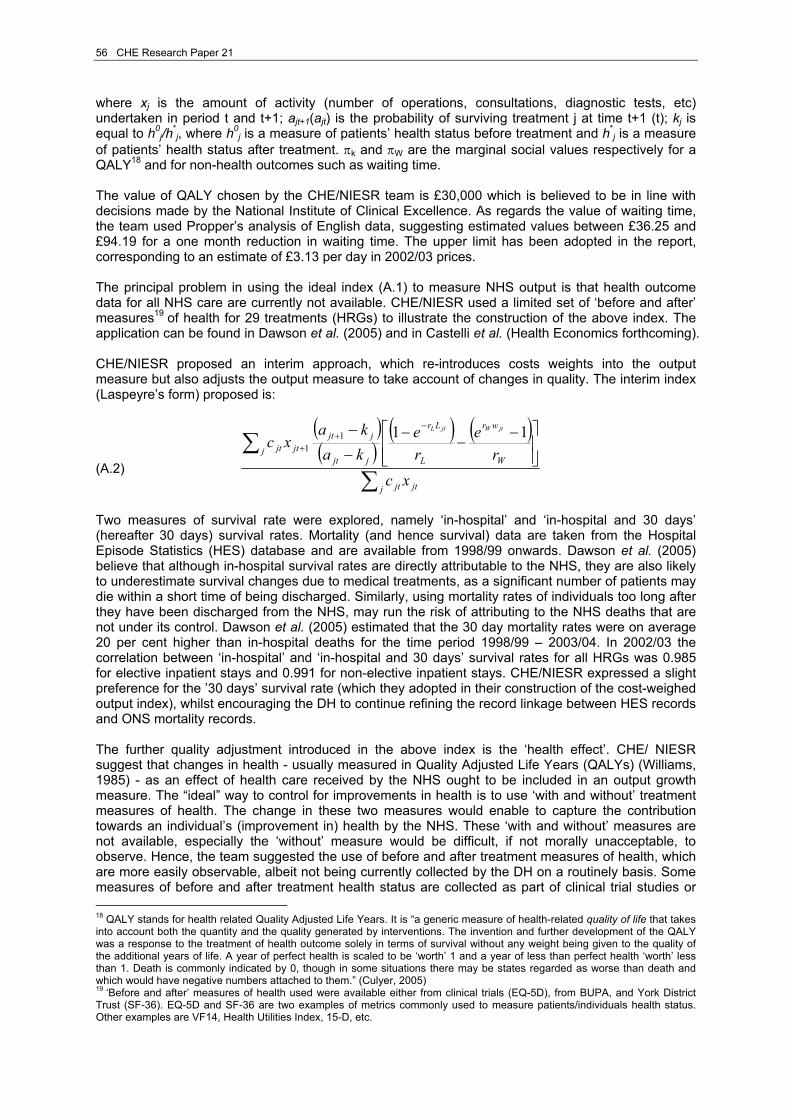
56 CHE Research Paper 21
where xj is the amount of activity (number of operations, consultations, diagnostic tests, etc) undertaken in period t and t+1; ajt+1(ajt) is the probability of surviving treatment j at time t+1 (t); kj is equal to h0
j/h*j, where h0
j is a measure of patients’ health status before treatment and h*j is a measure
of patients’ health status after treatment. πk and πW are the marginal social values respectively for a QALY18 and for non-health outcomes such as waiting time. The value of QALY chosen by the CHE/NIESR team is £30,000 which is believed to be in line with decisions made by the National Institute of Clinical Excellence. As regards the value of waiting time, the team used Propper’s analysis of English data, suggesting estimated values between £36.25 and £94.19 for a one month reduction in waiting time. The upper limit has been adopted in the report, corresponding to an estimate of £3.13 per day in 2002/03 prices. The principal problem in using the ideal index (A.1) to measure NHS output is that health outcome data for all NHS care are currently not available. CHE/NIESR used a limited set of ‘before and after’ measures19 of health for 29 treatments (HRGs) to illustrate the construction of the above index. The application can be found in Dawson et al. (2005) and in Castelli et al. (Health Economics forthcoming). CHE/NIESR proposed an interim approach, which re-introduces costs weights into the output measure but also adjusts the output measure to take account of changes in quality. The interim index (Laspeyre’s form) proposed is:
(A.2)
( )( )
( ) ( )
∑
∑⎥⎥⎦
⎤
⎢⎢⎣
⎡ −−
−−
− −+
+
j jtjt
W
wr
L
Lr
jjjt
jjtjtjt
xcr
ere
kaka
xcjtWjtL 111
1
Two measures of survival rate were explored, namely ‘in-hospital’ and ‘in-hospital and 30 days’ (hereafter 30 days) survival rates. Mortality (and hence survival) data are taken from the Hospital Episode Statistics (HES) database and are available from 1998/99 onwards. Dawson et al. (2005) believe that although in-hospital survival rates are directly attributable to the NHS, they are also likely to underestimate survival changes due to medical treatments, as a significant number of patients may die within a short time of being discharged. Similarly, using mortality rates of individuals too long after they have been discharged from the NHS, may run the risk of attributing to the NHS deaths that are not under its control. Dawson et al. (2005) estimated that the 30 day mortality rates were on average 20 per cent higher than in-hospital deaths for the time period 1998/99 – 2003/04. In 2002/03 the correlation between ‘in-hospital’ and ‘in-hospital and 30 days’ survival rates for all HRGs was 0.985 for elective inpatient stays and 0.991 for non-elective inpatient stays. CHE/NIESR expressed a slight preference for the ’30 days’ survival rate (which they adopted in their construction of the cost-weighed output index), whilst encouraging the DH to continue refining the record linkage between HES records and ONS mortality records. The further quality adjustment introduced in the above index is the ‘health effect’. CHE/ NIESR suggest that changes in health - usually measured in Quality Adjusted Life Years (QALYs) (Williams, 1985) - as an effect of health care received by the NHS ought to be included in an output growth measure. The “ideal” way to control for improvements in health is to use ‘with and without’ treatment measures of health. The change in these two measures would enable to capture the contribution towards an individual’s (improvement in) health by the NHS. These ‘with and without’ measures are not available, especially the ‘without’ measure would be difficult, if not morally unacceptable, to observe. Hence, the team suggested the use of before and after treatment measures of health, which are more easily observable, albeit not being currently collected by the DH on a routinely basis. Some measures of before and after treatment health status are collected as part of clinical trial studies or 18 QALY stands for health related Quality Adjusted Life Years. It is “a generic measure of health-related quality of life that takes into account both the quantity and the quality generated by interventions. The invention and further development of the QALY was a response to the treatment of health outcome solely in terms of survival without any weight being given to the quality of the additional years of life. A year of perfect health is scaled to be ‘worth’ 1 and a year of less than perfect health ‘worth’ less than 1. Death is commonly indicated by 0, though in some situations there may be states regarded as worse than death and which would have negative numbers attached to them.” (Culyer, 2005) 19 ‘Before and after’ measures of health used were available either from clinical trials (EQ-5D), from BUPA, and York District Trust (SF-36). EQ-5D and SF-36 are two examples of metrics commonly used to measure patients/individuals health status. Other examples are VF14, Health Utilities Index, 15-D, etc.

Circulatory disease in the NHS: measuring trends in hospital costs and output 57
routinely by BUPA and York Trust (limited to hip and knee replacements). As Castelli et al. (Health Economics, forthcoming) state ‘trial data tend to be based on populations different from those treated in practice’. Nonetheless, they show how these snapshot estimates can be used in an interim index to investigate their effect on NHS output growth index. Data were available only for 29 treatments which were mapped to Healthcare Resource Groups (HRGs) (see Box 3 for a definition of HRG) for elective and day cases only. For the rest of the elective and day case HRGs an estimate of k = 0.8 was chosen20. Non-electives were assigned a value equal to half the value of k. Another characteristic of health care goods and service that the CHE/NIESR team incorporated into their output growth index is waiting time. Dawson et al. (2005) suggest that waiting time can affect individuals in two ways. Individuals may dislike having to wait to receive treatment irrespective of the detrimental effect that waiting may have on their health. In this case, waiting time is regarded as a separate characteristic of health care. Further, having to wait may jeopardise the health gain from treatment, as well as causing distress and pain to the individual. In this case waiting may be considered as a scaling factor multiplying the health effect. Two different ways of discounting waiting time were investigated: discounting to start of wait and discounting to date of treatment with charge for waiting. The ‘interim’ index (A.2) introduces waiting times as a scaling factor, with waiting time discounted to date of treatment with a charge for waiting. The preference for this metric is based on the fact that ‘[…] increased dispersion of waiting times would reduce quality adjusted output, whereas discounting to date placed on list implies that patients would prefer increased dispersion’ (Dawson et al, 2005a). The resulting estimates of NHS output growth are shown in table A.1. Table A.1 Cost Weighted Output Indices, with CHE/NIESR adjustments
CWOI unadjusted
CWOI with survival and health effect
CWOI with survival, health effect, life expectancy and waiting time
1998/99 - 1999/00 2.61% 2.03% 2.22% 1999/00 - 2000/01 2.11% 2.36% 2.26% 2000/01 - 2001/02 3.85% 3.80% 3.74% 2001/02 - 2002/03 5.07% 5.87% 5.78% 2002/03 - 2003/04 4.43% 4.89% 4.93% Average growth 3.62% 3.79% 3.79% Source: Authors’ elaboration of Dawson et al. (2005) NHS input side was also investigated by the CHE/NIESR team. Labour is the most important input used in producing health care goods and services, accounting for about 75 per cent of total hospital expenditures (Dawson et al, 2005). Main data sources for labour were the NHS workforce census carried out by the DH and the Labour Force Survey. The former was used to obtain a headcount measure of labour input; whilst the latter was used to incorporate hours worked, quality adjustments and also to adjust for agency staff. Quality adjustments on labour regarded their qualifications and skills. The data show evidence of upskilling across the whole NHS workforce, as well as a decline in the proportion of workforce with no skills. Further quality adjustments were carried out on doctors and on training received by individuals above their certified qualifications. Data on intermediate input for hospital sector were obtained from the Trust Financial Returns (TFR). These were deflated by a modified version of the DH Health Services Cost Index to derive a volume measure. CHE/NIESR identified as intermediate input all ‘current non pay expenditure items in the TFR, and hence excluded all purchases of capital equipment and capital maintenance expenditures’.
20 Variants k= 0.7 and k= 0.9 were also studied.

58 CHE Research Paper 21
It appears that hospital drugs in intermediate expenditure have been rising rapidly from 24 per cent in 1998/99 to 34 per cent in 2003/04. Capital inputs used by CHE/NIESR are the same as the one employed by the Office for National Statistics (ONS) in their measure of Health Sector Productivity. The combination of input shares with growth in real terms allows calculating total input growth and subtracting this from output growth yields total factor productivity growth rates. These are summarised in table A.2 Table A.2 Total factor productivity growth
Unadjusted Includes CWOI with survival, health, life expectancy and waiting time adjustments
1998/99 - 1999/00 -2.33% -2.71% 1999/00 - 2000/01 0.55% 0.69% 2000/01 - 2001/02 -2.12% -2.22% 2001/02 - 2002/03 -1.86% -1.19% 2002/03 - 2003/04 -2.97% -2.51% Average growth -1.75% -1.59% Source: Authors’ elaboration of Dawson et al. (2005) A.1.3 The Department of Health contribution to healthcare sector productivity measurement In 2005 the Department of Health published the paper ‘Healthcare Output and Productivity: Accounting for Quality Change’. The paper takes on board the general principles and recommendations outlined in the Atkinson Review. It critically summarises key concepts and results from the research report commissioned by the DH from CHE/NIESR and makes further proposals for quality adjustment, which are published in 7 technical papers.21 We concentrate on four of the seven further quality adjustments explored by the DH as these are of particular interest to the topic of this report. The four22 mentioned quality adjustments are analysed at disease level, taking forward one of the recommendation of the Atkinson Review to explore a disease based approach as suggested by Professor D. Cutler. The DH focuses on coronary heart disease (CHD). In March 2000 the DH published a National Service Framework (NSF) in which a number of recommendations are set out to improve treatment for CHD both for primary and secondary prevention and treatment. Some substantial improvements have already been highlighted in the 2005 progress report, through reduced adult smoking prevalence (from 28 per cent down to 25 per cent); lives saved from use of statins (from 2900 in year 2000 to 9000 in year 2004); shorter waits for heart surgery and angioplasty (patients waited for no more than 3 months as from April 2005); and more patients with heart attacks were given thrombolysis within 30 minutes of arrival in hospital (from 38 per cent in year 2000 to 84 per cent in year 2004). This evidence encouraged the DH to carry out disease based analysis on each of the contributors to improved health outcomes in CHD. In particular, the DH investigates four aspects of care:
21 The DH paper as well as the 7 technical papers are available at www.dh.gov.uk/publications. 22 The DH produced a further technical paper (TP4) related to CHD on the impact on health outcomes of reduced ambulance response time for patients with cardiac failure. No quality adjustment was , however, added by the DH on this regard on the overall NHS output growth index.

Circulatory disease in the NHS: measuring trends in hospital costs and output 59
(A) the effect of increased use of statins ‘[…] to control cholesterol and reduce risks of heart attacks, strokes and development of angina, including analysis of the value (in terms of added life years), based on risk factors of different groups who take statins’ (DH, 2005a). The analysis is carried out using the Health Survey for England (HSE) 2003, which contained questions and clinical measures related to CHD. The survey contains data on pre-existing CHD and stroke, diabetes, total cholesterol, HDL cholesterol, blood pressure, smoking status and of course age and sex. Information on this variables was used to produce estimates on health gains from statins used in the population. The approach used in the Technical Paper Nr. 2 (TP2) makes use of evidence from clinical trials on effectiveness of statins for different groups. The paper shows that statin therapy in 2003 added 77,000 life years, compared with no therapy, for the 1.9 million patients who took the drug. The marginal benefit of each prescription is of 0.0038 life years. This translates to a value of each prescription of £115, assuming that the current evaluation of each life year as from NICE is £30.000. The unit cost for statin is, however, only £27. Thus, using £115 as the “value” weight for statin in the output index, adds an average growth of 0.81 per cent per year to the overall NHS output growth index. This contribution was incorporated by the DH into their overall figure for NHS output growth index. (B) the effect of improved blood pressure control and reduced cholesterol for patients with CHS as shown from GP records. The DH general aim was to develop a quality adjustment for primary medical care. As data are currently not available for the whole of the general practice, the DH focuses its attention on data currently available which relate to CHD. DH proposed using the ten ‘partial outcome indicators’ included in the Quality and Outcomes Framework (QOF) for payment of general practices23 (introduced in April 2004) to measure the impact of general practice on patients’ health. A universal time series of these payments is yet not available, hence the DH used data from the pre-existng QResearch database of a sample of general practices. The database consists of 3 million registered patients and information similar to the QOF indicators is available from 2001/02. The paper reports that the QResearch data show an average annual increase of 23 per cent in cholesterol control for patients with known CHD between January 2002 and 2004. Blood pressure control for CHD patients improved by 11 per cent per year, whilst blood pressure control for patients with hypertension improved by 22 per cent per year for the same time period. DH set out a general method to combine evidence from different partial outcome indicators by aggregating them according to the prevalence of the condition.24 Technical Paper Nr. 3 shows an average increase of 1.2 per cent per year in primary care medical services, which translates in an increase of 0.16 per cent per year, for the two years for which data is available, for the overall quality adjusted NHS output growth index. (C) the effect of improved surgical and medical management of angina. The DH technical paper Nr. 4 focuses on the NHS output produced in treating patients who suffer from angina. The analysis of the quality improvement induced by treatment of angina is said to overlap with that of statins, as the prescription of statins is very common for patients with diagnosed angina. The treatments usually suggested to patients with angina conditions range from beta blockers to revascularisation (also knows as angioplasty). In particular, revascularisation procedures are usually undertaken to relief the patients from the angina symptoms. And it is on these procedures that the paper focuses. Volumes of revascularisations performed are shown to have increased rapidly in the time period 1998 to 2003, relative to coronary bypass grafts (CABG). A simple cost-weighted activity index would record a smaller increase in the value of activity produced by the NHS, if patients that would have received CABG receive angioplasty instead. So, in order to overcome this paradox, this Technical Papers analyses the QALYs associated with the two treatments, as well as with medical management.
23 The Quality and Outcomes Framework (QOF) is a component of the new General Medical Services contract for general practices, introduced from 1 April 2004. The QOF rewards practices for the provision of quality care, and helps to fund further improvements in the delivery of clinical care. Participation by practices in the QOF is voluntary, but many practices with Personal Medical Services (PMS) contracts, as well as most practices on General Medical Services (GMS) contracts, are participating in the QOF. For participating practices, the QOF measures practice achievement against a range of evidence-based clinical indicators and against a range of indicators covering practice organisation and management. Practices score points according to their levels of achievement against these indicators, and practice payments are calculated from points achieved. 24 Alternative methods used as well as the ideal method are outlined in DH (2005c), pp. 18 – 25.
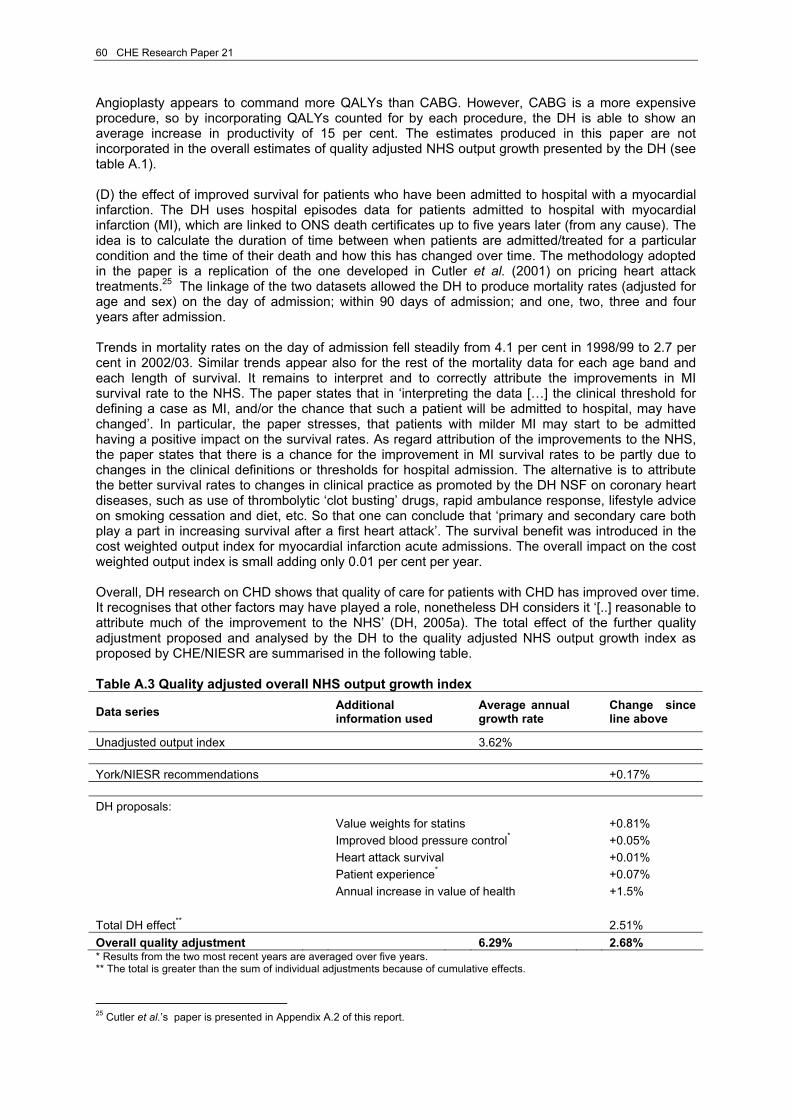
60 CHE Research Paper 21
Angioplasty appears to command more QALYs than CABG. However, CABG is a more expensive procedure, so by incorporating QALYs counted for by each procedure, the DH is able to show an average increase in productivity of 15 per cent. The estimates produced in this paper are not incorporated in the overall estimates of quality adjusted NHS output growth presented by the DH (see table A.1). (D) the effect of improved survival for patients who have been admitted to hospital with a myocardial infarction. The DH uses hospital episodes data for patients admitted to hospital with myocardial infarction (MI), which are linked to ONS death certificates up to five years later (from any cause). The idea is to calculate the duration of time between when patients are admitted/treated for a particular condition and the time of their death and how this has changed over time. The methodology adopted in the paper is a replication of the one developed in Cutler et al. (2001) on pricing heart attack treatments.25 The linkage of the two datasets allowed the DH to produce mortality rates (adjusted for age and sex) on the day of admission; within 90 days of admission; and one, two, three and four years after admission. Trends in mortality rates on the day of admission fell steadily from 4.1 per cent in 1998/99 to 2.7 per cent in 2002/03. Similar trends appear also for the rest of the mortality data for each age band and each length of survival. It remains to interpret and to correctly attribute the improvements in MI survival rate to the NHS. The paper states that in ‘interpreting the data […] the clinical threshold for defining a case as MI, and/or the chance that such a patient will be admitted to hospital, may have changed’. In particular, the paper stresses, that patients with milder MI may start to be admitted having a positive impact on the survival rates. As regard attribution of the improvements to the NHS, the paper states that there is a chance for the improvement in MI survival rates to be partly due to changes in the clinical definitions or thresholds for hospital admission. The alternative is to attribute the better survival rates to changes in clinical practice as promoted by the DH NSF on coronary heart diseases, such as use of thrombolytic ‘clot busting’ drugs, rapid ambulance response, lifestyle advice on smoking cessation and diet, etc. So that one can conclude that ‘primary and secondary care both play a part in increasing survival after a first heart attack’. The survival benefit was introduced in the cost weighted output index for myocardial infarction acute admissions. The overall impact on the cost weighted output index is small adding only 0.01 per cent per year. Overall, DH research on CHD shows that quality of care for patients with CHD has improved over time. It recognises that other factors may have played a role, nonetheless DH considers it ‘[..] reasonable to attribute much of the improvement to the NHS’ (DH, 2005a). The total effect of the further quality adjustment proposed and analysed by the DH to the quality adjusted NHS output growth index as proposed by CHE/NIESR are summarised in the following table. Table A.3 Quality adjusted overall NHS output growth index
Data series Additional information used Average annual
growth rate Change since line above
Unadjusted output index 3.62% York/NIESR recommendations +0.17% DH proposals: Value weights for statins +0.81% Improved blood pressure control* +0.05% Heart attack survival +0.01% Patient experience* +0.07% Annual increase in value of health +1.5% Total DH effect** 2.51% Overall quality adjustment 6.29% 2.68% * Results from the two most recent years are averaged over five years. ** The total is greater than the sum of individual adjustments because of cumulative effects.
25 Cutler et al.’s paper is presented in Appendix A.2 of this report.

Circulatory disease in the NHS: measuring trends in hospital costs and output 61
A.1.4 The Office for National Statistics work on measuring public service productivity on health ONS has established UKCeMGA to synthesize evidence on productivity growth, and develop new methodology in line with the Atkinson recommendations. Of particular interest to us are the papers on health productivity measures: ONS (2006 and 2004). The 2006 paper presents various estimates of change in productivity in public expenditure on health. In particular, it starts by using output measures as included in the current National Accounts. However, recognising that this estimate does not allow for quality changes and taking on board the recommendations outlined in the Atkinson’s Review, the article presents additional estimates that overcome this drawback. ONS, hence, introduces and proposes new methodology that allows for quality change. The methodology which incorporates quality adjustment in their productivity measure draws substantially on work described above. ONS paper critically appraises the work undertaken by CHE/NIESR and by the DH as well as replicating their estimates. The first set of estimates on NHS productivity presented in the ONS paper (2006) is based on current National Accounts estimates of output as in Blue Book 2005. The National Account estimates NHS output growth by means of the conventional cost weighted activity index. Each treatment activity within the NHS is weighted by the unit cost associated with its production. Changes in the volume of NHS activities are registered and adjusted according to the relative weight given to them. This measure produces an average NHS output growth of 3.2 per cent per year, for the period from 1995 to 2004, whilst the correspondent estimates of NHS inputs have increased on average between 3.9 and 4.6 per cent per year. Consequently, the NHS productivity is estimated to have fallen by an average of between 0.6 and 1.3 per cent per year, for the above time period. The paper then incorporates the recommendations of the reports described above. The ONS estimate of NHS output growth for the period 1999 to 2004, including all the quality adjustments discussed, presents an average increase of around 5 per cent per year. The NHS inputs estimate shows an increase between 4.8 and 5.5 per cent during the same period. This means that ONS estimates of NHS productivity growth range from between an average increase of 0.2 per cent per year and an average fall of 0.5 per cent per year. The third set of estimates produced by ONS incorporates the Atkinson Review’s principle C on the increasing value of health in an economy with rising GDP. This new measure of NHS output growth, which includes all the above quality adjustments as well as allowing for the increasing value of health, leads to an average growth in NHS outputs of 6.5 per cent per year over the time period under consideration. It implies an average estimate for NHS productivity growth of between 0.9 per cent per year and 1.6 per cent per year. It is worth noting that the Atkinson Review team advocated caution in introducing this type of adjustment, and the ‘value of health’ adjustment is currently the topic of an ONS consultation. A.1.5 A diagnosis-based approach to measure output growth Mai (2004) proposes a diagnosis-based approach to measure health care output, taking into account technological change and the introduction of innovations in existing treatments, and applies it to coronary heart disease. In particular, she proposes two alternative index measures of health care output which aggregate by patient and diagnosis respectively. This constitutes the main novelty of her indices compared to the Cost Weighted Activity index (CWAI), previously used by ONS26 to measure health care output. Both indices still use cost shares to weight together volumes of output. The two new measures need more complex data rather than just counts of activity. The cost-weighted patient index (CWPI) uses as the volume measure the number of patients treated using a particular treatment. The rationale for using this unit as the basis for the index is that a patient may, when undergoing a particular course of treatment, undergo a number of different activities. Hence, in the
26 We would like to stress here that following the works undertaken both by the Atkinson Review and the CHE/NIESR team on NHS output measure and productivity; the ONS has now incorporated the advices of the above projects and has now introduced a quality adjusted measure of non-market output in health. ONS has since produced two papers on public service productivity: health (2004, 2006), a summary of which was presented earlier in this section.
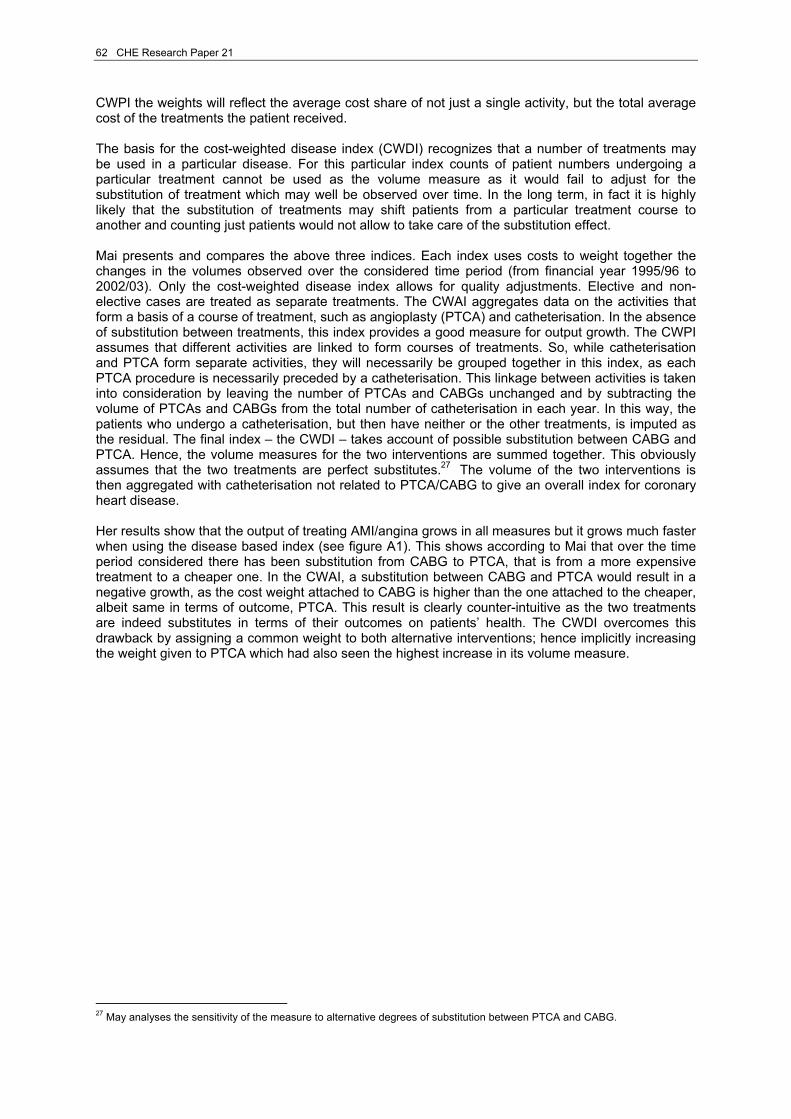
62 CHE Research Paper 21
CWPI the weights will reflect the average cost share of not just a single activity, but the total average cost of the treatments the patient received. The basis for the cost-weighted disease index (CWDI) recognizes that a number of treatments may be used in a particular disease. For this particular index counts of patient numbers undergoing a particular treatment cannot be used as the volume measure as it would fail to adjust for the substitution of treatment which may well be observed over time. In the long term, in fact it is highly likely that the substitution of treatments may shift patients from a particular treatment course to another and counting just patients would not allow to take care of the substitution effect. Mai presents and compares the above three indices. Each index uses costs to weight together the changes in the volumes observed over the considered time period (from financial year 1995/96 to 2002/03). Only the cost-weighted disease index allows for quality adjustments. Elective and non-elective cases are treated as separate treatments. The CWAI aggregates data on the activities that form a basis of a course of treatment, such as angioplasty (PTCA) and catheterisation. In the absence of substitution between treatments, this index provides a good measure for output growth. The CWPI assumes that different activities are linked to form courses of treatments. So, while catheterisation and PTCA form separate activities, they will necessarily be grouped together in this index, as each PTCA procedure is necessarily preceded by a catheterisation. This linkage between activities is taken into consideration by leaving the number of PTCAs and CABGs unchanged and by subtracting the volume of PTCAs and CABGs from the total number of catheterisation in each year. In this way, the patients who undergo a catheterisation, but then have neither or the other treatments, is imputed as the residual. The final index – the CWDI – takes account of possible substitution between CABG and PTCA. Hence, the volume measures for the two interventions are summed together. This obviously assumes that the two treatments are perfect substitutes.27 The volume of the two interventions is then aggregated with catheterisation not related to PTCA/CABG to give an overall index for coronary heart disease. Her results show that the output of treating AMI/angina grows in all measures but it grows much faster when using the disease based index (see figure A1). This shows according to Mai that over the time period considered there has been substitution from CABG to PTCA, that is from a more expensive treatment to a cheaper one. In the CWAI, a substitution between CABG and PTCA would result in a negative growth, as the cost weight attached to CABG is higher than the one attached to the cheaper, albeit same in terms of outcome, PTCA. This result is clearly counter-intuitive as the two treatments are indeed substitutes in terms of their outcomes on patients’ health. The CWDI overcomes this drawback by assigning a common weight to both alternative interventions; hence implicitly increasing the weight given to PTCA which had also seen the highest increase in its volume measure.
27 May analyses the sensitivity of the measure to alternative degrees of substitution between PTCA and CABG.

Circulatory disease in the NHS: measuring trends in hospital costs and output 63
Figure A1 – Trends in output indices for AMI/angina
Source: Mai (2004) A.2 US developments and contributions to the literature on price indices An expanding literature in the US illustrates how to obtain approximate disease specific measures of value for money. Although these measures are developed in the context of price indices for health care, the literature seems closely related to the problem of calculating output indices. In order to get disease specific measures of value for money, data on outcomes need to be available. Further, it is necessary to link disease specific treatments to patients with a particular condition. The American literature so far has concentrated on a number of diseases such as coronary heart disease, mental health, depression, schizophrenia, bipolar disorder and cataract surgery. Here we focus on contributions to the development of price and output indices for coronary heart disease only. Cutler et al. (2001) estimate price indexes for medical care. After illustrating currently used techniques and comparing them to alternative ones, they treat more formally two types of medical care price indexes: a service price index (SPI) and a cost-of-living index (COL). These are then applied to heart attack treatments. The service price index simply calculates the amount of money required in every time period to purchase the same bundle of goods and services. Applied to the health care sector, this requires identifying a representative bundle of medical care goods and services and observing it through time. Unfortunately, the SPI does not have a utility (or value) interpretation. As Cutler et al. (2001) point out in their paper if the quality of a certain bundle of goods and services changes over time the SPI will not be able to capture this, despite the fact that a greater quality of the same amount of goods produces greater utility. Hence, the need to develop an index that allows one not only to measure the value of health care good and services, but also to measure changes in the quality and hence utility of these goods and services. They call it the cost-of-living index. The cost-of-living index is based on patients’ welfare. Consumers purchase goods and services so as to maximise a certain utility function. Consumers’ utility is affected directly by some goods and services that are beneficial per se, such as cars, computers, clothes, etc. Consumers receive utility from consuming health care goods and services as well. In this case, however, the utility produced is indirect in the sense that the benefits derive not from the consumption of health care goods and services but of their indirect (beneficial) effect on individuals’ health. Cutler et al. consider a consumer affected by a series of diseases, indexed by d. For each of this diseases an individual receives

64 CHE Research Paper 21
medical care treatment md(t), a vector of constant-quality treatments. Any change in the quality of a treatment or any new developments in the medical field are registered as additions to the available set of treatments. To simplify we assume a representative consumer who chooses between the consumption of goods and services (other than health care ones) and health. It is also assumed that each person may contract only one disease. The utility function is then
(A.3) ( )[ ]MIM TLEKMHIPMPYUU −−−= ,,,, Where Y denotes an individual’s exogenous income, M denotes medical treatment and PM its price, while I represents the quantity of a constant-quality insurance policy and PI its price. L is leisure time and T denotes time devoted to medical treatments. H represents the individual’s health state which is a function of medical treatment M, medical knowledge K and the environment E. The first term of the utility function represents non-medical care consumption, the second represents health and the third is non-medical care time. It is also worth noting that the equation does not make any assumption about the way medical treatment decisions are taken or medical prices are set. We know that medical care and its price changes over time, as can the medical knowledge, the environment rather than the time dedicated to medical care. Cutler et al. (2001) hence pose the question: what is the correct price index for changes between periods 0 and 1, assuming that the consumer optimises in each period of time? In order to determine the correct price index for medical care treatment for two consecutives years, Cutler et al. consider an additional amount of money C that the consumer needs in period 1 so as to make her indifferent between living in period 1 and 0. In the Laspeyre’s form it will require C to be the solution of the following expression
(A.4) ( )[ ]
( )[ ]00000000
11111111
,,,,,,,,
MIM
MIM
TLEKMHCIPMPYUTLEKMHCIPMPYU−+−−=
=−+−−
C is effectively the change in the cost of living. A positive C indicates an increase in the cost of living. Scaling C by the income to produce utility in period 0 attains a price index. (A.5) cost-of-living = 1 + C/Y Using a first order difference approximation, we can differentiate (A.4) and after rearranging we get:
(A.5)
( ) ( ) ( ) ( ){ }
( )dtdTUU
dtdEHdtdKHdtdMHUUdtIPMPdC
MX
L
EKMX
HIM
/
////
+
++−+≅
where UH is the marginal utility of health, UX is the marginal utility of non-medical consumption, UL is the marginal utility of leisure, assuming dC/dt = UX. The change in the cost of living is made up of three parts: the additional spending on medical care and insurance; the dollar value change in health over time; and the change in the time cost of receiving medical care.
The first term on the right-hand side of equation (A.5) is additional spending on medical care and insurance services over time. Medical care spending may change over time because of either an increase in quantities or prices. It is only an increase in the cost of medical care goods and services, ceteris paribus, that will increase the cost of living. However, if the medical environment changes because a new disease appears, medical care expenditure will likely increase, but Cutler et al. do not consider it as a change in the cost of living, as the latter assumes an unchanged environment. Similarly, and because outcomes are being held fixed, if a treatment becomes obsolete, i.e. less
Circulatory disease in the NHS: measuring trends in hospital costs and output 65
effective, in curing a disease and is replaced by a treatment (drug) that is more effective and also more expensive, the price index should increase as it now reflects ‘the reduced efficacy (quality deterioration) of the older drug’ (Cutler et al., 2001). The second term of equation (A.5) captures the monetary value of change in health over time. As one can see, an improvement (deterioration) can occur through either of the following channels: (a) changes in the quantity of medical care, (b) changes in the knowledge or (c) changes in the environment. Any improvement in health will lower the cost of living, ceteris paribus. The monetary value of the change in health can be calculated by using the marginal rate of substitution between health and other goods (UH/UX) and multiplying the health change by this amount. The last term in equation (A.5) captures the change in the time cost of receiving medical care. If patients’ travel time and waiting time are reduced because of the introduction of more efficient delivery, or if less invasive surgery reduces substantially the recovery of a patient, then ceteris paribus the cost of living decreases. The discussion so far has concentrated on the effects that any change in the components of the cost of living index may have on the index itself for a representative consumer. If we want to aggregate across consumers then several methods are available even when consumers’ preferences differ. The most frequent approach is to weight an individual’s utility by her share in total expenditure: the share weights could be either base period, current period or an average of the two (Törnqvist index). An issue that arises now is how to estimate the values of the variables in the cost of living equations. The alternatives presented in Berndt et al. (2001) are: (i) hedonic analysis to separate the value of services to the patient from pure price effects; (ii) hedonic regressions based on insurance policies, in combination with willingness to pay techniques (e.g. Pauly, 1999); (iii) to make specific assumptions on the way in which medical treatment decisions are made (e.g. Cockburn and Anis (2001) for prescription drugs); (iv) a more direct measurement method that focuses on a particular disease and estimates empirically the changes in treatment costs and medical outcomes for that disease. The latter method is the one used by Cutler et al. (2001) in their application to heart attack. Cutler et al. (2001) explore a disease based approach for their cost-of-living index for heart attacks. In particular, they need to measure and price health improvements after a heart attack has occurred. They use an outcome adjusted index that takes into account of changes in treatment and medical practice. The index also incorporates improvements in the length of life after a heart attack and the extension of life expectancy due to new treatments. Cutler et al. (2001) introduce quality changes via mortality data, although they do explore the use of QALYs as the outcome measure. Their results show ‘substantial reductions in the cost of living for people with a heart attack’. Quality of life after heart attack has improved (or in the worse scenario, has remained the same). Thus, showing a declining quality-adjusted cost-of-living index for the time period considered. This results contrast with that of a service price index, which shows increases in the range 1.5 - 3.5 per cent annually.
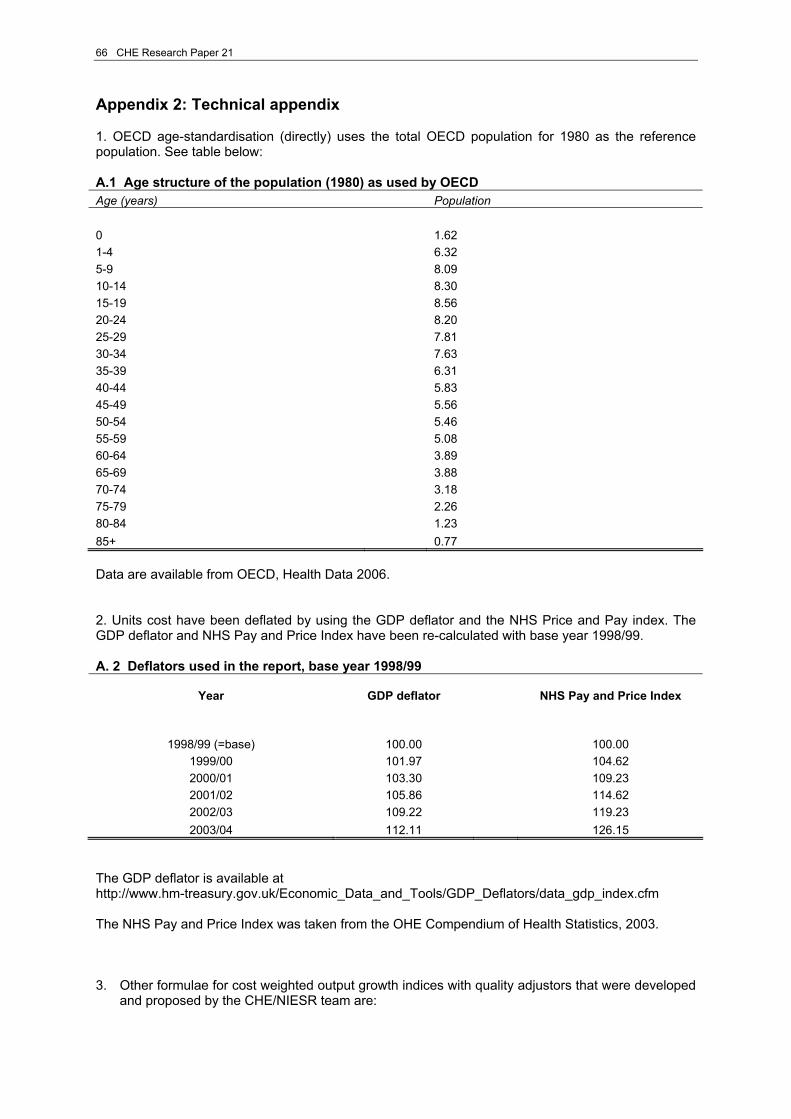
66 CHE Research Paper 21
Appendix 2: Technical appendix 1. OECD age-standardisation (directly) uses the total OECD population for 1980 as the reference population. See table below: A.1 Age structure of the population (1980) as used by OECD Age (years) Population 0 1.62 1-4 6.32 5-9 8.09 10-14 8.30 15-19 8.56 20-24 8.20 25-29 7.81 30-34 7.63 35-39 6.31 40-44 5.83 45-49 5.56 50-54 5.46 55-59 5.08 60-64 3.89 65-69 3.88 70-74 3.18 75-79 2.26 80-84 1.23 85+ 0.77 Data are available from OECD, Health Data 2006. 2. Units cost have been deflated by using the GDP deflator and the NHS Price and Pay index. The GDP deflator and NHS Pay and Price Index have been re-calculated with base year 1998/99. A. 2 Deflators used in the report, base year 1998/99
Year GDP deflator NHS Pay and Price Index
1998/99 (=base) 100.00 100.00
1999/00 101.97 104.62 2000/01 103.30 109.23 2001/02 105.86 114.62 2002/03 109.22 119.23 2003/04 112.11 126.15
The GDP deflator is available at http://www.hm-treasury.gov.uk/Economic_Data_and_Tools/GDP_Deflators/data_gdp_index.cfm The NHS Pay and Price Index was taken from the OHE Compendium of Health Statistics, 2003. 3. Other formulae for cost weighted output growth indices with quality adjustors that were developed
and proposed by the CHE/NIESR team are:

Circulatory disease in the NHS: measuring trends in hospital costs and output 67
Life expectancy
∑
∑ ⎟⎟⎠
⎞⎜⎜⎝
⎛
−
−⎟⎟⎠
⎞⎜⎜⎝
⎛
−
−
=−
−+
+
+
j jtjt
rL
rL
jjt
jjtjtj jt
xct xc
ee
kaka
xc
Ijt
jt
11 1
11
Waiting times Discount to date of treatment with charge for waiting
( ) ( )
( ) ( )
∑
∑
⎥⎥⎦
⎤
⎢⎢⎣
⎡ −−
−
⎥⎥⎦
⎤
⎢⎢⎣
⎡ −−
−
⎟⎟⎠
⎞⎜⎜⎝
⎛
−
−−
−
+
++
j jtjt
w
wr
L
Lr
w
wr
L
Lr
jjjt
jjtjtjt
xcr
ere
re
re
kaka
xcjtwjtL
jtwjtL
11
11 11
1
Discount to date placed on list
( )( )
∑
∑ ⎟⎟⎠
⎞⎜⎜⎝
⎛
−
−⎟⎟⎠
⎞⎜⎜⎝
⎛
−
−
=−−
−−+
+
++
j jtjt
Lrwr
Lrwr
jjt
jjtjtj jt
xct xc
eeee
kaka
xc
IjtLjtw
jtLjtw
11 11
11

68 CHE Research Paper 21