chef manual...document owner: louisa nara, ccps global technical director -3 - document information...
TRANSCRIPT

- 1 -
CHEF Manual Chemical Hazard Engineering Fundamentals
Version: 2.0
Revision Date: 25 March 2019
Document Owner: Louisa Nara, CCPS Global Technical Director


- 3 -
DOCUMENT INFORMATION
Purpose
This document, the CHEF manual, provides an overview of methods and techniques used within the Risk Analysis Screening Tool (RAST). RAST is intended to fill the gap between qualitative and detailed quantita-tive methods.
Version: This is version 2.0
Revised: 25-March-2019
Feedback Request:
Please provide feedback or comments on the content of this document to the RAST Committee, via the CCPS webpage (www.aiche.org/ccps)
Revision History: A complete document history is located at the end of this document.
Disclaimer
It is sincerely hoped that the information presented in this document will lead to an even better safety record for the entire industry; however, neither the American Institute of Chemical Engineers, its consultants, CCPS Technical Steering Committee and Subcommittee members, their employers, their employers officers and directors, nor The Dow Chemical Company, and its employees warrant or represent, expressly or by impli-cation, the correctness or accuracy of the content of the information presented in this document. As between (1) American Institute of Chemical Engineers, its consultants, CCPS Technical Steering Committee and Sub-committee members, their employers, their employer’s officers and directors, and The Dow Chemical Com-pany, and its employees, and (2) the user of this document, the user accepts any legal liability or responsibility whatsoever for the consequence of its use or misuse.
Copyright © 2019
American Institute of Chemical Engineers

- 5 -
TABLE OF CONTENTS
Contents
DOCUMENT INFORMATION ................................................................................................................... 3
Purpose ..................................................................................................................................................... 3
Disclaimer .................................................................................................................................................. 3
TABLE OF CONTENTS ........................................................................................................................... 5
1. INTRODUCTION ................................................................................................................................ 13
Intended Audience ................................................................................................................................... 13
Sections ................................................................................................................................................... 13
Risk-Based Process Safety ..................................................................................................................... 13
General Approach to Hazard Identification and Risk Analysis ................................................................. 14
Process Risk Management ...................................................................................................................... 14
Risk Analysis ........................................................................................................................................... 15
Risk Assessment ..................................................................................................................................... 15
Hazard Identification and Risk Analysis ................................................................................................... 15
2. HAZARD SCREENING ...................................................................................................................... 18
Hazard Definition ..................................................................................................................................... 18
Process Hazards ..................................................................................................................................... 18
Safety Data Sheets (SDS) ...................................................................................................................... 19
Hazard Classification criteria under NFPA 704 ........................................................................................ 19
Hazard Classification criteria under European Dangerous Substances Directive or Globally Harmonized
System (GHS) ......................................................................................................................................... 20
Other Sources for Chemical Hazards Information ................................................................................... 21
Guidance for Determining Equipment or Unit Operations to Include in Hazard Evaluation ..................... 21
Hazard Screening Summary .................................................................................................................... 22
3. FLAMMABILITY ................................................................................................................................. 23
Module Objectives ................................................................................................................................... 23
Fire Triangle ............................................................................................................................................ 23
Flammability Parameters ......................................................................................................................... 23
Where to Obtain Flammability Data ......................................................................................................... 24
Estimation of Flammable Limits for Vapor Mixtures ................................................................................. 25
Example Estimation of LFL for Vapor Mixtures ....................................................................................... 25

Hazard Screening CHEF Manual
- 6 -
Estimation of Flash Point for Liquid Mixtures ........................................................................................... 25
Combustible Dusts................................................................................................................................... 25
Liquid Aerosol or Mist .............................................................................................................................. 26
Limiting Oxygen Concentration ................................................................................................................ 26
Fire and Explosion ................................................................................................................................... 27
Fundamental Burning Velocity ................................................................................................................. 27
Dust Explosion Pentagon ........................................................................................................................ 28
Secondary Dust Explosion ....................................................................................................................... 29
Deflagration Index ................................................................................................................................... 29
Maximum Explosion Pressure ................................................................................................................. 30
Minimum Ignition Energy ......................................................................................................................... 30
Managing Ignition Sources ...................................................................................................................... 31
Adiabatic Compression ............................................................................................................................ 31
Static Electricity ....................................................................................................................................... 32
Managing Electrostatic Discharge from Liquids and Solids ..................................................................... 32
4. TOXICITY ........................................................................................................................................... 33
Module Objectives ................................................................................................................................... 33
How Toxicants Enter Biological Organisms ............................................................................................. 33
Toxicological Studies ............................................................................................................................... 33
Response to Toxic Dose .......................................................................................................................... 33
Lethal Concentration and Lethal Dose ..................................................................................................... 34
Toxic Criteria for Risk Screening ............................................................................................................. 34
Emergency Response Planning Guidelines (ERPG) ............................................................................... 35
Inhalation Toxic Dose .............................................................................................................................. 35
Inhalation Toxic Mixtures ......................................................................................................................... 36
Example Estimation of Equivalent ERPG-3 for Vapor Mixtures .............................................................. 36
Lethality Models ....................................................................................................................................... 36
Example Estimation of Lethality Using a Probit Model ............................................................................ 37
Relationship of Lethality to a Multiple of ERPG-3 .................................................................................... 38
People in Occupied Buildings .................................................................................................................. 39
Asphyxiation ............................................................................................................................................ 39
Dermal Toxicity ........................................................................................................................................ 40

Hazard Screening CHEF Manual
- 7 -
Thermal/ Chemical Burns ........................................................................................................................ 40
Environmental Toxicity ............................................................................................................................. 41
5. REACTIVITY ...................................................................................................................................... 43
Module Objectives ................................................................................................................................... 43
Reactivity Hazards Evaluation ................................................................................................................. 43
The Search for Reactivity Hazards .......................................................................................................... 43
Key Steps in Reactivity Hazard Evaluation .............................................................................................. 44
Reactive Chemicals Screening ................................................................................................................ 45
Key Reactivity Hazard Screening Information ......................................................................................... 45
Categorization of Reactivity Hazard from Heat of Reaction per Mass ..................................................... 45
Estimation of the Maximum Reaction Temperature and Pressure ........................................................... 46
Example Estimation of Maximum Reaction Temperature and Pressure ................................................. 46
Example Estimation of Maximum Reaction Pressure from Gas Generation ........................................... 47
Compatibility Charts................................................................................................................................. 47
Highly Energetic Reactions ...................................................................................................................... 49
Differential Scanning Calorimetry (DSC) ................................................................................................. 50
Yoshida’s Correlation of Highly Energetic Reactions ............................................................................... 50
Detected Reaction Onset Temperature ................................................................................................... 50
When to Consider Additional Reactive Chemicals Testing ...................................................................... 50
Accelerating Rate Calorimetry (ARC) ...................................................................................................... 51
Vent Sizing Package™ (VSP) ................................................................................................................. 51
Simple Kinetic Modeling to Obtain Reaction Rate Information................................................................. 51
Temperature of No Return ....................................................................................................................... 52
Reactivity Screening ................................................................................................................................ 53
Autocatalytic Behavior ............................................................................................................................. 53
Evaluation of Common Process Upsets involving Reactions ................................................................... 53
6. HAZARD EVALUATION .................................................................................................................... 55
Module Objectives ................................................................................................................................... 55
Non-Scenario and Scenario Based Hazard Evaluation Techniques ........................................................ 55
When to Perform Hazard Evaluation ....................................................................................................... 56
Preparing for Hazard Evaluation .............................................................................................................. 56
Process Equipment to Include in a Hazard Evaluation Study .................................................................. 57
Hazard Screening CHEF Manual
- 8 -
Key Process Information Needed for Hazard Evaluation ......................................................................... 57
Process Hazard Assessments ................................................................................................................. 58
Checklist Analysis .................................................................................................................................... 59
Relative Ranking ..................................................................................................................................... 59
Scenario-Based Hazard Evaluation Definitions ....................................................................................... 60
Scenario Development ............................................................................................................................ 60
Initiating and Loss Events ........................................................................................................................ 61
Initiating Events ....................................................................................................................................... 61
Loss Events ............................................................................................................................................. 62
Incident Outcome .................................................................................................................................... 63
What-If Analysis ....................................................................................................................................... 63
What-If Checklist ..................................................................................................................................... 64
Hazard and Operability Study (HAZOP) .................................................................................................. 64
HAZOP Study Terms ............................................................................................................................... 65
Simple HAZOP Example Node, Parameter and Deviation ...................................................................... 66
Additional HAZOP Study Terms .............................................................................................................. 67
HAZOP Documents ................................................................................................................................. 67
Other Hazard Identification Methods ....................................................................................................... 68
Scenario Libraries .................................................................................................................................... 69
Example Scenario Library ........................................................................................................................ 70
Scenario Feasibility.................................................................................................................................. 75
7. INTRODUCTION TO CONSEQUENCE AND RISK ANALYSIS ........................................................ 76
Risk Analysis Approach ........................................................................................................................... 76
Chemical Process Risk ............................................................................................................................ 78
Measurement of Risk ............................................................................................................................... 79
Presentation of Risk Results .................................................................................................................... 79
“Sharpening the Pencil” ........................................................................................................................... 82
8. ESTIMATION OF AIRBORNE QUANTITY ........................................................................................ 84
Module Objectives ................................................................................................................................... 84
Flowchart for Determination of Airborne Quantity .................................................................................... 84
Selection of a Discharge Model ............................................................................................................... 85
Hole Size Release Rate for Vapor or Subcooled Liquid .......................................................................... 86
Hazard Screening CHEF Manual
- 9 -
Hole Size Release Rate Example-Vapor ................................................................................................. 86
Hole Size Release Rate Example-Liquid ................................................................................................. 86
Hole or Short Pipe Size Release Rate for Flashing Liquid ....................................................................... 86
Example Hole or Short Pipe Size Release Rate for Flashing Liquid ........................................................ 87
Liquid Trajectory from a Hole ................................................................................................................... 87
Overflow or Specified Discharge Rate ..................................................................................................... 88
Discharge Rate from Excessive Heat Input ............................................................................................. 88
Example Discharge Rate from Excessive Heat Input ............................................................................. 88
Test for Two-Phase Flow ......................................................................................................................... 88
Example Test for Two-Phase Flow ......................................................................................................... 90
Equipment Rupture .................................................................................................................................. 90
Estimation of Mixture Properties .............................................................................................................. 90
Estimation of Flash Fraction .................................................................................................................... 91
Flash Fraction for Chemical Mixtures ...................................................................................................... 91
Aerosol Evaporation ................................................................................................................................ 91
Example Aerosol Evaporation ................................................................................................................. 93
Evaporation from a Liquid Pool ................................................................................................................ 93
Example Evaporation from a Liquid Pool ................................................................................................ 94
Example Airborne Quantity for a Flashing Liquid Release ...................................................................... 94
9. VAPOR DISPERSIONS...................................................................................................................... 97
Module Objectives ................................................................................................................................... 97
Vapor Dispersion Mechanisms ................................................................................................................ 97
Jet Mixing ................................................................................................................................................ 98
Jet Mixing Example ................................................................................................................................. 99
Continuous versus Instantaneous Release ........................................................................................... 100
Atmospheric Dispersion Modeling ......................................................................................................... 100
Dense Gas Dispersion Models .............................................................................................................. 101
Neutrally Buoyant Gaussian Models ...................................................................................................... 101
Simple Vapor Dispersion Correlation ..................................................................................................... 102
Correction for Initial Dilution in Simple Vapor Dispersion Model ............................................................ 104
Vapor Dispersion Example – Estimate Distance to a Concentration .................................................... 104
Vapor Dispersion Model Example – Estimate Concentration at a Distance .......................................... 104

Hazard Screening CHEF Manual
- 10 -
Evaluation of Short Duration Release .................................................................................................... 105
Estimation of Toxic Exposure Duration .................................................................................................. 105
Correction for Elevation in Simple Vapor Dispersion Model .................................................................. 105
Estimation of Maximum Ground Level Concentration ............................................................................ 106
Example Correction for Elevation ......................................................................................................... 107
Relief Device Effluent Screening ........................................................................................................... 107
Simplified Relief Effluent Screening Process ......................................................................................... 108
Relief Effluent Screening Criteria ........................................................................................................... 108
Relief Effluent Screening Tool and Additional Information ..................................................................... 109
Releases Impacting Personnel Located Indoors.................................................................................... 109
Releases within an Enclosed Process Area .......................................................................................... 110
Toxic Infiltration from an Outdoor Release ............................................................................................ 110
Typical Ventilation Rates ....................................................................................................................... 111
10. EXPLOSIONS ................................................................................................................................ 112
Module Objectives ................................................................................................................................. 112
Explosion Definitions ............................................................................................................................. 112
Damage and Blast Overpressure .......................................................................................................... 112
Physical Explosion Using Simple TNT Model ........................................................................................ 113
TNT Model Example ............................................................................................................................. 114
Baker-Strehlow-Tang Explosion Model .................................................................................................. 114
Potential Explosion Site (PES) .............................................................................................................. 117
Building Explosion and Equipment Deflagration .................................................................................... 118
Building Explosion Example.................................................................................................................. 118
Vapor Cloud Explosion Using Simplified Baker-Strehlow-Tang Model .................................................. 118
Vapor Cloud Explosion Example .......................................................................................................... 119
Class Exercise ...................................................................................................................................... 120
Limitations of Simple Explosion Models ................................................................................................. 120
11. IMPACT ASSESSMENT ................................................................................................................ 122
Module Objectives ................................................................................................................................. 122
Incident Outcome .................................................................................................................................. 122
Generalized Outcome Event Tree ......................................................................................................... 123
Incident Outcome Selection Criteria ...................................................................................................... 124
Hazard Screening CHEF Manual
- 11 -
On-Site Consequence Severity ............................................................................................................. 124
De Minimis Consequence ...................................................................................................................... 126
Example Screening Criteria for Consequence Severity sufficient to warrant further Risk Analysis ........ 126
Chemical Exposure Example Criteria .................................................................................................... 127
Thermal Radiation Example Criteria ...................................................................................................... 127
Estimating Number of People Impacted for On-site Incident ................................................................. 128
Estimating the On-site Probability of Exposure ...................................................................................... 128
Example Impact Assessment for Outdoor Release .............................................................................. 128
Estimating Number of People Impacted within Occupied Buildings ....................................................... 129
Example Impact Assessment for an Occupied Building Example ......................................................... 130
Offsite Toxic Impacts ............................................................................................................................. 131
Summary of Key Consequence Analysis Steps ..................................................................................... 133
12. LIKELIHOOD EVALUATION ......................................................................................................... 134
Module Objectives ................................................................................................................................. 134
Definition of Terms................................................................................................................................. 134
Failure Frequency .................................................................................................................................. 135
Reliability and Failure Probability ........................................................................................................... 135
Interactions Between Hardware or System Components ...................................................................... 136
Probability of Failure on Demand........................................................................................................... 136
Failure Frequency from Historical Data ................................................................................................. 137
Likelihood Modeling ............................................................................................................................... 138
Fault Tree Likelihood Modeling .............................................................................................................. 138
Example Fault Tree Analysis ................................................................................................................ 139
Pool Fire Frequency Analysis using Simplified Fault Tree ..................................................................... 140
Event Tree Likelihood Modeling ............................................................................................................ 141
Example Event Tree Analysis for Series of Protective Layers .............................................................. 142
13. LAYER OF PROTECTION ANALYSIS (LOPA) ............................................................................. 143
Introduction ............................................................................................................................................ 143
Module Objectives ................................................................................................................................. 143
Steps in Performing Layers of Protection Analysis ................................................................................ 144
Selection of LOPA Scenario Candidates. .............................................................................................. 145
Estimation of Consequence Severity ..................................................................................................... 145

Hazard Screening CHEF Manual
- 12 -
Initiating Event Frequency ..................................................................................................................... 146
Human Reliability ................................................................................................................................... 148
Enabling Conditions and Conditional Modifiers ..................................................................................... 148
Protection Layers ................................................................................................................................... 151
Passive Protective Layers .................................................................................................................... 153
Active Protection Layers ....................................................................................................................... 154
Human Action IPLs ............................................................................................................................... 157
Preventive versus Mitigating Protective Layers ..................................................................................... 157
Domino Effects ...................................................................................................................................... 158
Estimating Scenario Frequency and Risk Decisions .............................................................................. 159
Estimation of Scenario Frequency ......................................................................................................... 160
LOPA Documentation ............................................................................................................................ 160
Limitations of LOPA ............................................................................................................................... 162
14. SUMMARY ..................................................................................................................................... 163
Hazard Evaluation and Risk Analysis .................................................................................................... 163
Overall Work Process Steps for Hazard Evaluation and Risk Analysis ................................................. 163
GLOSSARY.......................................................................................................................................... 164
REFERENCES ..................................................................................................................................... 173
GLOSSARY.......................................................................................................................................... 175
APPENDIX A – REACTIVE CHEMICALS CHECKLIST ...................................................................... 184
1.1 Chemical reaction hazard identification ........................................................................................... 184
A.2 Reaction process design considerations ......................................................................................... 186
A.3 Resources and Publications ............................................................................................................ 187
REVISION HISTORY ............................................................................................................................ 189

Hazard Screening CHEF Manual
- 13 -
1. INTRODUCTION
Intended Audience
The intended audience for the Chemical Hazard Engineering Fundamentals (CHEF) manual is personnel performing screening level or risk analyses (including Hazards Identification and Risk Analysis {HIRA} and Layers of Protection Analysis {LOPA}) for existing and future manufacturing facilities including:
• Manufacturing personnel
• Improvement engineers
• Process engineers
• Other process safety roles
The overall Learning Objectives for Chemical Hazard Engineering Fundamentals are:
• Develop familiarity with concepts and simple methods such that Hazard Evaluation Teams with the help of Facilitators, Technology Experts, and Process Safety Specialists should be able to perform screening level Hazard Identification and Risk Analysis studies.
• Demonstrate the models used in the CHEF Calculation Aid spreadsheet.
• Document the methods utilized in the Risk Analysis Screening Tools (RAST) spreadsheet.
• Understand the limitations of the methodologies and when to utilize more advanced methods or to engage a Subject Matter Expert.
Sections
There are 14 sections or modules included in this Chemical Hazard Engineering Fundamental manual in-cluding:
1. Introduction (this section) 2. Hazard Screening 3. Flammability 4. Toxicity 5. Reactivity 6. Hazard Identification 7. Introduction to Consequence and Risk Analysis 8. Estimation of Airborne Quantity 9. Vapor Dispersions 10. Explosions 11. Impact Assessment 12. Likelihood Evaluation 13. Layer of Protection Analysis 14. Summary
Risk-Based Process Safety
Hazard Identification and Risk Analysis (HIRA) is part of an overall Process Safety program to protect people, property and the environment. The study team should be very familiar with their company’s Process Safety Management Systems (such as Operating Procedures, Safe Work Practices, Asset Integrity and Reliability) to aid in developing the scope of an HIRA study. It may be that some hazards are adequately addressed by
Hazard Screening CHEF Manual
- 14 -
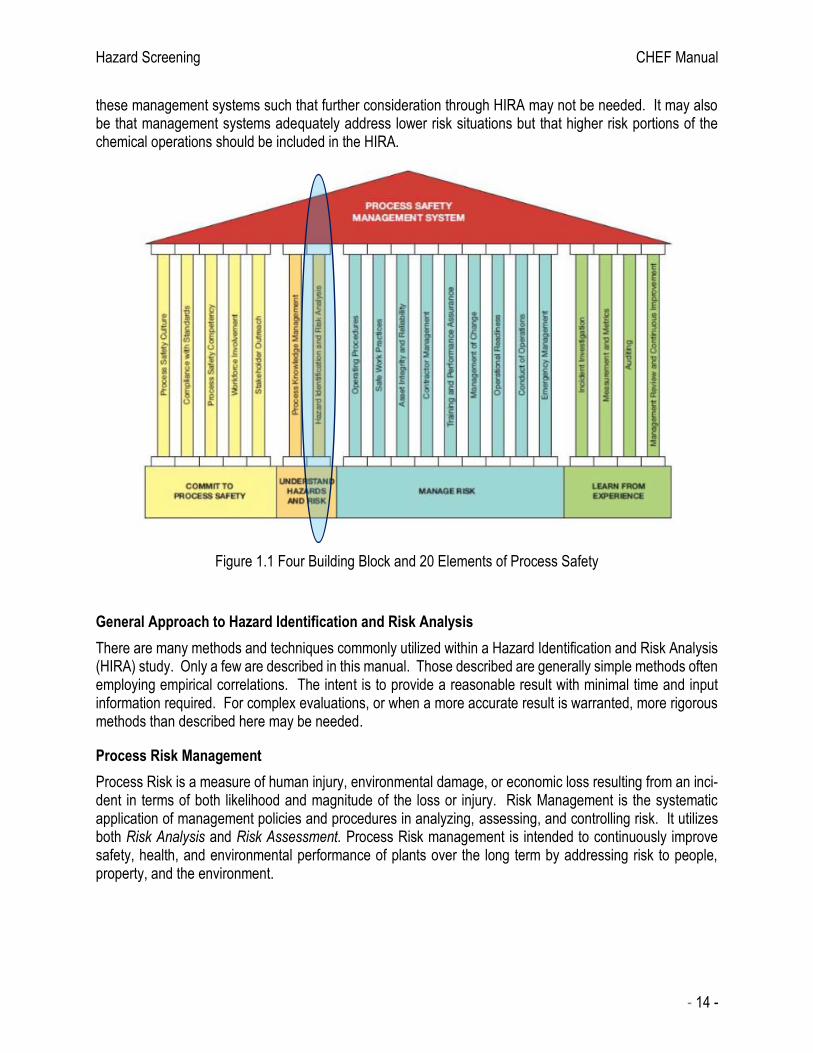
these management systems such that further consideration through HIRA may not be needed. It may also be that management systems adequately address lower risk situations but that higher risk portions of the chemical operations should be included in the HIRA.
Figure 1.1 Four Building Block and 20 Elements of Process Safety
General Approach to Hazard Identification and Risk Analysis
There are many methods and techniques commonly utilized within a Hazard Identification and Risk Analysis (HIRA) study. Only a few are described in this manual. Those described are generally simple methods often employing empirical correlations. The intent is to provide a reasonable result with minimal time and input information required. For complex evaluations, or when a more accurate result is warranted, more rigorous methods than described here may be needed.
Process Risk Management
Process Risk is a measure of human injury, environmental damage, or economic loss resulting from an inci-dent in terms of both likelihood and magnitude of the loss or injury. Risk Management is the systematic application of management policies and procedures in analyzing, assessing, and controlling risk. It utilizes both Risk Analysis and Risk Assessment. Process Risk management is intended to continuously improve safety, health, and environmental performance of plants over the long term by addressing risk to people, property, and the environment.

Hazard Screening CHEF Manual
- 15 -
Figure 1.2 Simplified Risk Management Process
Risk Analysis
Risk Analysis involves qualitative and quantitative Hazard Evaluation methods. Qualitative Hazard Evalua-tion techniques are commonly used to pinpoint weaknesses in process design and facility operation that could lead to incidents with potential safety consequences or impacts. Quantitative methods are typically used to determine the magnitude of an incident and estimate the likelihood of occurrence for a specific se-quence of events leading to an Incident.
Risk Assessment
Risk Assessment in one form or another is inherent in all decision making. If the risk exceeds predefined and agreed upon criteria:
• Methods of reducing the risk must be implemented, or
• The activity creating the risk must be reviewed with corporate management to agree upon appropri-ate actions, or
• The activity creating the risk must be discontinued.
Hazard Identification and Risk Analysis
Hazard Evaluation and Risk Analysis is a collective term that encompasses all activities involved in identifying
hazards and evaluating risk at facilities, throughout their life cycle, to make certain that risks to employees,
the public, or the environment are consistently controlled within the organization's risk tolerance. RAST is
based on a suggested HIRA work process (Figure 1.1) to answer basic questions involving:
• What are the Hazards? • What can go wrong? • How Bad can it be? • How Often might it happen? • Is the Risk Tolerable?
Determine Risk
Review Requirements
Yes
No
Identify
Hazards
Analyze/Assess
Risk
Manage
Residual Risk
Discontinue
Activity
Reduce
Risk
Is Risk
Tolerable?Can Risk be
Reduced?
When
&
Who
What
&
How
Yes
No

Hazard Screening CHEF Manual
- 16 -
Figure 1.3 Overall Work Process Steps for Hazard Evaluation and Risk Analysis
Chemical Hazards Engineering Fundamentals (CHEF) materials are based on performing Hazard Identifica-tion and Risk Analysis (HIRA) tasks in a specific order. The order of task execution is based on an overall work flow such that results of a specific estimate (such as a source model) being available as input for the subsequent task (such as vapor dispersion). The overall Work Process for HIRA includes:
Identify the Equipment or Activity for which we intend to perform an analysis. For example, the oper-ation of a storage tank, a reactor, a piping network, etc.
Identify Chemical and Process Hazards or “inherent chemical or physical characteristics that have the potential for causing damage to people, property, or the environment”. Both Chemical and Operational related hazards are considered. Chemical Hazards include flammability, toxicity, corrosivity, and reac-tivity (stored chemical energy). Operational Hazards include stored pressure-volume energy, high or low temperature (potential for thermal burns) and, to some extent, electrical conductivity (potential for static discharge).
Development of Scenarios involves “a detailed description of an unplanned event or incident sequence that results in a loss event and its associated impacts, including the success or failure of safeguards involved in the incident sequence”. Identification and development of scenarios often involve qualitative techniques such as Brainstorming, What-IF Checklists, and Hazard and Operability Analysis (HAZOP).
Consequence Analysis may be qualitative (based on judgment of the study team), simplified quantita-tive, or detailed quantitative. A simplified quantitative approach is described in the manual that uses various source and effect models from CCPS and other literature sources. Loss events are categorized as related to hole size (vapor, liquid, or two-phase), material balance (such as overfill), heat balance (such as vaporization resulting from fire exposure), rupture (instantaneous release) or equipment dam-age. Various Incident Outcome may result from a Loss Event such as Flash Fire, Vapor Cloud Explosion, Toxic Release, or Explosion damage. Finally, various effect models are used to estimate (and sometimes quantify) the impact to people, equipment, and the environment.
Scenario Frequency is estimated to provide an expected probability or frequency of occurrence for an event sequence.
Risk Analysis involves the combination of frequency and consequence magnitude for scenarios of con-cern. Commonly, order-of-magnitude results are utilized in simplified risk analysis. Scenarios of rela-tively low risk may be screened out from more detail risk analysis based on a company’s risk screening criteria.
What are the Hazards?
What can go Wrong?
How Bad could it Be?
How Oftenmight it
Happen?
Is the Risk Tolerable?
Identify Chemical
and ProcessHazards
Estimate Frequency
Analyze Consequences
AnalyzeRisk
ImplementAdditional Safeguards as Needed
DevelopScenarios
Identify Equipment
or Activity to be Analyzed
Sustain Safeguards
for Life Cycle of Facility

Hazard Screening CHEF Manual
- 17 -
During risk analysis, the study team may need to Identify Additional cost-effective Safeguards in order to manage risk to or below the tolerable risk criteria. Implementation of additional safeguards will typically reduce the frequency or severity of the scenario consequence.
Once appropriate safeguards and barriers have been implemented, they must be managed and Sus-tained for the life of the facility.
The Risk Assessment process for decisions regarding specific requirements or man-agement systems to appropriately manage or control risk are beyond the scope of Chemical Hazard Engineering Fundamentals training.

Hazard Screening CHEF Manual
- 18 -
2. HAZARD SCREENING
The handling of any chemical at a wide range of process conditions involves risk. However, it is important to narrow the scope of risk analysis to those chemicals and processing units representing significant hazard. Prior to performing Hazard Identification and Risk Analysis (HIRA) study, Process Hazards must be identified and screened to determine which equipment or unit operations should be analyzed.
Each company may have hazard screening criteria. Note that CCPS does not endorse any specific criteria but provides guidance for the company to consider. If hazard severity is considered reasonably low, then a HIRA study may not be required (or “screened out”), provided there is no regulatory or other requirement.
Hazard Definition
A Hazard is defined as an inherent physical or chemical characteristic that has the potential for causing harm to people, property, or the environment.
Process Hazards
Process Safety addresses acute hazards; one to which a single or short duration exposure may cause harm or damage. In addition to chemical and explosion hazards, asphyxiation and dermal exposure to corrosive, hot or cold materials as a result of a release is also included. Equipment scale is also important as severity is often related to the quantity of chemical or stored pressure-volume energy that could be released.
The following offers guidance in determining what equipment items should be included in a Hazard Identifi-cation and Risk Analysis (HIRA) study. In addition to these, any chemical or chemical that the study teams feel represents a hazard should be included.
Typical Chemical Hazards include:
• Flammability
• Toxicity (Inhalation, Dermal, or Environmental)
• Reactivity or Instability
• Corrosivity
Hazardous Process Conditions include:
• High/Low Temperature
• High/Low Pressure
• Scale of Operation
Hazard Identification and Risk Analysis
What are the Hazards?
What can go Wrong?
How Bad could it Be?
How Oftenmight it
Happen?
Is the Risk Tolerable?
Identify Chemical
and ProcessHazards
Estimate Frequency
Analyze Consequences
AnalyzeRisk
IdentifyAdditional Safeguards as Needed
DevelopScenarios
Identify Equipment
or Activity to
be Analyzed
Manage Barriers
for Life Cycle of Facility
Hazard Screening CHEF Manual
- 19 -
Contributing Factors include:
Equipment Characteristics • Fired Equipment (Boilers …) • Rotating Equipment • Other
Location of Hazards • Proximity of People • Proximity of Buildings • Congestion/Confinement
Safety Data Sheets (SDS)
Safety Data Sheets (SDS) are a tremendous source of information for hazards associated with the chemicals we handle. Information for flammability, toxicity and environmental issues are commonly included. The US National Fire Protection Agency (NFPA) has a rating system for Flammability, Health, and Reactivity based on a numerical value from 0 to 4 (with 4 being most hazardous) commonly found on an SDS. The European Dangerous Substances Directive on Classification, Labeling and Packaging of Substances and Mixtures; in addition to the United Nations Globally Harmonized System (GHS) for Classification and Labeling of Chemi-cals, utilize Physical Hazard Statements and Health Hazard Statements based on quantitative measures which may be referenced on an SDS.
Hazard Classification criteria under NFPA 704
Classification criteria under the US National Fire Protection Agency (NFPA 704):
Health
4 – Materials that, under emergency conditions, can be lethal
3 – Materials that, under emergency conditions, can cause serious or permanent injury
2 – Materials that, under emergency conditions, can cause temporary incapacitation or residual injury
1 – Materials that, under emergency conditions, can cause significant irritation
0 – Materials that, under emergency conditions, would offer no hazard beyond that of ordinary combus-tible materials
Flammability
4 – Materials that will rapidly and completely vaporize at atmospheric pressure and normal ambient tem-perature or that are readily dispersed in air and will burn readily.
3 – Liquids and solids that can be ignited under almost all ambient temperature conditions.
2 – Materials that must be moderately heated or exposed to relatively high ambient temperatures before ignition can occur
1 – Materials that must be preheated before ignition can occur.
0 – Materials that will not burn under typical fire conditions including intrinsically noncombustible materi-als as concrete, stone, and sand.

Hazard Screening CHEF Manual
- 20 -
Instability
4 – Materials that in themselves are readily capable of detonation or explosive decomposition or explo-sive reaction at normal temperatures and pressures
3 – Materials that in themselves are capable of detonation or explosive decomposition or explosive re-action but require a strong initiating source or must be heated under confinement before initiation.
2 – Materials which readily undergo violent chemical change at elevated temperatures and pressures
1 – Materials which can become unstable at elevated temperatures
0 – Materials that are normally stable, even under fire conditions
There may also be additional information associated with the NFPA classification including aquatic toxicity, oxidizing material, not to use water for fire-fighting, etc. The most reliable NFPA hazard ratings are typically found on Safety Data Sheets for the associated chemical supplier.
Hazard Classification criteria under European Dangerous Substances Directive or Globally Harmo-nized System (GHS)
Classification criteria under European Dangerous Substances Directive on Classification, Labeling and Pack-aging of Substances and Mixtures and Globally Harmonized System for Classification and Labeling of Chem-icals includes:
Flammability
Extremely Flammable – liquids with a Flash Point below 0oC and a Boiling Point less than 35oC or gas-eous substances which are flammable in contact with air at ambient temperature and pressure
Highly Flammable – liquids with a Flash Point below 21oC which are not Extremely Flammable, solids or vapors which may readily catch fire in contact with ambient air.
Flammable – liquids having a Flash Point between 21oC and 55oC. (Note that the United Nations Globally Harmonized System – GLS - requires labeling liquids have a flash point less than 60oC as flammable.)
Toxicity
Fatal, Very Toxic – Oral LD50, rat, < 25 mg/kg (Very Toxic if swallowed); Dermal LD50, rat or rabbit, < 50 mg/kg (Very Toxic in Contact with Skin); Inhalation LC50, rat, < 0.25 mg/liter/4 hr. for aerosols or particu-lates or < 0.5 mg/liter/4 hr. for gases and vapors (Very Toxic by Inhalation)
Toxic – Oral LD50, rat, between 25 and 200 mg/kg (Toxic if swallowed); Dermal LD50, rat or rabbit, be-tween 50 and 400 mg/kg (Toxic in Contact with Skin); Inhalation LC50, rat, between 0.25 and 1.0 mg/liter/4 hr. for aerosols or particulates –or- between 0.5 and 2.0 mg/liter/4 hr. for gases and vapors (Toxic by Inhalation)
Harmful – Oral LD50, rat, between 200 and 2000 mg/kg (Harmful if swallowed); Dermal LD50, rat or rabbit, between 400 and 2000 mg/kg (Harmful in Contact with Skin); Inhalation LC50, rat, between 1.0 and 5.0 mg/liter/4 hr. for aerosols or particulates –or- between 2.0 and 20 mg/liter/4 hr. for gases and vapors (Harmful by Inhalation)
In addition to these classification criteria, specific risk and safety sentences (R and S sentences) are used that may clarification the hazard information.
Hazard Screening CHEF Manual
- 21 -
Other Sources for Chemical Hazards Information
In addition to these Hazard Ratings found on an SDS, flammability information such as flash point or lower flammable limit, toxicity information such as Emergency Response Planning Guideline (ERPG) concentra-tions, and reactivity information such as heat of reaction may be used. This information may be found in Cameo Chemicals (a downloadable database of hazardous chemicals available through the US National Oceanic and Atmospheric Administration) and other literature sources.
Guidance for Determining Equipment or Unit Operations to Include in Hazard Evaluation
Based on experience and general observation, the guidelines below are provided as examples that may be used in determining what equipment items should be included in a Hazard Evaluation study. In addition to these criteria, any chemical or chemical that the study teams feel represents a hazard should be included. Any given hazard evaluation team or organization may decide to widen the hazard zones, but it is not rec-ommended that they narrow them.
Flammable Hazard sufficient for evaluation does not exist for equipment, vessels, transport containers, or piping handling chemicals if:
• Flash Point > 60 C and • The maximum process temperature (under normal or upset conditions) is less than the flash point less 5
C and • There are no “hot” surfaces in the immediate area that liquid could contact exceeding the flash point less
5 C and • The chemical is not considered a combustible dust or a combustible liquid that could be released as a
small droplet aerosol or mist.
Toxicity Hazard sufficient for evaluation does not exist for equipment, vessels, transport containers, or piping handling chemicals if:
• ERPG-3 is higher than an established level related to serious human health effects (e. g., ERPG-3 > 1000 ppmv) for gases or vapors and
• Chemical is not labeled or considered by a regulatory agency to be toxic if inhaled, toxic in contact with skin, or toxic to the environment.
Reactivity Hazard sufficient for evaluation does not exist for equipment, vessels, transport containers, or piping where intended or unintended reactions may occur (including reaction with water or any other chemical which may be inadvertently added) if:
• Heat of Reaction / Mass is minimal (e. g., less exothermic than –50 J/g or 25 C adiabatic heat rise) and • There is no evidence of highly volatile or gaseous products generated - and • The chemical is not considered or labeled as Explosive, Pyrophoric, Oxidizing, Water Reactive or other-
wise Unstable.

Hazard Screening CHEF Manual
- 22 -
Equipment: Hazardous Conditions sufficient for evaluation do not exist for, vessels, piping, or other equip-ment handling chemicals if:
• The maximum process temperature that does not pose a thermal hazard to human tissue under normal, upset, or reaction conditions (e. g., less than 60 C for liquids, less than 93 C for vapors and material temperature is greater than -23 C) and
• The chemical handled is not corrosive to human tissue and • The maximum process pressure or vapor pressure (under normal, upset, or reaction conditions) does
not exceed the MAWP or relief device set pressure and • The equipment or piping is not located within an enclosed area that a release could pose an asphyxiation
hazard
Hazard Screening Summary
Hazards to be evaluated include potential for thermal burns, chemical burns, equipment rupture, relief device activation, and asphyxiation in addition to flammability, toxicity, and reactivity. When in doubt if a hazard sufficient to include equipment, vessels or piping in the evaluation; include it. There are steps later in the proposed Hazard Identification and Risk Analysis work process when scenarios or incident outcome will be screening out from further evaluation.
Toxicity CHEF Manual
- 23 -
3. FLAMMABILITY
Potential consequences from fires within chemical and hydrocarbon facilities are very significant. In the US, property damage exceeds $300 MM annually from fire related incidents. Business interruption and loss of life are also substantial.
Module Objectives
In this module you will learn:
• The definitions for Lower and Upper Flammable Limits (LFL, UFL) and Limiting Oxygen Concentra-tion (LOC).
• Identification of LFL, UFL, and LOC on a flammability diagram.
• Estimation of Flammable Limits for Vapor Mixtures
• The definition of Flash Point and how it is measured.
• The definitions for Explosion, Deflagration and Detonation
• Fundamental Burning Velocity and Deflagration Index
• The definition of Combustible Dust
• Phrases related to the concepts of the Dust Explosion Pentagon
• Identification of common ignition sources
• Concepts for managing ignition sources.
Fire Triangle
The essential elements for combustion are fuel, an oxidizer, and an ignition source. Combustion occurs in the vapor phase: liquids are volatilized and solids are decomposed into vapor prior to combustion.
Flammability Parameters
• Flash Point (FP) – lowest temperature at which a liquid will give off sufficient vapor to be ignited in air. • Lower Flammability Limit (LFL) – lowest vapor concentration of a substance in air that will sustain com-
bustion when exposed to sufficient ignition source. • Upper Flammability Limit (UFL) – highest vapor concentration of a substance in air that will sustain
combustion when exposed to sufficient ignition source. • Limiting Oxygen Concentration (LOC) – minimum oxygen concentration required to propagate a flame. • Minimum Ignition Energy (MIE) – minimum amount of energy required to ignite a combustible vapor, gas
or dust cloud. • Autoignition Temperature (AIT) – lowest temperature at which a material will spontaneously ignite and
continue burning in a normal atmosphere without an external source of ignition, such as a flame or spark.
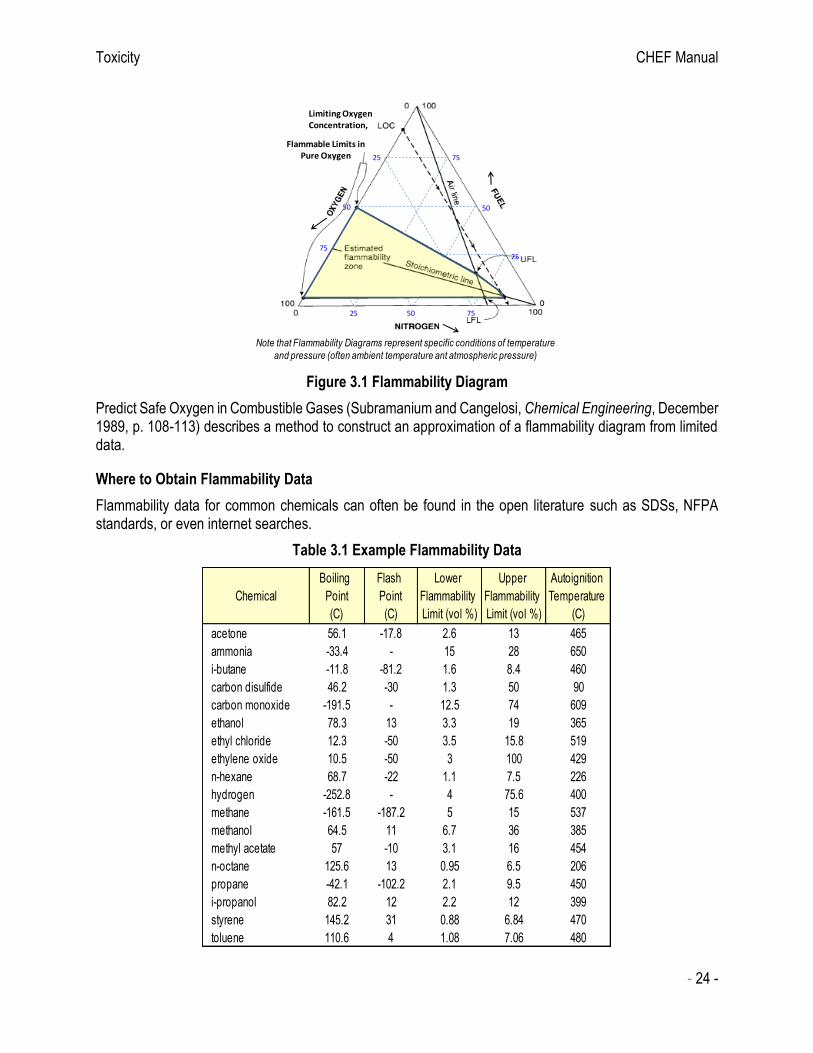
Several flammability properties can be explained by the use of a triangular flammability diagram (Figure 3.1). Typically, the diagram is defined by the concentration of the chemical of concern, the oxygen concentration and concentration of inert gas present (typically nitrogen). The flammability envelope is pie-shaped and a function of the oxygen concentration. The greater the oxygen content, the wider the flammable concentration.
Toxicity CHEF Manual
- 24 -
Figure 3.1 Flammability Diagram
Predict Safe Oxygen in Combustible Gases (Subramanium and Cangelosi, Chemical Engineering, December 1989, p. 108-113) describes a method to construct an approximation of a flammability diagram from limited data.
Where to Obtain Flammability Data
Flammability data for common chemicals can often be found in the open literature such as SDSs, NFPA standards, or even internet searches.
Table 3.1 Example Flammability Data
Limiting Oxygen Concentration,
75
25
50
75
25
75
50
5025
Flammable Limits in Pure Oxygen
Note that Flammability Diagrams represent specific conditions of temperature
and pressure (often ambient temperature ant atmospheric pressure)
Chemical
Boiling
Point
(C)
Flash
Point
(C)
Lower
Flammability
Limit (vol %)
Upper
Flammability
Limit (vol %)
Autoignition
Temperature
(C)
acetone 56.1 -17.8 2.6 13 465
ammonia -33.4 - 15 28 650
i-butane -11.8 -81.2 1.6 8.4 460
carbon disulfide 46.2 -30 1.3 50 90
carbon monoxide -191.5 - 12.5 74 609
ethanol 78.3 13 3.3 19 365
ethyl chloride 12.3 -50 3.5 15.8 519
ethylene oxide 10.5 -50 3 100 429
n-hexane 68.7 -22 1.1 7.5 226
hydrogen -252.8 - 4 75.6 400
methane -161.5 -187.2 5 15 537
methanol 64.5 11 6.7 36 385
methyl acetate 57 -10 3.1 16 454
n-octane 125.6 13 0.95 6.5 206
propane -42.1 -102.2 2.1 9.5 450
i-propanol 82.2 12 2.2 12 399
styrene 145.2 31 0.88 6.84 470
toluene 110.6 4 1.08 7.06 480

Toxicity CHEF Manual
- 25 -
Estimation of Flammable Limits for Vapor Mixtures
The Lower Flammable Limit (LFL) is the primary parameter for evaluating flammability hazard for vapors and is roughly 45 g/m3 for many hydrocarbons. As mixtures are very common in chemical processing, the mixture LFL is routinely needed and may be estimated from Le Chatelier’s equation7,11:
LFLmix = 1 / ( yi / LFLi ) (1)
where yi is the vapor mole fraction and LFLi the Lower Flammable Limit for each component i.
The Upper Flammability Limit (UFL) for mixtures may also be estimated from Le Chatelier’s equation. The LFL in air generally decreases slightly with increasing temperature and is not dependent on pressure. The UFL generally increases slightly with increasing temperature and increases significantly with increasing pres-sure. The Le Chatelier equation assumes flammable limits for each component are measured at the same temperature and that combustion kinetics is independent of the presence of other components in the mixture.
Example Estimation of LFL for Vapor Mixtures
As an example; the estimated lower flammable limit for a mixture at ambient temperature in air for 0.5 mole fraction methane (LFL of 5 %) and 0.5 mole fraction carbon disulfide (LFL of 1.1 %) is:
LFLmix = 1 / yi / LFLi = 1 / [ 0.5 / 5 + 0.5 / 1.1 ] = 1 / 0.5545 = 1.8 volume %.
Estimation of Flash Point for Liquid Mixtures
The Flash Point is the primary parameter for evaluating flammability hazard for liquids. Flash Point for a liquid mixture in air may be roughly estimated as the temperature at which the equilibrium vapor composition (at atmospheric pressure) is approximately equal to the Lower Flammable Limit (in volume fraction). Experi-mentally determined values are always recommended, particularly for mixtures containing more the one flam-mable component.
Combustible Dusts
A Combustible Dust is any finely divided solid material, 420 microns15 (0.42 mm, 1 mm per some European standards) or smaller in diameter (passing U.S. No. 40 Standard Sieve) which presents a fire or explosion hazard when dispersed and ignited in air. Particle size is extremely important in characterizing combustible dusts. The smaller the particle, the easier to suspend in air and ignite. In addition, the Explosible Range of dust concentration is very broad9, typically from 20 to 6000 g/m3.
Figure 3.2 Influence of Particle Size on Combustion Rate
a. Slow combustion b. Fast combustion c. Dust explosion

Toxicity CHEF Manual
- 26 -
Liquid Aerosol or Mist
Release of a liquid aerosol or mist (resulting from a high velocity release or condensed vapor) may result in an energetic explosion as the mass of fuel per volume is large relative to vapor. Operations such as splashing, aeration and vigorous agitation where electrostatic charging and atomization may occur should be avoided or maintained within an inert atmosphere. Aerosol below its flash point may be ignited although a strong ignition source may be required, as the liquid must partially vaporize to ignite.
Aerosol with droplet size less than 0.01 mm quickly evaporates and acts similar to flammable vapor with respect to Minimum Ignition Energy, Lower Flammable Limit and Fundamental Burning Velocity17. Aerosol with droplet diameter greater than 0.04 mm acts similar to a dust where droplets may burn individually and the Minimum Ignition Energy required increases with increasing droplet size8. Aerosol droplets greater than 0.6 mm typically do not support flame propagation7.
Limiting Oxygen Concentration
Most organics have a Limiting Oxygen Concentration (LOC) of roughly 9 to 10 volume % if N2 is the inert (Table 3.2). At less than 9-10% oxygen (e.g. by adding an inert gas to the system), it is not possible to have a flammable atmosphere.
Notable exceptions to the 9-10% Limiting Oxygen Concentration are:
Acetylene 2.5% Carbon disulfide 1.3% Carbon monoxide 12% Ethylene Oxide 3% Hydrogen 4% Propylene Oxide 2.3%
Note that less than 5 volume % oxygen is typically considered a “non-ignitable” atmosphere (based on roughly ½ the limiting oxygen content).

Toxicity CHEF Manual
- 27 -
Table 3.2 Limiting Oxygen Concentration
Partial Listing of Limiting Oxygen Concentration per NFPA 69
Fire and Explosion
The major distinction between a Fire and an Explosion is the combustion rate of a flammable gas, vapor or dust and degree of confinement where combustion is occurring. Explosions can occur within buildings, equipment, or in potentially congested outdoor areas.
• Explosion: Sudden expansion of gases resulting in a rapidly moving pressure or shock wave. An explosion typically requires some level of confinement (such as within a vessel, piping, or building) or a process area of high equipment or structure congestion.
• Deflagration: Propagation of a combustion or reaction zone at a speed that is less than the speed of sound in the un-reacted medium.
• Detonation: Propagation of a combustion or reaction zone at a velocity that is greater than the speed of sound in the un-reacted medium:
Fundamental Burning Velocity
The Fundamental Burning Velocity (or flame speed) in air is indication of combustion rate and potential ex-plosion energy for vapors. Fuels with fundamental burning velocity less than 45 cm/sec (such as ammonia and methane) are considered “low fuel reactivity” while fuels with fundamental burning velocity greater than 75 cm/sec (such as acetylene, ethylene oxide, and hydrogen) are considered “high fuel reactivity” resulting
Toxicity CHEF Manual
- 28 -
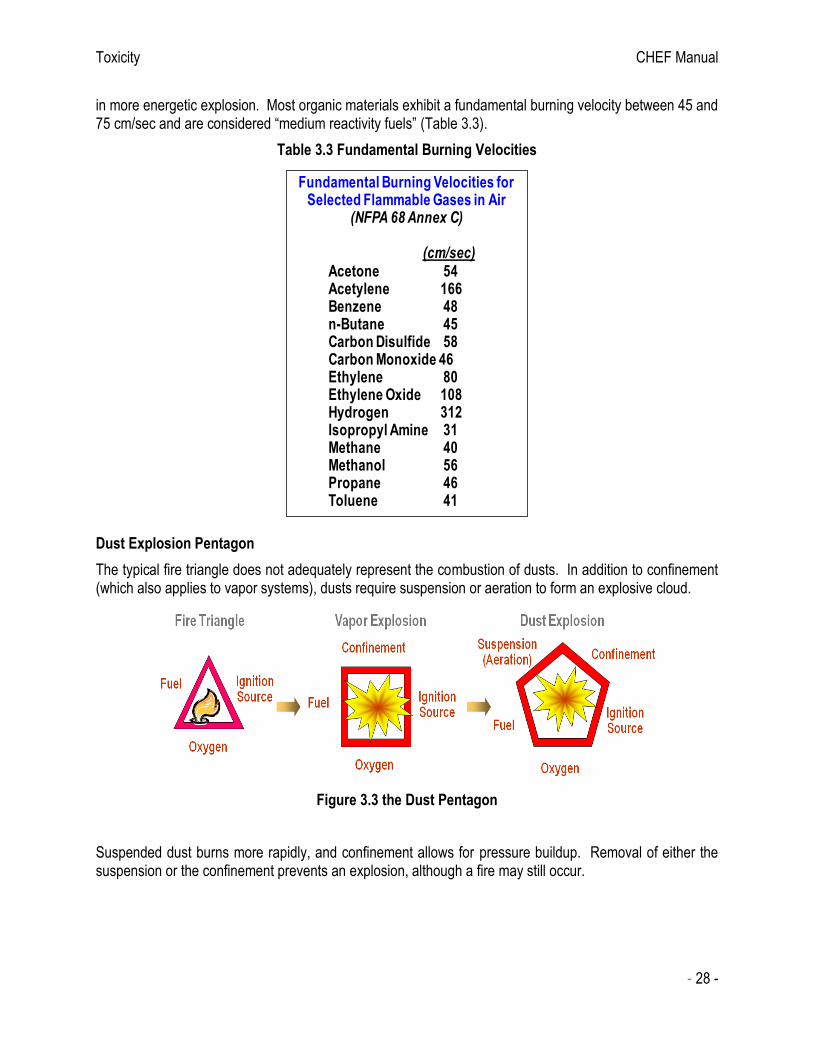
in more energetic explosion. Most organic materials exhibit a fundamental burning velocity between 45 and 75 cm/sec and are considered “medium reactivity fuels” (Table 3.3).
Table 3.3 Fundamental Burning Velocities
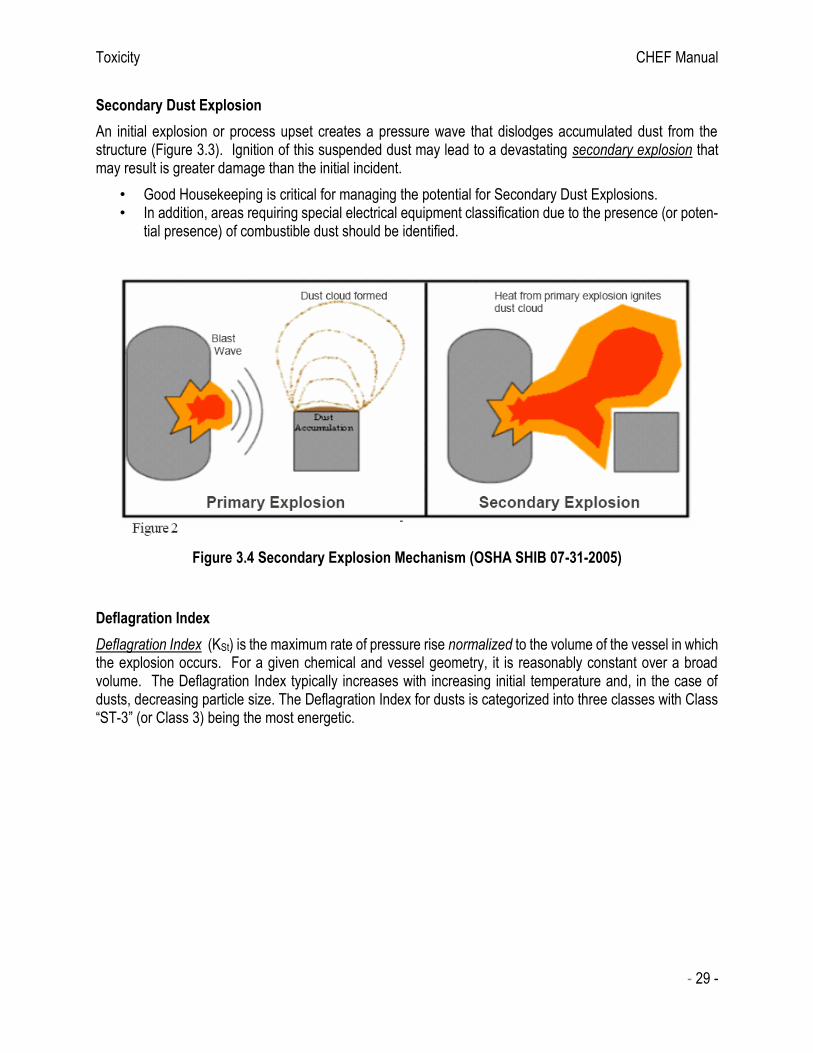
Dust Explosion Pentagon
The typical fire triangle does not adequately represent the combustion of dusts. In addition to confinement (which also applies to vapor systems), dusts require suspension or aeration to form an explosive cloud.
Figure 3.3 the Dust Pentagon
Suspended dust burns more rapidly, and confinement allows for pressure buildup. Removal of either the suspension or the confinement prevents an explosion, although a fire may still occur.
Fundamental Burning Velocities for Selected Flammable Gases in Air
(NFPA 68 Annex C)
(cm/sec)Acetone 54Acetylene 166Benzene 48n-Butane 45Carbon Disulfide 58Carbon Monoxide 46Ethylene 80Ethylene Oxide 108Hydrogen 312Isopropyl Amine 31Methane 40Methanol 56Propane 46Toluene 41
Toxicity CHEF Manual
- 29 -
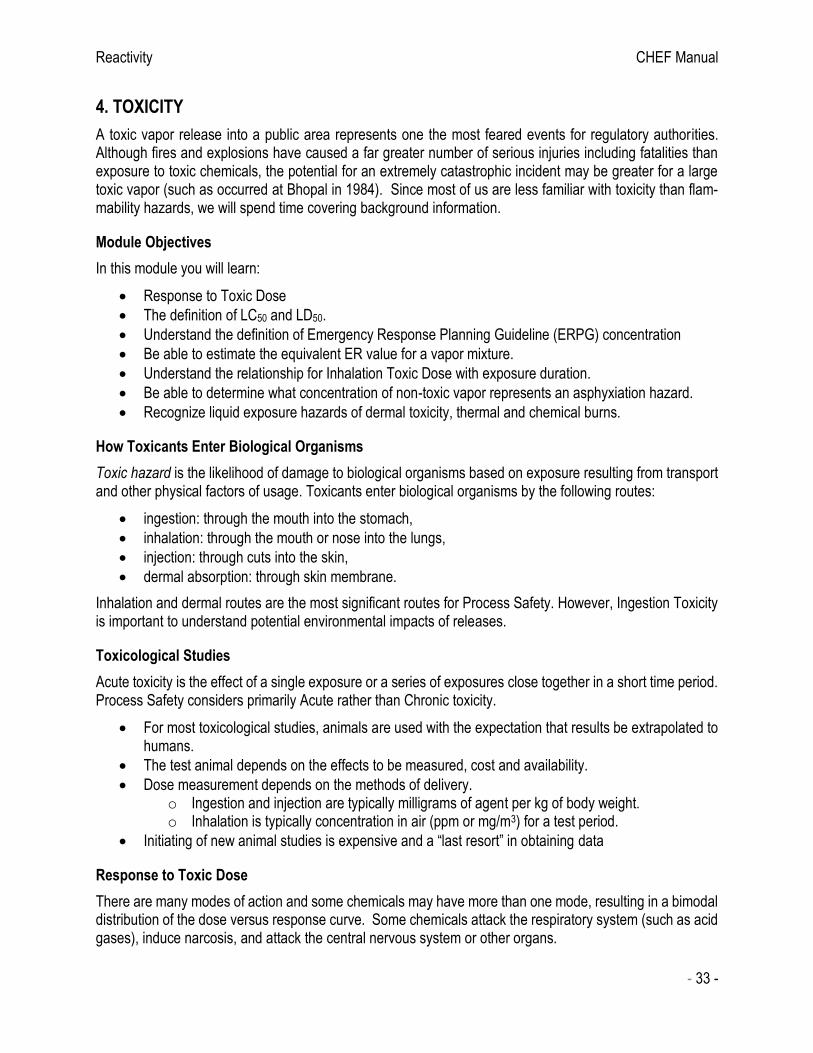
Secondary Dust Explosion
An initial explosion or process upset creates a pressure wave that dislodges accumulated dust from the structure (Figure 3.3). Ignition of this suspended dust may lead to a devastating secondary explosion that may result is greater damage than the initial incident.
• Good Housekeeping is critical for managing the potential for Secondary Dust Explosions. • In addition, areas requiring special electrical equipment classification due to the presence (or poten-
tial presence) of combustible dust should be identified.
Figure 3.4 Secondary Explosion Mechanism (OSHA SHIB 07-31-2005)
Deflagration Index
Deflagration Index (KSt) is the maximum rate of pressure rise normalized to the volume of the vessel in which the explosion occurs. For a given chemical and vessel geometry, it is reasonably constant over a broad volume. The Deflagration Index typically increases with increasing initial temperature and, in the case of dusts, decreasing particle size. The Deflagration Index for dusts is categorized into three classes with Class “ST-3” (or Class 3) being the most energetic.

Toxicity CHEF Manual
- 30 -
Table 3.4 Dust Deflagration Characteristics and Deflagration Index
Maximum Explosion Pressure
The maximum explosion pressure for organic materials (gas, vapor, or dust) ranges from 6 to 12 atmospheres starting from atmospheric pressure. A maximum pressure of 10 atmospheres for deflagration within equip-ment is commonly used in Hazard Evaluation.
Minimum Ignition Energy
The Minimum Ignition Energy (MIE) for most flammable vapors is very low compared to ignition sources. Human electrostatic discharge (initiated by walking across carpet) is roughly 20 mJ and much higher than the MIE for nearly all vapors (except ammonia).
The MIE for dust is generally much higher than for flammable vapors and highly dependent on particle size (with smaller particle size resulting in a lower MIE, Figure 3.4)). Moisture content is also important with dry material generally having a lower MIE. Minimum Ignition Energy and Particle Size are the primary parameters for evaluating flammability hazard for dusts. Beware of locations where fine dust can accumulate (such as a dust collector or overhead beams / rafters).
The hazard properties of combustible dusts cannot be determined theoretically, it is necessary to have test data on specific materials at the operating conditions of concern.
Deflagration Characteristics of Selected Combustible Dusts
(NFPA 68 Annex E)
Material Particle Pmax KSt
Size(mm) (bar) (bar-m/sec)
Activated Charcoal 28 7.7 14Aluminum 29 12.4 415Anthraquinone <10 10.6 364Calcium Acetate 85 6.6 21Cellulose 33 9.7 229Corn Starch 7 10.3 202Lactose 23 7.7 81Magnesium 28 17.5 508Paraformaldehyde 23 9.9 178Poly-acrylamide 10 5.9 12Poly-ethylene >10 8.0 156Soy Flour 20 9.2 110Sulfur 20 6.8 151Zinc 10 6.7 125
Dust Hazard
Class
Kst (bar-
m/sec)
Pmax
(bar)
ST-1 <200 10
ST-2 201-300 10
ST-3 >300 12
Dust Hazard
Class ST-1ST-3ST-3ST-1
ST-2ST-2ST-1ST-3ST-1ST-1ST-1ST-1ST-1ST-1

Toxicity CHEF Manual
- 31 -
Figure 3.5 Impact of Particle Size on Minimum Ignition Energy
Hybrid Mixtures of Dusts and Flammable Liquids generally exhibit a Minimum Ignition Energy of the flamma-ble liquid (which is typically much lower than that of the dust).
Managing Ignition Sources
The sources of ignition are numerous and often difficult to identify and eliminate. Common ignition sources include:
• Hot surfaces (such as heaters, dryers, and hot bearings) • Open flames (such as a fired heater or boiler) • Nearby Combustion Engines (such as cars, trucks, or machinery) • Hot work (from welding, cutting, grinding, or other spark producing activity) • Smoldering (such as combustion within dust piles or insulation) • Electrical and Static discharges (from switches, relays, loose connections, etc.)
Adiabatic Compression
There have been significant incidents caused by flammable vapors being drawn into a compressor and heated to a temperature exceeding the Autoignition Temperature, resulting in ignition.
Tf = T0 (Pf / P0)(-1)/ (2)
where: T0 and P0 are the initial absolute temperature and pressure, Tf is the final temperature. (Note that for air is 1.4 such that the exponent above is roughly 0.29)
0
100
200
300
400
500
600
0 40 80 120 160 200
Average particle size (mm)
MIE
(m
J)
NFPA 68 Figure 4.3.4.2.1 Effect of Average
Particle Diameter of a Typical Agricultural
Dust on the Minimum ignition Energy

Toxicity CHEF Manual
- 32 -
A compressor is particularly susceptible to reaching autoignition temperatures if it has a fouled after-cooler. A compression ratio, Pf / P0, of 10 to 20 can heat vapor from ambient temperature to greater than 400 C for many vapors.:
Static Electricity
One of the most elusive ignition sources within chemical plants is sparks resulting from static charge build-up and sudden discharge7. In order to have an electrostatic scenario for ignition of a fire or explosion, there must be Separation and Accumulation of electrostatic charges, sudden Discharge, and an Ignitable Atmos-phere.
Charges may be separated as fluids are pumped, mixed, stirred or otherwise transported. Significant charge separation can also occur when there is movement between two phases (gas with solids, two liquid phases, liquid with solid particles or gas bubbles), particularly if the continuous phase is non-conductive (or an insu-lator). At the same time there is a competing mechanism of charge relation. When charge separation ex-ceeds relaxation or dissipation, accumulation occurs. Accumulation may occur at an ungrounded conductor, the surface of an insulator, or within an insulator.
Sudden discharge occurs between a charged surface (such as a bag, pipe, wall, aerosol or mist, dust cloud, or bulk powder) and a grounded conductor (such as tools, vessel protrusions, instruments, or a person’s finger) or between two isolated conductive objects (one of which is charged to a higher potential than the other). The discharge energy commonly associated with ungrounded equipment is typically much higher than that required for ignition of flammable vapors. Since a high ignition risk is also associated with charged surfaces, nonconductive materials of construction or nonconductive linings, (examples: fiberglass, glass) should not be used with flammable liquids.
Managing Electrostatic Discharge from Liquids and Solids
Relaxation is a reduction in stream velocity to provide time for electrostatic charge to dissipate. For liquid flow rate into a vessel, API 2003 recommends that the velocity times pipe diameter of less than 0.5 m2/sec be used for filling of tank trucks to minimize static build-up of nonconductive liquids.
Bonding and Grounding reduces the voltage difference of all electrically connected components while grounding reduces the voltage of the entire system to zero. Use of conductive Dip Pipes extending below the liquid surface may also reduce the electrical charge that accumulates when liquid is allowed to free fall.
Increasing Fluid Conductivity with Additives may sometimes be used to minimize charge build-up between solid particles or liquid phases.
Inertion of the equipment atmosphere below the Limiting Oxygen Concentration may be needed if elec-trostatic discharges cannot be adequately managed.
Reactivity CHEF Manual
- 33 -
4. TOXICITY
A toxic vapor release into a public area represents one the most feared events for regulatory authorities. Although fires and explosions have caused a far greater number of serious injuries including fatalities than exposure to toxic chemicals, the potential for an extremely catastrophic incident may be greater for a large toxic vapor (such as occurred at Bhopal in 1984). Since most of us are less familiar with toxicity than flam-mability hazards, we will spend time covering background information.
Module Objectives
In this module you will learn:
• Response to Toxic Dose
• The definition of LC50 and LD50.
• Understand the definition of Emergency Response Planning Guideline (ERPG) concentration
• Be able to estimate the equivalent ER value for a vapor mixture.
• Understand the relationship for Inhalation Toxic Dose with exposure duration.
• Be able to determine what concentration of non-toxic vapor represents an asphyxiation hazard.
• Recognize liquid exposure hazards of dermal toxicity, thermal and chemical burns.
How Toxicants Enter Biological Organisms
Toxic hazard is the likelihood of damage to biological organisms based on exposure resulting from transport and other physical factors of usage. Toxicants enter biological organisms by the following routes:
• ingestion: through the mouth into the stomach,
• inhalation: through the mouth or nose into the lungs,
• injection: through cuts into the skin,
• dermal absorption: through skin membrane.
Inhalation and dermal routes are the most significant routes for Process Safety. However, Ingestion Toxicity is important to understand potential environmental impacts of releases.
Toxicological Studies
Acute toxicity is the effect of a single exposure or a series of exposures close together in a short time period. Process Safety considers primarily Acute rather than Chronic toxicity.
• For most toxicological studies, animals are used with the expectation that results be extrapolated to humans.
• The test animal depends on the effects to be measured, cost and availability.
• Dose measurement depends on the methods of delivery. o Ingestion and injection are typically milligrams of agent per kg of body weight. o Inhalation is typically concentration in air (ppm or mg/m3) for a test period.
• Initiating of new animal studies is expensive and a “last resort” in obtaining data
Response to Toxic Dose
There are many modes of action and some chemicals may have more than one mode, resulting in a bimodal distribution of the dose versus response curve. Some chemicals attack the respiratory system (such as acid gases), induce narcosis, and attack the central nervous system or other organs.

Reactivity CHEF Manual
- 34 -
Within a biological species, organisms respond differently to the same dose of a toxicant. These differences are a result of age, weight, diet, general health, and other factors.
:
Figure 4.1 Typical Toxic Dose-Response Curve
Lethal Concentration and Lethal Dose
LC is “Lethal Concentration “. For inhalation experiments, the concentration of the chemical in air that kills 50% of the test animals in a given time (usually four hours) is the LC50 value. The LC10 value is the concen-tration which kills 10% of the test animals in a given exposure time.
LD is “Lethal Dose”. LD50 is the amount of a material, given all at once, which causes the death of 50% (one half) of a group of test animals. The LD50 is one way to measure the short-term poisoning potential (acute toxicity) of a material.
LC50 is used in the comparison of toxicities. For inhalation, LC50 is measured in micrograms (or milligrams) of the material per liter or cubic meter, or in parts per million (ppm) by volume. The lower the concentration, the more toxic the material. Note that LC50 values cannot be directly extrapolated from one specie to another or to humans.
Toxic Criteria for Risk Screening
A simple approach for screening of toxic risk is to specify a concentration criterion above which it is assumed that individuals exposed to this value will be in danger.
There are many criteria promulgated by government agencies and private associations including:
• Emergency Response Planning Guidelines (ERPGs) for air contaminants issued by the American Industrial Hygiene Association (AIHA)
• Immediately Dangerous to Life and Health levels (IDLH) established by NIOSH
• Emergency Exposure Guidance Levels (EEGLs) and Short-term Public Emergency Guidance Levels (SPEGLs) issued by the National Academy of Sciences/National Research Council
• Acute Exposure Guideline Level (AEGL) – a toxic endpoint promulgated by the US EPA as part of the Risk Management Process (RMP)
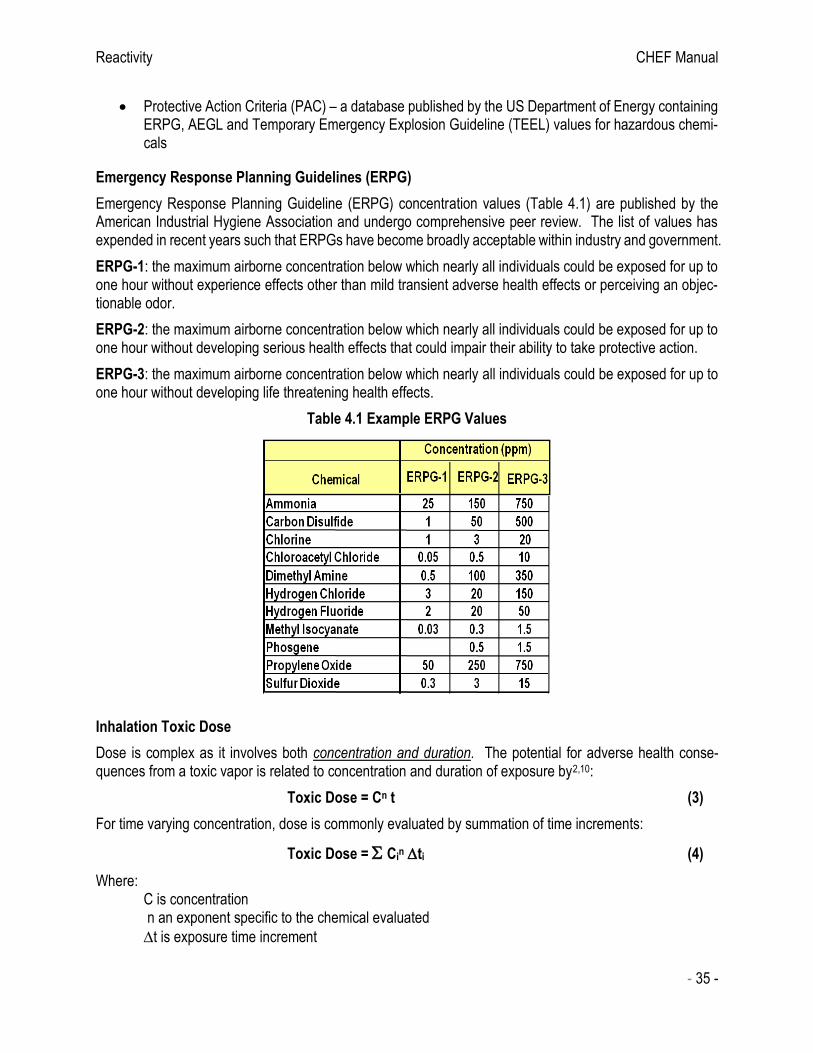
Reactivity CHEF Manual
- 35 -
• Protective Action Criteria (PAC) – a database published by the US Department of Energy containing ERPG, AEGL and Temporary Emergency Explosion Guideline (TEEL) values for hazardous chemi-cals
Emergency Response Planning Guidelines (ERPG)
Emergency Response Planning Guideline (ERPG) concentration values (Table 4.1) are published by the American Industrial Hygiene Association and undergo comprehensive peer review. The list of values has expended in recent years such that ERPGs have become broadly acceptable within industry and government.
ERPG-1: the maximum airborne concentration below which nearly all individuals could be exposed for up to one hour without experience effects other than mild transient adverse health effects or perceiving an objec-tionable odor.
ERPG-2: the maximum airborne concentration below which nearly all individuals could be exposed for up to one hour without developing serious health effects that could impair their ability to take protective action.
ERPG-3: the maximum airborne concentration below which nearly all individuals could be exposed for up to one hour without developing life threatening health effects.
Table 4.1 Example ERPG Values
Inhalation Toxic Dose
Dose is complex as it involves both concentration and duration. The potential for adverse health conse-quences from a toxic vapor is related to concentration and duration of exposure by2,10:
Toxic Dose = Cn t (3)
For time varying concentration, dose is commonly evaluated by summation of time increments:
Toxic Dose = Cin ti (4)
Where: C is concentration n an exponent specific to the chemical evaluated
t is exposure time increment
Reactivity CHEF Manual
- 36 -
For inhalation, values of n ranges from 0.5 to 3 with most chemicals between 1 and 2. A value of 2 if often used if there is not sufficient data at different test durations for estimation of “time scaled” ER values to exposure duration less than one hour. If extrapolation of the “time scaled” ER to greater than one-hour exposure is needed (rare situation), an “n” of 1 is often used.
Estimation of an equivalent toxic dose becomes based on exposure duration divided by test duration raised to the 1/n exponent. The concentration providing a one-hour equivalent dose to a 4-hour test would be twice the test concentration for an exponent of 2.
Inhalation Toxic Mixtures
The ER values for toxic chemicals may be orders of magnitude different from each other.
• Assuming the entire mixture at a toxicity equivalent to the “worst component” may be grossly con-servative.
• Assuming the toxicity of each chemical is independent of other toxic materials in the mixture may underestimate the hazard
The US Department of Energy and others have recommended an “additive” approach (which is similar to Le Chatelier’s rule)7,19.
ERPGMixture = 1 / (yi /ERPGi) (5)
This additive approach is also used for classifying the acute toxicity of mixtures under the United Nations Globally Harmonized System (GHS).
Example Estimation of Equivalent ERPG-3 for Vapor Mixtures
As an example; the estimated ERPG-3 for a mixture of 0.5 mole fraction sulfur dioxide (ERPG-3 of 15 ppm) and 0.5 mole fraction carbon disulfide (ERPG-3 of 500 ppm) is:
ERPG-3mix = 1 / yi / ERPG-3i = 1 / [ 0.5 / 15 + 0.5 / 500 ] = 1 / 0.034 = 29 ppm
Lethality Models
The response versus dose curve shown in Figure 4.1 is not particularly convenient approach for analysis of toxic effects. For single exposures, the probit (probability unit) method provides transformation of the dose-response curve to a straight line. The Probit Model relates log (Dose) with a “Probit Value” as:
Probit = a + b ln(Dose) = a + b ln(Cn t)
The probit value is then related to percent probability using the following graph or table. As examples, the probit for 1% likelihood is 2.67 while that for 50% likelihood is 5.0 from either the graph or table below.

Reactivity CHEF Manual
- 37 -
Figure 4.2 Probits versus Percentages
Table 4.2 Table of Percentage to Probits
Example Estimation of Lethality Using a Probit Model
As an example, the probit model, Probit = a + b ln(Cn t), for chlorine based on a US Coast Guard study have been summarized in Guidelines for Chemical Process Quantitative Risk Analysis, 2nd (CCPS) as:
a = -8.29 b = 0.92 n = 2

Reactivity CHEF Manual
- 38 -
Estimate the 1% lethal concentration for a one-hour exposure to chlorine vapor. Note the above constants use concentration in ppmv and time in minutes. Probit at 1% = 2.67 = -8.29 + 0.92 ln [C2 (60 minutes)] e11.913 = 149200 = C2 (60 minutes) C2 = 2487,
C = 49.9 ppmv
Relationship of Lethality to a Multiple of ERPG-3
• Probit models offer the best relationship for risk analysis, but these models are only available for a limited number of chemicals
• When probit models are unavailable, a short-duration exposure criteria associated with 10% fatality rate might be used for risk analysis screening (e. g., multiple times ERPG-3 for less than 10 minutes)
Dose-response models are available in the open literature. There is significant variability among models as effects are typically extrapolated from animal studies, may be based on a variety of safety factors, and represent assumptions of the portion of highly sensitive people, etc. A conservative “fit” of published proba-bility models versus multiples of ERPG-3 provides a rough estimate of vulnerability to personnel (Figure 4.2). A one-hour exposure to ERPG-3 concentration conservatively represents 1% vulnerability, while a one-hour exposure to 2 times ERPG-3 conservatively represents 10 to 15% vulnerability.
Figure 4.3 Multiple of ERPG-3 Concentration Vs Lethality for 60-minute Exposure
0.10
1.00
10.00
100.00
0.001 0.01 0.1 1
Co
nce
ntr
atio
n /
ERP
G-3
Probability of Severe Toxic Impact
Concentration versus Lethality per Probit Correlations, Guidelines for Chemical Process Quantitative Risk Analysis, CCPS (2000)
Acrolein
Acrylonitrile
Ammonia
Ammonia
Benzene
Bromine
Carbon Monoxide
Carbon Tetrachloride
Chlorine
Chlorine
Formaldehyde
Hydrogen Chloride
Hydrogen Chloride
Hydrogen Cyanide
Hydrogen Fluoride
Hydrogen Fluoride
Hydrogen Sulfide
Methyl Bromide
Methyl Isocyanate
Nitrogen Dioxide
Phosgene
Propylene Oxide
Sulfur Dioxide
Toluene
Model

Reactivity CHEF Manual
- 39 -
People in Occupied Buildings
A simple Effect Zone approach is not effective for Occupied Buildings as not all personnel within a building are typically impacted to the same extent. In these cases, the fraction of people impacted or “vulnerability” is estimated from inhalation of toxic chemicals or level of explosion damage.
Asphyxiation
Hazards with gas or vapor inhalation also includes asphyxiation (Table 4.2). Relatively non-toxic chemicals may pose an asphyxiation hazard, particularly for release within an enclosed process area. The oxygen content may be estimated as: associated
Average Percent Oxygen = 21 (1 – CIndoor/ 1000000) (6)
where CIndoor is the concentration of released material within an enclosed area in ppm.
• Faulty judgment and disorientation occurs at 12-16% oxygen which may be a reasonable level to consider as severe impact in Risk Analysis.
• Less than 19.5 percent oxygen represents the level at which supplied breathing air is required by OSHA.
Table 4.2 Effects of Oxygen Deficiency

Reactivity CHEF Manual
- 40 -
Dermal Toxicity
Dermal Toxicity is a key parameter for evaluation of exposure to liquids. It depends on the toxicity of the material, rate of absorption, and body area exposed. It is difficult to quantify dermal exposure as the rate of toxicant absorbed through the skin is not easily estimated. Most chemicals are not readily absorbed unless the skin is damaged from thermal or chemical burns. There are some exceptions, Phenol, for example, requires only a small area of skin to be exposed for a sufficient quantity to be absorbed resulting in death. Exposure to hydrofluoric acid to an area the size of your hand can cause death.
The European Dangerous Substances Directive for Classification and Labeling of Chemicals provides a rel-ative measure for Dermal Toxicity based on data.
• Fatal, Very Toxic – Dermal LD50, < 200 mg/kg (Fatal in Contact with Skin, Very Toxic in Contact with Skin) with Category 1 as Dermal LD50 < 50 mg/kg.
• Toxic – Dermal LD50, between 200 and 1000 mg/kg (Toxic in Contact with Skin)
• Harmful – Dermal LD50 between 1000 and 2000 mg/kg (Harmful I in Contact with Skin)
Such a relative measure (very toxic, toxic, or harmful) is sufficient in simple Risk Analysis to qualitatively estimate the impact from dermal exposure. Wearing protective clothing is very important in managing dermal toxicity issues.
As a point of reference, “fatal” or “very toxic” (200 mg/kg) would correlate to 10 to 20 grams (or 0.05 to 0.1 cup of liquid) absorbed through the skin for 50% lethality.
Thermal/ Chemical Burns
For Thermal or Chemical Burns, response depends upon the fraction of body area damaged – roughly 10% lethality at 25% and 50% at 50% of body area receiving 2nd or 3rd degree burns (Figure 4.3).
:
Figure 4.4 Estimation of Percent Body Surface
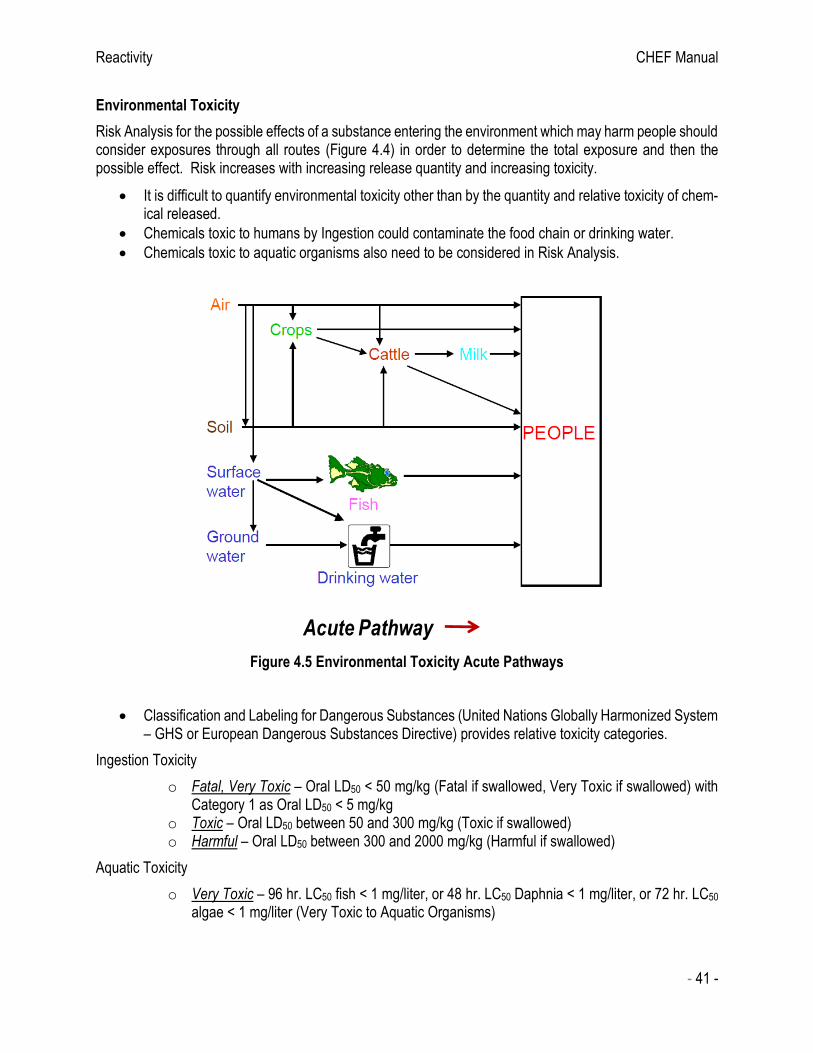
Reactivity CHEF Manual
- 41 -
Environmental Toxicity
Risk Analysis for the possible effects of a substance entering the environment which may harm people should consider exposures through all routes (Figure 4.4) in order to determine the total exposure and then the possible effect. Risk increases with increasing release quantity and increasing toxicity.
• It is difficult to quantify environmental toxicity other than by the quantity and relative toxicity of chem-ical released.
• Chemicals toxic to humans by Ingestion could contaminate the food chain or drinking water.
• Chemicals toxic to aquatic organisms also need to be considered in Risk Analysis.
Figure 4.5 Environmental Toxicity Acute Pathways
• Classification and Labeling for Dangerous Substances (United Nations Globally Harmonized System – GHS or European Dangerous Substances Directive) provides relative toxicity categories.
Ingestion Toxicity
o Fatal, Very Toxic – Oral LD50 < 50 mg/kg (Fatal if swallowed, Very Toxic if swallowed) with Category 1 as Oral LD50 < 5 mg/kg
o Toxic – Oral LD50 between 50 and 300 mg/kg (Toxic if swallowed) o Harmful – Oral LD50 between 300 and 2000 mg/kg (Harmful if swallowed)
Aquatic Toxicity
o Very Toxic – 96 hr. LC50 fish < 1 mg/liter, or 48 hr. LC50 Daphnia < 1 mg/liter, or 72 hr. LC50 algae < 1 mg/liter (Very Toxic to Aquatic Organisms)
Acute Pathway

Reactivity CHEF Manual
- 42 -
o Toxic – 96 hr. LC50 fish between 1 and 10 mg/liter, or 48 hr. LC50 Daphnia between 1 and 10 mg/liter, or 72 hr. LC50 algae between 1 and 10 mg/liter (Toxic to Aquatic Organisms)
o Harmful – 96 hr. LC50 fish between 10 and 100 mg/liter, or 48 hr. LC50 Daphnia between 10 and 100 mg/liter, or 72 hr. LC50 algae between 10 and 100 mg/liter (Harmful to Aquatic Or-ganisms)
Reactivity CHEF Manual
- 43 -
5. REACTIVITY
Evaluation of reactivity hazards often involves interpretation of reactive chemicals test data. Endothermic reactions represent a potential hazard if gaseous or highly volatile products are generated. Exothermic re-actions have the potential for a runaway reaction leading to a dramatic increase in temperature, pressure (if the reaction is contained) and reaction rate.
Module Objectives
In this module you will learn:
• To identify where unintended reactions may occur in a chemical process.
• To recognize Reactive Chemicals test methods and where to obtain data.
• To recognize an Inter-Reactivity Chart.
• The concept of Heat of Reaction and be able to estimate Maximum Reaction Temperature and Pres-sure.
• Guidance criteria for when additional Reactive Chemicals Testing is appropriate.
• The concept of simple kinetic modeling to evaluate the Temperature of No Return, Time to Maximum Rate, and potential for Autocatalytic Behavior.
• Recognize common process upsets that impact reactivity hazards.
Reactivity Hazards Evaluation
The US Chemical Safety and Hazard Investigation Board analyzed 167 serious incidents in the US involving Reactive Chemicals from 1980 through 2001. 48 of these incidents resulted in 108 fatalities. They concluded that Reactive Chemicals incidents represent a significant safety problem and recommended that awareness of reactivity hazards be improved.
Regular reviews of process reactive hazards are needed for existing processes, new processes and when-ever key personnel or a process is changed, as well as a thorough review of laboratory or pilot plant data prior to scale-up.
Appendix A presents a Reactive Chemicals checklist that was developed by members of the CCPS.
The Search for Reactivity Hazards
Raw materials, process streams, products and waste of any process must be reviewed and evaluated to determine if any potential reactive chemical hazards are involved. Endothermic reactions represent a poten-tial hazard if gaseous or highly volatile products are generated. Exothermic reactions with all reactants ini-tially present have the potential for a runaway reaction leading to a dramatic increase in temperature, pres-sure (if the reaction is contained) and reaction rate.
In general, if insufficient data are available, then the materials should be subjected to screening evaluations or tests.
Essential Practices for Managing Chemical Reactivity Hazards (Johnson, Rudy and Unwin, CCPS, 2003) provides a method for preliminary screening for reactivity hazards.
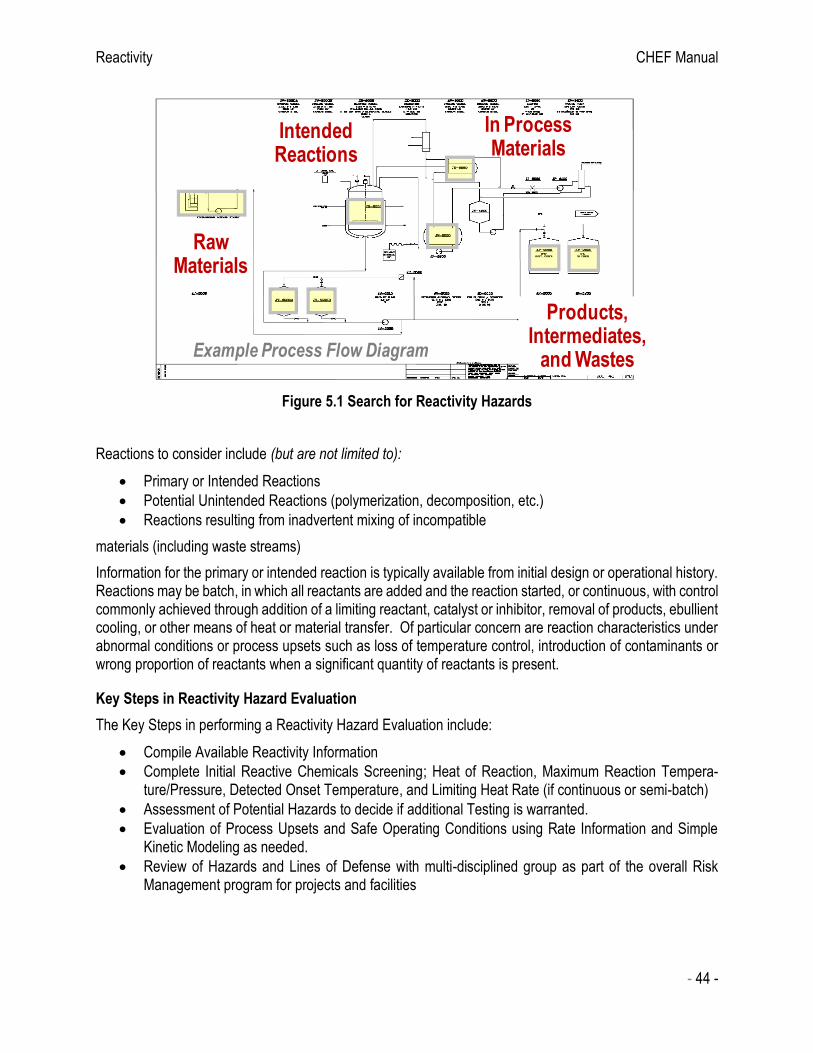
Reactivity CHEF Manual
- 44 -
Figure 5.1 Search for Reactivity Hazards
Reactions to consider include (but are not limited to):
• Primary or Intended Reactions
• Potential Unintended Reactions (polymerization, decomposition, etc.)
• Reactions resulting from inadvertent mixing of incompatible
materials (including waste streams)
Information for the primary or intended reaction is typically available from initial design or operational history. Reactions may be batch, in which all reactants are added and the reaction started, or continuous, with control commonly achieved through addition of a limiting reactant, catalyst or inhibitor, removal of products, ebullient cooling, or other means of heat or material transfer. Of particular concern are reaction characteristics under abnormal conditions or process upsets such as loss of temperature control, introduction of contaminants or wrong proportion of reactants when a significant quantity of reactants is present.
Key Steps in Reactivity Hazard Evaluation
The Key Steps in performing a Reactivity Hazard Evaluation include:
• Compile Available Reactivity Information
• Complete Initial Reactive Chemicals Screening; Heat of Reaction, Maximum Reaction Tempera-ture/Pressure, Detected Onset Temperature, and Limiting Heat Rate (if continuous or semi-batch)
• Assessment of Potential Hazards to decide if additional Testing is warranted.
• Evaluation of Process Upsets and Safe Operating Conditions using Rate Information and Simple Kinetic Modeling as needed.
• Review of Hazards and Lines of Defense with multi-disciplined group as part of the overall Risk Management program for projects and facilities
Raw Materials
Intended Reactions
Products, Intermediates,
and Wastes
In Process Materials
Example Process Flow Diagram

Reactivity CHEF Manual
- 45 -
These steps are intended to minimize the overall time and cost for Reactivity Hazard Evaluation. An effective Reactivity Hazard Evaluation should be a collaborative effort of Plant Personnel, Technology Experts, and Reactive Chemicals Experts.
Reactive Chemicals Screening
There are several sources of Reactive Chemicals information. The heat of reaction for known or proposed chemistry may be found in the open literature or estimated from the difference between heats of formation and thermodynamic properties of products and reactants. The following is a list of common information sources from least to most costly:
• Reactive Chemicals Databases
• Literature
• Estimation from Heats of Formation
• Calorimetry o Mixing Calorimetry (2-Drop) o Differential Scanning Calorimetry (DSC) o Accelerating Rate Calorimetry (ARC) o Reactive System Screening Tool (RSST) o Vent Sizing Package (VSP) o Others
• Development of complete Kinetic Models
Key Reactivity Hazard Screening Information
Key Reactivity Hazard Screening information includes:
• Heat of Reaction per Mass
• Estimate of Maximum Reaction Temperature and Pressure
• Detected Onset Temperature
• Chemicals containing highly energetic functional groups (such as nitro, epoxides, peroxides, etc.) that may indicate shock sensitive or “explosive” instability
Initial screening of reactivity by heat of reaction per mass and maximum reaction pressure allows focus on the highest hazards. Those reactions representing significant hazards are candidates for reactive chemicals testing and further evaluation.:
Categorization of Reactivity Hazard from Heat of Reaction per Mass
Low to Medium Energy Release Potential – Less exothermic than –50 J/g (Adiabatic temperature rise typically will be less than 25 C)
High Energy Release Potential – Between -50 and -1000 J/g (In this region, reaction vapor pressure and rate may result in catastrophic failure of process equipment and vessels)
Potentially Explosive – More exothermic than -1000 J/g (Reactions capable of deflagration and deto-nation)
Reactivity CHEF Manual
- 46 -
Estimation of the Maximum Reaction Temperature and Pressure
In addition to reaction energy release potential, excessive pressure may indicate a significant Reactivity Haz-ard. Key questions are:
• Could the maximum reaction pressure exceed the equipment design such that catastrophic failure or rupture might occur?
• Could the maximum reaction pressure exceed the relief device set pressure resulting is a hazardous chemical release?
The maximum adiabatic reaction temperature for a batch system may be estimated from the Heat of Reaction per Mass and the heat capacity of the reaction mixture as:
Tmax = T0 - HR / C (7)
Note that heat evolved is a negative value by convention. The corresponding maximum pressure for a liquid phase reaction may be estimated as:
Pmax = PPad (Tmax/T0) + PVP@Tmax + R Tmax (VL/VV) (8)
where: T0 is the initial temperature PPad is initial pad gas pressure
HR is heat of reaction per mass
is mole gas created per liquid volume C is liquid heat capacity R is gas law constant
VL/VV is ratio of liquid to vapor volume in equip-ment or vessel PVP@Tmax is vapor pressure at maximum tempera-ture
Note that the gas generation term in the above equation is based on an ideal gas with no liquid solubility.
For example, if = 0.1 mole gas created per liter of liquid at a maximum of 300 K in a vessel with liquid fill
fraction of 0.8, then the contribution of gas generation to the overall pressure is R Tmax (VL/VV) = 0.1 (0.082 mole/liter-atm-K) 300 K (0.8 fraction liquid / 0.2 fraction vapor) = 9.84 atm.
The maximum temperature for a continuous reaction is typically evaluated from an overall energy balance based on reactant feed rate. The maximum pressure for a vapor phase reaction may be estimated using the ideal gas law and the moles of products minus reactants plus inert materials, equipment or vessel volume, at the maximum reaction temperature.
Example Estimation of Maximum Reaction Temperature and Pressure
The heat evolved from diluting concentrated sulfuric acid to a 50 wt% solution is approximately -180 cal/g H2SO4 or -90 cal/g 50% solution. The average liquid heat capacity for this solution over the concentration range is 0.47 cal/g C. The maximum adiabatic temperature starting from 25 C (298 K) is:
Tmax = T0 - HR / C = 25 + 90 / 0.47 = 216.5 C or 489.5 K
Starting initially at atmospheric pressure, the initial pad gas is 0.99 atmosphere (or 1 atmosphere minus the vapor pressure at 25 C). The vapor pressure of 50% sulfuric acid at 216.5 C is 11.4 atmosphere. The corresponding maximum pressure (assuming adiabatic conditions) is:
Pmax = PPad (Tmax / T0) + PVP@Tmax = 0.99 ( 489.5 / 298 ) + 11.4 = 13 atmosphere

Reactivity CHEF Manual
- 47 -
Example Estimation of Maximum Reaction Pressure from Gas Generation
A liquid phase endothermic reaction (absorbs heat) generates 0.1 moles of gaseous products per liter of reaction mass. Estimate the maximum pressure at a temperature of 100 C (373 K), a vapor pressure of the non-gaseous mixture of 2.0 atmospheres, and a liquid fill fraction of 0.8. Ignore any initial pad gas. Use a gas law constant, R = 0.082 liter atmosphere/mole K.
Pmax = PVP@Tmax + R Tmax (VL/VV)
= 2 atmopsheres + 0.1 mole/liter (0.082) (373 K) (0.8 volume liquid / 0.2 volume vapor)
= 14.2 atmospheres
Compatibility Charts
Compatibility Charts are commonly used to summarize potential hazards for mixing binary combinations of chemicals within a manufacturing facility. This information in combination with equipment and plant layout information may help to identify specific reaction scenarios for hazard evaluation. Examples include the unintended transfer of material to the wrong tank, spills within production area where multiple chemicals are handled or stored (acids, bases, water, etc.), or reactions with heat transfer fluids or materials of construction.
The Chemical Reactivity Worksheet (CRW) is a free software program you can use to find out about the chemical reactivity of thousands of common hazardous chemicals, compatibility of absorbents, and suitability of materials of construction in chemical processes. It is available from the CCPS website at:https://www.aiche.org/ccps/resources/chemical-reactivity-worksheet-40
Figure 5.2 is an example of a compatibility chart created using CRW
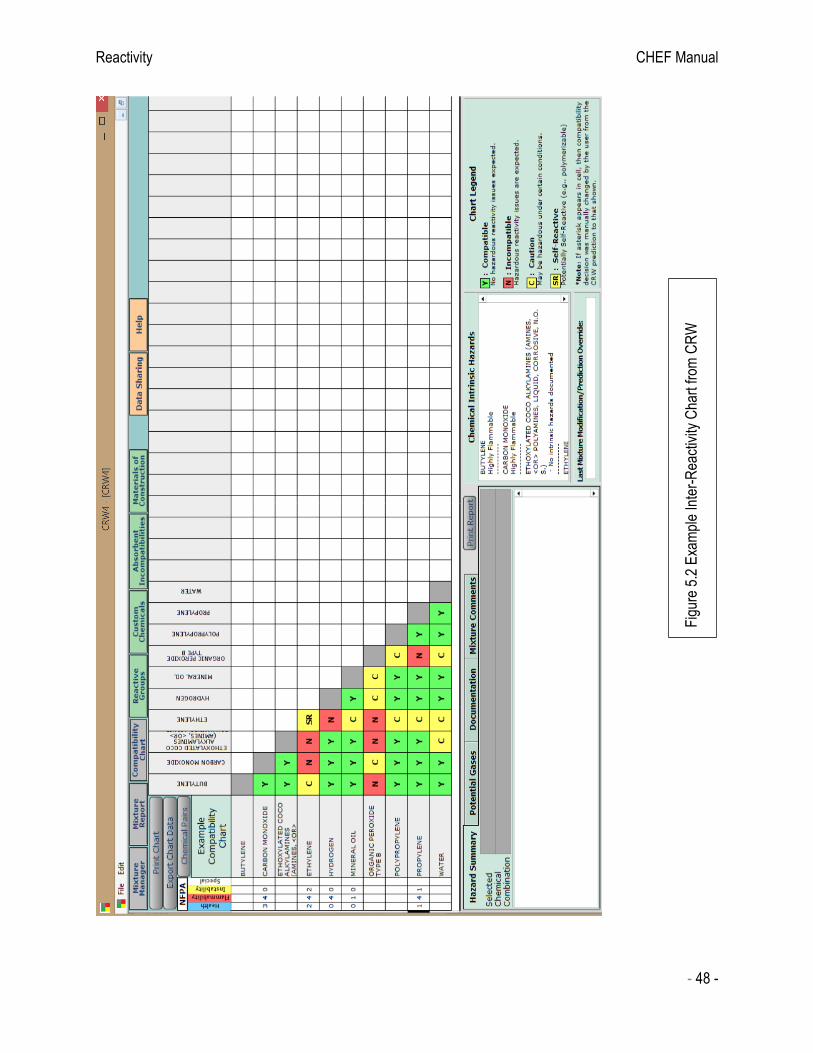
Reactivity CHEF Manual
- 48 -
Fig
ure
5.2
Exa
mpl
e In
ter-
Rea
ctiv
ity C
hart
from
CR
W

Reactivity CHEF Manual
- 49 -
Highly Energetic Reactions
There are several known reactions involving chemical structures of high energy. Examples are shown in the table below.
Table 5.1 Examples of High Energy Molecular Structures
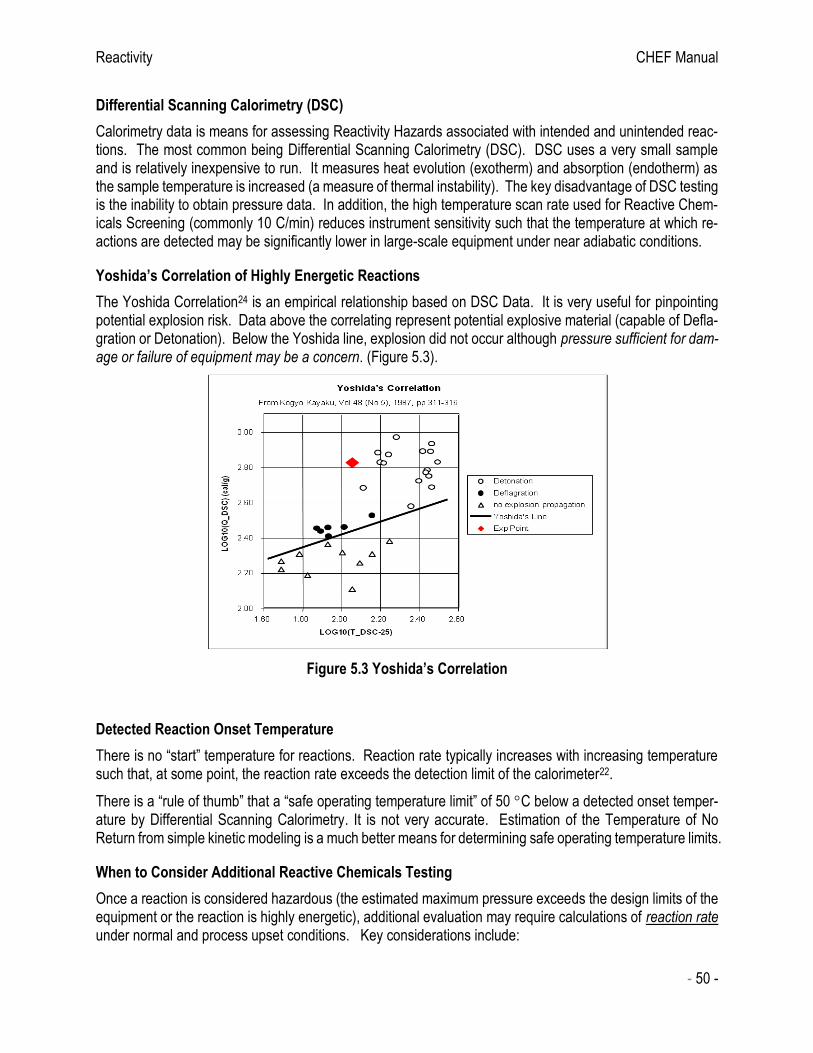
Reactivity CHEF Manual
- 50 -
Differential Scanning Calorimetry (DSC)
Calorimetry data is means for assessing Reactivity Hazards associated with intended and unintended reac-tions. The most common being Differential Scanning Calorimetry (DSC). DSC uses a very small sample and is relatively inexpensive to run. It measures heat evolution (exotherm) and absorption (endotherm) as the sample temperature is increased (a measure of thermal instability). The key disadvantage of DSC testing is the inability to obtain pressure data. In addition, the high temperature scan rate used for Reactive Chem-icals Screening (commonly 10 C/min) reduces instrument sensitivity such that the temperature at which re-actions are detected may be significantly lower in large-scale equipment under near adiabatic conditions.
Yoshida’s Correlation of Highly Energetic Reactions
The Yoshida Correlation24 is an empirical relationship based on DSC Data. It is very useful for pinpointing potential explosion risk. Data above the correlating represent potential explosive material (capable of Defla-gration or Detonation). Below the Yoshida line, explosion did not occur although pressure sufficient for dam-age or failure of equipment may be a concern. (Figure 5.3).
Figure 5.3 Yoshida’s Correlation
Detected Reaction Onset Temperature
There is no “start” temperature for reactions. Reaction rate typically increases with increasing temperature such that, at some point, the reaction rate exceeds the detection limit of the calorimeter22.
There is a “rule of thumb” that a “safe operating temperature limit” of 50 C below a detected onset temper-ature by Differential Scanning Calorimetry. It is not very accurate. Estimation of the Temperature of No Return from simple kinetic modeling is a much better means for determining safe operating temperature limits.
When to Consider Additional Reactive Chemicals Testing
Once a reaction is considered hazardous (the estimated maximum pressure exceeds the design limits of the equipment or the reaction is highly energetic), additional evaluation may require calculations of reaction rate under normal and process upset conditions. Key considerations include:

Reactivity CHEF Manual
- 51 -
• Significant pressure generated
• Highly energetic reaction
• Change in the process or operating conditions
• Change of scale
• Needed for equipment or pressure relief design
The experimental data needed depends on the specific questions to be addressed. Accelerating Rate Cal-orimetry (ARC) may be appropriate for evaluating process upsets needing confined pressure and tempera-ture rate information. Data from the Vent Sizing Package (VSP) or Reactive System Screening Tool (RSST) may be appropriate if the need is evaluation of emergency pressure relief requirements.
Accelerating Rate Calorimetry (ARC)
Accelerating Rate Calorimetry measures heat evolution (exotherm) and pressure under near adiabatic con-ditions. It uses a larger sample size than DSC and is a more expensive test. Test results provide self heat rate and pressure versus temperature which may be used in the development of simple kinetic models. Me-chanical stirring is also available with the ARC such that mixing effects may be evaluated (such as reactants in separate phases – two liquids or solid liquid reactions)
Vent Sizing Package™ (VSP)
The Vent Sizing Package is commonly used for sizing relief devices for large scale reaction/fire scenarios. Test results may be applied directly to large scale equipment without correction for the sample container heat losses.
Simple Kinetic Modeling to Obtain Reaction Rate Information
Utilizing rate information will involve some level of kinetic modeling to extrapolate the Reactive Chemicals data to plant conditions. Various reaction schemes may be assumed to determine which provides a “best” fit for Activation Energy and Initial Rate (at the specified Initial Temperature) for batch reactions. Simple kinetic parameters may also be developed from conversion correlated by pressure data and estimated gas generation. Often a simple zero or first order model provides sufficient accuracy in the region of interest for screening of reactivity hazards.
A simple “first-order” kinetic model results from a “best” fit of the test data to:
Reaction Rate = r0 (1-X) exp [ E / R (1/T0 – 1/T)] (9)
where: X = conversion determined by temperature rise, X=(T-T0)/(TFinal-T0) or by gas evolution. T, T0 = temperature and initial temperature respectively (K)
E = Activation Energy (energy/mole) R = gas law constant (energy/mole K) r0 = initial reaction rate at the initial temperature, T0
Activation Energy, E, determines the slope of reaction rate with temperature. The initial Temperature-Rate pair (T0, r0) determines a starting point for the model representing near zero conversion of reactants.

Reactivity CHEF Manual
- 52 -
Figure 5.4 Example ARC Temperature Rate vs Temperature Plot
Temperature of No Return
A key to managing reactivity hazard for an exothermic batch reaction is maintaining a normal operating tem-perature below the temperature at which reaction heat gain exceeds heat loss to the surroundings. Beyond the Temperature of No Return, if no action is taken, the reaction will proceed to a maximum rate.
Figure 5.5 Temperature of No Return
Reactivity CHEF Manual
- 53 -
The Temperature of No Return, TNR, is commonly used to determine Safe Operating Conditions23. It is nor-mally determined by trial-and-error methods or graphically. Of interest is the temperature at which the reac-tion proceeds in the absence of cooling (when heat loss is by convection to ambient) and the temperature at which control is lost with cooling (when the heat transfer coefficient and temperate reflect that for the cooling media).
The Temperature of No Return is highly dependent on the equipment size. TNR is a function of convec-tive heat loss, which depends on equipment surface area, and effectiveness of insulation. The TNR for small equipment with high surface area to volume may be significantly higher (50 C or more) than for large insulated equipment.
Reactivity Screening
The Time to Maximum Rate, tMR, from any initial temperature may be estimated by integrating the appropriate kinetic rate model. It gives an indication of time frame in which action must be taken to regain control of the reaction system. For a zero-order adiabatic reaction, it is estimated as23:
tMR = R T02 / ( q0 E ) (10)
where: q0 = adiabatic self heat rate at the initial temperature (degree/time) T0 = initial temperature respectively (K)
E = Activation Energy (energy/mole) R = gas law constant (energy/mole K)
Autocatalytic Behavior
Reactions exhibiting autocatalytic behavior may appear to be thermally stable due to an “induction period”. For these systems, the self-heat rate is near zero initially (at zero conversion) and accelerates to a maximum rate under isothermal conditions. Another indication of autocatalytic behavior is an unusually high Activation Energy for simple first-order fit to temperature rate data. The simple screening correlations for Temper-ature of No Return and Time to Maximum Rate are not valid for chemicals exhibiting Autocatalytic Behavior such as an inhibited monomer.
Evaluation of Common Process Upsets involving Reactions
In some cases, an estimation of the impact of a process upset may be evaluated by adjustment of appropriate kinetic parameters. Common process upsets of interest are:
▪ External heat plus reaction ▪ Misloading or Recipe Deviation ▪ Catalytic effects ▪ “Pooling” of reactants
External heat may result from a heat transfer surface, mechanical energy such as an agitator or circulating pump, or a fire. The primary impact of external heat is an increase in temperature without consuming reac-tants. At temperatures where reaction heat rate is much less than the external heat input, reaction conversion is essentially zero and total heat rate is only attributed to the external source. The maximum reaction tem-perature, pressure, and heat rate are much higher with external heat input.

Reactivity CHEF Manual
- 54 -
Misloading or Recipe Deviation may result in a change in heat of reaction per mass which affects the maximum temperature and the heat rate. More concentrated exothermic reactions generate more total reac-tion heat per mass.
Introduction of a Catalytic Impurity may significantly increase the rate constant and overall self heat rate for exothermic reactions (such as metals contamination of peroxides). Chemicals normally maintained within safe operating limits may quickly progress to potential runaway conditions upon the addition of impurities or loss of inhibitors.
A common means for controlling an exothermic reaction is by slow addition of a limiting reagent such that the overall reaction heat rate is proportional to the addition rate. “Pooling” of reactants occurs if the con-centration of limiting reagent is allowed to increase – typically by loss of mixing or low temperature.

Risk. Analysis CHEF Manual
- 55 -
6. HAZARD EVALUATION
Hazard Evaluation is an organized effort to identify and analyze “what can go wrong” in a chemical process. Fortunately, the number of catastrophic incidents is very small relative to the total number of incidents or near misses each year. Most of us will not personally experience a catastrophic incident during our career. This may present a challenge in appreciating the importance in developing a thorough Hazard Evaluation.
Module Objectives
In this module you will learn:
• Understand when to begin Hazard Evaluation.
• Understand what information is needed for Hazard Evaluation.
• Recognize Fire and Explosion Index and Chemical Exposure Index.
• Be able to define a Scenario.
• Match phrases related to the concepts of a Hazard and Operability (HAZOP) Study.
• Be able to use HAZOP keywords to identify process upsets that could lead to an incident.
• Understand basic concepts for screening feasible scenarios.
Non-Scenario and Scenario Based Hazard Evaluation Techniques
Hazard Evaluation involves both experience-based and predictive techniques1. It should be performed sev-eral times throughout the life of a process. Non-scenario-based techniques rely primarily on experience and focus on major risks within process units. These techniques may also identify design criteria or alternatives that could reduce hazards.
Non-Scenario Based Techniques
• Reactive Chemicals/Process Hazard Reviews • Checklist Analysis • Relative Ranking Indices
Scenario Based Techniques
• Defining a Scenario • What-If Analysis • Hazard and Operability Analysis (HAZOP)
Hazard Identification and Risk Analysis
What are the Hazards?
What can go Wrong?
How Bad could it Be?
How Oftenmight it
Happen?
Is the Risk Tolerable?
Identify Chemical
and ProcessHazards
Estimate Frequency
Analyze Consequences
AnalyzeRisk
IdentifyAdditional Safeguards as Needed
DevelopScenarios
Identify Equipment
or Activity to
be Analyzed
Manage Barriers
for Life Cycle of Facility
Risk. Analysis CHEF Manual
- 56 -
• Other Methods (Fault Tree, Event Tree, etc.)
Scenario based techniques are predictive and commonly used in performing more detailed analysis of a wide range of hazards during the design phase of a process and during routine operation. As these techniques are based on a common denominator, the scenario, the analysis may be used to systematically determine what can go wrong. Results are often scenarios appropriately structured for continuation into Barrier Analysis, Layers of Protection Analysis, or Quantitative Risk Analysis.
Each method or technique has strengths and weaknesses. Different techniques may be better suited for highly hazardous portions of the process (versus less hazardous units). It is best to combine methods to gain the advantages of creative techniques such as brainstorming with more structured approaches such as checklists and HAZOP. Each technique is more thorough and effective when performed by an experienced team.
When to Perform Hazard Evaluation
Hazard Evaluation should be performed several times throughout the life of a process.
• For capital projects, start “non-scenario based” techniques early as the plant is beginning the equip-ment layout. Continue updating the Hazard Identification as design information becomes available.
• Begin using “scenario based” techniques as equipment design pressure and relief device set pres-sure is determined
• Finalize the Hazard Evaluation once Piping and Instrument Diagrams are complete and equipment interconnectivity is known (and before final capital authorization)
• Update the Hazard Evaluation for existing facilities as part of periodic revalidation.
Preparing for Hazard Evaluation
The appropriate objective for a hazard evaluation depends upon several factors, including the life cycle phase the project is in when the hazard evaluation is performed. As a project evolves, the types of hazardous situ-ations investigated change from general questions about basic process chemistry to more detailed questions about equipment and procedures. If the hazard evaluation is being done to comply with regulatory require-ments, the process covered by regulation must clearly be identified. Depending on the objectives, the bound-aries of the study may be drawn to include only injury impacts or, more broadly to include non-injury commu-nity impacts, property damage, business interruption, and/or environmental impacts, with a threshold severity also drawn for each additional type of impact.
The composition of the team performing a hazard evaluation is essential to the success of the study. The level and types of skills that personnel must have to participate in hazard evaluations depend upon several factors, including the type and the complexity of process or operation analyzed, the hazard evaluation tech-nique selected, and the objective of the analysis.
• The team leader (or facilitator) provides direction for the analysis, organizes and executes analysis activities, and facilitates any team meetings that may be held as part of the study.
• A scribe or note taker is typically designated to formally document the discussions that take place during studies. If using a computer-based means of documenting the hazard evaluation, this individ-ual will also need to be proficient in the use of both the hardware and the software that is employed.
• The remainder of the evaluation team is composed of contributors or experts in various aspects of the design and operation of the process being evaluated.

Risk. Analysis CHEF Manual
- 57 -
Process Equipment to Include in a Hazard Evaluation Study
Process hazards typically depend upon a chemical or physical property (such as a flammable limit or vapor pressure), process conditions (such as temperature, pressure, or flow rate) and equipment parameters (such as volume and maximum allowable working pressure). Any unit operation (or major equipment item) within the scope or boundaries of the chemical process where a hazard is recognized is typically included in the scope of the Hazard Evaluation study. Process hazards typically depend upon a chemical or physical prop-erty (such as a flammable limit or vapor pressure), process conditions (such as temperature, pressure, or flow rate) and equipment parameters (such as volume and maximum allowable working pressure). Any unit operation (or major equipment item) within the scope or boundaries of the chemical process where a hazard is recognized is typically included in the scope of the Hazard Evaluation study.
Figure 6.1 Example Equipment Depiction on Process Flowsheet
Hazard Identification typically begins with a review Index Flowsheets, Process Flowsheets, or Block Flow Diagram of the process (using whatever level of detail is available). Ultimately, Piping and Instrument Dia-gram (P&ID) level details may be needed to pinpoint potential backflow and other interconnectivity issues.
Key Process Information Needed for Hazard Evaluation
The more information and knowledge one has about a process, the more thorough and valuable the hazard identification can be. Ultimately, the quality of any hazard evaluation depends directly on the quality of the information available to the analysis team.
Process Description – A compilation of information needed as input for process risk analysis including:
• Chemical related properties
• Process conditions
• Equipment design parameters
• Site and plant layout
• Procedures and policies
Risk. Analysis CHEF Manual
- 58 -
Chemical related properties include molecular weight, physical state, vapor pressure, liquid density, liquid heat capacity, and heat of vaporization. Chemical properties also include flash point, flammable limits, min-imum ignition energy, Emergency Response Planning Guideline (ERPG) concentrations, NFPA ratings or European Risk Phrases, and other chemical information one might find associated with a Material Safety Data Sheet.
Process conditions include temperature, pressure, feed rate and feed pressure. Batch versus continuous operation, batch processing steps, maintenance of an inert atmosphere, and potential for plugging or corro-sion issues also represent process conditions.
Equipment design parameters include equipment type, volume, design pressure, surface area, pipe diam-eter and length, motor size, and material of construction. Depending upon the type of equipment, heat trans-fer area and heating or coolant temperature, relief device type and set pressure, and type of insulation are also equipment parameters.
Site and plant layout includes spacing to occupied buildings and number of occupants, distance to local (off-site) population, size of spill containment, volume of indoor process areas, and distance to fired equip-ment. Assessment for access of emergency services, drainage, process area congestion and confinement, and potential to spill to waterways or other layout information may be needed.
Procedures and policies will also impact chemical process risk assessment. The failure frequency for piping and equipment is dependent on design and inspection practices. The effectiveness of return to oper-ations procedures following maintenance or daily equipment checks impacts the frequency of many “loss of containment” events. Corporate standards and regulatory requirements establish many of the policies and procedures that are routinely practiced.
Process Hazard Assessments
Government regulations require periodic Process Hazard Assessments for existing facilities, in addition to unannounced external audits. There is a good chance that most of us will be involved in one or more of these reviews.
When performed on existing facilities, the Process Hazard Assessment typically involves a walk-through inspection that can vary from an informal, routine visual examination to a formal team examination that takes several weeks. For processes that are still being designed, a design project team might, for example, review a set of drawings during a meeting.
A Process Hazard Assessment includes interviews with people in the plant: operators, maintenance staff, engineers, management, safety staff, and others, depending upon the plant organization. If performed on an existing facility, the review should start with a general orientation tour of the plant and progress to specific inspections and interviews. The review team may cover the relevant emergency procedures with operating personnel in a “roundtable” discussion.
The personnel assigned to the Review must be very familiar with safety standards and procedures. Special technical skills and experience are helpful for evaluating instrumentation, electrical systems, pressure vessels, process materials and chemistry, and other special-emphasis topics.

Risk. Analysis CHEF Manual
- 59 -
Checklist Analysis
The Checklist Analysis approach is easy to use and can be applied at any stage of the process’s lifecycle.
• Checklists are used primarily to ensure that organizations are complying with standard practices.
• Checklists are limited by their authors’ experience; therefore, they should be developed by authors with varied backgrounds who have extensive experience with the systems they are analyzing.
Example checklist questions for the inherent safe design of a facility (typically used during the early design phase)1:
Substitution
o Can a flammable solvent be replaced with water? o Is it possible to completely eliminate hazardous raw materials, process intermediates, or by-products
by using an alternative process or chemistry?
Minimization
o Can hazardous finished product inventory be reduced? o Can alternative equipment with reduced hazardous material inventory be used, such as o Flash dryers in place of tray dryers? o Continuous in-line mixers (static mixers) in place of mixing vessels or reactors?
Moderation
o Is it possible to limit the supply pressure of raw materials to less than the maximum allowable working pressure of the receiving equipment?
o Is it possible to make the reaction conditions (temperature, pressure) less severe by using a catalyst or a better catalyst?
Simplification
o Can equipment be designed such that it is difficult or impossible to create a potentially hazardous situation due to an operating or maintenance error, such as by
o Easy access and operability of valves to prevent inadvertent errors? o Elimination of all unnecessary cross-connections?
Relative Ranking
This technique allows hazard analysts to compare the attributes of several processes or activities to deter-mine whether they possess hazardous characteristics that are significant enough to warrant further study. Relative Ranking methods are used to determine the process areas or operations that are the most significant with respect to the hazard of concern, the potential severity of consequences, or the overall risk in a given study.
• Fire and Explosion Index (F&EI) – Evaluates the fire and explosion hazards associated with dis-crete “process units” considering material properties, process conditions, operating characteristics, distance from adjoining areas, the existence of safety and fire protection systems, etc.
• Chemical Exposure Index (CEI) – Addresses factors that can influence the effects of a chemical release: acute toxicity, volatile portion of material that could be released, distance to areas of con-cern, and various process parameters such as temperature, pressure, reactivity, etc.

Risk. Analysis CHEF Manual
- 60 -
Scenario-Based Hazard Evaluation Definitions
Definitions used in Scenario-based evaluations, consistent with several publications from the Center for Chemical Process Safety literature include:
• Event – An occurrence involving a process that is caused by equipment performance or human action or by an occurrence external to the process.
• Event Sequence – A specific, unplanned series of events composed of an initiating event and interme-diate events that may lead to an incident.
• Loss Event – Point in time in an abnormal situation when an irreversible physical event occurs that has the potential for loss and harm impacts. Examples include release of a hazardous material, ignition of flammable vapors or ignitable dust cloud, and over-pressurization rupture of a tank or vessel.
• Initiating Event – the first event in an event sequence and marks the transition from a normal to an abnormal situation.
• Incident Outcome – The physical manifestation of the incident: for toxic materials, the incident outcome is a toxic release, while for flammable materials; the incident outcome could be a boiling liquid expanding vapor explosion (BLEVE), flash fire, vapor cloud explosion (VCE), etc.
• Scenario – A detailed description of an unplanned event or incident sequence that results in a loss event and its associated impacts, including the success or failure of safeguards involved in the incident se-quence.
Scenario Development
Scenario development is the step in which the team or analyst constructs a series of events, including initi-ating events that lead to a loss event with undesired consequence.
Figure 6.2 Hazard Scenario
Scenario development is sometimes referred to as “structured scenario analysis”. Ideally, a project team begins Hazard Identification early in the design and completes the Scenario-Based approach as Piping and Instrument Diagrams are being finalized. This will help to ensure that issues are resolved before final au-thorization of capital funds.
Initiating Event
+ Enabling Conditions
Lo
ss E
ven
t
Incident Outcome with
Undesired Consequence
Failure of Independent Protective
Layers
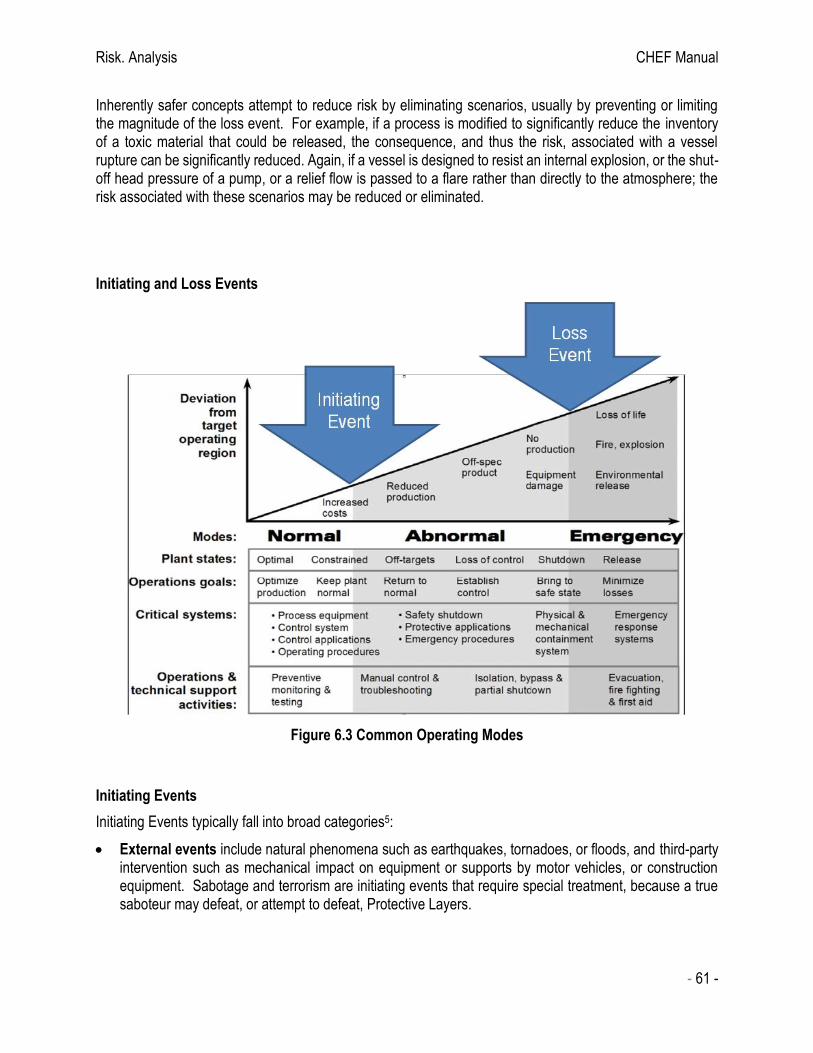
Risk. Analysis CHEF Manual
- 61 -
Inherently safer concepts attempt to reduce risk by eliminating scenarios, usually by preventing or limiting the magnitude of the loss event. For example, if a process is modified to significantly reduce the inventory of a toxic material that could be released, the consequence, and thus the risk, associated with a vessel rupture can be significantly reduced. Again, if a vessel is designed to resist an internal explosion, or the shut-off head pressure of a pump, or a relief flow is passed to a flare rather than directly to the atmosphere; the risk associated with these scenarios may be reduced or eliminated.
Initiating and Loss Events
Figure 6.3 Common Operating Modes
Initiating Events
Initiating Events typically fall into broad categories5:
• External events include natural phenomena such as earthquakes, tornadoes, or floods, and third-party intervention such as mechanical impact on equipment or supports by motor vehicles, or construction equipment. Sabotage and terrorism are initiating events that require special treatment, because a true saboteur may defeat, or attempt to defeat, Protective Layers.

Risk. Analysis CHEF Manual
- 62 -
• Equipment-related initiating events can be further classified into control system failures and mechan-ical failures. Control system failures include, but are not limited to:
o basic process control system (BPCS) component or software failures, o failure of control support systems or utilities (e.g., electricity, instrument air).
Similarly, mechanical failures include, but are not limited to:
o vessel or piping failure caused by wear, fatigue, or corrosion; o vessel or piping failure caused by overpressure (e.g., thermal expansion, pigging/blowing) or
under-pressure (vacuum collapse); o vibration-induced failures (e.g., in rotating equipment); o failures caused by design defects or inadequate maintenance/repair (including substitution of
improper materials of construction) o failures resulting from high temperature (e.g., fire exposure, loss of cooling) or low temperature
and resulting brittle fracture (e.g., auto-refrigeration, low ambient temperature); o failures resulting from flow surge or hydraulic hammer; and
• Human failures are either errors of omission or errors of commission, and include but are not limited to: o failure to execute the steps of a task properly, in the proper sequence or omitting steps (some-
thing not done), or o failure to observe or respond appropriately to conditions or other prompts by the system or pro-
cess (something done wrongly).
In addition, we sometimes consider Domino Effects from fires or explosions in adjacent equipment as a cause or Initiating Event.
Management systems are not normally listed as potential initiating events, although ineffective management systems are quite often a root cause of human error.
Loss Events
A Loss Event is essentially the “unintended release of a hazardous material or energy”; or loss of containment from:
• Gasket leak
• Connection failure
• Piping leaks
• Pump Seal leaks
• Inadvertently opened valve
• Relief Device activation
• Equipment rupture
In some Hazard Evaluation studies, the Loss Event is often qualitative and may not always be well differen-tiated from the causes or Initiating Events. Where additional clarity is needed (such as Quantitative Risk Analysis), Loss Events may be categorized by the type of discharge model used to determine the rate of release.
• Hole Size – many release situations may be estimated as an orifice or short pipe calculation - 5 to 10 mm to represent gasket failure or seal leak.

Risk. Analysis CHEF Manual
- 63 -
- 100 mm to full bore diameter to represent pipe or equipment nozzle failure.
• Fill Rate used for overflow and backflow situations.
• Excessive Heat determined by an energy balance as the rate of heat input divided by heat of va-porization.
• Catastrophic Failure or Rupture as a sudden release of entire equipment contents and correspond-ing release of reaction or pressure-volume energy.
Incident Outcome
A single incident may have several potential outcomes. For continuation of Scenario Identification, the Inci-dent Outcome, Impact or Consequence may need to be estimated in terms of human injury, damage, or economic loss. This is discussed in more detail as part of the Consequence Analysis topics (Impact Assess-ment).
Flammable Outcome:
• Flash Fire or Fireball
• Vapor Cloud Explosion
• Building or Confined Space Explosion Toxic Outcome:
• Off-site toxic exposure
• On-site toxic exposure
• Toxic infiltration of occupied buildings
• Chemical Exposure Other Outcome:
• Physical Explosion
• Environmental Incident
• Equipment Damage/Business Loss
Note that pool fire and jet fire are other possible flammable outcome that usually starts with a flash fire. Flash fire typically involves a greater effect zone than pool or jet fires.
What-If Analysis
The What-If Analysis technique is a brainstorming approach in which a group of experienced people familiar with the subject process ask questions or voice concerns about possible undesired events.
What-If Analysis is not as inherently structured as some other techniques such as a HAZOP study. The concept encourages the hazard evaluation team to think of questions that begin with “What-If.” However, any process safety concern can be voiced, even if it is not phrased as a question. The technique can also be used to evaluate hazards in a safety review.
Ideally “What if” questions represent potential Initiating or Loss Events in a Scenario. For example, “What if the unloading connection comes apart when the transfer begins?” represents an Event which could be caused by mechanical failure or human error. The team would brainstorm process deviation scenarios and identify inherent safety improvements for reducing or eliminating the potential for the scenario to develop.
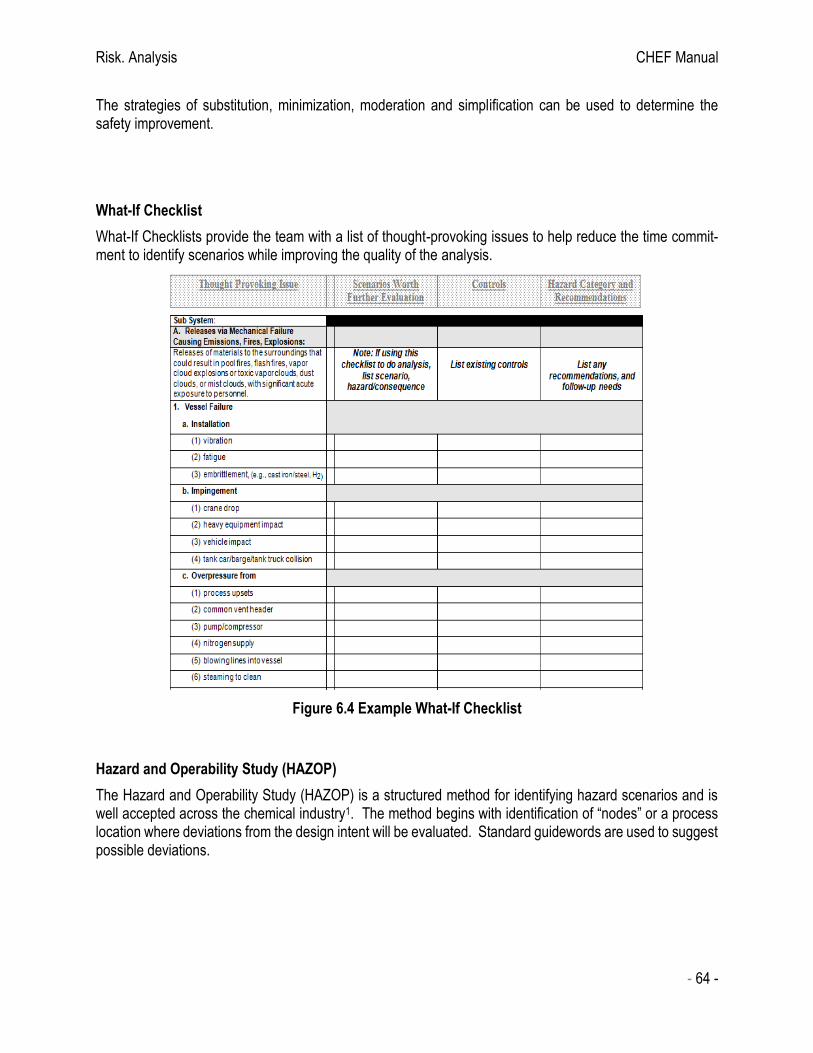
Risk. Analysis CHEF Manual
- 64 -
The strategies of substitution, minimization, moderation and simplification can be used to determine the safety improvement.
What-If Checklist
What-If Checklists provide the team with a list of thought-provoking issues to help reduce the time commit-ment to identify scenarios while improving the quality of the analysis.
Figure 6.4 Example What-If Checklist
Hazard and Operability Study (HAZOP)
The Hazard and Operability Study (HAZOP) is a structured method for identifying hazard scenarios and is well accepted across the chemical industry1. The method begins with identification of “nodes” or a process location where deviations from the design intent will be evaluated. Standard guidewords are used to suggest possible deviations.
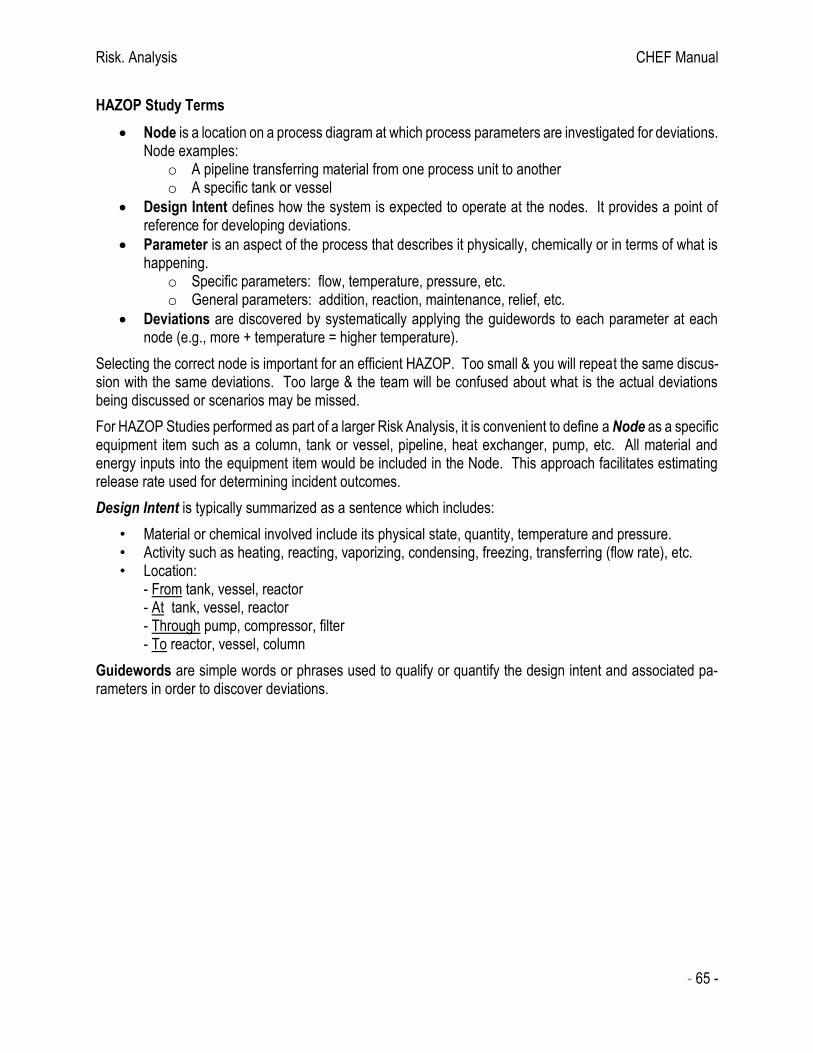
Risk. Analysis CHEF Manual
- 65 -
HAZOP Study Terms
• Node is a location on a process diagram at which process parameters are investigated for deviations. Node examples:
o A pipeline transferring material from one process unit to another o A specific tank or vessel
• Design Intent defines how the system is expected to operate at the nodes. It provides a point of reference for developing deviations.
• Parameter is an aspect of the process that describes it physically, chemically or in terms of what is happening.
o Specific parameters: flow, temperature, pressure, etc. o General parameters: addition, reaction, maintenance, relief, etc.
• Deviations are discovered by systematically applying the guidewords to each parameter at each node (e.g., more + temperature = higher temperature).
Selecting the correct node is important for an efficient HAZOP. Too small & you will repeat the same discus-sion with the same deviations. Too large & the team will be confused about what is the actual deviations being discussed or scenarios may be missed.
For HAZOP Studies performed as part of a larger Risk Analysis, it is convenient to define a Node as a specific equipment item such as a column, tank or vessel, pipeline, heat exchanger, pump, etc. All material and energy inputs into the equipment item would be included in the Node. This approach facilitates estimating release rate used for determining incident outcomes.
Design Intent is typically summarized as a sentence which includes:
• Material or chemical involved include its physical state, quantity, temperature and pressure. • Activity such as heating, reacting, vaporizing, condensing, freezing, transferring (flow rate), etc. • Location:
- From tank, vessel, reactor - At tank, vessel, reactor - Through pump, compressor, filter - To reactor, vessel, column
Guidewords are simple words or phrases used to qualify or quantify the design intent and associated pa-rameters in order to discover deviations.

Risk. Analysis CHEF Manual
- 66 -
Figure 6.5 HAZOP Guidewords
Useful alternative interpretations of the original guidewords include:
• Sooner or for OTHER THAN when considering time. • Where Else for OTHER THAN when considering position, sources, or destination • Higher and Lower for MORE and LESS when considering levels, temperature, or pressure
Simple HAZOP Example Node, Parameter and Deviation
Using an equipment item in a specific chemical service as a “node” may be used to streamline the scenario identification process so that the analysis team can focus on the less common process upsets. The analysis team may be able to build upon a pre-determined list of reasonable scenarios to more quickly identify other scenarios to consider.
Figure 6.6 Example HAZOP Node
Guidewords
Parameter More Less None Reverse Part Of As Well As Other Than
Flow High flow Low flow No flow Back flow Loss of
containment
Pressure High
pressure Low
pressure Vacuum
Partial pressure
Temperature High
temperature Low
temperature Cryogenic
Level High level Low level No level Loss of
containment
Composition State
Additional phase
Loss of phase
Change of
state Wrong
concentration Contaminants
Wrong material
Reaction High
reaction rate Low reaction
rate No
reaction Reverse action
Incomplete reaction
Side reaction Wrong
reaction

Risk. Analysis CHEF Manual
- 67 -
Not all possible deviations are meaningful. It is the HAZOP team’s job to identify meaningful deviations with credible causes.
Additional HAZOP Study Terms
• Causes are the reasons why deviations may occur. Causes can be equipment failure, human error or external events.
• Consequence may be documented as the Loss Event or Impacts resulting from the Loss Event.
• Recommendations are suggested actions to prevent or mitigate the consequence of deviation, or to obtain further information.
• Safeguards are the systems in place that reduce the probability of the deviation occurring or mitigate the severity of the consequences. Examples include: o Dikes o Drainage o Instrument systems o Fire protection systems o Documented mechanical integrity programs o Documented sampling or other procedures
A Preventive Safeguard is one that intervenes between an Initiating Event and the Loss Event – it prevents the Incident from occurring. A Mitigating Safeguard is one that is designed to reduce the Loss Event impact.
HAZOP Documents
The recording process is an important part of the HAZOP Study. The person assigned to scribe the meetings must be able to distill the pertinent results from the myriad of conversations that occur during the meetings. It is impossible to manually record all that is said during the meetings, yet it is very important that all important ideas are preserved.
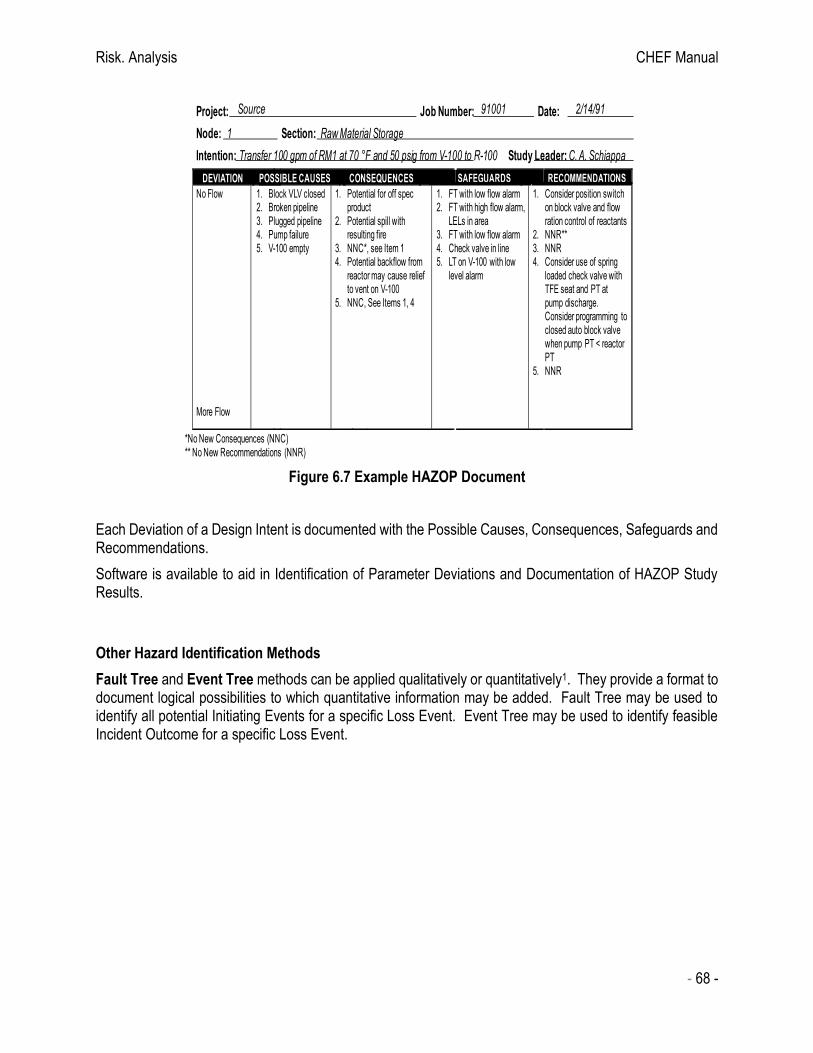
Risk. Analysis CHEF Manual
- 68 -
Figure 6.7 Example HAZOP Document
Each Deviation of a Design Intent is documented with the Possible Causes, Consequences, Safeguards and Recommendations.
Software is available to aid in Identification of Parameter Deviations and Documentation of HAZOP Study Results.
Other Hazard Identification Methods
Fault Tree and Event Tree methods can be applied qualitatively or quantitatively1. They provide a format to document logical possibilities to which quantitative information may be added. Fault Tree may be used to identify all potential Initiating Events for a specific Loss Event. Event Tree may be used to identify feasible Incident Outcome for a specific Loss Event.
Project: Source Job Number: 91001 Date: 2/14/91
Node: 1 Section: Raw Material Storage
Intention: Transfer 100 gpm of RM1 at 70 F and 50 psig from V-100 to R-100 Study Leader: C. A. Schiappa
DEVIATION POSSIBLE CAUSES CONSEQUENCES SAFEGUARDS RECOMMENDATIONS
No Flow
More Flow
1. Block VLV closed2. Broken pipeline3. Plugged pipeline4. Pump failure5. V-100 empty
1. Potential for off specproduct
2. Potential spill withresulting fire
3. NNC*, see Item 14. Potential backflow from
reactor may cause reliefto vent on V-100
5. NNC, See Items 1, 4
1. FT with low flow alarm2. FT with high flow alarm,
LELs in area3. FT with low flow alarm4. Check valve in line5. LT on V-100 with low
level alarm
1. Consider position switchon block valve and flowration control of reactants
2. NNR**3. NNR4. Consider use of spring
loaded check valve withTFE seat and PT atpump discharge.Consider programming toclosed auto block valvewhen pump PT < reactorPT
5. NNR
*No New Consequences (NNC)** No New Recommendations (NNR)
Risk. Analysis CHEF Manual
- 69 -
Figure 6.8 Example Fault Tree and Event Tree
Quantitatively, these methods can provide likelihood information for an event sequence. This will be dis-cussed further in the Likelihood Analysis Module.
Scenario Libraries
Most chemical process facilities utilize the same basic equipment types such as vessels or tanks, pumps, piping, heat exchangers, columns, scrubbers, etc. Development of HAZOP Libraries may help to reduce the time required for analysis.
Through operational experience, incident history, and risk analysis history; common process upsets or sce-nario categories for the various equipment types may be categorized such as:
• Overfill
• Drains/Vents left open
• Overpressure/Relief Activation
• Excessive Heating
• Physical Damage
• Hose Failure
• Mechanical Integrity Failures (erosion, corrosion, fatigue)
• Low Temperature Embrittlement
• Hydraulic Surge
• Uncontrolled Reaction
• Others
These scenario categories represent some of the common parameter deviations from the design intent.
No Scenario Library is Perfect. Facilitators should always ask Evaluation Teams to add scenarios based on their personal experience and plant or industry history.
Pump Seal
Failure
Or
Wear or
Fatigue
Pump
Deadhead
Poor
Installation
Manual Value
Left Closed
Loss of Air to
Automated Valve
Or
Fault Tree Event Tree
Tank
Overfill
Operator Stops
Transfer Upon Full Tank
High Level
Interlock Shuts Off Feed Pump
Sequence
Description
Safe Condition
Continue Normal Operation
Safe Condition
Automatic Shutdown
Unsafe Condition
Release to Atmosphere
Success
FailureSuccess
Failure
For Illustration Only – these diagrams do not reflect complete results
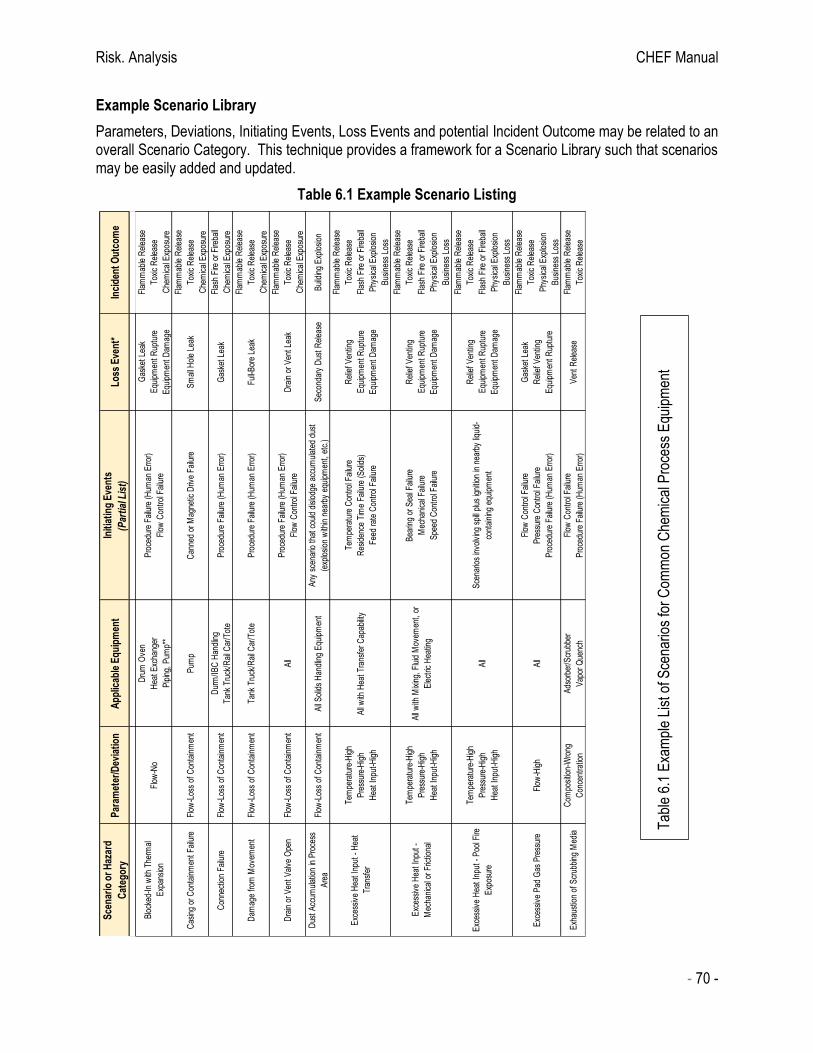
Risk. Analysis CHEF Manual
- 70 -
Example Scenario Library
Parameters, Deviations, Initiating Events, Loss Events and potential Incident Outcome may be related to an overall Scenario Category. This technique provides a framework for a Scenario Library such that scenarios may be easily added and updated.
Table 6.1 Example Scenario Listing
Sce
nar
io o
r H
azar
d
Cat
ego
ryP
aram
eter
/Dev
iati
on
Ap
plic
able
Eq
uip
men
tIn
itia
tin
g E
ven
ts
(Par
tial
Lis
t)L
oss
Eve
nt*
Inci
den
t O
utc
om
e
Blo
cked
-In
with
The
rmal
Exp
ansi
onF
low
-No
Dru
m O
ven
Hea
t E
xcha
nger
Pip
ing,
Pum
p**
Pro
cedu
re F
ailu
re (
Hum
an E
rror
)
Flo
w C
ontr
ol F
ailu
re
Gas
ket
Leak
Equ
ipm
ent
Rup
ture
Equ
ipm
ent
Dam
age
Fla
mm
able
Rel
ease
Tox
ic R
elea
se
Che
mic
al E
xpos
ure
Cas
ing
or C
onta
inm
ent
Fai
lure
Flo
w-L
oss
of C
onta
inm
ent
Pum
pC
anne
d or
Mag
netic
Driv
e F
ailu
reS
mal
l Hol
e Le
ak
Fla
mm
able
Rel
ease
Tox
ic R
elea
se
Che
mic
al E
xpos
ure
Con
nect
ion
Fai
lure
Flo
w-L
oss
of C
onta
inm
ent
Dur
m/I
BC
Han
dlin
g
Tan
k T
ruck
/Rai
l Car
/Tot
eP
roce
dure
Fai
lure
(H
uman
Err
or)
Gas
ket
Leak
Fla
sh F
ire o
r F
ireba
ll
Che
mic
al E
xpos
ure
Dam
age
from
Mov
emen
tF
low
-Los
s of
Con
tain
men
tT
ank
Tru
ck/R
ail C
ar/T
ote
Pro
cedu
re F
ailu
re (
Hum
an E
rror
)F
ull-B
ore
Leak
Fla
mm
able
Rel
ease
Tox
ic R
elea
se
Che
mic
al E
xpos
ure
Dra
in o
r V
ent
Val
ve O
pen
Flo
w-L
oss
of C
onta
inm
ent
All
Pro
cedu
re F
ailu
re (
Hum
an E
rror
)
Flo
w C
ontr
ol F
ailu
reD
rain
or
Ven
t Le
ak
Fla
mm
able
Rel
ease
Tox
ic R
elea
se
Che
mic
al E
xpos
ure
Dus
t A
ccum
ulat
ion
in P
roce
ss
Are
aF
low
-Los
s of
Con
tain
men
tA
ll S
olid
s H
andl
ing
Equ
ipm
ent
Any
sce
nario
tha
t co
uld
disl
odge
acc
umul
ated
dus
t
(exp
losi
on w
ithin
nea
rby
equi
pmen
t, e
tc.)
Sec
onda
ry D
ust
Rel
ease
Bui
ldin
g E
xplo
sion
Exc
essi
ve H
eat
Inpu
t -
Hea
t
Tra
nsfe
r
Tem
pera
ture
-Hig
h
Pre
ssur
e-H
igh
Hea
t In
put-
Hig
h
All
with
Hea
t T
rans
fer
Cap
abilit
y
Tem
pera
ture
Con
trol
Fai
lure
Res
iden
ce T
ime
Fai
lure
(S
olid
s)
Fee
d ra
te C
ontr
ol F
ailu
re
Rel
ief
Ven
ting
Equ
ipm
ent
Rup
ture
Equ
ipm
ent
Dam
age
Fla
mm
able
Rel
ease
Tox
ic R
elea
se
Fla
sh F
ire o
r F
ireba
ll
Phy
sica
l Exp
losi
on
Bus
ines
s Lo
ss
Exc
essi
ve H
eat
Inpu
t -
Mec
hani
cal o
r F
rictio
nal
Tem
pera
ture
-Hig
h
Pre
ssur
e-H
igh
Hea
t In
put-
Hig
h
All
with
Mix
ing,
Flu
id M
ovem
ent,
or
Ele
ctric
Hea
ting
Bea
ring
or S
eal F
ailu
re
Mec
hani
cal F
ailu
re
Spe
ed C
ontr
ol F
ailu
re
Rel
ief
Ven
ting
Equ
ipm
ent
Rup
ture
Equ
ipm
ent
Dam
age
Fla
mm
able
Rel
ease
Tox
ic R
elea
se
Fla
sh F
ire o
r F
ireba
ll
Phy
sica
l Exp
losi
on
Bus
ines
s Lo
ss
Exc
essi
ve H
eat
Inpu
t -
Poo
l Fire
Exp
osur
e
Tem
pera
ture
-Hig
h
Pre
ssur
e-H
igh
Hea
t In
put-
Hig
h
All
Sce
nario
s in
volv
ing
spill
plus
igni
tion
in n
earb
y liq
uid-
cont
aini
ng e
quip
men
t
Rel
ief
Ven
ting
Equ
ipm
ent
Rup
ture
Equ
ipm
ent
Dam
age
Fla
mm
able
Rel
ease
Tox
ic R
elea
se
Fla
sh F
ire o
r F
ireba
ll
Phy
sica
l Exp
losi
on
Bus
ines
s Lo
ss
Exc
essi
ve P
ad G
as P
ress
ure
Flo
w-H
igh
All
Flo
w C
ontr
ol F
ailu
re
Pre
ssur
e C
ontr
ol F
ailu
re
Pro
cedu
re F
ailu
re (
Hum
an E
rror
)
Gas
ket
Leak
Rel
ief
Ven
ting
Equ
ipm
ent
Rup
ture
Fla
mm
able
Rel
ease
Tox
ic R
elea
se
Phy
sica
l Exp
losi
on
Bus
ines
s Lo
ss
Exh
aust
ion
of S
crub
bing
Med
iaC
ompo
sitio
n-W
rong
Con
cent
ratio
n
Ads
orbe
r/S
crub
ber
Vap
or Q
uenc
h
Flo
w C
ontr
ol F
ailu
re
Pro
cedu
re F
ailu
re (
Hum
an E
rror
)V
ent
Rel
ease
Fla
mm
able
Rel
ease
Tox
ic R
elea
se
Tab
le 6
.1 E
xam
ple
List
of S
cena
rios
for
Com
mon
Che
mic
al P
roce
ss E
quip
men
t
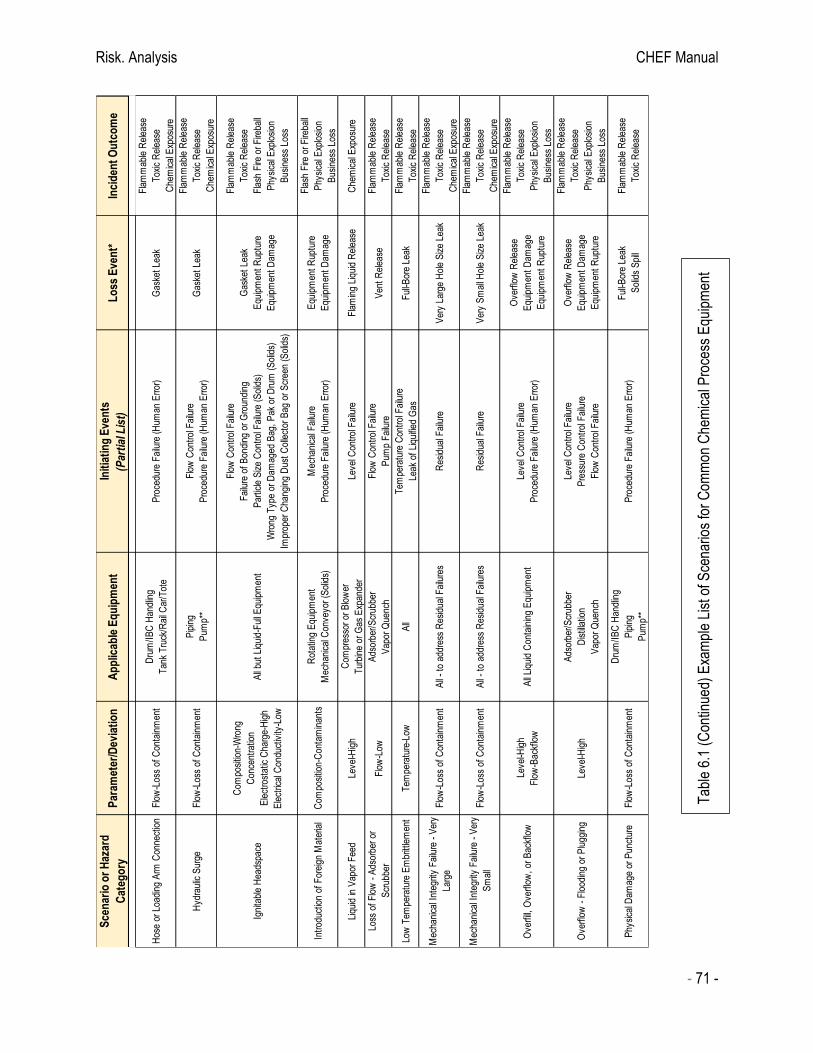
Risk. Analysis CHEF Manual
- 71 -
Sce
nar
io o
r H
azar
d
Cat
ego
ryP
aram
eter
/Dev
iati
on
Ap
plic
able
Eq
uip
men
tIn
itia
tin
g E
ven
ts
(Par
tial
Lis
t)L
oss
Eve
nt*
Inci
den
t O
utc
om
e
Hos
e or
Loa
ding
Arm
Con
nect
ion
Flo
w-L
oss
of C
onta
inm
ent
Dru
m/I
BC
Han
dlin
g
Tan
k T
ruck
/Rai
l Car
/Tot
eP
roce
dure
Fai
lure
(H
uman
Err
or)
Gas
ket
Leak
Fla
mm
able
Rel
ease
Tox
ic R
elea
se
Che
mic
al E
xpos
ure
Hyd
raul
ic S
urge
Flo
w-L
oss
of C
onta
inm
ent
Pip
ing
Pum
p**
Flo
w C
ontr
ol F
ailu
re
Pro
cedu
re F
ailu
re (
Hum
an E
rror
)G
aske
t Le
ak
Fla
mm
able
Rel
ease
Tox
ic R
elea
se
Che
mic
al E
xpos
ure
Igni
tabl
e H
eads
pace
Com
posi
tion-
Wro
ng
Con
cent
ratio
n
Ele
ctro
stat
ic C
harg
e-H
igh
Ele
ctric
al C
ondu
ctiv
ity-L
ow
All
but
Liqu
id-F
ull E
quip
men
t
Flo
w C
ontr
ol F
ailu
re
Fai
lure
of
Bon
ding
or
Gro
undi
ng
Par
ticle
Siz
e C
ontr
ol F
ailu
re (
Sol
ids)
Wro
ng T
ype
or D
amag
ed B
ag,
Pak
or
Dru
m (
Sol
ids)
Impr
oper
Cha
ngin
g D
ust
Col
lect
or B
ag o
r S
cree
n (S
olid
s)
Gas
ket
Leak
Equ
ipm
ent
Rup
ture
Equ
ipm
ent
Dam
age
Fla
mm
able
Rel
ease
Tox
ic R
elea
se
Fla
sh F
ire o
r F
ireba
ll
Phy
sica
l Exp
losi
on
Bus
ines
s Lo
ss
Intr
oduc
tion
of F
orei
gn M
ater
ial
Com
posi
tion-
Con
tam
inan
tsR
otat
ing
Equ
ipm
ent
Mec
hani
cal C
onve
yor
(Sol
ids)
Mec
hani
cal F
ailu
re
Pro
cedu
re F
ailu
re (
Hum
an E
rror
)
Equ
ipm
ent
Rup
ture
Equ
ipm
ent
Dam
age
Fla
sh F
ire o
r F
ireba
ll
Phy
sica
l Exp
losi
on
Bus
ines
s Lo
ss
Liqu
id in
Vap
or F
eed
Leve
l-Hig
hC
ompr
esso
r or
Blo
wer
Tur
bine
or
Gas
Exp
ande
rLe
vel C
ontr
ol F
ailu
reF
lam
ing
Liqu
id R
elea
seC
hem
ical
Exp
osur
e
Loss
of
Flo
w -
Ads
orbe
r or
Scr
ubbe
rF
low
-Low
Ads
orbe
r/S
crub
ber
Vap
or Q
uenc
h
Flo
w C
ontr
ol F
ailu
re
Pum
p F
ailu
reV
ent
Rel
ease
Fla
mm
able
Rel
ease
Tox
ic R
elea
se
Low
Tem
pera
ture
Em
britt
lem
ent
Tem
pera
ture
-Low
All
Tem
pera
ture
Con
trol
Fai
lure
Leak
of
Liqu
ified
Gas
Ful
l-Bor
e Le
akF
lam
mab
le R
elea
se
Tox
ic R
elea
se
Mec
hani
cal I
nteg
rity
Fai
lure
- V
ery
Larg
eF
low
-Los
s of
Con
tain
men
tA
ll -
to a
ddre
ss R
esid
ual F
ailu
res
Res
idua
l Fai
lure
Ver
y La
rge
Hol
e S
ize
Leak
Fla
mm
able
Rel
ease
Tox
ic R
elea
se
Che
mic
al E
xpos
ure
Mec
hani
cal I
nteg
rity
Fai
lure
- V
ery
Sm
all
Flo
w-L
oss
of C
onta
inm
ent
All
- to
add
ress
Res
idua
l Fai
lure
sR
esid
ual F
ailu
reV
ery
Sm
all H
ole
Siz
e Le
ak
Fla
mm
able
Rel
ease
Tox
ic R
elea
se
Che
mic
al E
xpos
ure
Ove
rfill,
Ove
rflo
w,
or B
ackf
low
Leve
l-Hig
h
Flo
w-B
ackf
low
All
Liqu
id C
onta
inin
g E
quip
men
tLe
vel C
ontr
ol F
ailu
re
Pro
cedu
re F
ailu
re (
Hum
an E
rror
)
Ove
rflo
w R
elea
se
Equ
ipm
ent
Dam
age
Equ
ipm
ent
Rup
ture
Fla
mm
able
Rel
ease
Tox
ic R
elea
se
Phy
sica
l Exp
losi
on
Bus
ines
s Lo
ss
Ove
rflo
w -
Flo
odin
g or
Plu
ggin
gLe
vel-H
igh
Ads
orbe
r/S
crub
ber
Dis
tilla
tion
Vap
or Q
uenc
h
Leve
l Con
trol
Fai
lure
Pre
ssur
e C
ontr
ol F
ailu
re
Flo
w C
ontr
ol F
ailu
re
Ove
rflo
w R
elea
se
Equ
ipm
ent
Dam
age
Equ
ipm
ent
Rup
ture
Fla
mm
able
Rel
ease
Tox
ic R
elea
se
Phy
sica
l Exp
losi
on
Bus
ines
s Lo
ss
Phy
sica
l Dam
age
or P
unct
ure
Flo
w-L
oss
of C
onta
inm
ent
Dru
m/I
BC
Han
dlin
g
Pip
ing
Pum
p**
Pro
cedu
re F
ailu
re (
Hum
an E
rror
)F
ull-B
ore
Leak
Sol
ids
Spi
ll
Fla
mm
able
Rel
ease
Tox
ic R
elea
se
Tab
le 6
.1 (
Con
tinue
d) E
xam
ple
List
of S
cena
rios
for
Com
mon
Che
mic
al P
roce
ss E
quip
men
t

Risk. Analysis CHEF Manual
- 72 -
Sc
en
ari
o o
r H
aza
rd
Ca
teg
ory
Pa
ram
ete
r/D
ev
iati
on
Ap
plic
ab
le E
qu
ipm
en
tIn
itia
tin
g E
ve
nts
(Pa
rtia
l Lis
t)L
os
s E
ve
nt*
Inc
ide
nt
Ou
tco
me
Pip
ing o
r E
quip
ment
Leak
- F
ull
Bore
Flo
w-L
oss
of
Conta
inm
ent
All
Hose
Failu
re
Pip
e F
ailu
re
Mech
anic
al F
ailu
re (
nozz
le)
Full-
Bore
Leak
Fla
mm
able
Rele
ase
Toxi
c R
ele
ase
Chem
ical E
xposu
re
Pip
ing o
r E
quip
ment
Leak
- S
mall
Flo
w-L
oss
of
Conta
inm
ent
All
Pro
cedure
Failu
re (
Hum
an E
rror)
Mech
anic
al F
ailu
re (
Loadin
g A
rm,
etc
.)S
mall
Hole
Siz
e L
eak
Fla
mm
able
Rele
ase
Toxi
c R
ele
ase
Chem
ical E
xposu
re
Pre
ssure
Dam
age
Pre
ssure
-Hig
hA
ll D
ust
Handlin
g E
quip
ment
Pre
ssure
Contr
ol F
ailu
re
Regula
tor
Failu
re
Solid
s S
pill
Equip
ment
Ruptu
re
Fla
mm
able
Rele
ase
Toxi
c R
ele
ase
Physi
cal E
xplo
sion
Busi
ness
Loss
Pum
p D
eadhead
Flo
w-N
o
Tem
pera
ture
-Hig
hP
um
p
Flo
w C
ontr
ol F
ailu
re
Pro
cedure
Failu
re (
Hum
an E
rror)
Util
ity F
ailu
re
Equip
ment
Ruptu
re
Fla
mm
able
Rele
ase
Toxi
c R
ele
ase
Physi
cal E
xplo
sion
Busi
ness
Loss
Relie
f D
evic
e F
ailu
reF
low
-Loss
of
Conta
inm
ent
All
Mech
anic
al F
ailu
reR
elie
f H
ole
Siz
e L
eak
Fla
mm
able
Rele
ase
Toxi
c R
ele
ase
Chem
ical E
xposu
re
Rota
ting E
quip
ment
Dam
age
Speed-H
igh
All
Rota
ting E
quip
ment
Speed C
ontr
ol F
ailu
re
Mech
anic
al F
ailu
re
Equip
ment
Ruptu
re
Equip
ment
Dam
age
Fla
mm
able
Rele
ase
Toxi
c R
ele
ase
Fla
sh F
ire o
r F
ireball
Physi
cal E
xplo
sion
Busi
ness
Loss
Seal L
eak
Flo
w-L
oss
of
Conta
inm
ent
Com
pre
ssor
or
Blo
wer
Pum
p,
Turb
ine o
r G
as
Exp
ander
Stir
red R
eact
or/
Cry
stallize
r
Mech
anic
al S
eal F
ailu
re
Util
ity F
ailu
re
Pro
cedure
Failu
re (
Hum
an E
rror)
Mech
anic
al S
eal H
ole
Siz
e
Leak
Fla
mm
able
Rele
ase
Toxi
c R
ele
ase
Chem
ical E
xposu
re
Tube F
ailu
reF
low
-Loss
of
Conta
inm
ent
Heat
Exc
hanger
Heat
Exc
hanger
Tube F
ailu
reT
ube H
ole
Siz
e L
eak
Fla
mm
able
Rele
ase
Toxi
c R
ele
ase
Busi
ness
Loss
Unco
ntr
olle
d R
eact
ion
React
ion-H
igh R
ate
Tem
pera
ture
-Hig
h
Com
posi
tion-W
rong
All
Flo
w C
ontr
ol F
ailu
re
Tem
pera
ture
Contr
ol F
ailu
re
Relie
f V
entin
g
Equip
ment
Ruptu
re
Fla
mm
able
Rele
ase
Toxi
c R
ele
ase
Fla
sh F
ire o
r F
ireball
Physi
cal E
xplo
sion
Busi
ness
Loss
Unco
ntr
olle
d R
eact
ion -
Inco
mpatib
le M
ate
rials
React
ion-W
rong R
eact
ion
All
Additi
on o
f W
rong R
eci
pe (
Hum
an E
rror)
Additi
on o
f W
rong M
ate
rial (
Hum
an E
rror)
Equip
ment
Ruptu
re
Fla
mm
able
Rele
ase
Toxi
c R
ele
ase
Fla
sh F
ire o
r F
ireball
Physi
cal E
xplo
sion
Busi
ness
Loss
Vacu
um
Dam
age
Pre
ssure
-Low
All
Pre
ssure
Contr
ol F
ailu
re
Mech
anic
al F
ailu
re
Full-
Bore
Leak
Equip
ment
Dam
age
Fla
mm
able
Rele
ase
Toxi
c R
ele
ase
Busi
ness
Loss
*E
ach
Loss
Event
repre
sents
separa
te S
cenario
s
**W
here
Pip
ing in
cluded w
ith P
um
p
***E
quip
ment
Failu
re r
epre
sents
tota
l loss
of
conta
inm
ent
with
out
Physi
cal E
xplo
sion
Tab
le 6
.1 (
Con
tinue
d) E
xam
ple
List
of
Sce
nario
s fo
r C
omm
on C
hem
ical
Pro
cess
Equ
ipm
ent

Risk. Analysis CHEF Manual
- 73 -
Sce
nar
io o
r H
azar
d
Cat
ego
ryP
aram
eter
/Dev
iati
on
Ap
plic
able
Eq
uip
men
tIn
itia
tin
g E
ven
ts
(Par
tial
Lis
t)L
oss
Eve
nt*
Inci
den
t O
utc
om
e
Con
nect
ion
Fai
lure
Flo
w-L
oss
of C
onta
inm
ent
All
Dus
t H
andl
ing
Equ
ipm
ent
Boo
t or
Fle
x H
ose
Fai
lure
(S
olid
s)G
aske
t Le
ak
Sol
ilds
Spi
ll
Fla
sh F
ire o
r F
ireba
ll
Che
mic
al E
xpos
ure
Dus
t A
ccum
ulat
ion
in P
roce
ss
Are
aF
low
-Los
s of
Con
tain
men
tA
ll S
olid
s H
andl
ing
Equ
ipm
ent
Any
sce
nario
tha
t co
uld
disl
odge
acc
umul
ated
dus
t
(exp
losi
on w
ithin
nea
rby
equi
pmen
t, e
tc.)
Sec
onda
ry D
ust
Rel
ease
Bui
ldin
g E
xplo
sion
Exc
essi
ve H
eat
Inpu
t -
Hea
t
Tra
nsfe
r
Tem
pera
ture
-Hig
h
Pre
ssur
e-H
igh
Hea
t In
put-
Hig
h
All
with
Hea
t T
rans
fer
Cap
abilit
y
Tem
pera
ture
Con
trol
Fai
lure
Res
iden
ce T
ime
Fai
lure
(S
olid
s)
Fee
d ra
te C
ontr
ol F
ailu
re
Rel
ief
Ven
ting
Equ
ipm
ent
Rup
ture
Equ
ipm
ent
Dam
age
Fla
mm
able
Rel
ease
Tox
ic R
elea
se
Fla
sh F
ire o
r F
ireba
ll
Phy
sica
l Exp
losi
on
Bus
ines
s Lo
ss
Exc
essi
ve H
eat
Inpu
t -
Mec
hani
cal o
r F
rictio
nal
Tem
pera
ture
-Hig
h
Pre
ssur
e-H
igh
Hea
t In
put-
Hig
h
All
with
Mix
ing,
Flu
id M
ovem
ent,
or
Ele
ctric
Hea
ting
Bea
ring
or S
eal F
ailu
re
Mec
hani
cal F
ailu
re
Spe
ed C
ontr
ol F
ailu
re
Rel
ief
Ven
ting
Equ
ipm
ent
Rup
ture
Equ
ipm
ent
Dam
age
Fla
mm
able
Rel
ease
Tox
ic R
elea
se
Fla
sh F
ire o
r F
ireba
ll
Phy
sica
l Exp
losi
on
Bus
ines
s Lo
ss
Igni
tabl
e H
eads
pace
Com
posi
tion-
Wro
ng
Con
cent
ratio
n
Ele
ctro
stat
ic C
harg
e-H
igh
Ele
ctric
al C
ondu
ctiv
ity-L
ow
All
but
Liqu
id-F
ull E
quip
men
t
Flo
w C
ontr
ol F
ailu
re
Fai
lure
of
Bon
ding
or
Gro
undi
ng
Par
ticle
Siz
e C
ontr
ol F
ailu
re (
Sol
ids)
Wro
ng T
ype
or D
amag
ed B
ag,
Pak
or
Dru
m (
Sol
ids)
Impr
oper
Cha
ngin
g D
ust
Col
lect
or B
ag o
r S
cree
n (S
olid
s)
Gas
ket
Leak
Equ
ipm
ent
Rup
ture
Equ
ipm
ent
Dam
age
Fla
mm
able
Rel
ease
Tox
ic R
elea
se
Fla
sh F
ire o
r F
ireba
ll
Phy
sica
l Exp
losi
on
Bus
ines
s Lo
ss
Intr
oduc
tion
of F
orei
gn M
ater
ial
Com
posi
tion-
Con
tam
inan
tsR
otat
ing
Equ
ipm
ent
Mec
hani
cal C
onve
yor
(Sol
ids)
Mec
hani
cal F
ailu
re
Pro
cedu
re F
ailu
re (
Hum
an E
rror
)
Equ
ipm
ent
Rup
ture
Equ
ipm
ent
Dam
age
Fla
sh F
ire o
r F
ireba
ll
Phy
sica
l Exp
losi
on
Bus
ines
s Lo
ss
Pro
paga
tion
of F
lam
e or
Bur
ning
Em
ber
Com
posi
tion-
For
eign
All
Dus
t H
andl
ing
Equ
ipm
ent
Any
ups
trea
m s
cena
rio r
esul
ting
in e
xplo
sion
or
smol
derin
g pa
rtic
les
(Sol
ids)
Equ
ipm
ent
Rup
ture
Fla
mm
able
Rel
ease
Fla
sh F
ire o
r F
ireba
ll
Phy
sica
l Exp
losi
on
Bus
ines
s Lo
ss
Rot
atin
g E
quip
men
t D
amag
eS
peed
-Hig
hA
ll R
otat
ing
Equ
ipm
ent
Spe
ed C
ontr
ol F
ailu
re
Mec
hani
cal F
ailu
re
Equ
ipm
ent
Rup
ture
Equ
ipm
ent
Dam
age
Fla
mm
able
Rel
ease
Tox
ic R
elea
se
Fla
sh F
ire o
r F
ireba
ll
Phy
sica
l Exp
losi
on
Bus
ines
s Lo
ss
Unc
ontr
olle
d R
eact
ion
-
Inco
mpa
tible
Mat
eria
lsR
eact
ion-
Wro
ng R
eact
ion
All
Add
ition
of
Wro
ng R
ecip
e (H
uman
Err
or)
Add
ition
of
Wro
ng M
ater
ial (
Hum
an E
rror
)E
quip
men
t R
uptu
re
Fla
mm
able
Rel
ease
Tox
ic R
elea
se
Fla
sh F
ire o
r F
ireba
ll
Phy
sica
l Exp
losi
on
Bus
ines
s Lo
ss
Tab
le 6
.2 E
xam
ple
List
of S
cena
rios
for
Sol
ids
Han
dlin
g E
quip
men
t
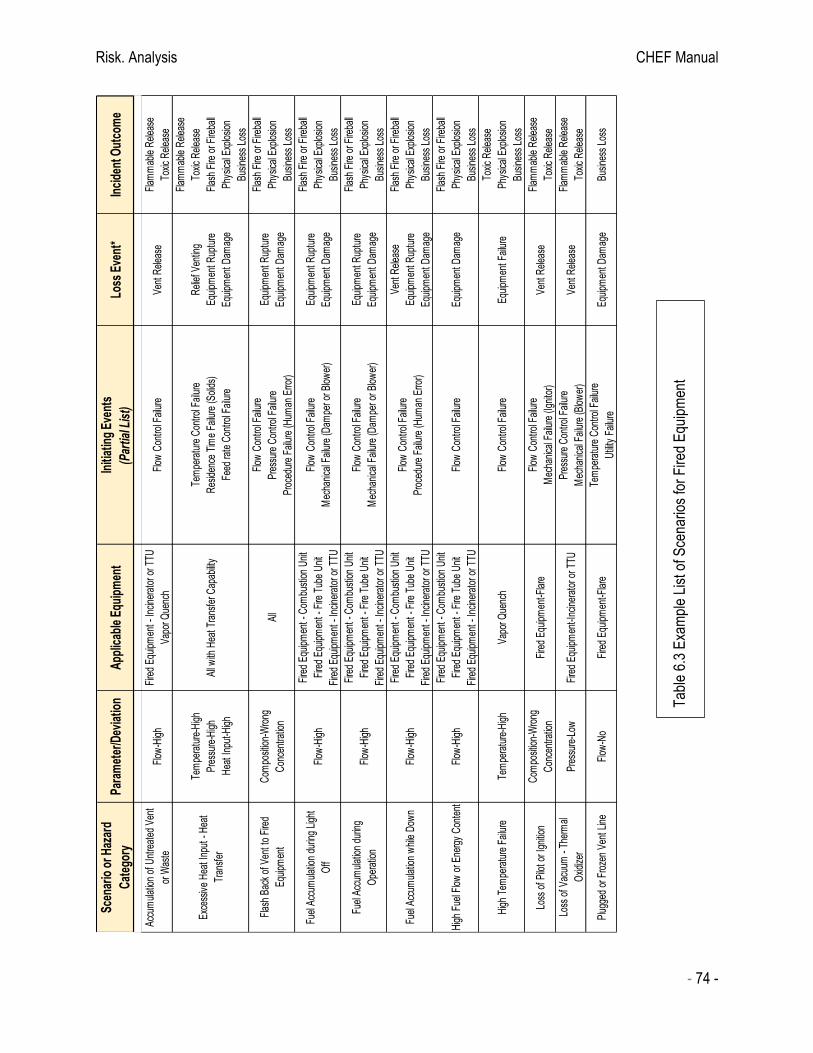
Risk. Analysis CHEF Manual
- 74 -
Scen
ario
or H
azar
d
Cat
egor
yPa
ram
eter
/Dev
iatio
nA
pplic
able
Equ
ipm
ent
Initi
atin
g Ev
ents
(Par
tial L
ist)
Loss
Eve
nt*
Inci
dent
Out
com
e
Acc
umul
atio
n of
Unt
reat
ed V
ent
or W
aste
Flow
-Hig
hFi
red
Equ
ipm
ent -
Inci
nera
tor o
r TTU
Vap
or Q
uenc
hFl
ow C
ontro
l Fai
lure
Ven
t Rel
ease
Flam
mab
le R
elea
se
Toxi
c R
elea
se
Exc
essi
ve H
eat I
nput
- H
eat
Tran
sfer
Tem
pera
ture
-Hig
h
Pre
ssur
e-H
igh
Hea
t Inp
ut-H
igh
All
with
Hea
t Tra
nsfe
r Cap
abilit
y
Tem
pera
ture
Con
trol F
ailu
re
Res
iden
ce T
ime
Failu
re (S
olid
s)
Feed
rate
Con
trol F
ailu
re
Rel
ief V
entin
g
Equ
ipm
ent R
uptu
re
Equ
ipm
ent D
amag
e
Flam
mab
le R
elea
se
Toxi
c R
elea
se
Flas
h Fi
re o
r Fire
ball
Phy
sica
l Exp
losi
on
Bus
ines
s Lo
ss
Flas
h B
ack
of V
ent t
o Fi
red
Equ
ipm
ent
Com
posi
tion-
Wro
ng
Con
cent
ratio
nA
ll
Flow
Con
trol F
ailu
re
Pre
ssur
e C
ontro
l Fai
lure
Pro
cedu
re F
ailu
re (H
uman
Erro
r)
Equ
ipm
ent R
uptu
re
Equ
ipm
ent D
amag
e
Flas
h Fi
re o
r Fire
ball
Phy
sica
l Exp
losi
on
Bus
ines
s Lo
ss
Fuel
Acc
umul
atio
n du
ring
Ligh
t
Off
Flow
-Hig
h
Fire
d E
quip
men
t - C
ombu
stio
n U
nit
Fire
d E
quip
men
t - F
ire T
ube
Uni
t
Fire
d E
quip
men
t - In
cine
rato
r or T
TU
Flow
Con
trol F
ailu
re
Mec
hani
cal F
ailu
re (D
ampe
r or B
low
er)
Equ
ipm
ent R
uptu
re
Equ
ipm
ent D
amag
e
Flas
h Fi
re o
r Fire
ball
Phy
sica
l Exp
losi
on
Bus
ines
s Lo
ss
Fuel
Acc
umul
atio
n du
ring
Ope
ratio
nFl
ow-H
igh
Fire
d E
quip
men
t - C
ombu
stio
n U
nit
Fire
d E
quip
men
t - F
ire T
ube
Uni
t
Fire
d E
quip
men
t - In
cine
rato
r or T
TU
Flow
Con
trol F
ailu
re
Mec
hani
cal F
ailu
re (D
ampe
r or B
low
er)
Equ
ipm
ent R
uptu
re
Equ
ipm
ent D
amag
e
Flas
h Fi
re o
r Fire
ball
Phy
sica
l Exp
losi
on
Bus
ines
s Lo
ss
Fuel
Acc
umul
atio
n w
hile
Dow
nFl
ow-H
igh
Fire
d E
quip
men
t - C
ombu
stio
n U
nit
Fire
d E
quip
men
t - F
ire T
ube
Uni
t
Fire
d E
quip
men
t - In
cine
rato
r or T
TU
Flow
Con
trol F
ailu
re
Pro
cedu
re F
ailu
re (H
uman
Erro
r)
Ven
t Rel
ease
Equ
ipm
ent R
uptu
re
Equ
ipm
ent D
amag
e
Flas
h Fi
re o
r Fire
ball
Phy
sica
l Exp
losi
on
Bus
ines
s Lo
ss
Hig
h Fu
el F
low
or E
nerg
y C
onte
ntFl
ow-H
igh
Fire
d E
quip
men
t - C
ombu
stio
n U
nit
Fire
d E
quip
men
t - F
ire T
ube
Uni
t
Fire
d E
quip
men
t - In
cine
rato
r or T
TU
Flow
Con
trol F
ailu
reE
quip
men
t Dam
age
Flas
h Fi
re o
r Fire
ball
Phy
sica
l Exp
losi
on
Bus
ines
s Lo
ss
Hig
h Te
mpe
ratu
re F
ailu
reTe
mpe
ratu
re-H
igh
Vap
or Q
uenc
hFl
ow C
ontro
l Fai
lure
Equ
ipm
ent F
ailu
re
Toxi
c R
elea
se
Phy
sica
l Exp
losi
on
Bus
ines
s Lo
ss
Loss
of P
ilot o
r Ign
ition
Com
posi
tion-
Wro
ng
Con
cent
ratio
nFi
red
Equ
ipm
ent-F
lare
Flow
Con
trol F
ailu
re
Mec
hani
cal F
ailu
re (I
gnito
r)V
ent R
elea
seFl
amm
able
Rel
ease
Toxi
c R
elea
se
Loss
of V
acuu
m -
Ther
mal
Oxi
dize
rP
ress
ure-
Low
Fire
d E
quip
men
t-Inc
iner
ator
or T
TUP
ress
ure
Con
trol F
ailu
re
Mec
hani
cal F
ailu
re (B
low
er)
Ven
t Rel
ease
Flam
mab
le R
elea
se
Toxi
c R
elea
se
Plu
gged
or F
roze
n V
ent L
ine
Flow
-No
Fire
d E
quip
men
t-Fla
reTe
mpe
ratu
re C
ontro
l Fai
lure
Util
ity F
ailu
reE
quip
men
t Dam
age
Bus
ines
s Lo
ss
Tab
le 6
.3 E
xam
ple
List
of S
cena
rios
for
Fire
d E
quip
men
t
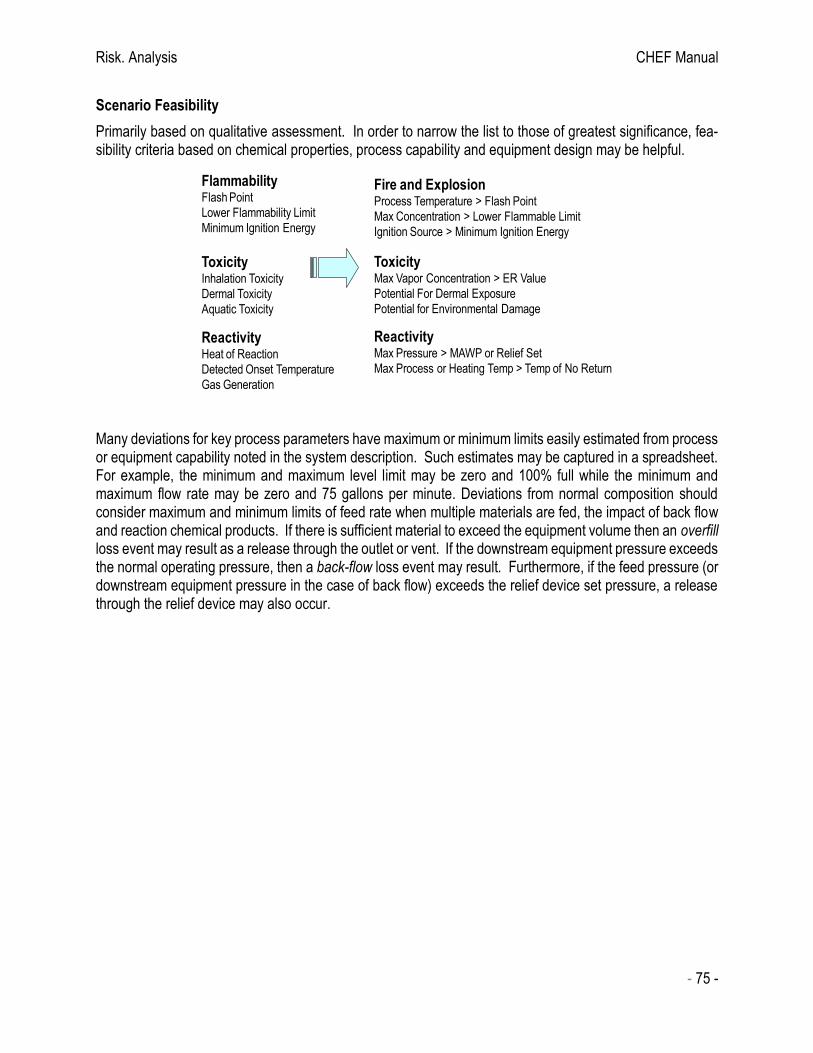
Risk. Analysis CHEF Manual
- 75 -
Scenario Feasibility
Primarily based on qualitative assessment. In order to narrow the list to those of greatest significance, fea-sibility criteria based on chemical properties, process capability and equipment design may be helpful.
Many deviations for key process parameters have maximum or minimum limits easily estimated from process or equipment capability noted in the system description. Such estimates may be captured in a spreadsheet. For example, the minimum and maximum level limit may be zero and 100% full while the minimum and maximum flow rate may be zero and 75 gallons per minute. Deviations from normal composition should consider maximum and minimum limits of feed rate when multiple materials are fed, the impact of back flow and reaction chemical products. If there is sufficient material to exceed the equipment volume then an overfill loss event may result as a release through the outlet or vent. If the downstream equipment pressure exceeds the normal operating pressure, then a back-flow loss event may result. Furthermore, if the feed pressure (or downstream equipment pressure in the case of back flow) exceeds the relief device set pressure, a release through the relief device may also occur.
FlammabilityFlash Point
Lower Flammability Limit
Minimum Ignition Energy
ToxicityInhalation Toxicity
Dermal Toxicity
Aquatic Toxicity
ReactivityHeat of Reaction
Detected Onset Temperature
Gas Generation
Fire and ExplosionProcess Temperature > Flash Point
Max Concentration > Lower Flammable Limit
Ignition Source > Minimum Ignition Energy
ToxicityMax Vapor Concentration > ER Value
Potential For Dermal Exposure
Potential for Environmental Damage
ReactivityMax Pressure > MAWP or Relief Set
Max Process or Heating Temp > Temp of No Return
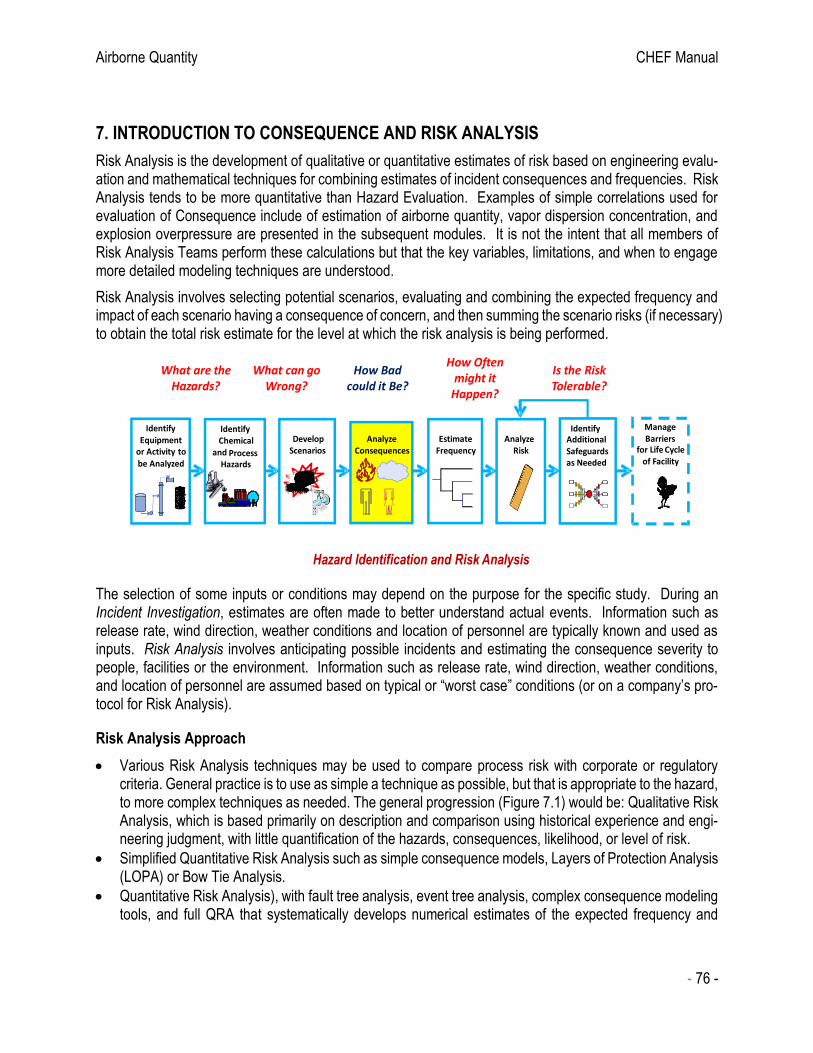
Airborne Quantity CHEF Manual
- 76 -
7. INTRODUCTION TO CONSEQUENCE AND RISK ANALYSIS
Risk Analysis is the development of qualitative or quantitative estimates of risk based on engineering evalu-ation and mathematical techniques for combining estimates of incident consequences and frequencies. Risk Analysis tends to be more quantitative than Hazard Evaluation. Examples of simple correlations used for evaluation of Consequence include of estimation of airborne quantity, vapor dispersion concentration, and explosion overpressure are presented in the subsequent modules. It is not the intent that all members of Risk Analysis Teams perform these calculations but that the key variables, limitations, and when to engage more detailed modeling techniques are understood.
Risk Analysis involves selecting potential scenarios, evaluating and combining the expected frequency and impact of each scenario having a consequence of concern, and then summing the scenario risks (if necessary) to obtain the total risk estimate for the level at which the risk analysis is being performed.
The selection of some inputs or conditions may depend on the purpose for the specific study. During an Incident Investigation, estimates are often made to better understand actual events. Information such as release rate, wind direction, weather conditions and location of personnel are typically known and used as inputs. Risk Analysis involves anticipating possible incidents and estimating the consequence severity to people, facilities or the environment. Information such as release rate, wind direction, weather conditions, and location of personnel are assumed based on typical or “worst case” conditions (or on a company’s pro-tocol for Risk Analysis).
Risk Analysis Approach
• Various Risk Analysis techniques may be used to compare process risk with corporate or regulatory criteria. General practice is to use as simple a technique as possible, but that is appropriate to the hazard, to more complex techniques as needed. The general progression (Figure 7.1) would be: Qualitative Risk Analysis, which is based primarily on description and comparison using historical experience and engi-neering judgment, with little quantification of the hazards, consequences, likelihood, or level of risk.
• Simplified Quantitative Risk Analysis such as simple consequence models, Layers of Protection Analysis (LOPA) or Bow Tie Analysis.
• Quantitative Risk Analysis), with fault tree analysis, event tree analysis, complex consequence modeling tools, and full QRA that systematically develops numerical estimates of the expected frequency and
Hazard Identification and Risk Analysis
Identify Chemical
and ProcessHazards
Estimate Frequency
Analyze Consequences
AnalyzeRisk
IdentifyAdditional Safeguards as Needed
DevelopScenarios
Identify Equipment
or Activity to
be Analyzed
Manage Barriers
for Life Cycle of Facility
What are the Hazards?
What can go Wrong?
How Bad could it Be?
How Oftenmight it
Happen?
Is the Risk Tolerable?

Airborne Quantity CHEF Manual
- 77 -
severity of potential incidents associated with a facility or operation based on engineering evaluation and mathematical techniques.
Companies and/or regulatory agencies often establish the criteria for which risk analysis technique should be used.
Figure 7.1 Risk Analysis Techniques
There are several approaches that may be used to categorize consequence severity for risk analysis.
• Categories without Direct Reference to Human Harm: Categories are often based on release quantity of a specific hazard level such as a 1000 kg release of highly toxic material. The release quantity may be estimated qualitatively or quantitatively. Categories may also be based on results of simple dispersion or explosion models such as a release where the distance to ERPG-2 concen-tration exceeds 1000 m or where the distance to 1 psi blast overpressure exceeds 500 m.
This approach avoids estimating the number of potential injuries or fatalities which may appear to imply that injuries or fatalities are tolerable. This approach also recognizes the difficulty in estimating the number of people who may be harmed and how severe the harm might be. For example, a toxic release may result in one or more fatalities or no harm at all, depending on the proximity of people to the release location and capability they have to escape.
• Qualitative Estimates of Human Harm: This approach uses the final impact to humans as the consequence of interest, but arrives at the value using qualitative judgment from past experience or knowledge of prior detailed modeling of similar releases.
Many people tend to understand consequence in terms of human harm rather than release size or release characteristics. The resulting risk of injury or fatality estimate can typically be compared directly to a company’s risk tolerance criteria. However, qualitative estimates may vary significantly between different analysts.
• Quantitative Estimate of Human Harm: This method involves the use of mathematical models to simulate the release, the subsequent dispersion, and toxic or blast effects. Models may be relatively
Inc
rea
sin
g P
roc
es
s R
isk
an
d D
eta
il o
f A
na
lys
is
Used for Low to Moderate
Risk Facilities, Unit
Operations or Equipment
Detailed Quantitative Risk
Methods
Simplified Quantitative Risk
Methods
Qualitative Risk Methods
Hazard and/or Risk Screening Criteria
QRA Criteria
Used for Moderate to High
Risk Facilities, Unit
Operations or Equipment
Used for Very High Risk
Facilities, Unit Operations
or Equipment
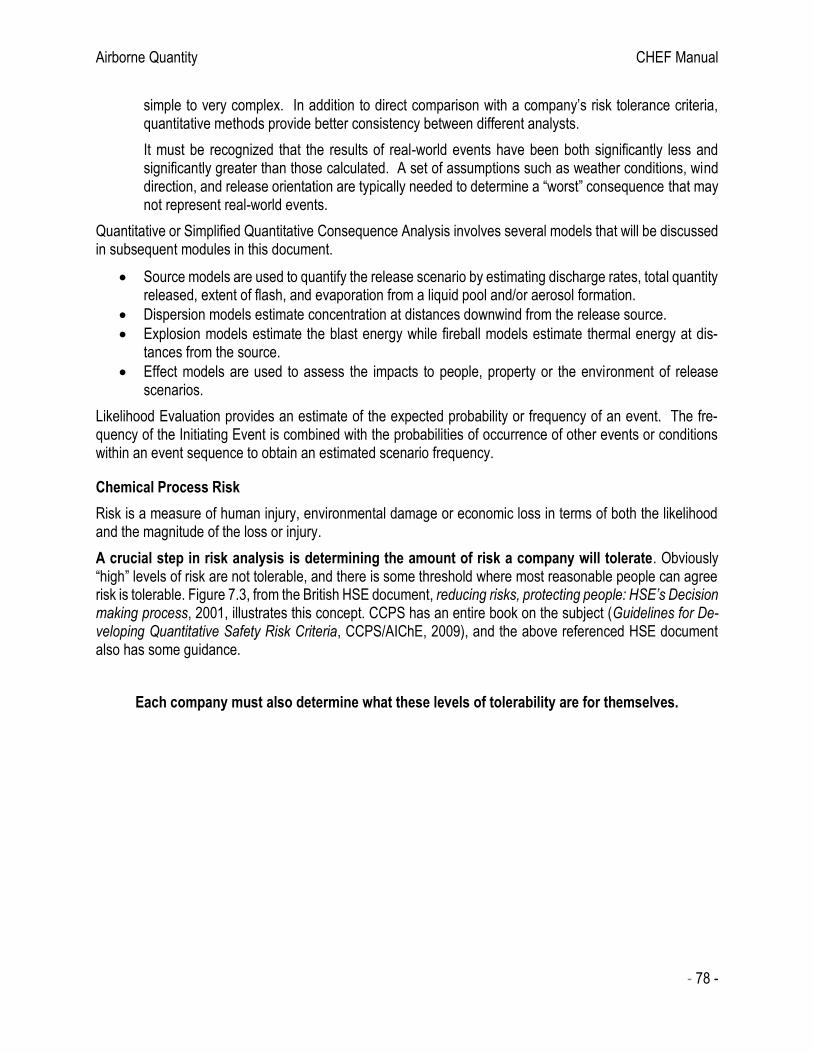
Airborne Quantity CHEF Manual
- 78 -
simple to very complex. In addition to direct comparison with a company’s risk tolerance criteria, quantitative methods provide better consistency between different analysts.
It must be recognized that the results of real-world events have been both significantly less and significantly greater than those calculated. A set of assumptions such as weather conditions, wind direction, and release orientation are typically needed to determine a “worst” consequence that may not represent real-world events.
Quantitative or Simplified Quantitative Consequence Analysis involves several models that will be discussed in subsequent modules in this document.
• Source models are used to quantify the release scenario by estimating discharge rates, total quantity released, extent of flash, and evaporation from a liquid pool and/or aerosol formation.
• Dispersion models estimate concentration at distances downwind from the release source.
• Explosion models estimate the blast energy while fireball models estimate thermal energy at dis-tances from the source.
• Effect models are used to assess the impacts to people, property or the environment of release scenarios.
Likelihood Evaluation provides an estimate of the expected probability or frequency of an event. The fre-quency of the Initiating Event is combined with the probabilities of occurrence of other events or conditions within an event sequence to obtain an estimated scenario frequency.
Chemical Process Risk
Risk is a measure of human injury, environmental damage or economic loss in terms of both the likelihood and the magnitude of the loss or injury.
A crucial step in risk analysis is determining the amount of risk a company will tolerate. Obviously “high” levels of risk are not tolerable, and there is some threshold where most reasonable people can agree risk is tolerable. Figure 7.3, from the British HSE document, reducing risks, protecting people: HSE’s Decision making process, 2001, illustrates this concept. CCPS has an entire book on the subject (Guidelines for De-veloping Quantitative Safety Risk Criteria, CCPS/AIChE, 2009), and the above referenced HSE document also has some guidance.
Each company must also determine what these levels of tolerability are for themselves.
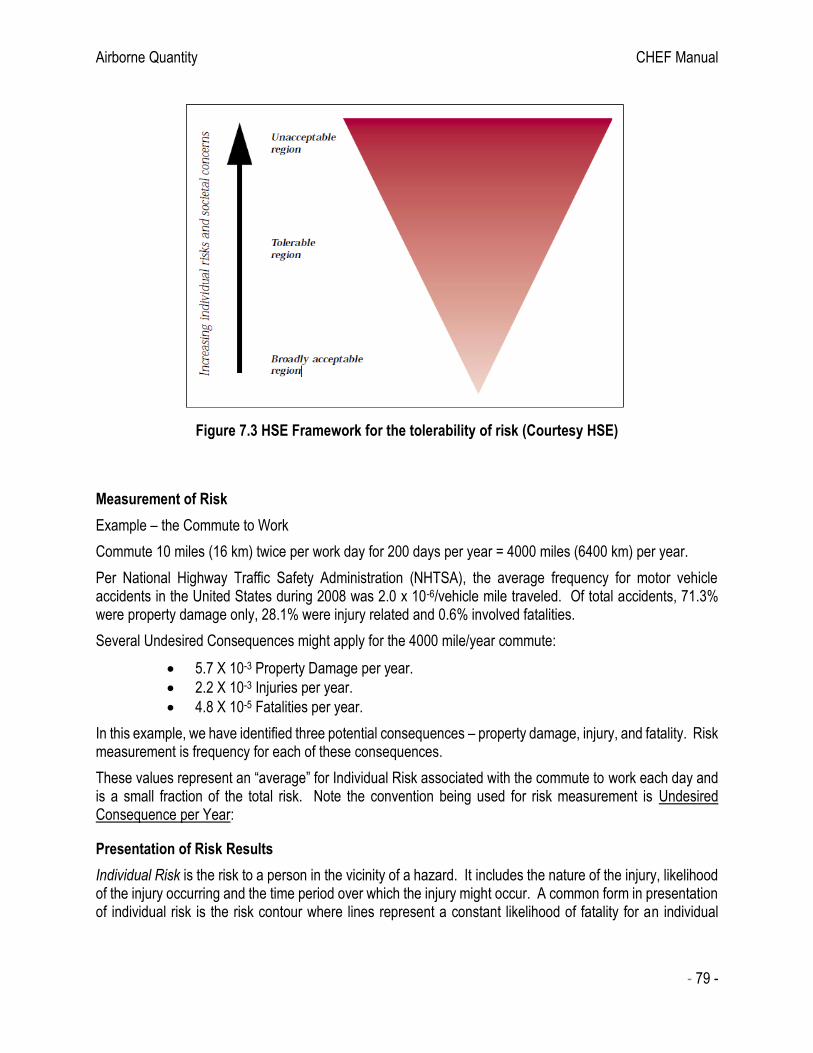
Airborne Quantity CHEF Manual
- 79 -
Figure 7.3 HSE Framework for the tolerability of risk (Courtesy HSE)
Measurement of Risk
Example – the Commute to Work
Commute 10 miles (16 km) twice per work day for 200 days per year = 4000 miles (6400 km) per year.
Per National Highway Traffic Safety Administration (NHTSA), the average frequency for motor vehicle accidents in the United States during 2008 was 2.0 x 10⁻⁶/vehicle mile traveled. Of total accidents, 71.3% were property damage only, 28.1% were injury related and 0.6% involved fatalities.
Several Undesired Consequences might apply for the 4000 mile/year commute:
• 5.7 X 10⁻³ Property Damage per year.
• 2.2 X 10⁻³ Injuries per year.
• 4.8 X 10⁻⁵ Fatalities per year.
In this example, we have identified three potential consequences – property damage, injury, and fatality. Risk measurement is frequency for each of these consequences.
These values represent an “average” for Individual Risk associated with the commute to work each day and is a small fraction of the total risk. Note the convention being used for risk measurement is Undesired Consequence per Year:
Presentation of Risk Results
Individual Risk is the risk to a person in the vicinity of a hazard. It includes the nature of the injury, likelihood of the injury occurring and the time period over which the injury might occur. A common form in presentation of individual risk is the risk contour where lines represent a constant likelihood of fatality for an individual

Airborne Quantity CHEF Manual
- 80 -
(Figure 7.4). Many risk assessments are conducted on the basis of fatal effects as degree of injury is often more difficult to quantify.
Figure 7.4 – Individual Risk Contour
Societal Risk addresses the number of people who may be affected by hazardous incidents. A common form of societal risk is the F-N (frequency-number) curve (Figure 7.5). This curve is a plot of cumulative frequency versus consequence (expressed as a number of fatalities). Many companies and regulatory agencies have specific societal risk requirements. Often these requirements are based on the summation of risks associated with all scenarios rather than risk of a single scenario.
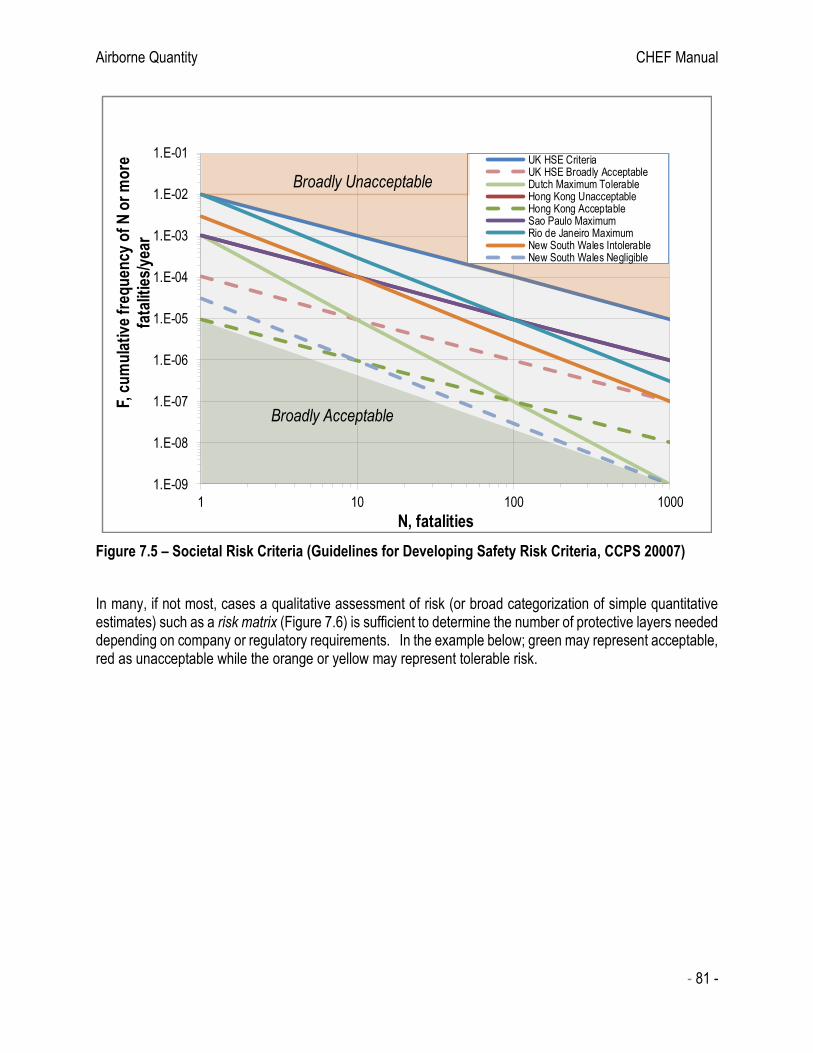
Airborne Quantity CHEF Manual
- 81 -
Figure 7.5 – Societal Risk Criteria (Guidelines for Developing Safety Risk Criteria, CCPS 20007)
In many, if not most, cases a qualitative assessment of risk (or broad categorization of simple quantitative estimates) such as a risk matrix (Figure 7.6) is sufficient to determine the number of protective layers needed depending on company or regulatory requirements. In the example below; green may represent acceptable, red as unacceptable while the orange or yellow may represent tolerable risk.
1.E-09
1.E-08
1.E-07
1.E-06
1.E-05
1.E-04
1.E-03
1.E-02
1.E-01
1 10 100 1000
F, c
um
ula
tive
fre
qu
ency
of
N o
r m
ore
fa
talit
ies/
year
N, fatalities
UK HSE CriteriaUK HSE Broadly AcceptableDutch Maximum TolerableHong Kong UnacceptableHong Kong AcceptableSao Paulo MaximumRio de Janeiro MaximumNew South Wales IntolerableNew South Wales Negligible
Broadly Unacceptable
Broadly Acceptable

Airborne Quantity CHEF Manual
- 82 -
Figure 7.6 – Example Risk Matrix
“Sharpening the Pencil”
The following modules will focus on a simplified quantitative approach to risk. There are several advantages and disadvantages to this method relative to more qualitative approaches.
Advantages: • Improved consistency across study teams • Provides a basis for comparison of risk across facilities • People tend to understand consequences in terms of incident outcome (flash fire, vapor cloud ex-
plosion, etc. than attempting to express risk in terms of release size. People tend to understand consequences in terms of number of personnel impacted than incident outcome.
• A greater degree of certainty concerning the predicted consequences • Ability for direct comparison with corporate risk criteria
Disadvantages: • The results of real-world incident have been both significantly less or significantly more than esti-
mated. Modeling results may be strongly influenced by exact release conditions (release orientation, weather conditions, location of personnel, etc.)
• The level of sophistication for modeling may be disproportionate to that needed in order-of-magni-tude Layers of Protection Analysis (LOPA)
• The training, experience and effort may be prohibitive for low risk scenarios.
A “middle ground” may also be appropriate. An estimate initially made using simplifying assumptions such as the entire liquid release becomes airborne or all building occupants are considered severely impacted as
Label People EnvironmentAssets or
Business
10-2
per
year
10-3
per
year
10-4
per
year
10-5
per
year
10-6
per
year
10-7
per
year
Severity
Level-1
Minor Injury or 0.001 to 0.01
likelihood of a single fatality
<100 kg Spill of Toxic Material
<1,000 kg Spill of Harmful Material
(Agency Reportable Incident)<$50,000 Loss
Severity
Level-2
Major Injury or 0.01 to 0.1
likelihood of a single fatality
<100 kg Spill of Very Toxic Material
<1,000 kg Spill of Toxic Material
<10,000 kg Spill of Harmful Material
(Contamination Confined to Site)
$50,000 to
$500,000 Loss
Severity
Level-3
0.1 to 1 likelihood of a single
fatality
<1,000 kg Spill of Very Toxic Material
<10,000 kg Spill of Toxic Material
<100,000 kg Spill of Harmful Material
(Requires Significant Offsite Remediation)
$500,000 to
$5,000,000 Loss
Severity
Level-41 to 10 fatalities
<10,000 kg Spill of Very Toxic Material
<100,000 kg Spill of Toxic Material
<1,000,000 kg Spill of Harmful Material
(Major Incidenet, Adverse National Media Attention)
$5,000,000 to
$50,000,000
Loss
Severity
Level-5>10 fatalities
>10,000 kg Spill of Very Toxic Material
>100,000 kg Spill of Toxic Material
(Major International Incident, Class Action Lawsuit)
> $50,000,000
Loss
Acceptable
Tolerable - Offsite
Tolerable - Onsite
Unacceptable
FrequencySeverity
Legend
Example Risk Matrix: Risk = Consequency Severity times Frequency
Each company determines the acceptable, unacceptable and tolerable
frequencies for the consequence severity adjusted to a single scenario
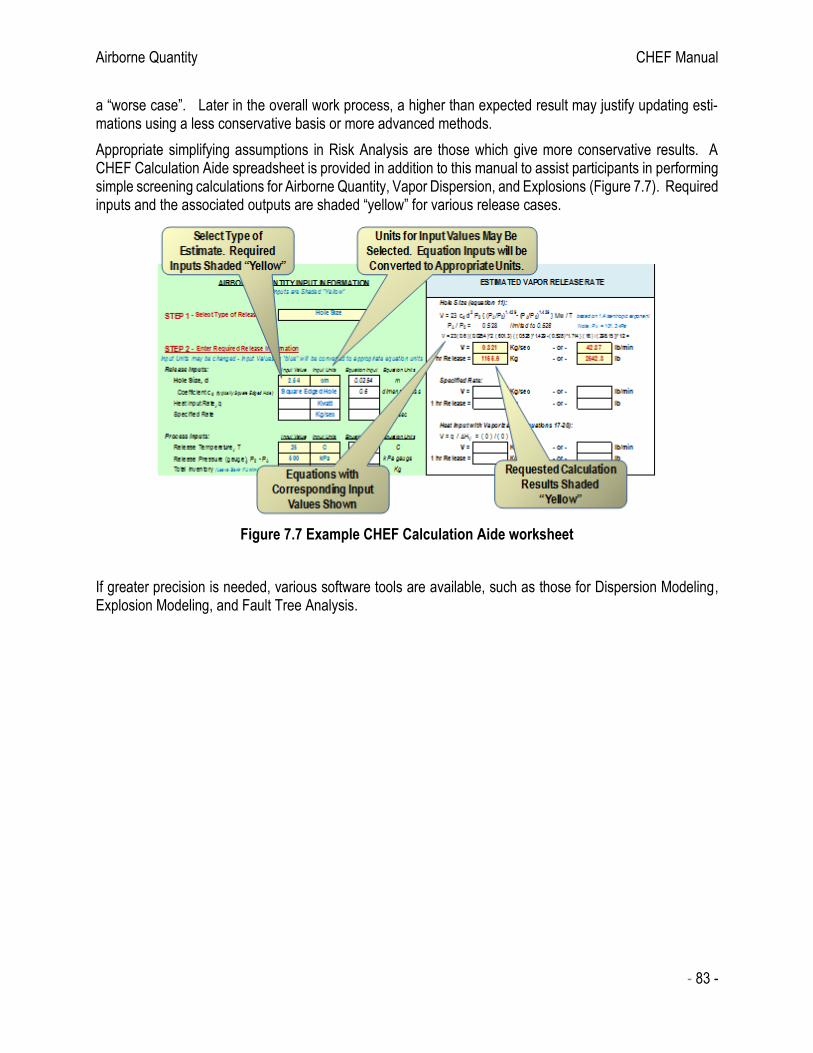
Airborne Quantity CHEF Manual
- 83 -
a “worse case”. Later in the overall work process, a higher than expected result may justify updating esti-mations using a less conservative basis or more advanced methods.
Appropriate simplifying assumptions in Risk Analysis are those which give more conservative results. A CHEF Calculation Aide spreadsheet is provided in addition to this manual to assist participants in performing simple screening calculations for Airborne Quantity, Vapor Dispersion, and Explosions (Figure 7.7). Required inputs and the associated outputs are shaded “yellow” for various release cases.
Figure 7.7 Example CHEF Calculation Aide worksheet
If greater precision is needed, various software tools are available, such as those for Dispersion Modeling, Explosion Modeling, and Fault Tree Analysis.

Vapor Dispersions CHEF Manual
- 84 -
8. ESTIMATION OF AIRBORNE QUANTITY
The Airborne Quantity for a vapor release is the flow rate calculated at the temperature and pressure condi-tions of the equipment when the release occurs. Liquid release requires more complex treatment. As liquid exits equipment or pipe, it may partially flash or vaporize, there is often small liquid droplets or aerosol which may be carried away with the vapor and eventually evaporate, and a liquid pool may be formed which slowly evaporates. The Airborne Quantity for a liquid release is the summation of quantity flashed and quantity evaporated from aerosol droplets and liquid pools.
Module Objectives
In this module you will learn:
• Estimation of Vapor Release Rate o Based on Hole Size o Based on Vaporization of Liquid
• Estimation of Liquid Release Rate o Based on Hole Size o Based on Catastrophic Failure o Based on Flashing Liquid Flow o Test for Two-Phase Flow
• Evaluation of Flash Fraction
• Evaluation of Aerosol Evaporation Fraction
• Estimate of Evaporation from a Liquid Pool
Several methods described in this document involve limitations relative to chemical properties, the most significant being that vapors are addressed as ideal gases and thermodynamic properties are correlated as simple linear relationship with temperature. Some source models for chemical pro-cesses operating near the critical point (critical temperature and critical pressure) will be less accu-rate than processes operating at or below the normal boiling point.
Flowchart for Determination of Airborne Quantity
The steps for estimation of Airborne Quantity include selection of the appropriate release model (based on a specified rate, hole size, heat balance, or catastrophic failure.

Vapor Dispersions CHEF Manual
- 85 -
Figure 8.1 Flowchart for Estimation of Airborne Quantity
Selection of a Discharge Model
The release rate for a hazard scenario is typically determined as the maximum feasible quantity. There are four primary Loss Event Categories aligned to a discharge model including:
❑ Hole Size where release rate is determined by modeling the discharge from a hole of specified di-ameter, process pressure, and fluid density. (Short Pipe Flashing Liquid is a special Hole Size case.)
❑ Overflow or Specified Rate where release rate is determined from the feed or other specified re-lease rate.
❑ Excessive Heat where release rate is determined from the rate of heat input divided by the heat of vaporization.
❑ Rupture represents a sudden release of the entire contents and may apply to both energy and haz-ardous chemical releases.
For loss events where the release rate may be estimated from a hole size, the general approach is to use the largest practical hole size. Hole sizes may be standardized to simplify screening evaluations. A small hole (5 to 15 mm) may represent gasket failure or leaks from mechanical pump seals. A medium (25 mm) hole may represent significant equipment or piping leaks. While a large (100 mm to full bore) hole represents hose, pipe, or equipment nozzle failure.
Liquid
Vapor
No
Pool
Evaporation
Select a scenario and Incident Type: ▪ Known Mass Flow Rate
▪ Heat Balance
▪ Hole Size
▪ Equipment Failure
Estimate Vapor
Discharge Rate and
Total Quantity
Estimate Pool Size and
Pool Temperature
Estimate Pool
Evaporation Rate
Type of
Release?
Is All Material
Vaporized?
AIRBORNE
QUANTITY
Estimate Liquid
Discharge Rate and
Total Quantity
Estimate Flash
Fraction
Estimate Aerosol
Evaporation
Flash
Fraction
Aerosol
Fraction
Vapor Dispersions CHEF Manual
- 86 -
Hole Size Release Rate for Vapor or Subcooled Liquid
The vapor discharge rate to atmospheric pressure for a nozzle, hole, or short pipe at an average isentropic expansion coefficient of 1.4 is estimated by2:
V = 23 cd d2 P0 {[(PA/P0)1.429 – (PA/P0)1.714] Mw / T}1/2 (11)
The ratio, PA/P0, is limited to a minimum of 0.528 for sonic flow
The sub-cooled (non-flashing) liquid discharge rate to atmospheric pressure for a nozzle, hole, or short pipe at liquid head, h’, may be estimated from the Bernoulli equation as7:
L = 1.2 cd d2 { L [ 1000 (P0 – PA) + 9.8 L h’ ] }1/2 (12)
where:
d = hole diameter (m) L = liquid release rate (kg/sec) Mw = vapor molecular weight V= vapor release rate (kg/sec) cd = discharge coefficient h’ = liquid height (m) P0 = upstream pressure (kPa) T = release temperature (K)
PA = atmospheric pressure (101.3 kPa) L, V = liquid or vapor density (kg/m3) Note that a discharge coefficient of 0.61 is typical for a hole or 1.0 for a well-rounded nozzle such as a safety valve.
Hole Size Release Rate Example-Vapor
Estimate the vapor release rate of methane (Mw = 16) from a 25 mm (0.025 m or 1 inch) hole at 500 kPa gauge (601.3 kPa absolute or 87 psia) and 25 C (287 K) using a cd of 0.6 is:
PA/P0 = 101.3 / 601.3 = 0.169 limited to 0.528
V = 23 (0.61) (0.025)2 601.3 [{ (0.528)1.429–(0.528)1.714 } 16 / 298 ]1/2 = 0.32 kg/sec:
Hole Size Release Rate Example-Liquid
Estimate the liquid release rate of toluene from a 25 mm (0.025 m or 1 inch) hole at 55 kPa gauge (156.3 kPa absolute or 22.7 psia), 100 C (373 K), and a height of 10 meter using cd =0.6. Use a liquid density for toluene at 100 C of 785 kg/m3.
L = 1.2 (0.61) (0.025)2 [ 785 {1000 (156.3–101.3) + 9.8 (785) 10} ]1/2 = 4.7 kg/sec
Hole or Short Pipe Size Release Rate for Flashing Liquid
The limiting liquid discharge rate for flashing liquid from a short pipe greater than 0.1 meter in length may be estimated as2:
LF = 20 d2 [ HV / { 1/V – 1/L } ] / [ Cs T ]1/2 (13)
where: Cs = liquid heat capacity (J/g C) d = hole diameter (m)
T = temperature (K) LF = flashing liquid release rate (kg/sec)
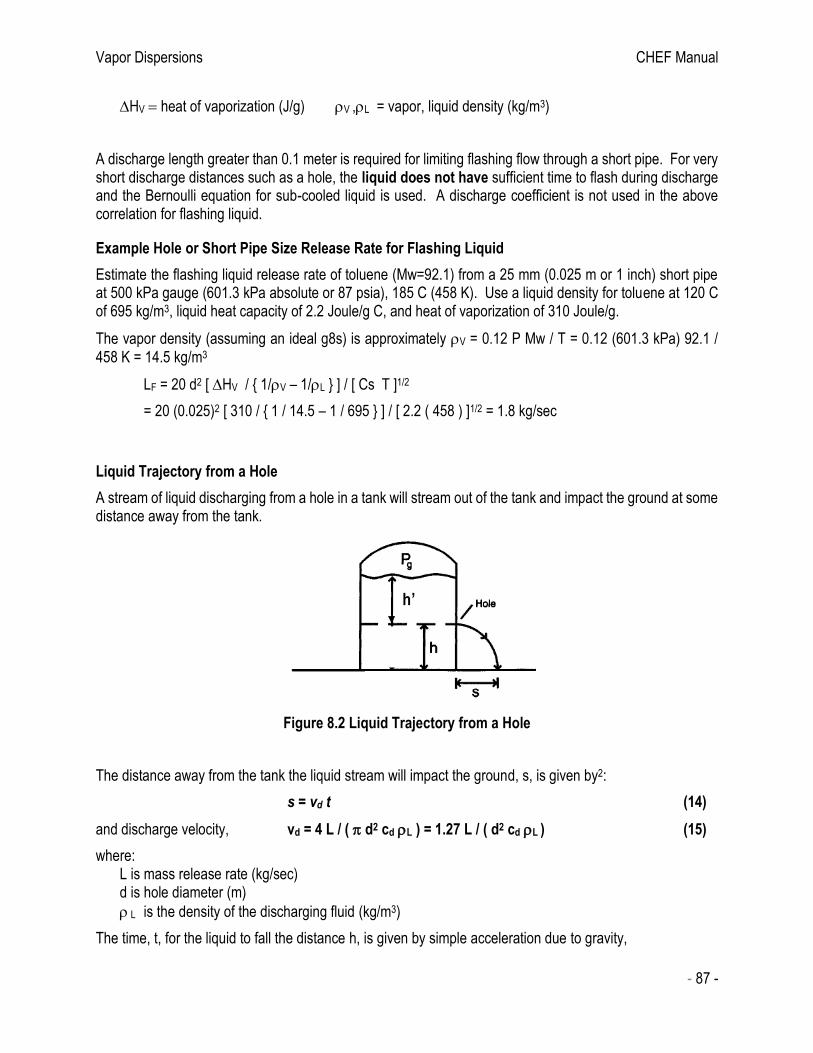
Vapor Dispersions CHEF Manual
- 87 -
HV = heat of vaporization (J/g) V ,L = vapor, liquid density (kg/m3)
A discharge length greater than 0.1 meter is required for limiting flashing flow through a short pipe. For very short discharge distances such as a hole, the liquid does not have sufficient time to flash during discharge and the Bernoulli equation for sub-cooled liquid is used. A discharge coefficient is not used in the above correlation for flashing liquid.
Example Hole or Short Pipe Size Release Rate for Flashing Liquid
Estimate the flashing liquid release rate of toluene (Mw=92.1) from a 25 mm (0.025 m or 1 inch) short pipe at 500 kPa gauge (601.3 kPa absolute or 87 psia), 185 C (458 K). Use a liquid density for toluene at 120 C of 695 kg/m3, liquid heat capacity of 2.2 Joule/g C, and heat of vaporization of 310 Joule/g.
The vapor density (assuming an ideal g8s) is approximately V = 0.12 P Mw / T = 0.12 (601.3 kPa) 92.1 / 458 K = 14.5 kg/m3
LF = 20 d2 [ HV / { 1/V – 1/L } ] / [ Cs T ]1/2
= 20 (0.025)2 [ 310 / { 1 / 14.5 – 1 / 695 } ] / [ 2.2 ( 458 ) ]1/2 = 1.8 kg/sec
Liquid Trajectory from a Hole
A stream of liquid discharging from a hole in a tank will stream out of the tank and impact the ground at some distance away from the tank.
Figure 8.2 Liquid Trajectory from a Hole
The distance away from the tank the liquid stream will impact the ground, s, is given by2:
s = vd t (14)
and discharge velocity, vd = 4 L / ( d2 cd L ) = 1.27 L / ( d2 cd L ) (15)
where: L is mass release rate (kg/sec) d is hole diameter (m)
L is the density of the discharging fluid (kg/m3)
The time, t, for the liquid to fall the distance h, is given by simple acceleration due to gravity,
h’

Vapor Dispersions CHEF Manual
- 88 -
t = 0.45 h1/2 (16)
Liquid trajectory distance and time may be used to estimate duration of aerosol droplets associated with a high velocity liquid leak of estimate a distance at which personnel could be sprayed from a liquid leak. The distance may also be used to determine if a liquid stream could shoot over any dike designed to contain a spill.
Overflow or Specified Discharge Rate
For overfill scenarios, the liquid release rate is equal to the maximum fill rate.
• The liquid release rate may be estimated from the pipe size, pipe length and pressure difference to downstream equipment for backflow scenarios.
• In some cases, a control valve or other piping restriction may allow estimation of the maximum feed rate using a hole size discharge model.
Discharge Rate from Excessive Heat Input
Many loss events involve excessive heat rate where with the vapor release rate (and corresponding airborne quantity) is determined as heat rate divided by heat of vaporization.
• Fire Venting = qFire / HV where qFire is evaluated per NFPA-30 or other (17)
• Heat Transfer Venting = U AHT (THM – TR) / HV for THM > TR (18)
• Mechanical Energy Venting = { qME – U AS (TR – TA) } / HV for TME > TR (19)
• Reaction Venting = M qRX / HV (20)
Where:
HV is heat of vaporization THM is heating media temperature U is heat transfer coefficient TR is temperature at relief set pressure A is heat transfer or surface area TA is ambient temperature qME is mechanical energy input TME is maximum mechanical energy temperature qRX is reaction energy per mass M is reactant mass
Example Discharge Rate from Excessive Heat Input
Estimate the average (or sizing) vapor release rate of toluene (Mw = 92) from a non-insulated vertical storage tank in a pool fire (using NFPA 30 guidance). Use: Tank dimensions of 9 m diameter by 6 m with volume of 380 m3, “wetted” surface area of 170 m2 , heat of vaporization of 350 Joule/g and qFire = 630 AS
0.338 kJoule for AS in m2.
Release Rate = qFire / HV = 630 AS0.338 / HV = 630 (170)0.338 / 350 = 10.2 kg/sec
The initial (or actual) vapor release rate may be much higher depending on the size and type of the relief device. This maximum release rate needs to be accounted for in the Risk Analysis.
Test for Two-Phase Flow
A test for two-phase flow would typically be applied to vessels or equipment exposed to fire or reactive sys-tems where the release occurs at the top such as with relief device activation.

Vapor Dispersions CHEF Manual
- 89 -
For a vessel at 80% full, the superficial gas velocity required for two-phase flow is roughly 0.12 m/sec (0.4 ft/sec) for “Churn-Turbulent” and 0.03 m/sec (0.09 ft/sec) for foamy or highly viscous (>100 cp at relief tem-perature) materials. Superficial velocity, v*, (m/sec) is determined as:
v* = 8.3 V T / { Mw P ACS } (21)
where the cross-sectional area, ACS, is 0.785 D2 for vertical tanks, 0.785 D H for horizontal tanks and 0.524 D2 for spheres (and D is tank diameter).
Figure 8.3 Liquid Swell from Volumetric Boiling
A “best estimate” two-phase density (Churn-Turbulent), TP, is related by:
TP / V = [ 1 + ( L / V )1/2 ] / [ 1 + ( V / L )1/2 ] (22)
The liquid portion of the two-phase release, L*, may be estimated from a “best estimate” vapor quality and vapor release rate, V, as:
L* = V {TP/V – 1} = V { [(L/V)1/2- (V/L)1/2] / [1 + (V/L)1/2] } (23)
where L, V are liquid and vapor density respectively.
The Total Airborne Quantity from a two-phase release includes Vapor plus Aerosol and Pool Evaporation of the liquid portion. Note that two-phase flow is not normally considered for external fire exposure as the heat input is only via the external surfaces.
80% full
Vapor Dispersions CHEF Manual
- 90 -
Example Test for Two-Phase Flow
In the previous example for fire exposure to a 9 m diameter toluene storage tank, use a vapor rate of 10.2 kg/sec, relief device set pressure of 10 kPa gauge, and liquid density of 770 kg/m3. The boiling point of toluene at 10 kPa gauge (111.3 kPa absolute) is 387 K.
The superficial gas velocity for a vapor rate of 10.2 kg/sec at a pressure of 111.3 kPa absolute and temper-ature of 387 K is:
ACS = 0.785 D2 = 0.785 (9)2 = 63.6 m2
v* = 8.3 V T / { Mw P ACS } = 8.3 (10.2) 387 / { 92 (111.3) 63.6 m2 } = 0.05 m/sec
The superficial gas velocity is below that for two-phase flow at a practical maximum fill fraction of 80 to 90 % (average void fraction of 0.1 to 0.2).
The superficial velocity at the actual vapor rate or capacity of the specific relief device size also needs to be evaluated.
Equipment Rupture
For rupture of low pressure, non-volatile liquid containing vessels or equipment, the release rate is often assumed as the total contents within 10 minutes or less.
For high pressure equipment (or equipment containing volatile liquid), evaluation as an instantaneous release may be more appropriate. For an instantaneous release, the total contents are released at time equal zero. The released material undergoes flash and aerosol evaporation creating an initial total airborne quantity and any remaining liquid undergoes pool evaporation for the entire duration (typically 1 hour).
Estimation of Mixture Properties
Often, particularly for boiling liquids, the liquid composition is known and vapor composition must be esti-mated from a simple vapor-liquid equilibrium model (such as Raoult’s Law). In this case, vapor mole fraction for any component is estimated as:
yi = xi Pi / (24)
where xi is liquid mole fraction, Pi is the component vapor pressure and is the total pressure which is also
equal to xi Pi .
In other cases, two liquid phases may exist and vapor composition is nearly constant between the solubility limits of each liquid phase. The total vapor pressure is estimated as the sum of vapor pressures for each of the two liquid phases.
Chemical properties for mixtures are dependent on composition. The following “Mixture Rules” provide a reasonable estimate for selected chemical properties11.
Mixture Liquid Density estimated by additive volumes:
1/L mixture = sum of mass fraction times (1/L component). (25)
Vapor Density estimated as an ideal gas by:
V = 0.12 P Mwavg / T where P is pressure in kPa and T in K (26)
Vapor Dispersions CHEF Manual
- 91 -
Mixture Liquid Heat Capacity estimated by the sum of liquid mass fraction times component Heat Capacity (or mole fraction times molar Heat Capacity).
Mixture Heat of Vaporization estimated by the sum of vapor mass fraction times component Heat of Va-porization (or mole fraction times molar Heat of Vaporization).
Estimation of Flash Fraction
If a release occurs at temperature above the normal boiling point, flashing will occur. The Flash Fraction, FV, is estimated from the change in temperature, liquid heat capacity and heat of vaporization by:
FV = ( T – TB ) CS / HV (27)
where:
Cs = liquid heat capacity HV = heat of vaporization T = release temperature TB = normal boiling point
The contribution to Airborne Quantity from flashing liquid is the Flash Fraction times the liquid discharge rate, L FV .
Flash Fraction for Chemical Mixtures
An adiabatic flash calculation for a mixture requires solving a material balance for each component11:
zi = (1-FV) xi + FV yi (28)
where xi, yi, and zi is the mole fraction of component i in the liquid, vapor, and feed respectively.
The final mixture boiling point is determined as the temperature where the sum of partial pressures equals the total system pressure (typically one atmosphere). Solving a multi-component flash requires complex “trial and error” techniques found in several engineering application such as ASPEN.
Aerosol Evaporation
The fraction of released liquid vaporized is a poor prediction of the total mass in the vapor cloud due to the presence of entrained liquid as droplets or aerosol. There is little information in the literature regarding aer-osol formation and evaporation. Some references17 note multiplying the flash fraction by factors of 1 to 4 to provide a rough approximation for the impact of aerosols. Another approach to determining the aerosol fraction involves estimation of droplet size and settling velocity.
Aerosol droplets are formed primarily from condensation, mechanical break-up, and/or flashing break-up of the exiting fluid. Droplets will either be carried downwind and evaporate or coalesce upon hitting the ground or other surfaces as “rainout”2,17. At this time, there is not a completely acceptable method for predicting aerosol evaporation. A common practice is to assume aerosol evaporation is a multiple of the flash fraction (typically 1 to 4).
Another approach is to estimate droplet size from a critical Weber number (typically 10 to 20), duration based on release elevation and settling velocity, and evaporation rate from the droplet surface. An approximation for droplet size from mechanical and flashing break-up (based on a critical Weber number10,17 of 10, typical surface tension of 0.02 N/m, assumed proportional to 1- FV, and ambient air density of 1.18 kg/m3) is:
Critical Weber Number ~ 10 = a vd2 dd / and droplet diameter proportional to (1-FV)
Vapor Dispersions CHEF Manual
- 92 -
dd ~ 0.17 (1 – FV) / vd2 (29)
where dd is droplet diameter in meter (to a maximum of 0.01 m), the liquid surface tension in air, and
discharge velocity, vd = 1.27 L / ( d2 cd ’ ) in m/sec. The density, ’, is that of the discharging fluid which for
two-phase flow is estimated as: 1/’ = FV /V + (1-FV)/L.
A very rough approximation for the fraction evaporated from aerosol droplets for droplet diameter < 0.01 m (or vd > 4 m/sec), FD, is estimated from the droplet surface per mass and release elevation, h, assuming diffusion limited evaporation as:
Diffusion Limited Surface Evaporation, m = 0.0027 Mw2/3 Psat / T per reference 2 in kg/sec m2
Spherical Surface Area per Mass = 6 / (dd L) = 35 vd2 / [L (1-FV)]
Droplet Duration, t = 0.45 h1/2 per Equation 16 assuming horizontal release
FD = 0.043 vd2 Mw2/3 Psat h1/2 / [ L TAerosol (1 – FV) ] (30)
where: vd = release velocity (m/sec) h = release height (m)
Mw = molecular weight L = liquid density (kg/m3) Psat = vapor pressure (kPa absolute) FV = flash fraction TAerosol = aerosol temperature (K) limited to a maximum of the normal boiling point
The aerosol temperature, TAerosol, may be conservatively assumed as the release temperature to a maximum of the normal boiling point. If a more accurate pool temperature is needed, it may be estimated (iteratively) from a heat balance per mass including evaporative cooling, and heat transfer from the droplet to the air as:
FD HV = UD AD t (TA – TAerosol) + 2 CS (T’-TAerosol) for TAerosol = (TFinal + T’) / 2
Spherical Surface Area per Mass = 6 / (dd L) = 35 vd2 / [L (1-FV)]
Droplet Duration, t = 0.45 h1/2 per Equation 16 assuming horizontal release
TAerosol = { 7.9 UD h1/2 vD2
TA / [L (1-FV)] + CS T’ - FD HV / 2 } / { 7.9 UD h1/2 vD2
/ [L (1-FV)] + CS } ] (31)
where: T’ = release temperature to a limit of the normal boiling point (K)
TA = ambient temperature (K) HV = heat of vaporization (Joule/g) mD =droplet evaporation rate (kg/sec m2) CS = liquid heat capacity (Joule/g K) UD – heat transfer coefficient of droplet to surrounding air, typically 0.02 to 0.05 kW/m2 K
The actual mechanism for aerosol formation is much more complex than this simple model. Very small droplets (less than 0.1 mm) may remain suspended for long periods of time and act as a mist or fog. In addition:
• The Fraction Aerosol Evaporation is limited to a maximum of 1.
• Saturation pressure, Psat, is estimated at the release temperature, T’, but limited to that of the normal boiling point, TB, if the fraction vaporized is greater than zero.
Vapor Dispersions CHEF Manual
- 93 -
• For a discharge directed downwards impinging on the ground, the equivalent release elevation and aerosol evaporation term is near zero.
The contribution to Airborne Quantity from Aerosol Evaporation is FD L (1 – FV).
Example Aerosol Evaporation
Estimate the aerosol droplet size and fraction aerosol evaporation for a 20 m/sec release of toluene (Mw = 92) at 100 C (373 K) and height of 2 meter. The density of toluene at 100 C is 785 kg/m3, and vapor pressure is 74 kPa. As the temperature is below the normal boiling point such that the flash fraction is zero.
The estimated average droplet diameter is:
dd ~ 0.17 (1 – FV) / vd2 = 0.17 (1 – 0) / (20)2 = 0.00043 meter (0.43 mm)
FD = 0.043 vd2 Mw2/3 Psat h1/2 / [L T’] = 0.043 (20)2 (92)2/3 74 (2)1/2 / [(785) 373] = 0.13
Evaporation from a Liquid Pool
An important parameter in estimation of evaporation from a liquid pool is the pool area. If unconfined, the pool will expand during the release. The maximum pool size is attained (unless limited by a dike or bund) at the end of the leak duration. Pool size is highly dependent on the roughness of the terrain with a “smooth” surface assumed as a “worst case” resulting in the largest estimated pool size.
The area for an unconfined pool is estimated from the liquid rate and leak duration, tL at a depth of 1 cm. The pool area is limited to the area of a dike or bund if it exists.
AP = L’ / [ L / (100 tL) + mP / 2 ] in m2 limited to the dike area (32)
where: L’ = liquid spill rate to the pool = L [ 1 – FV – (1–FV) FD ] in kg/sec mP = pool evaporation rate (kg/sec m2)
tL = liquid release duration (sec)
L = liquid density (kg/m3)
A “first pass” estimate of maximum pool area (assuming low evaporation rate) is simply AP = L’ / [ L / (100 tL) ].
For an instantaneous release (such as equipment rupture), the pool area is merely:
AP = Total Liquid Released ( 100 / L ) in m2 limited to the dike area (33)
The temperature of liquid in the pool, TP, may be conservatively assumed as the release temperature to a maximum of the normal boiling point. For cases where the release temperature is less than ambient below the normal boiling point, it may be appropriate to assume the liquid pool approaches ambient temperature. If a more accurate pool temperature is needed, it may be estimated (iteratively) from a steady-state heat balance including solar radiation, evaporative cooling, and heat transfer from the ground as:
mP AP HV = AP S + AP UGnd (TA – TP) + L’ CS (T’ – TP)
TP = {T’ L’ Cs + AP (S – mP Hv + UGnd TA)} / {L’ Cs + UGnd AP} ] (34)
Vapor Dispersions CHEF Manual
- 94 -
where: L’ = liquid spill rate to the pool = L (1 – FV) (1-FD ) in kg/sec S = solar radiation input, typically 0.5 kW/m2 for outdoor spills T’ = release temperature to a limit of the normal boiling point (K) TA = ambient temperature (K) mP = pool evaporation rate (kg/sec m2)
HV = heat of vaporization (Joule/g) CS = liquid heat capacity (Joule/g K) UGnd – heat transfer coefficient to ground, typically 0.02 kW/m2 K to 0.2 kW/m2 K
Evaporation rate from a liquid pool, mp (kg/sec m2), is evaluated as diffusion at the estimated pool tempera-ture12, TP, as:
mP = 0.0021 Mw2/3 u0.78 Psat / TP (35)
where: Mw = molecular weight Psat = saturation vapor pressure (kPa) u = wind speed (m/sec) TP = pool temperature (K)
The pool evaporation correlation selected is from the US EPA’s Risk Management Program Guidance for Offsite Consequence Analysis, Appendix D (1999). This reference suggests that for indoor liquid releases, a wind speed of 0.1 m/sec (with pool temperature assuming no solar radiation) may be used.
The contribution to Airborne Quantity from Pool Evaporation is mp AP to a limit of entire pool evaporated or L ( 1 – FV ) ( 1 - FD ).
Example Evaporation from a Liquid Pool
Estimate pool evaporation for a unconfined 15 minute (900 sec) liquid leak of 10 kg/sec toluene (Mw = 92) at 100 C (373 K) assuming a wind speed of 3 m/sec, a flash fraction of zero, and aerosol evaporation fraction of 0.29. The density of toluene is 785 kg/m3 and vapor pressure is 74 kPa at 100 C.
Conservatively assuming the pool temperature as the release temperature to a maximum of the normal boil-ing point:
mP = 0.0021 Mw2/3 u0.78 Psat / TP = 0.0021 (92)2/3 (3)0.78 74 / 373 = 0.020 kg/sec m2
AP = L’ / [ L / (100 tL ) + mP /2 ] = 10 (1–0.29) / [ 785 / (100 {900}) + 0.02 / 2 ] = 379 m2
And total evaporation rate = mp Ap = 379 (0.020) = 7.6 kg/sec limited to 10 (1-0.29) = 7.1 kg/sec
Example Airborne Quantity for a Flashing Liquid Release
Estimate the Airborne Quantity for failure of a 25 mm (0.025 m) diameter liquid butane hose. The location is outdoors and within a 10 m2 diked area. Use a hose elevation of 1 meter.
Use for butane:
Molecular Weight 58.1

Vapor Dispersions CHEF Manual
- 95 -
Release temperature of 10 C (283 K) Normal Boiling Point of - 0.8 C (272 K) Release Pressure of 50 kPa gauge (saturated liquid) Liquid Heat Capacity of 2.4 Joule/g K Heat of Vaporization of 380 Joule/g Liquid Density of 590 kg/m3 Vapor Density (at 10 C and 50 kPa gauge) of 3.7 kg/m3
The liquid discharge rate for flashing liquid from a pipe or hose may be estimated as:
LF = 20 d2 [ HV / { 1 / V – 1 / L } ] / [ Cs T ]1/2
= 20 (0.025)2 [ 380 / { 1 / 3.7 – 1 / 590 }] / [ 2.4 (283) ]1/2 = 0.68 kg/sec
The Flash Fraction, FV, is estimated from the change in temperature, liquid heat capacity and heat of vapor-ization by:
FV = ( T – TB ) CS / HV = ( 283 – 272 ) 2.4 / 380 = 0.07
The two-phase release velocity,
‘ = 1 / [ FV / V + (1-FV) / L ] = 1 / [ 0.07/ 3.7 + (1-0.07) / 590 ] = 49 kg/m3
vd = 1.27 L / ( D2 cd ’ ) = 1.27 (0.68) / [ (0.025)2 (1.0) 49 ] = 28 m/sec
The fraction aerosol droplet evaporation, FD, is estimated at the normal boiling point where Psat is atmospheric pressure or 101.3 kPa and release elevation, h, is 1 meter.
FD = 0.043 vd2 Mw2/3 Psat h1/2 / [L T’ (1 – FV) ]
= 0.043 (28)2 58.12/3 (101.3) 11/2 / [ (590) 272 (1-0.07) ] = 0.34
Evaporation rate from a liquid pool, is evaluated at an estimated pool temperature (assume the normal boiling point or 272 K), wind speed of 3 m/sec and pool area of 10 m2 as:
mP = 0.0021 Mw2/3 u0.78 Psat / TP
= 0.0021 (58.1)2/3 30.78 (101.3) / 272 = 0.028 kg/sec m2
The Airborne Quantity = L [ FV + (1 – FV ) FD ] + mp A
= 0.68 [ 0.07 + (1 – 0.07) 0.34 ] + 0.028 (10) = 0.54 kg/sec
which is close to the liquid release rate of 0.68 kg/sec.

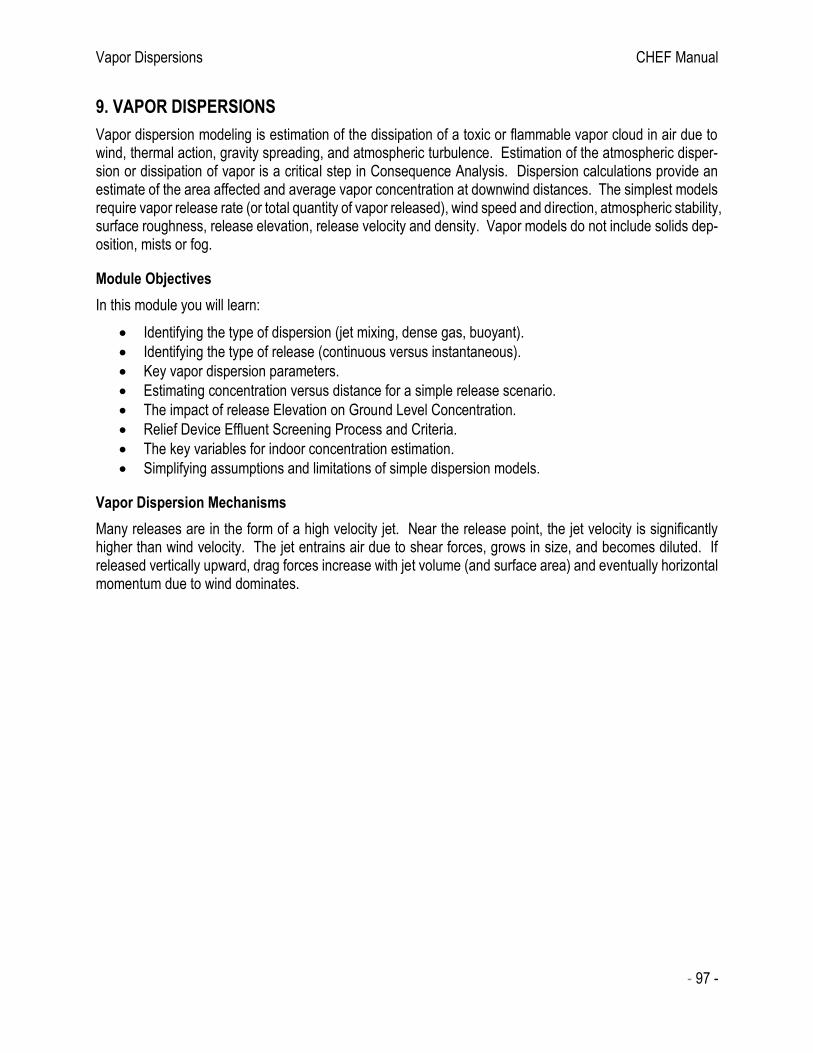
Vapor Dispersions CHEF Manual
- 97 -
9. VAPOR DISPERSIONS
Vapor dispersion modeling is estimation of the dissipation of a toxic or flammable vapor cloud in air due to wind, thermal action, gravity spreading, and atmospheric turbulence. Estimation of the atmospheric disper-sion or dissipation of vapor is a critical step in Consequence Analysis. Dispersion calculations provide an estimate of the area affected and average vapor concentration at downwind distances. The simplest models require vapor release rate (or total quantity of vapor released), wind speed and direction, atmospheric stability, surface roughness, release elevation, release velocity and density. Vapor models do not include solids dep-osition, mists or fog.
Module Objectives
In this module you will learn:
• Identifying the type of dispersion (jet mixing, dense gas, buoyant).
• Identifying the type of release (continuous versus instantaneous).
• Key vapor dispersion parameters.
• Estimating concentration versus distance for a simple release scenario.
• The impact of release Elevation on Ground Level Concentration.
• Relief Device Effluent Screening Process and Criteria.
• The key variables for indoor concentration estimation.
• Simplifying assumptions and limitations of simple dispersion models.
Vapor Dispersion Mechanisms
Many releases are in the form of a high velocity jet. Near the release point, the jet velocity is significantly higher than wind velocity. The jet entrains air due to shear forces, grows in size, and becomes diluted. If released vertically upward, drag forces increase with jet volume (and surface area) and eventually horizontal momentum due to wind dominates.

Vapor Dispersions CHEF Manual
- 98 -
Figure 9.1 Vapor Release Mechanisms
When dense gases are released, the gas travels downward and downwind while being mixed with fresh air. Considerable initial dilution occurs because of the gravity-driven intrusion of the cloud into the ambient air.
Irrespective of the initial release conditions of velocity and density, a point will eventually be reached where the gas has been diluted adequately to be considered neutrally buoyant. At this point the dispersion is dom-inated by ambient turbulence.
Jet Mixing
Release of flammable vapor often occurs at relatively discharge velocity. The primary dilution mechanism is entrainment of air due to shear forces. This mechanism is very important as often the initial dilution reduces concentration to below the lower flammable limit for release of a flammable vapor. A simple correlation for jet mixing of a turbulent, free (subsonic) jet is10:
C0 / C = 0.32 ( 0 / )1/2 X / d0 (36)
C0 / Ct = ( 0 / t ) ( v0 / u ) at X = Xt (37)
where: C0 = initial volumetric concentration at exit of jet (volume fraction) Ct = volumetric concentration at distance Xt (volume fraction) X = distance from the release point (m)
Xt = transition distance (m) or distance where jet mixing is no longer significant
Jet Mixing Dense Gas DispersionNeutrally Buoyant
Gaussian Dispersion
Transition from initial acceleration and dilution to dominance of
internal buoyancy
Region of Flammable
Concentration
Region of Toxic
Concentration
Release Point
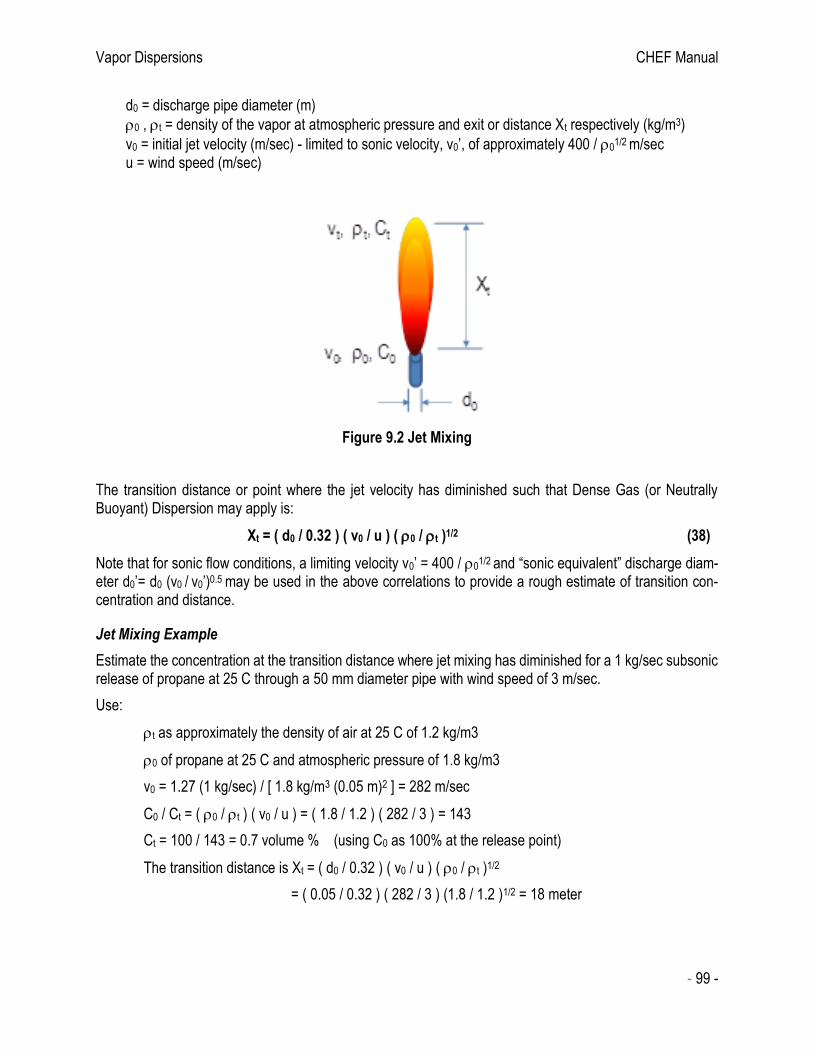
Vapor Dispersions CHEF Manual
- 99 -
d0 = discharge pipe diameter (m)
0 , t = density of the vapor at atmospheric pressure and exit or distance Xt respectively (kg/m3)
v0 = initial jet velocity (m/sec) - limited to sonic velocity, v0’, of approximately 400 / 01/2 m/sec
u = wind speed (m/sec)
Figure 9.2 Jet Mixing
The transition distance or point where the jet velocity has diminished such that Dense Gas (or Neutrally Buoyant) Dispersion may apply is:
Xt = ( d0 / 0.32 ) ( v0 / u ) ( 0 / t )1/2 (38)
Note that for sonic flow conditions, a limiting velocity v0’ = 400 / 01/2 and “sonic equivalent” discharge diam-
eter d0’= d0 (v0 / v0’)0.5 may be used in the above correlations to provide a rough estimate of transition con-centration and distance.
Jet Mixing Example
Estimate the concentration at the transition distance where jet mixing has diminished for a 1 kg/sec subsonic release of propane at 25 C through a 50 mm diameter pipe with wind speed of 3 m/sec.
Use:
t as approximately the density of air at 25 C of 1.2 kg/m3
0 of propane at 25 C and atmospheric pressure of 1.8 kg/m3
v0 = 1.27 (1 kg/sec) / [ 1.8 kg/m3 (0.05 m)2 ] = 282 m/sec
C0 / Ct = ( 0 / t ) ( v0 / u ) = ( 1.8 / 1.2 ) ( 282 / 3 ) = 143
Ct = 100 / 143 = 0.7 volume % (using C0 as 100% at the release point)
The transition distance is Xt = ( d0 / 0.32 ) ( v0 / u ) ( 0 / t )1/2
= ( 0.05 / 0.32 ) ( 282 / 3 ) (1.8 / 1.2 )1/2 = 18 meter
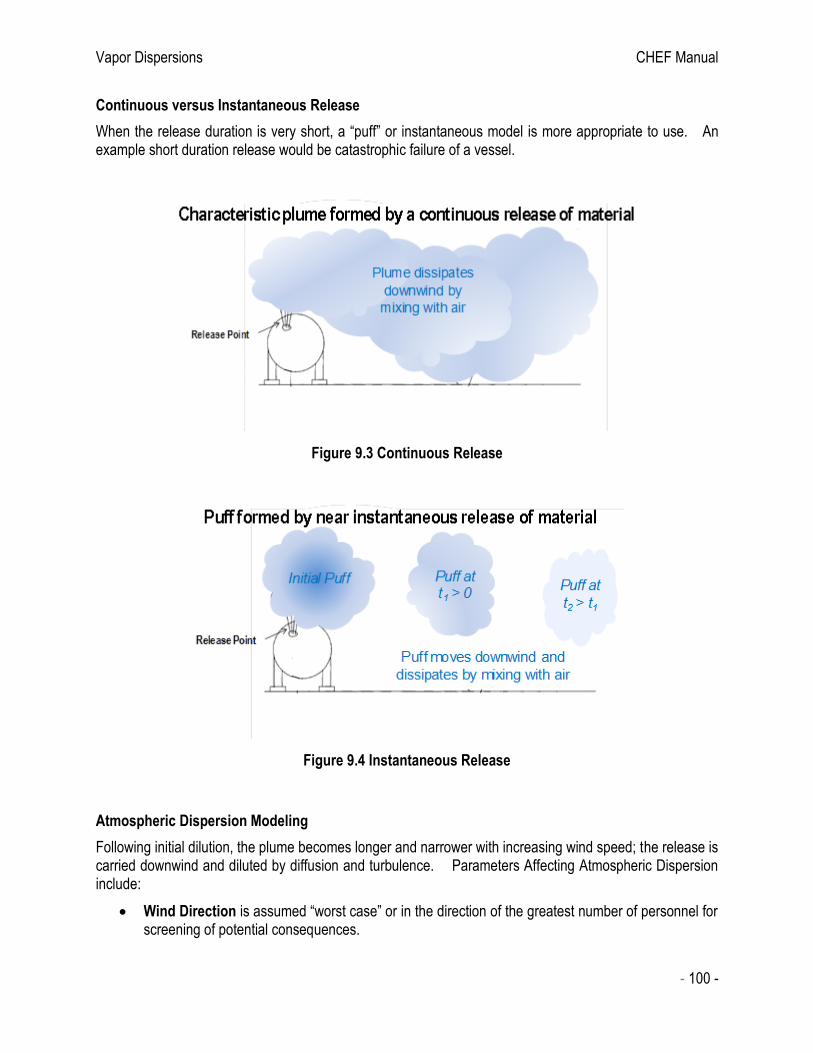
Vapor Dispersions CHEF Manual
- 100 -
Continuous versus Instantaneous Release
When the release duration is very short, a “puff” or instantaneous model is more appropriate to use. An example short duration release would be catastrophic failure of a vessel.
Figure 9.3 Continuous Release
Figure 9.4 Instantaneous Release
Atmospheric Dispersion Modeling
Following initial dilution, the plume becomes longer and narrower with increasing wind speed; the release is carried downwind and diluted by diffusion and turbulence. Parameters Affecting Atmospheric Dispersion include:
• Wind Direction is assumed “worst case” or in the direction of the greatest number of personnel for screening of potential consequences.

Vapor Dispersions CHEF Manual
- 101 -
• Surface Roughness and Wind Speed affect the mechanical mixing and the overall dispersion co-efficient. Trees and buildings increase surface roughness which promotes mixing, whereas lakes and open areas decrease it.
• Averaging Time is used to quantify an average concentration which accounts for variation over time due to meandering of the vapor plume. Gaussian models are typically based on a 10 minute aver-aging time which is the industry standard for analysis of toxic cases. The industry standard for analysis of flammable cases utilizes a much shorter averaging time (18.75 seconds) with higher maximum concentration.
• Release Elevation impacts ground-level concentration. As the release height increases, ground-level concentrations are reduced because the plume must disperse a greater distance vertically.
• Momentum and Buoyancy of the initial material released changes the effective height of the release. The momentum of a high-velocity jet will carry the gas higher than the point of release, resulting in a much higher effective release height. If the gas has a density less than air, the released gas will initially be positively buoyant and will lift upward. If the gas has a density greater than air, then the released gas will initially be negatively buoyant and will slump toward the ground.
• Atmospheric Stability relates to vertical mixing of the air in neutrally buoyant models. During the day, the air temperature decreases rapidly with height, encouraging vertical motions. At night the temperature decrease is less, resulting in less vertical motion. For screening of potential conse-quences, Class D atmospheric conditions with a wind speed of 3 m/sec is commonly used. In more detailed Consequence Analysis, Class D at other wind speeds and “worst case” Class F at 1.5 m/sec wind speed is included.
Dense Gas Dispersion Models
A dense gas is any released vapor with a density greater than ambient air through which it is being dispersed. Most vapor releases are considered “dense gas” as either the molecular weight is greater than air or the release temperature is less than ambient.
When a dense gas is initially released, the cloud slumps toward the ground under the influence of gravity and increases in width2,7. Dilution occurs due to gravity-driven intrusion of the cloud into ambient air. This is a different dispersion mechanism than occurs with neutrally buoyant releases. After sufficient dilution occurs, atmospheric turbulence becomes the primary mechanism. Eventually density differences become small such that the cloud may be considered neutrally buoyant.
Neutrally Buoyant Gaussian Models
Neutrally Buoyant models are based on a random mixing process driven by turbulence in the atmosphere2,7. The concentration at a downwind location is approximated as a “normal” or Gaussian distribution in both the horizontal and vertical direction from the centerline of the release.
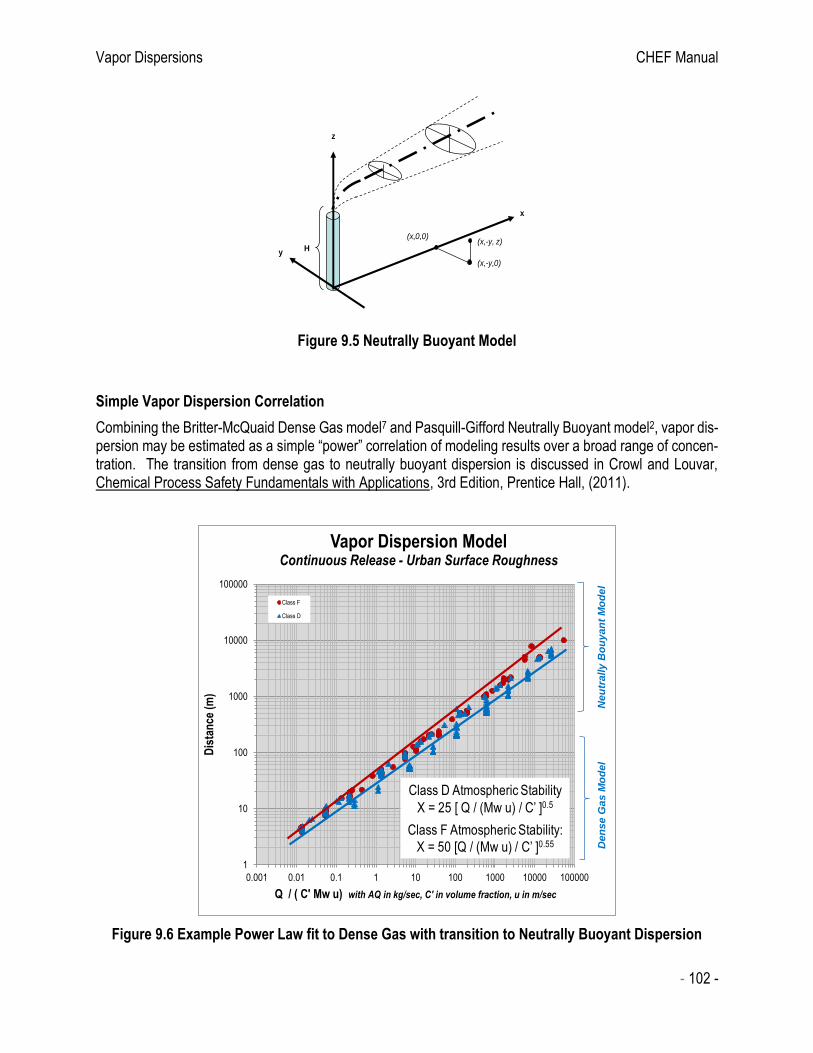
Vapor Dispersions CHEF Manual
- 102 -
Figure 9.5 Neutrally Buoyant Model
Simple Vapor Dispersion Correlation
Combining the Britter-McQuaid Dense Gas model7 and Pasquill-Gifford Neutrally Buoyant model2, vapor dis-persion may be estimated as a simple “power” correlation of modeling results over a broad range of concen-tration. The transition from dense gas to neutrally buoyant dispersion is discussed in Crowl and Louvar, Chemical Process Safety Fundamentals with Applications, 3rd Edition, Prentice Hall, (2011).
Figure 9.6 Example Power Law fit to Dense Gas with transition to Neutrally Buoyant Dispersion
x
y
z
H
(x,0,0)
(x,-y,0)
(x,-y, z)
1
10
100
1000
10000
100000
0.001 0.01 0.1 1 10 100 1000 10000 100000
Dis
tan
ce (
m)
Q / ( C' Mw u) with AQ in kg/sec, C' in volume fraction, u in m/sec
Vapor Dispersion ModelContinuous Release - Urban Surface Roughness
Class F
Class D
Den
se G
as M
od
el
Neu
trally B
ou
yan
t M
od
el
Class D Atmospheric Stability
X = 25 [ Q / (Mw u) / C’ ]0.5
Class F Atmospheric Stability:
X = 50 [Q / (Mw u) / C’ ]0.55
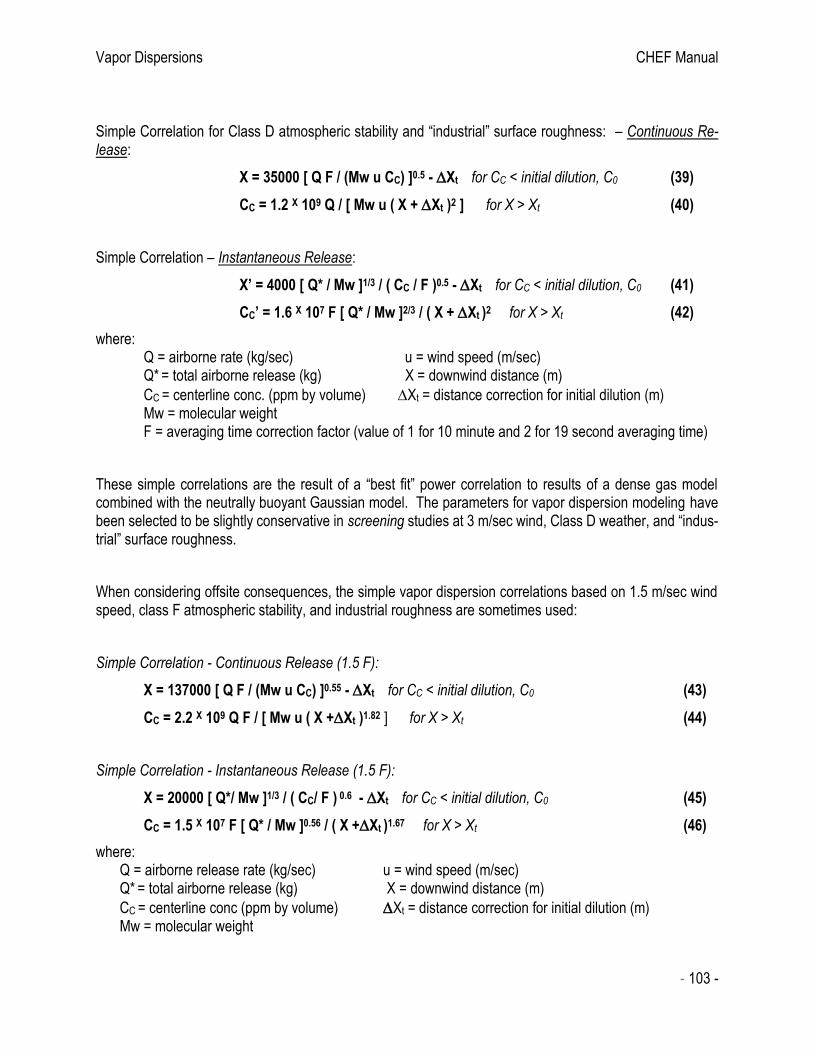
Vapor Dispersions CHEF Manual
- 103 -
Simple Correlation for Class D atmospheric stability and “industrial” surface roughness: – Continuous Re-lease:
X = 35000 [ Q F / (Mw u CC) ]0.5 - Xt for CC < initial dilution, C0 (39)
CC = 1.2 X 10⁹ Q / [ Mw u ( X + Xt )2 ] for X > Xt (40)
Simple Correlation – Instantaneous Release:
X’ = 4000 [ Q* / Mw ]1/3 / ( CC / F )0.5 - Xt for CC < initial dilution, C0 (41)
CC’ = 1.6 X 10⁷ F [ Q* / Mw ]2/3 / ( X + Xt )2 for X > Xt (42)
where: Q = airborne rate (kg/sec) u = wind speed (m/sec) Q* = total airborne release (kg) X = downwind distance (m)
CC = centerline conc. (ppm by volume) Xt = distance correction for initial dilution (m) Mw = molecular weight F = averaging time correction factor (value of 1 for 10 minute and 2 for 19 second averaging time)
These simple correlations are the result of a “best fit” power correlation to results of a dense gas model combined with the neutrally buoyant Gaussian model. The parameters for vapor dispersion modeling have been selected to be slightly conservative in screening studies at 3 m/sec wind, Class D weather, and “indus-trial” surface roughness.
When considering offsite consequences, the simple vapor dispersion correlations based on 1.5 m/sec wind speed, class F atmospheric stability, and industrial roughness are sometimes used:
Simple Correlation - Continuous Release (1.5 F):
X = 137000 [ Q F / (Mw u CC) ]0.55 - Xt for CC < initial dilution, C0 (43)
CC = 2.2 X 10⁹ Q F / [ Mw u ( X +Xt )1.82 ] for X > Xt (44)
Simple Correlation - Instantaneous Release (1.5 F):
X = 20000 [ Q*/ Mw ]1/3 / ( CC/ F ) 0.6 - Xt for CC < initial dilution, C0 (45)
CC = 1.5 X 10⁷ F [ Q* / Mw ]0.56 / ( X +Xt )1.67 for X > Xt (46)
where: Q = airborne release rate (kg/sec) u = wind speed (m/sec) Q* = total airborne release (kg) X = downwind distance (m)
CC = centerline conc (ppm by volume) Xt = distance correction for initial dilution (m) Mw = molecular weight

Vapor Dispersions CHEF Manual
- 104 -
F = averaging time correction factor (value of 1 for 10 minute and 2 for 19 second averaging time)
Correction for Initial Dilution in Simple Vapor Dispersion Model
This simple dispersion model may require a “virtual” distance correction for the transition from initial dilution by jet mixing to improve accuracy for downwind distance much less than 100 m. For many situations, this correction can be ignored. The correction for a continuous vapor release is estimated as:
Xt ~ 37 [ AQ v0 / T ]0.5 for a vertical release (47)
Xt ~ 37 [ AQ v0 / T ]0.5 – 3.3 d0 v0 (Mw / T)0.5 for a horizontal release (48)
At low vapor velocity, liquid or two-phase release, the distance correction is evaluated such that the concen-tration at zero downwind distance, X=0, is limited to 100% or 1000000 ppm. In this case:
Xt = 20 [ AQ / Mw ]0.5 (49)
where: X = downwind distance (m)
Xt = distance correction for initial dilution (m) AQ = airborne rate (kg/sec) T = release temperature (K) Mw = molecular weight v0 = release velocity (m/sec) – limited to sonic velocity d0 = discharge pipe diameter (m) – or equivalent diameter if discharge at sonic conditions
Vapor Dispersion Example – Estimate Distance to a Concentration
Estimate the distance to ERPG-3 concentration of 20 ppm by volume for a continuous 1 kg/sec chlorine release at 25 C (298 K) with 3 m/sec wind near ground elevation. Assume a very low velocity such that the initial dilution is zero. (The molecular weight for chlorine is 70.9)
Xt = 20 [ AQ / Mw ]0.5 = 20 [ 1 kg/sec / 70.9 ]0.5 = 2.4 m
a negligible correction which can be ignored in this case.
X = 35000 [ AQ / (Mw u C) ]0.5 = 35000 [ 1 kg/sec / ( 70.9 [ 3 m/sec ] {20 ppm} )]0.5
= 537 meter
Vapor Dispersion Model Example – Estimate Concentration at a Distance
Estimate the concentration at a downwind distance of 100 m for a continuous 1 kg/sec chlorine release at 25 C (298 K) with wind of 3 m/sec near ground elevation. Ignore the correction for initial dilution. Assume a very low velocity such that the initial dilution is zero. (The molecular weight for chlorine is 70.9)
CC = 1.2 X 10⁹ AQ / [ Mw ( X )2 ] = 1.2 X 10⁹ ( 1 kg/sec ) / [ 70.9 ( 3 m/sec) (100 m)2 ]
= 564 ppm:
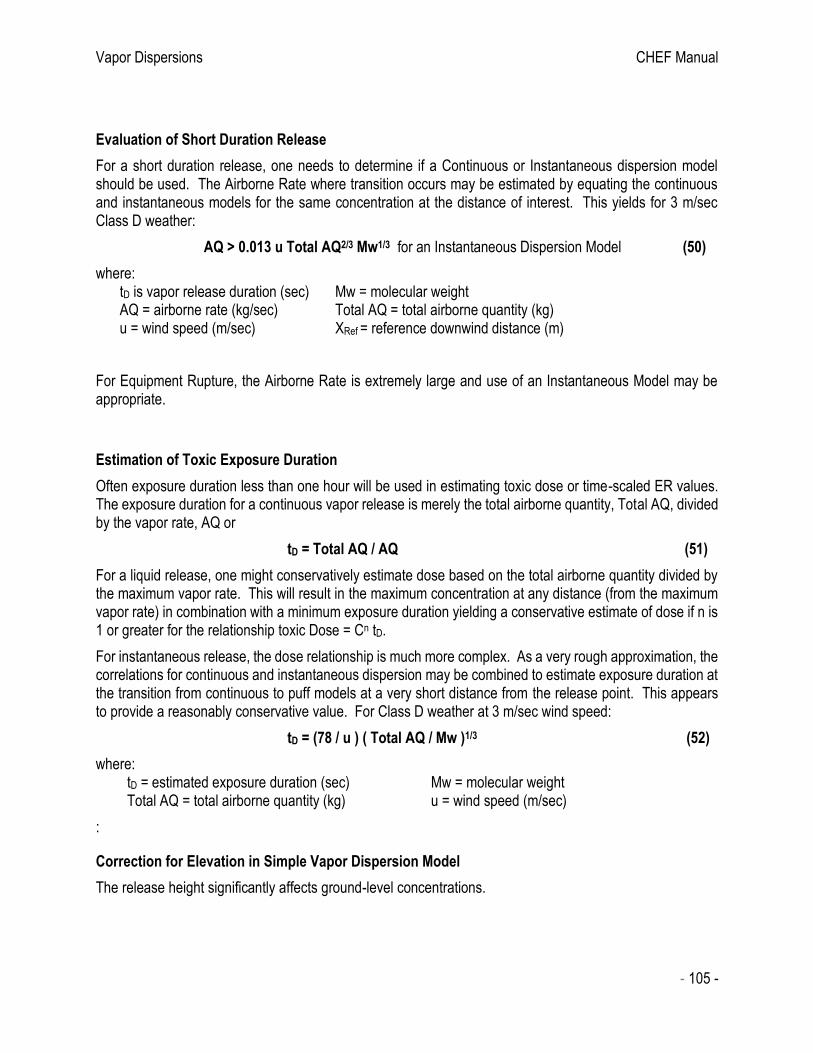
Vapor Dispersions CHEF Manual
- 105 -
Evaluation of Short Duration Release
For a short duration release, one needs to determine if a Continuous or Instantaneous dispersion model should be used. The Airborne Rate where transition occurs may be estimated by equating the continuous and instantaneous models for the same concentration at the distance of interest. This yields for 3 m/sec Class D weather:
AQ > 0.013 u Total AQ2/3 Mw1/3 for an Instantaneous Dispersion Model (50)
where: tD is vapor release duration (sec) Mw = molecular weight AQ = airborne rate (kg/sec) Total AQ = total airborne quantity (kg) u = wind speed (m/sec) XRef = reference downwind distance (m)
For Equipment Rupture, the Airborne Rate is extremely large and use of an Instantaneous Model may be appropriate.
Estimation of Toxic Exposure Duration
Often exposure duration less than one hour will be used in estimating toxic dose or time-scaled ER values. The exposure duration for a continuous vapor release is merely the total airborne quantity, Total AQ, divided by the vapor rate, AQ or
tD = Total AQ / AQ (51)
For a liquid release, one might conservatively estimate dose based on the total airborne quantity divided by the maximum vapor rate. This will result in the maximum concentration at any distance (from the maximum vapor rate) in combination with a minimum exposure duration yielding a conservative estimate of dose if n is 1 or greater for the relationship toxic Dose = Cn tD.
For instantaneous release, the dose relationship is much more complex. As a very rough approximation, the correlations for continuous and instantaneous dispersion may be combined to estimate exposure duration at the transition from continuous to puff models at a very short distance from the release point. This appears to provide a reasonably conservative value. For Class D weather at 3 m/sec wind speed:
tD = (78 / u ) ( Total AQ / Mw )1/3 (52)
where: tD = estimated exposure duration (sec) Mw = molecular weight Total AQ = total airborne quantity (kg) u = wind speed (m/sec)
:
Correction for Elevation in Simple Vapor Dispersion Model
The release height significantly affects ground-level concentrations.

Vapor Dispersions CHEF Manual
- 106 -
Figure 9.7 Elevated Vapor Release
Correction for release elevation due to vapor momentum and density may be approximated by7:
H = H’ + 1.5 ( v0 / u ) d0 [ sin + 1.8 d0 (1 - 0 /air) ] (53)
where:
sin is 1 for a vertically upward release and 0 for a horizontal release H’ is the release elevation (or stack height) v0 = gas exit velocity u = wind speed d0 = discharge pipe diameter (m)
0 = exit gas density
air = density of ambient air
For Class D weather, “industrial” surface roughness, and a Gaussian distribution; the ratio of concentration at a vertical distance from the center of the cloud to that at the center is approximately:
C / Cc = exp[ -0.5 ( H / { 0.395 ( X + Xt )0.701 } )2 ] (54)
where:
H = effective release elevation minus reference or receptor elevation (m) X = downwind distance (m)
Xt = distance correction for initial dilution (m)
Estimation of Maximum Ground Level Concentration
For a ground elevation release, the maximum ground level concentration is the concentration at the release location. For release from an elevated location, the maximum ground concentration at any distance (for 3 m/sec wind and Class D atmospheric stability) may be conservatively estimated as:
Effe
ctiv
e R
ele
ase
Ele
va
tion
Elevation Correction
for Plume Rise

Vapor Dispersions CHEF Manual
- 107 -
Cmax ~ 5.3 x 10⁶ AQ / ( H2.3 Mw ) (55)
where: AQ = airborne quantity (kg/sec)
H = effective release elevation minus reference elevation (m) Mw = molecular weight of released vapor Cmax = max ground level concentration (ppm)
Note that the reference elevation for “ground” level is typically assumed as 1.2 m (or 4 ft).
Example Correction for Elevation
Estimate the ground level concentration at 100 m downwind for a continuous 1 kg/sec chlorine release at 25 C (298 K) with wind of 3 m/sec and 10 meter effective elevation. Assume a very low velocity such that the initial dilution and plume rise is zero. (The molecular weight for chlorine is 70.9)
Xt = 20 [ AQ / Mw ]0.5 = 15 [ 1 kg/sec / 70.9 ]0.5 = 2.4 m
a negligible correction which can be ignored.
H = 10 – 1.2 = 8.8 meter using 4 ft or 1.2 m for “ground”
CC = 1.2 x 10⁹ AQ / [ Mw u ( X )2 ] = 1.2 x 10⁹ (1 kg/sec ) / [ 70.9 ( 3 m/sec ) (100 )2 ] = 564 ppm
C = CC exp[ -0.5 H / { 0.395 ( X + Xt )0.701 } )2 ] = 450 (0.677) = 382 ppm
Relief Device Effluent Screening
Overpressure scenarios represent a significant portion of potential releases in a typical facility risk analysis. These will often represent the design scenarios for pressure relief devices. Common scenarios include:
• Heat from fire exposure
• Closed outlet with heat source on – external heat input (vaporization)
• Thermal expansion of liquid – may be an issue if gasket or piping/equipment failure is not discovered before next use of piping or equipment.
• Loss of cooling
• Over pumping of liquid (overfill and back flow)
• Control valve / pressure regulator failure
• Heat exchanger tube failure (for heat exchangers)
• User provided Relief Rate (Relief Duty needed by customer)
• Pumping liquid in plus thermal breathing-API (vapor from liquid displacement)
• Pumping liquid out plus thermal breathing-API (potential vacuum condition)
• Runaway Reaction
A hazard screening and analysis process determines when pressure relief devices can be safely vented to the atmosphere and under what conditions (proximity, direction, etc.). Cases that fail the screening hazard assessment must be designed to minimize risk using the results of a Layers of Protection Analysis (LOPA)

Vapor Dispersions CHEF Manual
- 108 -
and / or vapor cloud dispersion model. If dispersion modeling shows the pressure relief device can not be safely vented to the atmosphere, or LOPA shows that the risk is too high for atmospheric venting, then the effluent should be routed to a treatment system. High Integrity Protection Systems (HIPS) can also be used to eliminate relief scenarios that have unacceptable effluent consequences.
Simplified Relief Effluent Screening Process
The Relief Effluent Screening involves several key steps:
• Is the released material considered hazardous? • Is the release all vapor? (Liquid and Two-Phase release requires a more detailed analysis and is
excluded from this screening at this time.) • 1st Pass Screening using simple modeling methods to determine if routed to a safe location • 2nd Pass Screening using advanced modeling – or – performing a simplified Risk Analysis (using
Layers of Protection Analysis) based on venting to atmosphere
Figure 9.8 Example Relief Effluent Screening Flowchart
Relief Effluent Screening Criteria
Relief Effluent Screening addresses if onsite personnel could be exposed to flammable or toxic cloud or if the cloud potentially exceeds the distance to plant’s property limit.
StartDoes the chemical trigger
need for effluent analysis?
Is effluent all-vapor?
Screening Evaluation for
flammability and/or toxicity
Detailed Evaluation using
Advanced Dispersion Modeling or
Simplified Risk Analysis (LOPA)
Atmospheric Venting
Acceptable to Safe Location
Vent to Containment or
Treatment System
Yes
Passes
Tests
Yes
Fails Tests
Passes
TestsFails
Tests
No
No

Vapor Dispersions CHEF Manual
- 109 -
Figure 9.9 Depiction of Relief Device Effluent
Here are some example screening criteria:
▪ Offsite concentration less than ERPG-2 (at ≤ 4 ft elevation) ▪ Onsite concentration less then ½ the Lower Flammable Limit at distance and elevation of nearest
unrestricted work area ▪ Onsite concentration less then time-scaled ERPG-3 at distance and elevation of nearest unrestricted
work area ▪ Onsite concentration less than ERPG-3 (scaled to 1 hour) at the distance and elevation of the nearest
occupied building is noted in the screening
Relief Effluent Screening Tool and Additional Information
A Relief Effluent Screening Tool has been developed for vapor releases which uses a simple dispersion method and addresses time varying release rates as discussed in the Toxicity training module. The tool, available in RAST, also:
• Adresses chemical mixtures • Accounts for release elevation and direction of discharge • Accounts for release duration in estimation of equivalent toxic dose • Provides information as input for detailed modeling if additional screening is needed.
Releases Impacting Personnel Located Indoors
There are two special cases where indoor personnel may be impacted from a hazardous release – those within an enclosed process area and those in a nearby occupied building. Each of these cases depends on ventilation rate. For those within an enclosed area, high ventilation rate will more quickly exhaust hazardous
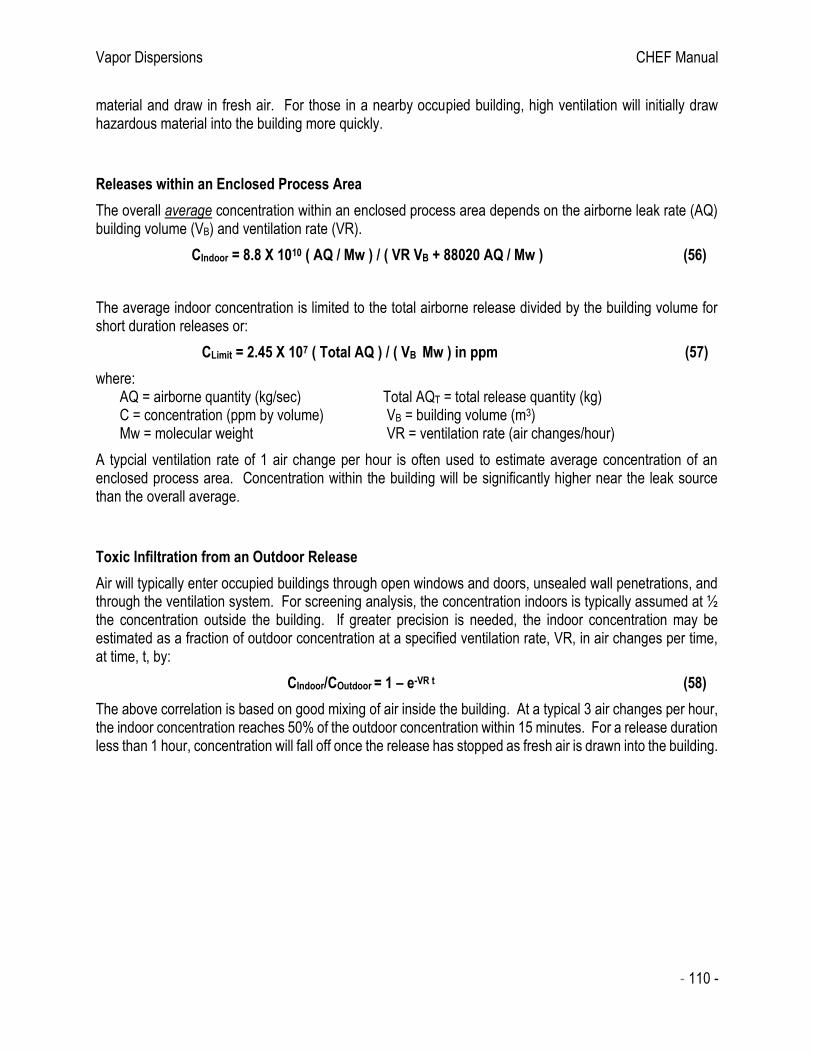
Vapor Dispersions CHEF Manual
- 110 -
material and draw in fresh air. For those in a nearby occupied building, high ventilation will initially draw hazardous material into the building more quickly.
Releases within an Enclosed Process Area
The overall average concentration within an enclosed process area depends on the airborne leak rate (AQ) building volume (VB) and ventilation rate (VR).
CIndoor = 8.8 X 10¹⁰ ( AQ / Mw ) / ( VR VB + 88020 AQ / Mw ) (56)
The average indoor concentration is limited to the total airborne release divided by the building volume for short duration releases or:
CLimit = 2.45 X 10⁷ ( Total AQ ) / ( VB Mw ) in ppm (57)
where: AQ = airborne quantity (kg/sec) Total AQT = total release quantity (kg) C = concentration (ppm by volume) VB = building volume (m3) Mw = molecular weight VR = ventilation rate (air changes/hour)
A typcial ventilation rate of 1 air change per hour is often used to estimate average concentration of an enclosed process area. Concentration within the building will be significantly higher near the leak source than the overall average.
Toxic Infiltration from an Outdoor Release
Air will typically enter occupied buildings through open windows and doors, unsealed wall penetrations, and through the ventilation system. For screening analysis, the concentration indoors is typically assumed at ½ the concentration outside the building. If greater precision is needed, the indoor concentration may be estimated as a fraction of outdoor concentration at a specified ventilation rate, VR, in air changes per time, at time, t, by:
CIndoor/COutdoor = 1 – e-VR t (58)
The above correlation is based on good mixing of air inside the building. At a typical 3 air changes per hour, the indoor concentration reaches 50% of the outdoor concentration within 15 minutes. For a release duration less than 1 hour, concentration will fall off once the release has stopped as fresh air is drawn into the building.

Vapor Dispersions CHEF Manual
- 111 -
Figure 9.10 Ratio of Indoor to Outcoor Concentration vs Time
For very short duration releases within the typical range of ventilation rate, a practical upper limit for indoor concentration is CIndoor/COutdoor = 2 t’ where t’ is the release duration in hours.
Typical Ventilation Rates
The ventilation rate for occupied buildings is typically designed for 2 air changes per hour for office areas, 6 for kitchens and restrooms, and higher for laboratories or process areas with possible toxic gas leaks. These or other design rates may be required by local permitting agencies.
Ventilation rate also depends on construction type, outdoor wind speed and degree of mechanical ventilation. A practical upper limit for enclosed process areas without mechanical ventilation is 2 air changes per hour with a range of 0.1 to 2 depending on outdoor wind speed. For screening analysis, a typical value of 1 air change per hour for an enclosed process area may be appropriate if the actual ventilation rate is not known.
Table 9.1 Typical Ventillation Rate for Houses
0
0.1
0.2
0.3
0.4
0.5
0.6
0.7
0.8
0 0.1 0.2 0.3 0.4 0.5 0.6 0.7 0.8 0.9 1
Ind
do
r/O
utd
oo
r C
on
cen
trat
ion
Time, hour
Indoor Concentrationfor 15 minute toxic release
0.5 Air Change/Hour
1 Air Change/Hour
2 Air Change/Hour
3 Air Change/Hour
5 Air Change/Hour
Typical Ventilation Rate for
Houses in an Urban Area
Construction Air Exchanges
Level per Hour
Tight 0.25
Average 0.50
Leaky 1.0
Very Leaky 2.0

Impact Assessment CHEF Manual
- 112 -
10. EXPLOSIONS
An explosion results from the rapid release of energy, often expansion of gases resulting in a rapidly moving pressure or shock wave. The damage depends on whether the propagation rate (detonation or deflagration) and level of confinement or congestion.
Module Objectives
In this module you will learn:
• Types of explosion – vapor cloud explosion, building or equipment explosion, and physical explosion.
• Key parameters for Estimation of Explosion Energy including typical Heat of Combustion per cloud volume, Fuel Reactivity, and Level of Equipment Congestion.
• Estimation of blast overpressure versus distance for Physical Explosion using a simple TNT model.
• Estimation of blast overpressure versus distance for a Building Explosion using a simple Baker-Strehlow-Tang model.
• Estimation of blast overpressure versus distance for a Vapor Cloud Explosion using a simple Baker-Strehlow-Tang model.
• Limitations of simple blast models.
Explosion Definitions
Common terms associated with explosion are:
Detonation – A release of energy caused by the propagation of a chemical reaction in which the reaction front advances into the unreacted substance at greater than sonic velocity in the unreacted material.
Deflagration - A combustion that propagates by heat and mass transfer through the un-reacted me-dium at a velocity less than the speed of sound.
Boiling-Liquid Expanding-Vapor Explosion (BLEVE) – A type of rapid phase transition in which a liquid contained above its atmospheric boiling point is rapidly depressurized, causing a nearly instanta-neous transition from liquid to vapor with a corresponding energy release. A BLEVE of flammable ma-terial is often accompanied by a large aerosol fireball, since an external fire impinging on the vapor space of a pressure vessel is a common cause. However, it is not necessary for the liquid to be flam-mable to have a BLEVE occur.
Dust Explosion – an explosion resulting from rapid combustion of fine solid particles.
Potential Explosion Site (PES) - A volume within a plant with sufficient congestion and/or confine-ment that a flammable vapor cloud ignited there could likely develop into an explosion.
Damage and Blast Overpressure
The maximum pressure resulting from blast or shock wave is the Peak Overpressure which is correlated to damage.

Impact Assessment CHEF Manual
- 113 -
Table 10.1 Blast Overpressure vs Damage
Overpressure is the pressure caused by a blast wave over and above normal atmospheric pressure. The duration of the blast wave is the Impulse. Simple damage models are based on correlation of damage to peak overpressure assuming a relatively long duration impulse.
Physical Explosion Using Simple TNT Model
The TNT equivalency model has been used for many years and is based on an assumption of “equivalence” between flammable materials and TNT. This simple model may be used for estimating damage distance for equipment rupture or sudden release of stored chemical energy. Stored pressure-volume energy may be estimated as the energy of expansion of an ideal gas by7:
QPV = V* PB [ ln (PB/PA) + (PA/PB) – 1 ] (59)
V* = VV + VL f ( L / V ) (60)
where: V* is the vapor volume in the vessel plus the volume (at the pressure inside the vessel) of vapor generated
from instantaneous vaporization (m3) VV is the initial vapor volume (m3) VL is the initial liquid volume (m3) f is the fraction liquid vaporized
L / V ls the ratio of liquid to vapor density at the initial pressure and temperature (before burst) QPV = explosion energy (kJoule) PA, PB = atmospheric and burst pressure (kPa) respectively.
Note that the vapor generated from instantaneous vaporization is based on a maximum initial tempera-ture less than the superheat critical limit (roughly 90% of the critical temperature)
The TNT equivalent, kgTNTeq, is the explosion energy divided by 4600 kJoule per kgTNTeq.
The TNT model is an empirical correlation of Scaled Pressure versus Scaled Distance. Scaled pressure is merely blast overpressure divided by atmospheric pressure. Scaled Distance, Z, is distance from the vessel or equipment divided by TNT equivalent raised to the 1/3 power2.
Overpressure
(PSI)
0.3
0.5
1
2
5
10
15
30
Damage per NFPA-921
“Safe distance” (95% probability of no serious damage)
Shattering of glass windows
Partial demolition of houses
Partial collapse of walls and roofs of houses
Wooden utility poles snapped/Flying glass serious injury
Total destruction of buildings/Heavy machine damage
Severe Injury/some fatalities (eardrum rupture/lung damage)
Near 100% Fatality from direct blast effects

Impact Assessment CHEF Manual
- 114 -
Figure 10.1 Scaled Overpressure vs Scaled Distance – TNT Model
For pressure vessels (design of greater than 1 atmosphere gauge), failure is assumed to occur between 2 and 4 times the design pressure. For screening evaluation, 100% of the energy at the minimum failure pressure is assumed for the blast wave (ignoring the portion energy that may be consumed by the equipment failure). Explosion distance to a specific Scaled Overpressure is estimated from Scaled Distance on the above TNT Model graph.
TNT Model Example
Estimate the distance to 1 psi overpressure for rupture of a vapor filled 10 m3 (2640 gal) vessel at 1000 kPa (145 psia).
QPV = V PB [ ln (PB/PA) + (PA/PB) – 1 ]
= 10 (1000) [ ln (1000/101.3) + 101.3/1000 – 1] = 1.39 x 10⁴ kJoule
kgTNTeq = 1.39 X 10⁴ / 4600 = 3.0 kg
From the TNT graph at 1 psi overpressure, Scaled Distance, Z = 18 = X / 3.01/3
X = 18 (3.01/3) = 26 m
Baker-Strehlow-Tang Explosion Model
Blast modeling for flammable vapor or dust explosion is based on rapid combustion. Correlation of Blast Overpressure for combustion related explosions requires a more complex model than the simple TNT Model.
0.01
0.1
1
10
100
1000
0.01 0.1 1 10 100
Sca
led
Ove
rpre
ssu
re,
PS
= P
0/
P a
Scaled Distance, Z = X / KgTNT1/3
TNT Modelfor Sperical Explosion at Sea Level
1 psi overpressure
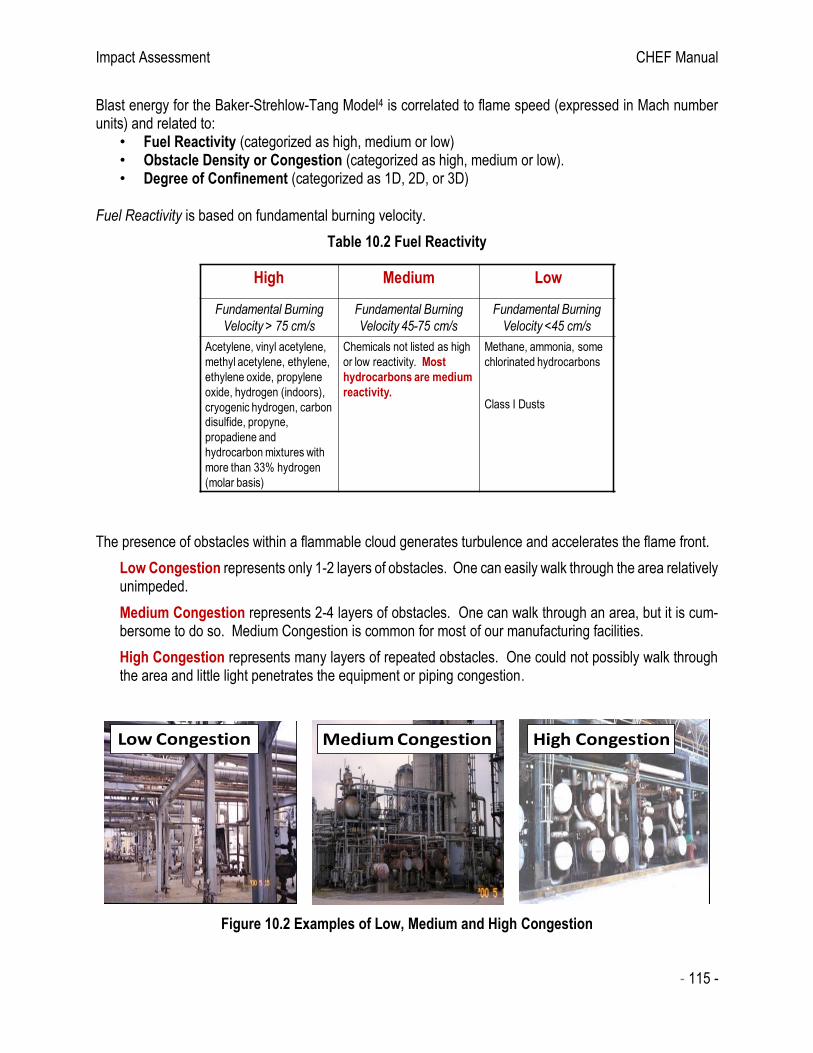
Impact Assessment CHEF Manual
- 115 -
Blast energy for the Baker-Strehlow-Tang Model4 is correlated to flame speed (expressed in Mach number units) and related to:
• Fuel Reactivity (categorized as high, medium or low) • Obstacle Density or Congestion (categorized as high, medium or low). • Degree of Confinement (categorized as 1D, 2D, or 3D)
Fuel Reactivity is based on fundamental burning velocity.
Table 10.2 Fuel Reactivity
The presence of obstacles within a flammable cloud generates turbulence and accelerates the flame front.
Low Congestion represents only 1-2 layers of obstacles. One can easily walk through the area relatively unimpeded.
Medium Congestion represents 2-4 layers of obstacles. One can walk through an area, but it is cum-bersome to do so. Medium Congestion is common for most of our manufacturing facilities.
High Congestion represents many layers of repeated obstacles. One could not possibly walk through the area and little light penetrates the equipment or piping congestion.
Figure 10.2 Examples of Low, Medium and High Congestion
High Medium Low
Fundamental Burning
Velocity > 75 cm/s
Fundamental Burning
Velocity 45-75 cm/s
Fundamental Burning
Velocity <45 cm/s
Acetylene, vinyl acetylene,
methyl acetylene, ethylene,
ethylene oxide, propylene
oxide, hydrogen (indoors),
cryogenic hydrogen, carbon disulfide, propyne,
propadiene and
hydrocarbon mixtures with
more than 33% hydrogen
(molar basis)
Chemicals not listed as high
or low reactivity. Most
hydrocarbons are medium
reactivity.
Methane, ammonia, some
chlorinated hydrocarbons
Class I Dusts
Low Congestion Medium Congestion High Congestion

Impact Assessment CHEF Manual
- 116 -
Degree of Confinement is the presence of surfaces that prevent flame propagation in any one or more of three directions.
3D Confinement indicates the flame front is free to expand in any direction.
2D Confinement indicates the flame front is free to expand in only two of three directions such as the space beneath platforms, between closely spaced vessels, or between closely spaced cars in a parking lot.
1D Confinement indicates the flame front is free to expand in only one direction such as within a tunnel.
Figure 10.3 Examples of 1D, 2D, and 3D Confinement
Although many combinations of Fuel Reactivity, Obstacle Density or Congestion, and Degree of Confinement are possible, only the 3-5 most common Flame Speed Mach Numbers are used for simple screening.
Table 10.3 BST Mach Number at Common Congestion and Fuel Reactivity Combination
Fuel Reactivity Obstacle Density or Congestion
Low Medium High
High 0.5 >1 >1
Low-Medium 0.35 0.5 1
Class I Dust 0.35 0.5
Above based on 2.5 D Confinement. 1D Confinement addressed as Mach >1 as transition to detonation is assumed to occur. Note that detonation is also assumed to occur for High Fuel Reactivity and Medium or High Obstacle Density (or congestion).
3D Confinement 2D Confinement 1D Confinement
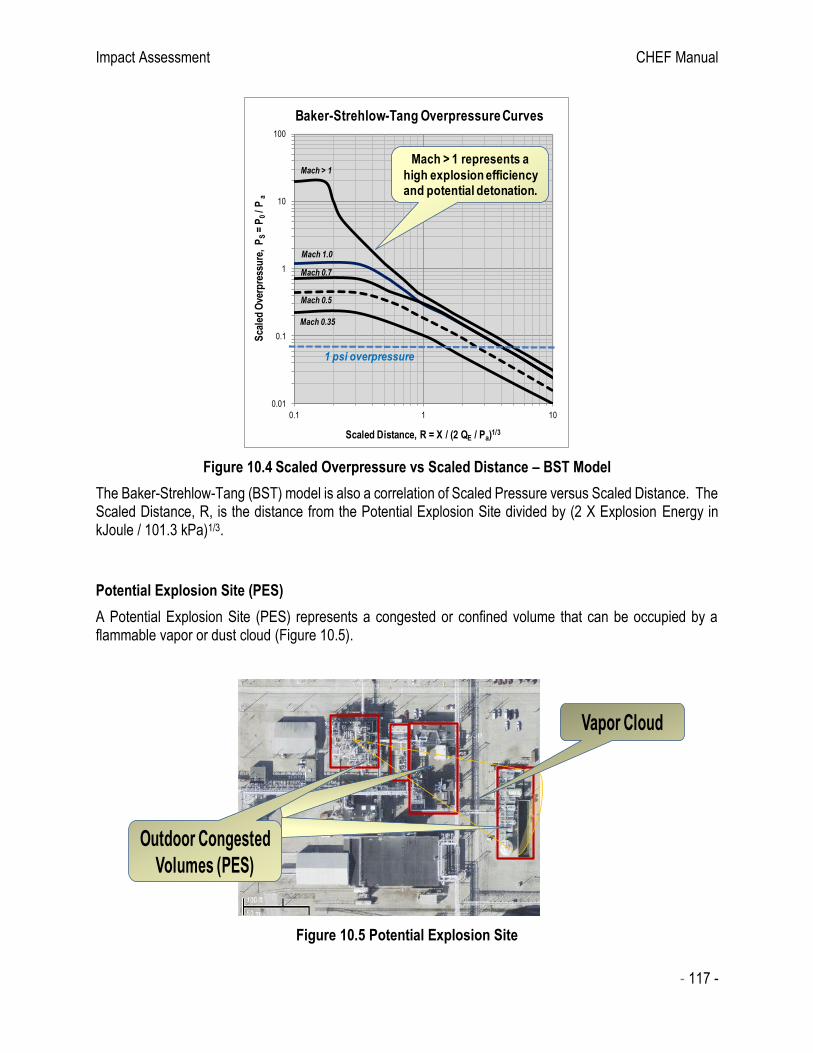
Impact Assessment CHEF Manual
- 117 -
Figure 10.4 Scaled Overpressure vs Scaled Distance – BST Model
The Baker-Strehlow-Tang (BST) model is also a correlation of Scaled Pressure versus Scaled Distance. The Scaled Distance, R, is the distance from the Potential Explosion Site divided by (2 X Explosion Energy in kJoule / 101.3 kPa)1/3.
Potential Explosion Site (PES)
A Potential Explosion Site (PES) represents a congested or confined volume that can be occupied by a flammable vapor or dust cloud (Figure 10.5).
Figure 10.5 Potential Explosion Site
0.01
0.1
1
10
100
0.1 1 10
Sca
led
Ove
rpre
ssu
re,
PS
= P
0/
P a
Scaled Distance, R = X / (2 QE / Pa)1/3
Baker-Strehlow-Tang Overpressure Curves
Mach > 1
Mach 1.0
Mach 0.7
Mach 0.35
Mach 0.5
1 psi overpressure
Mach > 1 represents a
high explosion efficiency and potential detonation.
Vapor Cloud
Outdoor Congested
Volumes (PES)
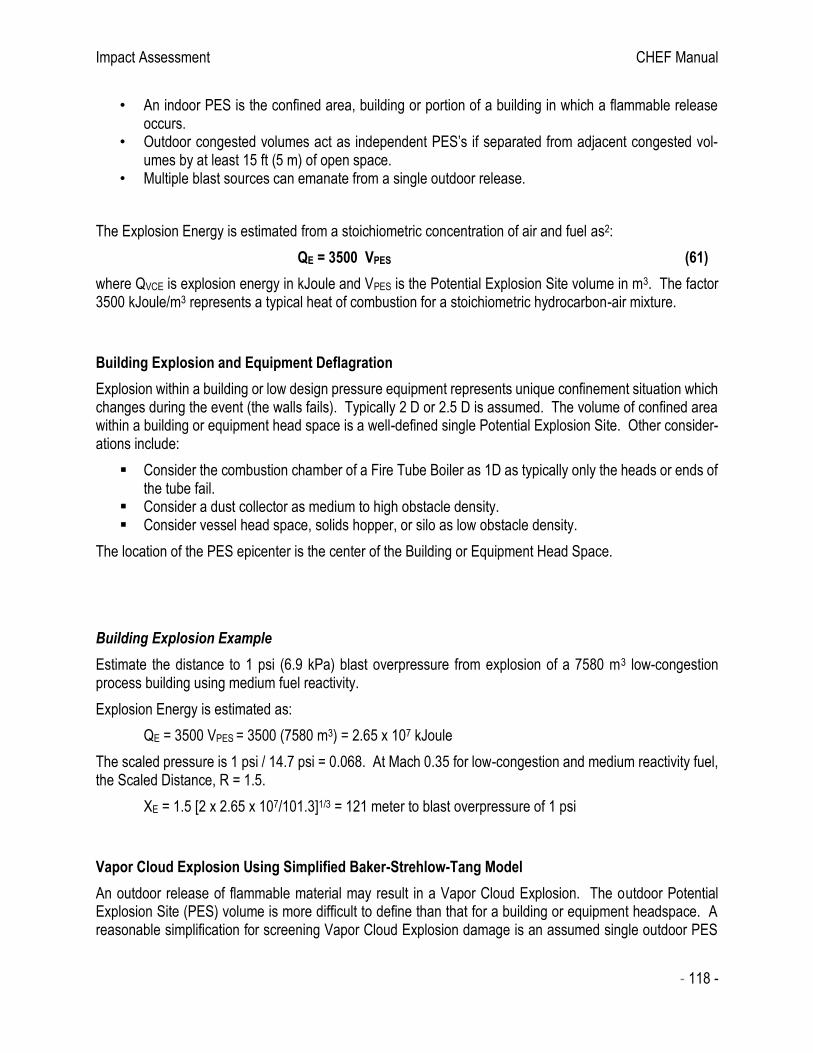
Impact Assessment CHEF Manual
- 118 -
• An indoor PES is the confined area, building or portion of a building in which a flammable release occurs.
• Outdoor congested volumes act as independent PES’s if separated from adjacent congested vol-umes by at least 15 ft (5 m) of open space.
• Multiple blast sources can emanate from a single outdoor release.
The Explosion Energy is estimated from a stoichiometric concentration of air and fuel as2:
QE = 3500 VPES (61)
where QVCE is explosion energy in kJoule and VPES is the Potential Explosion Site volume in m3. The factor 3500 kJoule/m3 represents a typical heat of combustion for a stoichiometric hydrocarbon-air mixture.
Building Explosion and Equipment Deflagration
Explosion within a building or low design pressure equipment represents unique confinement situation which changes during the event (the walls fails). Typically 2 D or 2.5 D is assumed. The volume of confined area within a building or equipment head space is a well-defined single Potential Explosion Site. Other consider-ations include:
▪ Consider the combustion chamber of a Fire Tube Boiler as 1D as typically only the heads or ends of the tube fail.
▪ Consider a dust collector as medium to high obstacle density. ▪ Consider vessel head space, solids hopper, or silo as low obstacle density.
The location of the PES epicenter is the center of the Building or Equipment Head Space.
Building Explosion Example
Estimate the distance to 1 psi (6.9 kPa) blast overpressure from explosion of a 7580 m3 low-congestion process building using medium fuel reactivity.
Explosion Energy is estimated as:
QE = 3500 VPES = 3500 (7580 m3) = 2.65 x 10⁷ kJoule
The scaled pressure is 1 psi / 14.7 psi = 0.068. At Mach 0.35 for low-congestion and medium reactivity fuel, the Scaled Distance, R = 1.5.
XE = 1.5 [2 x 2.65 x 107/101.3]1/3 = 121 meter to blast overpressure of 1 psi
Vapor Cloud Explosion Using Simplified Baker-Strehlow-Tang Model
An outdoor release of flammable material may result in a Vapor Cloud Explosion. The outdoor Potential Explosion Site (PES) volume is more difficult to define than that for a building or equipment headspace. A reasonable simplification for screening Vapor Cloud Explosion damage is an assumed single outdoor PES
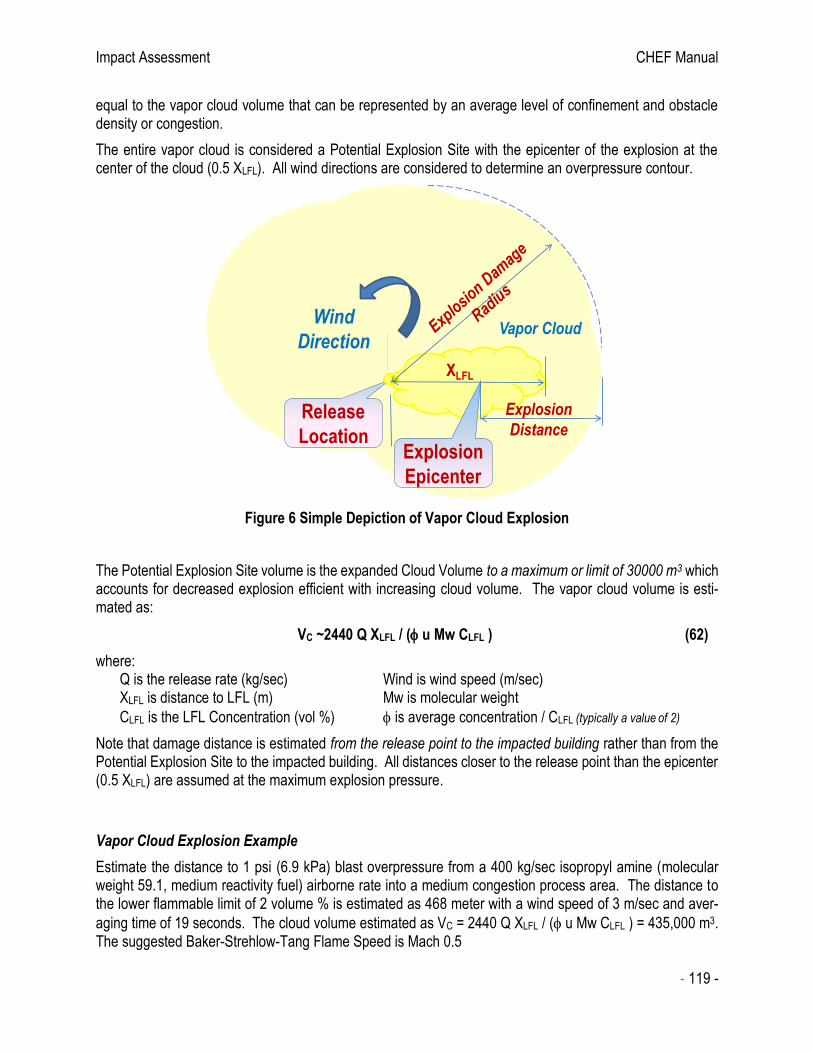
Impact Assessment CHEF Manual
- 119 -
equal to the vapor cloud volume that can be represented by an average level of confinement and obstacle density or congestion.
The entire vapor cloud is considered a Potential Explosion Site with the epicenter of the explosion at the center of the cloud (0.5 XLFL). All wind directions are considered to determine an overpressure contour.
Figure 6 Simple Depiction of Vapor Cloud Explosion
The Potential Explosion Site volume is the expanded Cloud Volume to a maximum or limit of 30000 m3 which accounts for decreased explosion efficient with increasing cloud volume. The vapor cloud volume is esti-mated as:
VC ~2440 Q XLFL / ( u Mw CLFL ) (62)
where: Q is the release rate (kg/sec) Wind is wind speed (m/sec) XLFL is distance to LFL (m) Mw is molecular weight
CLFL is the LFL Concentration (vol %) is average concentration / CLFL (typically a value of 2)
Note that damage distance is estimated from the release point to the impacted building rather than from the Potential Explosion Site to the impacted building. All distances closer to the release point than the epicenter (0.5 XLFL) are assumed at the maximum explosion pressure.
Vapor Cloud Explosion Example
Estimate the distance to 1 psi (6.9 kPa) blast overpressure from a 400 kg/sec isopropyl amine (molecular weight 59.1, medium reactivity fuel) airborne rate into a medium congestion process area. The distance to the lower flammable limit of 2 volume % is estimated as 468 meter with a wind speed of 3 m/sec and aver-
aging time of 19 seconds. The cloud volume estimated as VC = 2440 Q XLFL / ( u Mw CLFL ) = 435,000 m3. The suggested Baker-Strehlow-Tang Flame Speed is Mach 0.5
Release
Location
Wind
Direction
Explosion
Distance
XLFL
Vapor Cloud
Explosion
Epicenter

Impact Assessment CHEF Manual
- 120 -
The PES volume is estimated as VC limited to a maximum of 30000 m3.
The explosion energy is roughly:
QE = 3500 VC = 3500 (30000 m3) = 1.05 x 10⁸ kJoule
The scaled pressure is 1 psi / 14.7 psi = 0.068 where the Scaled Distance, R = 2.5 at Mach 0.5.
XE = R [2 QE / 101.3]1/3 = 2.5 (2 x 1.05 x 108 / 101.3)1/3 = 319 m
The epicenter is assumed at 0.5 XLFL or 234 m such that the total distance is 319 + 234 or 553 meter from the release point.
Class Exercise
Estimate the distance to 1 psi (6.9 kPa) blast overpressure from a 15 kg/sec butadiene (molecular weight 54.1 and medium reactivity fuel) leak into a low congestion outdoor process area. Use a lower flammable limit of 2 volume % and wind speed of 3 m/sec. The distance to the lower flammable limit from dispersion modeling at an averaging time of 19 seconds is estimated as 91 meter.
______________________________________
Share your estimate and any simplifying assumptions used.
Limitations of Simple Explosion Models
Simple models do not account for blast impulse and are treated as high impulse/long duration events. Results of these simple models may underestimate distance to overpressure greater than 3 to 5 psi and should not be used to estimate damage to blast resistant buildings. In addition:
• Vapor Cloud Explosion overpressure contours may be conservative as they are estimated as circular which does not account for regions within the LFL cloud that does not contain congested or confined areas (Potential Explosion Sites).
• The overpressure contour may be underestimated if there is a region of higher than average con-gestion near the furthest distance of the LFL cloud.
Physical Explosion and Confined Explosion 1 psi overpressure contours match closely with more advanced models as these are nearly “point sources”. Distance to higher overpressure may be underestimated with these simple models.

- 121 -

Layer of Protection Analysis CHEF Manual
- 122 -
11. IMPACT ASSESSMENT
Source models generate a variety of feasible Incident Outcomes that are caused by release of hazardous material or energy. The next step in the Overall Work Process is selection of a specific Outcome and as-sessment of Consequences. In assessing effects on people, consequences may be expressed as number of serious injuries or potential fatalities. In assessing physical damage, consequences may be expressed as business loss. Environmental effects may be more complex to quantify.
It must be noted that estimating the number of people impacted for a scenario is extremely inaccurate. Often consequence severity is predicted significantly higher or significantly less than actual historical inci-dents. It is the intent of this manual to provide estimates primarily for consistency among Hazard Identification and Risk Analysis studies and for comparison.
Module Objectives
In this module you will learn:
• Be able to select applicable Incident Outcome for a scenario.
• Estimation of an Effect Zone and number of people impacted for on-site toxic, flammable, and ex-plosion scenarios.
• Screening Criteria for Levels of Concern associated with the various Outcome.
• Estimation of an Effect Zone for Thermal Radiation or Fireball exposure.
• Estimation of toxic or explosion vulnerability within Occupied Buildings.
• Be able to estimate the number of people potential impacted for a simple scenario case:
Incident Outcome
Flash Fire is the non-explosive combustion of a vapor cloud in air. The primary hazards associated with flash fires are thermal burns and direct flame contact.
Building Explosion is feasible if the indoor chemical concentration exceeds its lower flammability limit. Building explosion for a combustible dust is feasible if the particle size is less than 420 mm and a concentra-tion greater than 0.3 gram per cubic meter can be achieved from a fluidized release or dispersion of accu-mulated dust from floors, beams and rafters. Relatively small quantities of fuel are generally involved in building explosions and projectiles represent the major threats.
What are the Hazards?
What can go Wrong?
How Bad could it Be?
How Oftenmight it
Happen?
Is the Risk Tolerable?
Identify Chemical
and ProcessHazards
Estimate Frequency
Analyze Consequences
AnalyzeRisk
IdentifyAdditional Safeguards as Needed
DevelopScenarios
Identify Equipment
or Activity to be Analyzed
Manage Barriers
for Life Cycle of Facility
Hazard Identification and Risk Analysis

Layer of Protection Analysis CHEF Manual
- 123 -
Vapor Cloud Explosion requires that a flammable cloud of sufficient size be formed prior to ignition and sufficient confinement or turbulent mixing must be present. Buildings located at a distance corresponding to less than 6.9 kPa (1 psi) overpressure would not be expected to sustain damage sufficient for occupants to be severely injured. (Low strength or portable buildings may be an exception and sustain significant damage at this overpressure).
Physical Explosion and BLEVE can produce a shock wave and/or eject equipment fragments from the sudden release of pressure-volume energy. Burst pressure of 1.1 times design pressure for low pressure tanks to 3 times design pressure for carbon steel pressure vessels may be appropriate for screening pur-poses to account for variability in design codes.
Toxic Release effects are based on short duration rather than chronic inhalation exposure. Off-site repre-sents a distance beyond the property line and includes areas normally populated by members of the public. On-site personnel may tolerate exposure to higher concentrations without serious effect as this group would not include the most susceptible people (elderly, infants, those with cardio-vascular illness, etc.) and be well trained in emergency response.
Generalized Outcome Event Tree
A single loss event may have several outcomes. A release of flammable material may result in a jet or flash fire, an outdoor vapor cloud explosion, or a non-ignited vapor cloud. A release of toxic material may result in an indoor toxic environment for those in an occupied building or an outdoor toxic impact. A sudden release of pressure-volume energy (such as from an equipment rupture) may result in a physical explosion.
Property Damage or Business Loss
Vapor, Liquid Mist,or Suspended Dust
Liquid
Flash Fraction, Aerosol and Pool
Evaporation
NotIgnited
Ignited
NotIgnited
Early Ignition
Vapor Cloud Explosion
Dermal Toxic, Hot, or Corrosive
Aquatic or Ingestion Toxic
Outdoors
NotIgnited
Outdoor Flash or Jet Fire
Outdoor Toxic Vapor Cloud
Indoor Toxic Release
Building Explosion
Indoors
Pool Fire
Chemical Exposure
Environmental Damage
BLEVE or Fireball
Loss of Containment
(Release of Hazardous Material or Material in Hazardous Service)
Equipment Rupture Physical
Explosion
Equipment Damage
Ph
ysic
al S
tate
Lo
cati
on
Excessive Heat with
Vapor Venting
NotIgnited
LateIgnition
NotIgnited
Early Ignition
Release of Energy(Excessive Pressure, Reaction, or Internal
Deflagration)
Peak Pressure >2 MAWP(ASME)
LateIgnition
Indoor Flash or Jet Fire
Loss Events
Outcome
Ignited
NotIgnited
Gas
ket
Fai
lure
Head Space Deflagration
Layer of Protection Analysis CHEF Manual
- 124 -
Figure 11.1 Generalized Outcome Event Tree
Incident Outcome Selection Criteria
Following determination of Release Rate and Airborne Quantity, models are used to determine downwind concentrations and overpressure versus distance for explosions. Various Outcome screening criteria are used to determine which are feasible.
• Flash (or Jet) Fire: the distance of a flammable cloud to a multiple of LFL concentration exceeds a de minimis value.
• Vapor Cloud Explosion: Greater than 1000 kg flammable (100 kg for high flame speed) released within 5 minutes.
• Building Explosion: Indoor average concentration exceeds a multiple of LFL concentration
• Physical Explosion: Blast Overpressure exceeds a Threshold Distance
• Toxic Vapor Release (Indoor, Outdoor) o Off-site exposure to > ERPG-2 concentration o On-site exposure to > LC-50 concentration o On-site exposure to > ERPG-3 concentration within an occupied building
On-Site Consequence Severity
A simple Impact Analysis is based on Hazards originating from a point source such that the effect zone is estimated in terms of radial distance from the source2. Personnel within the effect zone are assumed severely impacted while those outside of this area are assumed not affected.
Using a simple point source method is a simplification necessary to evaluate common consequences of an outdoor “on-site” incident. A more detailed analysis would look at many other variables such as wind direction, wind speed, weather, release impingement, terrain, etc. for each incident. In addition, a lethality for personnel at multiple locations would be summed versus simplification to zero and 100 % lethality regions.
An effect zone (or impact area) may be estimated in terms of radial distance from the source. The conse-quence within a particular impact area is assumed constant (such as serious impact to personnel including fatality). Generally, the probability of the consequence is assumed unity for any location within the impact area and zero for any location outside the impact area. For scenarios such as explosion or thermal radiation, the impact area (or “footprint”) is estimated as a circle at typically ground level elevation. For flammable or toxic releases impacted by wind, the impact area is estimated as a circle segment.
For Outcome Affected by Wind Direction (Outdoor Toxic and Flammable Releases) – the Effect Zone is Conical Plume estimated as a Pie Shaped Segment at Ground Level.

Layer of Protection Analysis CHEF Manual
- 125 -
Figure 11.2 Example Outdoor Effect Zone
Impact Area = 0.25 radius2 (for Class D weather) (63)
For Outcome resulting from Release within an Enclosed Process Area (or Process Building) – the Effect Zone is estimated as the fraction of building above the severe impact concentration or:
Impact Area = VB2/3
Cindoor / LFL for flammable release (64)
Impact Area = VB2/3
Cindoor / LC-50 for toxic release (65)
Where VB is the volume of the Enclosed Process Area and CIndoor is the average indoor concentration.
Figure 11.3 Indoor Effect Zone
Wind
Cloud Plume
Release Point
Effect Zone (Probability of Severe Impact = 1)
Area ~ 0.25 r2
Probability of Severe Impact = 0

Layer of Protection Analysis CHEF Manual
- 126 -
For Explosions – the Impact Area (for Overpressure or Projectiles) a Hemispherical Effect Zone.
Figure 11.4 Projectile Effect Zone
Estimation of fragment effects may be important as significant personal injury and domino damage are attributable to fragments. Typically a small number of large fragments (between 2 and 10) are produced upon pressure vessel failure so the likelihood of being struck is very small.
De Minimis Consequence
If the hazard distance or impact area is extremely small, a potential fatality or severe injury is nearly impos-sible. The cross-sectional area of a toxic cloud less than a few meters distance to LC-50 concentration is so small that a person would not be able to take a few breaths while remaining within the cloud. The cross-sectional area of a flammable cloud less than a few meters distance to ½ LFL is so small that burns could not cover a sufficient fraction of body area to be a fatality or severe consequence. If the distance to 10 psi overpressure from a physical explosion (with no fragments) is less than one meter, a fatality or severe injury is not feasible.
Example Screening Criteria for Consequence Severity sufficient to warrant further Risk Analysis
• Flash (or Jet) Fire: personnel exposure to a flammable cloud greater than 3 m to ½ LFL concentration
• Direct Explosion Impacts: personnel exposure to blast wave of distance to 10 psi overpressure greater than 1 m (excluding projectiles or fragments).
• Building Damage: Blast overpressure greater than 1 psi at distance to occupied building for typical construction or greater than 0.5 psi at distance to occupied building for low strength construction
• Thermal Radiation: personnel exposure to fireball with distance to severe burns from thermal radiation greater than 3 m
• Toxic Vapor Release (Indoor, Outdoor): o Off-site personnel exposure to greater than ERPG-2 concentration o On-site personnel exposure to toxic cloud greater than 3 m to LC-50 concentration
Indoor personnel exposure to average concentration greater than ERPG-3
Impact Area = radius2

Layer of Protection Analysis CHEF Manual
- 127 -
Chemical Exposure Example Criteria
Exposure to dermal toxic chemicals, chemical corrosive to human tissue, or high/low temperature fluids may cause serious injury. A potential fatality is considered if the release quantity and rate are sufficient to expose greater than 25% of body area to:
• Liquids considered “toxic in contact with skin” • Liquids considered “corrosive” • Liquids hotter than 60 C or colder than -23 C • Vapors hotter than 93 C
Thermal Radiation Example Criteria
Thermal radiation from a BLEVE or fireball is a significant cause for damage or injury. The distance to a specific thermal radiation level may be estimated as2:
XThemRad = { 828 M0.771 / Er – 18.9 M2/3 }1/2 (66)
A hazard distance and related impact area for severe burns from a fireball or BLEVE may be approximated by2:
XThermal = 2.64 t0.379 M0.307 (67)
where M is the total flammable mass in the fireball (kg) and hazard distance, t is t is the fireball duration (sec) estimated as 0.45 M1/3 for M<30,000 kg or 2.6 M1/6 for M>30,000 kg. Er is radiation flux (Kw/m2), at distance, XThermal, in meter.
Figure 11.5 Radiation Fireball
A Boiling-Liquid Expanding-Vapor Explosion (BLEVE) may occur if a vessel containing liquid above its normal boiling point ruptures. This outcome is typically based on external fire heating the vessel contents and weakening the structural integrity. The sudden vaporization of a large fraction of the vessel contents, possibly followed by intense combustion or explosion of the vaporized cloud is a very high energy release event. In addition to damage from the resulting blast overpressure wave, thermal radiation from the fireball

Layer of Protection Analysis CHEF Manual
- 128 -
is a very significant cause for human injury. When estimating the number of people impacted, however, consideration of personnel who have taken shelter due to the fire prior to occurrence of the BLEVE may be appropriate.
Fireball distance resulting from a vented internal explosion or deflagration from flammable vapor may be estimated as14:
Fireball Distance = 3.1 Equipment Volume0.402 (68)
Fireball distance resulting from a vented internal explosion or deflagration from dust may be estimated as14:
Fireball Distance = 10 Equipment Volume1/3 (69)
Estimating Number of People Impacted for On-site Incident
Onsite Outdoor Population Density accounts for maintenance and other personnel who may occasionally be in a nearby outdoor process area. A typical value is 0.0002 people/m2 for a large, well-automated facility.
Personnel in the Immediate Vicinity include those associated with procedures requiring operator attendance such as unloading a tank truck, sampling, etc. in addition to personnel using nearby walkways, at a nearby elevated work area, etc. Personnel in the Immediate Vicinity are considered:
Estimating the On-site Probability of Exposure
When the Effect Zone is small such that the number of people impacted is less than 1, the value representing a “random” probability of a single severe impact or fatality.
Table 11.1 Probability of Exposure
Number Impacted Probability of Exposure
0.1 to 1 1
< 0.1 0.1
If Personnel are in the Immediate Area, then the Probability of Exposure may be based on Time at Risk or the fraction time the hazard exists that a person could be present. Time at Risk depends on the time window that the hazard exists. If the Initiating Event for the hazard scenario is caused by the operator or other person in the immediate area, than Time at Risk may be nearly 100% (a probability of 1).
Example Impact Assessment for Outdoor Release
Estimate the number of people impacted from an outdoor release of acrylonitrile. The distance to the LC-50 concentration is 100 meter. The distance to a multiple of LFL is 25 meter. Use an outdoor population density of 0.0002 people/m2 and no people in the immediate vicinity of the release. Assume 3 m/sec wind and Class D Atmospheric stability.
For a release impacted by wind direction, the effect zone is 0.25 X2 in m2.
Toxic Impact: 0.25 (100 m)2 (0.0002 people/m2) = 0.5 people rounded to 1

Layer of Protection Analysis CHEF Manual
- 129 -
Flammable Impact: 0.25 (25 m)2 (0.0002 people/m2) = 0.03 people
Considered as 0.1 probability of 1 person
Note that example assumes a random probability of people being sufficiently close to the release to be impacted. If personnel could be in the immediate area, they would be added to the total estimated in the example.
Also note that the average outdoor population density is 0.0002 people/m2. For a “typical” facility covering 20000 m2, this represents 4 people within the plant’s outdoor process area at any time. A higher population density should be used for locations where a higher number of personnel could be in the specific area near the release location.
Estimating Number of People Impacted within Occupied Buildings
A simple Effect Zone approach is not effective for Occupied Buildings as not all personnel within a building are typically impacted to the same extent. In these cases, the fraction of people impacted or “vulnerability” is estimated from inhalation of toxic chemicals or level of explosion damage. The estimated number of people seriously impacted is the maximum number of occupants times the estimated fraction vulnerability.
A one hour exposure is assumed for Building Occupants in estimated toxic impacts. For a release duration less than 1 hour, concentration will fall off once the release has stopped as fresh air is drawn into the building. For screening assessment, using an indoor dose of ½ the dose at the building ventilation inlet may be appropriate. The Probability of Severe Impact discussed in the Toxicity module - Multiple of ERPG-3 Concentration versus Vulnerability Models may be used to estimate the fraction of total Building Occupants impacted.
Figure 11.6 Toxic Vulnerability at One-Hour Explosure Duration
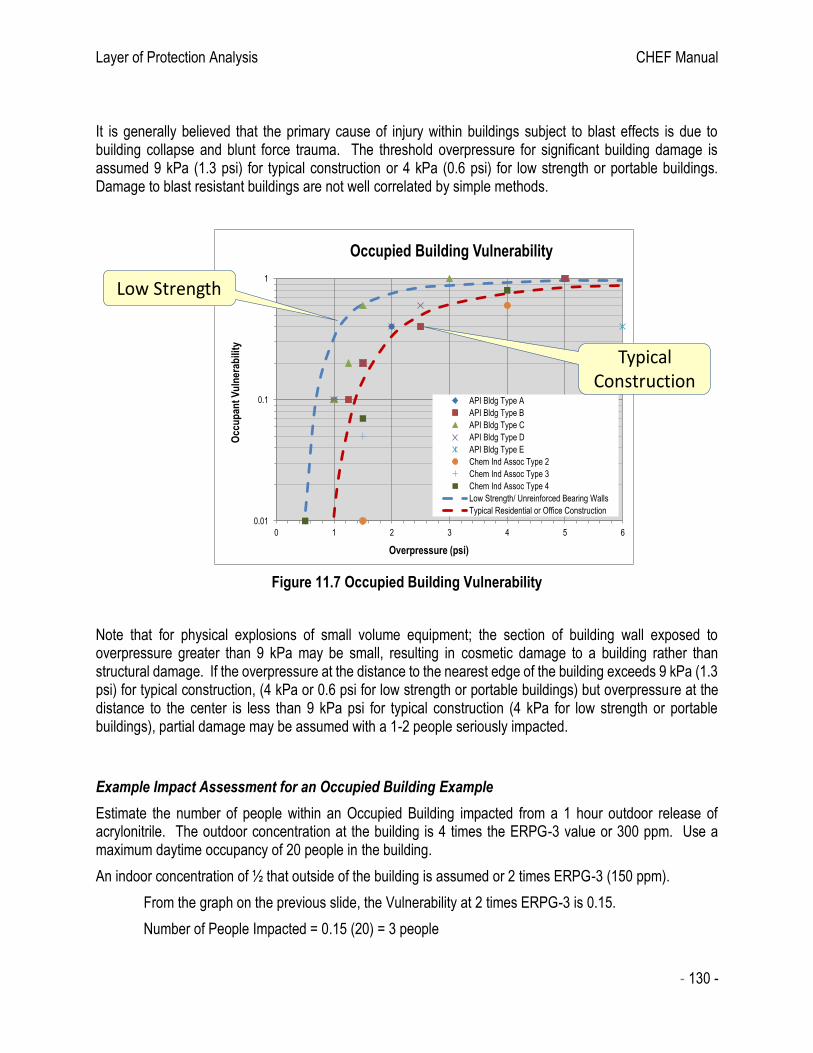
Layer of Protection Analysis CHEF Manual
- 130 -
It is generally believed that the primary cause of injury within buildings subject to blast effects is due to building collapse and blunt force trauma. The threshold overpressure for significant building damage is assumed 9 kPa (1.3 psi) for typical construction or 4 kPa (0.6 psi) for low strength or portable buildings. Damage to blast resistant buildings are not well correlated by simple methods.
Figure 11.7 Occupied Building Vulnerability
Note that for physical explosions of small volume equipment; the section of building wall exposed to overpressure greater than 9 kPa may be small, resulting in cosmetic damage to a building rather than structural damage. If the overpressure at the distance to the nearest edge of the building exceeds 9 kPa (1.3 psi) for typical construction, (4 kPa or 0.6 psi for low strength or portable buildings) but overpressure at the distance to the center is less than 9 kPa psi for typical construction (4 kPa for low strength or portable buildings), partial damage may be assumed with a 1-2 people seriously impacted.
Example Impact Assessment for an Occupied Building Example
Estimate the number of people within an Occupied Building impacted from a 1 hour outdoor release of acrylonitrile. The outdoor concentration at the building is 4 times the ERPG-3 value or 300 ppm. Use a maximum daytime occupancy of 20 people in the building.
An indoor concentration of ½ that outside of the building is assumed or 2 times ERPG-3 (150 ppm).
From the graph on the previous slide, the Vulnerability at 2 times ERPG-3 is 0.15.
Number of People Impacted = 0.15 (20) = 3 people
0.01
0.1
1
0 1 2 3 4 5 6
Oc
cu
pan
t V
uln
era
bil
ity
Overpressure (psi)
Occupied Building Vulnerability
API Bldg Type A
API Bldg Type B
API Bldg Type C
API Bldg Type D
API Bldg Type E
Chem Ind Assoc Type 2
Chem Ind Assoc Type 3
Chem Ind Assoc Type 4
Low Strength/ Unreinforced Bearing Walls
Typical Residential or Office Construction
Low Strength
Typical Construction
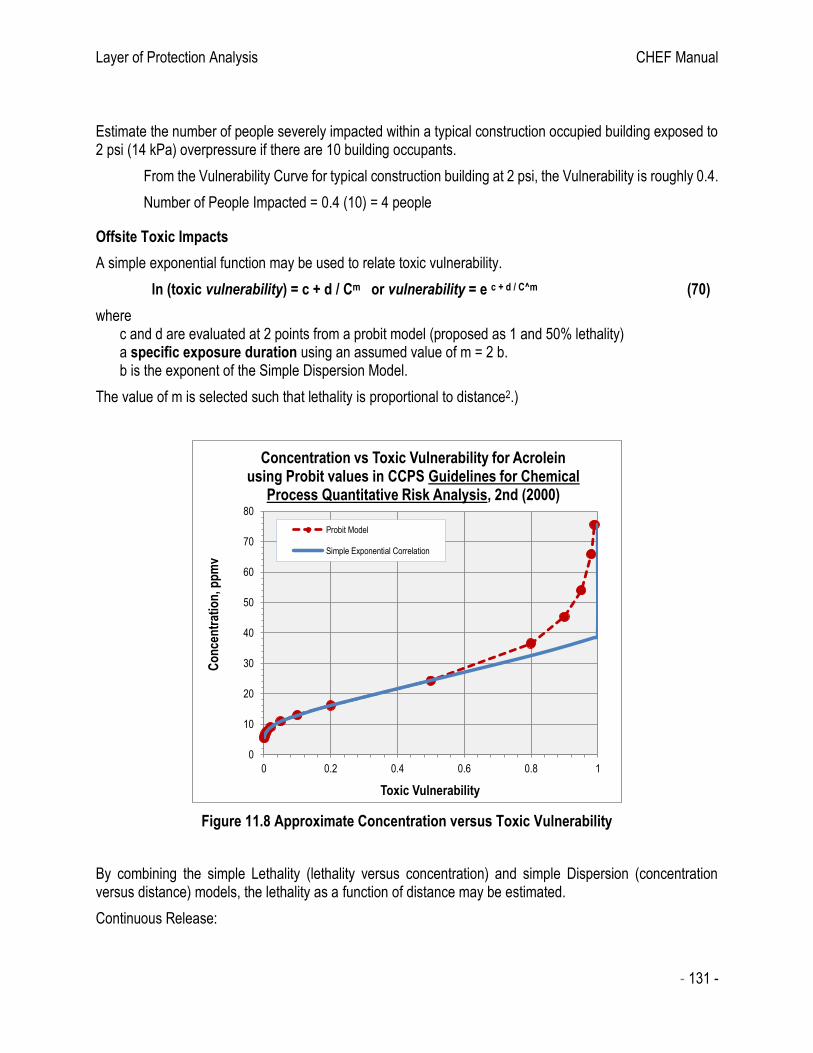
Layer of Protection Analysis CHEF Manual
- 131 -
Estimate the number of people severely impacted within a typical construction occupied building exposed to 2 psi (14 kPa) overpressure if there are 10 building occupants.
From the Vulnerability Curve for typical construction building at 2 psi, the Vulnerability is roughly 0.4.
Number of People Impacted = 0.4 (10) = 4 people
Offsite Toxic Impacts
A simple exponential function may be used to relate toxic vulnerability.
ln (toxic vulnerability) = c + d / Cm or vulnerability = e c + d / C^m (70)
where c and d are evaluated at 2 points from a probit model (proposed as 1 and 50% lethality) a specific exposure duration using an assumed value of m = 2 b. b is the exponent of the Simple Dispersion Model.
The value of m is selected such that lethality is proportional to distance2.)
Figure 11.8 Approximate Concentration versus Toxic Vulnerability
By combining the simple Lethality (lethality versus concentration) and simple Dispersion (concentration versus distance) models, the lethality as a function of distance may be estimated.
Continuous Release:
0
10
20
30
40
50
60
70
80
0 0.2 0.4 0.6 0.8 1
Co
nce
ntr
atio
n, p
pm
v
Toxic Vulnerability
Concentration vs Toxic Vulnerability for Acrolein using Probit values in CCPS Guidelines for Chemical
Process Quantitative Risk Analysis, 2nd (2000)
Probit Model
Simple Exponential Correlation

Layer of Protection Analysis CHEF Manual
- 132 -
ln (Lethality) = c + d / Cm where m = 2 b
Concentration, C = ( a / X )1/b Q / ( Mw u ) = a1/b [ Q / ( Mw u ) ] / X1/b
ln (Lethality) = c + d [ X2 {( Mw u ) / Q }2b / a2 ]
Lethality = ec+d [ X^2 {( Mw u ) / Q }^2b / a^2 ] (71)
Instantaneous Release:
ln (Lethality) = c + d / Cm where m = 2 b
Concentration, C = ( a / X )1/b ( Q* / Mw ) 1/(3 b) = [ a1/b ( Q* / Mw ) 1/(3 b) ] / X1/b
ln (Lethality) = c + d [ X2 ( Mw / Q* )2/3 / a2 ]
Lethality = ec+d [ X^2 ( Mw / Q* )^2/3 / a^2 ] (72)
where: C = concentration u = wind speed (distance/time) Mw = Molecular Weight X = downwind distance (including any correction for initial dilution) Q = release rate (mass/time) a, b, c, d, m = correlation coefficients Q* = release quantity (mass)
For a constant population density in the region of interest, PD, the number of people impacted are simply the integral of lethality times the change in impact area with distance times a constant population density. Since the Impact Area may be simply correlated by A = f X2, the change in impact area with distance, dA / d X = 2 f X dX.
Number Impacted = 2 PD f X0X X ec+d [ X^2 {(Mw u)/Q}^2b / a^2 ] dX
= PD f a2 {Q/(Mw u)}2b { ec+d [ X^2 {(Mw u)/Q}^2b / a^2 ] – ec+d [ X0^2 {(Mw u)/Q}^2b / a^2 ] } / d (73)
The lethality integral may also be written utilizing XRef as the distance to a concentration, Cref, by substituting:
[ Q / (Mw u) ]2b a2 = CRef2b XRef
2 for a continuous release
[ Q / (Mw u) ]2/3 a2 = CRef2b XRef
2 for an instantaneous release
Number Impacted = 2 PD f X0X X ec+d [ X^2 / (CRef^2b XRef^2 ) ] dX
= PD f CRef2b XRef
2 { ec+d [ X^2 / (CRef^2b XRef^2 ) ] – ec+d [ X0^2 / (CRef^2b XRef^2 ) ] } / d (74)
The factor corrects for average lethality at a distance to the lethality at the centerline concentration. Typical values would be 0.5 to 1.
Note that this integral applies in the region where lethality < 1. For lethality > 1, merely multiple population density times the Impact Area.
Personnel may be located outdoors or within buildings (or homes) and weather conditions may be different between day and night. The correlation for the number of people impacted may be repeated for people within
Layer of Protection Analysis CHEF Manual
- 133 -
buildings where the concentration may be a fraction of the outdoor concentration. In addition, the correlation for number of people impacted may be repeated for night weather conditions if different from day conditions of wind speed and atmospheric stability. The total estimate becomes the sum of fraction of time times the estimated number of people impacted for each condition.
Summary of Key Consequence Analysis Steps
The key steps in analysis of Consequences are:
• Estimate Airborne Quantity (per Airborne Quantity discussion) o Perform flash calculations, aerosol and pool evaporation
• Evaluate Hazard Distances (per Vapor Dispersions or Explosion discussion) o Distance (and Elevation) for Flash Fire o Distance (and Elevation) and Cloud Volume for Vapor Cloud Explosion o Distance for On-Site Toxic Impact o Distance for Direct Explosion Impact o Distance needed for Off-Site Toxic Impact o Concentration at Distance to Occupied Building for Toxic Infiltration o Overpressure at Distance to Occupied Building for Building Damage
• Estimate Impact Area for On-Site incident outcome. Personnel Impact determined from Area of Effect Zone and On-Site Outdoor Population Density (including personnel in immediate area)
• Estimate “Vulnerability” for Occupied Buildings. Personnel Impact determined from “vulnerability” times number of occupants.
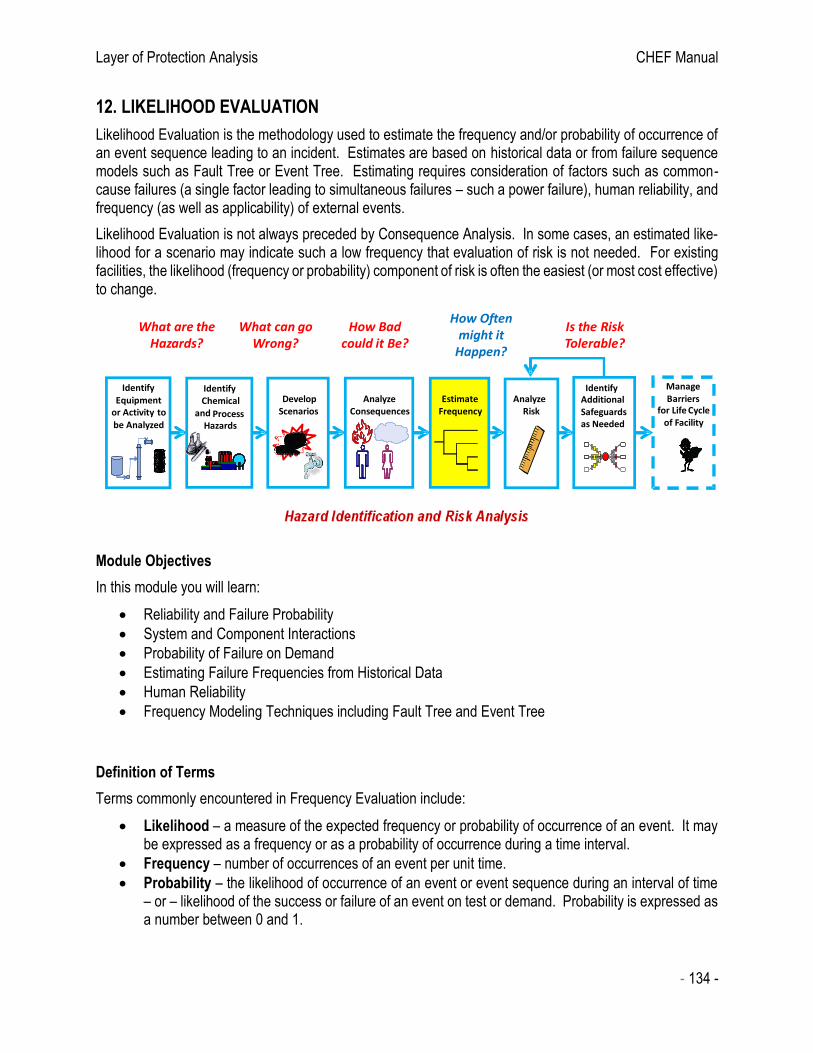
Layer of Protection Analysis CHEF Manual
- 134 -
12. LIKELIHOOD EVALUATION
Likelihood Evaluation is the methodology used to estimate the frequency and/or probability of occurrence of an event sequence leading to an incident. Estimates are based on historical data or from failure sequence models such as Fault Tree or Event Tree. Estimating requires consideration of factors such as common-cause failures (a single factor leading to simultaneous failures – such a power failure), human reliability, and frequency (as well as applicability) of external events.
Likelihood Evaluation is not always preceded by Consequence Analysis. In some cases, an estimated like-lihood for a scenario may indicate such a low frequency that evaluation of risk is not needed. For existing facilities, the likelihood (frequency or probability) component of risk is often the easiest (or most cost effective) to change.
Module Objectives
In this module you will learn:
• Reliability and Failure Probability
• System and Component Interactions
• Probability of Failure on Demand
• Estimating Failure Frequencies from Historical Data
• Human Reliability
• Frequency Modeling Techniques including Fault Tree and Event Tree
Definition of Terms
Terms commonly encountered in Frequency Evaluation include:
• Likelihood – a measure of the expected frequency or probability of occurrence of an event. It may be expressed as a frequency or as a probability of occurrence during a time interval.
• Frequency – number of occurrences of an event per unit time.
• Probability – the likelihood of occurrence of an event or event sequence during an interval of time – or – likelihood of the success or failure of an event on test or demand. Probability is expressed as a number between 0 and 1.
What are the Hazards?
What can go Wrong?
How Bad could it Be?
How Oftenmight it
Happen?
Is the Risk Tolerable?
Identify Chemical
and ProcessHazards
Estimate Frequency
Analyze Consequences
AnalyzeRisk
IdentifyAdditional Safeguards as Needed
DevelopScenarios
Identify Equipment
or Activity to be Analyzed
Manage Barriers
for Life Cycle of Facility

Layer of Protection Analysis CHEF Manual
- 135 -
• Reliability – the probability that an item is able to perform a required function for a stated period of time.
Failure Frequency
Many components exhibit a typical “bathtub” failure rate. The failure rate is highest when the component is new (infant mortality) and when it is old (old age (Figure 12.1). Between these two periods, the failure rate is reasonably constant for most components.
Figure 12.1 Failure Rate vs Time
Reliability and Failure Probability
Equipment failures in a process occur as a result of complex interactions of the individual components. The Probability that a particular hardware component will not fail during the time interval, t, for a constant failure
rate, , is estimated as7:
R(t) = e- t (75)
where R is reliability over the time interval
The Failure Probability over this time interval, P(t), assuming zero time for repair, is:
P(t) = 1 – R(t) = 1 – e- t (76)
The Mean Time Between Failures (MTBF) for constant failure rate is merely:
MTBF = 1 / (77)
The Mean Time to Repair (MTTR) is the mean time to restore a failed component or system to operation.:

Layer of Protection Analysis CHEF Manual
- 136 -
Interactions Between Hardware or System Components
Process components interact in two different fashions. In some cases a process failure requires the simulta-neous failure of a number of independent components in parallel. This parallel structure is represented by a logical "AND" function which means that the failure probabilities for the individual components must be mul-tiplied.
P = Pi = P1 P2 P3 …
Process components also interact in series. This means that a failure of any single component in the series of components will result in failure of the process. The logical OR function represents this case. For series components the overall failure probabilities is approximately the summation of failure probabilities for the individual components (which assumes an interaction probability - or both components in series fail – is small).
P = Pi = P1 + P2 + P3 …
A Common Cause Failure is a single event that affects a number of systems simultaneously and may signif-icantly increase overall failure probability. Common cause failures include events such as loss of utilities such as electricity or instrument air. These failure probabilities are typically addressed via OR logic within a summation of component failure probabilities. One needs to deliberately design systems to minimum com-mon cause failures.
Probability of Failure on Demand
Simple failure probability correlations assumed failures are immediately obvious and corrected in a negligible amount of time. For many components (particularly emergency interlocks), failure may not be obvious with-out regular and reliable testing.
For an unrevealed failure, the failure becomes obvious only upon regular inspection. For example: a flat tire on a car is immediately obvious to the driver (revealed failure). However, the spare tire may also be flat without the driver being aware until the spare is needed (unrevealed failure).
Figure 12.2 Changing a Tire
The Probability of Failure on Demand (PFD) for an unrevealed failure is based on the fraction of time that a system or component is unavailable and may be estimated as7:
PFDaverage for Unrevealed Failures = ½ (78)
where
= the inspection interval
= the average failure rate (or 1/ is the Mean Time Between Failures).
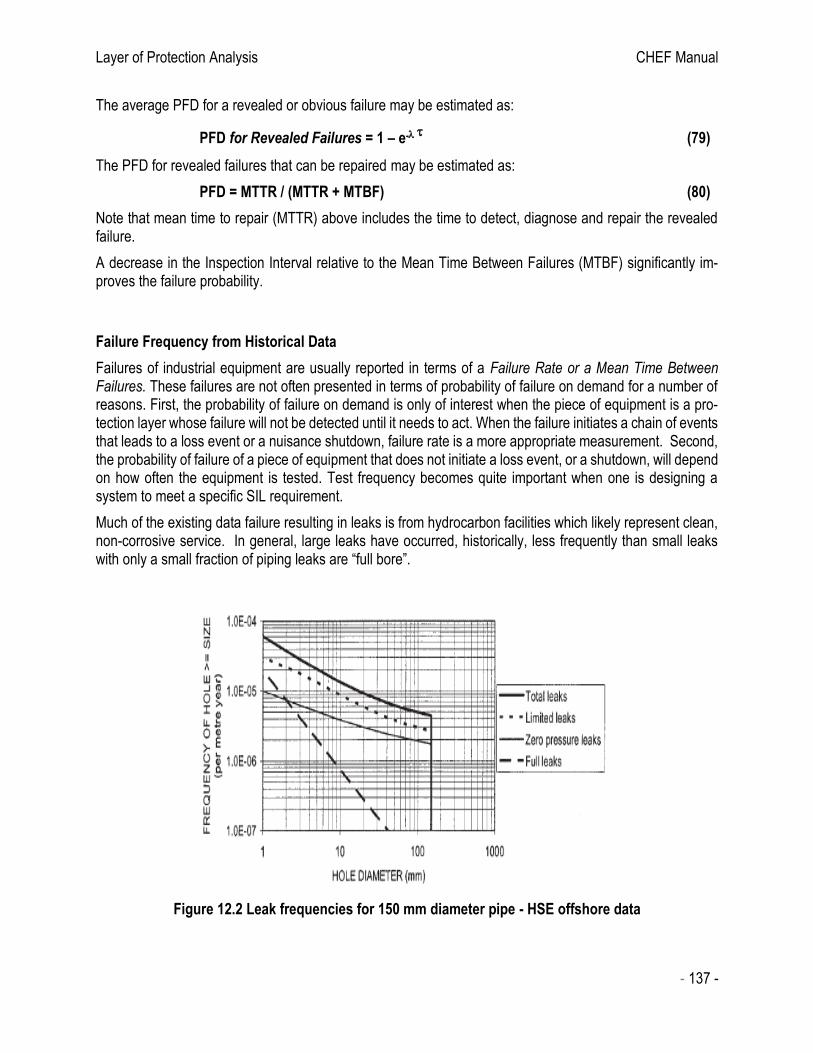
Layer of Protection Analysis CHEF Manual
- 137 -
The average PFD for a revealed or obvious failure may be estimated as:
PFD for Revealed Failures = 1 – e- (79)
The PFD for revealed failures that can be repaired may be estimated as:
PFD = MTTR / (MTTR + MTBF) (80)
Note that mean time to repair (MTTR) above includes the time to detect, diagnose and repair the revealed failure.
A decrease in the Inspection Interval relative to the Mean Time Between Failures (MTBF) significantly im-proves the failure probability.
Failure Frequency from Historical Data
Failures of industrial equipment are usually reported in terms of a Failure Rate or a Mean Time Between Failures. These failures are not often presented in terms of probability of failure on demand for a number of reasons. First, the probability of failure on demand is only of interest when the piece of equipment is a pro-tection layer whose failure will not be detected until it needs to act. When the failure initiates a chain of events that leads to a loss event or a nuisance shutdown, failure rate is a more appropriate measurement. Second, the probability of failure of a piece of equipment that does not initiate a loss event, or a shutdown, will depend on how often the equipment is tested. Test frequency becomes quite important when one is designing a system to meet a specific SIL requirement.
Much of the existing data failure resulting in leaks is from hydrocarbon facilities which likely represent clean, non-corrosive service. In general, large leaks have occurred, historically, less frequently than small leaks with only a small fraction of piping leaks are “full bore”.
Figure 12.2 Leak frequencies for 150 mm diameter pipe - HSE offshore data
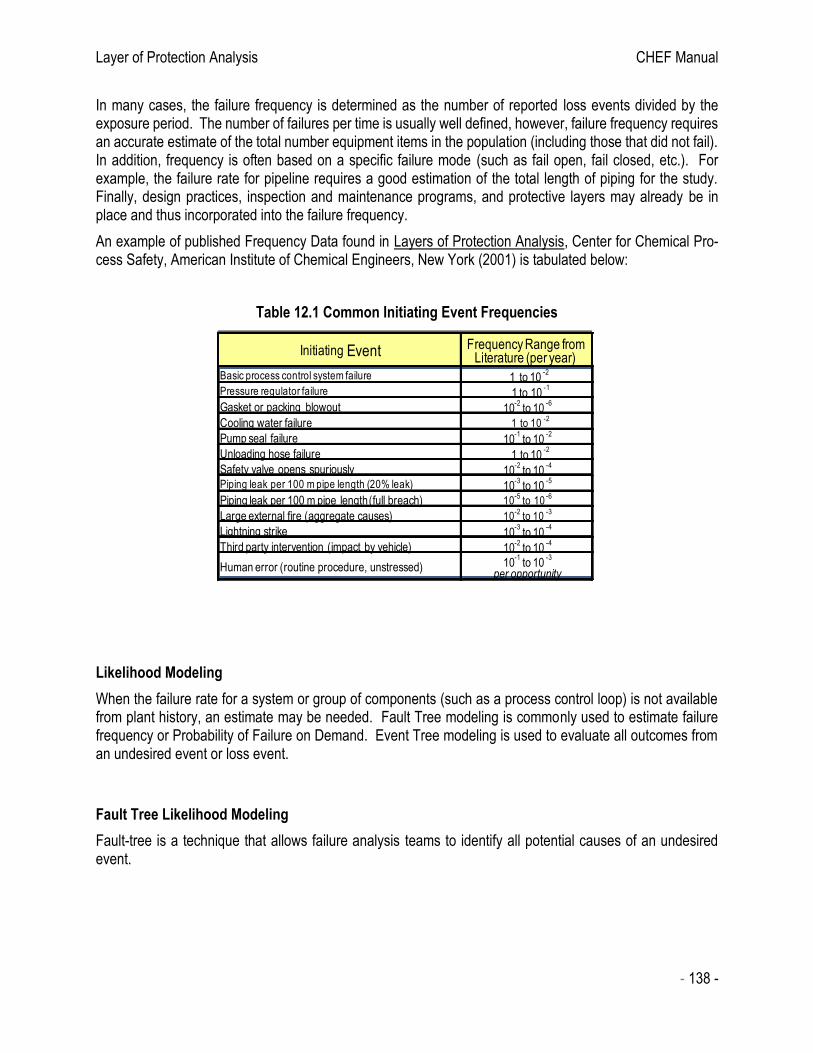
Layer of Protection Analysis CHEF Manual
- 138 -
In many cases, the failure frequency is determined as the number of reported loss events divided by the exposure period. The number of failures per time is usually well defined, however, failure frequency requires an accurate estimate of the total number equipment items in the population (including those that did not fail). In addition, frequency is often based on a specific failure mode (such as fail open, fail closed, etc.). For example, the failure rate for pipeline requires a good estimation of the total length of piping for the study. Finally, design practices, inspection and maintenance programs, and protective layers may already be in place and thus incorporated into the failure frequency.
An example of published Frequency Data found in Layers of Protection Analysis, Center for Chemical Pro-cess Safety, American Institute of Chemical Engineers, New York (2001) is tabulated below:
Table 12.1 Common Initiating Event Frequencies
Likelihood Modeling
When the failure rate for a system or group of components (such as a process control loop) is not available from plant history, an estimate may be needed. Fault Tree modeling is commonly used to estimate failure frequency or Probability of Failure on Demand. Event Tree modeling is used to evaluate all outcomes from an undesired event or loss event.
Fault Tree Likelihood Modeling
Fault-tree is a technique that allows failure analysis teams to identify all potential causes of an undesired event.
Initiating Event Frequency Range from Literature (per year)
Basic process control system failure 1 to 10-2
Pressure regulator failure 1 to 10-1
Gasket or packing blowout 10-2
to 10-6
Cooling water failure 1 to 10-2
Pump seal failure 10-1
to 10-2
Unloading hose failure 1 to 10-2
Safety valve opens spuriously 10-2
to 10-4
Piping leak per 100 m pipe length (20% leak) 10-3
to 10-5
Piping leak per 100 m pipe length (full breach) 10-5
to 10-6
Large external fire (aggregate causes) 10-2
to 10-3
Lightning strike 10-3
to 10-4
Third party intervention (impact by vehicle) 10-2
to 10-4
Human error (routine procedure, unstressed) 10-1
to 10-3
per opportunity

Layer of Protection Analysis CHEF Manual
- 139 -
• A Fault Tree model illustrates the combinations of failures causing one specific failure of interest, the Top Event.
• It is a deductive technique that uses Boolean logic (AND gates, OR gates, etc.) to break down the causes of the Top Event into basic equipment failures and human errors.
• Each of the intermediate causes is further examined for the basic causes of each intermediate event until the boundary of the analysis is reached.
The undesired event is the problem the failure analysis team is going to solve. When preparing a fault-tree analysis, the failure analysis team should, from a diagram of the process, mentally place themselves at the point where the failure manifested itself and ask, “What is in me or immediately adjacent to me that can induce this condition?” After answering this question, the events and conditions that can induce the failure are further developed, navigating through the system in a point-to-point manner. If any of the hypothesized causes of a command event could induce the condition, an OR gate should be used. If all of the hypothesized causes going into a command event are required, an AND gate should be used.
There are three categories of symbols used in Fault Tree Analysis: events, gates, and transfer symbols. Events are things that can happen and, either in isolation or in combination with other events, inducing an undesired or loss event. Gates show the relationship between events (if an event can induce an undesired condition by itself or if it must be combined with other events or conditions).
Advanced software is available to aid in performing Fault Tree Analysis.
Example Fault Tree Analysis
Consider a simple system failure analysis for failure of a porch light. The top undesired event in the fault tree is that the porch is dark.
The immediate causes of the “Porch is dark” are: loss of electrical supply, both porch bulbs burnt out, failure to turn on switch, and a fuse failure in the porch electric circuit. Wire failures and other causes are much less likely, so they are not included in the fault tree model.

Layer of Protection Analysis CHEF Manual
- 140 -
Figure 12.3 Example Fault Tree
The Fault Tree Models the logic that will capture the credible relevant ways the top event can occur. After identifying the immediate causes or events of the top event, the causes for each immediate event are then developed. This process continues until you reach the desired stopping point or basic event level.
Pool Fire Frequency Analysis using Simplified Fault Tree
There are typically many sources for leaks or spills that could ignite and cause a pool fire within the area (or nearby) where the equipment being analyzed is located. An estimate of the quantity of fuel present should be made to determine if heat up of vessel contents can occur in a reasonable time period. This time will be different for different vessel fill levels. For Reactive Cases, low Temperature of No Return (TNR) means a smaller, shorter fire could create a problem. Next, fire scenarios for nearby equipment based on the leak sources and ignition probabilities are performed. To determine the overall frequency, each source must be identified and its contribution to the overall frequency for pool fire estimated and summed to a total.
In a simple Fault Tree analysis, each leak scenario is analyzed as a series of “and” gates and the total frequency is merely the summation of all scenarios. As a simplification, common-cause failures are not included, so the final result for low frequency scenarios (less than 0.0001/year) may be overly optimistic and should utilize more advance Fault Tree software. Common-cause failures are a single event that may affect several branches in the Fault Tree. Examples of common-cause failure would include power loss disabling several electrical systems simultaneously or a maintenance error resulting in mis-calibration of multiple sen-sors.
Porch is dark
upon arriving home at night
Or
And
Power failsBoth bulbs
burnt outFuse fails
Bulb A burns
out
Bulb B burns
outFuse fails
blows out Power surge
Or
0.5/yr, 0.1 yr
repair time0.1/yr
F = 0.80/yr
0.5/yr0.15/yr
0.05/yr
0.05/yr
0.5/yr, 0.1 yr
repair time
Special Calc.
Fail to turn
on switch
0.1/yr
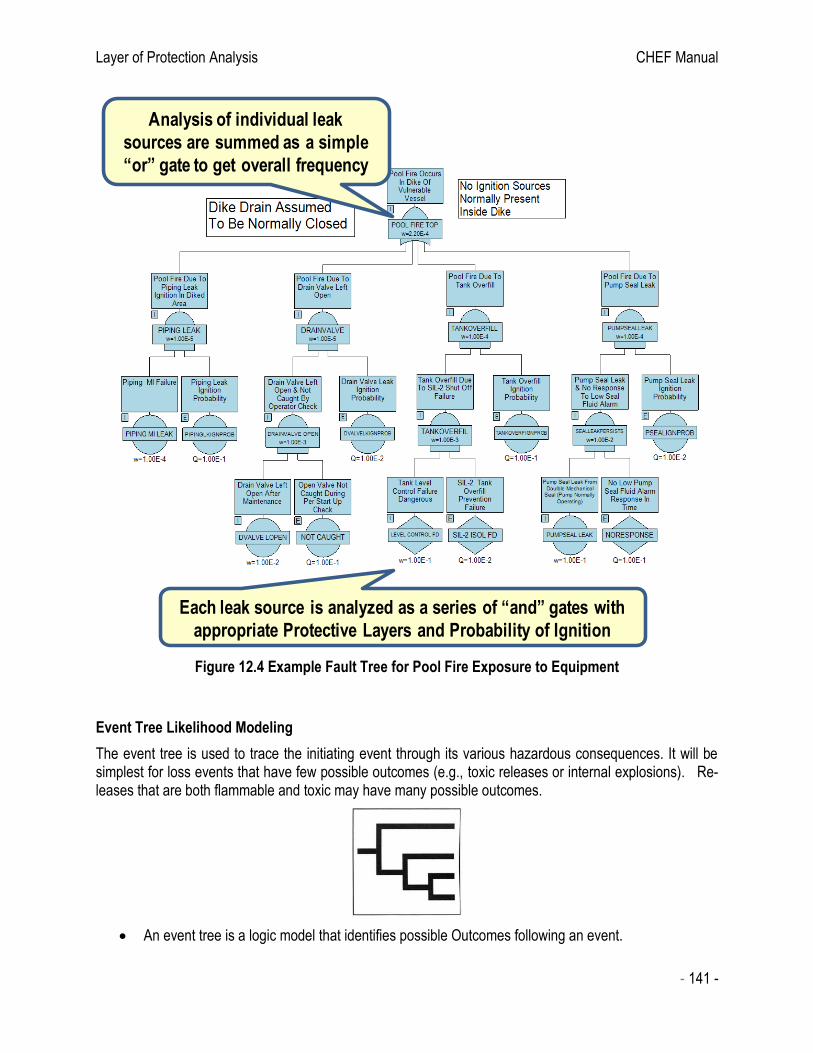
Layer of Protection Analysis CHEF Manual
- 141 -
Figure 12.4 Example Fault Tree for Pool Fire Exposure to Equipment
Event Tree Likelihood Modeling
The event tree is used to trace the initiating event through its various hazardous consequences. It will be simplest for loss events that have few possible outcomes (e.g., toxic releases or internal explosions). Re-leases that are both flammable and toxic may have many possible outcomes.
• An event tree is a logic model that identifies possible Outcomes following an event.
Each leak source is analyzed as a series of “and” gates with
appropriate Protective Layers and Probability of Ignition
Analysis of individual leak
sources are summed as a simple
“or” gate to get overall frequency

Layer of Protection Analysis CHEF Manual
- 142 -
• An event tree may also be used to evaluate the range of consequences possible (a post loss event application) where loss of containment has occurred.
• An event tree will have only one event that leads to many possible outcomes while a fault tree may have many initiating events that lead to the single top event.
The construction of an event tree is sequential and left-right in the usual convention. The construction begins with an event, and the temporal sequences of occurrence of all relevant safety functions or events are entered. Each branch of the event tree represents a separate outcome or event sequence.
Example Event Tree Analysis for Series of Protective Layers
One initiating event leads to many branches based on success/failure options of each Protective Layer. If any Protective function is successfully executed then the ultimate unsafe outcome will not occur (this time). The overall frequency of the undesired Consequence is estimated from the Initiating Event (or sometimes the “Top Event”) frequency times the Probability of Failure on Demand for each of the Protective Layers (assuming each is independent).
Figure 12.5 Example Event Tree

Layer of Protection Analysis CHEF Manual
- 143 -
13. LAYER OF PROTECTION ANALYSIS (LOPA)
Introduction
Layer of protection analysis is a simplified method of risk analysis that provides the middle ground between a qualitative process hazard analysis and a traditional, expensive quantitative risk analysis. The approach analyzes one incident scenario (cause-consequence pair) at a time, using simplifying rules to evaluate initi-ating event frequency, independent layers of protection failure probabilities, and consequence severity to provide an order-of-magnitude estimate of risk that may be compared to a company’s tolerable risk criteria. The primary purpose of LOPA is to determine if there are sufficient layers of protection against an incident scenario. LOPA can be useful in the process development, process design, operational, maintenance, mod-ification and decommissioning life cycle phases.
LOPA builds on qualitative hazard evaluations (such as HAZOP or scenarios gathered from any source, such as historical performance or incident investigation) for identification of scenarios. By analyzing selected sce-narios in detail, effective application of LOPA can determine whether the risk posed by each analyzed sce-nario has been reduced to be within a tolerable risk range. However, if the analyst or team can make a reasonable risk decision using only qualitative methods, then LOPA may not be warranted (see Section 7.2). Qualitative hazard evaluation methods (such as HAZOP) are intended to identify a comprehensive set of incident scenarios and qualitatively analyze those scenarios for the adequacy of safeguards using engineer-ing judgement. This approach is satisfactory for most scenarios. By contrast, LOPA might be used to analyze 10 to 30% of the incident scenarios, and Chemical Process Quantitative Risk Analysis (CPQRA) might be employed to study only 1% of the scenarios in detail. An exception to this is for a facility in a locality or country that requires a QRA.
LOPA assumes all events and protective layers are independent such that frequencies and probabilities are multiplied to obtain an overall frequency which is compared to a Tolerable Frequency to determine if sufficient protective layers are present. Order of magnitude categories for the Initiating Event frequency, Consequence Severity (tolerable frequency), and Probability of Failure on Demand for protective layers are typically used.
Module Objectives
In this module you will learn: • Steps in performing a Layers of Protection Analysis • LOPA Simplifying Assumptions • Criteria for Enabling Condition/Conditional Modifiers and Independent Protective Layers
What are the Hazards?
What can go Wrong?
How Bad could it Be?
How Oftenmight it
Happen?
Is the Risk Tolerable?
Identify Chemical
and ProcessHazards
Estimate Frequency
Analyze Consequences
AnalyzeRisk
IdentifyAdditional Safeguards as Needed
DevelopScenarios
Identify Equipment
or Activity to be Analyzed
Manage Barriers
for Life Cycle of Facility
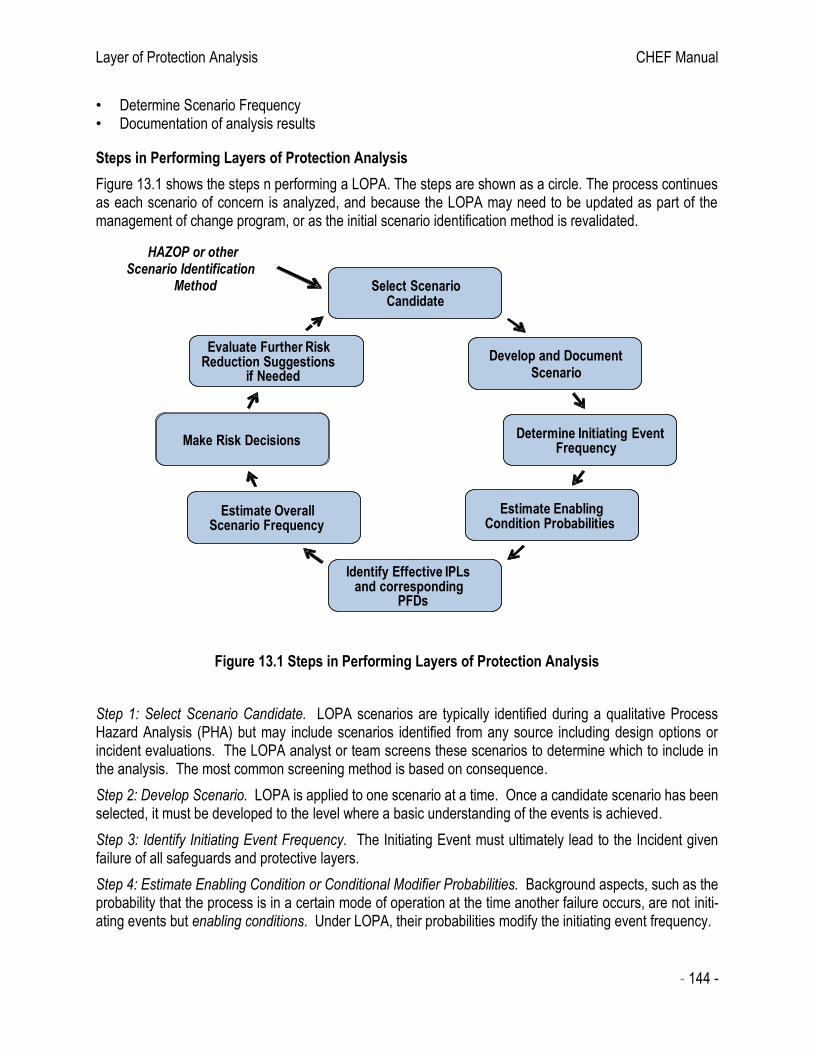
Layer of Protection Analysis CHEF Manual
- 144 -
• Determine Scenario Frequency • Documentation of analysis results
Steps in Performing Layers of Protection Analysis
Figure 13.1 shows the steps n performing a LOPA. The steps are shown as a circle. The process continues as each scenario of concern is analyzed, and because the LOPA may need to be updated as part of the management of change program, or as the initial scenario identification method is revalidated.
Figure 13.1 Steps in Performing Layers of Protection Analysis
Step 1: Select Scenario Candidate. LOPA scenarios are typically identified during a qualitative Process Hazard Analysis (PHA) but may include scenarios identified from any source including design options or incident evaluations. The LOPA analyst or team screens these scenarios to determine which to include in the analysis. The most common screening method is based on consequence.
Step 2: Develop Scenario. LOPA is applied to one scenario at a time. Once a candidate scenario has been selected, it must be developed to the level where a basic understanding of the events is achieved.
Step 3: Identify Initiating Event Frequency. The Initiating Event must ultimately lead to the Incident given failure of all safeguards and protective layers.
Step 4: Estimate Enabling Condition or Conditional Modifier Probabilities. Background aspects, such as the probability that the process is in a certain mode of operation at the time another failure occurs, are not initi-ating events but enabling conditions. Under LOPA, their probabilities modify the initiating event frequency.
Select ScenarioCandidate
Develop and DocumentScenario
Determine Initiating Event Frequency
Estimate Enabling Condition Probabilities
Identify Effective IPLs and corresponding
PFDs
Estimate Overall Scenario Frequency
Make Risk Decisions
Evaluate Further Risk Reduction Suggestions
if Needed
HAZOP or other Scenario Identification
Method
Layer of Protection Analysis CHEF Manual
- 145 -
Step 5: Identify Effective Independent Protective Layers (IPLs) and corresponding Probability of Failure on Demand. A scenario may require one or many independent protection layers (IPLs) depending on the se-verity of the consequence. Only one layer must work successfully for the scenario consequence to be pre-vented. However, since no layer is perfectly effective, sufficient layers must be provided to render the incident risk as tolerable. During this step we will often identify effective Safety Instrumented Systems and determine their preliminary design specifications and validation methods. Details for determining the PFD, special con-siderations and validation methods for IPLs are beyond the scope of this document.
Step 6: Estimate Overall Scenario Frequency. Combine the Initiating Event frequency times any Enabling Condition or Conditional Modifier probability times the probabilities of failure on demand (PFD) for existing Independent Protection Layers to estimate the overall scenario frequency.
Step 7: Compare Estimated Scenario Frequency to Company Tolerable Frequency. This comparison will help in reaching a decision if scenario risk is adequately managed, a more detailed risk evaluation should be performed, or if additional protective layers should be considered.
Step 8: Evaluate Further Risk Reduction Suggestions as Needed. Determine if there are additional cost-effective Protective Layers that may be appropriate in further reducing process risk.
Selection of LOPA Scenario Candidates.
The analysis team must screen for which scenarios to include in the LOPA analysis. The most common basis is by consequence severity although other criteria may be used depending on a specific company or business requirement. There are several approaches that may be used for evaluation of consequence se-verity depending on the risk methodology adopted by the organization (company, regulatory agency, etc.). Each approach has advantages and disadvantages.
Release Size/Characterization (example 1500 kg toxic release)
• Simple and easy to use • Avoids overt appearance that injuries and fatalities are tolerable • May introduce inconsistency in interpretation and inconsistency of results
Simplified Injury/Fatality Estimates (uses human harm as the consequence of interest)
• People tend to understand consequence in terms of harm rather than release size • Consequences may be compared directly with corporate risk criteria • Qualitative estimates of human harm may introduce inconsistencies depending on analysist level of
experience
Detailed Injury/Fatality Estimates
• More accurate predicted consequences and comparison to company risk criteria • Modeling consequences are strongly influenced by exact release conditions • Complex and time-consuming
Previous modules in this manual describe simplified consequence analysis techniques including methods for estimation of release size, effect zone, building damage and number of people impacted.
Estimation of Consequence Severity
After a Scenario candidate has been selected for LOPA analysis, it must be developed and documented. All important steps for an event sequence to progress from the Initiating Event to an Outcome with undesired

Layer of Protection Analysis CHEF Manual
- 146 -
Consequence should be documented. Companies will often have a specific protocol or format for LOPA documentation.
Figure 13.2 Depiction of Typical LOPA Scenario
A well-developed LOPA scenario description should contain information regarding the Initiating Event, Loss Event, and Outcome. Often the equipment involved, chemical, or energy released will be noted. In addition, the consequence severity may be noted. Figure 13.3 provides an example scenario description.
Figure 13.3 – Example LOPA Scenario Description
Initiating Event Frequency
In the context of hazard evaluation procedures, the operational error, mechanical failure, or external event that is the first event in an incident sequence and marks the transition from a normal situation to an abnormal situation. Synonymous with initiating cause.
Initiating Events typically fall into broad categories:
Initiating Event
+ Enabling Conditions
Lo
ss E
ven
t
Incident Outcome with
Undesired Consequence
Failure of Independent Protective
Layers
Vessel, Tank-203, is involved in an
Overfill event caused by Level Control
failurewith subsequent airborne release of 1500 kg acrylonitrile at a maximum
rate of 26 kg/min . This incident may
result in Toxic Infiltration to a nearby building
-which could seriously impact up to 3 People,
Equipment
Involved
Type of
Loss Event
Initiating
Event
Chemical
Involved
Airborne
Rate
Outcome
Consequence

Layer of Protection Analysis CHEF Manual
- 147 -
• External event including natural phenomena such as earthquakes or lightning strike, and third-party intervention such as impact damage from collision. An external event may also relate to major incidents in adjacent equipment or facilities which may indirectly cause damage or unintended release of hazard-ous material or energy from the equipment or facility being analyzed.
• Equipment related failure includes failure of Basic Process Control, and Equipment or Mechanical In-tegrity failure due to wear, fatigue, corrosion, or improper maintenance.
• Human error including error of omission (something not done) and error of commission (something done wrong).
Management system failures, such as faulty design or inadequate training, often lead to an unsafe acts or conditions that are root causes of an incident. If the root causes were removed, the particular incident would not occur. Root Causes are not typically Initiating Events but may contribute to the frequency by which an Initiating Event occurs. Equipment or Mechanical Integrity failures are sometimes considered as Initiating Events. These situations typically involve chronic issues rather than a short duration process upset. The frequency of integrity failures often depends on the effectiveness of management systems such as mainte-nance or Mechanical Integrity programs.
Often discrete initiating event frequencies are grouped into a representative set. For control system failures, the overall loop failure rate includes failure of any of several components (the sensor, the control element such as a valve, and the logic solver) and may include other factors such as improper set points, mis-calibra-tion, or operation in manual mode. This simplifies the analysis and improves consistency of risk estimates across the company or business.
Individual companies typically choose initiating event frequency values consistent with the company methods for making risk-based decisions and operating experience. The failure rate selected should be representative of the industry. Where sufficient data does not exist, engineering judgment is often used. Typical initiating event frequency for use in LOPA evaluation are shown below. Note that failure rate is normally assumed constant and “order of magnitude” values are common for LOPA evaluation. The CCPS book, Guidelines for Initiating Events and Independent Protection Layers in Layers of Protection Analysis (2015) provides detailed guidance including special conditions for use, quality assurance and generic validation methods.
TABLE 13-1 Typical Frequency Values Assigned to Initiating Events
Initiating event Frequency range from literature
(per year)
Example of a value
chosen by a com-pany for use in LOPA (per
year)
Pressure vessel residual failure 10-5 to 10-7 1 x 10⁻⁶
Piping residual failure, 100 m, full breach 10-5 to 10-6 1 x 10⁻⁵
Piping leak (10% section), 100 m 10-3 to 10-4 1 x 10⁻³
Atmospheric tank failure 10-3 to 10-5 1 x 10⁻³
Gasket/packing blowout 10-2 to 10-6 1 x 10⁻²
Turbine/diesel engine overspeed with casing breach 10-3 to 10-4 1 x 10⁻⁴
Third-party intervention (external impact by back-how, vehicle, etc.) 10-2 to 10-4 1 x 10⁻²
Crane load drop 10-3 to 10-4 per lift 1 x 10⁻⁴ per lift
Lightning strike 10-3 to 10-4 1 x 10⁻³
Safety valve opens spuriously 10-2 to 10-4 1 x 10⁻²

Layer of Protection Analysis CHEF Manual
- 148 -
Cooling water failure 1 to 10-2 1 x10⁻¹
Pump seal failure 10-1to 10-2 1 x10⁻¹
Unloading/loading hose failure 1 to 10-2 1 x10⁻¹
BPCS instrument loop failure 1 to 10-2 1 x10⁻¹
Regulator failure 1 to 10-2 1 x10⁻¹
Small external fire (aggregate causes) 10-1 to 10-2 1 x10⁻¹
Large external fire (aggregate causes) 10-2 to 10-3 1 x 10⁻²
LOTO (lock-out tag-out) procedure failure (overall failure of a 10-3 to 10-4 per 1 x 10⁻³ per
multiple element process) opportunity opportunity
Operator failure (to execute routine procedure; well trained, 10-1 to 10-3 per 1 x 10⁻² per
unstressed, not fatigued) opportunity opportunity
Note that Initiating Event frequency is expressed as failures “per year”. For frequencies expressed a failure “per opportunity” or “per lift”, values must be multiplied by opportunities per year or lifts per year to obtain the proper frequency. This may be as simple as counting the number of opportunities per year. Or, it may require more complex techniques as Fault Tree of Event Tree.
Human Reliability
A human error is an action that fails to meet a criteria of acceptability defined for a system. The error may be a physical action (such as closing a valve) or a cognitive action (such as problem diagnosis or decision making). Human error is either a cause or a contributor in virtually every process incident. It can occur at any stage in the chemical manufacturing process; research, design, construction, commissioning, operating or demolition. The human error can cause the incident immediately (active error) or exist for many years before causing the incident (latent error).
Factors impacting Human Reliability include:
• Familiarity with the task
• Complexity of the task (including problem diagnosis and decision making)
• Time to complete
• Human – Machine Interface
• Work Environment – stress, fatigue, training, etc.
If these items are clearly defined and well documented, identification of appropriate controls and mitigations (existing or proposed to be added as an upgrade to close the gap), as well as subsequent reviews, of the case will be easier.
Enabling Conditions and Conditional Modifiers
An Enabling Condition is not a failure, error or a protection layer but makes it possible for an incident se-quence to proceed to a consequence of concern. It consists of a condition or operating phase that does not directly cause the scenario, but that must be present or active in order for the scenario to proceed to a loss event; expressed as a dimensionless probability.
Layer of Protection Analysis CHEF Manual
- 149 -
Time at Risk - One general category of enabling condition involves the concept of “time at risk,” when an incident sequence may only be realized a certain fraction of the time when conditions are right for the event sequence to progress to a loss event. One common time-at-risk enabling condition is a sufficiently low am-bient temperature to enable process or utility lines or instrumentation to freeze up following failure of designed freeze protection. Another type of time-at-risk enabling condition is when a process must be in a certain part of a non-continuous operation when a failure occurs for the incident sequence to be able to proceed to a loss event. (Note that a time at risk enabling condition may not be appropriate for unrevealed failures. For ex-ample, if an unloading hose may have been damaged at any time but only leaks when in use and while personnel may be present, a time at risk probability would not be considered.)
A Conditional Modifier is one of several possible probabilities included in scenario risk calculations, generally when risk criteria endpoints are expressed in impact terms (e.g., fatalities) instead of in primary loss event terms (e.g., release, vessel rupture). Conditional modifiers include, but are not limited to: probability of a hazardous atmosphere, probability of ignition, probability of explosion, probability of personnel presence, probability of injury or fatality, and probability of equipment damage or other financial impact.
Probability of Personnel Presence - is a conditional modifier that relates to the fraction of time people are likely to be within an effect area (also termed impact zone) when a loss event occurs. The probability of personnel presence should account for all personnel in the effect area, including routine operations, transient or short-term operations such as start-ups, maintenance work, anticipated abnormal situations and periods of time in which a larger group of people may be present. Personnel in adjacent units will also need to be considered if the event is large enough to affect more than the immediate area. The probability of personnel presence must be independent of the scenario being evaluated. This is often not the case when operator response to an alarm is involved or the presence of an operator would be required for the initiating event to occur, such as an error made during a loading or unloading operation.
Probability of Ignition - The LOPA conditional probability of a flammable vapor, explosible dust cloud or com-bustible mist igniting or an uncontrolled reaction (such as an explosive decomposition) initiating is treated in various ways by different companies. A probability of ignition or initiation may be associated with two basic scenario types:
• Igniting a flammable or explosible atmosphere inside process equipment, resulting in an internal combustion reaction (usually a deflagration; transition to a detonation may be possible under the right conditions) that may or may not breach the primary containment.
• Igniting flammable vapors or an ignitable dust cloud external to process equipment, resulting in a flash fire, pool fire, jet fire and/or vapor cloud explosion.
The probability of ignition of a flammable or explosible atmosphere inside process equipment will not always warrant a conditional modifier. Scenarios involving ignition inside process equipment must be carefully eval-uated on a case-by-case basis. When there is normally a flammable or explosible atmosphere inside the process equipment, and an internal deflagration will be initiated as soon as a sufficiently energetic ignition source is present, then the presence of the ignition source is the initiating event (such as failure of the ground-ing and bonding system or where failure of mechanical components may result in hot surfaces).
Many of the same internal ignition considerations also apply to ignition outside of process equipment, such as following an atmospheric release or a loss of primary containment (LOPC) event. Other factors needing to be considered when assessing the probability of ignition include:
• Size of the flammable vapor cloud or ignitable dust cloud (larger releases may extend beyond elec-trical classification boundaries and involve more potential ignition sources)
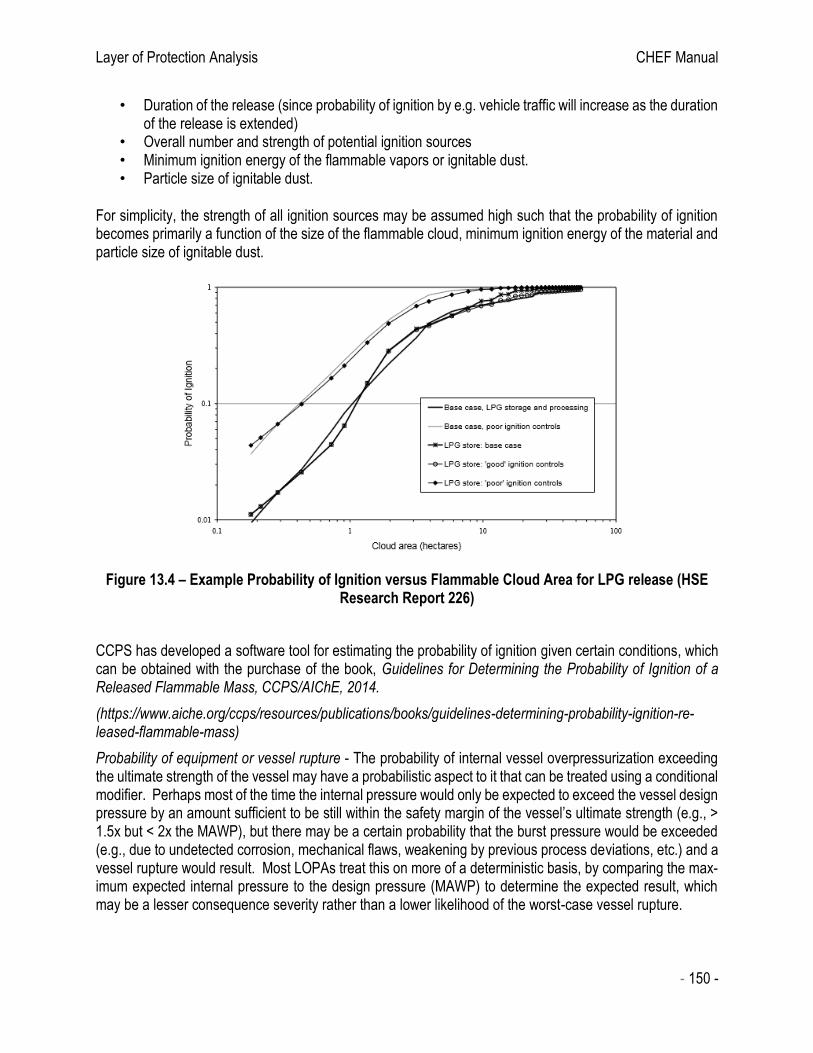
Layer of Protection Analysis CHEF Manual
- 150 -
• Duration of the release (since probability of ignition by e.g. vehicle traffic will increase as the duration of the release is extended)
• Overall number and strength of potential ignition sources • Minimum ignition energy of the flammable vapors or ignitable dust. • Particle size of ignitable dust.
For simplicity, the strength of all ignition sources may be assumed high such that the probability of ignition becomes primarily a function of the size of the flammable cloud, minimum ignition energy of the material and particle size of ignitable dust.
Figure 13.4 – Example Probability of Ignition versus Flammable Cloud Area for LPG release (HSE Research Report 226)
CCPS has developed a software tool for estimating the probability of ignition given certain conditions, which can be obtained with the purchase of the book, Guidelines for Determining the Probability of Ignition of a Released Flammable Mass, CCPS/AIChE, 2014.
(https://www.aiche.org/ccps/resources/publications/books/guidelines-determining-probability-ignition-re-leased-flammable-mass)
Probability of equipment or vessel rupture - The probability of internal vessel overpressurization exceeding the ultimate strength of the vessel may have a probabilistic aspect to it that can be treated using a conditional modifier. Perhaps most of the time the internal pressure would only be expected to exceed the vessel design pressure by an amount sufficient to be still within the safety margin of the vessel’s ultimate strength (e.g., > 1.5x but < 2x the MAWP), but there may be a certain probability that the burst pressure would be exceeded (e.g., due to undetected corrosion, mechanical flaws, weakening by previous process deviations, etc.) and a vessel rupture would result. Most LOPAs treat this on more of a deterministic basis, by comparing the max-imum expected internal pressure to the design pressure (MAWP) to determine the expected result, which may be a lesser consequence severity rather than a lower likelihood of the worst-case vessel rupture.

Layer of Protection Analysis CHEF Manual
- 151 -
A probability of injury or fatality conditional modifier relates to the probability that, given a person is within an effect area (impact zone) as determined in the preceding section, a serious injury or fatality would actually result. This conditional modifier cannot be determined independently of the probability of personnel presence, since it will be affected by the endpoint chosen for calculating the effect area. Also, the analyst needs to ensure consistency with the consequence severity as this conditional modifier may already be inherent in the value for tolerable frequency. (For example, if consequence severity assumes a low probability of a single fatality equivalent to an injury or the number of people within an occupied building is estimated from vulner-ability of the occupants based on damage, this modifier would not be used.)
An enabling condition or conditional modifier is expressed as a probability. The combination of the enabling condition or conditional modifier probability with the initiating event frequency must always be a frequency that represents the times per year an abnormal situation would be encountered that could lead to a loss event. Most companies provide guidance on estimating the frequency to achieve consistency in LOPA results. Note that many LOPA scenarios will not have enabling conditions or conditional modifiers. The CCPS book, Guidelines for Enabling Conditions and Conditional Modifiers in Layers of Protection Analysis (2014) provides detailed guidance on when use of enabling conditions or conditional modifiers is appropriate.
Protection Layers
A scenario may require one or many protection layers depending on the process complexity and potential consequence severity. For a given scenario, only one protection must work successfully for the consequence to be prevented. However, since no single protective layer is perfectly effective, sufficient layers must be provided to render the risk associated with the scenario tolerable. Figure 13.5 illustrates the concept of using “layers” of protection, as if they were layers of an onion. In addition, there are many types of protections to prevent or mitigate a scenario, some of which may be more effective than others in specific circumstances.
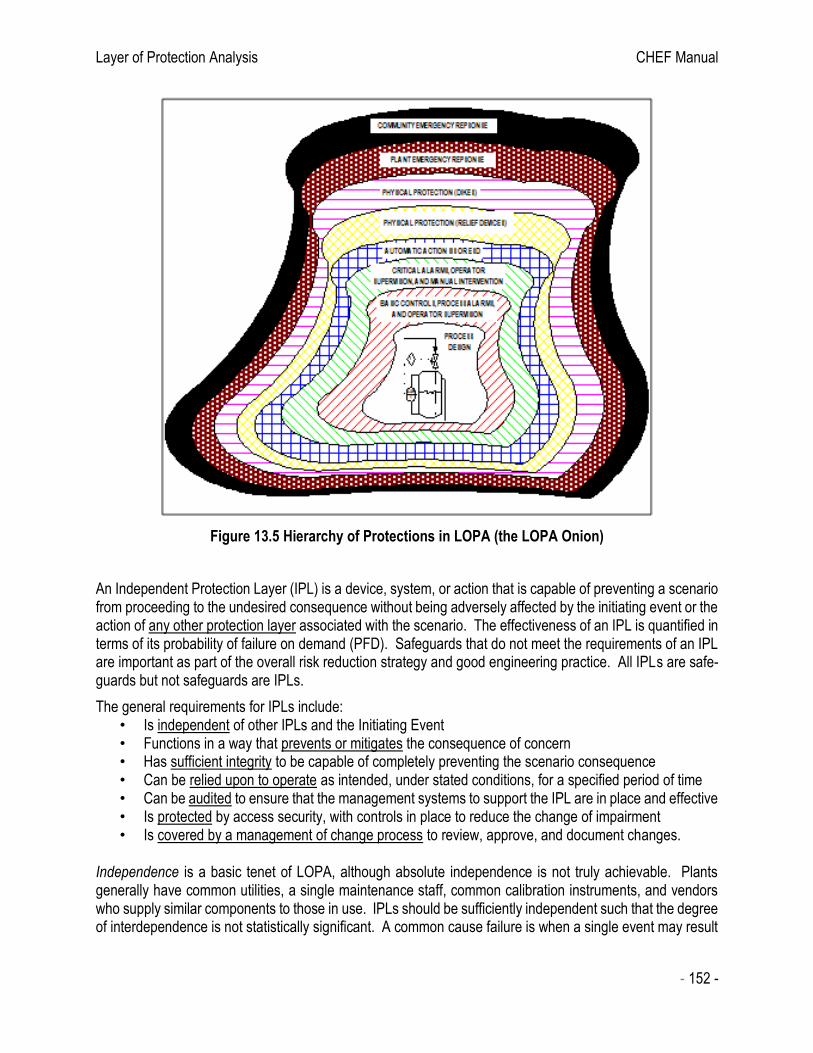
Layer of Protection Analysis CHEF Manual
- 152 -
Figure 13.5 Hierarchy of Protections in LOPA (the LOPA Onion)
An Independent Protection Layer (IPL) is a device, system, or action that is capable of preventing a scenario from proceeding to the undesired consequence without being adversely affected by the initiating event or the action of any other protection layer associated with the scenario. The effectiveness of an IPL is quantified in terms of its probability of failure on demand (PFD). Safeguards that do not meet the requirements of an IPL are important as part of the overall risk reduction strategy and good engineering practice. All IPLs are safe-guards but not safeguards are IPLs.
The general requirements for IPLs include: • Is independent of other IPLs and the Initiating Event • Functions in a way that prevents or mitigates the consequence of concern • Has sufficient integrity to be capable of completely preventing the scenario consequence • Can be relied upon to operate as intended, under stated conditions, for a specified period of time • Can be audited to ensure that the management systems to support the IPL are in place and effective • Is protected by access security, with controls in place to reduce the change of impairment • Is covered by a management of change process to review, approve, and document changes.
Independence is a basic tenet of LOPA, although absolute independence is not truly achievable. Plants generally have common utilities, a single maintenance staff, common calibration instruments, and vendors who supply similar components to those in use. IPLs should be sufficiently independent such that the degree of interdependence is not statistically significant. A common cause failure is when a single event may result

Layer of Protection Analysis CHEF Manual
- 153 -
in failure of more than one device, procedure or system. An example is loss of power which could cause failure of multiple sensing instruments as well as electronic equipment such as pumps or agitators. Another example is the sharing of control loops between a protective layer and initiating event such as level control and high level shut off utilizing the same sensing instrument or same shut off valve.
For a device, system or action to be credited as an IPL, it must be effective in preventing the undesired consequence associated with the scenario. The IPL design basis must apply to the specific scenario for which it is credited and is valid for the mode of operation being analyzed (normal, start-up, or shut-down). For example, a relief device for a storage vessel may have been sized for fire exposure but be inadequate for a back-flow scenario. The IPL must also be able to accomplish its function in sufficient time to prevent the consequence of concern and perform reliably. When operator response is part of the IPL, there must be a well-written procedure and an effective training program to ensure that operators understand the hazard and how to respond to the initiating event, alarm, or emergency situation, as well as enough time to perform the response action to prevent the consequence of concern from occurring
Auditability reflects the ability of an organization to inspect procedures, records, previous validation assess-ments, and other documented information to ensure that design, testing, maintenance, and operation con-tinue to conform to expectations. Maintenance systems are periodically audited to verify that the existing administrative processes ensure that maintenance is performed as required, design is performed by qualitied personnel following accepted engineering practices, and documentation is maintained. The Management of Change (MOC) process is audited to ensure changes to materials, operating parameters, equipment, proce-dures and organization are properly reviewed and documented, and that any action items generated have been completed.
Passive Protective Layers
A passive IPL is not required to take an action in order for it to achieve its function in reducing risk. Such IPLs achieve the intended function if their process or mechanical design is correct and if constructed, installed and maintained correctly. In general, crediting of a passive IPL applicable in the consequence severity can only result from the failure of the IPL to be effective. For example, if the scenario states that “flammable liquid spills into a diked area”, then the consequence severity has already assumed that the dike is in place and effective and would not be credited as an IPL. If the consequence of the scenario were defined as environmental contamination if the spill is not contained, then it may be appropriate to credit the dike as an IPL. Another example would be pool fire exposure to a vessel where fire-proof insulation has already been assumed in the estimation of fire heat input and so the insulation would not be credited as an IPL. Examples of Passive IPLs include:
• Flame, Deflagration or Detonation Arrester • Overflow Lines to prevent overpressure • Dikes, Berms and Bunds • Remote Impoundment • Fire-Resistant Insulation or Cladding • Blast-Resistant Buildings • Blast Walls or Explosion Barriers
Table 13.2 presents typical PFD values assigned to passive protection layers.
Layer of Protection Analysis CHEF Manual
- 154 -
Active Protection Layers
Active IPLs ensure the functional safety of the process by taking action to prevent the scenario from occurring. This action may be mechanical-only in nature or may use a combination of instruments, humans, and me-chanical devices. Examples include:
• Basic Process Control System (BPCS) • Safety Instrumented System (SIS) • Pressure Relief Systems • Vacuum Breaker • Excess Flow Valve • Pressure Regulator
Table 13.3 presents typical PFD values assigned to active protection layers. In some cases, successful action of a protective layer may create another scenario. For example, a properly designed pressure relief device would prevent rupture of a vessel but cause a release to atmosphere of potentially hazardous materials (typically a less severe consequence) upon activation. Both scenarios need to be considered with credit of the relief device for preventing rupture but exclusion of the relief device credit for evaluation of the atmos-pheric release or effluent scenario.

Layer of Protection Analysis CHEF Manual
- 155 -
TABLE 13-2 Typical PFD Values Assigned to Passive IPLs (CCPS)

Layer of Protection Analysis CHEF Manual
- 156 -
TABLE 13-3 Typical PFD Values Assigned to Active IPLs (CCPS)
An IPL is considered Independent if it is not adversely affected by the initiating event or any other protection layer associated within the scenario. In some cases, however, the same IPLs may be used to manage related scenarios such that the PFD should be adjusted. If we have two scenarios with the same loss event and incident outcome but different initiating events, we may need to consider adjusting the PFD. For example: if we have two means for overfill of a tank, one a BPCS level control failure (at a frequency of 0.1 per year) and the other a human error, such as unloading into the wrong tank (at a frequency of 0.1 per year); then total demand on IPLs shared between these scenarios is 0.2 per year. At least one of the shared IPLs should be considered a PFD of 0.2 rather than 0.1 (or 0.02 rather than 0.01, etc.). This “correction” is typically ignored
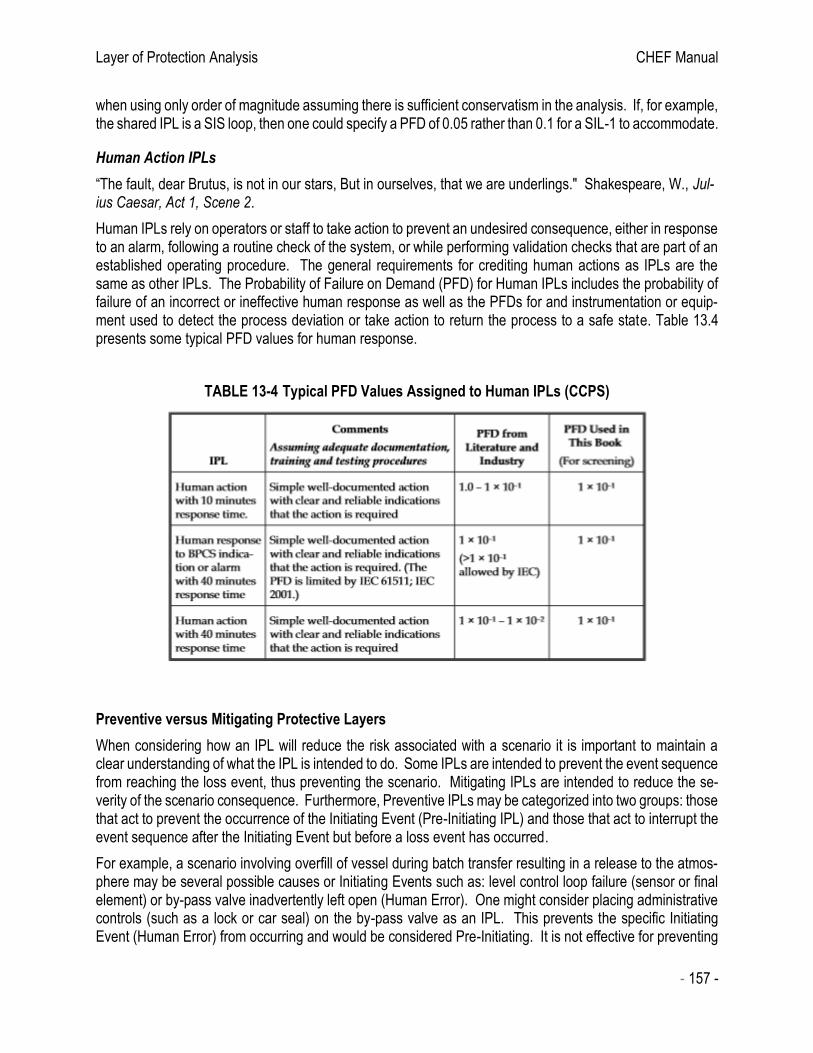
Layer of Protection Analysis CHEF Manual
- 157 -
when using only order of magnitude assuming there is sufficient conservatism in the analysis. If, for example, the shared IPL is a SIS loop, then one could specify a PFD of 0.05 rather than 0.1 for a SIL-1 to accommodate.
Human Action IPLs
“The fault, dear Brutus, is not in our stars, But in ourselves, that we are underlings." Shakespeare, W., Jul-ius Caesar, Act 1, Scene 2.
Human IPLs rely on operators or staff to take action to prevent an undesired consequence, either in response to an alarm, following a routine check of the system, or while performing validation checks that are part of an established operating procedure. The general requirements for crediting human actions as IPLs are the same as other IPLs. The Probability of Failure on Demand (PFD) for Human IPLs includes the probability of failure of an incorrect or ineffective human response as well as the PFDs for and instrumentation or equip-ment used to detect the process deviation or take action to return the process to a safe state. Table 13.4 presents some typical PFD values for human response.
TABLE 13-4 Typical PFD Values Assigned to Human IPLs (CCPS)
Preventive versus Mitigating Protective Layers
When considering how an IPL will reduce the risk associated with a scenario it is important to maintain a clear understanding of what the IPL is intended to do. Some IPLs are intended to prevent the event sequence from reaching the loss event, thus preventing the scenario. Mitigating IPLs are intended to reduce the se-verity of the scenario consequence. Furthermore, Preventive IPLs may be categorized into two groups: those that act to prevent the occurrence of the Initiating Event (Pre-Initiating IPL) and those that act to interrupt the event sequence after the Initiating Event but before a loss event has occurred.
For example, a scenario involving overfill of vessel during batch transfer resulting in a release to the atmos-phere may be several possible causes or Initiating Events such as: level control loop failure (sensor or final element) or by-pass valve inadvertently left open (Human Error). One might consider placing administrative controls (such as a lock or car seal) on the by-pass valve as an IPL. This prevents the specific Initiating Event (Human Error) from occurring and would be considered Pre-Initiating. It is not effective for preventing
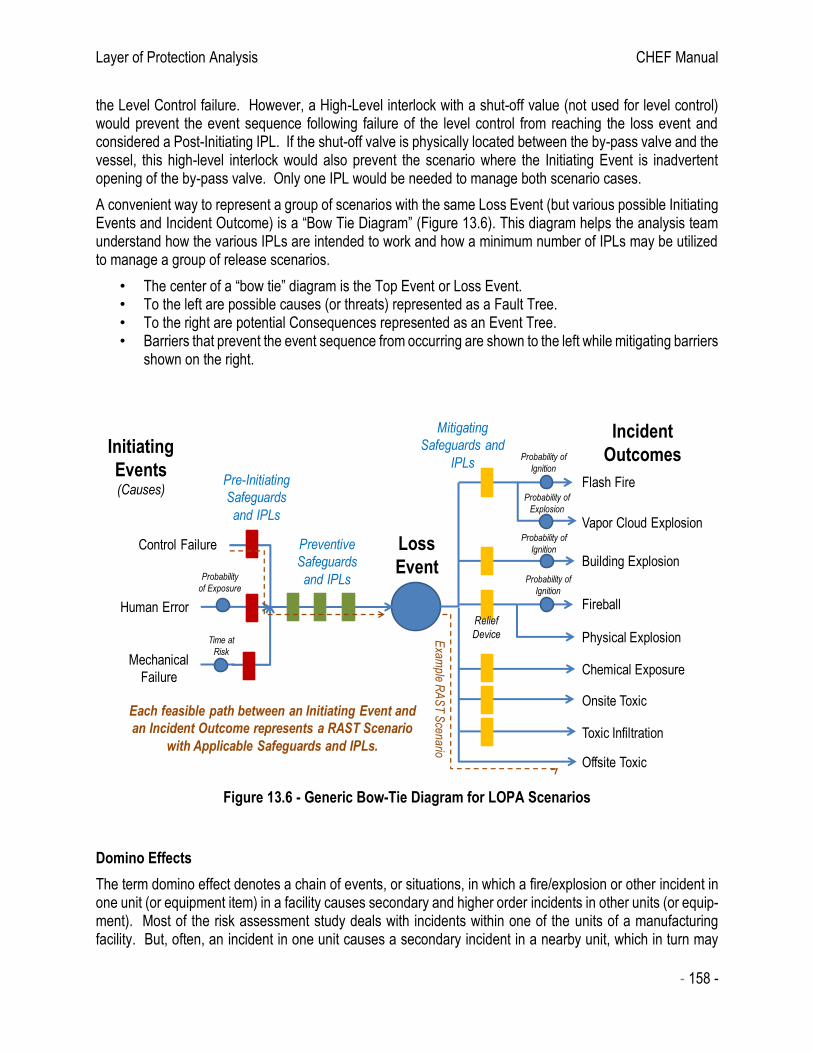
Layer of Protection Analysis CHEF Manual
- 158 -
the Level Control failure. However, a High-Level interlock with a shut-off value (not used for level control) would prevent the event sequence following failure of the level control from reaching the loss event and considered a Post-Initiating IPL. If the shut-off valve is physically located between the by-pass valve and the vessel, this high-level interlock would also prevent the scenario where the Initiating Event is inadvertent opening of the by-pass valve. Only one IPL would be needed to manage both scenario cases.
A convenient way to represent a group of scenarios with the same Loss Event (but various possible Initiating Events and Incident Outcome) is a “Bow Tie Diagram” (Figure 13.6). This diagram helps the analysis team understand how the various IPLs are intended to work and how a minimum number of IPLs may be utilized to manage a group of release scenarios.
• The center of a “bow tie” diagram is the Top Event or Loss Event. • To the left are possible causes (or threats) represented as a Fault Tree. • To the right are potential Consequences represented as an Event Tree. • Barriers that prevent the event sequence from occurring are shown to the left while mitigating barriers
shown on the right.
Figure 13.6 - Generic Bow-Tie Diagram for LOPA Scenarios
Domino Effects
The term domino effect denotes a chain of events, or situations, in which a fire/explosion or other incident in one unit (or equipment item) in a facility causes secondary and higher order incidents in other units (or equip-ment). Most of the risk assessment study deals with incidents within one of the units of a manufacturing facility. But, often, an incident in one unit causes a secondary incident in a nearby unit, which in turn may
Flash Fire
Vapor Cloud Explosion
Probability of
Ignition
Probability of
Explosion
Probability of
Ignition
Building Explosion
Fireball
Physical Explosion
Probability of
Ignition
Chemical Exposure
Onsite Toxic
Toxic Infiltration
Human Error
Control Failure
Mechanical
Failure
Loss
Event
Initiating
Events(Causes)
Incident
Outcomes
Relief
Device
Pre-Initiating
Safeguards
and IPLs
Preventive
Safeguards
and IPLs
Mitigating
Safeguards and
IPLs
Offsite Toxic
Exam
ple
RA
ST
Scen
ario
Each feasible path between an Initiating Event and
an Incident Outcome represents a RAST Scenario
with Applicable Safeguards and IPLs.
Probability
of Exposure
Time at
Risk

Layer of Protection Analysis CHEF Manual
- 159 -
trigger a tertiary incident, and so on. The probability of occurrence of such ‘domino’ or ‘cascading’ effects increase with increasing congestion in industrial complexes.
We seldom evaluate incidents within one process unit that may affect another unit as the likelihood is very small. However, several situations with potentially catastrophic impacts are drawing more attention including:
• Secondary Dust Explosions
• Impact of Pool Fire on Nearby Equipment
• Potential for Physical Damage to Nearby Equipment from Explosion Debris
Fault Tree and Event Tree Analysis can be used to estimate the frequencies associated with Domino Effects. In Fault Tree, the Top Event would be the secondary incident.
Estimating Scenario Frequency and Risk Decisions
The general procedure for estimating frequency for a scenario with a specific consequence endpoint is mul-tiplication of the Initiating Frequency times the probability of any applicable Enabling Condition or Conditional Modifier times the product of all applicable IPLs. Typically, only order-of-magnitude values are used.
fiConsequence = fi
Initiating Event X piEnabling Factors X ∏ 𝑷𝑭𝑫
𝒋𝒋=𝟏 ij
IPL (81)
where: fi denotes frequency of scenario i in year-1 a pi denotes probability of a specific enabling factor for scenario i.
The Enabling Factor probabilities may include Probability of Ignition, Probability of Personnel within the Im-pact Zone, Probability of Injury, etc. but must be appropriate for the scenario. The Initiating Event frequency, Enabling Factor Probability and the Tolerable Frequency should represent a consistent set of values among analysis teams. If for example, an Initiating Event frequency accounts for infrequent execution of a procedure (Human Error), then a Time at Risk enabling condition is already included in the Initiating Event and a sepa-rate enabling probability should not be taken. If for example, an Injury consequence severity (based on a low fatality probability) is accounted for in the Tolerable Frequency, then a Probability of Injury should not be included in the scenario frequency.
As an example, consider the scenario described previously:
Tank-203 is involved in an Overfill event caused by Level Control failure with airborne release of 1500 kg acrylonitrile and potential for Toxic Infiltration to a nearby building resulting in up to 3 People seriously im-pacted (Table 13.5.)
Table 13.5. Risk Analysis of Tank Overflow Scenario
Description Probability Frequency
Tolerable Fre-quency
Onsite Toxic Release with up to 3 fatalities 10-5/year
Initiating Event Level Control failure 10-1/year
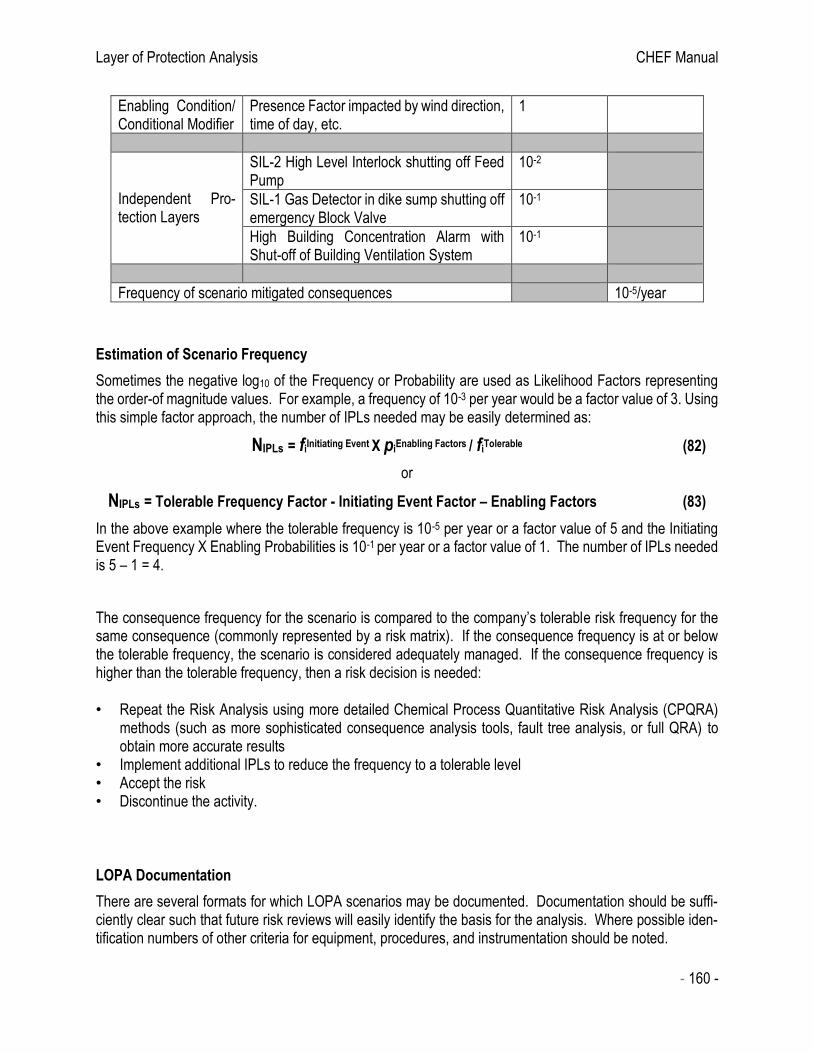
Layer of Protection Analysis CHEF Manual
- 160 -
Enabling Condition/ Conditional Modifier
Presence Factor impacted by wind direction, time of day, etc.
1
Independent Pro-tection Layers
SIL-2 High Level Interlock shutting off Feed Pump
10-2
SIL-1 Gas Detector in dike sump shutting off emergency Block Valve
10-1
High Building Concentration Alarm with Shut-off of Building Ventilation System
10-1
Frequency of scenario mitigated consequences 10-5/year
Estimation of Scenario Frequency
Sometimes the negative log10 of the Frequency or Probability are used as Likelihood Factors representing the order-of magnitude values. For example, a frequency of 10-3 per year would be a factor value of 3. Using this simple factor approach, the number of IPLs needed may be easily determined as:
NIPLs = fiInitiating Event X pi
Enabling Factors / fiTolerable (82)
or
NIPLs = Tolerable Frequency Factor - Initiating Event Factor – Enabling Factors (83)
In the above example where the tolerable frequency is 10-5 per year or a factor value of 5 and the Initiating Event Frequency X Enabling Probabilities is 10-1 per year or a factor value of 1. The number of IPLs needed is 5 – 1 = 4.
The consequence frequency for the scenario is compared to the company’s tolerable risk frequency for the same consequence (commonly represented by a risk matrix). If the consequence frequency is at or below the tolerable frequency, the scenario is considered adequately managed. If the consequence frequency is higher than the tolerable frequency, then a risk decision is needed:
• Repeat the Risk Analysis using more detailed Chemical Process Quantitative Risk Analysis (CPQRA) methods (such as more sophisticated consequence analysis tools, fault tree analysis, or full QRA) to obtain more accurate results
• Implement additional IPLs to reduce the frequency to a tolerable level • Accept the risk • Discontinue the activity.
LOPA Documentation
There are several formats for which LOPA scenarios may be documented. Documentation should be suffi-ciently clear such that future risk reviews will easily identify the basis for the analysis. Where possible iden-tification numbers of other criteria for equipment, procedures, and instrumentation should be noted.

Layer of Protection Analysis CHEF Manual
- 161 -
Figure 13.7 shows the format suggested in the CCPS book, Layer of Protection Analysis. It allows for clear documentation of a given cause-consequence pair. Figure 13.8 shows a horizontal LOPA format. Either for-mat can be adapted to a spreadsheet.
Figure 13.7 Example LOPA Documentation Form (CCPS)

Layer of Protection Analysis CHEF Manual
- 162 -
Limitations of LOPA
• Risk comparisons of scenarios are valid only if the same LOPA methods and same tolerance criteria are used. The numbers generated by a LOPA analysis are not precise values of the risk of a scenario (this is also a limitation of detailed quantitative risk analysis).
• LOPA is a simplified approach and should not be applied to all scenarios. The amount of effort required to implement LOPA may be excessive for some risk-based decisions or overly simplistic for others.
• LOPA requires more time to reach risk-based decisions that qualitative methods (such as HAZOP or What-If Analysis). This extra time is offset by improved risk decisions and consistency of results among evaluation teams.
• LOPA is not intended to be a hazard identification technique. However, the more rigorous procedure of LOPA frequently clarifies ill-defined scenarios from qualitative hazard reviews.
• Differences in risk tolerance criteria and in LOPA implementation between organizations means the re-sults cannot normally be compared directly from one organization to another.
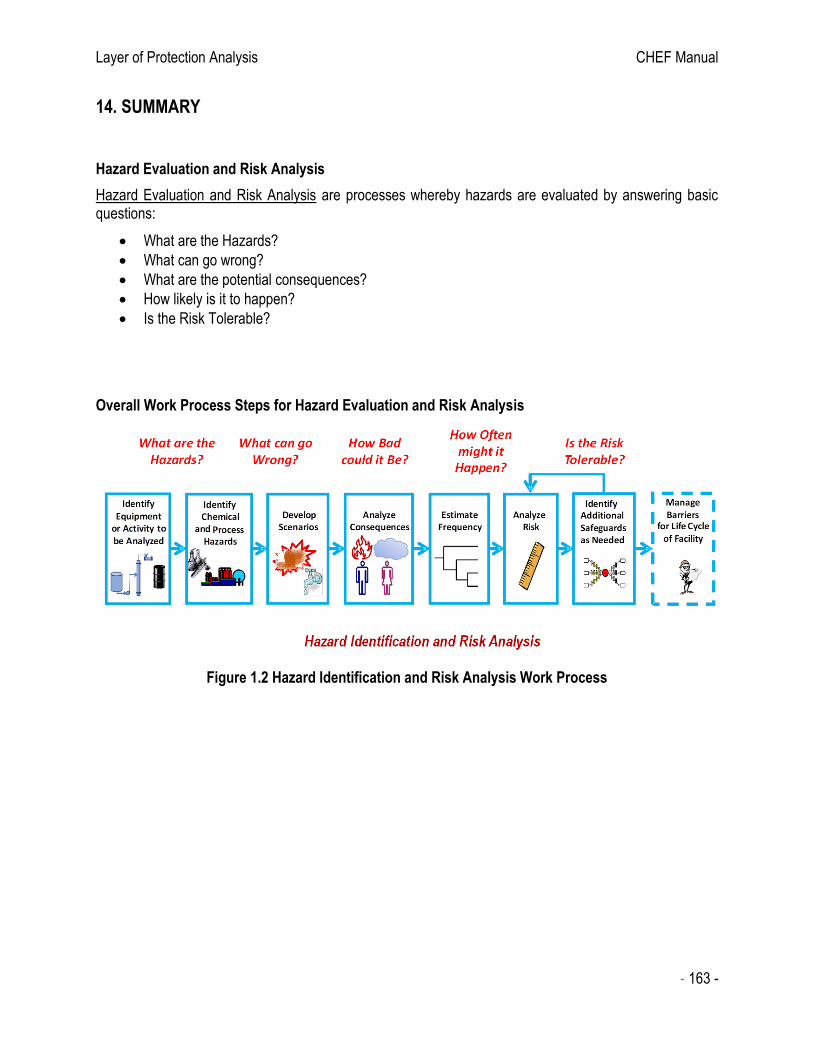
Layer of Protection Analysis CHEF Manual
- 163 -
14. SUMMARY
Hazard Evaluation and Risk Analysis
Hazard Evaluation and Risk Analysis are processes whereby hazards are evaluated by answering basic questions:
• What are the Hazards?
• What can go wrong?
• What are the potential consequences?
• How likely is it to happen?
• Is the Risk Tolerable?
Overall Work Process Steps for Hazard Evaluation and Risk Analysis
Figure 1.2 Hazard Identification and Risk Analysis Work Process
References CHEF Manual
- 164 -
GLOSSARY
Acute Hazard: The potential for injury or damage to occur as a result of an instantaneous or short duration exposure to the effects of an incident.
Administrative Controls: Procedural mechanism for controlling, monitoring, or auditing human performance, such as lock out/tagout procedures, bypass approval processes, car seals, and permit systems.
Asset Integrity Management: A process safety management system for ensuring the integrity of assets throughout their life cycle.
Atmospheric Dispersion: The low momentum mixing of a gas or vapor with air. The mixing is the result of turbulent energy exchange, which is a function of wind (mechanical eddy formation) and atmospheric tem-perature profile (thermal eddy formation).
Audit: A systematic, independent review to verify conformance with prescribed standards of care using a well-defined review process to ensure consistency and to allow the auditor to reach defensible conclusions.
Barrier: Anything used to control, prevent, or impede energy flows. Includes engineering (physical, equip-ment design) and administrative (procedures and work processes). See also Layer of Protection.
Basic Process Control System: A system that responds to input signals from the process and its associ-ated equipment, other programmable systems, and/or from an operator, and generates output signals caus-ing the process and its associated equipment to operate in the desired manner and within normal production limits.
Blast Wave: The overpressure wave traveling outward from an explosion point.
Boiling Liquid Expanding Vapor Explosion (BLEVE): A type of rapid phase transition in which a liquid contained above its atmospheric boiling point is rapidly depressurized, causing a nearly instantaneous tran-sition from liquid to vapor with a corresponding energy release. A BLEVE of flammable material is often accompanied by a large aerosol fireball, since an external fire impinging on the vapor space of a pressure vessel is a common cause. However, it is not necessary for the liquid to be flammable to have a BLEVE occur.
Bow-Tie Diagram: A diagram for visualizing the types of preventive and mitigative barriers which can be used to manage risk. These barriers are drawn with the threats on the left, the unwanted event at the center, and the consequences on the right, representing the flow of the hazardous materials or energies through its barriers to its destination. The hazards or threats can be proactively addressed on the left with specific barriers (safeguards, layers of protection) to help prevent a hazardous event from occurring; barriers reacting to the event to help reduce the event’s consequences are shown on the right.
Catastrophic Release: An uncontrolled loss of containment of toxic, reactive, or flammable materials from
a process that has the potential for causing onsite or offsite acute health effects, significant environmental
effects (e.g., compromise of a public drinking water supply), or significant on-site or off-site property dam-
age.
Center for Chemical Process Safety (CCPS): is a not-for-profit, corporate membership organization
within the American Institute for Chemical Engineers (AIChE) that identifies and addresses process safety
needs for a variety of facilities involved with handling, storing, using or processing, and transporting hazard-
ous materials

References CHEF Manual
- 165 -
Checklist Analysis: A hazard evaluation procedure using one or more pre-prepared lists of process safety
considerations to prompt team discussions of whether the existing safeguards are adequate.
Chemical Process Quantitative Risk Assessment (CPQRA or QRA): The quantitative evaluation of ex-pected risk from potential incident scenarios. It examines both consequences and frequencies, and how they combine into an overall measure of risk. The CPQRA process is always preceded by a qualitative systematic identification of process hazards. The CPQRA results may be used to make decisions, particularly when mitigation of risk is considered.
Combustible Dust: A finely divided combustible particulate solid that presents a flash fire hazard or explo-sion hazard when suspended in air or the process specific oxidizing medium over a range of concentrations.
Common Cause Failure: The failure of more than one component, item, or system due to the same cause.
Condensed Phase Explosion: An explosion that occurs when the material is present in the form of a liquid or solid.
Conditional Modifier: One of several possible probabilities included in scenario risk calculations, generally when risk criteria endpoints are expressed in impact terms (e.g., fatalities) instead of in primary loss event terms (e.g., release, vessel rupture). Conditional modifiers include, but are not limited to: probability of a hazardous atmosphere, probability of ignition, probability of explosion, probability of personnel presence, probability of injury or fatality, and probability of equipment damage or other financial impact.
Confined Explosion (or Building Explosion): An explosion of fuel-oxidant mixture inside a closed system (e.g. vessel or building).
Confinement: Obstacles such as walls and ceilings of a building, vessel, pipe, etc. that serve to limit the expansion of a dispersing or exploding vapor cloud.
Congestion: Obstacles in the path of the flame that generate turbulence.
Consequence: The undesirable result of a loss event, usually measured in health and safety effects, envi-ronmental impacts, loss of property, and business interruption costs.
Consequence Analysis: The analysis of the expected effects of incident outcome cases, independent of frequency or probability.
Consequence Screening: The evaluation of consequence severity to determine the extent and detail to which risk analysis is warranted.
De Minimis Risk: A level of risk that would be perceived by most to be broadly acceptable, and not requiring further reduction.
Deflagration: A combustion that propagates by heat and mass transfer through the un-reacted medium at a velocity less than the speed of sound.
Demand: A plant condition or event which requires a protective system or device to take appropriate action in order to prevent a hazard. (1) A signal or action that should change the state of a device, or (2) an oppor-tunity to act, and thus, to fail.
Detection System: A mechanical, electrical, or chemical device that automatically identifies the presence of a material or a change in environmental conditions such as pressure, temperature, or composition.
Detonation: A release of energy caused by the propagation of a chemical reaction in which the reaction front advances into the unreacted substance at greater than sonic velocity in the unreacted material.

References CHEF Manual
- 166 -
Deviation: A process condition outside of established design limits, safe operating limits, or standard oper-ating procedures.
Dike: An embankment or wall built to act as a barrier blocking passage of liquids to surrounding areas.
Domino Effect: The triggering of secondary events, such as toxic releases, by a primary event, such as an explosion, such that the result is an increase in consequences or area of an effect zone. Generally considered only when a significant escalation of the original incident results.
Dose: Time-integrated concentration
Effect Zone: For an incident that produces an incident outcome of toxic release, the area over which the airborne concentration equals or exceeds some level of concern. For a flammable release, the area over which a particular incident outcome case produces an effect based on a specified criterion.
Equipment: A piece of hardware which can be defined in terms of mechanical, electrical or instrumentation components contained within its boundaries.
Enabling Condition: A condition that is not a failure, error or a protection layer but makes it possible for an incident sequence to proceed to a consequence of concern. It consists of a condition or operating phase that does not directly cause the scenario, but that must be present or active in order for the scenario to proceed to a loss event; expressed as a dimensionless probability.
Event: An occurrence involving a process that is caused by equipment performance or human action or by an occurrence external to the process.
Event Sequence: A specific unplanned sequence of events composed of initiating events and intermediate events that may lead to an incident
Explosion: A release of energy that causes a pressure discontinuity or blast wave.
F-N Curve: A plot of cumulative frequency versus consequences (often expressed as number of fa-talities).
Facility: The physical location where a management system activity is performed. In early life-cycle stages, a facility may be the company's central research laboratory, pilot plant, or the engineering offices of a tech-nology vendor. In later stages, the facility may be a typical chemical plant, storage terminal, distribution center, or corporate office. In the context of this document, a facility is a portion of or a complete plant, unit, site, complex or offshore platform or any combination thereof.
Failure: an unacceptable difference between expected and observed performance.
Fault Tree Analysis: A method used to analyze graphically the failure logic of a given event, to identify various failure scenarios (called cut-sets), and to support the probabilistic estimation of the frequency of the event.
Final Element: Process control or safety device that implements the physical action necessary to achieve or maintain a safe state; e.g., valves, switch gear, and motors, including their auxiliary elements (such as the solenoid valve used to operate a valve).
Fireball: The atmospheric burning of a fuel-air cloud in which the energy is mostly emitted in the form of radiant heat. The inner core of the fuel release consists of almost pure fuel whereas the outer layer in which ignition first occurs is a flammable fuel-air mixture. As buoyancy forces of the hot gases begin to dominate, the burning cloud rises and becomes more spherical in shape.
References CHEF Manual
- 167 -
Flammable: A gas that can burn with a flame if mixed with a gaseous oxidizer such as air or chlorine and then ignited. The term flammable gas includes vapors from flammable or combustible liquids above their flash points.
Flash Fire: A fire that spreads by means of a flame front rapidly through a diffuse fuel, such as a dust, gas, or the vapors of an ignitable liquid, without the production of damaging pressure.
Frequency: Number of occurrences of an event per unit time (e.g., 1 event in 1000 yr. = 1 x 10⁻³ events/yr.).
Globally Harmonized System (GHS): system for Classification and Labeling of Chemicals adopted by the
United Nations
Hazard: An inherent chemical or physical characteristic that has the potential for causing damage to peo-
ple, property, or the environment.
Hazard and Operability Study (HAZOP): A systematic qualitative technique to identify process hazards
and potential operating problems using a series of guide words to study process deviations. A HAZOP is
used to question every part of a process to discover what deviations from the intention of the design can
occur and what their causes and consequences may be. This is done systematically by applying suitable
guidewords. This is a systematic detailed review technique, for both batch and continuous plants, which
can be applied to new or existing processes to identify hazards.
Hazard Evaluation: Identification of individual hazards of a system, determination of the mechanisms by
which they could give rise to undesired events, and evaluation of the consequences of these events on
health (including public health), environment and property. Uses qualitative techniques to pinpoint weak-
nesses in the design and operation of facilities that could lead to incidents.
Hazard Identification: The inventorying of material, system, process and plant characteristics that can pro-duce undesirable consequences through the occurrence of an incident.
Hazard Identification and Risk Analysis Study (HIRA): A collective term that encompasses all activities
involved in identifying hazards and evaluating risk at facilities, throughout their life cycle, to make certain
that risks to employees, the public, or the environment are consistently controlled within the organization's
risk tolerance.
Hazard Screening: The evaluation of hazard severity to determine the extent to which hazard assessment
and subsequent risk analysis is warranted.
Hazardous Chemical: A material that is toxic, reactive, or flammable and is capable of causing a process
safety incident if released. Also Hazardous material.
Human Error: Intended or unintended human action or inaction that produces an inappropriate result. In-
cludes actions by designers, operators, engineers, or managers that may contribute to or result in acci-
dents.
Human Reliability Analysis: A method used to evaluate whether system-required human-actions, tasks,
or jobs will be completed successfully within a required time period. Also used to determine the probability
that no extraneous human actions detrimental to the system will be performed.

References CHEF Manual
- 168 -
Hybrid Mixture: A mixture of a flammable gas with either a combustible dust or combustible mist.
Impact: A measure of the ultimate loss and harm of a loss event. Impact may be expressed in terms of numbers of injuries and/or fatalities, extent of environmental damage and/or magnitude of losses such as property damage, material loss, lost production, market share loss, and recovery costs.
Incident: An event, or series of events, resulting in one or more undesirable consequences, such as harm to people, damage to the environment, or asset/business losses. Such events include fires, explosions, re-leases of toxic or otherwise harmful substances, and so forth.
Incident Investigation: A systematic approach for determining the causes of an incident and developing recommendations that address the causes to help prevent or mitigate future incidents. See also Root cause analysis and Apparent cause analysis.
Incident Outcome: The physical manifestation of the incident: for toxic materials, the incident outcome is a toxic release, while for flammable materials; the incident outcome could be a boiling liquid expanding vapor explosion (BLEVE), flash fire, vapor cloud explosion (VCE), etc.
Independent Protection Layer (IPL): A device, system, or action that is capable of preventing a scenario from proceeding to the undesired consequence without being adversely affected by the initiating event or the action of any other protection layer associated with the scenario.
Individual Risk: The risk to a person in the vicinity of a hazard. This includes the nature of the injury to the individual, the likelihood of the injury occurring, and the time period over which the injury might occur.
Inherently Safer Design: A way of thinking about the design of chemical processes and plants that focuses on the elimination or reduction of hazards, rather than on their management and control.
Initiating Cause (or Initiating Event): The operational error, mechanical failure, or external event or agency that is the first event in an incident sequence and marks the transition from a normal situation to an abnormal situation.
Interlock: A protective response which is initiated by an out-of-limit process condition. Instrument which will not allow one part of a process to function unless another part is functioning. A device such as a switch that prevents a piece of equipment from operating when a hazard exists. To join two parts together in such a way that they remain rigidly attached to each other solely by physical interference. A device to prove the physical state of a required condition and to furnish that proof to the primary safety control circuit.
Jet Fire: A fire type resulting from the discharge of liquid, vapor, or gas into free space from an orifice, the momentum of which induces the surrounding atmosphere to mix with the discharged material.
Layer of Protection Analysis: An approach that analyzes one incident scenario (cause-consequence pair) at a time, using predefined values for the initiating event frequency, independent protection layer failure prob-abilities, and consequence severity, in order to compare a scenario risk estimate to risk criteria for determin-ing where additional risk reduction or more detailed analysis is needed. Scenarios are identified elsewhere, typically using a scenario-based hazard evaluation procedure such as a HAZOP Study.
Likelihood: A measure of the expected probability or frequency of occurrence of an event. This may be expressed as an event frequency (e.g., events per year), a probability of occurrence during a time interval (e.g., annual probability) or a conditional probability (e.g., probability of occurrence, given that a precursor event has occurred).

References CHEF Manual
- 169 -
Loss Event: Point in time in an abnormal situation when an irreversible physical event occurs that has the potential for loss and harm impacts. Examples include release of a hazardous material, ignition of flammable vapors or ignitable dust cloud, and over-pressurization rupture of a tank or vessel. An incident might involve more than one loss event, such as a flammable liquid spill (first loss event) followed by ignition of a flash fire and pool fire (second loss event) that heats up an adjacent vessel and its contents to the point of rupture (third loss event). Generally synonymous with hazardous event.
Loss of Primary Containment (LOPC): An unplanned or uncontrolled release of material from primary containment, including non-toxic and non-flammable materials (e.g., steam, hot condensate, nitrogen, com-pressed CO2 or compressed air).
Management of Change: A management system to identify, review, and approve all modifications to equip-ment, procedures, raw materials, and processing conditions, other than replacement in kind, prior to imple-mentation to help ensure that changes to processes are properly analyzed (for example, for potential adverse impacts), documented, and communicated to employees affected.
Mechanical Integrity (or Equipment Integrity): A management system focused on ensuring that equip-ment is designed, installed, and maintained to perform the desired function.
Mean Time Between Failure (MTBF): For a stated period in the life of a functional unit, the mean value of the length of time between consecutive failures under stated conditions.
Mitigate: Reduce the impact of a loss event.
Mitigative Safeguard: A safeguard that is designed to reduce loss event impact.
National Fire Protection Agency (NFPA): a United States trade association, that creates and maintains standards and codes for usage and adoption by local governments.
Near-Miss: An unplanned sequence of events that could have caused harm or loss if conditions were differ-ent or were allowed to progress, but actually did not.
Normal Operations: Any process operations intended to be performed between startup and shutdown to support continued operation within safe upper and lower operating limits.
Occupant Vulnerability: Proportion of building occupants that could potentially suffer an injury or fatality if a postulated event were to occur. The level of injury is defined according to the technical basis of the occupant vulnerability model being used.
Off-Site Population: Persons located outside of the site property line that may be impacted by an on-site incident.
On-Site Personnel: Employees, contractors, visitors, service providers, and others present at the facility.
Operating Procedures: Written, step by step instructions and information necessary to operate equipment, compiled in one document including operating instructions, process descriptions, operating limits, chemical hazards, and safety equipment requirements.
Operator: An individual responsible for monitoring, controlling, and performing tasks as necessary to ac-complish the productive activities of a system. Operator is also used in a generic sense to include people who perform a wide range of tasks (e.g., readings, calibration, incidental maintenance, manage loading/un-loading, and storage of hazardous materials).

References CHEF Manual
- 170 -
OSHA Process Safety Management (OSHA PSM): A U.S. regulatory standard that requires use of a 14-element management system to help prevent or mitigate the effects of catastrophic releases of chemicals or energy from processes covered by the regulations (49 CFR 1910.119).
Parameter: A quantity describing the relation of variables within a given system. Note: A parameter may be constant or depend on the time or the magnitude of some system variables.
Passive System: A system in which failures are only revealed by testing or when a demand has occurred.
Personal Protective Equipment (PPE): Equipment designed to protect employees from serious workplace injuries or illnesses resulting from contact with chemical, radiological, physical, electrical, mechanical, or other workplace hazards. Besides face shields, safety glasses, hard hats, and safety shoes, PPE includes a variety of devices and garments, such as goggles, coveralls, gloves, vests, earplugs, and respirators.
Physical Explosion: The catastrophic rupture of a pressurized gas/vapor-filled vessel by means other than reaction, or the sudden phase-change from liquid to vapor of a superheated liquid.
Piping and Instrument Diagram (P&ID): A diagram that shows the details about the piping, vessels, and instrumentation.
Pool Fire: The combustion of material evaporating from a layer of liquid at the base of the fire.
Potential Explosion Site (PES): A volume within a plant with sufficient congestion and/or confinement that a flammable vapor cloud ignited there could likely develop into an explosion.
Pre-Initiating Safeguard: A safeguard that acts to prevent an initiating event or cause from occurring.
Preventive Safeguard: A safeguard that forestalls the occurrence of a particular loss event, given that an initiating cause has occurred; i.e., a safeguard that intervenes between an initiating cause and a loss event in an incident sequence.
Prevention: The process of eliminating or preventing the hazards or risks associated with a particular activity. Prevention is sometimes used to describe actions taken in advance to reduce the likelihood of an undesired event.
Probability: The expression for the likelihood of occurrence of an event or an event sequence during an interval of time, or the likelihood of success or failure of an event on test or on demand. Probability is ex-pressed as a dimensionless number ranging from 0 to 1.
Probit: A random variable with a mean of 5 and a variance of 1, which is used in various effect models. Probit-based models derived from experimental dose-response data, are often used to estimate the health effect that might result based upon the intensity and duration of an exposure to a harmful substance or condition (e.g., exposure to a toxic atmosphere, or a thermal radiation exposure).
Process Hazard Analysis: An organized effort to identify and evaluate hazards associated with processes and operations to enable their control. This review normally involves the use of qualitative techniques to identify and assess the significance of hazards. Conclusions and appropriate recommendations are devel-oped. Occasionally, quantitative methods are used to help prioritized risk reduction.
Process Safety Management Systems: Comprehensive sets of policies, procedures, and practices de-signed to ensure that barriers to episodic incidents are in place, in use, and effective.
Process Safety: A disciplined framework for managing the integrity of operating systems and processes
handling hazardous substances by applying good design principles, engineering, and operating practices. It

References CHEF Manual
- 171 -
deals with the prevention and control of incidents that have the potential to release hazardous materials or
energy. Such incidents can cause toxic effects, fire, or explosion and could ultimately result in serious inju-
ries, property damage, lost production, and environmental impact.
Process Safety Review: An inspection of a plant/process unit, drawings, procedures, emergency plans and/or management systems, etc., usually by an on-site team and usually problem-solving in nature. (See "Audit" for contrast).
Qualitative: Based primarily on description and comparison using historical experience and engineering judgment, with little quantification of the hazards, consequences, likelihood, or level of risk.
Quantitative Risk Analysis: The systematic development of numerical estimates of the expected frequency and severity of potential incidents associated with a facility or operation based on engineering evaluation and mathematical techniques.
Recognized and Generally Accepted Good Engineering Practice (RAGAGEP): a term originally used
by OSHA, stems from the selection and application of appropriate engineering, operating, and maintenance
knowledge when designing, operating and maintaining chemical facilities with the purpose of ensuring
safety and preventing process safety incidents. It involves the application of engineering, operating or
maintenance activities derived from engineering knowledge and industry experience based upon the evalu-
ation and analyses of appropriate internal and external standards, applicable codes, technical reports, guid-
ance, or recommended practices or documents of a similar nature. RAGAGEP can be derived from singular
or multiple sources and will vary based upon individual facility processes, materials, service, and other en-
gineering considerations.
Reliability: Core attribute of a protection layer related to the probability that the equipment operates accord-ing to its specification for a stated period of time under all relevant conditions.
Risk: A measure of human injury, environmental damage, or economic loss in terms of both the incident likelihood and the magnitude of the loss or injury.
Risk Analysis: The estimation of scenario, process, facility and/or organizational risk by identifying potential incident scenarios, then evaluating and combining the expected frequency and impact of each scenario hav-ing a consequence of concern, then summing the scenario risks, if necessary, to obtain the total risk estimate for the level at which the risk analysis is being performed.
Risk-Based Process Safety (RBPS): The Center for Chemical Process Safety's process safety manage-ment system approach that uses risk-based strategies and implementation tactics that are commensurate with the risk-based need for process safety activities, availability of resources, and existing process safety culture to design, correct, and improve process safety management activities.
Risk Matrix: A tabular approach for presenting risk tolerance criteria, typically involving graduated scales of incident likelihood on the Y-axis and incident consequences on the X-Axis.
Risk Management: The systematic application of management policies, procedures, and practices to the tasks of analyzing, assessing, and controlling risk in order to protect employees, the general public, the en-vironment, and company assets, while avoiding business interruptions. Includes decisions to use suitable engineering and administrative controls for reducing risk.
Risk Tolerance Criteria: A predetermined measure of risk used to aid decisions about whether further efforts to reduce the risk are warranted.

References CHEF Manual
- 172 -
Safeguard: Any device, system, or action that either interrupts the chain of events following an initiating event or that mitigates the consequences. A safeguard can be an engineered system or an administrative control. Not all safeguards meet the requirements of an IPL.
Safety Instrumented System (SIS): A separate and independent combination of sensors, logic solvers, final elements, and support systems that are designed and managed to achieve a specified safety integrity level. A SIS may implement one or more Safety Instrumented Functions (SIFs).
Scenario: A detailed description of an unplanned event or incident sequence that results in a loss event and its associated impacts, including the success or failure of safeguards involved in the incident sequence.
Screening Criteria: A predetermined measure, standard, or rule (typically based upon company or regula-tory requirements), on which a judgment or decision can be based.
Severity: The maximum credible consequences or effects, assuming no safeguards are in place.
Screening Tool: A simplified model with limited capabilities, suitable for screening-level studies.
Spray Distance: The maximum distance a fluid travels before the velocity slows and/or the fluid falls to the ground.
Societal Risk: A measure of risk to a group of people. It is most often expressed in terms of the frequency distribution of multiple casualty events.
Source Term: The release parameters (e.g. magnitude, rate, duration, orientation, temperature) that are the initial conditions for determining the consequences of the loss event for a hazardous material and/or energy release to the surroundings. For vapor dispersion modeling, it is the estimation, based on the release speci-fication, of the actual cloud conditions of temperature, aerosol content, density, size, velocity and mass to be input into the dispersion model.
Tolerable Frequency: The maximum frequency for a specific consequence that is regarded as tolerable/
Tolerable Frequency Factor (TFF): - log10 of the tolerable frequency
Tolerable Risk Level: The maximum level of risk of a particular technical process or condition that is re-garded as tolerable in the context of the circumstances in questions.
Vapor Cloud Explosion (VCE): The explosion resulting from the ignition of a cloud of flammable vapor, gas, or mist in which flame speeds accelerate to sufficiently high velocities to produce significant overpressure.
Virtual Source: The offset in distance to the specified source of a gas or vapor release that results in a maximum concentration of 100% at the source using a Gaussian dispersion model.
What-If Analysis: A scenario-based hazard evaluation procedure using a brainstorming approach in which typically a team that includes one or more persons familiar with the subject process asks questions or voices concerns about what could go wrong, what consequences could ensue, and whether the existing safeguards are adequate.
Worst Case: A conservative (high) estimate of the consequences of the most severe incident identified.
References CHEF Manual
- 173 -
REFERENCES
Key references may be found at:
Guidelines for Hazard Evaluation Procedures, 3nd Edition, Center for Chemical Process Safety, American Institute of Chemical Engineers, New York (2008)
Guidelines for Chemical Process Quantitative Risk Analysis, 2nd Edition, Center for Chemical Process Safety, American Institute of Chemical Engineers, New York (2000)
Guidelines for Consequence Analysis of Chemical Releases, Center for Chemical Process Safety, American Institute of Chemical Engineers, New York (1999)
Guidelines for Evaluating the Characteristics of Vapor Cloud Explosions, Flash Fires, and BLEVEs, 2nd Edi-tion, Center for Chemical Process Safety, American Institute of Chemical Engineers, New York (2010)
Layer of Protection Analysis, Center for Chemical Process Safety, American Institute of Chemical Engineers, New York (2001)
Guidelines for Enabling Conditions and Conditional Modifiers in Layers of Protection Analysis, Center for Chemical Process Safety, American Institute of Chemical Engineers, New York (2013)
Guidelines for Initiating Events and Independent Protection Layers in Layer of Protection Analysis, Center for Chemical Process Safety, American Institute of Chemical Engineers, New York (2015)
Guidelines for Chemical Reactivity Evaluation and Application to Process Design, Center for Chemical Pro-cess Safety, American Institute of Chemical Engineers, New York (1995)
Guidelines for Evaluating Process Plant Buildings for External Explosions, Fires, and Toxic Releases, Center for Chemical Process Safety, American Institute of Chemical Engineers, New York (1996)
Crowl and Louvar, Chemical Process Safety Fundamentals with Applications, 3rd Edition, Prentice Hall, (2011)
Britton, Avoiding Static Ignition Hazards in Chemical Operations, Center for Chemical Process Safety, Amer-ican Institute of Chemical Engineers, New York (1999)
Pratt, Electrostatic Ignitions of Fires and Explosions, Center for Chemical Process Safety, American Institute of Chemical Engineers, New York (2000)
Mannan, Lee’s Loss Prevention in the Process Industries, 3rd Edition, Elsevier, (2005)
Green and Perry, Perry’s Chemical Engineers’ Handbook, 8th Edition, McGraw-Hill, New York (2008)
Risk Management Program Guidance for Offsite Consequence Analysis, United States Environmental Pro-tection Agency, Chemical Emergency Preparedness and Prevention Office (1999)
Guidelines for Quantitative Risk Assessment: "Purple Book”, Netherlands Organisation for Applied Scientific Research TNO, The Hague (2005)
NFPA 68 Explosion Protection by Deflagration Venting, National Fire Protection Agency, Quincy MA (2007)
NFPA 654 Standard of the Prevention of Fire and Dust Explosion from the Manufacture, Processing and Handling of Combustible Particulate Solids, National Fire Protection Agency, Quincy MA (2006
Guide for Pressure Relieving and Depressuring Systems, API Recommended Practice 551 5th Ed, American Petroleum Institute (2007)

References CHEF Manual
- 174 -
Woodward, Estimating the Flammable Mass of a Vapor Cloud, Center for Chemical Process Safety, Ameri-can Institute of Chemical Engineers, New York (1998)
Prugh, “Quantitative Evaluation of BLEVE Hazards”, Journal of Fire Protection Engineering, Vol 3 (1991)
Franks, “Lines of Defense/Layers of Production Analysis in the COMAH Context”, United Kingdom Health and Safety Executive
Craig, Baskett, Davix, Dukes, Hansen, Petrocchi, Powell, Sutherland, and Tuccinardi, “Recommended De-fault Methodology for Analysis of Airborne Exposures to Mixtures of Chemicals in Emergencies”, Applied Occupational and Environmental Hygiene, Vol 14 (1999)
Bell and Holroyd, “Review of Human Reliability Assessment Methods”, United Kingdom Health and Safety Executive (2009)
First, K., “Scenario Identification and Evaluation for Layers of Protection Analysis”, Journal of Loss Prevention in the Process Industries, Vol 23, Elsevier (2010)
Hofelich, T. and LaBarge, M., “On the use and misuse of detected onset temperature of calorimetric experi-ments for reactive chemicals”, Journal of Loss Prevention in the Process Industries, 15 (2002)
Townsend, D. and Tou, J., “Thermal Hazard Evaluation by an Accelerating Rate Calorimeter”, Thermochem-ica Acta, 37, (1980)
Yoshida, T., “Estimation of Explosive Properties of Self-Reactive Chemicals form SC-DSC Data”, Kogyo Kayaku, vol 48, (1987)
Revision History CHEF Manual
- 175 -
GLOSSARY
Acute Hazard: The potential for injury or damage to occur as a result of an instantaneous or short duration exposure to the effects of an incident.
Administrative Controls: Procedural mechanism for controlling, monitoring, or auditing human performance, such as lock out/tagout procedures, bypass approval processes, car seals, and permit systems.
Asset Integrity Management: A process safety management system for ensuring the integrity of assets throughout their life cycle.
Atmospheric Dispersion: The low momentum mixing of a gas or vapor with air. The mixing is the result of turbulent energy exchange, which is a function of wind (mechanical eddy formation) and atmospheric tem-perature profile (thermal eddy formation).
Audit: A systematic, independent review to verify conformance with prescribed standards of care using a well-defined review process to ensure consistency and to allow the auditor to reach defensible conclusions.
Barrier: Anything used to control, prevent, or impede energy flows. Includes engineering (physical, equip-ment design) and administrative (procedures and work processes). See also Layer of Protection.
Basic Process Control System: A system that responds to input signals from the process and its associ-ated equipment, other programmable systems, and/or from an operator, and generates output signals caus-ing the process and its associated equipment to operate in the desired manner and within normal production limits.
Blast Wave: The overpressure wave traveling outward from an explosion point.
Boiling Liquid Expanding Vapor Explosion (BLEVE): A type of rapid phase transition in which a liquid contained above its atmospheric boiling point is rapidly depressurized, causing a nearly instantaneous tran-sition from liquid to vapor with a corresponding energy release. A BLEVE of flammable material is often accompanied by a large aerosol fireball, since an external fire impinging on the vapor space of a pressure vessel is a common cause. However, it is not necessary for the liquid to be flammable to have a BLEVE occur.
Bow-Tie Diagram: A diagram for visualizing the types of preventive and mitigative barriers which can be used to manage risk. These barriers are drawn with the threats on the left, the unwanted event at the center, and the consequences on the right, representing the flow of the hazardous materials or energies through its barriers to its destination. The hazards or threats can be proactively addressed on the left with specific barriers (safeguards, layers of protection) to help prevent a hazardous event from occurring; barriers reacting to the event to help reduce the event’s consequences are shown on the right.
Catastrophic Release: An uncontrolled loss of containment of toxic, reactive, or flammable materials from
a process that has the potential for causing onsite or offsite acute health effects, significant environmental
effects (e.g., compromise of a public drinking water supply), or significant on-site or off-site property dam-
age.
Center for Chemical Process Safety (CCPS): is a not-for-profit, corporate membership organization
within the American Institute for Chemical Engineers (AIChE) that identifies and addresses process safety
needs for a variety of facilities involved with handling, storing, using or processing, and transporting hazard-
ous materials

Revision History CHEF Manual
- 176 -
Checklist Analysis: A hazard evaluation procedure using one or more pre-prepared lists of process safety
considerations to prompt team discussions of whether the existing safeguards are adequate.
Chemical Process Quantitative Risk Assessment (CPQRA or QRA): The quantitative evaluation of ex-pected risk from potential incident scenarios. It examines both consequences and frequencies, and how they combine into an overall measure of risk. The CPQRA process is always preceded by a qualitative systematic identification of process hazards. The CPQRA results may be used to make decisions, particularly when mitigation of risk is considered.
Combustible Dust: A finely divided combustible particulate solid that presents a flash fire hazard or explo-sion hazard when suspended in air or the process specific oxidizing medium over a range of concentrations.
Common Cause Failure: The failure of more than one component, item, or system due to the same cause.
Condensed Phase Explosion: An explosion that occurs when the material is present in the form of a liquid or solid.
Conditional Modifier: One of several possible probabilities included in scenario risk calculations, generally when risk criteria endpoints are expressed in impact terms (e.g., fatalities) instead of in primary loss event terms (e.g., release, vessel rupture). Conditional modifiers include, but are not limited to: probability of a hazardous atmosphere, probability of ignition, probability of explosion, probability of personnel presence, probability of injury or fatality, and probability of equipment damage or other financial impact.
Confined Explosion (or Building Explosion): An explosion of fuel-oxidant mixture inside a closed system (e.g. vessel or building).
Confinement: Obstacles such as walls and ceilings of a building, vessel, pipe, etc. that serve to limit the expansion of a dispersing or exploding vapor cloud.
Congestion: Obstacles in the path of the flame that generate turbulence.
Consequence: The undesirable result of a loss event, usually measured in health and safety effects, envi-ronmental impacts, loss of property, and business interruption costs.
Consequence Analysis: The analysis of the expected effects of incident outcome cases, independent of frequency or probability.
Consequence Screening: The evaluation of consequence severity to determine the extent and detail to which risk analysis is warranted.
De Minimis Risk: A level of risk that would be perceived by most to be broadly acceptable, and not requiring further reduction.
Deflagration: A combustion that propagates by heat and mass transfer through the un-reacted medium at a velocity less than the speed of sound.
Demand: A plant condition or event which requires a protective system or device to take appropriate action in order to prevent a hazard. (1) A signal or action that should change the state of a device, or (2) an oppor-tunity to act, and thus, to fail.
Detection System: A mechanical, electrical, or chemical device that automatically identifies the presence of a material or a change in environmental conditions such as pressure, temperature, or composition.
Detonation: A release of energy caused by the propagation of a chemical reaction in which the reaction front advances into the unreacted substance at greater than sonic velocity in the unreacted material.
Revision History CHEF Manual
- 177 -
Deviation: A process condition outside of established design limits, safe operating limits, or standard oper-ating procedures.
Dike: An embankment or wall built to act as a barrier blocking passage of liquids to surrounding areas.
Domino Effect: The triggering of secondary events, such as toxic releases, by a primary event, such as an explosion, such that the result is an increase in consequences or area of an effect zone. Generally considered only when a significant escalation of the original incident results.
Dose: Time-integrated concentration
Effect Zone: For an incident that produces an incident outcome of toxic release, the area over which the airborne concentration equals or exceeds some level of concern. For a flammable release, the area over which a particular incident outcome case produces an effect based on a specified criterion.
Equipment: A piece of hardware which can be defined in terms of mechanical, electrical or instrumentation components contained within its boundaries.
Enabling Condition: A condition that is not a failure, error or a protection layer but makes it possible for an incident sequence to proceed to a consequence of concern. It consists of a condition or operating phase that does not directly cause the scenario, but that must be present or active in order for the scenario to proceed to a loss event; expressed as a dimensionless probability.
Event: An occurrence involving a process that is caused by equipment performance or human action or by an occurrence external to the process.
Event Sequence: A specific unplanned sequence of events composed of initiating events and intermediate events that may lead to an incident
Explosion: A release of energy that causes a pressure discontinuity or blast wave.
F-N Curve: A plot of cumulative frequency versus consequences (often expressed as number of fa-talities).
Facility: The physical location where a management system activity is performed. In early life-cycle stages, a facility may be the company's central research laboratory, pilot plant, or the engineering offices of a tech-nology vendor. In later stages, the facility may be a typical chemical plant, storage terminal, distribution center, or corporate office. In the context of this document, a facility is a portion of or a complete plant, unit, site, complex or offshore platform or any combination thereof.
Failure: an unacceptable difference between expected and observed performance.
Fault Tree Analysis: A method used to analyze graphically the failure logic of a given event, to identify various failure scenarios (called cut-sets), and to support the probabilistic estimation of the frequency of the event.
Final Element: Process control or safety device that implements the physical action necessary to achieve or maintain a safe state; e.g., valves, switch gear, and motors, including their auxiliary elements (such as the solenoid valve used to operate a valve).
Fireball: The atmospheric burning of a fuel-air cloud in which the energy is mostly emitted in the form of radiant heat. The inner core of the fuel release consists of almost pure fuel whereas the outer layer in which ignition first occurs is a flammable fuel-air mixture. As buoyancy forces of the hot gases begin to dominate, the burning cloud rises and becomes more spherical in shape.

Revision History CHEF Manual
- 178 -
Flammable: A gas that can burn with a flame if mixed with a gaseous oxidizer such as air or chlorine and then ignited. The term flammable gas includes vapors from flammable or combustible liquids above their flash points.
Flash Fire: A fire that spreads by means of a flame front rapidly through a diffuse fuel, such as a dust, gas, or the vapors of an ignitable liquid, without the production of damaging pressure.
Frequency: Number of occurrences of an event per unit time (e.g., 1 event in 1000 yr. = 1 x 10⁻³ events/yr.).
Globally Harmonized System (GHS): system for Classification and Labeling of Chemicals adopted by the
United Nations
Hazard: An inherent chemical or physical characteristic that has the potential for causing damage to peo-
ple, property, or the environment.
Hazard and Operability Study (HAZOP): A systematic qualitative technique to identify process hazards
and potential operating problems using a series of guide words to study process deviations. A HAZOP is
used to question every part of a process to discover what deviations from the intention of the design can
occur and what their causes and consequences may be. This is done systematically by applying suitable
guidewords. This is a systematic detailed review technique, for both batch and continuous plants, which
can be applied to new or existing processes to identify hazards.
Hazard Evaluation: Identification of individual hazards of a system, determination of the mechanisms by
which they could give rise to undesired events, and evaluation of the consequences of these events on
health (including public health), environment and property. Uses qualitative techniques to pinpoint weak-
nesses in the design and operation of facilities that could lead to incidents.
Hazard Identification: The inventorying of material, system, process and plant characteristics that can pro-duce undesirable consequences through the occurrence of an incident.
Hazard Identification and Risk Analysis Study (HIRA): A collective term that encompasses all activities
involved in identifying hazards and evaluating risk at facilities, throughout their life cycle, to make certain
that risks to employees, the public, or the environment are consistently controlled within the organization's
risk tolerance.
Hazard Screening: The evaluation of hazard severity to determine the extent to which hazard assessment
and subsequent risk analysis is warranted.
Hazardous Chemical: A material that is toxic, reactive, or flammable and is capable of causing a process
safety incident if released. Also Hazardous material.
Human Error: Intended or unintended human action or inaction that produces an inappropriate result. In-
cludes actions by designers, operators, engineers, or managers that may contribute to or result in acci-
dents.
Human Reliability Analysis: A method used to evaluate whether system-required human-actions, tasks,
or jobs will be completed successfully within a required time period. Also used to determine the probability
that no extraneous human actions detrimental to the system will be performed.
Revision History CHEF Manual
- 179 -
Hybrid Mixture: A mixture of a flammable gas with either a combustible dust or combustible mist.
Impact: A measure of the ultimate loss and harm of a loss event. Impact may be expressed in terms of numbers of injuries and/or fatalities, extent of environmental damage and/or magnitude of losses such as property damage, material loss, lost production, market share loss, and recovery costs.
Incident: An event, or series of events, resulting in one or more undesirable consequences, such as harm to people, damage to the environment, or asset/business losses. Such events include fires, explosions, re-leases of toxic or otherwise harmful substances, and so forth.
Incident Investigation: A systematic approach for determining the causes of an incident and developing recommendations that address the causes to help prevent or mitigate future incidents. See also Root cause analysis and Apparent cause analysis.
Incident Outcome: The physical manifestation of the incident: for toxic materials, the incident outcome is a toxic release, while for flammable materials; the incident outcome could be a boiling liquid expanding vapor explosion (BLEVE), flash fire, vapor cloud explosion (VCE), etc.
Independent Protection Layer (IPL): A device, system, or action that is capable of preventing a scenario from proceeding to the undesired consequence without being adversely affected by the initiating event or the action of any other protection layer associated with the scenario.
Individual Risk: The risk to a person in the vicinity of a hazard. This includes the nature of the injury to the individual, the likelihood of the injury occurring, and the time period over which the injury might occur.
Inherently Safer Design: A way of thinking about the design of chemical processes and plants that focuses on the elimination or reduction of hazards, rather than on their management and control.
Initiating Cause (or Initiating Event): The operational error, mechanical failure, or external event or agency that is the first event in an incident sequence and marks the transition from a normal situation to an abnormal situation.
Interlock: A protective response which is initiated by an out-of-limit process condition. Instrument which will not allow one part of a process to function unless another part is functioning. A device such as a switch that prevents a piece of equipment from operating when a hazard exists. To join two parts together in such a way that they remain rigidly attached to each other solely by physical interference. A device to prove the physical state of a required condition and to furnish that proof to the primary safety control circuit.
Jet Fire: A fire type resulting from the discharge of liquid, vapor, or gas into free space from an orifice, the momentum of which induces the surrounding atmosphere to mix with the discharged material.
Layer of Protection Analysis: An approach that analyzes one incident scenario (cause-consequence pair) at a time, using predefined values for the initiating event frequency, independent protection layer failure prob-abilities, and consequence severity, in order to compare a scenario risk estimate to risk criteria for determin-ing where additional risk reduction or more detailed analysis is needed. Scenarios are identified elsewhere, typically using a scenario-based hazard evaluation procedure such as a HAZOP Study.
Likelihood: A measure of the expected probability or frequency of occurrence of an event. This may be expressed as an event frequency (e.g., events per year), a probability of occurrence during a time interval (e.g., annual probability) or a conditional probability (e.g., probability of occurrence, given that a precursor event has occurred).

Revision History CHEF Manual
- 180 -
Loss Event: Point in time in an abnormal situation when an irreversible physical event occurs that has the potential for loss and harm impacts. Examples include release of a hazardous material, ignition of flammable vapors or ignitable dust cloud, and over-pressurization rupture of a tank or vessel. An incident might involve more than one loss event, such as a flammable liquid spill (first loss event) followed by ignition of a flash fire and pool fire (second loss event) that heats up an adjacent vessel and its contents to the point of rupture (third loss event). Generally synonymous with hazardous event.
Loss of Primary Containment (LOPC): An unplanned or uncontrolled release of material from primary containment, including non-toxic and non-flammable materials (e.g., steam, hot condensate, nitrogen, com-pressed CO2 or compressed air).
Management of Change: A management system to identify, review, and approve all modifications to equip-ment, procedures, raw materials, and processing conditions, other than replacement in kind, prior to imple-mentation to help ensure that changes to processes are properly analyzed (for example, for potential adverse impacts), documented, and communicated to employees affected.
Mechanical Integrity (or Equipment Integrity): A management system focused on ensuring that equip-ment is designed, installed, and maintained to perform the desired function.
Mean Time Between Failure (MTBF): For a stated period in the life of a functional unit, the mean value of the length of time between consecutive failures under stated conditions.
Mitigate: Reduce the impact of a loss event.
Mitigative Safeguard: A safeguard that is designed to reduce loss event impact.
National Fire Protection Agency (NFPA): a United States trade association, that creates and maintains standards and codes for usage and adoption by local governments.
Near-Miss: An unplanned sequence of events that could have caused harm or loss if conditions were differ-ent or were allowed to progress, but actually did not.
Normal Operations: Any process operations intended to be performed between startup and shutdown to support continued operation within safe upper and lower operating limits.
Occupant Vulnerability: Proportion of building occupants that could potentially suffer an injury or fatality if a postulated event were to occur. The level of injury is defined according to the technical basis of the occupant vulnerability model being used.
Off-Site Population: Persons located outside of the site property line that may be impacted by an on-site incident.
On-Site Personnel: Employees, contractors, visitors, service providers, and others present at the facility.
Operating Procedures: Written, step by step instructions and information necessary to operate equipment, compiled in one document including operating instructions, process descriptions, operating limits, chemical hazards, and safety equipment requirements.
Operator: An individual responsible for monitoring, controlling, and performing tasks as necessary to ac-complish the productive activities of a system. Operator is also used in a generic sense to include people who perform a wide range of tasks (e.g., readings, calibration, incidental maintenance, manage loading/un-loading, and storage of hazardous materials).

Revision History CHEF Manual
- 181 -
OSHA Process Safety Management (OSHA PSM): A U.S. regulatory standard that requires use of a 14-element management system to help prevent or mitigate the effects of catastrophic releases of chemicals or energy from processes covered by the regulations (49 CFR 1910.119).
Parameter: A quantity describing the relation of variables within a given system. Note: A parameter may be constant or depend on the time or the magnitude of some system variables.
Passive System: A system in which failures are only revealed by testing or when a demand has occurred.
Personal Protective Equipment (PPE): Equipment designed to protect employees from serious workplace injuries or illnesses resulting from contact with chemical, radiological, physical, electrical, mechanical, or other workplace hazards. Besides face shields, safety glasses, hard hats, and safety shoes, PPE includes a variety of devices and garments, such as goggles, coveralls, gloves, vests, earplugs, and respirators.
Physical Explosion: The catastrophic rupture of a pressurized gas/vapor-filled vessel by means other than reaction, or the sudden phase-change from liquid to vapor of a superheated liquid.
Piping and Instrument Diagram (P&ID): A diagram that shows the details about the piping, vessels, and instrumentation.
Pool Fire: The combustion of material evaporating from a layer of liquid at the base of the fire.
Potential Explosion Site (PES): A volume within a plant with sufficient congestion and/or confinement that a flammable vapor cloud ignited there could likely develop into an explosion.
Pre-Initiating Safeguard: A safeguard that acts to prevent an initiating event or cause from occurring.
Preventive Safeguard: A safeguard that forestalls the occurrence of a particular loss event, given that an initiating cause has occurred; i.e., a safeguard that intervenes between an initiating cause and a loss event in an incident sequence.
Prevention: The process of eliminating or preventing the hazards or risks associated with a particular activity. Prevention is sometimes used to describe actions taken in advance to reduce the likelihood of an undesired event.
Probability: The expression for the likelihood of occurrence of an event or an event sequence during an interval of time, or the likelihood of success or failure of an event on test or on demand. Probability is ex-pressed as a dimensionless number ranging from 0 to 1.
Probit: A random variable with a mean of 5 and a variance of 1, which is used in various effect models. Probit-based models derived from experimental dose-response data, are often used to estimate the health effect that might result based upon the intensity and duration of an exposure to a harmful substance or condition (e.g., exposure to a toxic atmosphere, or a thermal radiation exposure).
Process Hazard Analysis: An organized effort to identify and evaluate hazards associated with processes and operations to enable their control. This review normally involves the use of qualitative techniques to identify and assess the significance of hazards. Conclusions and appropriate recommendations are devel-oped. Occasionally, quantitative methods are used to help prioritized risk reduction.
Process Safety Management Systems: Comprehensive sets of policies, procedures, and practices de-signed to ensure that barriers to episodic incidents are in place, in use, and effective.
Process Safety: A disciplined framework for managing the integrity of operating systems and processes
handling hazardous substances by applying good design principles, engineering, and operating practices. It
Revision History CHEF Manual
- 182 -
deals with the prevention and control of incidents that have the potential to release hazardous materials or
energy. Such incidents can cause toxic effects, fire, or explosion and could ultimately result in serious inju-
ries, property damage, lost production, and environmental impact.
Process Safety Review: An inspection of a plant/process unit, drawings, procedures, emergency plans and/or management systems, etc., usually by an on-site team and usually problem-solving in nature. (See "Audit" for contrast).
Qualitative: Based primarily on description and comparison using historical experience and engineering judgment, with little quantification of the hazards, consequences, likelihood, or level of risk.
Quantitative Risk Analysis: The systematic development of numerical estimates of the expected frequency and severity of potential incidents associated with a facility or operation based on engineering evaluation and mathematical techniques.
Recognized and Generally Accepted Good Engineering Practice (RAGAGEP): a term originally used
by OSHA, stems from the selection and application of appropriate engineering, operating, and maintenance
knowledge when designing, operating and maintaining chemical facilities with the purpose of ensuring
safety and preventing process safety incidents. It involves the application of engineering, operating or
maintenance activities derived from engineering knowledge and industry experience based upon the evalu-
ation and analyses of appropriate internal and external standards, applicable codes, technical reports, guid-
ance, or recommended practices or documents of a similar nature. RAGAGEP can be derived from singular
or multiple sources and will vary based upon individual facility processes, materials, service, and other en-
gineering considerations.
Reliability: Core attribute of a protection layer related to the probability that the equipment operates accord-ing to its specification for a stated period of time under all relevant conditions.
Risk: A measure of human injury, environmental damage, or economic loss in terms of both the incident likelihood and the magnitude of the loss or injury.
Risk Analysis: The estimation of scenario, process, facility and/or organizational risk by identifying potential incident scenarios, then evaluating and combining the expected frequency and impact of each scenario hav-ing a consequence of concern, then summing the scenario risks, if necessary, to obtain the total risk estimate for the level at which the risk analysis is being performed.
Risk-Based Process Safety (RBPS): The Center for Chemical Process Safety's process safety manage-ment system approach that uses risk-based strategies and implementation tactics that are commensurate with the risk-based need for process safety activities, availability of resources, and existing process safety culture to design, correct, and improve process safety management activities.
Risk Matrix: A tabular approach for presenting risk tolerance criteria, typically involving graduated scales of incident likelihood on the Y-axis and incident consequences on the X-Axis.
Risk Management: The systematic application of management policies, procedures, and practices to the tasks of analyzing, assessing, and controlling risk in order to protect employees, the general public, the en-vironment, and company assets, while avoiding business interruptions. Includes decisions to use suitable engineering and administrative controls for reducing risk.
Risk Tolerance Criteria: A predetermined measure of risk used to aid decisions about whether further efforts to reduce the risk are warranted.
Revision History CHEF Manual
- 183 -
Safeguard: Any device, system, or action that either interrupts the chain of events following an initiating event or that mitigates the consequences. A safeguard can be an engineered system or an administrative control. Not all safeguards meet the requirements of an IPL.
Safety Instrumented System: A separate and independent combination of sensors, logic solvers, final elements, and support systems that are designed and managed to achieve a specified safety integrity level. A SIS may implement one or more Safety Instrumented Functions (SIFs).
Scenario: A detailed description of an unplanned event or incident sequence that results in a loss event and its associated impacts, including the success or failure of safeguards involved in the incident sequence.
Screening Criteria: A predetermined measure, standard, or rule (typically based upon company or regula-tory requirements), on which a judgment or decision can be based.
Severity: The maximum credible consequences or effects, assuming no safeguards are in place.
Screening Tool: A simplified model with limited capabilities, suitable for screening-level studies.
Societal Risk: A measure of risk to a group of people. It is most often expressed in terms of the frequency distribution of multiple casualty events.
Source Term: The release parameters (e.g. magnitude, rate, duration, orientation, temperature) that are the initial conditions for determining the consequences of the loss event for a hazardous material and/or energy release to the surroundings. For vapor dispersion modeling, it is the estimation, based on the release speci-fication, of the actual cloud conditions of temperature, aerosol content, density, size, velocity and mass to be input into the dispersion model.
Tolerable Risk Level: The maximum level of risk of a particular technical process or condition that is re-garded as tolerable in the context of the circumstances in questions.
Vapor Cloud Explosion (VCE): The explosion resulting from the ignition of a cloud of flammable vapor, gas, or mist in which flame speeds accelerate to sufficiently high velocities to produce significant overpressure.
Virtual Source: The offset in distance to the specified source of a gas or vapor release that results in a maximum concentration of 100% at the source using a Gaussian dispersion model.
What-If Analysis: A scenario-based hazard evaluation procedure using a brainstorming approach in which typically a team that includes one or more persons familiar with the subject process asks questions or voices concerns about what could go wrong, what consequences could ensue, and whether the existing safeguards are adequate.
Worst Case: A conservative (high) estimate of the consequences of the most severe incident identified.

Revision History CHEF Manual
- 184 -
APPENDIX A – REACTIVE CHEMICALS CHECKLIST
This checklist is adapted from a CCPS Safety Alert; A Checklist for Inherently Safer Chemical Reaction Pro-cess Design and Operation, March 1, 2004. Copyright 2004.
1.1 Chemical reaction hazard identification
1. Know the heat of reaction for the intended and other potential chemical reactions.
There are a number of techniques for measuring or estimating heat of reaction, including various calorimeters, plant heat and energy balances for processes already in operation, analogy with similar chemistry (confirmed by a chemist who is familiar with the chemistry), literature resources, supplier contacts, and thermodynamic estimation techniques. You should identify all potential reactions that could occur in the reaction mixture and understand the heat of reaction of these reactions.
2. Calculate the maximum adiabatic temperature for the reaction mixture.
Use the measured or estimated heat of reaction, assume no heat removal, and that 100% of the reactants actually react. Compare this temperature to the boiling point of the reaction mixture. If the maximum adiabatic reaction temperature exceeds the reaction mixture boiling point, the reaction is capable of generating pres-sure in a closed vessel and you will have to evaluate safeguards to prevent uncontrolled reaction and con-sider the need for emergency pressure relief systems.
3. Determine the stability of all individual components of the reaction mixture at the maximum adiabatic re-action temperature.
This might be done through literature searching, supplier contacts, or experimentation. Note that this does not ensure the stability of the reaction mixture because it does not account for any reaction among compo-nents, or decomposition promoted by combinations of components. It will tell you if any of the individual components of the reaction mixture can decompose at temperatures which are theoretically attainable. If any components can decompose at the maximum adiabatic reaction temperature, you will have to understand the nature of this decomposition and evaluate the need for safeguards including emergency pressure relief systems.
4. Understand the stability of the reaction mixture at the maximum adiabatic reaction temperature. A
re there any chemical reactions, other than the intended reaction, which CCPS Safety Alert, March 1, 2004 3 can occur at the maximum adiabatic reaction temperature? Consider possible decomposition reactions, particularly those which generate gaseous products. These are a particular concern because a small mass of reacting condensed liquid can generate a very large volume of gas from the reaction products, resulting in rapid pressure generation in a closed vessel. Again, if this is possible, you will have to understand how these reactions will impact the need for safeguards, including emergency pressure relief systems. Understanding the stability of a mixture of components may require laboratory testing.
5. Determine the heat addition and heat removal capabilities of the pilot plant or production reactor.
Don’t forget to consider the reactor agitator as a source of energy – about 2550 Btu/hour/horsepower. Un-derstand the impact of variation in conditions on heat transfer capability. Consider factors such as reactor fill level, agitation, fouling of internal and external heat transfer surfaces, variation in the temperature of heating and cooling media, variation in flow rate of heating and cooling fluids.

Revision History CHEF Manual
- 185 -
6. Identify potential reaction contaminants. In particular, consider possible contaminants which are ubiquitous in a plant environment, such as air, water, rust, oil and grease.
Think about possible catalytic effects of trace metal ions such as sodium, calcium, and others commonly present in process water. These may also be left behind from cleaning operations such as cleaning equip-ment with aqueous sodium hydroxide. Determine if these materials will catalyze any decomposition or other reactions, either at normal conditions or at the maximum adiabatic reaction temperature.
7. Consider the impact of possible deviations from intended reactant charges and operating conditions.
For example, is a double charge of one of the reactants a possible deviation, and, if so, what is the impact? This kind of deviation might affect the chemistry which occurs in the reactor – for example, the excess material charged may react with the product of the intended reaction or with a reaction solvent. The resulting unantic-ipated chemical reactions could be energetic, generate gases, or produce unstable products. Consider the impact of loss of cooling, agitation, and temperature control, insufficient solvent or fluidizing media, and re-verse flow into feed piping or storage tanks.
8. Identify all heat sources connected to the reaction vessel and determine their maximum temperature.
Assume all control systems on the reactor heating systems fail to the maximum temperature. If this temper-ature is higher than the maximum adiabatic reaction temperature, review the stability and reactivity infor-mation with respect to the maximum temperature to which the reactor contents could be heated by the vessel heat sources.
9. Determine the minimum temperature to which the reactor cooling sources could cool the reaction mixture.
Consider potential hazards resulting from too much cooling, such as freezing of reaction mixture components, fouling of heat transfer surfaces, increase in reaction mixture viscosity reducing mixing and heat transfer, precipitation of dissolved solids from the reaction mixture, and a reduced rate of reaction resulting in a haz-ardous accumulation of unreacted material.
10. Consider the impact of higher temperature gradients in plant scale equipment compared to a laboratory or pilot plant reactor.
Agitation is almost certain to be less effective in a plant reactor, and the temperature of the reaction mixture near heat transfer surfaces may be higher (for systems being heated) or lower (for systems being cooled) than the bulk mixture temperature. For exothermic reactions, the temperature may also be higher near the point of introduction of reactants because of poor mixing and localized reaction at the point of reactant contact. The location of the reactor temperature sensor relative to the agitator, and to heating and cooling surfaces may impact its ability to provide good information about the actual average reactor temperature. These prob-lems will be more severe for very viscous systems, or if the reaction mixture includes solids which can foul temperature measurement devices or heat transfer surfaces. Either a local high temperature or a local low temperature could cause a problem. A high temperature, for example, near a heating surface, could result in a different chemical reaction or decomposition at the higher temperature. A low temperature near a cooling coil could result in slower reaction and a buildup of unreacted material, increasing the potential chemical energy of reaction available in the reactor. If this material is subsequently reacted because of an increase in temperature or other change in reactor conditions, there is a possibility of an uncontrolled reaction due to the unexpectedly high quantity of unreacted material available.
Revision History CHEF Manual
- 186 -
11. Understand the rate of all chemical reactions.
It is not necessary to develop complete kinetic models with rate constants and other details, but you should understand how fast reactants are consumed and generally how the rate of reaction increases with temper-ature. Thermal hazard calorimetry testing can provide useful kinetic data.
12. Consider possible vapor phase reactions.
These might include combustion reactions, other vapor phase reactions such as the reaction of organic va-pors with a chlorine atmosphere, and vapor phase decomposition of materials such as ethylene oxide or organic peroxide.
13. Understand the hazards of the products of both intended and unintended reactions.
For example, does the intended reaction, or a possible unintended reaction, form viscous materials, solids, gases, corrosive products, highly toxic products, or materials which will swell or degrade gaskets, pipe linings, or other polymer components of a system? If you find an unexpected material in reaction equipment, deter-mine what it is and what impact it might have on system hazards. For example, in an oxidation reactor, solids were known to be present, but nobody knew what they were. It turned out that the solids were pyrophoric, and they caused a fire in the reactor.
14. Consider doing a Chemical Interaction Matrix and/or a Chemistry Hazard Analysis.
These techniques can be applied at any stage in the process life cycle, from early research through an operating plant. They are intended to provide a systematic method to identify chemical interaction hazards and hazards resulting from deviations from intended operating conditions.
A.2 Reaction process design considerations
1. Rapid reactions are desirable.
In general, you want chemical reactions to occur immediately when the reactants come into contact. The reactants are immediately consumed and the reaction energy quickly released, allowing you to control the reaction by controlling the contact of the reactants. However, you must be certain that the reactor is capable of removing all of the heat and any gaseous products generated by the reaction.
2. Avoid batch processes in which all of the potential chemical energy is present in the system at the start of the reaction step.
If you operate this type of process, know the heat of reaction and be confident that the maximum adiabatic temperature and pressure are within the design capabilities of the reactor.
3. Use gradual addition or “semi-batch” processes for exothermic reactions.
The inherently safer way to operate exothermic reaction process is to determine a temperature at which the reaction occurs very rapidly. Operate the reaction at this temperature, and feed at least one of the reactants gradually to limit the potential energy contained in the reactor. This type of gradual addition process is often called “semi-batch.” A physical limit to the possible rate of addition of the limiting reactant is desirable – a metering pump, flow limited by using a small feed line, or a restriction orifice, for example. Ideally, the limiting reactant should react immediately, or very quickly, when it is charged. The reactant feed can be stopped if necessary if there is any kind of a failure (for example, loss of cooling, power failure, loss of agitation) and the reactor will contain little or no potential chemical energy from unreacted material. Some way to confirm

Revision History CHEF Manual
- 187 -
actual reaction of the limiting reagent is also desirable. A direct measurement is best, but indirect methods such as monitoring of the demand for cooling from an exothermic batch reactor can also be effective.
4. Avoid using control of reaction mixture temperature as the only means for limiting the reaction rate.
If the reaction produces a large amount of heat, this control philosophy is unstable – an increase in temper-ature will result in faster reaction and even more heat being released, causing a further increase in temper-ature and more rapid heat release. If there is a large amount of potential chemical energy from reactive materials, a runaway reaction results. This type of process is vulnerable to mechanical failure or operating error. A false indication of reactor temperature can lead to a higher than expected reaction temperature and possible runaway because all of the potential chemical energy of reaction is available in the reactor. Many other single failures could lead to a similar consequence – a leaking valve on the heating system, operator error in controlling reactor temperature, failure of software or hardware in a computer control system.
5. Account for the impact of vessel size on heat generation and heat removal capabilities of a reactor.
Remember that the heat generated by a reactive system will increase more rapidly than the capability of the system to remove heat when the process is operated in a larger vessel. Heat generation increases with the volume of the system – by the cube of the linear dimension. Heat removal capability increases with the surface area of the system, because heat is generally only removed through an external surface of the reactor. Heat removal capability increases with the square of the linear dimension. A large reactor is effectively adia-batic (zero heat removal) over the short time scale (a few minutes) in which a runaway reaction can occur. Heat removal in a small laboratory reactor is very efficient, even heat leakage to the surroundings can be significant. If the reaction temperature is easily controlled in the laboratory, this does not mean that the tem-perature can be controlled in a plant scale reactor. You need to obtain the heat of reaction data discussed previously to confirm that the plant reactor is capable of maintaining the desired temperature.
6. Use multiple temperature sensors, in different locations in the reactor for rapid exothermic reactions.
This is particularly important if the reaction mixture contains solids, is very viscous, or if the reactor has coils or other internal elements which might inhibit good mixing.
7. Avoid feeding a material to a reactor at a higher temperature than the boiling point of the reactor contents.
This can cause rapid boiling of the reactor contents and vapor generation.
A.3 Resources and Publications
There are many valuable books and other resources to help in understanding and managing reactive chem-istry hazards. Some particularly useful resources include:
• American Institute of Chemical Engineers, Center for Chemical Process Safety, Safety Alert: Reactive Material Hazards, New York, 2001.
• Bretherick’s Handbook of Reactive Chemical Hazards, Butterworth-Heineman, 1999.
• Chemical Reactivity Worksheet, U. S. National Oceanic and Atmospheric Administration, http://re-sponse.restoration.noaa.gov/chemaids/react.html
• American Institute of Chemical Engineers, Center for Chemical Process Safety, Guidelines for Safe Stor-age and Handling of Reactive Materials, 1995.
Revision History CHEF Manual
- 188 -
• American Institute of Chemical Engineers, Center for Chemical Process Safety, Guidelines for Chemical Reactivity Evaluation and Application to Process Design, 1995.
• United Kingdom Health and Safety Executive, Designing and Operating Safe Chemical Reaction Pro-cesses, 2000.
• Barton, J., and R. Rogers, Chemical Reaction Hazards: A Guide to Safety, Gulf Publishing Company, 1997.
• Johnson, R. W., S. W. Rudy, and S. D. Unwin. Essential Practices for Managing Chemical Reactivity Hazards. New York: American Institute of Chemical Engineers, Center for Chemical Process Safety, 2003.
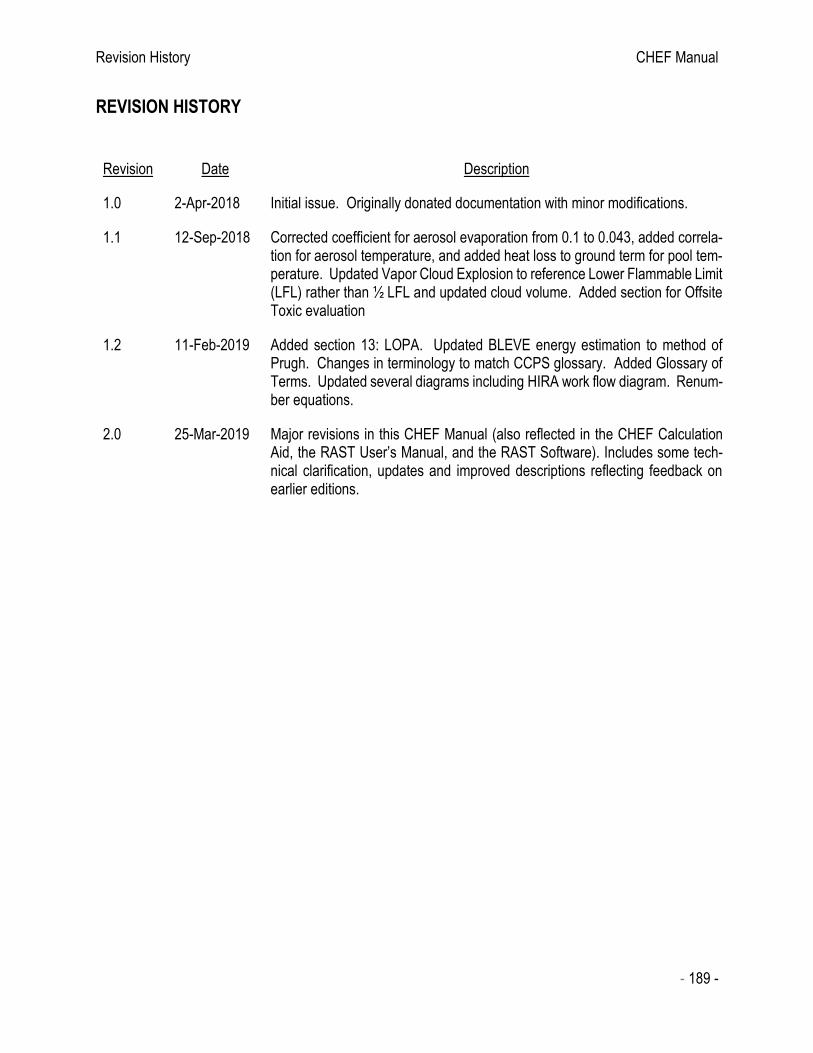
Revision History CHEF Manual
- 189 -
REVISION HISTORY
Revision Date Description
1.0 2-Apr-2018 Initial issue. Originally donated documentation with minor modifications.
1.1 12-Sep-2018 Corrected coefficient for aerosol evaporation from 0.1 to 0.043, added correla-tion for aerosol temperature, and added heat loss to ground term for pool tem-perature. Updated Vapor Cloud Explosion to reference Lower Flammable Limit (LFL) rather than ½ LFL and updated cloud volume. Added section for Offsite Toxic evaluation
1.2 11-Feb-2019 Added section 13: LOPA. Updated BLEVE energy estimation to method of Prugh. Changes in terminology to match CCPS glossary. Added Glossary of Terms. Updated several diagrams including HIRA work flow diagram. Renum-ber equations.
2.0 25-Mar-2019 Major revisions in this CHEF Manual (also reflected in the CHEF Calculation Aid, the RAST User’s Manual, and the RAST Software). Includes some tech-nical clarification, updates and improved descriptions reflecting feedback on earlier editions.