chemical and consumer sector: diaper value chain survey
TRANSCRIPT

DISCLOSURE APPENDIX AT THE BACK OF THIS REPORT CONTAINS IMPORTANT DISCLOSURES, ANALYST CERTIFICATIONS, AND THE STATUS OF NON-US ANALYSTS. US Disclosure: Credit Suisse does and seeks to do
business with companies covered in its research reports. As a result, investors should be aware that the Firm may have a conflict of interest that could affect the objectivity of this report. Investors should consider this report as only a single factor in making their investment decision.
CREDIT SUISSE SECURITIES RESEARCH & ANALYTICS BEYOND INFORMATION®
Client-Driven Solutions, Insights, and Access
21 January 2015
Asia Pacific/Japan
Equity Research
Chemical and Consumer Sector:
Diaper value chain survey Connections Series
Japan’s showpiece product entailing advanced technology from SAP to finished diapers
■ Toiletries and chemicals industries marked by intensifying global competition: Japanese chemical manufacturers expect petrochemicals supply–
demand to loosen due to growth in supply as a result of the emergence of shale gas and low-priced gas in the Middle East. In electronics, although Japanese
companies are competitive in advanced materials, competition with Chinese and South Korean manufacturers is intensifying, especially in LCDs. Worldwide
competition is also heating up in the toiletries segment. Global majors and Asia's new entrants are stepping up local production of cosmetics and daily necessities
with an eye to markets in Southeast Asia and China, which are experiencing remarkable economic growth.
■ Expect longer-term growth in diapers: In this environment, while Japan's
market for baby diapers is maturing, demand for adult diapers is increasing
rapidly due to the growing number of elderly people. Populations are also aging in China and Southeast Asia, and we believe that this, coupled with demand for
baby diapers in emerging markets, should drive up global demand in the longer term. Japanese manufacturers of diapers and their component materials should
benefit from this demand growth.
■ Focal points: Diapers, which are a general consumer good worldwide, feature
Japanese technological innovations, and the barrier to entry into premium products is high. They are a rare differentiated product at a time when daily
necessities are easy to commoditize. From a chemical sector perspective, super-absorbent polymer (SAP), which is the focus of this report, is one of three areas
in which Japan should be able to retain world-class technological prowess and competitiveness and maintain its technological edge (the other two being silicon
wafers and carbon fiber). SAP is made to the unique specifications of each diaper maker and involves joint development by SAP and diaper makers. Only
Japanese and major overseas manufacturers possess this technical expertise; Chinese and other manufacturers have been unable to penetrate the global
diaper market due to their lack of SAP-related technical expertise. Three Japanese companies (Nippon Shokubai, Sanyo Chemical and Sumitomo Seika)
together command nearly half the global market (44%).
■ Stocks to watch: Kao (4452, OUTPERFORM, TP ¥5,500): Kao's diapers are
growing more popular as awareness of their high quality spreads, especially among affluent consumers in mainland China. The company is also gaining
domestic market share. We intend to focus on the company's sales expansion strategy for as-yet undeveloped Southeast Asian markets.
■ Sanyo Chemical Industries (4471, OUTPERFORM, TP ¥950): An SAP pioneer,
Sanyo Chemical has considerable technological prowess. The company should
gain the most in earnings from the weaker yen and lower naphtha prices among the stocks in our chemicals and synthetic fiber sector coverage.
The Credit Suisse Connections Series
leverages our exceptional breadth of
macro and micro research to deliver
incisive cross-sector and cross-border
thematic insights for our clients.
Research Analysts
Masami Sawato
81 3 4550 9729
Masashi Mori
81 3 4550 9695
21 January 2015
Chemical and Consumer Sector: Diaper value chain survey 2
Table of contents Japan's globally competitive diaper industry 3
Reasons for focus on diaper industry 3 Stocks to watch 4
Diaper market overview 5 Asia the largest segment of a ¥6tn market 5 Emerging markets set for higher penetration rate and growth in per capita usage 7 Keywords for the Chinese market: premium diapers, pants-type diapers, and e-
commerce 8 Japanese rivals take on Unicharm’s stronghold in Southeast Asia 13 Growth in baby diaper exports and strong demand for adult diapers in Japan 15
Basic materials 20 Diaper structure and business overview of related chemical makers 20 Japan leads with top class SAP technology and production capacity 23
SAP makers in spotlight 25 Sustained growth in SAP demand 25 Price trends 27 Japanese SAP makers 27
Japanese manufacturers also dominant in nonwoven fabric and other materials 31 Nonwoven fabric 31 Microporous film 33 Hot-melt adhesive 33
Stocks to watch 34 Kao (4452, OUTPERFORM, TP ¥5,500) 34 Sanyo Chemical Industries (4471, OUTPERFORM, TP ¥950) 35

21 January 2015
Chemical and Consumer Sector: Diaper value chain survey 3
Japan's globally competitive diaper industry Reasons for focus on diaper industry
We expect supply–demand of basic chemicals such as ethylene to loosen due to growth in
supply as a result of the emergence of shale gas and low-priced gas in the Middle East. In
electronics, although Japanese companies are competitive in advanced materials,
competition with Chinese and South Korean manufacturers is intensifying, especially in
LCDs.
In contrast, it is easy to draw up projections for diapers—a daily necessity—based on
countries' demographic trends and economic foundations. While Japan's market for baby
diapers is maturing, demand for adult diapers is increasing rapidly due to the growing
number of elderly people. Populations are also aging in China and Southeast Asia, and
this combined with demand for baby diapers in emerging markets should drive up global
demand in the longer term.
Generally speaking, the baby diaper market takes off when per capita GDP breaks
through the $3,000 level, while the disposable adult diaper market does so when per
capita GDP exceeds $10,000. Asian countries' economic strength is growing steadily. Per
capita GDP in 2013 was $10,457 in Malaysia, $6,959 in China, $5,676 in Thailand and
$3,510 in Indonesia, all levels sufficient for diaper use to take off in earnest. The Asian
region (including Japan) is now the largest baby diaper market, accounting for around 30%
of the global total (on a sales volume basis). We see substantial worldwide growth
potential, including in Africa, Latin America and Asia, where we expect populations and
economies to grow.
The leading Japanese diaper makers are Unicharm (8113), Kao, and Daio Paper (3880).
We intend to focus on Kao. The company has been gaining share in China and Japan
since mid-2013, and we believe sales grew strongly in 2014. We think this trend will likely
remain in place from 2015. We intend to focus on the company's sales expansion strategy
for as-yet underdeveloped Southeast Asian markets. With the company having entered
the market late, we expect investor expectations will hinge on how it recovers lost ground.
Among diaper raw materials makers, we intend to focus on Sanyo Chemical. In 1978, it
became the first company in the world to commercially produce super-absorbent polymers
(SAP) used as absorption material in disposable diapers. It currently ranks fifth in the
world in SAP production capacity behind Nippon Shokubai (4114), BASF, Evonik and
Sumitomo Seika (4008). Sanyo Chemical has advanced technology. It is the only
manufacturer in the world employing two SAP production processes. This allows it to offer
two kinds of SAP, one with high absorption capacity and one with fast absorption rate. We
believe the advantage afforded by this favorably positions the company to benefit from
global growth in disposable diaper demand over the medium term. The fact that it is
expanding production capacity for new grades of SAP with superior urine diffusion
capability and increased absorption capacity is also significant, as the launch of these new
products promise to drive growth exceeding that in the market as a whole.
Loosening petrochemical
supply–demand, sustained
competition in electronic
materials
Expectations of longer-term
growth in diapers
Diaper use growing in Asian
countries
Kao is a highly competitive
diaper maker with growth
potential
Focusing on Sanyo
Chemical among raw
materials makers

21 January 2015
Chemical and Consumer Sector: Diaper value chain survey 4
Stocks to watch
Kao (4452, OUTPERFORM, TP ¥5,500)
Kao's diapers are growing more popular as awareness of their high quality spreads,
especially among affluent consumers in mainland China. The company is also gradually
gaining share the Russian market. Demand for high-quality, high-price diapers is
increasing in Russia, as it is in China. Kao plans a full-fledged entry into Indonesia at the
start of 2015. The company already has strength in the traditional small retail outlets in
Indonesia known as warung, which are a key distribution channel, via its sanitary products
for women, and we see considerable longer-term growth potential.
Sanyo Chemical Industries (4471, OUTPERFORM, TP ¥950)
An SAP pioneer, Sanyo Chemical has considerable technological prowess. We think the
company will benefit from increasing demand for diapers over the medium term via the
launch of new-grade products and worldwide development. The share price in our view
does not reflect market growth-beating expansion in earnings. The company should
experience the largest earnings impact from the weaker yen and lower naphtha prices
among the stocks in our chemicals and synthetic fiber sector coverage. We also expect
positive surprises in near-term earnings.
Growth in China, Russia,
focus on Indonesia in 2015
SAP pioneer
21 January 2015
Chemical and Consumer Sector: Diaper value chain survey 5
Diaper market overview Asia the largest segment of a ¥6tn market
Expect global demand to grow by a steady 4–5% per year
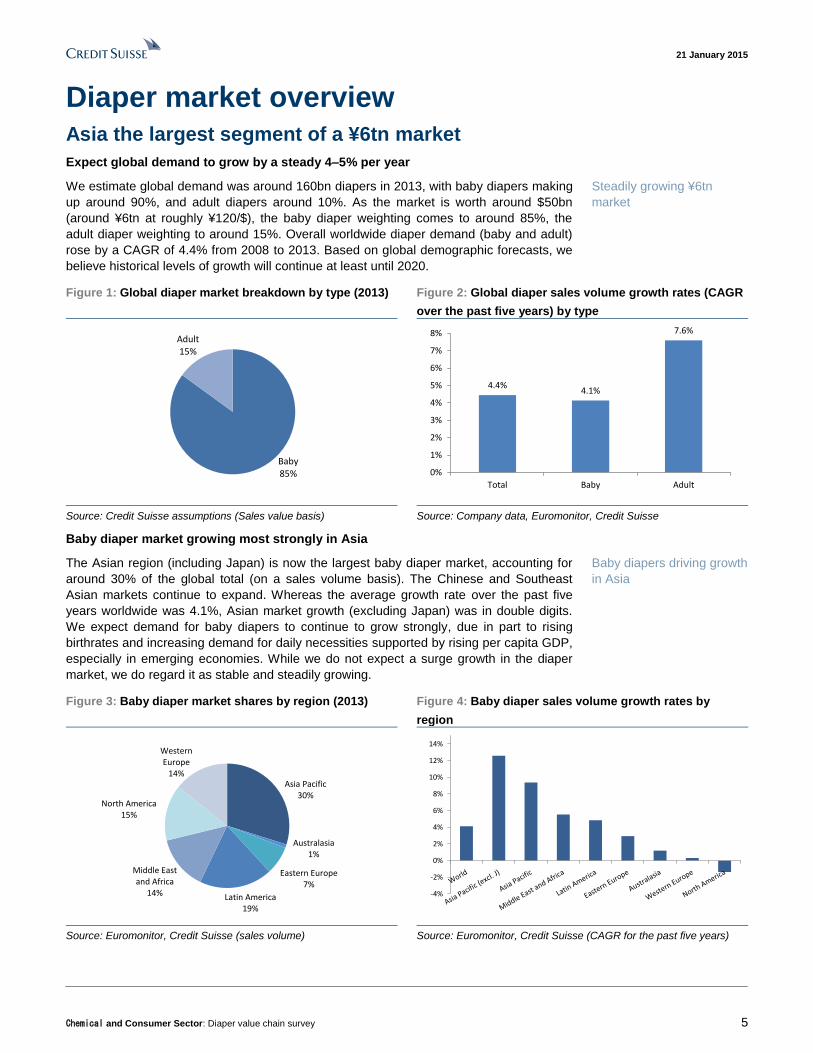
We estimate global demand was around 160bn diapers in 2013, with baby diapers making
up around 90%, and adult diapers around 10%. As the market is worth around $50bn
(around ¥6tn at roughly ¥120/$), the baby diaper weighting comes to around 85%, the
adult diaper weighting to around 15%. Overall worldwide diaper demand (baby and adult)
rose by a CAGR of 4.4% from 2008 to 2013. Based on global demographic forecasts, we
believe historical levels of growth will continue at least until 2020.
Figure 1: Global diaper market breakdown by type (2013) Figure 2: Global diaper sales volume growth rates (CAGR
over the past five years) by type
Baby85%
Adult15%
4.4%4.1%
7.6%
0%
1%
2%
3%
4%
5%
6%
7%
8%
Total Baby Adult
Source: Credit Suisse assumptions (Sales value basis) Source: Company data, Euromonitor, Credit Suisse
Baby diaper market growing most strongly in Asia
The Asian region (including Japan) is now the largest baby diaper market, accounting for
around 30% of the global total (on a sales volume basis). The Chinese and Southeast
Asian markets continue to expand. Whereas the average growth rate over the past five
years worldwide was 4.1%, Asian market growth (excluding Japan) was in double digits.
We expect demand for baby diapers to continue to grow strongly, due in part to rising
birthrates and increasing demand for daily necessities supported by rising per capita GDP,
especially in emerging economies. While we do not expect a surge growth in the diaper
market, we do regard it as stable and steadily growing.
Figure 3: Baby diaper market shares by region (2013) Figure 4: Baby diaper sales volume growth rates by
region
Asia Pacific30%
Australasia1%
Eastern Europe7%
Latin America19%
Middle East and Africa
14%
North America15%
Western Europe
14%
-4%
-2%
0%
2%
4%
6%
8%
10%
12%
14%
Source: Euromonitor, Credit Suisse (sales volume) Source: Euromonitor, Credit Suisse (CAGR for the past five years)
Steadily growing ¥6tn
market
Baby diapers driving growth
in Asia

21 January 2015
Chemical and Consumer Sector: Diaper value chain survey 6
Industrialized nations are the main market for adult diapers; Asia, Latin America
look promising further ahead
North America, Japan, and western Europe account for nearly 80% of worldwide adult
diaper sales (on a volume basis). We think demand in these industrialized nations will
likely continue to increase for now. Long term, we look for the Asian (excluding Japan) and
Latin American markets to expand.
Product development expertise with respect to adult diapers has accumulated early in the
Japanese market, which has experienced a decline in the number of children and an aging
population sooner than many other countries. We believe Japanese companies will
consequently have a strong competitive edge in Asian adult diaper markets. Asian
markets' entry into a phase of full-fledged demand expansion could well drive new growth
for Japanese companies.
Figure 5: Adult diaper market shares by region (2013) Figure 6: Adult diaper sales volume growth rates by
region
Japan25%
Non Japan Asia7%
Australasia2%
Eastern Europe3%
Latin America9%
Middle East and Africa
1%
North America30%
Western Europe
23%
-4%
-2%
0%
2%
4%
6%
8%
10%
12%
14%
Source: Euromonitor, Credit Suisse (sales volume) Source: Euromonitor, Credit Suisse (CAGR for the past 5 years)
Demographic trend forecasts imply longer-term diaper demand growth of at least
4% per year
Based on global population, birthrate and other forecasts and certain assumptions
including with regard to frequency of use, we estimate that sales of baby diapers will grow
by 4.4% per year over ten years from 2010 to 2020. We assume that demand for adult
diapers will similarly increase as the number of people aged 65 and over worldwide is
expected to increase by around 3% per year. We conclude that diaper demand as a whole
will grow by 4.3% per year.
Figure 7: Diaper demand forecasts based on demographic trend estimates (growth outlook of 4.3% per year in 2010–20)
Total population (2010) 2010-2020 annual avg 2020 total pop Birthrate (2010-2015 est)
(1,000s) growth est (%) est (1,000s) (per 1,000) 2010 2020
Developed countries 1,240,935 0.3 1,274,929 11.2 13,898 14,279 1,848
Developing countries 5,675,249 1.3 6,441,820 21.3 120,883 137,211 65,270
Global 6,916,184 1.2 7,716,749 19.5 134,781 151,490 67,118
■ Assumptions
・Developed countries: Ave. diaper use 3.5yrs from birth, ave. diaper replacement 4 per day
・Nearly 95% of total infants in developed countries wearing disposable diapers, same level in 2020
・Diaper usage rate in developing countries rising from around 10% in 2010 to nearly 20% in 2020
Total population (2010) 2020 total population Est of average growth in
(1,000s) est (1,000s) 2010 2020 (est) 2010 2020 (est) poulation over 65 (%)
Developed countries 1,240,935 1,274,929 15.9 19.0 197,309 242,237 2.1
Developing countries 5,675,249 6,441,820 5.8 7.5 329,164 483,137 3.9
Global 6,916,184 7,716,749 7.6 9.4 526,473 725,373 3.3
■ Conclusions
・We estimate diaper demand at around 140bn pieces in 2010, c90% for infant-use diapers, c10% for adult-use diapers
・We thus calculate that infant-use diaper demand will rise 4.4% over the next five years
・We estimate that the over 65 population will grow by around 3% annually, with demand for adult-use diapers rising at the same rate (3% annually)
・Based on these assumptions, we forecast that diaper demand will rise 4.3% annually in 2010-2020
Assumptions for infant-use diapers
Births per year (1,000s) Est of aggregated growth in consumption for infants'
diapers 2010-2020 (tons)
Assumptions for adult diapers
Population over 65 (%) Population over 65 (1,000s)
Note 1: Population growth rates, birthrates, and ratios of people aged 65 and over reference United Nations estimates.
Note 2: Population forecasts, etc., are Credit Suisse estimates based on IMF population data.
Source: IMF, UN, Statistics Bureau, Credit Suisse estimates
Industrialized nations
account for 80% of adult
diaper sales
Expecting annual growth of
4.3% through 2020

21 January 2015
Chemical and Consumer Sector: Diaper value chain survey 7
Emerging markets set for higher penetration rate and
growth in per capita usage
Joining the ‘per capita GDP of $3,000’ club
Diaper industry players (henceforth defined with regard to baby diapers only) view that a
country's diaper market takes off when per capita GDP breaks through the $3,000 level.
Based on this theory, Indonesia looks like one of the most promising markets, as per
capita GDP has already exceeded $3,000, and we estimate that the country has the
world's fourth-highest annual birthrate. Among emerging markets with large populations,
China, Brazil, and Russia are already members of the $3,000 club, and we believe diaper
penetration is rising.
India also looks promising in view of its large population and high birthrate, but we believe
it will be some time yet before per capita GDP in the country exceeds $3,000. Accordingly,
we believe it will take time for diaper use to become widespread in the country. On the
other hand, sanitary product usage generally takes off when per capita GDP surpasses
$1,000. Thus, we believe India, Pakistan, Vietnam and other countries will be growth
markets for sanitary products.
Figure 8: Birthrate, GDP per capita and other basic data for top 20 most populated countries
2010 2013 2016 2019
1 China 1,386 12.1 16.8 8.2 4,437 6,959 8,859 11,071
2 India 1,252 22.8 28.5 4.9 1,430 1,509 1,893 2,366
3 United States 320 14.0 4.5 13.1 48,314 53,001 59,503 67,348
4 Indonesia 250 22.5 5.6 5.6 2,985 3,510 3,770 4,560
5 Brazil 200 - - 7.0 10,961 11,173 11,979 13,731
6 Pakistan 182 24.0 4.4 4.3 1,034 1,275 n/a n/a
7 Nigeria 174 41.7 7.3 3.4 2,396 3,082 3,824 4,167
8 Bangladesh 157 20.9 3.3 4.6 808 1,033 1,425 1,864
9 Russia 143 12.6 1.8 12.8 10,671 14,591 15,557 18,057
10 Japan 127 8.5 1.1 23.0 42,917 38,468 39,586 43,504
11 Mexico 122 17.0 2.1 6.3 9,197 10,650 11,777 13,592
12 Philippines 98 18.9 1.9 3.6 2,155 2,791 3,569 4,712
13 Vietnam 92 15.7 1.4 6.0 1,297 1,902 2,371 2,948
14 Ethiopia 94 28.8 2.7 3.3 354 518 647 813
15 Germany 83 8.1 0.7 20.4 40,496 44,999 50,097 56,209
16 Egypt 82 23.2 1.9 5.0 2,812 3,243 4,120 5,609
17 Iran 77 18.0 1.4 5.2 5,638 4,769 5,402 5,907
18 Turkey 75 17.1 1.3 6.0 10,021 10,721 11,536 13,302
19 Congo 68 - - 2.7 291 388 461 534
20 Thailand 67 14.1 0.9 8.9 4,740 5,676 6,040 7,047
Number of births
(mn)
People 65 years of age or
older (%)
Birthrate
(per 1,000)
2013 total
population (mn)
GDP per capita (USD)
Note: Birthrate is per year per 1,000 people (excluding stillbirths). UN estimates. Number of births per year derived by applying birthrates to total
populations in 2012 (IMF data). Per capita GDPs are IMF estimates.
Source: Credit Suisse from IMF, UN and Statistics Bureau data
Indonesia a promising
market

21 January 2015
Chemical and Consumer Sector: Diaper value chain survey 8
Figure 9: Baby diaper and sanitary napkin usage volume
per month
Figure 10: Daily consumption volume and penetration
rates in emerging and industrialized economies
Baby diaper Sanitary napkin
Japan 140 21
China 26 9
Indonesia 25 6
Thailand 48 8
Brazil 160 6
India 10 7
0%
20%
40%
60%
80%
100%
120%
140%
160%
180%
0.0
1.0
2.0
3.0
4.0
5.0
6.0
7.0
8.0
Indonesia Thailand China Russia Brazil Japan
Daily consumption volume (piece/day, lhs)
Penetration rate (rhs)
Source: Company data, Credit Suisse Note: 100% penetration rate = four diapers per infant per day
Source: Credit Suisse estimates based on Euromonitor data (2013)
Keywords for the Chinese market: premium diapers,
pull-up diapers, and e-commerce
E-commerce emerging as the most important sales channel; shift to premium
products gains momentum
The year 2014 heralded major changes for the Chinese diaper market, the most significant
of these in our view being rapid growth in the e-commerce channel. Representing more
than 30% of the overall market, e-commerce outpaced specialty baby care stores to
emerge as the largest sales channel. According to Unicharm’s estimates, the weighting of
the e-commerce channel in overall sales is likely to reach 40% by 2017. The main factors
for growth in the Chinese e-commerce channel include greater convenience and lower
prices. We therefore assume the e-commerce channel is likely to remain dominant in the
Chinese diaper market in the near-term.
We note a sustained trend, particularly among affluent consumers, of valuing quality over
price in the coastal areas of China, and we see imported overseas brands remaining
popular. The shift from standard and economy-types to premium diapers is gaining
momentum, and we see no factors that could hinder this trend for 2015 or beyond. It
appears only a question of time before premium diapers outpace standard-type diapers
and emerge as the product category with highest sales weighting in the market by value.
Also, awareness of pull-up (locally known as "pants-type") diapers is steadily rising in
China, where tape-type diapers (disposable diapers with resealable tapes and elasticated
leg cuffs) are the most commonly used.
Based on the trend in 2014, we believe only those companies that have strong premium
products and a pull-up diapers category as well as those adept in e-commerce sales
strategy are likely to emerge as winners going forward.
E-commerce channel grew
rapidly in 2014
Growth in premium diapers
21 January 2015
Chemical and Consumer Sector: Diaper value chain survey 9
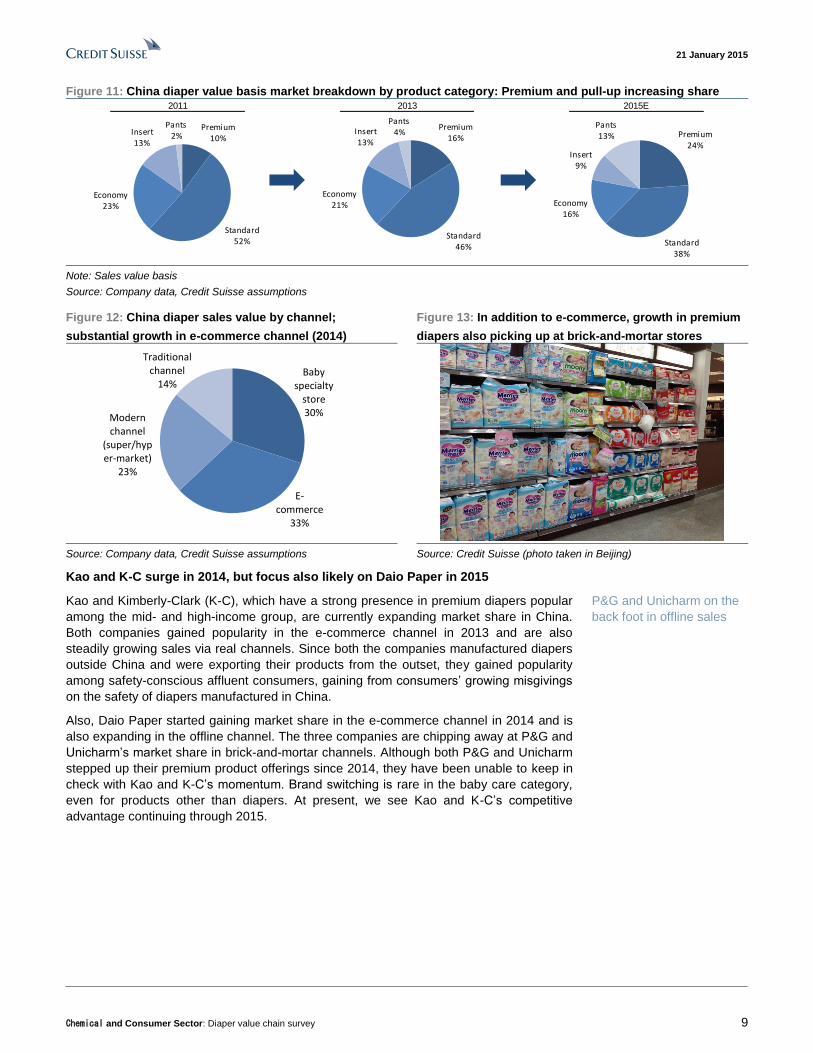
Figure 11: China diaper value basis market breakdown by product category: Premium and pull-up increasing share 2011 2013 2015E
Premium16%
Standard46%
Economy21%
Insert13%
Pants4%
Premium10%
Standard52%
Economy23%
Insert13%
Pants2% Premium
24%
Standard38%
Economy16%
Insert9%
Pants13%
Note: Sales value basis
Source: Company data, Credit Suisse assumptions
Figure 12: China diaper sales value by channel;
substantial growth in e-commerce channel (2014)
Figure 13: In addition to e-commerce, growth in premium
diapers also picking up at brick-and-mortar stores
Baby
specialty store30%
E-commerce
33%
Modern channel
(super/hyper-market)
23%
Traditional channel
14%
Source: Company data, Credit Suisse assumptions Source: Credit Suisse (photo taken in Beijing)
Kao and K-C surge in 2014, but focus also likely on Daio Paper in 2015
Kao and Kimberly-Clark (K-C), which have a strong presence in premium diapers popular
among the mid- and high-income group, are currently expanding market share in China.
Both companies gained popularity in the e-commerce channel in 2013 and are also
steadily growing sales via real channels. Since both the companies manufactured diapers
outside China and were exporting their products from the outset, they gained popularity
among safety-conscious affluent consumers, gaining from consumers’ growing misgivings
on the safety of diapers manufactured in China.
Also, Daio Paper started gaining market share in the e-commerce channel in 2014 and is
also expanding in the offline channel. The three companies are chipping away at P&G and
Unicharm’s market share in brick-and-mortar channels. Although both P&G and Unicharm
stepped up their premium product offerings since 2014, they have been unable to keep in
check with Kao and K-C’s momentum. Brand switching is rare in the baby care category,
even for products other than diapers. At present, we see Kao and K-C’s competitive
advantage continuing through 2015.
P&G and Unicharm on the
back foot in offline sales

21 January 2015
Chemical and Consumer Sector: Diaper value chain survey 10
Figure 14: China diaper market share by company (excluding e-commerce): K-C and Kao gain share
2014E2012 2013
P&G33%
Unicharm17%
Kimberly-Clark11%
Kao3%
Hengan10%
Other26% P&G
30%
Unicharm14%Kimberly-
Clark13%
Kao7%
Hengan9%
Other27%
P&G26%
Unicharm12%
Kimberly-Clark15%
Kao10%
Hengan8%
Other29%
Note: Store sales value basis
Source: Credit Suisse estimates based on company and sector data
Kao holds top share in premium category in e-commerce channel; top share overall
for P&G
We now take a look at the breakdown by manufacturer of 100 top-selling diaper products
on China’s leading e-commerce sites (different from share by sales volume or sales value).
Kao held top share in the premium category with roughly 35%. P&G, Daio Paper, and
Unicharm gained as K-C lost share in 2H 2014. In particular, we regard P&G’s surge over
the last few months as remarkable. P&G increased market share in JD and other key
e-commerce channels, as it probably ramped up promotional activities.
While P&G held top share for diapers overall, the decline in K-C’s shares is relatively
significant. Other companies, excluding the top five in the premium category, raised their
share to nearly 30% recently. Although SCA and Hengan do not stand out at present, we
believe the two are steadily gaining market share. We see the likelihood of stiffer
competition in 2015, even within the growth channel of e-commerce. We expect
companies with a premium category, which is a sign of product differentiation, to enjoy a
relative advantage.
Figure 15: E-commerce diaper market share (Credit Suisse estimates)
Aug-2014 Jan-2015
Premium diaper All type of diaper
Aug-2014 Jan-2015
Kao16%
K-C16%
P&G22%
Unicharm16%
Daio3%
Other27%
Kao, 34%
K-C, 36%
P&G, 18%
Unicharm, 9%
Daio, 3% Kao18%
K-C24%
P&G20%
Unicharm19%
Daio1%
Other18%
Kao, 34%
K-C, 24%
P&G, 23%
Unicharm, 11%
Daio, 8%
Note: Premium products restricted to Kao, K-C, P&G, Unicharm, and Daio Paper
Source: Credit Suisse, based on company data and data from industry sources including iResearch Japan
P&G expanding online
market share

21 January 2015
Chemical and Consumer Sector: Diaper value chain survey 11
Figure 16: Breakdown by manufacturer of 100 top-selling diaper products on China's leading e-commerce sites, as of 9
January 2014
14-Dec 9-Jan 14-Dec 9-Jan
Premium All type Premium All type
Premium All type Premium All type
Premium All type Premium All type
dangdang.com (当当网) taobao.com (淘宝网)
Premium diaper on total ECs (B2C and B2B) All type of diaper on total ECs (B2C and B2B)
tmall.com(天猫) jd.com (京东)
yhd.com (1号店) suning.com (苏宁易购)
Kao, 53%
K-C, 20%
P&G, 19%
Unicharm, 3%
Daio, 5%Kao20%
K-C11%
P&G14%
Unicharm3%
Daio1%
Other51%
Kao, 34%
K-C, 36%
P&G, 11%
Unicharm, 15%
Daio, 4%
Kao28%
K-C31%
P&G19%
Unicharm18%
Daio3%
Other1%
Kao, 28%
K-C, 38%
P&G, 13%
Unicharm, 5%
Daio, 17%
Kao13%
K-C28%
P&G26%
Unicharm14%
Daio7%
Other12%
Kao, 36%
K-C, 15%
P&G, 26%
Unicharm, 14%
Daio, 9%Kao16%
K-C7%
P&G22%
Unicharm13%
Daio4%
Other38%
Kao, 22%
K-C, 30%P&G, 29%
Unicharm, 16%
Daio, 4%Kao12%
K-C23%
P&G30%
Unicharm29%
Daio2%
Other4%
Kao, 22%
K-C, 41%
P&G, 12%
Unicharm, 7.8%
Daio, 17%
Kao11%
K-C31%
P&G16%
Unicharm20%
Daio7%
Other15%
Kao, 34%
K-C, 24%
P&G, 23%
Unicharm, 11%
Daio, 8%Kao16%
K-C16%
P&G22%
Unicharm16%
Daio3%
Other27%
Kao, 35%
K-C, 24%
P&G, 21%
Unicharm, 11%
Daio, 10%
Kao16%
K-C17%
P&G24%
Unicharm14%
Daio4%
Other25%
Note: (1) We screened for the top 100 products in order of popularity on each e-commerce site. (2) We divided the 100 products into 10 groups
and calculated weighted-average market shares, with no adjustment for diaper size or the number of diapers in each pack. Each product
featuring in the rankings is treated as a single item. (3) In premium-type products, we only show the shares of five companies: Kao, Kimberly-
Clark, P&G, Unicharm, and Daio Paper. (4) To find each company's share of the overall e-commerce market, we took market shares for each
site and calculated weighted averages, referencing the proportion of net shopping transaction value accounted for by B2C and B2B and each
company’s share of the B2B and B2C markets. (5) For Tmall, we calculate monthly sales revenue base market share based on its monthly sales
volume and selling price data. We believe the data is valid since the market share is unlikely to be substantially different from that calculated
using the above method (all type).
Source: Credit Suisse, based on company data and data from industry sources including iResearch Japan

21 January 2015
Chemical and Consumer Sector: Diaper value chain survey 12
Growth in imports from Japan
According to CNHPIA (China National Household Paper Industry Association), the market
for hygiene-related products (sanitary products, baby diapers, and adult diapers) in China
grew 12.7% YoY in 2013, with sales totaling RMB59.45bn (around ¥1.1tn; 1RMB=¥19).
Sanitary products rose 13.5% YoY to RMB32.4bn (roughly ¥615bn), baby diapers
increased by 9.3% to RMB24.04bn (¥457bn), and adult diapers grew by 36.2% to
RMB3.01bn (around ¥57bn). While sanitary products have a market penetration of 91.1%,
the penetration rate for baby diapers is 47%. Demand for high-end products appears to be
growing in both sanitary products and baby diapers. Products that are light, thin, and soft
appear to be rising in popularity. CNHPIA’s most recent comment, from end-December
2014, highlights a 21.4% YoY increase in the import of hygiene-related products (41.1%
YoY rise in import value). Imports from Japan appear to be sizable, particularly of products
by Kao, Daio Paper, and Unicharm. Chinese imports from Japan have been rising steadily
with each passing year, and we see this trend continuing for the near term.
Figure 17: Breakdown of Chinese market size for hygiene-
related products (2013)
Figure 18: China’s import volume of hygiene-related
products by country (YTD through November)
Sanitary napkin
(YoY +13.5%)55%
Baby disposable
diaper(YoY +9.3%)
40%
Adult disposable
diaper(YoY +36.2%)
5%
0
10
20
30
40
50
60
70
80
0
200
400
600
800
1,000
12 13 14
(%)(mn USD) Japan S.Korea
Taiwan Other
a % of Japan
Note: Figures in parenthesis denote YoY change
Source: CNHPIA, Credit Suisse
Source: Global Trade Atlas China customs statistics, Credit Suisse
estimates
High single-digit growth likely to continue in China
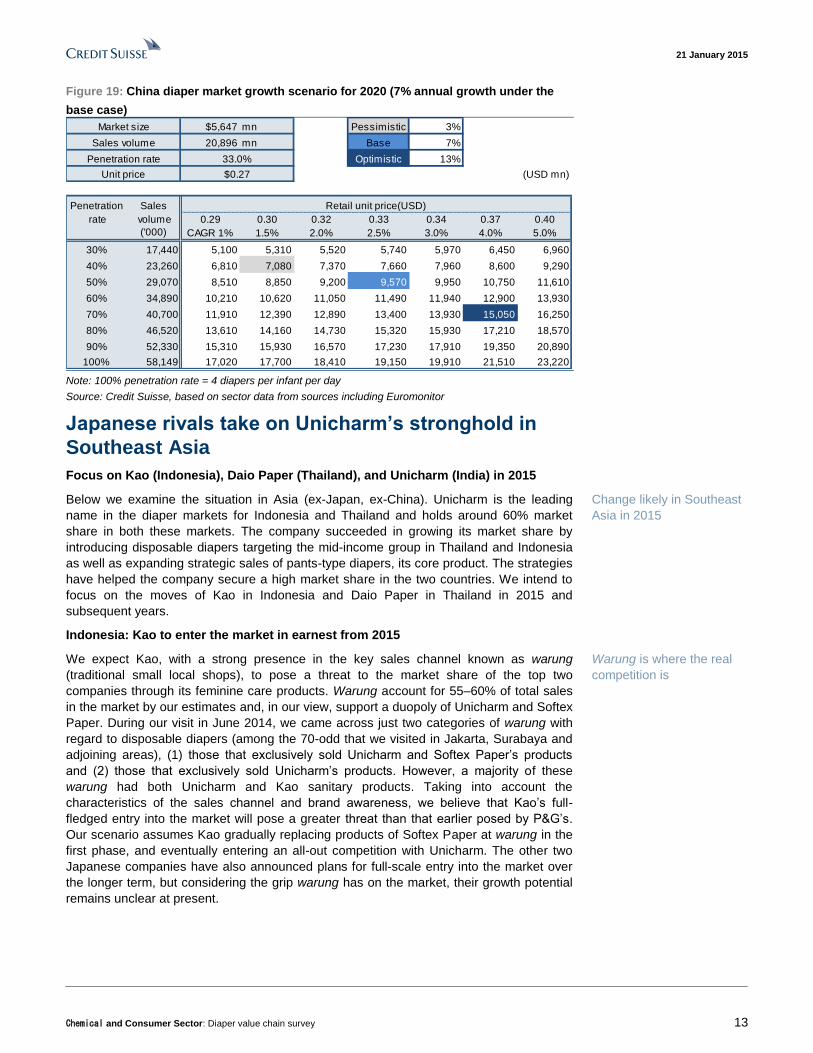
We examine the growth scenario for the Chinese diaper market through 2020 based on
data from 2013. In the base case, we anticipate an annual market growth rate of 7%
premised on: (1) a sustained increase in unit price (2.5% per annum) supported by the
shift to premium products and inflation, and (2) an increase in market penetration, from
36% in 2013 to 50% in 2020. Our bearish case projects an annual market growth rate of
3%, and our bullish case projects 13%. While we anticipate limited impact from the review
of China’s one-child policy due to rising education costs and other factors, we believe
there could be upside to our base growth scenario if the total number of births exceeds our
estimates.
Imports rose 40% by value
in 2014
Anticipate annual growth
rate of 7%
21 January 2015
Chemical and Consumer Sector: Diaper value chain survey 13
Figure 19: China diaper market growth scenario for 2020 (7% annual growth under the
base case)
$5,647 mn Pessimistic 3%
20,896 mn Base 7%
Optimistic 13%
(USD mn)
Penetration Sales
rate volume 0.29 0.30 0.32 0.33 0.34 0.37 0.40
('000) CAGR 1% 1.5% 2.0% 2.5% 3.0% 4.0% 5.0%
30% 17,440 5,100 5,310 5,520 5,740 5,970 6,450 6,960
40% 23,260 6,810 7,080 7,370 7,660 7,960 8,600 9,290
50% 29,070 8,510 8,850 9,200 9,570 9,950 10,750 11,610
60% 34,890 10,210 10,620 11,050 11,490 11,940 12,900 13,930
70% 40,700 11,910 12,390 12,890 13,400 13,930 15,050 16,250
80% 46,520 13,610 14,160 14,730 15,320 15,930 17,210 18,570
90% 52,330 15,310 15,930 16,570 17,230 17,910 19,350 20,890
100% 58,149 17,020 17,700 18,410 19,150 19,910 21,510 23,220
Market size
Retail unit price(USD)
Sales volume
Penetration rate 33.0%
Unit price $0.27
Note: 100% penetration rate = 4 diapers per infant per day
Source: Credit Suisse, based on sector data from sources including Euromonitor
Japanese rivals take on Unicharm’s stronghold in
Southeast Asia
Focus on Kao (Indonesia), Daio Paper (Thailand), and Unicharm (India) in 2015
Below we examine the situation in Asia (ex-Japan, ex-China). Unicharm is the leading
name in the diaper markets for Indonesia and Thailand and holds around 60% market
share in both these markets. The company succeeded in growing its market share by
introducing disposable diapers targeting the mid-income group in Thailand and Indonesia
as well as expanding strategic sales of pants-type diapers, its core product. The strategies
have helped the company secure a high market share in the two countries. We intend to
focus on the moves of Kao in Indonesia and Daio Paper in Thailand in 2015 and
subsequent years.
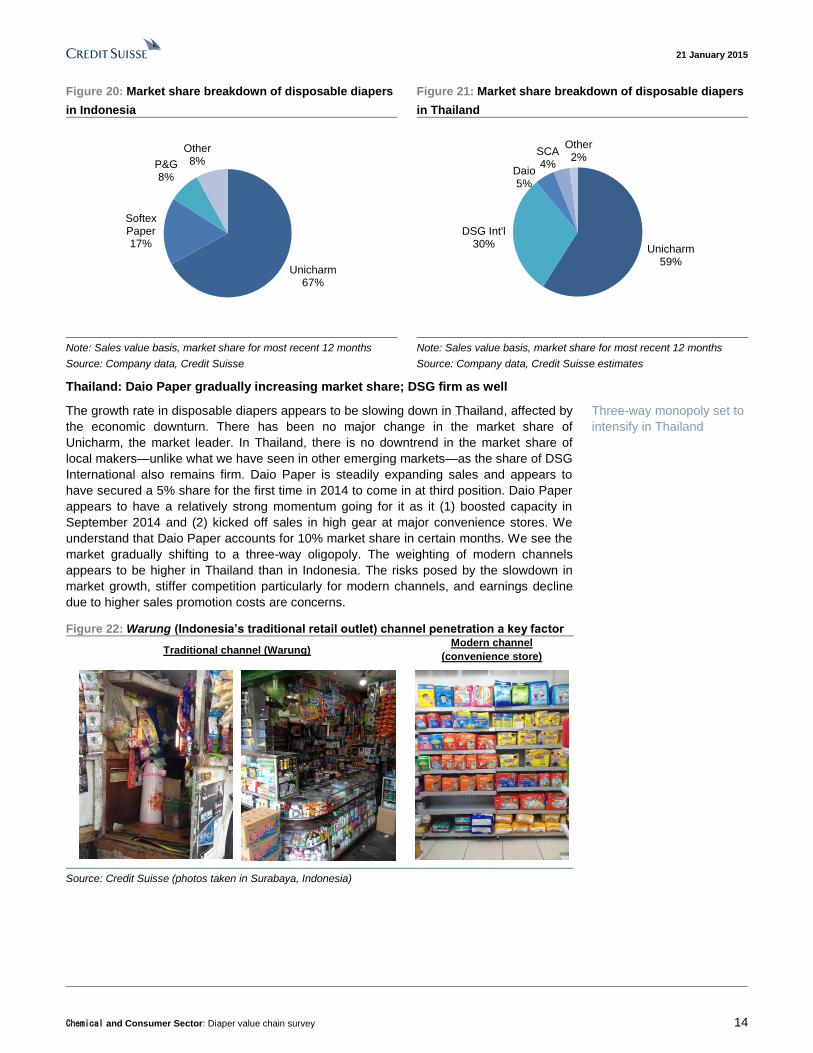
Indonesia: Kao to enter the market in earnest from 2015
We expect Kao, with a strong presence in the key sales channel known as warung
(traditional small local shops), to pose a threat to the market share of the top two
companies through its feminine care products. Warung account for 55–60% of total sales
in the market by our estimates and, in our view, support a duopoly of Unicharm and Softex
Paper. During our visit in June 2014, we came across just two categories of warung with
regard to disposable diapers (among the 70-odd that we visited in Jakarta, Surabaya and
adjoining areas), (1) those that exclusively sold Unicharm and Softex Paper’s products
and (2) those that exclusively sold Unicharm’s products. However, a majority of these
warung had both Unicharm and Kao sanitary products. Taking into account the
characteristics of the sales channel and brand awareness, we believe that Kao’s full-
fledged entry into the market will pose a greater threat than that earlier posed by P&G’s.
Our scenario assumes Kao gradually replacing products of Softex Paper at warung in the
first phase, and eventually entering an all-out competition with Unicharm. The other two
Japanese companies have also announced plans for full-scale entry into the market over
the longer term, but considering the grip warung has on the market, their growth potential
remains unclear at present.
Change likely in Southeast
Asia in 2015
Warung is where the real
competition is
21 January 2015
Chemical and Consumer Sector: Diaper value chain survey 14
Figure 20: Market share breakdown of disposable diapers
in Indonesia
Figure 21: Market share breakdown of disposable diapers
in Thailand
Unicharm67%
Softex Paper 17%
P&G8%
Other8%
Unicharm59%
DSG Int'l30%
Daio 5%
SCA 4%
Other2%
Note: Sales value basis, market share for most recent 12 months
Source: Company data, Credit Suisse
Note: Sales value basis, market share for most recent 12 months
Source: Company data, Credit Suisse estimates
Thailand: Daio Paper gradually increasing market share; DSG firm as well
The growth rate in disposable diapers appears to be slowing down in Thailand, affected by
the economic downturn. There has been no major change in the market share of
Unicharm, the market leader. In Thailand, there is no downtrend in the market share of
local makers—unlike what we have seen in other emerging markets—as the share of DSG
International also remains firm. Daio Paper is steadily expanding sales and appears to
have secured a 5% share for the first time in 2014 to come in at third position. Daio Paper
appears to have a relatively strong momentum going for it as it (1) boosted capacity in
September 2014 and (2) kicked off sales in high gear at major convenience stores. We
understand that Daio Paper accounts for 10% market share in certain months. We see the
market gradually shifting to a three-way oligopoly. The weighting of modern channels
appears to be higher in Thailand than in Indonesia. The risks posed by the slowdown in
market growth, stiffer competition particularly for modern channels, and earnings decline
due to higher sales promotion costs are concerns.
Figure 22: Warung (Indonesia’s traditional retail outlet) channel penetration a key factor
Traditional channel (Warung)Modern channel
(convenience store)
Source: Credit Suisse (photos taken in Surabaya, Indonesia)
Three-way monopoly set to
intensify in Thailand

21 January 2015
Chemical and Consumer Sector: Diaper value chain survey 15
India, Vietnam: Unicharm expands market share
Similar to Indonesia, Vietnam is a promising market with prospects for 20–30% growth.
Recent trends indicate that Unicharm and K-C gained market share, while P&G appears to
have lost some ground. The larger trend points to ongoing market domination by a handful
of players. Taking into account factors such as disposable income per person and annual
birth rate, Vietnam may not be a market comparable in scale to Indonesia, but we still
regard it as promising from a longer-term perspective.
Unicharm has been steadily increasing its market share in India, while P&G and K-C
appear to have slightly lost share. The three companies dominate the market in India.
Since the country has the highest birth rate globally, we see substantial growth potential in
India depending on the pace of per capita GDP growth it can achieve.
Figure 23: Market share breakdown of disposable diapers
in Vietnam
Figure 24: Market share breakdown of disposable diapers
in India
Unicharm40%
Kimberly-Clark 40%
P&G13%
Other7%
P&G57%Unicharm
23%
Kimberly-Clark 17%
Other3%
Note: Sales value basis, market share for most recent 12 months
Source: Company data, Credit Suisse assumptions
Note: Sales value basis, market share for most recent 12 months
Source: Company data, Credit Suisse assumptions
Growth in baby diaper exports and strong demand
for adult diapers in Japan
Combined production volume of baby and adult diapers set for growth of around
7% in the next three years
Disposable diaper production volume grew at a compound annual growth rate of 5.9%
over the last 10 years. While CAGR for baby diapers was 4.8%, the ratio for adult diapers
was 8.0%. We estimate baby diapers to grow at a CAGR of 8–9% and adult diapers at
4–5% in the three years from 2014–16.
Strong exports to emerging markets supported growth in baby diapers, particularly in 2012
and 2013, scoring double-digit growth. We think this growth was probably driven by strong
demand in China for higher-end disposable diapers. Growth in exports to China (total
including by manufacturers and agencies) appears to have picked up in 2014. Of the
entire domestic production volume (estimated at 11.7bn diapers; +8.9% YoY) we estimate
the weighting of exports to China, which effectively accounted for 26% (15% in 2013),
grew considerably in scale.
Also, taking into account the outlook for growth in an aging population (over 65 years of
age), we expect domestic adult diaper demand to register stable growth. A key feature of
adult diapers in Japan is the combination of pull-up and pad-type diaper features in
mainstream products. Most Chinese consumers, given their strong price consciousness,
consider basic functions in adult diapers as sufficient; the use of pad-type diapers remains
limited. Accordingly, we believe genuine growth in the export of adult diapers to China is
still some way out.
Three-company domination
in India and Vietnam;
Unicharm enjoying good
sales momentum
Estimate export ratio to
China at 20–30% in 2014

21 January 2015
Chemical and Consumer Sector: Diaper value chain survey 16
Figure 25: Domestic diaper production volume (2003–13
CAGR=+5.9%)
Figure 26: Trends in number of births and aging
population in Japan
0
5
10
15
20
25
03 04 05 06 07 08 09 10 11 12 13 14E 15E 16E
(bn pieces)
Infant-use Adult-use
0
500
1,000
1,500
2,000
2,500
3,000
19
50
19
55
19
60
19
65
19
70
19
75
19
80
19
85
19
90
19
95
20
00
20
05
20
10
20
15
20
20
20
25
20
30
0
5,000
10,000
15,000
20,000
25,000
30,000
35,000
40,000
('000 ppl) ('000 ppl)Aging population (over 65 year old, RHS)
Number of births (LHS)
Source: JHPIA, Credit Suisse estimates Source: STAT (MIC) estimates, Credit Suisse
Figure 27: Breakdown of diapers manufactured in Japan
by type (volume basis)
Figure 28: Weighting by export region for baby diapers
manufactured in Japan For babies
For adults
diapers with
resealable tapes48%
pants diapers
52% disposable adult diapers
21%
absorbency booster pads
(flat type)3%
incontinence pads and
others76%
0%
10%
20%
30%
40%
50%
60%
70%
12E 13E 14E
Japan China Russia Other
Source: JHPIA, Credit Suisse (2013) Note: Effective domestic demand and effective exports (Other
includes inventory)
Source: Credit Suisse assumptions, based on sector data from
sources including Global Trade Atlas and JHPIA
Top share for Kao in baby diapers, Unicharm strong in adult diapers
In the past, Unicharm held top domestic share in baby diapers, but we think a major
change is likely in terms of market share in 2014. We estimate that Kao may have secured
top share in this category. We see a sustained trend of Chinese agencies actively
procuring Kao’s Merries brand diapers at Japanese retail stores, which appears to have
boosted Kao’s domestic market share. Merries brand diapers appear to be constantly out-
of-stock in both urban and rural areas. Our survey shows that the shortage of Merries
brand diapers was a contributing factor in some higher-end products of Daio Paper and
Unicharm going out of stock at some retail stores recently.
We estimate that Unicharm currently holds about 50% domestic market share in adult
diapers. The gap between Unicharm and the company ranked second (with just under
20% market share) is overwhelming. Compared with baby diapers, adult diapers involve
extremely detailed requirement parameters such as size, shape, and absorption capacity
and odor-reduction functions. We believe that Unicharm’s edge in this category stems
from its highly capable marketing (including in both hospital and general retail routes) in
addition to its rich product lineup and product development capability.
Kao reached top share at
end-2014

21 January 2015
Chemical and Consumer Sector: Diaper value chain survey 17
Figure 29: Domestic market share for baby diapers Figure 30: Domestic market share for adult diapers
Unicharm32%
Kao35%
P&G17%
Daio Paper12%
Other4%
Unicharm52%
Daio Paper14%
Kao10%
Hakujuji8%
PB8%
Livedo8%
Note: Sales value basis, market share for most recent 12 months
Source: Company data, Credit Suisse estimates
Note: Sales value basis, market share for most recent 12 months
Source: Company data, Credit Suisse estimates
Figure 31: Sharp increase in Kao’s market share since
April 2014 supported by active procurements by agencies
for export to China
Figure 32: Kao gained market share after capacity
increase in spring 2014 and aims to eliminate supply
shortages by boosting capacity again in 2015
0
5
10
15
20
25
30Kao Unicharm P&G
(%)
0
5
10
15
20
25
30 Kao Unicharm P&G
(%)
Note: Monthly trend in combined market share for top-selling 20 products
Source: Nikkei POS, Credit Suisse
Note: Monthly trend in combined market share for top-selling 20 products
Source: Nikkei POS, Credit Suisse
Recent export situation in Japan indicates strong momentum for Kao
Based on the status of diaper-related exports from Japanese ports in November 2014, we
believe Kao’s strong momentum is poised to continue in a similar vein to October. Only
Sakata Port (closest to Kao’s plant) registered a MoM increase in the value of exports to
both China and Russia, which are major destinations for Kao’s products. This also
indicates the continuing popularity of Kao’s diapers manufactured in Japan.
Exports to China: Exports rose 89% YoY (–10% MoM) to $61.6mn in November. Sakata
Port registered a 13% MoM increase and Mishima-Kawanoe Port (Unicharm and Daio
Paper) remained flat MoM, but exports declined 16% MoM at Kobe Port (P&G). Meanwhile,
all ports in the vicinity of major metropolitan cities such as Tokyo and Osaka registered a
MoM decline. We regard the ongoing popularity of Kao’s products as one of the reasons
for MoM increase at Sakata Port.
Exports to Russia: Exports declined 17% YoY (–22% MoM) to $13.2mn in October.
Sakata Port saw exports rise 6% MoM. Exports declined 18% MoM at Mishima-Kawanoe
Port and 25% at Kobe Port. We estimate Kao’s market share for diapers in Russia (by
value) at around 5% (no. 4), while P&G, K-C, and SCA constitute the top three. Daio
Paper was sixth with 2.5% market share. Based on the monthly trend in November, it is
difficult to judge whether the downtrend is due to forex factors or to a broader economic
downturn and higher inventories. However, we can say with a high degree of certitude that
Sakata port set to become
critical export hub for China
and Russia

21 January 2015
Chemical and Consumer Sector: Diaper value chain survey 18
Kao’s high levels of exports underscore its relative strength. Demand for high-quality, high-
price diapers is increasing in Russia, as it is in China. In September 2014, Kao decided to
boost capacity at its Sakata Plant, which suggests the company is probably looking to
increase exports to China as well as Russia in the future.
Figure 33: Monthly export value of diapers and sanitary napkins to Russia (by port)
Mishima-kawanoe
Sakata Kobe
All Port
0
5
10
15
20
25
Jan-12 Jun-12 Nov-12 Apr-13 Sep-13 Feb-14 Jul-14
(USD mn)
0.0
0.5
1.0
1.5
2.0
2.5
3.0
3.5
4.0
4.5
Feb-12 Jul-12 Dec-12 May-13 Oct-13 Mar-14 Aug-14
(USD mn)
0.0
0.5
1.0
1.5
2.0
2.5
3.0
3.5
4.0
Jan-12 Jun-12 Nov-12 Apr-13 Sep-13 Feb-14 Jul-14
(USD mn)
0
2
4
6
8
10
12
Feb-12 Jul-12 Dec-12 May-13 Oct-13 Mar-14 Aug-14
(USD mn)
Source: Global Trade Atlas, Credit Suisse

21 January 2015
Chemical and Consumer Sector: Diaper value chain survey 19
Figure 34: Monthly export value of diapers and sanitary napkins to China (by port)
Osaka Tokyo
All Port Mishima-kawanoe
Sakata Kobe
0
10
20
30
40
50
60
70
80
Jan-12 Jul-12 Jan-13 Jul-13 Jan-14 Jul-14
Th
ou
sa
nd
s
(USD mn)
0
1
2
3
4
5
6
7
Jan-12 Jul-12 Jan-13 Jul-13 Jan-14 Jul-14
(USD mn)
0
1
2
3
4
5
6
7
8
9
Jan-12 Jul-12 Jan-13 Jul-13 Jan-14 Jul-14
(USD mn)
0
1
2
3
4
5
6
7
8
Jan-12 Jul-12 Jan-13 Jul-13 Jan-14 Jul-14
(USD mn)
0
2
4
6
8
10
12
14
Jan-12 Jul-12 Jan-13 Jul-13 Jan-14 Jul-14
Th
ou
sa
nd
s
(USD mn)
0
2
4
6
8
10
12
Jan-12 Jul-12 Jan-13 Jul-13 Jan-14 Jul-14
Th
ou
sa
nd
s
(USD mn)
0
5
10
15
20
25
30
35
Jan-12 Jul-12 Jan-13 Jul-13 Jan-14 Jul-14
Th
ou
sa
nd
s Kobe Nagoya Hakata Yokohama
(USD mn)
Source: Global Trade Atlas, Credit Suisse

21 January 2015
Chemical and Consumer Sector: Diaper value chain survey 20
Basic materials Diaper structure and business overview of related
chemical makers
Disposable diapers can be broadly divided into three layers: a surface layer, absorption
layer, and waterproof material layer. The surface layer comes into direct contact with the
skin and catches urine flow. The purpose of this layer is to improve user comfort and is
normally made of nonwoven fabric such as polyester or polypropylene. The use of
nonwoven fabric helps in keeping the diaper surface dry.
Urine passing through the surface layer enters the absorption layer directly under it. This
layer includes SAP, which enables easy absorption and allows urine to be trapped in the
diaper core. SAP can absorb urine up to 50–100 times its weight and retain it even when
pressed.
The outermost layer of a diaper is wrapped in waterproof material that prevents urine
leakage. Some diapers are made with a breathable material that allows for airflow but
prevents moisture from passing pass through.
Figure 35: Disposable diaper structure
Body
Top sheet
Leak guard
Tape
Waterproof fabricAbsorbent paper
Fluff pulp
SAP
Ab
so
rbe
nt
Source: Credit Suisse
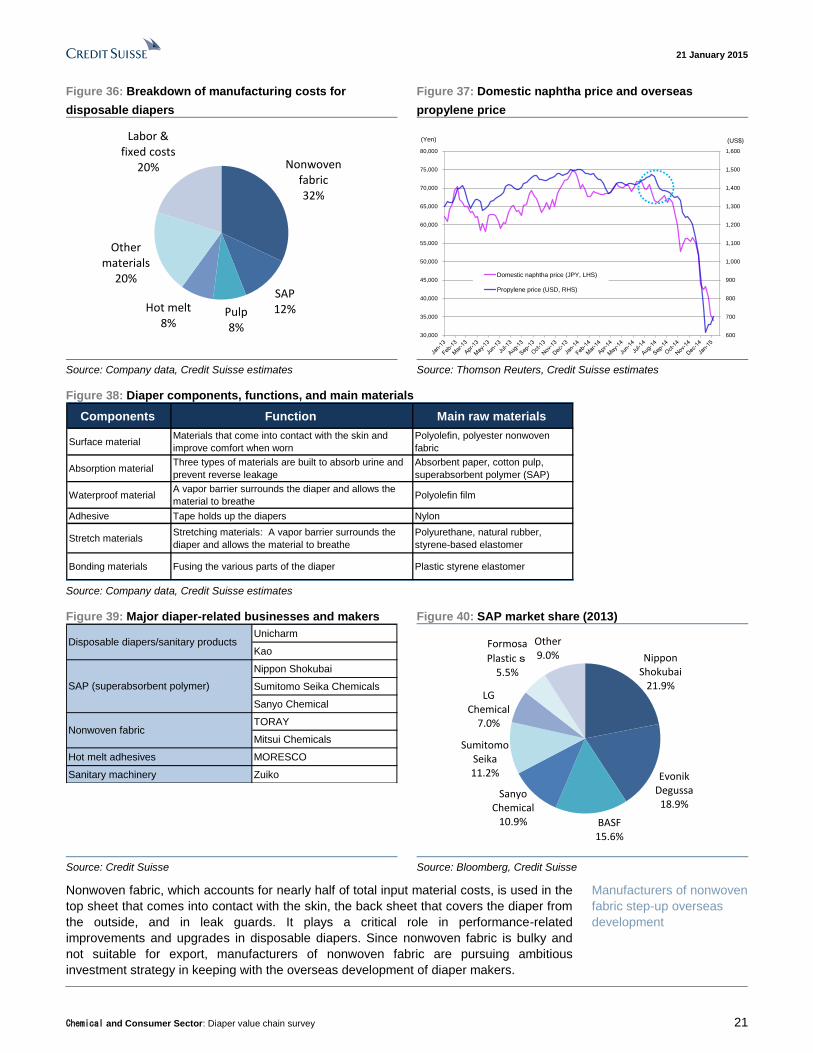
Figure 39 shows a list of diaper materials and related makers. We estimate diaper
manufacturing costs break down as nonwoven fabric 32%, super-absorbent polymers
(SAP) 12%, pulp 8%, hot-melt adhesives 8%, other materials 20%, and labor and other
fixed costs 20%. Since all input materials other than pulp are produced from naphtha, a
crude oil derivative, the trend in naphtha prices impacts the total cost of disposable
diapers.
Diaper structure consists of
three layers
Diaper manufacturing cost
breakdown: nonwoven
fabric 32%, SAP 12%, pulp
8%, and other fixed costs
20%
21 January 2015
Chemical and Consumer Sector: Diaper value chain survey 21
Figure 36: Breakdown of manufacturing costs for
disposable diapers
Figure 37: Domestic naphtha price and overseas
propylene price
Nonwoven fabric 32%
SAP12%Pulp
8%
Hot melt8%
Other materials
20%
Labor & fixed costs
20%
600
700
800
900
1,000
1,100
1,200
1,300
1,400
1,500
1,600
30,000
35,000
40,000
45,000
50,000
55,000
60,000
65,000
70,000
75,000
80,000
Domestic naphtha price (JPY, LHS)
Propylene price (USD, RHS)
(Yen) (US$)
Source: Company data, Credit Suisse estimates Source: Thomson Reuters, Credit Suisse estimates
Figure 38: Diaper components, functions, and main materials
Components Function Main raw materials
Surface material Materials that come into contact with the skin and
improve comfort when worn
Polyolefin, polyester nonwoven
fabric
Absorption material Three types of materials are built to absorb urine and
prevent reverse leakage
Absorbent paper, cotton pulp,
superabsorbent polymer (SAP)
Waterproof materialA vapor barrier surrounds the diaper and allows the
material to breathePolyolefin film
Adhesive Tape holds up the diapers Nylon
Stretch materials Stretching materials: A vapor barrier surrounds the
diaper and allows the material to breathe
Polyurethane, natural rubber,
styrene-based elastomer
Bonding materials Fusing the various parts of the diaper Plastic styrene elastomer
Source: Company data, Credit Suisse estimates
Figure 39: Major diaper-related businesses and makers Figure 40: SAP market share (2013)
Unicharm
Kao
Nippon Shokubai
Sumitomo Seika Chemicals
Sanyo Chemical
TORAY
Mitsui Chemicals
Hot melt adhesives MORESCO
Sanitary machinery Zuiko
SAP (superabsorbent polymer)
Nonwoven fabric
Disposable diapers/sanitary products
Nippon Shokubai
21.9%
Evonik Degussa 18.9%
BASF 15.6%
Sanyo Chemical
10.9%
Sumitomo Seika11.2%
LG Chemical
7.0%
Formosa
Plastics5.5%
Other9.0%
Source: Credit Suisse Source: Bloomberg, Credit Suisse
Nonwoven fabric, which accounts for nearly half of total input material costs, is used in the
top sheet that comes into contact with the skin, the back sheet that covers the diaper from
the outside, and in leak guards. It plays a critical role in performance-related
improvements and upgrades in disposable diapers. Since nonwoven fabric is bulky and
not suitable for export, manufacturers of nonwoven fabric are pursuing ambitious
investment strategy in keeping with the overseas development of diaper makers.
Manufacturers of nonwoven
fabric step-up overseas
development

21 January 2015
Chemical and Consumer Sector: Diaper value chain survey 22
Figure 41: Top 20 global nonwoven fabric makers (2011 sales basis)
Rank Company Country Rank Company Country
1 Freudenberg Germany 11 Sandler AG Germany
2 DuPont US 12 Hollingswroth & Vose US
3 Kimberly-Clark US 13 Japan Vilene Japan
4 Polymer Group, Inc. US 14 Companhia Providencia Brazil
5 Ahlstrom Finland 15 First Quality Nonwovens US
6 Johns Manville US 16 Asahi Kasei Japan
7 Fitesa US 17 Buckeye Technologies US
8 Glatfelter Canada 18 Fibertex Personal Care Denmark
9 Fiberweb UK 19 Toray Japan
10 Avgol Israel 20 Mitsui Chemicals Japan Source: Nonwovens Industry 2012, Nonwovens Yearbook
Figure 42: Acrylic acid, SAP and disposable diaper value chain (Credit Suisse estimates)
Acrylic acid SAP Disposable diaper
Nippon Shokubai(640kt)
BASF (1,140kt)
A w ide variety of customers
Hengan Intl. (1.1%)
BASF (400kt, 16%)
P&G (30%)
Nippon Shokubai(560kt, 22%)
Mitsubishi Chemical (110kt) Sanyo Chemical
(280kt, 11%)
Sumitomo Seika(287kt,11%)
Unicharm (7%)
Kao (1.5%)
Arkema (600kt)
Dow Chemical(890kt)
Evonik Degussa(485kt, 19%)
Kimberly-Clark (23%)
LG Chem (353kt) LG Chem (180kt, 7%)
Formosa Plastics(320kt)
Formosa Plastics
(140kt, 5%)
A few Chinese makers
A few Chinese makers
SCA (6%)
Note: Figures in parenthesis denote production capacity at end-2013 and global share based on production
capacity
Source: Company data, Credit Suisse estimates
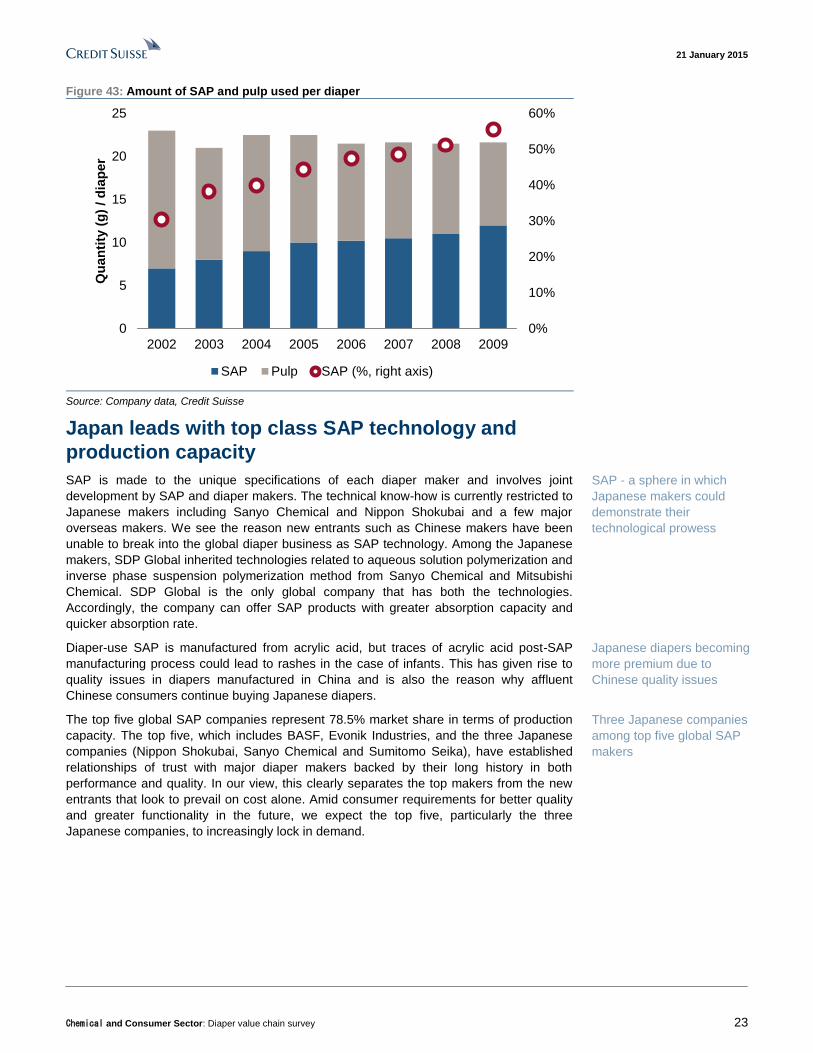
Consumer needs for diapers are becoming increasingly diverse in tandem with higher
market penetration for baby diapers in emerging markets and adult diapers in developed
markets. Some of the key needs are thinner diapers, reduced leakage, and post-
absorption surface dryness. In adult diapers, where quick drying is expected in view of
urine discharge volume, consumers are now seeking greater absorption volume per unit
time, leading to greater SAP usage. Further, the trend toward thinner diapers in raising
user comfort and saving on resources means greater usage of SAP and a reduction pulp
usage.
Increase in SAP usage in
keeping with consumer
needs for thinner diapers
with greater absorption
21 January 2015
Chemical and Consumer Sector: Diaper value chain survey 23
Figure 43: Amount of SAP and pulp used per diaper
0%
10%
20%
30%
40%
50%
60%
0
5
10
15
20
25
2002 2003 2004 2005 2006 2007 2008 2009
Qu
an
tity
(g
) / d
iap
er
SAP Pulp SAP (%, right axis)
Source: Company data, Credit Suisse
Japan leads with top class SAP technology and
production capacity
SAP is made to the unique specifications of each diaper maker and involves joint
development by SAP and diaper makers. The technical know-how is currently restricted to
Japanese makers including Sanyo Chemical and Nippon Shokubai and a few major
overseas makers. We see the reason new entrants such as Chinese makers have been
unable to break into the global diaper business as SAP technology. Among the Japanese
makers, SDP Global inherited technologies related to aqueous solution polymerization and
inverse phase suspension polymerization method from Sanyo Chemical and Mitsubishi
Chemical. SDP Global is the only global company that has both the technologies.
Accordingly, the company can offer SAP products with greater absorption capacity and
quicker absorption rate.
Diaper-use SAP is manufactured from acrylic acid, but traces of acrylic acid post-SAP
manufacturing process could lead to rashes in the case of infants. This has given rise to
quality issues in diapers manufactured in China and is also the reason why affluent
Chinese consumers continue buying Japanese diapers.
The top five global SAP companies represent 78.5% market share in terms of production
capacity. The top five, which includes BASF, Evonik Industries, and the three Japanese
companies (Nippon Shokubai, Sanyo Chemical and Sumitomo Seika), have established
relationships of trust with major diaper makers backed by their long history in both
performance and quality. In our view, this clearly separates the top makers from the new
entrants that look to prevail on cost alone. Amid consumer requirements for better quality
and greater functionality in the future, we expect the top five, particularly the three
Japanese companies, to increasingly lock in demand.
SAP - a sphere in which
Japanese makers could
demonstrate their
technological prowess
Japanese diapers becoming
more premium due to
Chinese quality issues
Three Japanese companies
among top five global SAP
makers

21 January 2015
Chemical and Consumer Sector: Diaper value chain survey 24
Figure 44: Production capacity for SAP (including expansion plans through 2016)
0 200 400 600 800
Dow Chemical
FormosaPlastics
LG Chemical
SanyoChemical
SumitomoSeika
Evonik
BASF
NipponShokubai
(000t)
Source: Credit Suisse
Figure 45: Valuations for global SAP makers
Dividend
Ticker Company Curreycy Close TP (US$mn) FY14E FY15E FY16E FY14E FY15E FY16E FY14E FY15E FY16E FY14E FY15E FY16E Yield
4114 Nippon Shokubai JPY 1,574 1,600 2,693 7% 8% 9% 15.2 13.3 12.4 1.3 1.2 1.1 7.5 6.9 6.6 1.4%
4471 Sanyo Chemical JPY 872 950 810 6% 6% 7% 14.1 11.1 8.9 0.9 0.9 0.8 5.0 4.4 3.9 1.7%
4008 Sumitomo Seika JPY 777 - 457 8% 8% 8% 10.2 9.0 10.0 na na na na na na 1.9%
BASFn.DE BASF EUR 74 64 78,587 10% 10% 10% 15.1 14.3 13.5 2.3 2.2 2.0 8.4 8.4 8.0 3.7%
EVKn.DE Evonik EUR 27 28 14,651 8% 9% 10% 17.4 15.7 14.4 1.8 1.7 1.6 8.3 7.6 7.0 3.7%
051910.KS LG Chem Ltd. KRW 183,000 290,000 11,158 6% 8% 9% 10.7 8.7 8.8 1.0 0.9 0.8 5.3 4.5 3.9 2.2%
DOW.N Dow Chemical Company USD 44 51 51,105 11% 10% 12% 15.1 14.7 14.0 2.5 2.3 2.2 7.0 7.1 6.0 3.5%
1301.TW Formosa Plastics TWD 76 83 15,183 4% 4% 4% 18.3 16.8 15.6 2.3 2.1 2.0 12.1 11.2 10.4 2.5%
Average 8% 8% 9% 14.5 12.9 12.2 1.7 1.6 1.5 7.7 7.2 6.5 3%
P/E P/B EV/EBITDAPrice Mkt cap OP/Sales
Source: Company data, I/B/E/S, Credit Suisse estimates
21 January 2015
Chemical and Consumer Sector: Diaper value chain survey 25
SAP makers in spotlight Sustained growth in SAP demand
Among the basic materials used in diapers, we focus on demand growth for SAP, in which
Japanese makers boast top class technology and production capacity. Japanese SAP
makers have stepped up global development in tandem with demand growth for baby and
adult diapers, which account for 90% of SAP demand, and for hygiene-related products.
Nippon Shokubai estimates global SAP demand will grow at an annual rate of 6–7% in the
medium term (from an estimated 2mn t in 2013).
SAP is one of the rare areas registering sustained growth among petroleum-derived
plastics. Initially, the main component of diapers was pulp, but they have become thinner
and easy to use thanks to SAP, which also eliminated leakage and resurfacing of moisture.
Unlike cloth diapers, there is no washing involved in disposable diapers, and since there is
little need for frequent diaper change, disposable diapers have gained widespread support
from parents and care-givers. This has also led to significant growth in demand. The
recent trend in disposable diapers is toward reducing pulp volume to significantly cut
waste. We assume that, unlike repeated washing of cloth diapers, the use of disposable
diapers has almost no environmental impact.
Unicharm has introduced its own theory on disposable diapers. According to this,
disposable diaper sales start rising rapidly once the nation’s per capita GDP exceeds
$3,000. The growth, driven by Asia, is particularly remarkable in China and emerging
markets. The annual growth rate in these regions is over 20%. The use of disposable
diapers is well established in Japan, Europe and the US, but the annual growth rate in
these regions is only around a few percent. The demand is driven by growth in adult
diapers rather than baby diapers in countries such as Japan, which face a declining birth
rate and a growing proportion of elderly people. Also, the recent demand for pet diapers
cannot be overlooked.
According to the Japan Hygiene Products Industry Association (JHPIA), domestic diaper
output rose 8% YoY, up 17.2108bn pieces in 2013 (+6% or 665,435t on a weight basis).
Despite a falling birth rate, baby diapers rose 12% to 107.2005bn pieces, and adult
diapers rose 3% to 6.4902bn pieces in a strong performance. Napkin-type incontinence
pads, which have gained in visibility, also substantially eclipsed year earlier performance.
The overall trend has remained intact in 2014, with Jan–Sep diaper output (by weight)
rising 8% YoY to 523,376t. Baby diapers rose 10% to 291,960t, and adult diapers
increased by 5.6% to 231,416t. Baby diapers continued to register double-digit growth for
the second straight year in Japan, a country facing a declining birth rate and aging
population.
Supply capacity has kept pace with growing demand. Annual production capacity of major
manufacturers in 2013 is as follows: Nippon Shokubai 560,000t, BASF, 400,000t, Evonik
405,000t, Sumitomo Seika 287,000t, SDP Global 280,000t, LG 180,000t. As each
company continued to raise capacity, the combined capacity of the top eight global
companies increased to 2.33mn t.
SDP Global is scheduled to raise capacity in China by 80,000t as early as 2015.
Sumitomo Seika plans to bring roughly 40,000t in additional capacity online in April 2015.
As a result, total capacity of the top six global companies is likely to rise to just under
2.71mn t in 2015.
Global demand totaled
2mn t in 2013
SAP – a rare growth area in
plastics
Correlation between
disposable diapers and per
capita GDP of US$3,000
Domestic diaper production
volume rose 8% YoY in
2013

21 January 2015
Chemical and Consumer Sector: Diaper value chain survey 26
Figure 46: SAP production capacity global ranking Company Americas Europe Asia Total
1 Nippon Shokubai 60 60 440 560 Jun 2016 Expansion 50 in Japan
2 Evonik Industries *1 135 190 80 405 End of 2013 Expansion 80 in Saudi Arabia
End of 2014 Newly established 60 in Brazil
3 BASF 180 200 20 400 End of 2013 Newly established 80 Saudi Arabia
4 Sumitomo Seika Chemicals *2 47 240 287 Apr 2015 Expansion 40 in Japan
May-16 Expansion 59 in South Korea
5 SDP Global 280 280 Jul-15 Expansion 80 in China
6 LG Chem Ltd. 180 180 Sep 2015 Expansion 80 in South Korea
7 Formosa Plastics Group 140 140
8 The Dow Chemical Company 80 80 Make-to-order for Evonik
Total of top 8 companies 455 497 1,380 2,332
Worldwide total 465 497 1,600 2,562
Unit: 1,000 tons
Note
Note: Additional capacity excluded from total for top eight companies and global total
Source: Chemical goods handbook 2014, The Heavy & Chemical Industries News Agency
The outlook points to a stable supply-demand balance continuing in the foreseeable future.
We calculate SAP demand outlook for diapers based on estimated baby and adult diaper
volumes. The global disposable diaper market in 2012 totaled 138.6590bn pieces in baby
diapers and 14.2850bn pieces in adult diapers. We assume SAP usage at 12 grams for
baby diapers and at 15.6 grams for adult diapers, and applying these to the above diaper
numbers, we arrive at a total SAP volume of 1.8887mn t. Assuming a 5% increase in baby
diapers and an 8% increase in adult diapers from 2012 to 2013, we arrive at a total SAP
demand of 1.9880mn t (close to the 2mn t estimated by Nippon Shokubai).
SAP demand is likely to grow to 2.8710mn t in 2020, assuming the above 5% increase in
baby diapers and 8% increase in adult diapers remains constant throughout the period.
On the other hand, assuming supply grows at an annual rate of 5% beyond 2015, total
supply is likely to rise to 3.7250mn t in 2020, up from 2.5690mn t in 2013.
We forecast the supply–demand balance to remain more or less even, from 78% in 2013
to 77% in 2020. We accordingly expect SAP supply–demand to trend firm over the
medium-term.
Figure 47: Supply–demand of SAP for diapers
0
500
1,000
1,500
2,000
2,500
3,000
3,500
4,000
2013 2014 2015 2016 2017 2018 2019 2020
Supply
Adult diaper
Baby diaper
(thousand tons)
Source: Company data, Credit Suisse estimates
Outlook for a strong
supply–demand balance

21 January 2015
Chemical and Consumer Sector: Diaper value chain survey 27
Price trends
SAP export prices were on a downtrend from 2009 following a hike in Chinese supply
capacity. However, after an accident at Nippon Shokubai in September 2012, the supply-
demand situation started to tighten, leading to a sharp increase in export prices. With
outlook emerging for restoration of manufacturing facilities, export prices are trending
somewhat soft recently. We think Japanese SAP makers can ensure margins through the
adoption of a manufacturing process that starts with basic raw materials. Also, we expect
growth in supply of high function SAP used in thinner, premium diapers to drive
improvement in product mix.
Figure 48: SAP export volume from Japan and unit price Figure 49: Acrylic acid export volume from Japan and unit
price
200
300
400
500
600
700
0
1000
2000
3000
4000
5000
6000
7000
8000
Jan
-88
Jul-
89
Jan
-91
Jul-
92
Jan
-94
Jul-
95
Jan
-97
Jul-
98
Jan
-00
Jul-
01
Jan
-03
Jul-
04
Jan
-06
Jul-
07
Jan
-09
Jul-
10
Jan
-12
Jul-
13
Jan
-15
Export volume (LHS,t) Price (RHS, Y000/t)
0
200
400
600
800
1000
1200
0
2000
4000
6000
8000
10000
12000
14000
16000
Jan
-88
Jul-
89
Jan
-91
Jul-
92
Jan
-94
Jul-
95
Jan
-97
Jul-
98
Jan
-00
Jul-
01
Jan
-03
Jul-
04
Jan
-06
Jul-
07
Jan
-09
Jul-
10
Jan
-12
Jul-
13
Jan-1
5
Export volume (LHS,t) Price (RHS, Y000/t)
Source: Trade Statistics of Japan, Ministry of Finance Source: Trade Statistics of Japan, Ministry of Finance
Figure 50: China SAP monthly import volume and unit
price
Figure 51: China acrylic acid monthly import volume and
unit price
2.80
3.00
3.20
3.40
0
10
20
30
40
50
12-3 12-7 12-11 13-3 13-7 13-11 14-3 14-7 14-11
(US$/kg)(000t)
Volume (LHS)
Unit price(RHS)
1.20
1.30
1.40
1.50
1.60
1.70
1.80
1.90
2.00
0
2
4
6
8
10
12
12-3 12-7 12-11 13-3 13-7 13-11 14-3 14-7 14-11
(US$/kg)(000t) Volume (LHS)
Unit price(RHS)
Source: China Customs Information Center Source: China Customs Information Center
Japanese SAP makers
Below, we examine the latest developments at the three Japan-based SAP makers, who
between them account for just under half of the six leading suppliers’ global production
capacity of an estimated 2.4mn tons. Japan’s leading manufacturer, Nippon Shokubai,
produces SAP at its Himeji Plant. In September 2012 the company was ordered to shut
down the entire plant owing to an explosion and fire at the acrylic acid production facility. It
has gradually brought operations back on stream in stages since, recovering to full
operating status in early 2014. Elsewhere, Sanyo Chemical subsidiary San-Dia Polymer
underwent reorganization, making a new start on 30 September 2013 as SDP Global. In
April 2015, Sumitomo Seika plans to bring on stream an additional 40,000t of annual
capacity at its Himeji Works, while in Korea it is building a new 59,000t SAP plant
scheduled to become operational in May 2016.

21 January 2015
Chemical and Consumer Sector: Diaper value chain survey 28
Nippon Shokubai
Nippon Shokubai is the world’s leading SAP manufacturer, with annual capacity of
560,000t across five locations around the world, Wielding the substantial supply capability
afforded by its large-scale and global production structure, together with the high quality of
its proprietary SAP, manufactured with acrylic acid produced through a propylene vapor
phase oxidation process, the company was able to capture a dominant share of the
market. However, on 29 September, 2012, an intermediate tank in the acrylic acid
production facility of the company’s Himeji plant exploded and caught fire, resulting in a
complete shutdown of both Himeji’s acrylic acid production (annual capacity 460,000t) and
SAP production (320,000t). Within a few months following the accident, the company was
able to gradually begin bringing back into operation different facilities at the plant, and by
August 2013 was able to produce every type of product handled at Himeji. On 18
December, the government rescinded its order to halt production in the acrylic acid facility
that was the source of the accident, marking a full recovery. The acrylic acid
manufacturing facility restarted early in 2014.
To cover for the drop in output caused by the Himeji fire, in December 2012 Nippon
Shokubai’s US subsidiary NA Industries restarted an old 60,000t SAP plant in
Chattanooga, Tennessee, that had been shut down that June when a new plant became
operational. Elsewhere, in October 2013 the company’s Indonesian subsidiary Nippon
Shokubai Indonesia commenced full operation of a new 90,000t SAP plant. By moving
early to ramp up overseas expansion efforts, the company was able to successfully offset
the impact of the accident. At the same time, however, the accident also highlighted the
need to decentralize production bases, and it may well serve to accelerate deliberations
over future plans in this regard.
Nippon Shokubai plans to further expand its global SAP production capacity. In terms of
the schedule for capacity expansion, between 2016 and 2018 the company intends to
boost annual SAP capacity by 150,000t and add 100,000t of acrylic acid (AA) capacity.
With another 160,000t of AA capacity to be added by 2020, Nippon Shokubai will spend
an estimated ¥80bn over this period. In parallel, the company has decided to invest a total
of ¥70bn on two sets of 100,000t of SAP capacity and 100,000t of AA capacity, with the
aim of completing the first set by 2020. Once this is achieved, Nippon Shokubai’s SAP/AA
production capacity will increase from 560,000t/780,000t at present to more than
910,000t/1,240,000t by the start of the 2020s. This should further consolidate the
company's status as world leader in the SAP industry.
We forecast SAP sales of just under ¥110bn in FY14, We expect sales to increase by
¥33bn YoY, on full resumption of operations after the accident and recovery in market
share, and a full-year contribution from capacity expansion in Indonesia.
Sanyo Chemical Industries
Sanyo Chemical’s subsidiary specializing in SAP, previously called San-Dia Polymers,
was renamed SDP Global in September 2013, reflecting its new ownership structure as a
joint venture between Sanyo Chemical, with a 70% stake, and Toyota Tsusho, with a 30%
stake following acquisition of shares from Mitsubishi Chemical.
SDP Global is capable of producing 280,000t of SAP annually, with capacity of 110,000t at
its Nagoya Plant, 20,000t at its Ogaki Plant, and 150,000t at its Nantong Plant in China.
The Nagoya plant, formerly under the control of Sanyo Chemical, produces SAP using the
aqueous solution polymerization method, while the Ogaki plant, formerly run by Mitsubishi
Chemical (Nippon Synthetic Chemical Industry), employs the inverse phase suspension
polymerization process. As a result, SDP Global is the only SAP maker in the world using
both processes. The company also successfully introduced a manufacturing process that
reduced investment costs by some 20% on the third line at its Nantong plant (80,000t
capacity, operations launched in 2011). In anticipation of a tightening supply–demand
balance for SAP, SDP Global plans to boost the Nantong Plant’s annual capacity by
World’s leading SAP
manufacturer
Accident hastened
offshoring of production
SAP business reorganized
Demand for new-grade
products expected to grow

21 January 2015
Chemical and Consumer Sector: Diaper value chain survey 29
80,000t from July 2015. In addition, it aims to construct a new plant in Southeast Asia, with
a view to commencing operation in 2017.
We see the company outpacing market growth as it expands capacity for new grades of
SAP products and brings them to market. These new products will allow the manufacture
of thinner disposable diapers with superior urine diffusion capability, while using less pulp
than traditional products. They will also allow effective urine absorption capacity to be
raised by over 10%, making it possible to extend absorption over a wider area.
SDP Global expects the global SAP market to total 3mn t annually in 2020, and aims to
secure a 20% market. To that end it will need to supplement the new plant in Southeast
Asia with further capex. In 2014, the company embarked on a feasibility study looking into
SAP production in the US.
SDP Global had sales of ¥51.4bn in FY13, for OP of ¥2.57bn. For FY14 we forecast sales
of ¥55bn and OP of ¥3.6bn.
Sumitomo Seika
Sumitomo Seika's SAP production capacity totals 287,000t, comprising 170,000t at its
Himeji Works, 70,000t in Singapore, and 47,000t at the French production facility acquired
in 2008 from France’s Arkema (production continues to be done by Arkema on a toll
manufacture basis). In addition to its proximity to markets in the Middle East and Africa,
where latent demand for disposable diapers is massive, the French production base can
also provide a stable supply of key feedstock acrylic acid from Arkema. In April 2015,
Sumitomo Seika plans to bring on stream an additional 40,000t of annual capacity at its
Himeji Works, while in Korea it is building a new 59,000t SAP plant scheduled to become
operational in May 2016. This would take the company’s total SAP production capacity to
386,000t. Sumitomo Seika has moved aggressively to expand production capacity in
recent years as part of a strategy to boost capacity to 300,000t by FY15, the final year of
its current medium-term management plan, Seika Plan 2015, launched in FY10.
According to an announcement made in November 2014, Sumitomo Seika has developed
a higher-grade product, AQUA KEEP HP, which has significantly improved performance
over its conventional line of SAP, AQUA KEEP. AQUA KEEP HP exhibits high water
absorption performance as well as an improved ability to retain absorbed water under load.
We understand that samples have been shipped to customers for evaluation.
Generally, super-absorbent polymers are required to have two different performances; one
is to absorb an abundance of water (“higher absorption capacity”) and the other is to retain
absorbed water under load (”higher absorption capacity under load”). Since there is a
trade-off between the two performances, a solution has been sought to enhance both
performances at the same time.
AQUA KEEP capitalizes on the characteristics of Sumitomo Seika’s proprietary production
technology (an inverse suspension polymerization process) and is well suited to the
manufacture of thin-style diapers for children and adults. With AQUA KEEP HP, the
company has established a new production technology wherein the polymerization
process is significantly improved and the polymer structure is optimized. This new
technology is capable of realizing higher performance than ever before in both “higher
absorption capacity” and “higher absorption capacity under load.” It also enables
Sumitomo Seika to control the two performances flexibly according to customers' specific
needs. The company will be able to produce AQUA KEEP HP both at the new facility
being built at the Himeji Works, and also at the 59,000t plant being constructed in Yeosu,
Korea. With some modifications it should also be capable of producing AQUA KEEP HP at
other manufacturing facilities. It is awaiting customer evaluation of samples before
undertaking any such modifications.
Sumitomo Seika discloses results for its superabsorbent polymer segment, and for FY14 it
is targeting segment sales of ¥67bn, and OP of ¥6.2bn.
Pursuing overseas
expansion
New grade of SAP
developed

21 January 2015
Chemical and Consumer Sector: Diaper value chain survey 30
Figure 52: Nippon Shokubai (4114) – SAP production sites (company estimates for Jun
2016)
(Unit: 1,000 tons)
Nippon shokubai (4114) Pre-incident Current Jun 2016
Himeji 320 320 370
Tennessee (NAII)
Texas (NAII) 60 60 60
Belgium (NSE) 60 60 60
China (NSC) 30 30 30
Indonesia (NSI) 90 90
Total 470 560 610 Source: Company data
Figure 53: Sanyo Chemical (4471) – SAP production sites (company estimates for Jul
2015)
(Unit: 1,000 tons)
Sanyo Chemical (4471) Current Jul 2015
Nagoya (SDP) 110 110
Ogaki (SDP) 20 20
Nantong, China (SDN) 150 230
Total 280 360 Source: Company data
Figure 54: Sumitomo Seika Chemicals (4008) – SAP production sites (company estimates
for May 2016)
(Unit: 1,000 tons)
Sumitomo Seika Chemicals (4008) Current May 2016
Himeji 170 210
Singapore 70 70
France 47 47
Korea 59
Total 287 386 Source: Company data

21 January 2015
Chemical and Consumer Sector: Diaper value chain survey 31
Japanese manufacturers also dominant in nonwoven fabric and other materials Nonwoven fabric
Nonwoven fabric is used for the top sheet in diapers (in contact with the skin), for the back
sheet (facing outwards), and for the gather (which prevents leaks). Spunbond nonwoven
fabric made of polypropylene is typically used in disposable diapers.
As products for infants and the elderly, groups that tend to have weak immune systems,
disposable diapers must be manufactured to very precise quality standards (approaching
“zero defects per 10,000m”) yet also at a high production velocity of 500–1,000
units/minute. Only manufacturers in Japan, the US and Europe are capable of producing
diapers to these high tolerances. Nonwoven fabrics are not suitable for export due to their
bulk. For this reason, as disposable diaper manufacturers expand overseas, nonwoven
fabric makers are also actively expanding their own foreign operations.
Figure 55: Manufacturing sites for non-woven fabrics Company Operating company / factory Location Capacity Start operation Note
Nobeoka Office Nobeoka, Miyazaki pref. 12,000t/y PP non-woven fabric, "Eltas"
12,000t/y PP non-woven fabric, "Eltas"
5,400t/y PET non-woven fabric, "Eltas"
3,300t/y Nylon non-woven fabric, "Eltas"
20,000t/y Sep 2012PP non-woven fabric, "Eltas", Owned 90% by Asahi Kasei
Fibers Co., 10% by Saha Group
25,000t/y 2015 Considering the second stage of expansion
4,000t/y PET non-woven fabric, 100% owned by Toray
43,000t/y PP non-woven fabric
58,000t/y Mar 2008PP non-woven fabric, TPN、owned 50% by TAK, 40% by
Toray and 10% by Toray Industries (China)
20,000t/y Mar 2008 Expanded, considering further expansion
19,000t/y Jun 2013PP non-woven fabric, owned 65% by TAK, 25% by Toray
and 25% by Toray Indonesia
18,000t/y Sep 2016 Expansion
Sunrex Industry Co., Ltd. Yokkaichi, Mie pref. 49,000t/yPP non-woven fabric, 100% owned by Mitsui Chemical.
Expanded to 15,000t/y in June 2012
Tianjin Mitsui Chemicals non-wovens Co.,Ltd. Tianjin, China 15,000t/y Autumn 2013 PP non-woven fabric, 100% owned by Mitsui Chemical.
Mitsui Hygiene Materials Thailand Co.,Ltd Rayong, Thailand 30,000t/y Mar 2003 PP non-woven fabric, 100% owned by Mitsui Chemical.
JNC Fibers Company Moriyama, Shiga pref. 5,000t/y Spunbounded non-woven fabric
Guangzhou ES Fiber Co., Ltd.Guangzhou, Guangdong
prov., China7,800t/y
Through-air non-woven fabric, owned 50% by JNC Fibers
Co., 50% by FiberVisions A/S (Denmark)
Chisso ES Asia (Changshu) Co., Ltd.Changshu, Jiangsu prov.,
China4,800t/y Jan 2012
Through-air non-woven fabric, Currently 2,400t/y X2 lines.
Planning to expand to 65 lines 12,000t/y eventually. 100%
owned by JNC Fibers Co.
2,400t/y Autumn 2014 Planning expansion
4,800t/y End of 2013Through-air non-woven fabric, 100% owned by JNC Fibers
Co.
Mitsui
Chemical
JNC
JNC ES non-wovens Thailand Rayong, Thailand
Asahi Kasei
Fibers
Corporation
Moriyama Office Moriyama, Shiga pref.
Asahi Kasei Spunbond (Thailand) Chonburi, Thailand
Toray
Toray Advanced Materials Korea Inc. Korea
Toray Polytech (Nantong) Co., Ltd. Nantong, China
P.T.Toray Polytech Jakarta Indonesia
Source: Company data, J-Chem, Credit Suisse
At its Indonesian offshoot, Toray Polytech Jakarta (TPJ), Toray (3402) is planning an
18,000t boost to its annual production capacity for high-performance polypropylene
spunbond (PP spunbond). The company is to invest ¥6bn or so in the new capacity, with
construction due to start in February 2015 and operation likely to commence in September
2016. This would take TPJ’s capacity to 37,000t, and expand the Toray Group’s total
production capacity for PP spunbond to 153,000t.
Demand for disposable baby diapers is forecast to rapidly grow in ASEAN countries, in
tandem with improvement in people’s lifestyles as their national income increases. In
addition, demand for disposable diapers for the elderly is expected to expand in developed
and semi-developed countries in East Asia due to declining birthrates and aging societies.
Under such circumstances, Toray expects demand for PP spunbond, which is the main
material for making disposable diapers, to grow to 660,000t per year in 2016 from
Nonwoven fabric a key
component in diaper
construction
Toray boosting capacity in
Indonesia

21 January 2015
Chemical and Consumer Sector: Diaper value chain survey 32
493,000t in 2013, and to 936,000t per year in 2020. We estimate Toray’s PP spunbond
sales at around ¥25bn; in 2015 the company aims to grow this figure by around 1.5x.
Asahi Kasei Fibers sells a polypropylene spunbond nonwoven fabric called Eltas and a
spandex fiber called Roica. Eltas comes in waterproof, water-permeable, and ultrafine
filament types. The brand accounts for about one-third of all nonwoven fabric sales and
about 70% of sales for use in hygiene products, particularly disposable diapers. Almost all
overseas sales appear to be for use in diapers. With demand for Eltas growing steadily
both in Japan and overseas, in November 2012 the company brought on stream a new
production facility in Thailand, with 20,000t annual capacity on lines using proprietary
technology. In November 2015 the company is planning a second phase of expansion,
adding another 20,000t of capacity to take the total to 40,000t.
In Thailand, Asahi Kasei is also planning a 50% increase in production capacity for its
Roica brand of Spandex (polyurethane elastic fiber), the reason being robust demand for
disposable diaper gather materials. The new capacity is scheduled for completion in early
2017, and will take annual capacity from 6,000t at present to 9,000t. Asahi Kasei's
polyurethane elastic fiber production capacity totals 23,600t, comprising 9,000t at its
Moriyama production site, 5,600t in Taiwan, 3,000t in China, and 6,000t in Thailand. With
the capacity expansion in China, the total will rise to 26,600t. Roica is manufactured using
the dry spinning process. It has excellent stretch, and can be combined with many
different materials, ranging from synthetic fibers such as nylon and polyester to natural
fibers like wool and cotton. Aside from being used in disposable diapers, it has many other
applications including inner and outer wear and household fabrics.
In addition to a spunbond nonwoven fabric called Syntex for use in hygiene products and a
similar industrial-use fabric called Tafnel, Mitsui Chemicals markets a breathable film for
disposable diapers called Espoir. Fabrics for use in hygiene products account for about
80% of total sales in Mitsui Chemicals’ nonwoven fabric business. Management divides its
nonwoven products into three categories according to quality—general-purpose, functional,
and performance—and has outlined plans to specialize in the latter two. The company
estimates that it already has captured a 60% share of the Asian market for performance
nonwoven fabric used in hygiene products, and it aims to expand capacity and sales
sufficiently to raise this to 80% in 2015.
According to the trade journal Nonwovens Industry, Mitsui Chemicals had nonwoven fabric
sales of $186mn in 2013 (¥18.6bn, at USD/JPY of 100). PP spunbond nonwovens
generate the bulk of sales. Manufacturing subsidiary Sunrex Industry (in Yokkaichi, Mie
Prefecture) has five production lines with an annual production capacity of 49,000t, while
Mitsui Hygiene Materials Thailand (MHM) has two lines with capacity of 30,000t, and
Mitsui Chemicals Nonwovens (Tianjin) (MCNT) has one line with capacity of 15,000t, for a
total of 94,000t.
Figure 56: Domestic production of synthetic fiber
declining, but that for nonwoven fabrics remains high
Figure 57: Asian demand for PP spunbond increasing
rapidly
0
5,000
10,000
15,000
20,000
25,000
30,000
35,000
0
20,000
40,000
60,000
80,000
100,000
120,000
140,000
160,000
180,000
Jan
-87
Ma
y-8
8
Se
p-8
9
Jan
-91
Ma
y-9
2
Se
p-9
3
Jan
-95
Ma
y-9
6
Sep-9
7
Jan
-99
Ma
y-0
0
Se
p-0
1
Jan
-03
Ma
y-0
4
Se
p-0
5
Jan
-07
Ma
y-0
8
Se
p-0
9
Jan
-11
Ma
y-1
2
Sep-1
3
Jan
-15
Synthetic fiber total (LHS, t) Non-woven fabric (RHS,t)
0
100
200
300
400
500
600
700
800
900
1000
2013 2016 E 2020 E
(000 tons)
Source: Ministry of Economy, Trade and Industry (METI) Source: Toray
Asahi Kasei also
manufacturing in Thailand
Asahi Kasei also increasing
output of spandex for use in
disposable diaper gathers
Mitsui Chemicals
specializing in functional
products and
high-performance products

21 January 2015
Chemical and Consumer Sector: Diaper value chain survey 33
Microporous film
In 2010, Tokuyama (4043) expanded capacity at its Chinese subsidiary Shanghai
Tokuyama Plastics for production of its polyethylene microporous film Porum, used in
disposable diaper back sheets. This took total capacity to 240mn m2. Porum is a
microporous film with a polyethylene-based porous structure that allows gases, including
water vapor and other types of moisture, to pass through, while blocking liquids such as
water. Tokuyama has Porum production capacity of 240mn m² at both the Tokuyama plant
and Shanghai Tokuyama Plastics, and in autumn 2013 it boosted capacity at a second
Chinese production subsidiary, Tianjin Tokuyama Plastics, to 240mn m².
With demand for Porum likely to continue to expand as the disposable diaper market in
China grows, management believes additional capacity expansion investment will become
necessary. It plans to add another production line in Shanghai, which would boost
combined annual capacity by 120mn m², to 360mn m². Management will flush out details
of the plan in terms supply–demand balance, demand outlook, and profitability. If these
plans are realized, Porum capacity in China could climb to 600mn m² across five lines.
Diaper penetration in China is expected to grow from a little over 30% in 2010 to 60% by
2020. Driven by this expansion in usage, diaper demand has been growing at an annual
rate of 20%. In addition, average daily usage in China in still only about half that in Japan,
at just three diapers per user, suggesting that Chinese diaper demand will see continued
strong growth going forward. Within this favorable operating environment, Tokuyama,
through its local subsidiaries Tianjin Tokuyama Plastics and Shanghai Tokuyama Plastics,
will continue to expand the volume of Porum it supplies to Japanese disposable diaper
manufacturers in China.
Hot-melt adhesive
Demand for hot-melt adhesive used for bonding disposable diapers is also strong. Hot-
melt is a type of adhesive that melts and adheres when heated (to 80–100° C). It offers the
advantages of quick curing and no release of gases because no solvents are used.
Thermoplastics like ethylene-vinyl acetate (EVA) are used as the base material. With
expanding production of disposable diapers providing a tailwind, global sales volume of
Zeon’s (4205) products made from petroleum resin and styrene-isoprene-styrene (SIS)
block copolymer are growing. Adhesives for disposable diapers, comprising a mixture of
petroleum resin and SIS or wax, are used in the layering structure of the diaper to adjust
the hardness of the outer shell and inner liner. With demand for disposable diapers
growing in emerging markets with large populations, like China, India, and Indonesia, we
expect global demand for hot-melt adhesives used in disposable diapers to grow at an
annual rate of about 5%.
Zeon supplies two of the raw materials used in hot-melt adhesive for disposable diapers—
petroleum resin (annual capacity of 40,000t at the Mizushima plant, 40,000t at the Thai
plant including recently added capacity) and SIS (45,000t at Mizushima). Amid growing
demand for use in disposable diapers and other applications, production of both these
materials continues to run at full capacity. Global demand for SIS is growing at an average
annual clip of 4%, and Zeon is looking at building new plants to meet future demand. The
company exports 80% of its SIS. Given this, and the availability of raw materials in Japan,
we think it likely any new plants will be situated overseas.
Tokuyama boosting
microporous film capacity in
China
Disposable diaper adhesive
demand also growing
Zeon operates petroleum
resin plant in Thailand

21 January 2015
Chemical and Consumer Sector: Diaper value chain survey 34
Stocks to watch Kao (4452, OUTPERFORM, TP ¥5,500)
Fundamentals: In Japan and Chinese-speaking nations, we believe Kao’s disposable
diaper business has greater growth potential than those of rivals. Kao’s diapers are
gaining popularity among mainland China’s affluent consumers, who recognize quality,
and we think this pattern gained momentum in 2014. Kao is also making progressive
inroads into the Russian market. As is the case in China, there is growing demand in
Russia for high-end diapers. Kao is now laying the foundations for increasing exports to
Russia as well as to China. In Indonesia, it is planning a full-scale entry into the disposable
diaper market from early 2015. We see ample growth potential over the medium to long
term, thanks in part to synergies from a shared sales channel with feminine hygiene
products—namely the traditional small local shops called warung, which are an important
sales channel in Indonesia.
Investment case: There are five main reasons for our bullish stance on Kao:
(1) sustained growth in sales of high-value-added products in Japan and Asia;
(2) expectations of a 10% CAGR for OP over the next three years; (3) the likelihood that
bad news will be exhausted with the booking in 4Q of extraordinary losses to cover
Kanebo-related compensation; (4) moves to strengthen shareholder returns, backed by
the company’s solid finances; and (5) the stock continuing to look undervalued in the
global HPC sector.
Effective inbound demand from Asia (including exports by agents) started to increase in
2014. Disposable diapers are a typical example in Kao's case, but other products are also
expanding. We expect drugstores' and other stores' tax-exemption measures to get fully
under way in 2015, and think Kao should benefit. We believe the stock market view that
Kao is not a growth stock due to its high domestic sales weighting should gradually erode.
We look for expectations to rise as the company consolidates its product categories and
ramps up moves into local Asian markets.
Earnings outlook: We estimate FY12/14 OP of ¥133bn, just above guidance for ¥130bn.
Our forecast reflects the likelihood of Kao booking extraordinary losses of around ¥20bn in
4Q, arising from additional compensation paid to customers who experienced vitiligo-like
symptoms after using Kanebo products. We expect OP CAGR of 10% over three years
starting in 2015 (not adjusted for the expected application of IFRS in 2016). We forecast
FY12/15 OP of ¥150bn. The ¥17bn YoY increase breaks down into a net ¥6bn from lower
raw materials prices, ¥6bn in cost savings, and ¥5bn due to higher sales volume and
product mix improvement. As lower raw materials prices gave an ¥18bn boost in FY3/10,
prices for raw materials derived from naphtha might drop even lower than we envision if
crude oil prices remain at current levels.
Catalysts/risks: Catalysts include: (1) confirmation of growing sales of high-value-added
products in Japan and Asia; (2) the announcement of extraordinary losses related to
Kanebo cosmetics; and (3) lower raw material costs. Downside risks include: (1) a shift
toward low-price products and a decline in consumption in the domestic market; (2) a
substantial increase in raw materials prices; and (3) a slowdown in the Asia business.
Valuation: We derive our TP by applying an EV/EBITDA multiple of around 10x (average
for Japan’s HPC sector) to our FY12/16 forecasts.

21 January 2015
Chemical and Consumer Sector: Diaper value chain survey 35
Figure 58: Kao (4452) – Earnings forecast summary
¥mn YoY (%) ¥mn YoY (%) ¥mn YoY (%) ¥mn YoY (%) ¥ YoY (%)
Consolidated
13/12 Actual 1,315,217 - 124,656 - 128,053 - 64,764 - 126.0 -
14/12 CS E 1,373,000 4.4 133,000 6.7 137,000 7.0 71,000 9.6 138.6 10.0
CoE 1,390,000 5.7 130,000 4.3 133,000 3.9 75,000 15.8 147.5 17.1
IBES E 1,389,365 5.6 133,425 7.0 135,869 6.1 77,977 20.4 156.7 24.3
15/12 CS E 1,452,000 5.8 150,000 12.8 152,700 11.5 87,600 23.4 175.5 26.6
IBES E 1,447,217 4.2 148,665 11.4 152,674 12.4 91,049 16.8 181.5 15.9
16/12 CS E 1,512,000 4.1 170,000 13.3 172,700 13.1 100,500 14.7 201.3 14.7
IBES E 1,502,485 3.8 167,753 12.8 173,832 13.9 103,724 13.9 214.1 18.0
17/12 CS E 1,581,000 4.6 177,000 4.1 179,700 4.1 106,000 5.5 212.4 5.5
Sales Operating profit Recurring profit Net profit EPS
Source: Company data, I/B/E/S, Credit Suisse estimates
Sanyo Chemical Industries (4471, OUTPERFORM, TP
¥950)
Fundamentals: Sanyo Chemical manufactures and sells around 3,000 products referred
to collectively as performance chemicals. Many of these are urethane derivatives or
polymers made using surfactant technology. The company led the world in starting
commercial SAP production in 1978. It currently ranks fifth globally in terms of SAP
production capacity, behind Nippon Shokubai, Evonik Industries, BASF and Sumitomo
Seika.
Investment case: Sanyo Chemical is the only company in the world using two methods to
manufacture SAP, enabling it to supply SAP products optimized either for degree of
absorbency or speed of absorption. We think the company is well positioned by virtue of
its technical strengths to benefit from growth in global demand for disposable diapers over
the medium term. Moreover, we think the company can grow more swiftly than the broader
market as it expands into new types of SAP products that improve the way in which the
diaper disperses urine, and feature enhanced levels of urine absorbency. In our view, the
share price does not adequately reflect potential for medium-term growth in SAP earnings.
Earnings outlook: Among the chemicals and synthetic fiber manufacturers in our
coverage, Sanyo Chemical is the best placed to benefit from yen weakness and lower
naphtha prices. We calculate that every ¥1,000/kl fall in the price of naphtha adds ¥420mn
to annual OP. Company guidance is premised on a naphtha price of ¥67,000/kl. If we
assume an average naphtha price of ¥60,000/kl in 2H, this would represent a ¥7,000/kl fall
from the assumed level, signifying a decrease of just under ¥1.5bn in 2H naphtha costs. If
USD/JPY averages ¥10 lower than the company's assumption of 102, this would add a
further ¥1.0bn to 2H OP. Based on the above, we think Sanyo Chemical is more than
likely to raise its FY3/15 OP guidance, currently ¥8.8bn versus our ¥10.0bn estimate.
Catalysts/risks: Catalysts include confirmation of growth for SAP demand and stronger
sales of lubricating oil additives for automobiles, materials for auto interiors, and other new
products. Risks include a worsening supply–demand balance for SAP or reversal of the
yen’s weakening trend.
Valuation: Our ¥950 TP is based on FY3/16E EPS of ¥78.9 and a P/E of 12x, the average
for global SAP makers.

21 January 2015
Chemical and Consumer Sector: Diaper value chain survey 36
Figure 59: Sanyo Chemical (4471) – Earnings forecast summary
¥bn YoY (%) ¥bn YoY (%) ¥bn YoY (%) ¥bn YoY (%) ¥ YoY (%)
Consolidated
14/3 A 165.2 15.8 8.1 31.1 9.2 26.8 4.9 17.7 44.6 17.7
15/3 CS E 174.0 5.3 10.0 23.3 11.2 21.6 6.8 38.2 61.7 38.2
CoE 172.0 4.1 8.8 8.5 10.0 8.5 6.0 22.0 54.4 22.0
Shikiho 170.0 2.9 8.2 1.1 9.4 2.0 5.7 15.9 51.7 15.9
IBES E 172.9 4.7 9.2 13.4 - - 6.2 26.0 56.2 26.0
16/3 CS E 198.0 13.8 12.5 25.0 13.7 22.3 8.7 27.9 78.9 27.9
IBES E 187.1 8.2 11.2 22.1 - - 7.6 22.0 68.6 22.0
17/3 CS E 221.0 11.6 15.5 24.0 16.7 21.9 10.8 24.1 97.9 24.1
IBES E 203.6 8.8 12.7 12.6 - - 8.7 15.0 78.9 15.0
EPSSales Operating profit Recurring profit Net profit
Source: Company data, Japan Company Handbook by Toyo Keizai, I/B/E/S, Credit Suisse estimates

21 January 2015
Chemical and Consumer Sector: Diaper value chain survey 37
Companies Mentioned (Price as of 20-Jan-2015)
Arkema (AKE.PA, €58.91) Asahi Kasei Seni KK (Unlisted) BASF (BASFn.DE, €74.08) Cellulosa SCA (SCAa.ST, Skr177.0) DSG Intl Thai (DSGT.BK, Bt7.7) Daio Paper (3880.T, ¥943) Dow Chemical Company (DOW.N, $44.13) Evonik (EVKn.DE, €27.22) Formosa Plastics (1301.TW, NT$75.5) Hengan International (1044.HK, HK$82.65) JNC (Unlisted) Kao (4452.T, ¥5,011) Kimberly-Clark Corporation (KMB.N, $117.53) LG Chem Ltd. (051910.KS, W183,000) Mitsubishi Chemical Holdings (4188.T, ¥575) Mitsui Chemicals (4183.T, ¥333) Moresco (5018.T, ¥2,119) NA Industries (Unlisted) Nippon Shokubai (4114.T, ¥1,574) Nippon Synthetic (4201.T, ¥696) Procter & Gamble Co. (PG.N, $91.19) SDP Global (Unlisted) Sanyo Chemical (4471.T, ¥872) Softex Paper (Unlisted) Sumitomo Seika (4008.T, ¥777) Tokuyama (4043.T, ¥238) Toray Industries (3402.T, ¥973) Toyota Tsusho (8015.T, ¥2,689) Unicharm (8113.T, ¥3,072) Zeon (4205.T, ¥1,150) Zuiko (6279.T, ¥4,935)
Disclosure Appendix
Important Global Disclosures
Masami Sawato and Masashi Mori, each certify, with respect to the companies or securities that the individual analyzes, that (1) the views expressed in this report accurately reflect his or her personal views about all of the subject companies and securities and (2) no part of his or her compensation was, is or will be directly or indirectly related to the specific recommendations or views expressed in this report.
The analyst(s) responsible for preparing this research report received Compensation that is based upon various factors including Credit Suisse's total revenues, a portion of which are generated by Credit Suisse's investment banking activities
As of December 10, 2012 Analysts’ stock rating are defined as follows:
Outperform (O) : The stock’s total return is expected to outperform the relevant benchmark*over the next 12 months.
Neutral (N) : The stock’s total return is expected to be in line with the relevant benchmark* over the next 12 months.
Underperform (U) : The stock’s total return is expected to underperform the relevant benchmark* over the next 12 months.
*Relevant benchmark by region: As of 10th December 2012, Japanese ratings are based on a stock’s total return relative to the analyst's coverage universe which consists of all companies covered by the analyst within the relevant sector, with Outperforms representing the most attractive, Neutrals the less attractive, and Underperforms the least attractive investment opportunities. As of 2nd October 2012, U.S. and Canadian as well as European ra tings are based on a stock’s total return relative to the analyst's coverage universe which consists of all companies covered by the analyst within the relevant sector, with Outperforms representing the most attractive, Neutrals the less attractive, and Underperforms the least attractive investment opportunities. Fo r Latin American and non-Japan Asia stocks, ratings are based on a stock’s total return relative to the average total return of the relevant country or regional benchmark; prior to 2nd October 2012 U.S. and Canadian ratings were based on (1) a stock’s absolute total return potential to its current share price and (2) the relative attractiveness of a stock’s total return potentia l within an analyst’s coverage universe. For Australian and New Zealand stocks, 12 -month rolling yield is incorporated in the absolute total return calculation and a 15% and a 7.5% threshold replace the 10-15% level in the Outperform and Underperform stock rating definitions, respectively. The 15% and 7.5% thresholds replace the +10-15% and -10-15% levels in the Neutral stock rating definition, respectively. Prior to 10th December 2012, Japanese ratings were based on a stock’s total return relative to the average total return of the relevant country or regional benchmark.
Restricted (R) : In certain circumstances, Credit Suisse policy and/or applicable law and regulations preclude certain types of communications, including an investment recommendation, during the course of Credit Suisse's engagement in an investment banking transaction and in certain other circumstances.
Volatility Indicator [V] : A stock is defined as volatile if the stock price has moved up or down by 20% or more in a month in at least 8 of the past 24 months or the analyst expects significant volatility going forward.
Analysts’ sector weightings are distinct from analysts’ stock ratings and are based on the analyst’s expectations for the fundamentals and/or valuation of the sector* relative to the group’s historic fundamentals and/or valuation:
Overweight : The analyst’s expectation for the sector’s fundamentals and/or valuation is favorable over the next 12 months.

21 January 2015
Chemical and Consumer Sector: Diaper value chain survey 38
Market Weight : The analyst’s expectation for the sector’s fundamentals and/or valuation is neutral over the next 12 months.
Underweight : The analyst’s expectation for the sector’s fundamentals and/or valuation is cautious over the next 12 months.
*An analyst’s coverage sector consists of all companies covered by the analyst within the relevant sector. An analyst may cover multiple sectors.
Credit Suisse's distribution of stock ratings (and banking clients) is:
Global Ratings Distribution
Rating Versus universe (%) Of which banking clients (%)
Outperform/Buy* 46% (53% banking clients)
Neutral/Hold* 38% (50% banking clients)
Underperform/Sell* 14% (43% banking clients)
Restricted 2%
*For purposes of the NYSE and NASD ratings distribution disclosure requirements, our stock ratings of Outperform, Neutral, and Underperform most closely correspond to Buy, Hold, and Sell, respectively; however, the meanings are not the same, as our stock ratings are determin ed on a relative basis. (Please refer to definitions above.) An investor's decision to buy or sell a security should be based on investment objectives, current holdin gs, and other individual factors.
Credit Suisse’s policy is to update research reports as it deems appropriate, based on developments with the subject company, the sector or the market that may have a material impact on the research views or opinions stated herein.
Credit Suisse's policy is only to publish investment research that is impartial, independent, clear, fair and not misleading. For more detail please refer to Credit Suisse's Policies for Managing Conflicts of Interest in connection with Investment Research: http://www.csfb.com/research-and-analytics/disclaimer/managing_conflicts_disclaimer.html
Credit Suisse does not provide any tax advice. Any statement herein regarding any US federal tax is not intended or written to be used, and cannot be used, by any taxpayer for the purposes of avoiding any penalties.
See the Companies Mentioned section for full company names
The subject company (BASFn.DE, DOW.N, 1301.TW, 1044.HK, KMB.N, 051910.KS, PG.N) currently is, or was during the 12-month period preceding the date of distribution of this report, a client of Credit Suisse.
Credit Suisse provided investment banking services to the subject company (PG.N) within the past 12 months.
Credit Suisse provided non-investment banking services to the subject company (DOW.N) within the past 12 months
Credit Suisse has managed or co-managed a public offering of securities for the subject company (PG.N) within the past 12 months.
Credit Suisse has received investment banking related compensation from the subject company (PG.N) within the past 12 months
Credit Suisse expects to receive or intends to seek investment banking related compensation from the subject company (AKE.PA, DOW.N, 1301.TW, 1044.HK, KMB.N, 051910.KS, PG.N, 4043.T, 8113.T, 4183.T, 4205.T, 4114.T, 3402.T, 4452.T) within the next 3 months.
Credit Suisse has received compensation for products and services other than investment banking services from the subject company (DOW.N) within the past 12 months
As of the date of this report, Credit Suisse makes a market in the following subject companies (DOW.N, KMB.N, PG.N).
As of the end of the preceding month, Credit Suisse beneficially own 1% or more of a class of common equity securities of (AKE.PA, BASFn.DE, 1301.TW, 4188.T).
As of the date of this report, an analyst involved in the preparation of this report has the following material conflict of interest with the subject company (PG.N). An analyst or a member of the analyst's household has a long position in the common stock of (PG).
For other important disclosures concerning companies featured in this report, including price charts, please visit the website at https://rave.credit-suisse.com/disclosures or call +1 (877) 291-2683.
Important Regional Disclosures
Singapore recipients should contact Credit Suisse AG, Singapore Branch for any matters arising from this research report.
The analyst(s) involved in the preparation of this report have not visited the material operations of the subject company (AKE.PA, BASFn.DE, DOW.N, EVKn.DE, 1301.TW, 1044.HK, KMB.N, 051910.KS, PG.N, PG.N, 4043.T, 8113.T, 4183.T, 4471.T, 4188.T, 4205.T, 4114.T, 3402.T, 4452.T) within the past 12 months
Restrictions on certain Canadian securities are indicated by the following abbreviations: NVS--Non-Voting shares; RVS--Restricted Voting Shares; SVS--Subordinate Voting Shares.
Individuals receiving this report from a Canadian investment dealer that is not affiliated with Credit Suisse should be advised that this report may not contain regulatory disclosures the non-affiliated Canadian investment dealer would be required to make if this were its own report.
For Credit Suisse Securities (Canada), Inc.'s policies and procedures regarding the dissemination of equity research, please visit http://www.csfb.com/legal_terms/canada_research_policy.shtml.
The following disclosed European company/ies have estimates that comply with IFRS: (BASFn.DE).
21 January 2015
Chemical and Consumer Sector: Diaper value chain survey 39
Credit Suisse has acted as lead manager or syndicate member in a public offering of securities for the subject company (BASFn.DE, PG.N) within the past 3 years.
As of the date of this report, Credit Suisse acts as a market maker or liquidity provider in the equities securities that are the subject of this report.
Principal is not guaranteed in the case of equities because equity prices are variable.
Commission is the commission rate or the amount agreed with a customer when setting up an account or at any time after that.
To the extent this is a report authored in whole or in part by a non-U.S. analyst and is made available in the U.S., the following are important disclosures regarding any non-U.S. analyst contributors: The non-U.S. research analysts listed below (if any) are not registered/qualified as research analysts with FINRA. The non-U.S. research analysts listed below may not be associated persons of CSSU and therefore may not be subject to the NASD Rule 2711 and NYSE Rule 472 restrictions on communications with a subject company, public appearances and trading securities held by a research analyst account.
Credit Suisse Securities (Japan) Limited ................................................................................................................ Masami Sawato ; Masashi Mori
For Credit Suisse disclosure information on other companies mentioned in this report, please visit the website at https://rave.credit-suisse.com/disclosures or call +1 (877) 291-2683.

21 January 2015
Chemical and Consumer Sector: Diaper value chain survey 40
References in this report to Credit Suisse include all of the subsidiaries and affiliates of Credit Suisse operating under its investment banking division. For more information on our structure, please use the following link: https://www.credit-suisse.com/who_we_are/en/This report may contain material that is not directed to, or intended for distribution to or use by, any person or entity who is a citizen or resident of or located in any locality, state, country or other jurisdiction where such distribution, publication, availability or use would be contrary to law or regulation or which would subject Credit Suisse AG or its affiliates ("CS") to any registration or licensing requirement within such jurisdiction. All material presented in this report, unless specifically indicated otherwise, is under copyright to CS. None of the material, nor its content, nor any copy of it, may be altered in any way, transmitted to, copied or distributed to any other party, without the prior express written permission of CS. All trademarks, service marks and logos used in this report are trademarks or service marks or registered trademarks or service marks of CS or its affiliates. The information, tools and material presented in this report are provided to you for information purposes only and are not to be used or considered as an offer or the solicitation of an offer to sell or to buy or subscribe for securities or other financial instruments. CS may not have taken any steps to ensure that the securities referred to in this report are suitable for any particular investor. CS will not treat recipients of this report as its customers by virtue of their receiving this report. The investments and services contained or referred to in this report may not be suitable for you and it is recommended that you consult an independent investment advisor if you are in doubt about such investments or investment services. Nothing in this report constitutes investment, legal, accounting or tax advice, or a representation that any investment or strategy is suitable or appropriate to your individual circumstances, or otherwise constitutes a personal recommendation to you. CS does not advise on the tax consequences of investments and you are advised to contact an independent tax adviser. Please note in particular that the bases and levels of taxation may change. Information and opinions presented in this report have been obtained or derived from sources believed by CS to be reliable, but CS makes no representation as to their accuracy or completeness. CS accepts no liability for loss arising from the use of the material presented in this report, except that this exclusion of liability does not apply to the extent that such liability arises under specific statutes or regulations applicable to CS. This report is not to be relied upon in substitution for the exercise of independent judgment. CS may have issued, and may in the future issue, other communications that are inconsistent with, and reach different conclusions from, the information presented in this report. Those communications reflect the different assumptions, views and analytical methods of the analysts who prepared them and CS is under no obligation to ensure that such other communications are brought to the attention of any recipient of this report. Some investments referred to in this report will be offered solely by a single entity and in the case of some investments solely by CS, or an associate of CS or CS may be the only market maker in such investments. Past performance should not be taken as an indication or guarantee of future performance, and no representation or warranty, express or implied, is made regarding future performance. Information, opinions and estimates contained in this report reflect a judgment at its original date of publication by CS and are subject to change without notice. The price, value of and income from any of the securities or financial instruments mentioned in this report can fall as well as rise. The value of securities and financial instruments is subject to exchange rate fluctuation that may have a positive or adverse effect on the price or income of such securities or financial instruments. Investors in securities such as ADR's, the values of which are influenced by currency volatility, effectively assume this risk. Structured securities are complex instruments, typically involve a high degree of risk and are intended for sale only to sophisticated investors who are capable of understanding and assuming the risks involved. The market value of any structured security may be affected by changes in economic, financial and political factors (including, but not limited to, spot and forward interest and exchange rates), time to maturity, market conditions and volatility, and the credit quality of any issuer or reference issuer. Any investor interested in purchasing a structured product should conduct their own investigation and analysis of the product and consult with their own professional advisers as to the risks involved in making such a purchase. Some investments discussed in this report may have a high level of volatility. High volatility investments may experience sudden and large falls in their value causing losses when that investment is realised. Those losses may equal your original investment. Indeed, in the case of some investments the potential losses may exceed the amount of initial investment and, in such circumstances, you may be required to pay more money to support those losses. Income yields from investments may fluctuate and, in consequence, initial capital paid to make the investment may be used as part of that income yield. Some investments may not be readily realisable and it may be difficult to sell or realise those investments, similarly it may prove difficult for you to obtain reliable information about the value, or risks, to which such an investment is exposed. This report may provide the addresses of, or contain hyperlinks to, websites. Except to the extent to which the report refers to website material of CS, CS has not reviewed any such site and takes no responsibility for the content contained therein. Such address or hyperlink (including addresses or hyperlinks to CS's own website material) is provided solely for your convenience and information and the content of any such website does not in any way form part of this document. Accessing such website or following such link through this report or CS's website shall be at your own risk. This report is issued and distributed in Europe (except Switzerland) by Credit Suisse Securities (Europe) Limited, One Cabot Square, London E14 4QJ, England, which is authorised by the Prudential Regulation Authority and regulated by the Financial Conduct Authority and the Prudential Regulation Authority. This report is being distributed in Germany by Credit Suisse Securities (Europe) Limited Niederlassung Frankfurt am Main regulated by the Bundesanstalt fuer Finanzdienstleistungsaufsicht ("BaFin"). This report is being distributed in the United States and Canada by Credit Suisse Securities (USA) LLC; in Switzerland by Credit Suisse AG; in Brazil by Banco de Investimentos Credit Suisse (Brasil) S.A or its affiliates; in Mexico by Banco Credit Suisse (México), S.A. (transactions related to the securities mentioned in this report will only be effected in compliance with applicable regulation); in Japan by Credit Suisse Securities (Japan) Limited, Financial Instruments Firm, Director-General of Kanto Local Finance Bureau (Kinsho) No. 66, a member of Japan Securities Dealers Association, The Financial Futures Association of Japan, Japan Investment Advisers Association, Type II Financial Instruments Firms Association; elsewhere in Asia/ Pacific by whichever of the following is the appropriately authorised entity in the relevant jurisdiction: Credit Suisse (Hong Kong) Limited, Credit Suisse Equities (Australia) Limited, Credit Suisse Securities (Thailand) Limited, regulated by the Office of the Securities and Exchange Commission, Thailand, having registered address at 990 Abdulrahim Place, 27th Floor, Unit 2701, Rama IV Road, Silom, Bangrak, Bangkok 10500, Thailand, Tel. +66 2614 6000, Credit Suisse Securities (Malaysia) Sdn Bhd, Credit Suisse AG, Singapore Branch, Credit Suisse Securities (India) Private Limited (CIN no. U67120MH1996PTC104392) regulated by the Securities and Exchange Board of India (registration Nos. INB230970637; INF230970637; INB010970631; INF010970631), having registered address at 9th Floor, Ceejay House, Dr.A.B. Road, Worli, Mumbai - 18, India, T- +91-22 6777 3777, Credit Suisse Securities (Europe) Limited, Seoul Branch, Credit Suisse AG, Taipei Securities Branch, PT Credit Suisse Securities Indonesia, Credit Suisse Securities (Philippines ) Inc., and elsewhere in the world by the relevant authorised affiliate of the above. Research on Taiwanese securities produced by Credit Suisse AG, Taipei Securities Branch has been prepared by a registered Senior Business Person. Research provided to residents of Malaysia is authorised by the Head of Research for Credit Suisse Securities (Malaysia) Sdn Bhd, to whom they should direct any queries on +603 2723 2020. This report has been prepared and issued for distribution in Singapore to institutional investors, accredited investors and expert investors (each as defined under the Financial Advisers Regulations) only, and is also distributed by Credit Suisse AG, Singapore branch to overseas investors (as defined under the Financial Advisers Regulations). By virtue of your status as an institutional investor, accredited investor, expert investor or overseas investor, Credit Suisse AG, Singapore branch is exempted from complying with certain compliance requirements under the Financial Advisers Act, Chapter 110 of Singapore (the "FAA"), the Financial Advisers Regulations and the relevant Notices and Guidelines issued thereunder, in respect of any financial advisory service which Credit Suisse AG, Singapore branch may provide to you. This information is being distributed by Credit Suisse AG, Dubai Branch, duly licensed and regulated by the Dubai Financial Services Authority (DFSA), and is directed at Professional Clients or Market Counterparties only, as defined by the DFSA. The financial products or financial services to which the information relates will only be made available to a client who meets the regulatory criteria to be a Professional Client or Market Counterparty only, as defined by the DFSA, and is not intended for any other person. This research may not conform to Canadian disclosure requirements. In jurisdictions where CS is not already registered or licensed to trade in securities, transactions will only be effected in accordance with applicable securities legislation, which will vary from jurisdiction to jurisdiction and may require that the trade be made in accordance with applicable exemptions from registration or licensing requirements. Non-U.S. customers wishing to effect a transaction should contact a CS entity in their local jurisdiction unless governing law permits otherwise. U.S. customers wishing to effect a transaction should do so only by contacting a representative at Credit Suisse Securities (USA) LLC in the U.S. Please note that this research was originally prepared and issued by CS for distribution to their market professional and institutional investor customers. Recipients who are not market professional or institutional investor customers of CS should seek the advice of their independent financial advisor prior to taking any investment decision based on this report or for any necessary explanation of its contents. This research may relate to investments or services of a person outside of the UK or to other matters which are not authorised by the Prudential Regulation Authority and regulated by the Financial Conduct Authority and the Prudential Regulation Authority or in respect of which the protections of the Prudential Regulation Authority and Financial Conduct Authority for private customers and/or the UK compensation scheme may not be available, and further details as to where this may be the case are available upon request in respect of this report. CS may provide various services to US municipal entities or obligated persons ("municipalities"), including suggesting individual transactions or trades and entering into such transactions. Any services CS provides to municipalities are not viewed as "advice" within the meaning of Section 975 of the Dodd-Frank Wall Street Reform and Consumer Protection Act. CS is providing any such services and related information solely on an arm's length basis and not as an advisor or fiduciary to the municipality. In connection with the provision of the any such services, there is no agreement, direct or indirect, between any municipality (including the officials, management, employees or agents thereof) and CS for CS to provide advice to the municipality. Municipalities should consult with their financial, accounting and legal advisors regarding any such services provided by CS. In addition, CS is not acting for direct or indirect compensation to solicit the municipality on behalf of an unaffiliated broker, dealer, municipal securities dealer, municipal advisor, or investment adviser for the purpose of obtaining or retaining an engagement by the municipality for or in connection with Municipal Financial Products, the issuance of municipal securities, or of an investment adviser to provide investment advisory services to or on behalf of the municipality. If this report is being distributed by a financial institution other than Credit Suisse AG, or its affiliates, that financial institution is solely responsible for distribution. Clients of that institution should contact that institution to effect a transaction in the securities mentioned in this report or require further information. This report does not constitute investment advice by Credit Suisse to the clients of the distributing financial institution, and neither Credit Suisse AG, its affiliates, and their respective officers, directors and employees accept any liability whatsoever for any direct or consequential loss arising from their use of this report or its content. Principal is not guaranteed. Commission is the commission rate or the amount agreed with a customer when setting up an account or at any time after that.
Copyright © 2015 CREDIT SUISSE AG and/or its affiliates. All rights reserved.
Investment principal on bonds can be eroded depending on sale price or market price. In addition, there are bonds on which investment principal can be eroded due to changes in redemption amounts. Care is required when investing in such instruments. When you purchase non-listed Japanese fixed income securities (Japanese government bonds, Japanese municipal bonds, Japanese government guaranteed bonds, Japanese corporate bonds) from CS as a seller, you will be requested to pay the purchase price only.
Connection series_diaper_012115_E.doc