chemical engineering research and design_s... · 858 chemical engineering research and design 92...
TRANSCRIPT

ATp
SAa
b
c
d
e
1
Imd2ap
A
0h
chemical engineering research and design 9 2 ( 2 0 1 4 ) 857–875
Contents lists available at ScienceDirect
Chemical Engineering Research and Design
j ourna l h omepage: www.elsev ier .com/ locate /cherd
sphaltene precipitation and deposition in oil reservoirs –echnical aspects, experimental and hybrid neural networkredictive tools
ohrab Zendehboudia,∗, Ali Shafieib, Alireza Bahadori c, Lesley A. Jamesa,li Elkameld, Ali Lohie
Faculty of Engineering and Applied Science, Memorial University of Newfoundland, St. John’s , NL , CanadaDepartment of Earth and Environmental Sciences, University of Waterloo, Waterloo, Ontario, CanadaSchool of Environment, Science and Engineering, Southern Cross University, Lismore, NSW, AustraliaDepartment of Chemical Engineering, University of Waterloo , Waterloo, Ontario, CanadaDepartment of Chemical Engineering, Ryerson University, Toronto, Ontario, Canada
a b s t r a c t
Precipitation of asphaltene is considered as an undesired process during oil production via natural depletion and
gas injection as it blocks the pore space and reduces the oil flow rate. In addition, it lessens the efficiency of the gas
injection into oil reservoirs. This paper presents static and dynamic experiments conducted to investigate the effects
of temperature, pressure, pressure drop, dilution ratio, and mixture compositions on asphaltene precipitation and
deposition. Important technical aspects of asphaltene precipitation such as equation of state, analysis tools, and
predictive methods are also discussed. Different methodologies to analyze asphaltene precipitation are reviewed,
as well. Artificial neural networks (ANNs) joined with imperialist competitive algorithm (ICA) and particle swarm
optimization (PSO) are employed to approximate asphaltene precipitation and deposition with and without CO2
injection. The connectionist model is built based on experimental data covering wide ranges of process and ther-
modynamic conditions. A good match was obtained between the real data and the model predictions. Temperature
and pressure drop have the highest influence on asphaltene deposition during dynamic tests. ICA-ANN attains more
reliable outputs compared with PSO-ANN, the conventional ANN, and scaling models. In addition, high pressure
microscopy (HPM) technique leads to more accurate results compared with quantitative methods when studying
asphaltene precipitation.
© 2013 The Institution of Chemical Engineers. Published by Elsevier B.V. All rights reserved.
Keywords: Oil production; Precipitation of asphaltene; Deposition of asphaltene; Laboratory data; Predictive tools;
Visual methods; Smart techniques
and Xia, 2004; Hirscberg et al., 1984; Pfeiffer and Saal, 1940).
. Introduction
n the petroleum industry, asphaltene precipitation is detri-ental to production operations since oil flow rate is impaired
ue to asphaltene precipitation/deposition (Akbarzadeh et al.,004; Greaves and Xia, 2004; Hirscberg et al., 1984; Pfeiffernd Saal, 1940; Sirvastava et al., 1995). This undesirable
henomenon results in a permeability drop and wettability∗ Corresponding author at: Faculty of Engineering and Applied Scien1B 3X5. Tel.: +1 519 888 4567x36157.
E-mail addresses: [email protected], szendehb@uwaReceived 7 July 2012; Received in revised form 12 June 2013; Accepted
263-8762/$ – see front matter © 2013 The Institution of Chemical Engittp://dx.doi.org/10.1016/j.cherd.2013.08.001
alteration. Prior to oil production, it seems vital to forecast theconditions that cause asphaltene precipitation and to deter-mine the quantity of the precipitated asphaltene.
Asphaltene is defined as association of aggregates with 2–6molecules per aggregate. The aggregates are either colloidalparticles or macromolecules (Akbarzadeh et al., 2004; Greaves
ce, Memorial University of Newfoundland, St. John’s, NL, Canada
terloo.ca (S. Zendehboudi). 5 August 2013
Asphaltenes form centers of the micelles in the association
neers. Published by Elsevier B.V. All rights reserved.

858 chemical engineering research and design 9 2 ( 2 0 1 4 ) 857–875
Nomenclature
Acronyms and abbreviationsADE asphaltene deposition envelopeANN artificial neural networkANOVA analysis of varianceAOP asphaltene onset pressureAP asphaltene precipitationART acoustic resonance techniqueBP back propagationBPP bubble point pressureCII colloidal instability indexCPM cross-polar microscopyEOR enhanced oil recoveryEOS equation of stateFH Flory–HugginsGOR gas/oil ratio (Sm3/Sm3)HPM high pressure microscopyICA imperialist competitive algorithmLCO light cycle oilLLE liquid–liquid equilibriumLST light scattering techniqueMAAPE maximum absolute percentage errorMEAE mean absolute errorMIAPE minimum absolute percentage errorMSE mean squared errorNIR near infra-redNN neural networkPC-SAFT perturbed-chain statistical associating fluid
theoryPSO particle swarm optimizationSAFT statistical associating fluid theorySARA saturates, asphaltenes, resins, aromaticsSDS solid detection systemSTO stock-tank oilVLE vapor–liquid equilibriumWAT wax appearance temperature
Variables and � two random variables that update the area
where colonies seek the imperialist�t time interval of particle advancement◦C degrees Celsiusc1 and c2 attraction of a particle toward pb and gb, cor-
respondinglyd the distance between the imperialist and the
colonyP pressurePb bubble point pressurePi initial pressurer1 and r2 two random parameters in the range of 0.0–1.0R2 correlation coefficientT temperature in ◦Ct timevi particle velocityw inertia factorx compositionymax and ymin maximum and minimum magnitudes of
parameter y
Greek letter� difference operator
� density (g/cm3)
Subscriptsmax maximummin minimum
of maltenes from colloidal view. The associated asphaltenesmake a pile bordered and spread in the oil by resins. Precipi-tation will take place when the resins are separated from thecolloid causing aggregation and phase separation (Akbarzadehet al., 2004; Greaves and Xia, 2004). From the macromolecularviewpoint, the associated asphaltene molecules are assumedto be independent like resins and other oil components.Precipitation in this case appears to be a liquid–liquid orliquid–solid phase transition. Molar mass and calorimetricexperiments confirm the macromolecular analysis (Agrawalaand Yarranton, 2001; Andersen and Speight, 2001; Greaves andXia, 2004; Pfeiffer and Saal, 1940). In general, asphaltene (aspolar part of the oil) in the form of a complex molecular struc-ture contains aromatic chains within its core and naphthenicpart surrounds the core. This complex component usually hasa fairly high molecular weight.
The mechanisms of solid deposition and characteristics ofheavy organic compounds are well illustrated in the open lit-erature. However, precise prediction and effective mitigationof solid deposition during oil production processes remainchallenging due to the complexity of the solid compounds.The precipitated solid is normally composed of heavy organiccompounds such as waxes, resins, and asphaltenes (Katz andBeu, 1945; Koots and Speight, 1975; Speight and Moschopedis,1981; Waxman et al., 1980; Yen et al., 1984). The most effectiveparameters contributing to asphaltene precipitation includepressure reduction and the solvent injection during oil produc-tion and/or EOR processes (Alizadeh et al., 2011; Speight, 1999).Through adding certain amount of a solvent to the petroleummixture, precipitation of asphaltene starts and follows by vari-ous phenomena such as assembling, aggregation, and growing(Firoozabadi, 1999; Nellensteyn, 1938). Asphaltenes are typ-ically insoluble in non-polar solvents (e.g., normal alkanes)but sufficiently are dissolved in aromatic solvents includingtoluene and benzene (Buckley and Wang, 2002; Speight, 1999).
Several models are reported for PVT and flow behavior ofasphaltene precipitation from hydrocarbon mixtures (Feng-Lan and Jie-nian, 2004; Hirscberg et al., 1984; Junior et al., 2006;Leontaritis and Mansoori, 1987; Mansoori, 1997; Ming-Fu et al.,2005; Nghiem et al., 1993; Nghiem and Coombe, 1997, 1998;Speight et al., 1985; Pan and Firoozabadi, 2000). The model-ing methods are usually classified in five groups includingpolymer solubility models, equation of state (EOS) models, col-loidal techniques, thermodynamic micellization approaches,and molecular thermodynamic models. Hirscberg et al. (1984)developed the solubility model to predict the heat of solution.The mixing heat of asphaltene/oil in this model is expressedin terms of the dissimilarity between the asphaltene and therest components of the crude oil in terms of solubility. Thereversible liquid–liquid equilibrium (LLE) is considered onthe basis of activity coefficients which are computed usingthe Flory–Huggins polymer solution model (Flory, 1942). Thisapproach properly simulates the effect of non-ideality of resinand asphaltene parts in phase equilibria computation. Other
researchers (e.g., Ming-Fu et al., 2005; Mansoori, 1997; Nghiem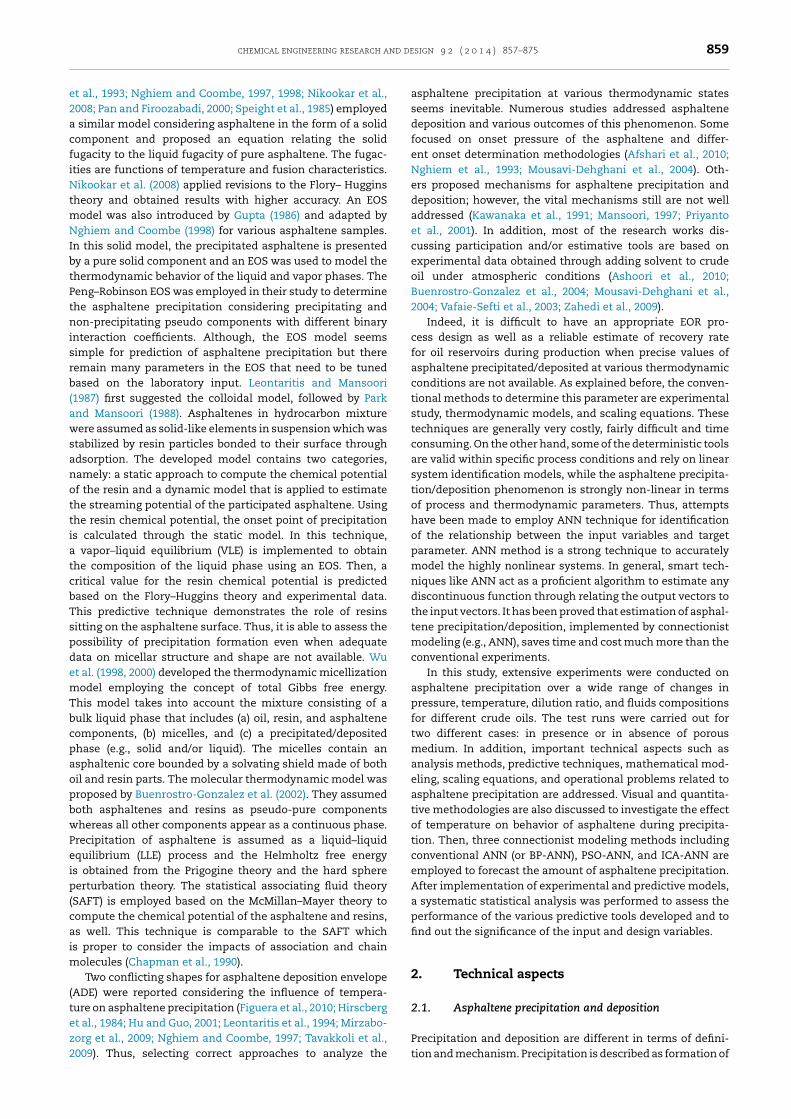
chemical engineering research and design 9 2 ( 2 0 1 4 ) 857–875 859
e2acfiNtmNIbtPtnisrb(awsanottiatcbTspdemTbcpaopbwPeip(caim
(t
z2
t al., 1993; Nghiem and Coombe, 1997, 1998; Nikookar et al.,008; Pan and Firoozabadi, 2000; Speight et al., 1985) employed
similar model considering asphaltene in the form of a solidomponent and proposed an equation relating the solidugacity to the liquid fugacity of pure asphaltene. The fugac-ties are functions of temperature and fusion characteristics.ikookar et al. (2008) applied revisions to the Flory– Huggins
heory and obtained results with higher accuracy. An EOSodel was also introduced by Gupta (1986) and adapted byghiem and Coombe (1998) for various asphaltene samples.
n this solid model, the precipitated asphaltene is presentedy a pure solid component and an EOS was used to model thehermodynamic behavior of the liquid and vapor phases. Theeng–Robinson EOS was employed in their study to determinehe asphaltene precipitation considering precipitating andon-precipitating pseudo components with different binary
nteraction coefficients. Although, the EOS model seemsimple for prediction of asphaltene precipitation but thereemain many parameters in the EOS that need to be tunedased on the laboratory input. Leontaritis and Mansoori
1987) first suggested the colloidal model, followed by Parknd Mansoori (1988). Asphaltenes in hydrocarbon mixtureere assumed as solid-like elements in suspension which was
tabilized by resin particles bonded to their surface throughdsorption. The developed model contains two categories,amely: a static approach to compute the chemical potentialf the resin and a dynamic model that is applied to estimatehe streaming potential of the participated asphaltene. Usinghe resin chemical potential, the onset point of precipitations calculated through the static model. In this technique,
vapor–liquid equilibrium (VLE) is implemented to obtainhe composition of the liquid phase using an EOS. Then, aritical value for the resin chemical potential is predictedased on the Flory–Huggins theory and experimental data.his predictive technique demonstrates the role of resinsitting on the asphaltene surface. Thus, it is able to assess theossibility of precipitation formation even when adequateata on micellar structure and shape are not available. Wut al. (1998, 2000) developed the thermodynamic micellizationodel employing the concept of total Gibbs free energy.
his model takes into account the mixture consisting of aulk liquid phase that includes (a) oil, resin, and asphalteneomponents, (b) micelles, and (c) a precipitated/depositedhase (e.g., solid and/or liquid). The micelles contain ansphaltenic core bounded by a solvating shield made of bothil and resin parts. The molecular thermodynamic model wasroposed by Buenrostro-Gonzalez et al. (2002). They assumedoth asphaltenes and resins as pseudo-pure componentshereas all other components appear as a continuous phase.
recipitation of asphaltene is assumed as a liquid–liquidquilibrium (LLE) process and the Helmholtz free energys obtained from the Prigogine theory and the hard sphereerturbation theory. The statistical associating fluid theory
SAFT) is employed based on the McMillan–Mayer theory toompute the chemical potential of the asphaltene and resins,s well. This technique is comparable to the SAFT whichs proper to consider the impacts of association and chain
olecules (Chapman et al., 1990).Two conflicting shapes for asphaltene deposition envelope
ADE) were reported considering the influence of tempera-ure on asphaltene precipitation (Figuera et al., 2010; Hirscberg
et al., 1984; Hu and Guo, 2001; Leontaritis et al., 1994; Mirzabo-
org et al., 2009; Nghiem and Coombe, 1997; Tavakkoli et al.,009). Thus, selecting correct approaches to analyze theasphaltene precipitation at various thermodynamic statesseems inevitable. Numerous studies addressed asphaltenedeposition and various outcomes of this phenomenon. Somefocused on onset pressure of the asphaltene and differ-ent onset determination methodologies (Afshari et al., 2010;Nghiem et al., 1993; Mousavi-Dehghani et al., 2004). Oth-ers proposed mechanisms for asphaltene precipitation anddeposition; however, the vital mechanisms still are not welladdressed (Kawanaka et al., 1991; Mansoori, 1997; Priyantoet al., 2001). In addition, most of the research works dis-cussing participation and/or estimative tools are based onexperimental data obtained through adding solvent to crudeoil under atmospheric conditions (Ashoori et al., 2010;Buenrostro-Gonzalez et al., 2004; Mousavi-Dehghani et al.,2004; Vafaie-Sefti et al., 2003; Zahedi et al., 2009).
Indeed, it is difficult to have an appropriate EOR pro-cess design as well as a reliable estimate of recovery ratefor oil reservoirs during production when precise values ofasphaltene precipitated/deposited at various thermodynamicconditions are not available. As explained before, the conven-tional methods to determine this parameter are experimentalstudy, thermodynamic models, and scaling equations. Thesetechniques are generally very costly, fairly difficult and timeconsuming. On the other hand, some of the deterministic toolsare valid within specific process conditions and rely on linearsystem identification models, while the asphaltene precipita-tion/deposition phenomenon is strongly non-linear in termsof process and thermodynamic parameters. Thus, attemptshave been made to employ ANN technique for identificationof the relationship between the input variables and targetparameter. ANN method is a strong technique to accuratelymodel the highly nonlinear systems. In general, smart tech-niques like ANN act as a proficient algorithm to estimate anydiscontinuous function through relating the output vectors tothe input vectors. It has been proved that estimation of asphal-tene precipitation/deposition, implemented by connectionistmodeling (e.g., ANN), saves time and cost much more than theconventional experiments.
In this study, extensive experiments were conducted onasphaltene precipitation over a wide range of changes inpressure, temperature, dilution ratio, and fluids compositionsfor different crude oils. The test runs were carried out fortwo different cases: in presence or in absence of porousmedium. In addition, important technical aspects such asanalysis methods, predictive techniques, mathematical mod-eling, scaling equations, and operational problems related toasphaltene precipitation are addressed. Visual and quantita-tive methodologies are also discussed to investigate the effectof temperature on behavior of asphaltene during precipita-tion. Then, three connectionist modeling methods includingconventional ANN (or BP-ANN), PSO-ANN, and ICA-ANN areemployed to forecast the amount of asphaltene precipitation.After implementation of experimental and predictive models,a systematic statistical analysis was performed to assess theperformance of the various predictive tools developed and tofind out the significance of the input and design variables.
2. Technical aspects
2.1. Asphaltene precipitation and deposition
Precipitation and deposition are different in terms of defini-tion and mechanism. Precipitation is described as formation of

860 chemical engineering research and design 9 2 ( 2 0 1 4 ) 857–875
0
0.5
1
1.5
2
2.5
3
3.5
4
4.5
5
5.5
0 1 2 3 4 5 6 7 8
Init
ial
Pre
ssu
re _
Bubble
Poin
t P
ress
ure
(P
i _
Pb)
Density at Ini tial Pressure (ρ @ Pi)
Region A
Region B
Region C
Fig. 1 – De Boer plot, representing (Pi–Pb) versus � (modifiedafter de Boer et al., 1995).
0
2
4
6
8
0 5 10 15 20 25
Asp
hal
tene
Wei
ght,
%
Resins Weight, %
Unstable
Stable
Fig. 2 – Stability of asphaltene in terms of asphaltene andresins weight percentage (modified after Jamaluddin et al.,
ume of the liquid existing in the depressurized PVT cell. The
25
35
45
55
65
75
20 40 60 80
Asp
hal
tenes
and S
atura
tes,
%
Aromatics and Resin s, %
Serio us Concerns
Mild
Concerns
Minor or No Concer ns
Fig. 3 – Asphaltene and saturates weight percentage versusaromatics and resin percentage to determine the possibility
solid phase from liquid phase; while, deposition phenomenonis defined as the solid phase precipitated on the surface.Asphaltene precipitation does not generally result in deposi-tion; however, precipitation usually affects deposition process(Koots and Speight, 1975; Leontaritis and Mansoori, 1987;Mansoori, 1997; Speight and Moschopedis, 1981; Speight et al.,1985). Asphaltene precipitation depends on various factorssuch as pressure, temperature, and oil composition; while,the deposition happens after asphaltene precipitation and itis strongly dependent on the fines adsorption onto the rocksurface. The aggregation of fines into bigger particles is calledflocculation. The particles might again break up into smallflocs (particles). This process is defined as dissociation of par-ticles. The flocs adsorbed on the rock can cause pore throatplugging and particles entrainment. Thus, asphaltenes depo-sition will lead to reduction in effective mobility of the oil dueto lowered porosity and effective rock permeability (Kim et al.,1990; Monger and Fu, 1987; Rassamdana et al., 1996). In addi-tion, it increases the oil viscosity and also alters the mediumwettability (Kim et al., 1990; Rassamdana et al., 1996).
2.2. Detection/measurement techniques
Some detection methods such as gravimetric and light scat-tering technique (LST) have been used to investigate variousaspects (e.g., concentration, onset pressure) of asphaltene pre-cipitation. The following section describes the main methodsin a brief manner.
De Boer plot: This technique was suggested by de Boer et al.(1995) to find out at what thermodynamic conditions oil maystart forming a solid phase leading to reduction in flow rate.As demonstrated in Fig. 1, the De Boer plot shows pressuredifference between the initial pressure and bubble point pres-sure versus initial density of the oil sample. According to thisfigure, there are three different zones, namely: (1) Region Awith high possibility of serious flow problem, (2) Region B withmodest concerns, and (3) Region C with slight or negligible flowproblems (de Boer et al., 1995).
Asphaltene resin ratio approach: Jamaluddin et al. (2002) sug-gested a method based on weight ratio of asphaltene to resinto determine at what ratio asphaltene deposition might takeplace. As shown in Fig. 2, this method introduces two differ-ent regions including stable and unstable in the context of
asphaltene deposition.2002).
Colloidal instability index (CII): Yen et al. (2001) introducedthe CII technique based on the ratio of the total asphaltenesand saturates to the total of aromatics and resins to recognizecrude oil systems prone to asphaltene deposition. As shownin Figs. 2 and 3, if the CII of oil is lower than 0.7 then the oilis considered as stable; while, the oil with CII greater than 0.9would be considered as an unstable phase.
Gravimetric: This technique is based on the onset pressureof asphaltene such that asphaltene precipitation occurs oncethe pressure in PVT cell reaches lower than the onset pressure(Akbarzadeh et al., 2007; Jamaluddin et al., 2002). Asphalteneconcentration against pressure can be plotted based on theresults obtained from this method. Precision of this techniquegenerally depends on the measurement accuracy and the sizeof pressure steps. The main disadvantages of this methodinclude the need for large amount of oil sample and being aprolonged process.
Filtration: A filtration technique in the form of PVT cell fil-ter is used to extract the precipitated asphaltene and passrest of the fluid as the pressure is reduced (Akbarzadeh et al.,2007; Jamaluddin et al., 2002; Speight et al., 1985). A filter withsize of 0.22–45 �m is usually used for filtration of a small vol-
of asphaltene deposition (modified after Yen et al., 2001).
chemical engineering research and design 9 2 ( 2 0 1 4 ) 857–875 861
aipbam
vdsSo(1stfe
ssoeiatoodwhli(spAts
2
Iwgvt(ttc
fibtsBruoir(
dvantage of this method is that the asphaltene precipitations taken into account as a physical separation method and therecipitated asphaltene can be used for further investigationy other methods including aromatic, resin, saturated, andsphaltene (SARA) analysis. However, the performance of thisethod is a function of filter size, considerably.Acoustic resonance technique (ART): Using this method, the
ariations in acoustic characteristics of the oil samples areetermined while the asphaltene is being extracted from theolution (Akbarzadeh et al., 2007; Jamaluddin et al., 2002;peight et al., 1985). ART is faster and needs smaller amountf the reservoir fluid compared with gravimetric technique
Akbarzadeh et al., 2007; Jamaluddin et al., 2002; Speight et al.,985). However, the main disadvantage of this method is that aimilar change in acoustic properties may be observed due tohe existence of other solid materials and vapor–liquid inter-ace. In addition, lower margin of asphaltene precipitationnvelope (APE) cannot be recognized by ART.
Light scattering technique (LST): LST method also known asolid detection system (SDS) employs near-infrared light toearch for fluids as asphaltene precipitates under isothermalr isobaric conditions (Akbarzadeh et al., 2007; Jamaluddint al., 2002; Speight et al., 1985). In this technique, a near-nfrared light source on the side of the equipment creates lightnd the liquid scatters if asphaltene precipitation occurs. Inhis case, the power of light transmission decreases. Detectionf the light transmittance power is carried out using fiber-ptic sensors placed at the other side of the cell. As pressureecreases, the transmittance power of the light is increasedith lowering the pressure because of presence of liquid withigher density. Such high dense fluids offer an increase in
ight transmission. A sharp decrease in transmission powers experienced when asphaltene precipitates are producedupper asphaltene onset pressure (AOP) boundary). As pres-ure decreases, more gas leaves the oil mixture at the bubbleoint pressure and leads to a higher light transmission. LowerOP can be detected from a significant change in the light
ransmission. This means that the asphaltene begins redis-olution process.
.3. Modeling methods for asphaltene precipitation
t is necessary to investigate the asphaltene precipitation atide ranges of thermodynamic conditions (e.g., P, T, and x) to
ain better knowledge of asphaltene behavior. In this section,arious models such as solubility models (or polymer solutionheory), solid models, colloidal models, and equations of stateEOS) models reported for the purpose of modeling of asphal-ene behavior are presented. To validate the models and obtainhe tuning parameters, the experimental data obtained underertain conditions are usually used.
Polymer solution theory: The polymer solution theory wasrst introduced by Flory–Huggins (1942) and then extendedy other researchers (e.g., Hirscberg et al., 1984) to describehe asphaltene solubility in crude oils. This method con-iders the asphaltene components as a non-ideal solution.oth vapor/liquid equilibrium (VLE) and liquid/liquid equilib-ium (LLE) in conjunction with polymer solution theory aresed to conduct required computation to obtain the amountf asphaltene precipitated. This technique does not take
nto account the micellar nature of the asphaltene. Some
esearchers including Burke et al. (1990), Novosad and Costain1990) and Kokal et al. (1992) have performed a number ofexperimental studies to enhance the accuracy of the existingsolubility models.
Solid models: The solid model treats asphaltene as a sin-gle solid component. This technique includes some tuningparameters that are obtained using experimental data. A solidmodel categorizes the heavy ends of the oil into two fractions:asphaltene as precipitating part and non-precipitating partsuch as resin. The solid model which considers asphaltenein the form of a lump component was suggested by Chunget al. (1991). This simple model is able to directly identify theasphaltene stability. However, the effect of pressure is not con-sidered in this model; while, it is a proved fact that pressureis one of the main parameters affecting asphaltene stability.
Thermodynamic colloidal model: The thermodynamic col-loidal model was introduced by Leontaritis and Mansoori(1987) assuming asphaltene is moderately dissolved in thecolloidal suspension inside the crude oil. In this model itis presumed that resins adsorbed on the particles surfacescause stabilization of the insoluble suspended particles. UsingFlory–Huggins polymer solution theory, the critical chem-ical potential of resin is determined to predict the onsetof asphaltene precipitation at various thermodynamic con-ditions. According to several laboratory observations, thereversibility of asphaltene association was approved whileemploying various crude oils and organic solvents. Thisfinding appears to be different from the initial hypothesis con-sidered in the model.
EOS model: Nghiem et al. (1993) and Nghiem and Coombe(1998) forecasted asphaltene precipitation through using athermodynamic model. The model divides the plus fractionof the oil into some parts and the heaviest fraction is classi-fied into a non-precipitating part and a precipitating element.The PR EOS was chosen to determine the amount of pre-cipitated asphaltene by allocating various binary interactioncoefficients to the precipitating part that consists of the lightelements. The computations were carried out by a three-phaseflash calculation procedure. This technique does not take intoaccount the micellar nature of asphaltenes.
Association equations of state: An EOS for prediction ofphase equilibria based on the statistical associating fluid the-ory (SAFT) was developed by Chapman et al. (1989). Also,Chapman et al. (2004) suggested a modified EOS that takesinto account the impacts of molecular shape, intermolecularassociation, and van der waals interaction. This EOS model isproved to be a proper predictive tool for forecasting the ther-modynamic behavior of more complex mixtures. The PC-SAFTmodel was proposed by Pedersen and Hasdbjerg (2007) to beused for different types of petroleum fluids from natural gasto heavy oil containing asphaltene.
Thermodynamic micellization model: This model was devel-oped by Victorov and Firoozabadi (1996) and it illustrates thatthe asphaltene molecules are mainly present in the form ofmicelles within the crude oil. When normal alkenes withlow carbon are blended with oil then, a number of asphal-tene molecules are observed as monomers in the mixture.In addition, asphaltene precipitation may occur because oflow solubility of the monomers. Using this technique, Gibb’sfree energy is minimized to find the growth of micellar sizeand magnitude of the asphaltene precipitated (Victorov andFiroozabadi, 1996).
Governing equations: In this method, the calculation ison the basis of thermodynamic equilibrium between three
phases including, liquid, vapor, and solid (Nghiem et al., 1993;Pedersen and Hasdbjerg, 2007).
862 chemical engineering research and design 9 2 ( 2 0 1 4 ) 857–875
Fig. 4 – Asphaltene deposition envelope (ADE) andprecipitation region (modified after Akbarzadeh et al., 2007;
Jamaluddin et al., 2002).2.4. Onset pressure determination techniques
Near-infrared spectroscopy: The light scattering technique foridentification of the onsets of solids nucleation is called nearinfra-red (NIR). This technique is found on the basis of trans-mittance of a laser light in the near infra-red wavelength whena fluid sample experiences variations in T, P, and composition(Aske et al., 2002). The spectroscopic region of the electromag-netic spectrum for NIR is in the range of 780–2500 nm (Askeet al., 2002). Electronic and vibrational overtone transitions aregenerally observed in this region for a test fluid with asphal-tene aggregates. The spectroscopic region for this occurrenceranges from 1100 to 2500 nm. The process parameters such astemperature (T), pressure (P), time (t), solvent volume, and thepower level of the light transmitted are recorded while usingNIR.
High pressure microscope (HPM): This technique can be usedto conduct visualization tests to identify onset conditionsduring wax and asphaltene precipitation at high pressures(up to 1100 atm) and temperatures (up to 200 ◦C). Using HPM,it is possible to monitor variations in size and structure ofsolid particles in terms of time, pressure, and temperature(Abdallah et al., 2010; Jamaluddin et al., 2000, 2002). The oilsample is homogenized in the PVT cell and then conveyed to aHPM cell under controlled conditions. As pressure is graduallydecreased, alteration in the characteristics of the fluid sampleis captured by a HPM video camera. This enables finding theparticle size distribution.
IP 143 method: IP 143 is used to obtain the asphaltene per-centage in petroleum fluids on the basis of the amount ofasphaltene deposition on filter (IP 143, 1985). Type and gradeof the filter affects the weight of the deposited asphaltene.Asphaltene weight percentage of the test sample is deter-mined using the following formula:
Asphaltene Weight % = Weight of AsphalteneWeight of Oil Sample
× 100 (1)
Depending on the technique employed to determine theamount of asphaltene precipitated/deposited, different formsof asphaltene deposition envelope (ADE) are proposed. A com-mon form of ADE is demonstrated in Fig. 4.
It is important to note that the onset pressure of APincreases with increase in temperature. Also, the bubble
pressure in the AP context lowers as the temperatureincreases. The impacts of temperature on asphaltene nucleiand growth of these nuclei are in contradiction depending onthe visual or quantitative technique is employed.
2.5. Asphaltene precipitation/deposition preventionmethods
Asphaltene inhibitors: Asphaltene inhibitors such as light cycleoil (LCO) are used to avoid asphaltene flocculation in the crudeoil and are very cost effective (Ghloum et al., 2010; Shedid,2002; Zekri et al., 2001). The easiest way to use this is to contin-uously inject the inhibitor directly into the formation wherethere is a risk of asphaltene deposition. Then, the inhibitoris absorbed by the asphaltene through a physical–chemicalprocess leading to reduction in possibility of asphaltene pre-cipitation.
Chemical treatments: Chemicals used in this method includesolvents such as toluene and xylene which can dissolvethe deposit of the asphaltene, detergents which help tobreak the asphaltene deposition and also prevent asphal-tene molecules to be re-agglomerated, and crystal modifierswhich are polymers that can change wax crystal growththrough crystallization and modify the paraffin crystals, aswell (Ghloum et al., 2010; Shedid, 2002; Zekri et al., 2001).
Mechanical treatments: Common mechanical methods fortreatment of asphaltene generally consist of rod scrapers, free-floating piston scrappers, wire-line scrappers, and wire-liningtubing. However, this category of treatment is time-consumingand expensive. Also, there is a risk of losing tools in the well(Ghloum et al., 2010; Shedid, 2002; Zekri et al., 2001).
Thermal treatments: In general, this kind of treatment is clas-sified in the following groups (Ghloum et al., 2010; Shedid,2002; Zekri et al., 2001): (1) hot oiling: the hot oil is injectedin the deposit of asphaltene to remove it. But, it may alsodamage the formation due to their thermally induced stressesaround the wellbore; (2) down-hole heaters: Big down-holeheaters are employed to melt the asphaltene. After melting,the asphaltene is pumped out by the crude oil. However, thismethod is very expensive in terms of heat and electric powerconsumption; and (3) heat-liberating chemicals: In this tech-nique, the heat liberating chemicals like ammonium chlorideand sodium nitrate are pumped down into the well and thenexothermic reaction takes place resulting in melting downthe asphaltene (Ghloum et al., 2010; Shedid, 2002; Zekri et al.,2001).
3. Connectionist modeling
3.1. Artificial neural network
Neural network is referred to as “artificial neural network”(ANN). ANNs are information processing systems repre-senting rough approximation and simplified simulationsof biological neuron network systems (Hagan et al., 1966;Hornick et al., 1989, 1990; James, 1890). It normally takessome input, processes them and gives outputs. The keyaspects of ANNs are the topology of the ANN, input andoutput parameters, learning and testing stages, convergence,data representation and interpretation, and generalization.The earliest practical implication of ANNs was in 1950s
when Frank Rosenblatt and his assistants demonstrated thecapability of this technique in pattern recognition (Hagan
chemical engineering research and design 9 2 ( 2 0 1 4 ) 857–875 863
eAamfiB
-
--
sa
rJ
3
PtfiEitTa(1ppAetwEp(
v
x
Iiarai1soo(aba
t al., 1966; Hornick et al., 1989, 1990; James, 1890). Then,NNs improved and were applied in various disciplines suchs aerospace, automotive, defence, transportation, telecom-unications, electronics, entertainment, manufacturing,
nance, medical, and petroleum.The conventional ANN (e.g.,P-ANN) model has three main disadvantages as follows:
It is stuck in local optima when the target function has mul-tiple optimum points.
The rate of convergence for the BP-ANN is slow. Most of the system parameters in the BP-ANN are deter-
mined through trial and error technique. Therefore, thereis always difference between them and the optimized (best)ones that cause some errors in the model outputs.
The ICA-ANN and PSO-ANN are proposed in this study toolve these problems, leading to better results in terms ofccuracy.
Technical reader is encouraged to read the correspondingeferences (e.g., Hagan et al., 1966; Hornick et al., 1989, 1990;ames, 1890) for further information on ANN systems.
.2. Particle swarm optimization
article swarm optimization (PSO) is recognized as a stochas-ic optimization method found based on social behavior ofsh education and/or bird collection (Eberhart et al., 1996;berhart and Kennedy, 1995; Coulibaly and Baldwin, 2005). PSOncludes several common characteristics with other evolu-ionary computation methods (e.g., genetic algorithms or GA).his technique starts with a population of random solutionsnd looks for optimum solutions through updating iterationsgenerations) (Coulibaly and Baldwin, 2005; Eberhart et al.,996; Eberhart and Kennedy, 1995). Over PSO modeling, therospective solutions, known as particles, move within theroblem space toward the existing most favorable particles.ll particles possess memory. This means that they keep theirarlier situations. The movement of each particle depends onhe initial random velocity and the effects of two randomeights (Coulibaly and Baldwin, 2005; Eberhart et al., 1996;berhart and Kennedy, 1995). In the PSO, the position of eacharticle is updated according to its best location set by itself
pbi) and the particles surrounding it (gbi) as follows:
i+1 = wvi + c1r1(pbi − xi) + c2r2(gbi − xi) (2)
i+1 = xi + �tvi+1 (3)
n Eqs. (2) and (3), vi represents the particle velocity, r1 and r2
ntroduce two random parameters in the range of 0.0–1.0, c1
nd c2 show the attraction of a particle toward pb and gb, cor-espondingly. Also, �t and w are the time interval of particledvancement and inertia factor controlling the particle veloc-ty, respectively (Coulibaly and Baldwin, 2005; Eberhart et al.,996; Eberhart and Kennedy, 1995). At each generation, thepeed of a particle is alerted from its recent magnitude basedn the coefficient of weight inertia, the previous best positionf the particle, and also the best location of the entire swarm
Coulibaly and Baldwin, 2005; Eberhart et al., 1996; Eberhartnd Kennedy, 1995). More information on PSO algorithm can
e found in Coulibaly and Baldwin (2005), Eberhart et al. (1996)nd Eberhart and Kennedy (1995).3.3. Imperialist competitive algorithm
Similar to PSO technique, imperialist competitive algorithm(ICA) is initialized with a primary population. The individ-uals which are named countries are classified into two groups:colonies and imperialists (Atashpaz-Gargari and Lucas, 2007;Lucas et al., 2010). Combination of the colonies and imperi-alists leads to formation of some empires. The ICA methodis based on the competitive approach between the empires.Throughout this contest, feeble empires lose their powerand strong ones possess their colonies. Imperialistic contestapproaches to a condition in which just one empire exists. Inthis case, the colonies of the remaining empire have equal sta-tus and cost as the imperialist. The procedure to carry out theimperialist competitive algorithm has some important stagesas the following (Atashpaz-Gargari and Lucas, 2007; Lucaset al., 2010):
(1) Pick several random points from the population and startforming the empires.
(2) Transfer the colonies on the way to their correspondingimperialists.
(3) Alter the locations of some colonies in a random way.(4) In case a colony belonging to an empire has lower cost
than the imperialist, switch the locations of that colonywith the imperialist.
(5) Bring together the comparable empires.(6) Calculate the total cost of the whole empires.(7) Choose the weakest colony among the empires with low-
est power and offer it to one of the empires.(8) Remove the weakest empires.(9) If stop criteria are met, it would be the end of program;
otherwise, return to the second stage.
In x direction, the colony travels toward the imperialist. Eqs.(4) and (5) show x and � functions, respectively, representingtwo random parameters with uniform distribution as givenbelow (Atashpaz-Gargari and Lucas, 2007; Lucas et al., 2010):
x ≈ U(0, × d) (4)
� ≈ U (−�, �) (5)
Here, the distance between the imperialist and the colony issymbolized by d and and � are two random variables thatupdate the area where colonies seek the imperialist. In thecurrent study, and � are set on 1.5 and 0.5, respectively.
To obtain more information about the ICA algorithm, read-ers can study these two papers (e.g., Atashpaz-Gargari andLucas, 2007; Lucas et al., 2010).
4. Experimental study
4.1. Asphaltene precipitation
This section presents results obtained from conductingasphaltene precipitation tests under static conditions. Thecrude oil samples selected for the experimental work weretaken from two oil fields in south of Iran. Gas-chromatographymass-spectroscopy (GC–MS) technique and differential liber-ation tests were used to obtain oil composition and other
properties such as molecular weight and API. Table 1 liststhe compositions and main characteristics of the oils such as
864 chemical engineering research and design 9 2 ( 2 0 1 4 ) 857–875
Table 1 – Properties of two different crude oils tested.
Components Sample A(mol%)
Sample B(mol%)
C1 22.62 41.95C2 8.51 8.74C3 4.45 5.21i-C4 0.81 1.33n-C4 3.21 2.12i-C5 0.97 1.83n-C5 1.3 2.56C6 6.07 2.41C7 2.96 2.28C8 3.49 3.39C9 2.23 2.75C10 1.87 2.04C11 3.72 2.11C12
+ 30.23 9.55H2S 2.54 6.37N2 0.37 1.41CO2 4.65 3.95Total (mol%) 100 100
Molecular weight of oil (g/gmol) 168.34 74.78Asphaltene (wt%) 15.53 0.94Aromatics (wt%) 38.99 37.03Resins (wt%) 13.62 2.71Saturates (wt%) 31.86 59.32API specific gravity 21.45 32.96Gas/oil ratio, GOR (Sm3/Sm3) 77.84 267.13
Table 2 – SARA analysis and wax appearancetemperature.
Characteristics Sample A Sample B
Asphaltene (wt%) 15.53 0.94Aromatics (wt%) 38.99 37.03Resins (wt%) 13.62 2.71Saturates (wt%) 31.86 59.32Wax appearance temperature (◦C) 40 25
molecular weight, gas/oil ratio, and API degree. In addition, theoil samples were analyzed based on asphaltenes (A), aromatics(A), resins (R), and saturates (S) by using the SARA techniquewhich has been explained in IP 143.
In the test runs, precipitants including n-pentane and n-heptane, as solvents with 99.5% purity, were used to extractthe asphaltene from crude oil. As shown in Fig. 5, the set upincludes components such as hydraulic pump, PVT cell, oven,0.25 � metal filter, and shaker. Depending on the experiments,the oil volume is in the range of 10–50 cm3. The crude oil andprecipitants with the dilution ratio (solvent/oil) ranging from 1to 50 are mixed by an electrical mixer for about 2 days to attainequilibrium condition. Then, the mixture is sent to a PVT cell(e.g., visual JEFRI equilibrium cell) with a volume of 500 cm3
under a constant pressure. An oven was also used to attaina desired temperature in the PVT cell. The maximum operat-ing P and T range for the cell are 700 bar and −20 to 300 ◦C,respectively. To simulate reservoir conditions (e.g., P and T),the cell is shaken for 4 days. The next step is to lower the pres-sure gradually in subsequent defined stages that indicate thepressure depletion during the production process. The asphal-tene is precipitated due to pressure reduction. After that, thesolution is directed to a 0.25 �m filter. It is important to notethat the oil sample should be in the form of a single phasewhile passing through the filter. Helium with high pressurewas utilized to sustain a back-pressure on the output line ofthe filter. A two-phase separator flashes the filtered oil andIP-143 method was also used to obtain the asphaltene con-tent of the residual fluid. Also, the freezing point techniquewas employed to determine the average molecular weight ofthe heavy component of the oil sample. The variations in theamount of asphaltene in the initial and final oil mixtures givethe precipitated asphaltene in weight fraction or percentage. Itshould be noted here that the weight percentage of asphaltene
precipitated during the experiments was obtained in the T andP ranges of 20–150 ◦C and 0.0–9000 psia, respectively. Hence,this enabled us to collect the asphaltene precipitation dataat various thermodynamic conditions and then plot them interms of temperature (T) and pressure (P).
4.2. Asphaltene deposition
In this part, experimental study of asphaltene deposition inlight oil sample includes core flooding using CO2 with differ-ent mole fractions. The test trials cover a wide range of T. Acore with diameter of 10 cm and length of 30 cm was preparedfor this phase of experimental investigation. The volume ofoil in place varies between 50 cm3 and 300 cm3, depending onthe type of production process. The core was saturated with oilsample by using the vacuum methodology. Fig. 6 demonstratesthe experimental setup. The setup consists of a core holder,a gas flow meter, pressure gauges, temperature gauges, and adisplacement pump. After saturation process, a gas (e.g., CO2)is injected while the flow rate was being recorded by using agas flow meter. During gas flooding, the pressure differencebetween the input and output is controlled by a backpres-sure regulator installed on the outlet. Thus, the pressure dropalong the porous medium length remains unchanged duringthe injection. A gradual cylinder was used to collect the pro-duced fluid. After around 5 PV gas injected, the core floodingwas terminated where no oil is produced from the porous sys-tem. Then, the core pressure is declined slightly. When thecore pressure approached zero then, the core was taken outfrom the core holder. The cores were dried in an oven wherethe temperature was set at 150 ◦C under vacuum condition.The amount of asphaltene deposited on the core surface wasdetermined through the difference between mass of the driedcore prior to saturation process and after gas injection.
5. Results and discussion
5.1. Technical aspects
Employing cross-polar microscopy (CPM) method, SARA anal-ysis and wax appearance temperature (WAT) are determinedbased on the stock tank oil (STO) data (see Table 2). The SARAdata can be used to initially screen the asphaltene and alsoillustrate the de-Boer curve.
Screening criteria are commonly used in order to assessthe tendency of asphaltenes to precipitate. The most com-monly used criteria are asphaltene/resin ratio, de Boer plot,the asphaltene stability index, and the colloidal instabilityindex (Akbarzadeh et al., 2007; Jamaluddin et al., 2002; Speightet al., 1985). Screening parameters include PVT characteristicssuch as reservoir pressure, density at bubble point pressure,and SARA components (saturates, aromatics, resins, andasphaltenes) of the stock-tank oil (STO) (see Table 2). Todesign a proper production plan, it seems important to
further delineate the asphaltene stability screening, onset ofthe asphaltene destabilization, and the amount of asphaltene
chemical engineering research and design 9 2 ( 2 0 1 4 ) 857–875 865
Fig. 5 – The laboratory setup used for asphaltene precipitation experiments in absence of porous medium.
pdad
msdlelrp
recipitated during oil production at different P and T con-itions. To obtain such information, various techniques suchs qualitative (e.g., IP 143) and visual (e.g., NIR and HPM) areiscussed, briefly.
Effect of temperature on AP by visual methods: Severaleasurements were performed under isothermal depres-
urization condition to determine the onset of asphalteneestabilization pressure at different temperatures when the
ight was transmitted through the oil samples. The light sourcemployed in this study is near infra red (NIR) with a wave-ength beam equal to 1600 nm. In addition, the temperature
◦
anged from 20 to 150 C for the isothermal depressurizationrocesses. The temperature range was chosen based on theFig. 6 – Schematic of the experimental setup used for a
reported data from the real cases. During the test trials, thePVT cell was filled with the oil sample and equilibrated at acertain temperature. After that, the depressurization processwas conducted at constant temperature and the magnitudeof light transmittance was determined. As depicted in Fig. 7,if the phase change happens, a sudden alteration in the lighttransmittance will be observed. Fig. 7 describes light trans-mittance properties of oil sample B at two different valuesof temperature. As shown in Fig. 7, a decrease in oil den-sity due to pressure reduction leads to an increase in lighttransmittance. The maximum light transmittance is obtained
at the bubble point pressure. Afterwards, the light transmit-tance lowers drastically as the gas bubbles are released fromsphaltene deposition during production process.
866 chemical engineering research and design 9 2 ( 2 0 1 4 ) 857–875
(a)
(b)
0
0.2
0.4
0.6
0.8
1
1.2
200 300 400 500 600 700 800 900
Norm
alis
ed L
ight
Tra
nsm
itta
nce
Pressure (atm)
Depres sur izat ion
Repressurization
0.0
0.2
0.4
0.6
0.8
1.0
1.2
200 300 400 500 600 700 800 900
Norm
alis
ed L
ight
Tra
nsm
itta
nce
Pressure (atm)
Depres sur izat ion
Repressurization
Fig. 7 – Isothermal depressurization and pressurization ofoil sample B at (a) T = 100 ◦C and (b) T = 150 ◦C.
(a)
(b)
0
10
20
30
40
50
60
0 3 6 9 12 15
Num
ber
of
Part
icle
s
Diame ter ( m × 10)
0
50
100
150
200
250
0 2 4 6 8 10 12 14
Num
ber
of
Part
icle
s
Diame ter ( m × 10)
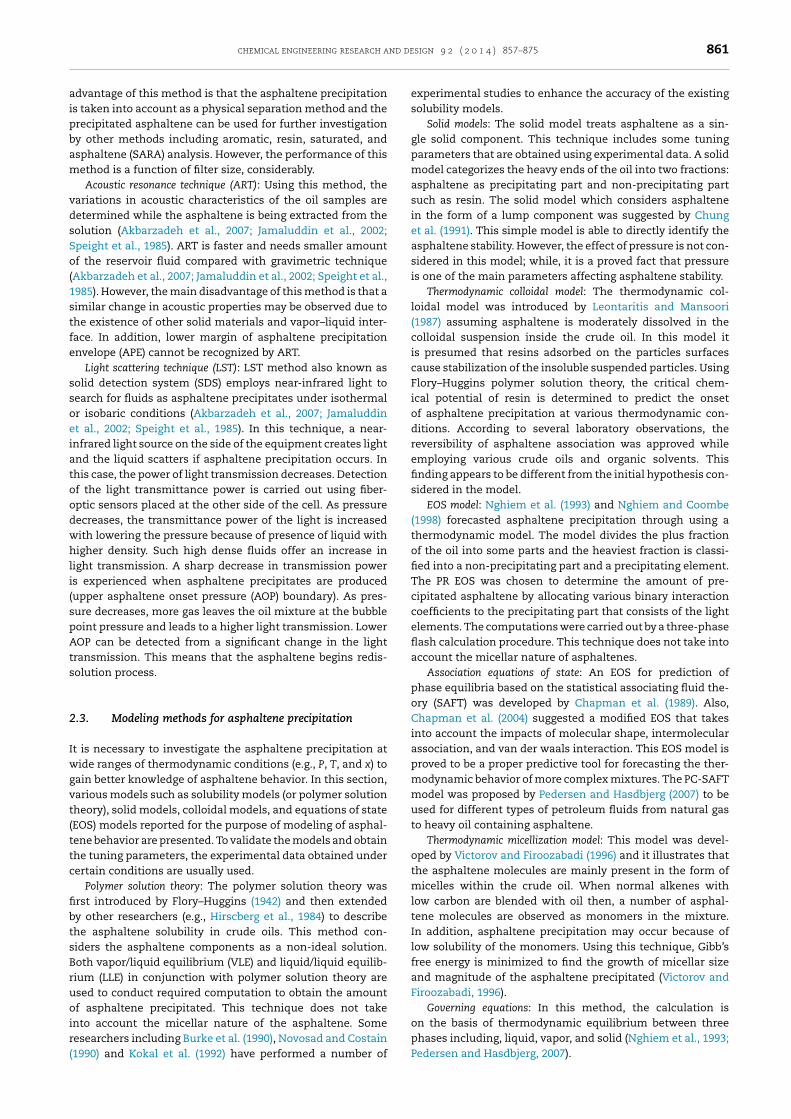
Fig. 8 – Particle size distribution for oil sample B attemperature of 150 ◦C: (a) P = 890 atm and (b) P = 490 atm.
the mixture. The asphaltene onset pressure (AOP) is foundby a variation in the slope of the light transmittance curve.Such asphaltene destabilization (Fig. 7) is observed at 650 and570 atm when the values of reservoir fluid temperature are100 and 150 ◦C, respectively. This indicates that decrease intemperature causes an increase in AOP.
As explained before, high pressure microscopy (HPM) isanother visualization technique for describing asphaltenedestabilization and morphological behavior of asphaltene.The depressurization process was carried out in a HPM cell at aconstant temperature corresponding to the reservoir temper-ature. At the initial high pressure (e.g., 890 atm), only a smallnumber of solid particles were precipitated under this con-dition as shown in Fig. 8a. However, no increase in the sizeand number of particles was observed throughout the depres-surization. Hence, this condition was taken into account as areference for the purpose of contrast. With gradual decrease inpressure, the solid particles begin to form and their populationincreases, slightly (see Fig. 8b). If the pressure is further low-ered as it becomes less than the bubble point pressure, the gasbubbles will be evolved from the fluid sample. Fig. 8 (panels aand b) shows the particle growth based on the measurementsconducted for two pressure steps at a certain temperature(e.g., 100 and 150 ◦C). Again, Fig. 8 confirms that AOP increaseswith decrease in temperature. Pressure reduction continuesto attain AOP. For T = 150 ◦C, the AOP was determined to be573 atm. These results indicate that there is acceptable agree-ment between AOP values obtained from the NIR technique
and HPM experiments.Effect of temperature on AP using quantitative techniques: Basedon the NIR technique, it is predicted that asphaltene floccu-lation occurs at pressures above the bubble point pressure.The high pressure–high temperature filter was employed todetermine the magnitude of precipitated asphaltene undervarious ranges of P and T. The highest amount of precipitatedasphaltene is obtained at the bubble point pressure basedon the conventional theoretical methods (Akbarzadeh et al.,2004; Hirscberg et al., 1984; Pfeiffer and Saal, 1940; Sirvastavaet al., 1995). Therefore, the filtration tests were performed atthree different temperatures attributed to three different bub-ble point pressures. After the filtration process, toluene wasused to wash the PVT cell. It was found that around 5–10 wt%of the total asphaltene exists in the toluene solution madeof sample B. The IP 143 standard was used to measure theprecipitated asphaltene. Approximately 0.9, 0.55, and 0.2 wt%were reported for AP at 150, 120, and 100 ◦C, respectively. Asexpected, the amount of flocculated asphaltene in sample Blowers as the temperature is reduced.
This study confirms that the effect of temperature on APbased on visual and quantitative methods is contentious. Thevisual methods such as NIR show that an increase in temper-ature leads to reduction of onset pressure; while, increase intemperature causes higher amount of asphaltene flocculatedand deposited during depressurization process according tothe quantitative method. The main reasons for this contra-diction come from the mechanisms involved in precipitationprocess that has been explained through these two differenttechniques. Based on the visualization technique, precipita-tion process includes two main steps, namely: (1) formationof the initial solid particles and (2) increase in the size of solidparticles that leads to particles precipitation. In the first stage,
a deflection takes place as observed in the NIR curve as solid
chemical engineering research and design 9 2 ( 2 0 1 4 ) 857–875 867
0.2
0.3
0.4
0.5
0.6
0.7
0.8
0.9
1.0
50 100 150 200 250 300 350
Per
cen
tage
of
Asp
hal
ten
e P
reci
pit
atio
n
Pressure (atm)
T= 120 ºC
T=100 ºC
T=80 ºC
Fig. 9 – Asphaltene precipitation versus pressure at varioustemperatures for the light oil (sample B) during staticexperiments.
ppipdeostagism
5
Stpdraiidtgpbtbti
stctabo
0.0
0.4
0.8
1.2
1.6
2.0
20 60 100 140 180 220 260 300 340 380
Per
cen
tage
of
Asp
hal
ten
e P
reci
pit
atio
n
Pressure (atm)
T=80 º C
T=100 º C
T= 120 º C
Fig. 10 – Asphaltene precipitation versus pressure atvarious temperatures for the heavy oil (sample A) during
According to the experiments conducted by Nakhli et al.(2011), as the mole fraction of injected gas increases, the
0.0
0.1
0.2
0.3
0.4
0.5
0.6
0.7
0.8
0.9
0 10 20 30 40 50 60
Per
centa
ge
of
Asp
hal
ten
e P
reci
pit
atio
n
Solvent/Oil Ratio
n-C5
n-C7
articles with diameter lower than 0.05 �m are formed. Thisarticular point is generally called as onset pressure. Increase
n temperature leads to formation of fewer particles at lowerressures. During the second step, solid particles keep oneveloping. This step proceeds as long as the particle diam-ter is lower than 0.2 �m. According to the volumetric ratiof particles with the size of >0.2 �m to the total volume ofolid particles, a good agreement was observed between thesewo deterministic methods in terms of behavior prediction ofsphaltene nuclei. The population of nuclei with a diameterreater than 0.2 �m increases as the temperature goes up. It ismportant to note that AP generally occurs during the secondtep in which, increase in temperature results in creation ofore solid particles with diameter size >0.2 �m.
.2. Experimental investigation
tatic and dynamic experiments were conducted at variousemperatures, dilution rates, injection rates, precipitants andressures to study asphaltene precipitation during naturalepletion and CO2 injection processes. Each test has beenepeated two times. According to the statistical analysis, thebsolute error percentage between trials for each certain cases lower than 7%. The laboratory setups for these two exper-mental schemes are given in Figs. 5 and 6. During pressureepletion tests for both oil samples, as the pressure lowers,he asphaltene precipitation phenomenon takes place. Therowth rate of precipitation proceeds until the fluids bubbleoint pressure (BPP). However, when the system pressure goeselow BPP, the solution gas will be released from the mix-ure. This means that the concentration of heavy componentsecomes higher in the liquid phase, resulting in an increase inhe asphaltene solubility into the oil phase and also a declinen flocculation rate.
The effects of P and T on asphaltene precipitation arehown in Figs. 9 and 10 for light and heavy oil, respectively. Theemperature impact appears to be different depending on theorresponding pressure is greater or lower than the BPP of mix-ure. When the pressure is higher than the BPP, asphaltenesre more unstable with increase in the temperature. It can
e concluded that the tendency of asphaltene clusters in theil sample to stop aggregation and precipitation lowers as thestatic experiments.
temperature increases. However, the dissolution of asphaltenemolecules is mostly affected by the librated gas rather thantemperature when the pressure is below the BPP. Based on theresults obtained from the natural depletion runs, increase intemperature leads to an increase in the amount of asphalteneprecipitated in the light oil sample (Fig. 9); while, the oppositebehavior is observed for the heavy oil in terms of temperatureimpact on asphaltene precipitation (Fig. 10). This is attributedto solubility of asphaltene in the oil as a function of tempera-ture and pressure. Also, as can be seen from Figs. 9 and 10, alower portion of asphaltene available in the heavy oil is precip-itated compared to the light oil for the same thermodynamicconditions.
Effects of the solvent type and dilution ratio are shown inFig. 11 for the heavy oil sample. It is clear that the asphal-tene precipitated increases with increase in the precipitantconcentration until a certain ratio. After that, the amount ofasphaltene precipitation remains almost unchanged even ifthe solvent/oil ratio becomes double. Also, n-C5 causes moreasphaltene precipitation throughout the pressure depletion.
Fig. 11 – Asphaltene precipitation versus dilution ratio forthe light oil (sample B) (T = 120 ◦C and P = 200 atm).

868 chemical engineering research and design 9 2 ( 2 0 1 4 ) 857–875
0.4
0.5
0.6
0.7
0.8
0.9
0 0.2 0.4 0.6 0.8
Per
centa
ge
of
Asp
hal
tene
Pre
cipit
atio
n
Mole Fr action of CO2
T=100 ºC
T=120 ºC
Fig. 12 – Effect of CO2 concentration on asphaltene
0
0.1
0.2
0.3
0.4
0.5
0.6
0.7
0.8
0.9
0 1 2 3 4 5 6 7
Per
centa
ge
of
Asp
hal
tene
Pre
cipit
ated
Pressure Drop (atm)
Flowing Pressure= 225 atm
Flowing Pr essure= 175 atm
Fig. 14 – Effect of pressure drop on asphaltene depositedduring the dynamic tests using the light oil (sample B).
precipitation for the light oil (sample B).asphaltene precipitation increases for both dry and enrichedgas cases as long as the pressure is greater than the BPP.However, for pressures lower than the BPP, increase in gasmole percent decreases the amount of asphaltene precipi-tated during the production process. The main reason forthis phenomenon is gas evolution from the mixture andalso re-dissolution of asphaltene into the sample. This studyinvestigates the effect of CO2 injection process on asphalteneprecipitation/deposition which is expected to see a differ-ent behavior. If the CO2 is injected into the oil phase, loweramounts of asphaltene will be precipitated in the light oil caseas the mole fraction of CO2 is increased as depicted in Fig. 12.This trend continues until the BPP. After that, an increase inthe asphaltene precipitation is experienced. This occurrencemight be attributed to the high density of CO2 (in compari-son with the oil phase) that affects the solubility of asphaltenemolecules, considerably, such that effects of P and T comparedto density will be neglected. However, a different behavior isobserved in the heavy oil sample such that the amount ofprecipitated asphaltene increases with increase in the mole
fraction of CO2 in the mixture (see Fig. 13). The amount of0
1
2
3
4
5
6
7
0 0.2 0.4 0.6 0.8
Per
centa
ge
of
Asp
hal
tene
Pre
cipit
atio
n
Mole Fr action of CO2
T=100 ºC
T=120 ºC
Fig. 13 – Effect of CO2 mole fraction on asphalteneprecipitated in the heavy oil (sample A).
asphaltene precipitation in terms of gas concentration (e.g.,mole fraction) strongly depends on the BPP of the mixture andalso the P–x diagram which corresponds to the solubility of thegas in the oil sample. This suggests that the oil API gravity andcomposition affect the solubility, considerably.
During the dynamic experimental work (deposition tests),the effects of T, P, dilution ratio, and gas concentration on theasphaltene behavior are almost the same as those observedin the static trials for investigation of the asphaltene precip-itation. Fig. 14 shows that the pressure drop is in favor ofasphaltene precipitation. As clear from the figure, the effectof pressure drop is predominant compared to the flowingpressure throughout the asphaltene deposition process. Also,Fig. 10 confirms that the maximum amount of precipitatedasphaltene is obtained at the flowing pressure close to BPP.
5.3. Connectionist modeling
After experimental study and data collection from the lit-erature, the data series are arranged into two categories,including: training and testing sets to implement artificialneural network (ANN) modeling. In general, about 75–80%of the data are assigned to the training phase and the test-ing phase employs the remaining data. For instance, 276 and95 data points were used in the training and testing stages,respectively; while, employing smart technique for precipita-tion test runs. Furthermore, ANN systems to employ for thedeposition (or dynamic) section include 110 and 35 data fortraining and testing steps, correspondingly. It is important tomention here that total data points used in the connectionistmodeling for the static experimental case are 371, containing290 from the literature and 81 from the current study. On theother hand, the ANN systems to predict asphaltene depositionduring the dynamic tests employ 145 data points including 120and 25 points taken from other studies and the current study,respectively.
In the current study, various ANN structures with differ-ent numbers of hidden layers and neurons (in each layer)are examined to attain the optimized network such thatthe asphaltene precipitation/deposition is estimated withacceptable precision in a reasonable time period. Back prop-
agation algorithm is employed in all connectionist (or ANN)
chemical engineering research and design 9 2 ( 2 0 1 4 ) 857–875 869
0
0.1
0.2
0.3
0.4
0.5
0 2 4 6 8 10 12
Mea
n S
qu
ared
Err
or
(MS
E)
Number of Hidden Neu ron s
Fig. 15 – Determination of the optimum number of hiddenn
me
scobfo
Fpt
(a)
(b)
R² = 0.9863
-1
-0. 8
-0.6
-0.4
-0.2
0
0.2
0.4
0.6
0.8
1
-1 -0. 8 -0. 6 -0. 4 -0. 2 0 0. 2 0. 4 0. 6 0. 8 1
Pre
dic
ted
by
PS
O-A
NN
Exp erime ntal Precipitated Asphalten e
Real Data
Y=X
Fit:
R² = 0.9808
-0.6
-0.4
-0.2
0
0.2
0.4
0.6
0.8
1
Pre
dic
ted
by
PS
O-A
NN
Real Dat a
Y=X
Fit:
eurons based on the magnitude of MSE.
odeling runs to find the final results when the mean squaredrror (MSE) is minimized over training and testing stages.
To conduct ANN modeling, two evolutionary algorithmsuch as imperialist competitive algorithm (ICA) and parti-le swarm optimization (PSO) are employed to determine thebjective function (e.g., precipitated or deposited asphaltene)ased on the system parameters obtained from these two dif-erent hybrid smart techniques. Hence, a comparison in terms
f their performances appears to be necessary. An evaluation(a)
(b)
R² = 0.9669
-1
-0. 8
-0. 6
-0. 4
-0. 2
0
0.2
0.4
0.6
0.8
1
-1 -0.8 -0.6 -0.4 -0.2 0 0.2 0.4 0.6 0.8 1
Pre
dic
ted b
y B
P-A
NN
Exp erime ntal Precipitated Asphalten e
Real Dat a
Y=X
Fit:
R² = 0.9247
-1
-0.8
-0.6
-0. 4
-0. 2
0
0.2
0.4
0.6
0.8
1
-1 -0 .8 -0 .6 -0 .4 -0 .2 0 0. 2 0. 4 0. 6 0. 8 1
Pre
dic
ted b
y B
P-A
NN
Exp erime ntal Precipitated Asphalten e
Real Dat a
Y=X
Fit:
ig. 16 – Scatter plot of predicted values of asphaltenerecipitation versus real data based on BP-ANN model: (a)raining stage and (b) testing stage.
-1
-0.8
-1 -0 .8 -0 .6 -0 .4 -0 .2 0 0. 2 0. 4 0. 6 0. 8 1
Exp erime ntal Precipitated Asphalten e
Fig. 17 – Scatter plot of predicted values of asphalteneprecipitation versus real data based on PSO-ANN model: (a)
training stage and (b) testing stage.is made based on some important criteria including capa-bility of optimizing variables, capability of avoiding stuck inlocal minima, promptness convergence, precision, and repro-ducibility of outputs. Depending on type of experimental runs,the connectionist modeling systems such as BP-ANN, PSO-ANN, and ICA-ANN consider the following variables as inputparameters in the current study:
(1) Temperature, pressure, solvent/oil ratio, concentration ofinjected gas and molecular weight for asphaltene precipi-tation (without porous system).
(2) Temperature, pressure, solvent/oil ratio, concentrationof injected gas, pressure drop, injection flow rate andmolecular weight for asphaltene deposition (with poroussystem).
Eq. (6) is used to normalize the data as follows:
Y = 2y − ymax − ymin
ymax − ymin(6)
In Eq. (6), ymax and ymin represent the maximum and minimummagnitudes of parameter y, respectively.
For the ICA-ANN model, the primary population is set on 40countries. Also, 10 of the best countries are picked to establishthe imperialists. On the other hand, 40 particles are considered
as the initial population for the PSO-ANN system. To have alogical contrast between the performances of these two ANN
870 chemical engineering research and design 9 2 ( 2 0 1 4 ) 857–875
Table 3 – Values of the parameters in the PSO-ANN andICA-ANN systems.
Coefficients ofPSO-ANN model
Coefficients ofICA-ANN model
c1 and c2 = 1.6 = 1.5wmax = 0.85 � = 0.5wmin = 0.45 Revolution rate = 0.2
models, the best values for other parameters in both hybrid-ANN structures are selected based on statistical analysis andthe literature. The parameters are obtained through a trialand error procedure based on the best predictive performance.Table 3 lists the values for the systems’ constants.
Different numbers of neurons (4, 5, 6, 7, 8, 9 and 10) aretested for the ANN networks. Based on statistical parameters
(a)
(b)
R² = 0.987
-1
-0. 8
-0. 6
-0. 4
-0.2
0
0.2
0.4
0.6
0.8
1
-1 -0. 8 -0. 6 -0. 4 -0. 2
Pre
dic
ted b
y I
CA
-AN
N
Exp erime ntal Pr
Real Dat a
Y=X
Fit:
R² = 0.9
-1
-0.8
-0.6
-0.4
-0.2
0
0.2
0.4
0.6
0.8
1
-1 -0.8 -0.6 -0.4 -0.2
Pre
dic
ted b
y I
CA
-AN
N
Exp erime ntal
Real Dat a
Y=X
Fit:
Fig. 18 – Scatter plot of predicted values of asphaltene precipitatistage and (b) testing stage.
(e.g., R2 and MSE), the optimum number of hidden neuronswas determined to be 8 (see Fig. 15). It is important to note thathaving more neurons in the network increases the processingtime in ANN modeling, leading to data over fitting, thoughhigher number of neurons may improve the network perfor-mance, inconsiderably.
Figs. 16–18 demonstrate a comparison between calculatedand real amounts of asphaltene precipitated over training andtesting stages for the whole ANN systems including BP-ANN,PSO-ANN, and ICA-ANN. Clearly, the predictive performanceof ANN-PSO and ANN-ICA is almost the same; but, a waygreater than that of BP-ANN in terms of accuracy.
The statistical criteria such as mean squared error (MSE)and maximum absolute percentage error (MAAPE), minimum
absolute percentage error (MIAPE), and correlation coefficient(R2) are employed to evaluate the performance of the BP-ANN,0 0. 2 0. 4 0. 6 0. 8 1
ecipitated Asphalten e
231
0 0.2 0.4 0.6 0.8 1
Precipitated Asphalten e
on versus real data based on ICA-ANN model: (a) training

chemical engineering research and design 9 2 ( 2 0 1 4 ) 857–875 871
Table 4 – Statistical analysis of predictive performances of the ICA-ANN, PSO-ANN, BP-ANN, and Hu et al. (2000) models.
Parameter Hu et al. (2000) BP-ANN PSO-ANN ICA-ANN
R2Precipitation 0.895 0.925 0.981 0.991Deposition 0.857 0.897 0.969 0.976
MIAPE (%)Precipitation 11.42 8.77 3.05 2.66Deposition 12.88 10.59 3.78 2.91
MAAPE (%)Precipitation 20.14 13.79 8.01 7.12Deposition 21.02 14.85 8.92 7.97
MSEPrecipitation 0.9516 0.2107 0.0284 0.0227Deposition 0.9835 0.2213 0.0296 0.0248
R² = 0.8948
-1
-0.8
-0.6
-0.4
-0.2
0
0.2
0.4
0.6
0.8
1
-1 -0 .8 -0 .6 -0 .4 -0 .2 0 0. 2 0. 4 0. 6 0. 8 1
Pre
cip
itat
ed A
sphal
tene
Pre
dic
ted b
y H
uet
al.
Exp erime ntal Precipitated Asphalten e
Real Data
Y=X
Fit:
Fig. 19 – Performance of the model developed by Hu et al.(2000) in estimating asphaltene precipitated during thes
Pdirectfapettit
ecfiloatdppp
(a)
(b)
R² = 0.9841
-1
-0. 8
-0. 6
-0. 4
-0. 2
0
0.2
0.4
0.6
0.8
1
-1 -0. 8 -0. 6 -0. 4 -0. 2 0 0. 2 0. 4 0. 6 0. 8 1
Pre
dic
ted b
y I
CA
-AN
N
Exp erim ental De posited Asphalten e
Real Dat a
Y=X
Fit:
R² = 0.9759
-1
-0.8
-0.6
-0.4
-0.2
0
0.2
0.4
0.6
0.8
1
-1 -0 .8 -0 .6 -0 .4 -0 .2 0 0. 2 0. 4 0. 6 0. 8 1
Pre
dic
ted b
y IC
A-A
NN
Exp erim ental De posited Asphalten e
Real Dat a
Y=X
Fit:
Fig. 20 – Performance of the ICA-ANN model in estimating
tatic experiments.
SO-ANN, and ICA-ANN models as presented in Table 4. Theata for both asphaltene precipitation and deposition are
ncluded in the table, as well. The results listed in Table 4eveal that the hybrid ANN system using ICA algorithmxhibits an excellent predictive performance in terms of bothonvergence rate and global optimality. The PSO-ANN holdshe second rank in terms of predictive performance; however,airly high error percentages at some conditions (e.g., T and P)re obtained while utilizing BP-ANN to predict the amount ofrecipitated asphaltene. It can be concluded that all modelsmployed exhibit lower accuracy in forecasting target condi-ions in dynamic asphaltene deposition case as compared tohe static case since a higher number of variables is involvedn the former case and more uncertainties come into play inhe predictive models.
To evaluate the effectiveness of the ANN systems, a scalingquation model introduced by Hu et al. (2000) is brought to theurrent study. This developed equation has been originatedrom Rassamdana (1996a,b)’s method. Hu et al. (2000)’s models used to determine asphaltene precipitation for the sameaboratory conditions. As shown in Table 4, MSE and R2 arebtained to be 0.9516 and 89.5% for static precipitation tests,nd 0.9835 and 85.7% for the dynamic deposition tests, respec-ively. The predicted values plotted versus the experimentalata in Fig. 19 also show fairly high error percentages in thisarticular scaling equation. This shows that the model pro-
osed by Hu et al. (2000) can be used to estimate the asphaltenerecipitation only within limited ranges of thermodynamicand process conditions during natural depletion and gas injec-tion processes.
As mentioned before, the same procedure was followedto conduct ANN modeling for asphaltene deposition ontothe surface of porous media. An acceptable agreement wasattained between the predicted values and the real data whenthe hybrid smart technique was used. For the sake of com-parison, the results obtained from the ICA-ANN and Hu et al.(2000)’s model are demonstrated in Figs. 20 and 21, respec-tively. The results for other ANN models are not presentedhere due to the some similarities and also to avoid using morespaces in the journal. Figs. 20 and 21 convey the same conclu-sions drawn based on Table 4 in a different manner.
asphaltene deposited in the dynamic tests: (a) trainingstage and (b) testing stage.

872 chemical engineering research and design 9 2 ( 2 0 1 4 ) 857–875
R² = 0.8572
-1
-0.8
-0.6
-0.4
-0.2
0
0.2
0.4
0.6
0.8
1
-1 -0 .8 -0 .6 -0 .4 -0 .2 0 0. 2 0. 4 0. 6 0. 8 1
Pre
dic
ted b
y H
uet
al.
Exp erim ental De posited Asphalten e
Real Dat a
Y=X
Fit:
Fig. 21 – Scatter plot presenting predicted asphaltenedeposition versus the experimental data based on the
(a)
(b)
29
27
19
15
10
0 5 10 15 20 25 30
Pre ssur e
Tempe ratu re
Molecular Weight
CO2 Mole Fraction
Solv ent/Oil Rati o
23
21
16
15
13
7
5
0 5 10 15 20 25
Pressure Drop
Tempe ratu re
Molecular Weight
Flowing Pressu re
CO2 Mole Fraction
Solv ent/Oil Rati o
Injection Rate
Fig. 22 – Relative importance of variables contributing in (a)static experiments (asphaltene precipitation) and (b)dynamic experiments (asphaltene deposition).
model proposed by Hu et al. (2000).
Based on Table 5, the number of iterations for convergencein ICA-ANN during training stage is lower than that in PSO-ANN. Consequently, ICA-ANN model is converged faster thanthe PSO-ANN. However, the same predictive performancesin terms of accuracy and repeatability are obtained for bothPSO-ANN and ICA-ANN models when the number of param-eters is low enough (e.g., <6). In addition, both ANN systemsmeet the global optimum all the time even if the target func-tion has several local minima. On the other hand, increasein the number of parameters causes a considerable reduc-tion in performance of PSO-ANN in terms of convergencerate, accuracy and reproducibility; while, the ICA-ANN perfor-mance remains the same as before. It can be concluded herethat employing ICA-ANN brings an important advantages tothe smart predictive tools; particularly in convergence speedand global optima. Since the data covers wide ranges of tem-peratures (293–460 K), pressures (1.0–612 bar), and molecularweights (40–1946 g/gmol), the BP-ANN system and the scal-ing equation (e.g., Hu et al. (2000)’s model) appear to be lessefficient methods within the above data intervals.
It is important to determine how much each input variablecontributes to the target function in the introduced models.This contribution can be computed using the analysis of vari-ance (ANOVA) technique. As depicted in Fig. 22 (panels a andb), P and T are the most important parameters affecting thevalue of asphaltene precipitation during static experimentsin which the porous medium is not involved. However, pres-sure drop and temperature both play important roles duringasphaltene deposition onto the surface of the porous medium.The experimental results confirmed this important point, aswell.
In general, PVT models and scaling equations do nothave capability to estimate the amount of precipitated (ordeposited) asphaltene and also to determine the components,
composition within the desired ranges of molecular weight,temperature, pressure, and solvent to oil ratio. Therefore, theTable 5 – Performance of PSO-ANN and ICA-ANN modelsin terms of number of iterations and execution time.
ANN system Number ofiterations
Executiontime (s)
PSO-ANN 1672 30.46ICA-ANN 124 1.25
attained results are not comprehensive enough. However, thehybrid ANN model can obtain better fit in terms of close-ness to actual data and productivity if the network is trainedadequately. This study demonstrates that utilization of PSO-ANN and ICA-ANN in prediction of asphaltene precipitationcan result in more reliable estimations that can be usefulin the design of EOR processes. Nevertheless, when consid-ering the PSO-ANN and ICA-ANN models for prediction ofasphaltene precipitation, determination of the optimal neu-ral network structure presents a big challenge which requiresfurther research.
6. Conclusions
A systematic experimental study of asphaltene precipita-tion/deposition is presented in this paper, supported bycomprehensive discussions on various predictive models,analysis methods and challenging issues in precipita-tion/deposition processes occurring in oil reservoirs. Smarttechniques linked with evolutionary algorithms (e.g., ICA andPSO) are also applied on the experimental results attainedfor both cases: (a) dynamic tests to simulate the productionprocess are conducted and (b) statistic experiments for sensi-tivity analysis in asphaltene precipitation phenomenon. Themain conclusions based on the experimental data, modelingoutputs, and technical discussions are drawn as follows:
(1) Compared to the scaling models, BP-ANN, and PSO-ANN,the ICA-ANN model is more reliable in predicting asphal-tene precipitation and deposition.
(2) In the absence of solvent, Flory–Huggins (FH) theory isable to favorably predict asphaltene precipitation for aparticular oil sample at various pressures; while, scalingequations work better in the case of solvent/oil mixture
tests.
chemical engineering research and design 9 2 ( 2 0 1 4 ) 857–875 873
(
(
(
(
(
(
A
TpR
R
A
A
A
A
A
A
3) Experimental data and modeling results with the aid ofstatistical investigation indicated that two parametersnamely: pressure and temperature are the most importantcontributing parameters in the static test runs. However,the pressure drop (not flowing pressure) and tempera-ture have higher impacts among the important processvariables in asphaltene deposition during dynamic exper-imental work.
4) Both PSO-ANN and ICA-ANN models have global andlocal searching abilities not to be stuck in local min-ima while estimating asphaltene precipitation. However,the convergence speeds of smart techniques are in theorder of ICA-ANN, PSO-ANN, and BP-ANN when they areused to forecast the magnitude of asphaltene precipitationthroughout the experiments.
5) Increase in temperature at lower pressures leads tooccurrence of asphaltene nucleation according to visualanalysis technique; while, the quantitative method reportsthat more particles with diameter sizes of bigger than0.2 �m are formed as temperature increases.
6) Asphaltene precipitation is normally analyzed more accu-rately through high pressure microscopy (HPM) techniquecompared to quantitative methodologies and any othervisual tools.
7) The percentage of precipitated asphaltene in light oil sam-ples is greater than that in heavy oil mixture. This can beattributed to the higher instability and lower solubility ofasphaltene in light oil samples.
8) The presented hybrid ANN tool can be combined withavailable asphaltene precipitation simulation softwares toenhance their performance, lower their uncertainties, andincrease their prediction and modeling capabilities.
cknowledgments
he authors would like to acknowledge the financial sup-ort of this research by the Natural Sciences and Engineeringesearch Council of Canada (NSERC) and the Mitacs Elevate.
eferences
bdallah, D., Al-Basry, A., Zwolle, Z., Grutters, M., Huo, Z.,Stankiewicz, A., 2010. Asphaltene studies in on-shore AbuDhabi oil fields. PART II: Investigation and mitigation ofasphaltene deposition – A case study. In: Paper SPE #138039-MS presented at the Abu Dhabi InternationalPetroleum Exhibition and Conference, 1–4 November 2010,Abu Dhabi, UAE.
fshari, S., Kharrat, R., Ghazanfari, M.H., 2010. Asphalteneprecipitation study during natural depletion at reservoirconditions. In: Paper SPE # 130071-MS presented at theCPS/SPE Int. Oil Gas Conf. and Exh., 8–10 June 2010, Beijing,China.
grawala, M., Yarranton, H.W., 2001. Asphaltene associationmodel analogous to linear polymerization. Ind. Eng. Chem.Res. 40, 4664–4672.
kbarzadeh, K., Ayatollahi Sh Moshfeghian, M., Alboudwarej, H.,Yarranton, H.W., 2004. Estimation of SARA fraction propertiesusing the SRK EOS. J. Can. Pet. Tech. 43 (9), 31–39.
kbarzadeh, K., Hammami, A., Kharrat, A., Zhang, D., Allenson,S., Creek, J., Kabir, S., Jamaluddin, A., Marshall, A.G., Rodgers,R.P., Mullins, O.C., Solbakken, T., 2007. Asphaltenes -Problematic but rich in potential. Oilfield Review 19 (2), 22–43.
lizadeh, A., Nakhli, H., Kharrat, R.M., Ghazanfari, H., 2011. An
experimental investigation of asphaltene precipitation duringnatural production of heavy and light oil reservoirs: The roleof pressure and temperature. Pet. Sci. & Tech 29 (10),1054–1065.
Andersen, S.I., Speight, J.G., 2001. Petroleum resins: separation,character, and role in petroleum. Pet. Sci. Tech. 19 (1), 1–34.
Ashoori, S., Abedini, A., Abedini, R., Qorbani-Nasheghi, Kh., 2010.Comparison of scaling equation with neural network modelfor prediction of asphaltene precipitation. J. Pet. Sci. Eng. 72,186–194.
Aske, N., Kallevik, H., Johnsen, E.E., Sjoblom, J., 2002. Asphalteneaggregation from crude oils and model systems studied byhigh pressure NIR spectroscopy. Energy Fuels 16,1287–1295.
Atashpaz-Gargari, E., Lucas, C., 2007. Imperialist competitivealgorithm: an algorithm for optimization inspired byimperialistic competition. IEEE Cong. Evol. Comp. 2007,4661–4667.
Buckley, J.S., Wang, J., 2002. Crude oil and asphaltenecharacterization for prediction of wetting alteration. J. Pet. Sci.Eng. 33 (1–3), 1889–1893.
Buenrostro-Gonzalez, E., Andersen, S.I., Garcia-Martinez, J.A.,Lira-Galeana, C., 2002. Solubility/molecular structurerelationships of asphaltenes in polar and nonpolar media.Energy Fuels 16, 732–741.
Buenrostro-Gonzalez, E., Lira-Galeana, C., Gil-Villegas, A., Wu, J.,2004. Asphaltene precipitation in crude oils: theory andexperiments. AIChE J. 50 (10), 2552–2570.
Burke, N.E., Hobbs, R.D., Kashou, S.F., 1990. Measurement andmodeling of asphaltene. J. Pet. Tech. 1990, 1440–1446.
Chapman, W.G., Gubbins, K.E., Jackson, G., Radosz, M., 1989.SAFT: equation-of-state solution model for associating fluids.Fluid Phase Equil. 52, 31–38.
Chapman, W.G., Gubbins, K.E., Jackson, G., Radosz, M., 1990. Newreference equation of state for associating liquids. Ind. Eng.Chem. Res. 29 (8), 1709–1721.
Chapman, W.G., Sauer, S.G., Ting, D., Ghosh, A., 2004. Phasebehavior applications of SAFT based equations of state-fromassociating fluids to polydisperse, polar copolymers. FluidPhase Equil. 217 (2), 137–143.
Chung, F., Sarathi, P., Jones, R., 1991. Modeling of asphaltene andwax precipitation. Topical Report in NIPER-498. DOE, January1991.
Coulibaly, P., Baldwin, C.K., 2005. Nonstationary hydrological timeseries forecasting using nonlinear dynamic methods. J.Hydrol. 307, 164–174.
de Boer, R.B., Leerlooyer, K., Eigner, M.R.P., Mij, B.V., van Bergen,A.R.D., 1995. Screening of crude oils for asphalt precipitation:theory, practice, and the selection of inhibitors. SPE Prod.Facil. 10 (1), 55–61.
Eberhart, R.C., Kennedy, J.,1995. A new optimizer using particleswarm theory. In: Proc. Sixth Int. Symp. Micro Machine andHuman Sci. (Nagoya, Japon). IEEE Service Center, Piscataway,NJ, pp. 39–43.
Eberhart, R.C., Simpson, P., Dobbins, R., 1996. ComputationalIntelligence PC Tools. Academic Press.
Feng-Lan, Z., Jie-nian, Y., 2004. A study on inhibitors andremovers for asphaltene deposits from heavy crude oils.Oilfield Chem. 21, 310–312.
Figuera, L., Marin, M., Lopez, L., Marin, E., Gammiero, A., Granado,C., 2010. Characterization and modeling of asphalteneprecipitation and deposition in a compositional reservoir. In:Paper SPE # 133180 presented at the SPE Ann. Tech. Conf. andExh., 19–22 September 2010, Florence, Italy.
Firoozabadi, A., 1999. Thermodynamics of HydrocarbonReservoirs, first ed. McGraw-Hill, New York.
Flory, P.J., 1942. Thermodynamics of high polymer solutions. J.Chem. Phys. 10, 51–61.
Ghloum, E.F., Al-Qahtani, M., Al-Rashid, A., 2010. Effect ofinhibitors on asphaltene precipitation for Kuwaiti reservoirs.J. Pet. Sci. Eng. 70, 99–106.
Greaves, M., Xia, T.X., 2004. Downhole catalytic process for
upgrading heavy oil: produced oil properties and composition.Journal of Canadian Technology 43, 25–30.
874 chemical engineering research and design 9 2 ( 2 0 1 4 ) 857–875
Gupta, A.K., 1986. A Model for Asphaltene Flocculation Using anEquation of State. Department of Chemical and PetroleumEngineering, University of Calgary, M.Sc. Thesis.
Hagan, M.T., Demuth, H.B., Beal, M., 1966. Neural NetworkDesign. PWS Publishing Company, Boston.
Hirscberg, L.N.J., de Jong, B.A., Schipper, B.A., Meijer, J.G., 1984.Influence of temperature and pressure on asphalteneflocculation. SPEJ, 283–293.
Hornick, K., Stinchcombe, M., White, H., 1989. Multilayer feedforward networks are universal approximators. NeuralNetworks 2, 359–366.
Hornik, K., Stinchcombe, M., White, H., 1990. Universalapproximation of an unknown mapping and its derivativesusing multilayer feed forward networks. Neural Networks 3(5), 551–600.
Hu, U-F., Guo, T-M., 2001. Effect of temperature and molecularweight of n-alkane precipitants on asphaltene precipitation.Fluid Phase Equil. 192, 13–25.
Hu, Y.F., Chen, G.J., Yang, J.T., Guo, T.M., 2000. A study on theapplication of scaling equation for asphaltene precipitation.Fluid Phase Equil. 171, 181–195.
IP 143/90 or ASTM D3279-90, 1985. Asphaltene (HeptaneInsolubles) in Petroleum Products. Standards for Petroleumand its Products. Institute of Petroleum, London, UK, pp.143.1–143.7.
Jamaluddin, A.K.M., Creek, J., Kabir, C.S., Mcfadden, J.D., D’cruz,D., Manakalathil, J., Joshi, N., Ross, B., 2002. Laboratorytechniques to measure thermodynamic asphaltene instability.J. Can. Pet. Tech. 41, 44–52.
Jamaluddin, A.K.M., Nighswander, J.N., Koshe, B.F., El Mahdi, A.,Binbrek, M.A., Hogg, P.F., 2000. Experimental and theoreticalassessment of the asphaltene precipitation characteristics ofthe Sahil field under a proposed gas injection scheme. In:Paper SPE # 87292 presented at the SPE Conf. and Exh., 15–18October 2000, Abu Dhabi, UAE.
James, W., 1890. The Principles of Psychology. H. Holt andCompany, New York.
Junior, L.C.R., Ferreira, M.S., Ramos, A.C.S., 2006. Inhibition ofasphaltene precipitation in Brazilian crude oils using new oilsoluble amphiphiles. J. Pet. Sci. Eng. 51, 26–36.
Katz, D.L., Beu, K.E., 1945. Nature of asphaltic substances. Ind.Eng. Chem. 37 (2), 195–200.
Kawanaka, S., Park, S.J., Mansoori, G.A., 1991. Organic depositionfrom reservoir fluids: a thermodynamic predictive technique.SPE Res. Eng. 6 (2), 185–192.
Kim, S.T., Boudh-Hir, M.-E., Mansoori, G.A., 1990. The role ofasphaltene in wettability reversal. In: SPE Paper presented atthe SPE Ann. Tech. Conf. and Exh., 1990, New Orleans,Louisiana.
Kokal, S.L., Najman, J., Sayegh, S.G., George, A.E., 1992.Measurement and correlation of asphaltene precipitationfrom heavy oils by gas injection. J. Can. Pet. Tech. 31 (4),24–30.
Koots, J.A., Speight, J.G., 1975. Relation of petroleum resins toasphaltenes. Fuel 54 (3), 179–184.
Leontaritis, K.J., Amaefule, J.O., Charles, R.E., 1994. A systematicapproach for prevention and treatment of formation damagecaused by asphaltene deposition. SPE Prod. Facil.,157–164.
Leontaritis, K.J., Mansoori, G.A., 1987. Asphaltene flocculationduring oil production and processing: a thermodynamiccolloidal model. In: Paper SPE # 16258 presented at the SPE Int.Symp. Oilfield Chem., 4–5 February 1987, San Antonio, Texas,USA.
Lucas, C., Nasiri-Gheidari, Z., Tootoonchian, F., 2010. Applicationof an imperialist competitive algorithm to the design of alinear induction motor. Energy Conserv. Manage. 51 (7),1407–1411.
Mansoori, G.A., 1997. Modeling of asphaltene and other heavyorganic depositions. J. Pet. Sci. Eng. 17, 101–111.
Ming-Fu, M., Wei, L., Ya-Cun, L., 2005. Pore structure
characteristics analysis of the oilfield in North Melut Basin,Sudan. Pet. Exp. Dev. 32, 121–124.Mirzabozorg, A., Bagheri, M.B., Kharrat, R., Abedi, J., Ghotbi, C.,2009. Simulation study of permeability impairment due toasphaltene deposition in one of the Iranian Fractured OilReservoirs. PETSOC-2009-088-P.
Monger, T.G., Fu, J.C., 1987. The nature of CO2-induced organicdeposition. In: SPE Paper # 16713 presented at the SPE Ann.Tech. Conf. and Exh., Houston, TX.
Mousavi-Dehghani, S.A., Riazi, M.R., Vafaie-Sefti, M., Mansoori,G.A., 2004. An analysis of methods for determination ofonsets of asphaltene phase separations. J. Pet. Sci. Eng. 42,145–156.
Nakhli, H., Alizadeh, A., Sadeqi-Moqadam, M., Afshari, S.,Kharrat, R., Ghazanfari, M.H., 2011. Monitoring of asphalteneprecipitation: experimental and modeling study. J. Pet. Sci.Eng. 78, 384–395.
Nellensteyn, F.J., 1938. The colloidal structure of bitumen. TheScience of Petroleum, vol. 4. Oxford University Press, London,UK, pp. 2760.
Nghiem, L.X., Coombe, D.A., 1998. Compositional simulation ofasphaltene deposition and plugging. In: SPE Ann. Tech. Conf.and Exh., 27–30 September 1998, New Orleans, Louisiana.
Nghiem, L.X., Coombe, D.A., 1997. Modeling asphalteneprecipitation during primary depletion. SPE J. 2,170–176.
Nghiem, L.X., Hassam, M.S., Nutakki, R., 1993. Efficient modelingof asphaltene precipitation. In: SPE Ann. Tech. Conf. and Exh.,3–6 October 1993, Houston, Texas.
Nikookar, M., Pazuki, G.R., Omidkhah, M.R., Sahranavard, L., 2008.Modification of a thermodynamic model and an equation ofstate for accurate calculation of asphaltene precipitationphase behavior. Fuel 87, 85–91.
Novosad, Z., Costain, T.G., 1990. Experimental and modelingstudies of asphaltene equilibria for a reservoir under CO2
injection. In: 65th SPE Ann. Tech. Conf. and Exh., 23–28September, New Orleans, LA.
Pan, H., Firoozabadi, A., 2000. Thermodynamic micellizationmodel for asphaltene precipitation from reservoir crudes athigh pressures and temperatures. SPE Prod. Facil. 15,58–65.
Park, S.J., Mansoori, G.A., 1988. Aggregation and deposition ofheavy organics in petroleum crudes. Int. J. Energy Sources 10,109–125.
Pedersen, K.S., Hasdbjerg, C., 2007. PC-SAFT equation of stateapplied to petroleum reservoir fluids. In: SPE Ann. Tech. Conf.and Exh., 2007, Anaheim, California, USA.
Pfeiffer, J.P., Saal, R.N.J., 1940. Asphaltene bitumen as colloidsystem. J. Phys. Chem. 44, 139–149.
Priyanto, S., Mansoori, G.A., Suwono, A., 2001. Measurement ofproperty relationships of nano-structure micelles andcoacervates of asphaltene in a pure solvent. Chem. Eng. Sci.56, 6933–6939.
Rassamdana, H., 1996a. Asphalt flocculation and deposition: II.Formation and growth of fractal aggregates. AIChE J. 42,3318–3332.
Rassamdana, H., 1996b. Asphalt flocculation and deposition: I.The onset of precipitation. AIChE J. 42, 10–21.
Rassamdana, H.B., Dabir, B., Nematy, M., Farhani, M., Sahimi, M.,1996. Asphaltene flocculation and deposition: I. The onset ofprecipitation. AIChE J. 42 (1), 10–22.
Shedid, S.A., 2002. A novel technique of asphaltene depositiontreatment using ultrasonic irradiation. Pet. Sci. Tech. 20 (9–10),1097–1118.
Sirvastava, R.K., Huang, S.S., Dyer, S.B., Mourits, F.M., 1995.Quantification of asphaltene flocculation during miscible CO2
flooding in the Weyburn reservoir. J. Can. Pet. Tech. 34,31–42.
Speight, J.G., 1999. The chemical and physical structure ofpetroleum: effect on recovery operations. J. Pet. Sci. Eng. 22,3–15.
Speight, J.G., Moschopedis, S.E., 1981. On the molecular nature ofpetroleum asphaltene: chemistry of asphaltene. American
Chemical Society Advances in Chemistry Series,No. 195.
chemical engineering research and design 9 2 ( 2 0 1 4 ) 857–875 875
S
T
V
V
W
peight, J.G., Wernick, D.L., Gould, K.A., Overfield, R.E., Rao,B.M.L., Savage, D.W., 1985. Molecular weight and associationof asphaltenes: a critical review. Revue De L’Institut FrancaisDu Petrole 40 (1), 51–61.
avakkoli, M., Masihi M., Kharrat, R., Ghazanfari, M.H., 2009.Thermodynamic modelling of asphaltene precipitation forheavy crude: a comparative study of thermodynamicmicellization model and solid model. PETSOC-2009-090-P.
afaie-Sefti, M., Mousavi-Dehghani, S.A., Mohammad-Zadeh,M.A., 2003. Simple model for asphaltene deposition inpetroleum mixtures. Fluid Phase Equil. 206 (1-2),1–11.
ictorov, A.I., Firoozabadi, A., 1996. Thermodynamics ofasphaltene precipitation in petroleum fluids by amicellization model. AIChE J. 42,1753–1764.
axman, M.H., Deeds, C.T., Closmann, P.J., 1980. Thermalalterations of asphaltenes in Peace River Tars. In: Paper SPE #
9510 presented at the SPE Ann. Tech. Conf. and Exh., 21–24September 1980, Dallas, Texas.Wu, J., Prausnitz, J.M., Firoozabadi, A., 1998.Molecular-thermodynamic framework for asphaltene-oilequilibria. AIChE J. 44 (5), 1188–1199.
Wu, J., Prausnitz, J.M., Firoozabadi, A., 2000. Molecularthermodynamics of asphaltene precipitation in reservoirfluids. AIChE J. 46 (1), 197–209.
Yen, A., Yin, Y.R., Asomaning, S., 2001. Evaluating asphalteneinhibitors: laboratory tests and field studies. In: Paper SPE #65376-MS presented at the SPE Int. Symp. Oilfield Chem. 2001,Houston, Texas.
Yen, T.F., Wu, W.H., Chilingar, G.V., 1984. A study of the structureof petroleum asphaltenes and related substances by protonnuclear magnetic resonance. Energy Sources 7 (3), 275–304.
Zahedi, G., Fazlali, A.R., Hussein, S.M., Pazuki, G.R., Sheikhattar,L., 2009. Prediction of asphaltene precipitation in crude oil. J.Pet. Sci. Eng. 68, 218–222.
Zekri, A.Y., Shedid, S.A., Alkashef, H., 2001. Use of lasertechnology for the treatment of asphaltene deposition incarbonate formations. In: Paper SPE # 71457-MS presented at
the SPE Ann. Tech. Conf. and Exh., 30 September–3 October2001, New Orleans, Louisiana.