chemical resistance of cement paste to the action of
TRANSCRIPT

Chemical resistance of cement paste to the action ofdeionized water
Đuroković, Marija
Doctoral thesis / Disertacija
2019
Degree Grantor / Ustanova koja je dodijelila akademski / stručni stupanj: University of Zagreb, Faculty of Science / Sveučilište u Zagrebu, Prirodoslovno-matematički fakultet
Permanent link / Trajna poveznica: https://urn.nsk.hr/urn:nbn:hr:217:449477
Rights / Prava: In copyright
Download date / Datum preuzimanja: 2021-11-26
Repository / Repozitorij:
Repository of Faculty of Science - University of Zagreb

FACULTY OF SCIENCE
Marija Đuroković
CHEMICAL RESISTANCE OF CEMENT PASTE TO
THE ACTION OF DEIONIZED WATER
DOCTORAL THESIS
Zagreb, 2019


PRIRODOSLOVNO-MATEMATIČKI FAKULTET
Marija Đuroković
KEMIJSKA OTPORNOST CEMENTNE PASTE
PREMA DJELOVANJU DEIONIZIRANE VODE
DOKTORSKI RAD
Mentori: Prof. dr. sc. Dubravka Matković–Čalogović Dr. sc. Ivan Janotka
Zagreb, 2019.


FACULTY OF SCIENCE
Marija Đuroković
CHEMICAL RESISTANCE OF CEMENT PASTE TO
THE ACTION OF DEIONIZED WATER
DOCTORAL THESIS
Supervisors: Prof.dr.sc. Dubravka Matković–Čalogović Dr.sc. Ivan Janotka
Zagreb, 2019


Acknowledgments This work is a result of my twenty-two years long work within Croatian Portland cement industry. On this long-lasting trip, I have met many people who have encouraged my development by sharing their knowledge, experience and passion for simple grey powder which enables people to create and moderate our surroundings. It is really hard to find appropriate words to describe my gratitude to all of them. My special acknowledgments go to my supervisors prof. dr. sc. Dubravka Matković-Čalogović and dr. sc. Ivan Janotka for their guidance, help, support and humanity on my way towards scientific approach to Portland cement needs and problems. It has been my honour to be their student. My acknowledgments go also to the evaluation committee for their suggestions and comments. I am especially grateful to my colleagues from Institute IGH who has supported my efforts on daily basis. Finally, I thank members of my family: my husband Tomislav and my children Lucija, Katarina and David, for their unconditional love and support throughout my whole professional life. I am also especially grateful to my parents: Terezija and Josip and my aunt Ivanka who have always believed in me.
Marija


Contents
ABSTRACT ............................................................................................................................ XI
SAŽETAK ............................................................................................................................ XIII
PROŠIRENI SAŽETAK....................................................................................................... XV
§ 1. INTRODUCTION .......................................................................................................... 1
1.1. Problem statement ....................................................................................................................... 1
1.2. Objectives, hypothesis and methods of research ....................................................................... 3
§ 2. LITERATURE REVIEW .............................................................................................. 4
2.1. Portland cement ........................................................................................................................... 4
2.2. Portland cement composition ...................................................................................................... 5
2.2.1. Bulk composition of Portland cement ............................................................................................ 5
2.2.2. Portland cement phase composition .............................................................................................. 6
2.2.3. Calculation of phase composition .................................................................................................. 9
2.3. X-ray diffraction .......................................................................................................................... 9
2.4. Minor elements in Portland cement ......................................................................................... 13
2.5. Portland cement hydration........................................................................................................ 14
2.5.1. Hydration of alite ......................................................................................................................... 14
2.5.2. Hydration of belite ....................................................................................................................... 18
2.5.3. Experimental considerations ........................................................................................................ 18
2.5.4. Hydration of aluminate and ferrite phase .................................................................................... 18
2.5.5. Portland cement hydration ........................................................................................................... 20
2.5.6. Hydration kinetics and mechanism of hydration.......................................................................... 20
2.6. Microstructure of hardened Portland cement paste ............................................................... 21
2.6.1. Scanning electron microscopy ..................................................................................................... 22
2.6.2. Distribution of the trace elements in hydrated Portland cement paste ........................................ 24
2.6.3. Pore solution chemistry ............................................................................................................... 25
2.7. Portland cement production...................................................................................................... 29
2.7.1. Production process ...................................................................................................................... 29
2.7.2. CO2 emission in Portland cement production .............................................................................. 31
2.8. Calcium sulfoaluminate cement ................................................................................................ 33
2.9. Leaching ...................................................................................................................................... 35
§ 3. MATERIALS AND METHODS ................................................................................. 37
3.1. Introduction ................................................................................................................................ 37
3.2. Materials and methods .............................................................................................................. 37

3.2.1. Cement ......................................................................................................................................... 39
3.2.2. Deionised water ........................................................................................................................... 45
3.3. Sample preparation .................................................................................................................... 49
3.3.1. Cement paste preparation ............................................................................................................ 49
3.3.2. Prismatic samples compaction and curing .................................................................................. 50
3.3.3. Cylindric samples compaction and curing ................................................................................... 51
3.3.4. Obtaining pore solution and prime characterisation ................................................................... 53
3.4. Testing methods .......................................................................................................................... 55
3.4.1. Determination of strength and preparation of samples for chemical analysis ............................ 55
3.4.2. Determination of secant modulus of elasticity ............................................................................. 55
3.4.3. Powder X-ray diffraction ............................................................................................................. 56
3.4.5. Determination of chemical compostion of pore solution ............................................................. 57
3.4.6. Determination of dimensional stability ........................................................................................ 58
3.4.7. Determination of the mass loss .................................................................................................... 59
3.4.8. Determination of water absorption coefficient due to capillary action ....................................... 59
3.4.9. Determination of permeability to gasses ...................................................................................... 60
3.4.10. SEM determination ................................................................................................................. 61
3.4.11. Air voids content ..................................................................................................................... 61
3.4.12. Used chemicals and reagents ................................................................................................. 63
§ 4. RESULTS AND DISCUSSION ................................................................................... 66
4.1. Characterization of starting materials ..................................................................................... 66
4.2. Hydration of cement pastes ....................................................................................................... 74
4.3. Mechanical and physical properties of hydrated cement pastes ............................................ 77
4.4. Microstructural properties ........................................................................................................ 81
4.5. Cement paste and pore solution composition .......................................................................... 84
§ 5. CONCLUSION ............................................................................................................. 91
§ 6. LIST OF ABREVIATIONS ......................................................................................... 93
§ 7. BIBLIOGRAPHY ......................................................................................................... 95
§ 8. APPENDIX ............................................................................................................. XLVII
§ 9. CURRICULUM VITAE............................................................................................ LIII

§ Abstract xi
Marija Đuroković Doktorska disertacija
University of Zagreb
Faculty of Science
Department of Chemistry
Doctoral Thesis
ABSTRACT
CHEMICAL RESISTANCE OF CEMENT PASTE TO THE ACTION OF DEIONIZED WATER
Marija Đuroković
Institute IGH d.d., Department for materials and structures, Laboratory for binders and ecology, Janka Rakuše 1, 10000 Zagreb, Hrvatska
Introduction of new, sustainable materials into the existing civil engineering standards requires durability data for different degradation processes. Unfortunately, durability tests are not standardized. In this work degradation process of decalcification, also called leaching, of cement pastes was studied. The research was conducted on three different immature cement pastes. Two Portland cements based on calcium silicate or aluminate compounds and a cement based on calcium sulfoaluminate compounds were used for preparation of cement pastes. The change in chemical composition of cement pastes and pore solutions, phase compositions, microstructures of cement pastes and their mechanical properties (strength, modulus of elasticity, dimensional and mass stability) were observed during a 365 days leaching period. The results indicate no significant impact of leaching on microstructure, modulus of elasticity, dimensional and mass stability. The observed strength decrease correlates with the observed changes in phase and chemical composition of the cement pastes and pore solutions.
(106 + LIV pages, 56 figures, 31 tables, 236 references, original in English)
Thesis deposited in Central Chemical Library, Horvatovac 102A, Zagreb, Croatia and National and University Library, Hrvatske bratske zajednice 4, Zagreb, Croatia. Key words: Calcium sulfoaluminate cement / cement paste/ leaching / Portland cement Supervisors: Prof. dr. sc. Dubravka Matković –Čalogović, Dr. sc. Ivan Janotka Thesis accepted: 9th October 2019. Reviewers: izv. prof. dr. sc. Sanda Rončević, MPF, Zagreb prof. dr. sc. Dubravka Matković–Čalogović, PMF, Zagreb
doc. dr. sc. Jelena Bleiziffer, Građevinski fakultet, Zagreb zamjena: dr.sc. Goran Štefanić, zn. savj., IRB Zagreb


§ Sažetak xiii
Sveučilište u Zagrebu
Prirodoslovno-matematički fakultet
Kemijski odsjek
Doktorska disertacija
SAŽETAK
KEMIJSKA OTPORNOST CEMENTNE PASTE PREMA DJELOVANJU DEIONIZIRANE VODE
Marija Đuroković
Institut IGH d.d. , Zavod za materijale i konstrukcije, Laboratorij za veziva i ekologiju, Janka Rakuše 1, 10 000 Zagreb, Croatia
Uvođenje novih materijala u postojeće građevinske norme zahtijeva podatke o trajnosnim svojstvima novih materijala. Nažalost, ispitivanja trajnosnih svojstava materijala nisu standardizirana. U ovom radu je opisano istraživanje procesa degradacije dekalcifikacijom ili izluživanjem. Istraživanje je provedeno na tri različite nezrele cementne paste. Dva tipa portlandskog cementa izgrađenih od kalcijevih silikata ili aluminata i cement izgrađenog od kalcijevih sulfoaluminata korišteni su za izradu uzoraka cementnih pasti u ovom istraživanju. Praćene su promjene kemijskog sastava cementnih pasta i pornih otopina, faznog sastava, mikrostrukture cementne paste kao i mehaničkih svojstava (čvrstoće, modula elastičnosti, promjene dimenzija i mase) u periodu izluživanja od 365 dana. Rezultati ispitivanja ne pokazuju značajan utjecaj izluživanja na mikrostrukturu, modul elastičnosti, dimenzionalnu i masenu stabilnosti. Uočeni pad čvrstoće povezan je s učenim promjenama faznog i kemijskog sastava cementnih pasti i pornih otopina.
(106 + LIV stranica, 56 slika, 31 tablica, 236 literaturnih navoda, jezik izvornika: engleski)
Rad je pohranjen u Središnjoj kemijskoj knjižnici, Horvatovac 102a, Zagreb i Nacionalnoj i sveučilišnoj knjižnici, Hrvatske bratske zajednice 4, Zagreb.
Ključne riječi: cementna pasta / kalcijev sulfoaluminatni cement / izluživanje / portlandski cement
Mentori: Prof. dr. sc. Dubravka Matković–Čalogović, Dr. sc. Ivan Janotka Rad prihvaćen: 09. listopada 2019. Ocjenitelji: izv. prof. dr. sc. Sanda Rončević, MPF, Zagreb prof. dr. sc. Dubravka Matković–Čalogović, PMF, Zagreb
doc. dr. sc. Jelena Bleiziffer, Građevinski fakultet, Zagreb zamjena: dr.sc. Goran Štefanić, zn. savj., IRB Zagreb


§ Prošireni sažetak xv
Sveučilište u Zagrebu
Prirodoslovno-matematički fakultet
Kemijski odsjek
Doktorska disertacija
PROŠIRENI SAŽETAK
UVOD
Doprinos proizvodnje portlandskog cementa ukupnoj emisiji ugljikovog dioksida koji
nastaje ljudskim djelovanjem iznosi od 5 % do 8 %. Zbog toga je traženje održivijih rješenja
postalo jedan od ključnih pokretača istraživanja i inovacija u području portlandskog cementa
[K. L.Scrivener i R. J. Kirkpatrick, Cem. Concr. Res. 38 (2008) 128 – 136]. Razvijeni su
različiti načini značajnijeg smanjenja emisije CO2 [K. L.Scrivener i R. J. Kirkpatrick, Cem.
Concr. Res. 38 (2008) 128 – 136; C. D. Lawrence, Proizvodnja nisko – energetskih
cemenata, u: P. C. Hewlett (ur.) Lea – Kemija Cementa i Betona četvrto izdanje, Oxford,
Elsevier, 2005, str. 421 - 470 (engleski izvornik); C. Shi, A. F. Jiménez i A. Palomo, Cem.
Concr. Res. 41 (2011) 750 - 763]. Tradicionalna rješenja utemeljena su na poboljšanju
portlandskog cementa opće namjene koji su utemeljeni na spojevima kalcijevih silikata ili
aluminata. Inovativnija rješenja uključuju nove cemente utemeljene na sulfoaluminatnim,
sulfoferitnim ili fluoraluminatnim spojevima [C. Shi, A. F. Jiménez i A. Palomo, Cem. Concr.
Res. 41 (2011) 750 - 763]. Moderno građevinarstvo utemeljeno je na normama koje su vrlo
konzervativne jer im je osnovna svrha zaštita od katastrofalnih pogrešaka i gubitka života [K.
L.Scrivener i R. J. Kirkpatrick, Cem. Concr. Res. 38 (2008) 128 – 136]. Ključan nedostatak
cjelovitog pristupa u razvoju novih tipova cementa predstavlja nedostatak standardiziranih
metoda ispitivanja trajnosti cementne paste.
U normalnim uvjetima cementni kompoziti imaju dobru trajnost u normalnom vijeku
uporabe do 70 godina i više [J. Radić i J. Bleiziffer, Trajnost betonskih konstrukcija, u: J.
Radić (ur.) Betonske konstrukcije 4: Sanacije, Hrvatska sveučilišna naklada, Građevinski
fakultet Sveučilišta u Zagrebu, Secon HDGK, 2008, str. 83 – 164]. Tijekom uporabe cementa
pasta može biti izložena djelovanju okoliša i degradaciji što može skratiti vijek uporabe.
Deionizirana voda koja sadrži male koncentracije otopljenih iona u dodiru s portlandskom
§ Prošireni sažetak xvi
cementnom pastom izaziva dekalcifikaciju [F. Adenot i M. Buil, Cem. Conc. Res. 22 (1992)
489 - 496; M. Mainguy, C. Tognazzi, J. M. Torrenti i F. Adenot, Cem. Concr. Res. 30 (2000)
83 - 90]. Proces se naziva izluživanje. Ključne posljedice izluživanja su povećanje poroznosti
i propusnosti i gubitak čvrstoće u konstrukcijama koje su mu izložene [F. P. Glasser, J.
Marchand i E. Samson, Cem. Concr. Res. 38 (2008) 226 – 246; C. Carde, R. Franqois i J. M.
Torrenti, Cem. Concr. Res. 26 (1996) 1257 – 1268; F. H. Heukamp, F. J. Ulm i J. T.
Germaine, Cem. Concr. Res. 31 (2001) 767 – 774; G. J. Verbeck i R. H. Helmuth, Struktura i
fizička svojstva cementne paste, Zbornik radova s Petog međunarodnog simpozija o kemiji
cementa, knjiga I, Tokyo, Japan, 1968, str. 1 - 32]. Opći pristup ispitivanju otpornosti
portlandske cementne paste prema izluživanju nije još razvijen. Osobito nedostaju ispitivanja
u kojima su kemijski i mineraloški sastavi povezani s mehaničkim svojstvima kao što su
čvrstoća, modul elastičnosti, dimenzije i slično. Nedostatak pouzdane procedure provjere
otpornosti portlandske cementne paste prema izluživanju, sprječava uvođenje novih vrsta
cementa u postojeće norme.
Ciljevi ovog rada su:
• odrediti promjene u kemijskom i faznom sastavu i mikrostrukturi nezrelih cementih
pasta različitog početnog kemijskog i mineraloškog sastava izloženih izluživanju
deioniziranom vodom, bez zaustavljanja hidratacije;
• odrediti promjenu mehaničkih i fizičkih svojstava: čvrstoće, modula elastičnosti,
dimenzionalne i masene stabilnosti izazvanih izluživanjem;
• odrediti utjecaj početnog sastava cementa na proces izluživanja i utjecaj izluživanja na
proces hidratacije;
• odrediti mogućnost upotrebe elemenata u tragovima u ispitivanjima izluživanja;
• određivanje mogućnosti provođenja ispitivanja izluživanja na nezrelim cementnim
pastama u djelomično otvorenom sustavu.
Osnovna hipoteza rada je da otpornost cementne paste djelovanju deionizarne vode ovisi o
svojstvima svih sastavnica cementne paste: hidratacijskim produktima, pornoj otopini i
sustavu pora. Ta su svojstva određena faznim sastavom nehidratiziranog cementa i uvjetima
njegovanja u kojima se odvijaju kemijske reakcije.
U istraživanju za određivanje faznog sastava nehidratiziranog cementa i za praćenje
promjena faznog sastava cementne paste s protekom vremena upotrebljena je rendgenska
difrakcija. Kemijski sastav (glavni, sporedni i elementi u tragovima) određeni su metodama
§ Prošireni sažetak xvii
mokre kemije ili spektrometrijom masa s induktivno spregnutom plazmom. Promjene u
mikrostrukturi određene su pretražnim elektronskim mikroskopom, određivanjem sadržaja
zraka u mirkoporama, određivanjem kapilarnog upijanja vode i određivanjem
plinopropusnosti. Kemijska otpornost cementne paste prema djelovanju deionizirane vode
praćena je promjenama u čvrstoći, modulu elastičnosti, dimenzionalnoj i masenoj stabilnosti.
Znanje o međuovisnosti sastava cementa, cementne paste, porne otopine, mikrostrukture
cementne paste, uvjeta njegovanja i otpornosti djelovanju deionizirane vode može pomoći u
oblikovanju novih tipova cementa s manjim utjecajem na okoliš.

§ Prošireni sažetak xviii
LITERATURNI PREGLED
Portlandski cement
Cementom se općenito nazivaju povezujući dijelovi kompozitnog materijala, obično
betona, morta ili cementne paste [A. Đureković, Cement i cementni kompoziti i dodaci za
beton, Školska knjiga, Zagreb, 1996, str. 1-20]. Cement je praškasti materijal koji u dodiru s
vodom kemijskim i fizikalnim procesima, prelazi u očvrslu cementnu pastu. Portlandski
cement se proizvodi mljevenjem portlandskog cementnog klinkera uz dodatak nekoliko
postotaka gipsa [V. Ukrainczyk, Beton, Alcor, Zagreb, 1994, str. 11 – 39].
Portlandski cement je izumljen početkom 19. stoljeća. Izum je djelomično utemljeljen na
graditeljskom znanju iz doba Grčke i Rima [R. G. Blezard, Povijest kalcijskog cementa, u: P.
C. Hewlett (ur.) Lea – Kemija Cementa i Betona četvrto izdanje, Oxford, Elsevier, 2005,
str. 1 - 23 (engleski izvornik)]. Danas je portlandski cement u obliku konačnog proizvoda,
betona, najviše korišten materijal u graditeljstvu [P. K. Mehta i P. J. M. Monteiro, Beton:
Mikrostruktura, Svojstva i Materijali, New York, McGraw-Hill, 2006, str. 203 – 251
(engleski izvornik)]. Procijenjena svjetska proizvodnja portlandskog cementa u 2016. godini
je 4,6 milijardi tona, od čega se više od 52 % proizvodi u Kini
[https://cembureau.eu/media/1716/activity-report-2017.pdf (pristup 28. veljače 2019.)].
Proizvodnja cementa ima značajnu ulogu u ekonomskom, društvenom razvoju i razvoju
okoliša.
Sastav portlandskog cementa
Različiti spojevi kalcija nalaze se u sastavu portlandskog cementa. Kemijski sastav
portlandskog cementa izražava se u obliku oksida. Oksidi kalcija (CaO), aluminija (Al2O3) i
željeza (Fe2O3) određuju kemijski sastav cementa. Kemičari se u svakodnevnom radu koriste
skraćenicama za pojedine okside koje su navedene u tablici I.I. Titrimetrijske metode
upotrebom etilendiamintetraoctene kiseline najčešće se koriste za određivanje sadržaja CaO,
MgO, Al2O3 i Fe2O3 u portlandskom cementu. Selektivnost je kontrolirana s pH i
maskiranjem pogodnim reagensima. Silicij se određuje tradicionalnim metodama, obradom
uzorka klorovodičnom kiselinom i amonijevim kloridom kako bi se otopili drugi spojevi.

§ Prošireni sažetak xix
Nakon otapanja slijedi titracija i spaljivanje. Poznata metoda taloženja barijevim kloridom
koristi se za određivanje sulfata.
Tablica I.I. Skraćenice oksida u portlandskom cementu
Oksid Skraćenica
CaO C
SiO2 S
Al2O3 A
Fe2O3 F
MgO M
SO3 �̅
Na2O N
K2O K
H2O H
Plamena fotometrija primjenjuje se za određivanje alkalijskih elemenata, a
spektrofotometrija za određivanje mangana. Kloridi se određuju taloženjem s otopinom
srebrovog nitrata i povratnom titracijom s amonijevim tiocijanatom [C. D. Lawrence, Sastav i
specifikcije portlandskog cementa, u: P. C. Hewlett (ur.) Lea – Kemija Cementa i Betona
četvrto izdanje, Oxford,, Oxford, Elsevier, 2005, str. 131 – 193 (engleski izvornik)].
Kemijski sastav portlandskog cementa nije povezan s mehaničkim svojstvima kao što je
čvrstoća i konačan zaključak o portlandskom cementu ne može se izvesti iz kemijske analize.
Faze koje nastaju kemijskim reakcijama na visokim temperaturama tijekom proizvodnje
cementa određuju ključna svojstva portlandskog cementa [H. F. W. Taylor, Kemija cementa
drugo izdanje, London, Thomas Telford, 1997, str. 1 – 28; P. K. Mehta i P. J. M. Monteiro,
Beton: Mikrostruktura, Svojstva i Materijali, New York, McGraw-Hill, 2006, str. 203 – 251
(engleski izvornik); C. D. Lawrence, Sastav i specifikacije portlandskog cementa, u: P. C.
Hewlett (ur.) Lea – Kemija Cementa i Betona četvrto izdanje, Oxford, Elsevier, 2005, str. 131
– 193 (engleski izvornik)].
Složena mineralogija portlandskog cementa posljedica je termodinamičkih odnosa između
različitih spojeva tijekom proizvodnje portlandskog cementnog klinkera. Četiri glavne faze
prisutne u portlandskom cementu su: alit, belit, aluminat i ferit. Skraćenice koje se koriste za

§ Prošireni sažetak xx
jednostavnije zapisivanje faza navedene su u tablici I.II. [H. F. W. Taylor, Kemija cementa
drugo izdanje, London, Thomas Telford, 1997, str. 1 - 28].
Tablica I.II. Skraćenice portlandskih cementnih faza
Faza Skraćenica Ime
3CaO·SiO2 C3S Trikalcijev silikat, alit
2CaO·SiO2 C2S Dikalcijev silikat, belit
3CaO·Al2O3 C3A Trikalcijev aluminat, aluminat
4CaO·Al2O3·Fe2O3 C4AF Tetrakalcijev aluminoferit, ferit
CaSO4 x 2H2O C�̅H2 gips
Faze prisutne u portlandskom cementu modificirane su u sastavu i kristalnoj strukturi
zamjenom ionima koji su manje zastupljeni poput magnezija, natrija, kalija i sulfata.
Identificirano je sedam različitih polimorfa alita i pet različitih polimorfa belita [H. F. W.
Taylor, Kemija cementa drugo izdanje, London, Thomas Telford, 1997, str. 1 - 28].
Visokotemperturne modifikacije alita i belita mogu se izolirati na nižim temperaturama samo
ako su stabilizirane većom količinom supstituirajućih iona. U industrijski proizvedenim
portlandskim cementnim klinkerima prisutne su monoklinske modifikacije alita (M1 i M3) ili
njihova smjesa. Belit se u industrijski proizvedenim portlandskim cementnim klinkerima
najčešće nalazi u obliku β – polimorfa, a trikalcijev aluminat u kubičnom ili rompskom
kristalnom sustavu. Ferit tvori niz čvrstih otopina općeg sastava Ca2(AlxFe1-x)2O5 gdje je
0 < x < 0,7. Dio magnezija ugrađuje se u glavne faze (do 2 %), a dio kristalizira kao MgO,
periklas. Slobodni kalcijev oksid rjeđe je prisutan u suvremenim portlandskim cementima.
Obje faze imaju kubičnu strukturu. Alkalijski metali su prisutni u obliku dvostrukih sulfata ili
se ugrađuju u alit i belit u slučajevima kada nema dovoljno sulfata [H. F. W. Taylor, Kemija
cementa drugo izdanje, London, Thomas Telford, 1997, str. 1 - 28].

§ Prošireni sažetak xxi
Fazni sastav cementa moguće je izračunati iz kemijskog sastava cementa upotrebom
formula po Bogueu:
C3S = 4.0710C - 7.6024S - 6.7187A - 1.4297F
C4AF = 2.8675S - 0.7544C3S
C3A = 2.6504A – 1.6920F
C4AF = 3.0432F [ R. H. Bogue, Ind. Eng. Chem. 1 (1929) 192 – 197].
Bogueov izračun utemeljen je na pretpostavci da su četiri osnovne faze prisutne u klinkeru
kemijski čiste, odnosno da sadrže samo CaO, SiO2, Al2O3, Fe2O3 i SO3. Ovo je najveći izvor
nesigurnosti Bogueovog izračuna, jer su faze prisutne u portlandskom cementu čvrste otopine
čiji sastav odstupa od sastava čistih faza [G .L. Saoût, V. Kocaba i K. Scrivener Cem. Concr.
Res. 41 (2011) 133 – 148]. Postojanje i drugih manje zastupljenih individualnih faza također
utječe na točnost proračuna [G .L. Saoût, V. Kocaba i K. Scrivener Cem. Concr. Res. 41
(2011) 133 – 148].
Rendgenska difrakcija na prahu je jedina metoda kojom se može odrediti fazni sastav
klinkera, cementa i hidratizirane cementne paste [H. F. W. Taylor, Kemija cementa drugo
izdanje, London, Thomas Telford, 1997, str. 1 - 28]. Primjena rendgenske difrakcije na prahu
moguća je jer svaka faza prisutna u cementu ima svoj specifični difraktogram. U primjeni
rendgenske difrakcije na cementu postoje određeni izazovi koji proizlaze iz same metode i
prirode materijala. Difraktogrami portlandskog cementa vrlo su kompleksni zbog
mnogobrojnih preklapanja difrakcijskih maksimuma s difrakcijskim maksimumima alita kao
najzastupljenijom fazom u portlandskom cementu [C. D. Lawrence, Sastav i specifikacije
portlandskog cementa, u: P. C. Hewlett (ur.) Lea – Kemija Cementa i Betona četvrto izdanje,
Oxford,, Oxford, Elsevier, 2005, str. 131 – 193 (engleski izvornik)]. Promjene u sastavu i
strukturi svake od faza, značajno utječu na položaj i intenzitet pojedinih difrakcijskih
maksimuma u difraktogramu. Glavni izvori sustavnih i slučajnih pogrešaka su: pomicanje
uzorka, preferirana orijentacija i ograničena dubina interakcije rendgenskih zraka. Pomicanje
uzorka uzrokuje pomicanje difrakcijskih maksimuma u difraktogramu i ne utječe značajnije
na njihov intenzitet. Preferirana orijentacija utječe na intenzitet difrakcijskih maksimuma.
Ako je područje neke faze usporedivo s dubinom prodiranja moguće je da jedna ili više faza
dominiraju u uzorku [M. A. G. Aranda , A. G. De la Torre i L. León – Reina, Rew. Mineral.
Geochem. 74 (2012) 169 - 209]. Sva tri izvora greške mogu se značajno reducirati
smanjenjem veličine čestica u uzorku. Pogreške uzrokovane pomicanjem uzorka mogu se
§ Prošireni sažetak xxii
smanjiti i upotrebom internog standarda kao što su rutil, silicij, kalijev bromid, kalcijev
fluorid i korund [H. F. W. Taylor, Kemija cementa drugo izdanje, London, Thomas Telford,
1997, str. 1 - 28 (engleski izvornik); H. F. W. Taylor, Adv. Cem. Res. 2 (1989) 73 - 77].
Mljevenje je vrlo zahtjevno jer može rezultirati oštećenjem faza i smanjenjem kristaliničnosti
što može utjecati na proširenje difrakcijskih maksimuma.
Snimanje i karakterizacija rendgenograma portlandskog cementa zahtjeva puno vještine i
iskustva. Zbog toga se rendgenska difrakcija desetljećima primjenjivala za kvalitativnu, a ne
za kvantitativnu analizu. Danas se za kvantitativnu analizu najčešće primjenjuje Rietveldova
metoda koja je primjenjiva na klinkeru, cementu i hidratiziranoj cementnoj pasti [G .L. Saoût,
V. Kocaba i K. Scrivener Cem. Concr. Res. 41 (2011) 133 – 148; A. I. Boikova, Kemijski
sastav sirovina kao glavni čimbenik odgovoran za sastav, strukturu i svojstva klinkerskih faza,
Zbornik radova Osmog međunarodnog simpozija o kemiji cementa, knjiga I, Rio de Janeiro,
Brasil, 1986, str. 19 - 33 (engleski izvornik)]. Posebno razvijeni računalni programi
olakšavaju primjenu Rietveldove metode. Rezultati dobiveni Rietveldovom metodom
precizniji su, a moguće ju je primjeniti i u ispitivanjima trajnostnih svojstava [M. A. G.
Aranda , A. G. De la Torre i L. León – Reina, Rew. Mineral. Geochem. 74 (2012) 169 - 209].
Primjena rendgenske difrakcije na hidratiziranim cementnim pastama ograničena je
činjenicom da je glavni produkt hidratacije portlandskog cementa gotovo potpuno amorfan.
No može se primijeniti na druge kristalinične faze poput portlandita, etringita, nehidratiziranih
klinkerskih faza ili manje zastupljenih individualnih faza [I .G. Richardson, Cem. Concr. Res.
38 (2008) 137 - 158]. Rendgenska difrakcija in-situ uspješno je primijenjena tehnika koja
omogućava praćenje hidratacije u vremenu bez utjecaja na uzorak.
Svi elementi koji su u portlandskom cementu prisutni u koncentracijama manjim od
nekoliko postotaka smatraju se elementima u tragovima [M. Achternbosch, K. R. Bräutigam,
N. Hartliebe; C. Kupsch, U. Richers, P. Stemmermann, i M. Gleis., Teški metali u cementu i
betonu kao rezultat suspaljivanja otpada u cementnoj peći u odnosu na zakonske zahtjeve za
upotrebu otpada, FZK, Karlsruhe, 2003, str. 15 – 105 (engleski izvornik)]. Povećana upotreba
otpada kao sirovine ili goriva u proizvodnji cementa povećala je interes za elemente u
tragovima koji se ugrađuju u portlandski cement. Neki od njih su toksični ili kancerogeni
(arsen, kadmij, kobalt, krom, bakar, živa, nikal, olovo) ili predstavljaju značajan rizik u radu
(krom, kobalt, nikal) [S. Bodaghpour, N. B. Joo i S. Ahamdi, Int. J. Geol. 6 (2012) 62 - 67].
Prijelazni metali (kobalt, krom, bakar, mangan, nikal, vanadij, titan, cink) imaju utjecaj na

§ Prošireni sažetak xxiii
proces nastajanja klinkera i svojstva konačnog proizvoda [C. J. Engelsen, Utjecaj
mineralizatora na proizvodnju cementa, Concrete Innovation Centre, Trondheim, 2007, str. 4
- 15]. Elementi u tragovima mobiliziraju se u osnovnim fazama klinkera kada su prisutni u
niskim koncentracijama. Kada im se koncentracija poveća, nastaju nove faze. Mehanizam
ugradnje ovisi i o oksidacijskom stanju elementa koji je posljedica kemijskog sastava
materijala i proizvodnih uvjeta [D. Herfort, G. K. Moir, V. Johansen, F. Sorrentino i H. Bollio
- Arceo, Adv. Cem. Res. 22 (2010) 187 - 194].
Hidratacija portlandskog cementa
Hidratacija portlandskog cementa uključuje sve reakcije između cementa i vode.
Mješavina cementa i vode naziva se cementnom pastom, a uključuje i očvrsli materijal. Omjer
vode i cementa ili vodocementni faktor određuje mnoga svojstva portlandske cementne paste
[H.F.W. Taylor, Kemija cementa drugo izdanje, London, Thomas Telford, 1997, str.113 -
156]. Interpretacija složenih reakcija hidratacije portlandskog cementa moguća je jedino uz
poznavanje hidratacije pojedinačnih faza klinkera. Složena reakcija hidratacije alita može se
pojednostavljeno prikazati slijedećom jednadžbom:
2 C3S + 7 H C3S2H4 + 3 CH ∆ H = -1114 kJ mol-1.
Glavni produkti koji nastaju ovom egzotermnom reakcijom su kalcijev hidroksid (CH)
kojeg obično zovemo portlandit i kalcijev silikat hidrat obično označen kao C-S-H [A.
Đureković, Cement i cementni kompoziti i dodaci za beton, Školska knjiga, Zagreb, 1996,
str. 21 - 251]. Približno 70 % alita reagira unutar 28 dana, a gotovo sav za godinu dana [H. F.
W. Taylor, Kemija hidratacije cementa, Zbornik Osmog međunarodnog simpozija o kemiji
cementa, knjiga I, Rio de Janeiro, 1986, str. 82 - 110]. Kalcijev silikat hidrat je amorfan ili
slabo kristaliničan. Crtice u njegovom imenu označavaju da je odnos između pojedinih
komponenti (C/S i H/S) promjenjiv. Sastav ovisi o uvjetima nastajanja i mijenja se tijekom
hidratacije [H.F.W. Taylor, Kemija cementa drugo izdanje, London, Thomas Telford, 1997,
str.113 – 156; A. Đureković, Cement i cementni kompoziti i dodaci za beton, Školska knjiga,
Zagreb, 1996, str. 21 - 251]. Kalcijevi silikati hidrati mogu se naći u prirodi, sintetizirati u
laboratoriju ili nastati tijekom hidratacije portlandskog cementa [J .J. Chen, J. J. Thomas, H.
F. W. Taylor i H. M. Jennings, Cem. Concr. Res. 34 (2004) 1499 - 1519]. Struktura i velika
specifična površina C-S-H omogućava mu da zajedno s pornim otopinama stvara rigidan gel u
kojem se pore mijenjaju od makroskopskih do nanometarskih. Izraz C-S-H gel koristi se samo

§ Prošireni sažetak xxiv
kada je nastao hidratacijom portlandskog cementa. Primarno je odgovoran za razvoj
mehaničkih svojstava portlandske cementne paste. Rendgenski difraktogram C-S-H gela
pokazuje nepostojanje uređene strukture [H.F.W. Taylor, Kemija cementa drugo izdanje,
London, Thomas Telford, 1997, str. 113 – 156; A. Đureković, Cement i cementni kompoziti i
dodaci za beton, Školska knjiga, Zagreb, 1996, str. 21 - 251]. Usporedbom strukture
kristaliničnih hidrata 1,4-nm tobermorita i jenita prikupljeno je dosta podataka o nanostrukturi
C-S-H gela [J .J. Chen, J. J. Thomas, H. F. W. Taylor i H. M. Jennings, Cem. Concr. Res. 34
(2004) 1499 - 1519]. Difraktogram C-S-H gela ne daje nam jednoznačan dokaz koja od dvije
navedene strukture bolje odgovara strukturi C-S-H gela. Dokazi prikupljeni drugim metodama
podupiru pretpostavku da je struktura C-S-H gela u početku hidratacije smjesa obje strukture,
a s protekom vremena prevladava struktura jenita [H. F. W. Taylor, J. Am. Ceram. Soc. 69
(1986) 464 - 467]. Pretražnom elektronskom mikroskopijom potvrđeno je postojanje četiri
morfološka oblika C-S-H gela:
• Tip I: vlaknasti materijal duljine do 2 µm dominantan u ranoj fazi hidratacije;
• Tip II: saćasti ili mrežasti materijal tipčan za ranu hidrataciju;
• Tip III: masivna ili dobro zbijena sferična zrna veličine do 300 nm uočena u
starijim pastama;
• Tip IV: bezobličan i masivan produkt uočen u starijim pastama
[S. Diamond, Mikrostruktura cementne paste – pregled na nekoliko nivoa: u Hidraulične
cementne paste: struktura i svojstva, Zbornik radova konferencije održane na Sveučilištu u
Shefieldu, 8 – 9 travnja 1976., Slough: Cement and Concrete Association; 1976. str. 2 – 30].
Hidratacijom belita nastaju isti produkti kao i hidratacijom alita. Samo 30 % belita reagira
unutar 28 dana, a 90 % unutar godine. Reakcija hidratacije može se prikazati
pojednostavljenom jednadžbom:
2 C2S + 5 H C3S2H4 + CH ∆ H = -43kJ mol-1.74
Iz jednadžbe je vidljivo da nastaje značajnije manja količina CH i da je relativni udio C-
S-H gela veći. Nema razlike u rastu, morfologiji i sastavu C-S-H gela nastalog hidratacijom
alita i belita [H. E. Petch, Acta. Cryst. 14 (1961) 950 – 957; R. J. Bartlett i G. D. Purvis, Int. J.
Quantum Chem. 14 (1978) 561 – 581]. Kalcijev hidroksid ima slojevitu strukturu s
oktaedarski koordiniranim atomima kalcija i tetraedarski koordiniranim atomima kisika
[J.D. Bernal i H. D. Megaw, Proc. Roy. Soc. A151 (1935) 384 – 420; H. E. Petch, Acta. Cryst.
14 (1961) 950 – 957]. Čisti C3A reagira trenutno s vodom, pri čemu se oslobađa velika

§ Prošireni sažetak xxv
količina topline. Reakcijom nastaju kristalni produkti kao što su C3AH6, C4AH19 i C2AH8
[H.F.W. Taylor, Kemija cementa drugo izdanje, London, Thomas Telford, 1997, str.113-156;
A. Đureković, Cement i cementni kompoziti i dodaci za beton, Školska knjiga, Zagreb, 1996,
str. 21 - 251]. Kada C3A reagira s vodom u prisutnosti kalcijevog sulfata, nastaje etringit koji
u daljnjoj reakciji stvara aluminat ferat monosulfatne faze (AFm faze). Reakcije se mogu
prikazati slijedećim jednadžbama:
C3A + 3C�̅H2 + 26 H C6A�̅�H32
C3A + C6A�̅�H32 + 4 H 3 C4A�̅H12 [H.F.W. Taylor, Kemija cementa drugo
izdanje, London, Thomas Telford, 1997, str.113 – 156].
Etringit (C6A�̅�H32) je prvi kristalni hidrat koji nastaje u hidratiziranoj cementnoj pasti,
približno 30 minuta od početka reakcije. U periodu od 24 do 48 sati, etringit reagira dalje i
stvara AFm faze. Hidratacijom C4AF nastaju produkti koji su slični onima koji nastaju
hidratacijom C3A [H.F.W. Taylor, Kemija cementa drugo izdanje, London, Thomas Telford,
1997, str.113 – 156]. Etringit pripada aluminat ferat trisulfatnim fazama (AFt faze) opće
formule [Ca3(Al,Fe)(OH)6·12H2O]2·X3·xH2O gdje je x normalno ≤ 2 i gdje X predstavlja
jedan dvostruko nabijeni anion ili dva jednostruko nabijena aniona. Faza AFm u
portlandskom cementu je slabo kristalinična i pomiješana sa C-S-H gelom. Opća formula
AFm faze je CaAl(OH)6·X·nH2O gdje X predstavlja jedan jednostruko nabijeni ili polovicu
dvostruko nabijenog aniona. Hidratacija aluminatne i feritne faze vrlo je važna jer određuje
vezivanje cementa, reološka svojstva svježe portlandske cementne paste i rano očvršćivanje.
Hidratacija portlandskog cementa je vrlo slična hidrataciji čistog C3S. Osnovni produkti
C-S-H gel i CH koji nastaju hidratacijom kalcijevih silikata i AFt i AFm faze koje nastaju
hidratacijom aluminatne i feritne faze također su prisutni u hidratiziranoj portlandskoj
cementnoj pasti. Klinkerske faze troše se različitim brzinama, kalcijevi sulfati obično nisu
više prisutni nakon 24 sata. U difraktogramu praha difrakcijski maksimumi koji odgovaraju
etringitu obično se uočavaju nakon nekoliko sati i dostižu svoj maksimum nakon 1 dana.
Difrakcijski maksimumi koji odgovaraju AFm fazi pojavljuju se kasnije. Obično su vrlo
široki što sugerira da je AFm faza slabo kristalinična [H. F. W. Taylor, Kemija cementa drugo
izdanje, London, Thomas Telford, 1997, str. 187 - 225]. U cementnim pastama portlandskog
cementa s visokim omjerom �̅/A ili u pastama sulfatno otpornih cemenata etringit je
detektiran i nakon godine dana hidratacije. Karbonatizacija hidratizirane portlandske
§ Prošireni sažetak xxvi
cementne paste također izaziva nastajanje etringita u kasnijem periodu hidratacije [G.
Strohbauch i H.J. Kuzel, ZKG Int. 41 (1988) 358 - 360].
Mikrostruktura očvrsle portlandske cementne paste
Očvrsla portlandska cementna pasta ima svojstva rigidnog gela. To je čvrsta krutina visoke
poroznosti. Očvrslu portlandsku cementnu pastu izgrađuju hidratacijski produkti,
neizreagirana zrna cementa, kapilarne pore i vodena otopina zvana porna otopina [A.
Đureković, Cement i cementni kompoziti i dodaci za beton, Školska knjiga, Zagreb, 1996, str.
21 – 251; H. F. W. Taylor, Kemija cementa drugo izdanje, London, Thomas Telford, 1997,
str. 227- 259]. Vodu u očvrsloj portlandskoj cementnoj pasti dijelimo na isparivu i neisparivu.
Neispariva voda je ugrađena unutar hidratacijskih produkata i ponekad se koristi kao mjera za
stupanj hidratacije. Ispariva voda ispunjava kapilarne pore i gel-pore u hidratacijskim
produktima [T. C. Powers, Fizička svojstva cementne paste, Zbornik radova Četvrte
međunarodne konferencije o kemiji cementa, knjiga 2, Washington, USA, 1960,
str. 577 - 613. (engleski izvornik)]. Ukupna poroznost očvrsle cementne paste uključuje sve
tipove pora: otvorene (prohodne i vrećaste) i zatvorene [A. Đureković, Cement i cementni
kompoziti i dodaci za beton, Školska knjiga, Zagreb, 1996, str. 21 - 251]. Prema IUPAC-
ovom prijedlogu pore u očvrsloj cementnoj pasti dijele se na mikropore promjera manjeg od
2,6 nm, mezopore ili kapilarne pore promjera između 2,6 i 50 nm i makro pore promjena
većeg od 50 nm [IUPAC Priručnik o simbolima i terminologiji, Dodatak 2, Dio 1, Koloidna i
površinska kemija, Pure Appl.Chem, 31 (1972) 578 - 638 (engleski izvornik)].
Veza između nekih svojstava koja opisuju poroznost i mehaničkih svojstava cementa
opširno je proučavana. Powers je uspostavio vezu između tlačnih čvrstoća i odnosa između
volumena hidratacijskih produkata i kapilarne poroznosti. Razvijeni su mikrostrukturni
modeli koji povezuju mehanička svojstva i mikrostrukturu cementne paste. Vrlo malo
istraživanja usmjereno je prema objašnjenju kako priroda hidratacijskih produkata utječe na
mehanička svojstva cementne paste. Razlog su poteškoće u kvantifikaciji volumena kojeg
različite hidratizirane faze zauzimaju u hidratiziranoj cementnoj pasti i nedostatku modela
koji mogu povezati fazni sastav s mehaničkim svojstvima. Nedavno je utvrđeno da svi
hidratacijski produkti ne pridonose tlačnim čvrstoćama. C-S-H gel ima kritičnu ulogu u
odnosu na druge hidratacijske produkte. Ovo je objašnjeno činjenicom da je C-S-H gel
pomiješan s porama odnosno da su druge faze samo umetnute u matriks kojeg čine C-S-H i
§ Prošireni sažetak xxvii
pore. [H.F.W. Taylor, Kemija cementa drugo izdanje, London, Thomas Telford, 1997,
str.113 - 156].
Pretražna elektronska mikroskopija može dati vrlo važne informacije o mikrostrukturi
očvrsle cementne paste. Moguće je koristiti široki raspon povećanja od 20× do 10 000× što
omogućava promatranje morfologije hidratacijskih produkata. Pretražni elektronski
mikroskopi obično su opremljeni tako da mogu napraviti rendgensku mikroanalizu koja
omogućava identifikaciju različitih mikrostrukturnih sastavnica [S. Diamond, Cem. Concr.
Comp. 26 (2004) 919 – 933; K. L. Scrivener, Cem. Concr. Comp. 26 (2004) 935 – 945].
Nakon hidratacije, elementi u tragovima iz nehidratiziranog cementa prelaze u
hidratacijske produkte. Struktura i sastav hidratacijskih produkata potiče ugradnju elemenata
u tragovima različitim mehanizmima: kemisorpcijom, taloženjem, stvaranjem površinskih
produkata, inkluzijom i kemijskom ugradnjom [D. L. Coke i M. Y. A. Mollah, J. Hazard.
Mater. 24 (1990) 231 - 253]. Mnogi elementi u tragovima prisutni su u hidratiziranoj
portlandskoj cementnoj pasti u obliku individualnih faza: hidroksida, karbonata i miješanih
nitratnih soli [F. K. Cartledge, L. G. Butler, D. Chalasani, H. Eaton, F. P. Frey, E. Herrera, M.
T. Tittlebaum i S. Yang, Envirnon. Sci. Technol. 24 (1990) 867 - 873]. Manji dio elemenata u
tragovima otopljeno je u pornoj otopini prisutnoj u kapilarnim porama hidratizirane cementne
paste.
Porna otopina je osnovni, ali vrlo često zanemareni sastojak hidratizirane cementne paste.
Sastav porne otopine odražava kemijske procese i interakciju između čvrste i tekuće faze.
Kemijski sastav porne otopine može biti koristan za razumijevanje mehanizma i kinetike
hidratacije cementa kao i za termodinamičko modeliranje hidratacije [A. Vollpracht, B.
Lothenbach, R. Snellings i J. Haufe, Mater. Struct. 49 (2016) 3341 - 3367]. Porna otopina
odgovorna je za transport tvari unutar portlandske cementne paste i služi kao ulaz za tvari
izvana. Zbog toga se sastav porne otopine može koristiti za vrednovanje različitih
destruktivnih djelovanja povezanih s trajnošću [R. D. Hooton, M .D. A. Thomas i T.
Ramlochan, Adv. Cem. Res. 22 (2010) 203 - 210]. Porna otopina smatra se otopinom
alkalijskih hidroksida jer su najzastupljeniji ioni u pornoj otopini hidroksidni ioni, ioni kalija,
natrija, kalcija, ortosilikatni i aluminatni ion.
Koncentracija iona natrija i kalija u pornoj otopini raste s vremenom zbog procesa
hidratacije i oslobađanja elemenata ugrađenih u osnovne faze klinkera. Maksimalnu
koncentraciju dosežu oko 7 dana hidratacije. Nakon maksimuma, koncentracija oba elementa

§ Prošireni sažetak xxviii
malo opada dok ne dosegnu konstantnu vrijednost koju dugoročno zadržavaju. Koncentracija
alkalija u pornoj otopini ovisi o ukupnom sadržaju alkalija u cementu i vodocementnom
faktoru. Koncentracija hidroksidnih iona povezana je s koncentracijom alkalija. Obično se
izražava u obliku vrijednosti pH. Povećanjem koncentracije alkalijskih iona povećava se i
vrijednost pH. Koncentracija hidroksidnih iona ovisi o vodocementom faktoru. Koncentracija
iona kalcija i sulfatnih iona ovisi o produktu topljivosti faza prisutnih u određenom
hidratacijskom vremenu. Dugoročno, koncentraciju kalcijevih iona određuje topljivost
portlandita, pa zbog efekta zajedničkog iona ona ovisi o vrijednosti pH otopine. Etringit
ograničava topljivost iona sulfata koja značajnije ne ovisi o pH vrijednosti otopine
[A. Vollpracht, B. Lothenbach, R. Snellings i J. Haufe, Mater. Struct. 49 (2016) 3341 - 3367].
Ispitivanja sadržaja elemenata u tragovima u pornim otopinama slabo su dostupna.
Proizvodnja portlandskog cementa
Portlandski cement se proizvodi nizom međusobno povezanih operacija jednim od četiri
moguća procesa: mokri proces, polumokri proces, polusuhi proces i suhi proces.
Osnovna razlika među procesima je u načinu pripreme sirovine. U polusuhom i suhom
procesu, sirovine se suše i melju u praškasti materijal, nazvan sirovinsko brašno. U
polumokrom i mokrom procesu sirovina se pretvara u emulziju. Suhi proces je pogodniji jer
je energetski učinkovitiji zbog toga što ne zahtijeva energiju za isparavanje vode iz emulzije
tijekom proizvodnje [Institute for Prospective Technological Studies, Sustainable Production
and Consumption Unit, European IPPC Bureau, Najbolje primjenjive tehnike, Referentni
dokument za proizvodnju cementa, vapna i magnezija, 2013]. Jeftini materijali kao što su
vapnenac, lapor, dolomit, glina i pijesak obično se koriste za pripremu sirovine. Ponekad je
potrebno dodati boksit ili rudu željeza da bi se osigurale količine aluminija i željeza potrebne
za stvaranje kalcijevih aluminata ili alumoferita [H. F. W. Taylor, Kemija cementa drugo
izdanje, London, Thomas Telford, 1997, str. 1 – 28; G. J. Verbeck i R. H. Helmuth, Struktura
i fizička svojstva cementne paste, Zbornik radova s Petog međunarodnog simpozija o kemiji
cementa, knjiga I, Tokyo, Japan, 1968, str. 1 - 32]. Sirovinsko brašno (ili emulzija)
zagrijavaju se na 1450 °C u rotacijskoj peći pri čemu nastaju tamne kuglice portlandskog
cementnog klinkera. Potrebna toplinska energija osigurava se sagorijevanjem fosilnih goriva.
Alternativna goriva dobivena iz industrijskih izvora kao što su gume, otpadna ulja, plastika,
otapala i mnogi drugi materijali mogu se koristi kao zamjena za fosilna goriva. Proizvedeni

§ Prošireni sažetak xxix
klinker melje se uz dodatak nekoliko postotaka gipsa u portlandski cement. Cement se
distribuira kupcima u rasutom stanju ili u vrećama kamionskim prijevozom, vlakom ili
brodom.
Glavni izvori emisije CO2 u proizvodnji su dekarbonatizacija, sagorijevanje goriva i
indirektne emisije. Preko 50 % emisija CO2 u proizvodnji cementa otpada na
dekarbonatizaciju, jednostavnu reakciju transformacije vapnenca u vapno:
CaCO3 (s) CaO (s) + CO2 (g)
[https://cembureau.eu/media/1500/cembureau_2050roadmap_lowcarboneconomy_2013-09-
01.pdf (pristup 28. veljače 2019)].
Smanjenje emisije CO2 iz dekarbonatizacije najizazovniji je zadatak u proizvodnji
portlandskog cementa. Ako cjelokupan kalcij dolazi iz vapnenca, za proizvodnju 1 t
portlandskog cementnog klinkera potrebno je 1,26 t vapnenca pri čemu se oslobodi približno
526 t CO2 [L. Bacarelo, J. Kline, G. Walenta i E. Gartner, Mater. Struct. 47 (2014) 1055 –
1065]. Tradicionalni pristupi smanjenju dekarbonatizacijskog CO2 ograničeni su na povećanje
hidrauličke aktivnosti portlandskog cementa i proizvodnju miješanih cemenata [C. D.
Lawrence, Proizvodnja nisko – energetskih cemenata, u: P. C. Hewlett (ur.) Lea – Kemija
Cementa i Betona četvrto izdanje, Oxford, Elsevier, 2005, str. 421 - 470 (engleski izvornik)].
Dodavanje nekih elemenata poput fluorida (F-) u malim količinama sirovini za proizvodnju
klinkera može poboljšati hidrauličku aktivnosti cementa i omogućiti upotrebu manjih količina
portlandskog cementa u proizvodnji betona. U proizvodnji miješanog portlandskog cementa
dio klinkera zamjenjuje se materijalima koji imaju slična svojstva poput: prirodnih pucolana,
letećeg pepela, granulirane zgure visoke peći, silikatne prašine ili vapnenca. Upotreba
zamjenskih materijala je utemeljena na mnogobrojnim znanstvenim istraživanjima. CO2
otisak pojedinih klinkerskih faza opada u nizu C3S > C3A > C2S > C4AF [L. Bacarelo, J.
Kline, G. Walenta i E. Gartner, Mater. Struct. 47 (2014) 1055 – 1065]. Alternativna rješenja
uključuju proizvodnju klinkera upotrebom sustava utemeljenih na sulfoaluminatima,
sulfoferitima i flouroaluminatima.
Kalcijev sulfoaluminatni cement
Glavna karakteristika kalcijevog sulfoaluminatnog cementa (CSA cement) je visok sadržaj
tetrakalcijevog trialuminat sulfata (C4A3�̅) poznatog kao jelimit ili Kleinova sol. Ovaj tip
cementa potječe iz Kine gdje je razvijen početkom 1970-ih [L. Zhang, M. Su i Y. Wang, Adv.

§ Prošireni sažetak xxx
Cem. Res. 11 (1999) 15 – 21; T. Sui and Y. Yao, Suvremeni napredak u posebnim cementima
u Kini, Zbornik radova Jedanaestog međunarodnog kongresa o kemiji cementa, knjiga 4,
Durban, South Africa, 2003, str. 2028 - 2032 (engleski izvornik)]. Druge osnovne faze
prisutne u CSA cementu su C2S i C �H2 i neke manje zastupljene kao što su CA, C3A, C4AF,
majanit i gelenit [J. Péra i J. Ambroise, Cem. Concr. Res. 34 (2004) 671 - 676.; D. Gastaldi, F.
Canonico i E. Boccaleri, J. Mater. Sci. 44 (2009) 5788 - 5794., W. Lan and F.P. Glasser, Adv.
Cem. Res. 8 (1996) 127 - 134].
Nema europske norme za cemente koje sadrže jelimit, pa se CSA cementi mogu podijeliti
u tri različite grupe ovisno o ukupnom sadržaju jelimita:
• kalcijev sulfoaluminatni cement s visokim sadržajem jelimita;
• belitni kalcijev sulfoaluminatni cement;
• alitni kalcijev sulfoaluminatni cement
[M. A. G. Aranda i A .G. Dela Torre, Sulfoaluminatni cementi, u: F. Pacheo – Torgal, S. Jalali
i J. Labrinda (ur.) Eko -učinkovitost betona, Cambridge, Woodhead Publishing Limited, 2013,
str. 488 - 522].
Hidratacija CSA cementa je složena, no ključne su reakcije stvaranja i transformacije
etringita. Etringit nastaje brzom hidratacijom jelimita prema slijedećim jednadžbama:
C4A3�̅ + 2 C�̅H2 + 34 H C6A���H32 + 2AH3 (bez prisutnosti CH)
3C4A3�̅ + 2 C�̅H2 + 6 CH + 74 H 3 C6A���H32 (u prisutnosti CH).
Ako nema gipsa reakcije teku prema slijedećim jednadžbama:
C4A3�̅ + 18 H 3 C4A�̅H12 + 2AH3
C6A���H32 3 C4A�̅H12 + 2 C�̅H2 + 16H.
Reakcije hidratacije C2S, C4AF i drugih faza odgovaraju onima u portlandskom cementu.
Osnovne kristalne faze koje nastaju hidratacijom CSA cementa su etringit i monosulfat.
C-S-H koji nastaje hidratacijom C2S i aluminijev hidroksid (AH3) koji nastaje hidratacijom
jelimita su gelovi [J. Péra and J. Ambroise, Cem. Concr. Res. 34 (2004) 671 - 676]. CSA
cement ima manji negativan utjecaj na okoliš pa je zbog toga vrlo zanimljiv za proučavanje.
Jedna trećina CO2 ispuštenog za proizvodnju C3S ispušta se za proizvodnju C4A3�̅ (približno
220 kg t-1). Temperatura proizvodnje je približno 200 °C niža od temperature potrebne za
proizvodnju portlandskog cementnog klinkera. Različiti industrijski poluproizvodi ili otpadni
materijali poput granulirane zgure visoke peći, crvenog mulja ili fosfogipsa mogu se koristi
kao sirovine za proizvodnju kalcijevog sulfoaluminatnog cementa [Beretka, B. De Vito, L.

§ Prošireni sažetak xxxi
Santoro, N. Sherman i G. L. Valenti, Cem. Concr. Res. 23 (1993) 1205 – 1214; S. Sahu i J.
Majling, Cem. Concr. Res. 24 (1994) 1065 – 1072; J. Majling i J. Strigac, Adv. Cem. Res. 11
(1999) 27 – 34; P. Arjunan, M. Silsbee i D. M. Roy, Cem. Concr. Res. 29 (1999) 1305 -
1311]. Upotreba kalcijevog CSA cementa u Europi je vrlo ograničena zbog nedostataka
odgovarajućih normi.
Izluživanje
Hidratacijski produkti u portlandskoj cementnoj pasti su u dinamičkoj ravnoteži s pornom
otopinom čiji se sastav mijenja s hidratacijom [H .F. W. Taylor, Kemija cementa drugo
izdanje, London, Thomas Telford, 1997, str. 187 - 225]. Kad je portlandska cementna pasta
izložena djelovanju kemijski agresivnog okoliša kemijski sastav hidratacijskih produkata i
porne otopine se mijenja, što dovodi do urušavanja i ponovnog uspostavljanja ravnoteže,
nestajanja čvrstih produkata i stvaranja novih. Ovo može imati negativan utjecaj na
mehanička svojstava portlandske cementne paste, uzrokovati njenu degradaciju i konačno
smanjiti njen vijek uporabe i uzrokovati lošu trajnost. Deionizirana voda koja sadrži male
koncentracije otopljenih iona uzrokuje dekalcifikaciju [F. Adenot i M. Buil, Cem. Concr. Res.
22 (1992) 489 – 496; M. Mainguy, C. Tognazzi, J. M. Torrenti i F. Adenot, Cem. Concr. Res.
30 (2000) 83 - 90]. Proces se naziva izluživanje. Smanjenje koncentracije iona kalcija i
hidroksidnih iona u pornoj otopini izaziva hidrolizu i izluživanje hidratacijskih produkata koji
sadrže kalcij [T. H. Wee, J. Zhua, H. T. Chua i S. F. Wong, ACI. Mater. J. 98 (2001)184 –
193; S. Kamali, B. Gerrard i M. Moranville, Cem. Concr. Compos. 25 (2003) 451 - 458].
Osjetljivost prema deioniziranoj vodi opada u slijedu CH, AFm, AFt, C-S-H [M. Mainguy, C.
Tognazzi, J. M. Torrenti i F. Adenot, Cem. Concr. Res. 30 (2000) 83 - 90]. Otapanje
portlandita smanjuje pH vrijednost porne otopine i uzrokuje povećanje makro poroznosti
cementne paste. Otapanje C-S-H postepeno smanjuje C/S odnos i uzrokuje povećanje mikro
poroznosti. Izluživanje alkalijskih metala nema negativan utjecaj na mehanička svojstva
portlandske cementne paste. U izluženoj portlandskoj cementnoj pasti dolazi do sekundarnog
taloženja AFm, AFt i kalcita [F. Adenot i M. Buil, Cem. Concr. Res. 22 (1992) 489 – 496; T.
H. Wee, J. Zhua, H. T. Chua i S. F. Wong, ACI. Mater. J. 98 (2001) 184 – 193; S. Kamali, B.
Gerrard i M. Moranville, Cem. Concr. Compos. 25 (2003) 451 – 458; J. Jain i N. Neithalath,
Cem. Concr. Comps. 31 (2009) 176 – 185; F. P. Glasser, J. Marchand i E. Samson, Cem.
Concr. Res. 38 (2008) 226 – 246; R. D. Hooton, M. D. A. Thomas i T. Ramlochan, Adv. Cem.

§ Prošireni sažetak xxxii
Res. 22 (2010) 203 - 210]. Povećanje poroznosti i propusnosti i gubitak čvrstoće su ključne
posljedice procesa izluživanja [C. Carde, R. Franqois i J. M. Torrenti, Cem. Concr. Res. 26
(1996) 1257 – 1268; F. H. Heukamp, F. J. Ulm i J. T. Germaine, Cem. Concr. Res. 31 (2001)
767 – 774; G. J. Verbeck i R. H. Helmuth, Struktura i fizička svojstva cementne paste,
Zbornik radova s Petog međunarodnog simpozija o kemiji cementa, knjiga I, Tokyo, Japan,
1968, str. 1 - 32]. Izluživanje može utjecati na imobilizaciju elementa u tragovima, njihovu
koncentraciju u pornim otopinama i mogući rizik za okoliš. Izluživanje se javlja u
portlandskim cementnim pastama izloženim djelovanju pare, magle, kišnice ili podzemne
vode. Izraženo je u građevinama kao što su brane, spremišta vode, cjevovodi, a posebno u
skladištima nuklearnog otpada [R. D. Hooton, M. D. A. Thomas i T. Ramlochan, Adv. Cem.
Res. 22 (2010) 203 – 210; P. K. Mehta i P. J. M. Monteiro, Beton: Mikrostruktura, Svojstva i
Materijali, New York, McGraw-Hill, 2006, str. 203 - 251(engleski izvornik)].

§ Prošireni sažetak xxxiii
MATERIJALI I METODE
Ispitivanje je provedeno prema planu ispitivanja navedenim u tablici I.III.
Tablica I. III. Plan ispitivanja
Oznaka uzorka Razdoblje hidratacije
(izluživanja) Svojstva
CEM I nehidratizirani
kemijski i fazni sastav, sastav*
CEM III CSA cement
deionizirana voda -
električna vodljivost, pH, elementi u tragovima, kalcij i magnezij, tvrdoća, ukupno
otopljene krutine
CEM I – CP**
dani: 2, 7, 28, 56, 90, 180, 360
čvrstoća (na savijanje, na tlak), modul elastičnosti,
fazni sastav, kemijski sastav, dimenzionalna stabilnost,
gubitak mase
CEM III – CP
CSA cement – CP
CEM I – CP 28 dana (samo sadržaj
zračnih pora) 365 dana
kapilarno upijanje vode, plinopropusnost, SEM,
sadržaj zračnih pora CEM III – CP
CSA cement – CP
CEM I – CP sati: 1-48
dani: 7,14,28 in – situ fazni sastav CEM III – CP
CSA cement – CP CEM I – PS***
dani: 2, 7, 28, 56, 90, 180, 360
pH, kemijski sastav, elementi u tragovima
CEM III – PS CSA cement – PS
* samo za CEM I i CEM III ** CP – cementna pasta *** PS – porna otopina
§ Prošireni sažetak xxxiv
Ispitivanja su provedena normiranim metodama ili dobro poznatim nenormiranim metodama
koje se primjenjuju za karakterizaciju portlandskog cementa, morta ili betona uz neke manje
modifikacije koje su se odnosile na pripremu uzoraka ili vrijeme hidratacije. Metode su
primijenjene i na kalcijev sulfoaluminatni cement jer posebne normirane metode za ispitivanje
ovog tipa cementa nisu razvijene.
Istraživanje je provedeno na cementnim pastama pripremljenim iz portlandskog cementa
CEM I 42,5R (dalje: CEM I) proizvođača Cemex, Hrvatska, sulfatnootpornog metalurškog
cementa niske topline hidratacije CEM III/A 52,5 N SR LH (CEM III) proizvođača Schwenk
Zement KG Njemačka i kalcijevog sulfoaluminatnog cementa Alipre® (dalje: CSA cement)
proizvođača Italcementi, Italija. CEM I i CEM III odgovaraju normi HRN EN 197-1: 2012
Cement – 1 dio: Sastav, specifikacije i kriteriji sukladnosti cementa opće namjene.
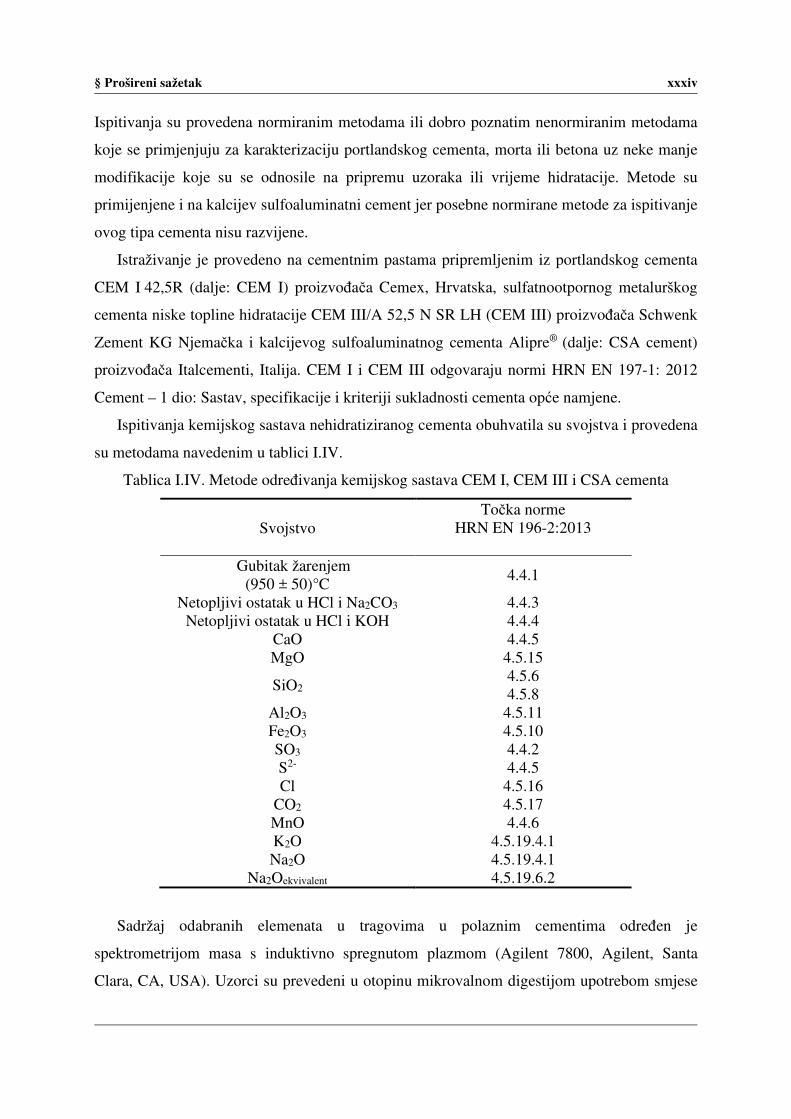
Ispitivanja kemijskog sastava nehidratiziranog cementa obuhvatila su svojstva i provedena
su metodama navedenim u tablici I.IV.
Tablica I.IV. Metode određivanja kemijskog sastava CEM I, CEM III i CSA cementa
Svojstvo Točka norme
HRN EN 196-2:2013
Gubitak žarenjem (950 ± 50)°C
4.4.1
Netopljivi ostatak u HCl i Na2CO3 4.4.3 Netopljivi ostatak u HCl i KOH 4.4.4
CaO 4.4.5 MgO 4.5.15
SiO2 4.5.6 4.5.8
Al2O3 4.5.11 Fe2O3 4.5.10 SO3 4.4.2 S2- 4.4.5 Cl 4.5.16
CO2 4.5.17 MnO 4.4.6 K2O 4.5.19.4.1 Na2O 4.5.19.4.1
Na2Oekvivalent 4.5.19.6.2
Sadržaj odabranih elemenata u tragovima u polaznim cementima određen je
spektrometrijom masa s induktivno spregnutom plazmom (Agilent 7800, Agilent, Santa
Clara, CA, USA). Uzorci su prevedeni u otopinu mikrovalnom digestijom upotrebom smjese
§ Prošireni sažetak xxxv
nitratne kiseline, klorovodične kiseline i tetraflouroboratne kiseline. Provedena je slijedeća
procedura digestije: 20 minuta zagrijavanja do 220 °C i 15 minuta na 220 °C uz snagu od
1800 W uređaja za mikrovalnu digestiju. Određen je sastav cementa CEM I i CEM III
normiranom metodom (HRI CEN/TR 196-4:2017 Metode ispitivanja cementa – 4 dio:
Kvantitativno određivanje sastojaka). Za CSA cement korišteni su podaci proizvođača o
sastavu jer nema metode za određivanje sastava CSA cementa. Fazni sastav cementa određen
je rendgenskom difrakcijom na prahu.
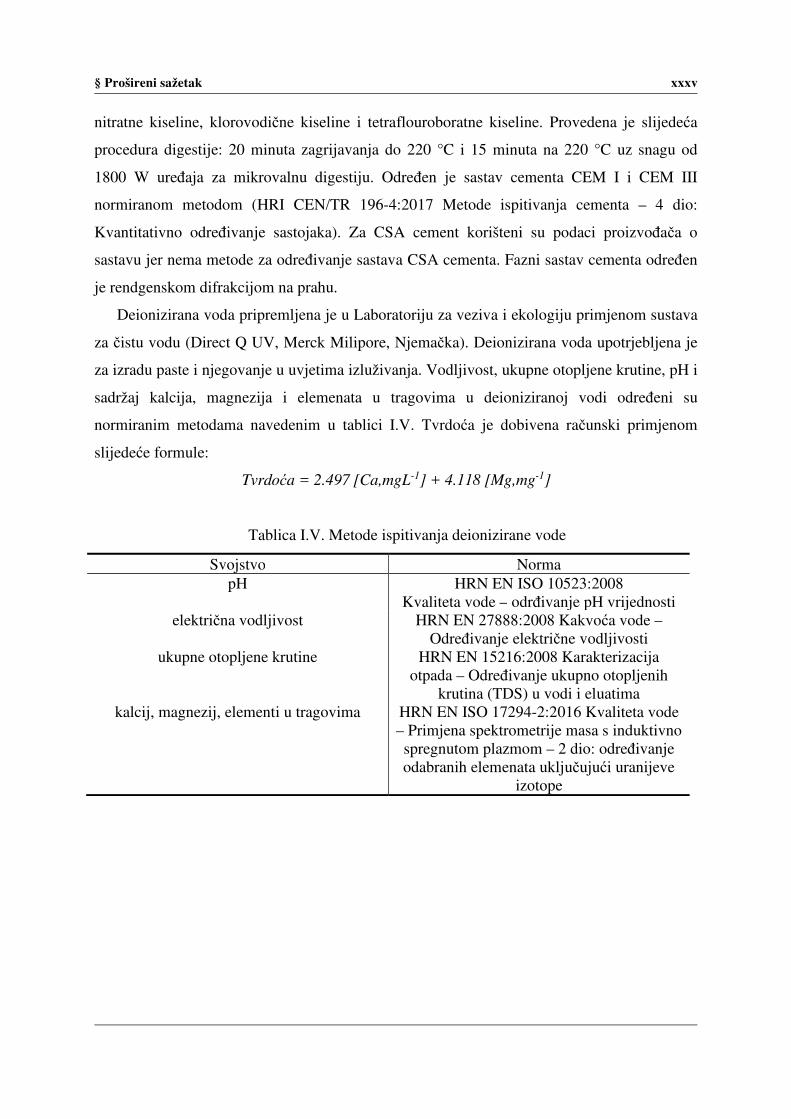
Deionizirana voda pripremljena je u Laboratoriju za veziva i ekologiju primjenom sustava
za čistu vodu (Direct Q UV, Merck Milipore, Njemačka). Deionizirana voda upotrjebljena je
za izradu paste i njegovanje u uvjetima izluživanja. Vodljivost, ukupne otopljene krutine, pH i
sadržaj kalcija, magnezija i elemenata u tragovima u deioniziranoj vodi određeni su
normiranim metodama navedenim u tablici I.V. Tvrdoća je dobivena računski primjenom
slijedeće formule:
Tvrdoća = 2.497 [Ca,mgL-1] + 4.118 [Mg,mg-1]
Tablica I.V. Metode ispitivanja deionizirane vode
Svojstvo Norma pH HRN EN ISO 10523:2008
Kvaliteta vode – odrđivanje pH vrijednosti električna vodljivost HRN EN 27888:2008 Kakvoća vode –
Određivanje električne vodljivosti ukupne otopljene krutine HRN EN 15216:2008 Karakterizacija
otpada – Određivanje ukupno otopljenih krutina (TDS) u vodi i eluatima
kalcij, magnezij, elementi u tragovima HRN EN ISO 17294-2:2016 Kvaliteta vode – Primjena spektrometrije masa s induktivno spregnutom plazmom – 2 dio: određivanje odabranih elemenata uključujući uranijeve
izotope
§ Prošireni sažetak xxxvi
Uzorci cementnih pasti pripremljeni su miješanjem cementa i vode u kontroliranim
uvjetima (temperatura (20 ± 2) °C, vlažnost veća od 50 %). U standardnoj miješalici za mort
pripremljene su cementne paste s vodocementnim faktorom 0,5 modificiranom standardnom
procedurom opisanom u normi HRN EN 196-1: 2016 Metode ispitivanja cementa – 1 dio:
Određivanje čvrstoće. Modifikacija se odnosila na količinu cementa (upotrjebljeno je 1000 g
cementa) i količinu vode koja je prilagođena vodocementnom faktoru 0,5. Nakon procedure
miješanja, pripremeljna cementna pasta ugrađena je u kalupe za izradu prizmatičnih ili
cilindričnih uzoraka ili u držače za in–situ rendgenska mjerenja. Standardni kalupi
upotrebljeni su za izradu prizmatičnih uzoraka dimenzija 40 × 40 × 160 mm. Cementne paste
ugrađene su u kalup bez dodatnog sabijanja i vibracije uz uklanjanje zračnih mjehurića samo
nježnim udarcima. Ista vrsta kalupa s ugrađenim graničnicima iskorištena je za pripremu
uzoraka za određivanje volumne stabilnosti. Ispunjeni kalupi njegovani su u komori na
temperaturi (20,0 ± 1,0) °C i relativnoj vlažnosti većoj od 90 % tijekom 24 sata. Nakon
raskalupljivanja, prizmatični uzorci su smješteni u spremnike s deioniziranom vodom na
način da je omjer površine uzorka i volumena bio 1:10. Voda u kojoj su se prizme njegovale
mijenjana je tri puta tjedno (ponedjeljkom, utorkom, petkom) kako bi se osiguralo stalno
agresivno djelovanje deionizirane vode na cementnu pastu. Prizmatični uzorci korišteni su za
ispitivanja čvrstoće (na savijanje i na tlak), modula elastičnosti, dimenzionalne i masene
stabilnosti, kemijskog i faznog sastava. Cilindrični kalupi upotrjebljeni su za pripremu
cilindričnih uzoraka dimenzija 100 × 200 mm. Paste su pripremljene i njegovane na istovjetan
način kao i paste za prizmatične uzorke. Cilindrični uzorci korišteni su za pripremu
poduzoraka za ispitivanja pretražnim elektronskim mikroskopom, ispitivanja sadržaj zračnih
pora, kapilarnog upijanja i plinopropusnosti. Porne otopine su pripremljene istiskivanjem pod
tlakom.
Čvrstoća (na savijanje i tlak), modul elastičnosti, dimenzionalna stabilnost, sadržaj zračnih
pora, kapilarno upijanje i plinopropusnost cementne paste određeni su normiranim metodama
navedenim u tablici I.VI.

§ Prošireni sažetak xxxvii
Tablica I.VI. Ispitivanja fizičkih i mehaničkih svojstava cementne paste
Svojstvo Norma
čvrstoća (na savijanje, na tlak) HRN EN 196-1: 2016 Metode ispitivanja
cementa – 1 dio: Određivanje čvrstoće
modul elastičnosti HRN EN 12390-13: 2013 Ispitivanje
očvrslog betona – 13 dio: Određivanje sekantnog modula elastičnosti pri tlaku
dimenzionalna stabilnost
HRN EN 12617-4: 2003 Proizvodi i sustavi za zaštitu i popravak betonskih konstrukcija
– Ispitne metode- 4 dio: Određivanje skupljanja i bubrenja
sadržaj zračnih pora Dodaci betonu i mortu za injektiranje – Ispitne metode – 11 dio: Određivanje
značajka zračnih pora u očvrslom betonu
kapilarno upijanje
HRN EN 15418: 2004 Značajke građevnih materijala i proizvoda s obzirom na toplinu i
vlagu – Određivanje koeficijenta vodoupojnosti pri djelomičnom uranjanju
plinopropusnost HRN EN 993-4: Metode ispitivanja ne
prozirnih vatrostalnih proizvoda – 4 dio: Određivanje propusnosti na plinove
Podaci o mikrostrukturi prikupljeni su i pretražnom elektronskom mikroskopijom. Promjena
mase određena je vaganjem pod vodom. Kemijski sastav cementnih pasti i pornih otopina
određen je normiranim metodama navedenim u tablici I.IV. pH pornih otopina izmjeren je
normiranom metodom navedenom u tablici I.V. Za praćenje promjena u faznom sastavu
cementnih pasti primijenjena je metoda rendgenske difrakcije na prahu i rendgenska in-situ
difrakcija.

§ Prošireni sažetak xxxviii
REZULTATI I RASPRAVA
Sadržaj glavnih i sporednih oksida u portlandskim cementima CEM I i CEM III je različit.
Gubitak žarenjem ovisi o sadržaju materijala koji nisu prošli obradu na visokim
tempearturama prije dodavanja cementu. To su najčešće prirodni gips ili vapnenac. Veći
maseni udio gubitka žarenjem u cementu CEM I u odnosu na CEM III ukazuje na veći maseni
udio prirodnog kalcijevog sulfata (gipsa) ili prisutnost vapnenca. Veći maseni udio sulfata i
CO2 u CEM I također odgovara tom rezultatu. Osnovni minerali klinkera: alit, belit, aluminati
i ferit potvrđeni su redngenskom difrakcijcom na prahu u cementu CEM I i CEM III.
Prisutnost vapnenca nije potvrđena. U difraktogramu praha CEM I uočen je difrakcijski
maksimu kod 51,7° s dodatkom (ramenom) na 51,9° koji je karakterističan za monoklinski M1
polimer. Struktura ovog polimera nije poznata, pa je za Rietveldovu analizu upotrebljen
difraktogram strukturno vrlo sličnog M3 polimera. Kvantitativnom rendgenskom difrakcijom
utvrđeno je da su alit i belit dominantne faze u cementu CEM I.
Veći maseni udio netopljivog ostataka u CEM III odgovara većem masenom udjelu
ukupnog silicija i upućuje na prisutnost staklastog materijala koja je potvrđena
difratkogramom praha. Danas se smatra da suvremeni klinkeri sadrže stalastu fazu samo u
rijetkim slučajevima. Granulirana zgura visoke peći sadrži između 50 % do 90 % masenog
udjela staklaste faze. Kristalne faze prisutne u cementu CEM I potvrđene su i u cementu
CEM III. Visok šum odgovara amorfnoj fazi koja je rezultat dodavanja granulirane zgure
visoke peći.
Kemijski sastav CSA cementa znatno se razlikuje u usporedbi s CEM I i CEM III. Niži
maseni udio CaO i SiO2 i viši maseni udio Al2O3 upućuje na to da su primarni spojevi koji
izgrađuju ovaj cement kalcijevi aluminosulfati za razliku od kalcijevih silikata koji su osnovni
spojevi u CEM I i CEM III. Viši maseni udio sulfata i manji maseni udio gubitak žarenjem
također podupiru ovaj rezultat koji je potvrđen i faznom analizom. Jelimit, glavna faza u CSA
cementu uz belit i druge manje zastupljene faze potvrđena je rendgenskom difrakcijom na
prahu. Kvantitativni fazni sastav cemenata određen Rietveldovom analizom dan je u tablici
I.VII. Faze s manjim masenim udjelom (<1,8 %) nisu navedene.

§ Prošireni sažetak xxxix
Tablica I.VII. Fazni sastav CEM I, CEM III i CSA cement
Mineral w / %
CEM I CEM III CSA cement
C3S 71.8 41.0 0
C2S 12.8 3.7 13.5
C3A 3.2 3.2 3.4
C4AF 3.7 8.1 0
C4A3Ŝ 0 0 70.7
C2AS 0 0 2.5
C12A7 0 0 2.6
anhidrit 0.5 0 1.8
kalcit 4.8 2.2 0
periklas 0 0 2.4
Staklaste faze 0 38.0 0
Rezultati kemijske analize pokazuju da je razlika glavnih i sporednih oksida u cementu
CEM I i CEM III posljedica dodatka granulirane zgure visoke peći. Zamjena 64 % klinkera
granuliranom zgurom visoke peći utvrđena je analizom sastava u cementu CEM III. Prisutnost
vapnenca u cementu CEM III nije potvrđena.
Koncentracija elemenata u tragovima, osim žive i olova, niža je u cementu CEM I u
usporedbi s cementnom CEM III. Ovi podaci odgovaraju rezultatima drugih autora dobivenih
za iste tipove cementa [M. Achternbosch, K. R. Bräutigam, N. Hartliebe; C. Kupsch, U.
Richers, P. Stemmermann, i M. Gleis, Teški metali u cementu i betonu kao rezultat
suspaljivanja otpada u cementnoj peći u odnosu na na zakonske zahtjeve za upotrebu otpada,
FZK, Karlsruhe, 2003, str. 15 – 105. (engleski izvornik)]. Zamjena klinkera granuliranom
zgurom visoke peći povećava sadržaj elementa u tragovima u CEM III. Elementi u tragovima
mogu se podijeliti u dvije grupe: elementi s koncentracijom iznad 5 mg kg-1 (Co, Cr, Cu, Ni,
Sb, Zn and V) i elementi koncentracije ispod 5 mg kg-1 (As, Cd, Hg and Pb). Niža
koncentracija nekih elemenata povezana je s njihovom hlapljivošću. Arsen, kadmij, živa i
olovo smatraju se lako hlapljivim elementima koji se zadržavaju u sustavu rotacijske peći za
proizvodnju klinkera. Oni se teško stabiliziraju u portlandskom cementnom klinkeru, dok se

§ Prošireni sažetak xl
drugi elementi koji su uključeni u ovo istraživanje smatraju manje hlapljivim, dobro se
ugrađuju u faze klinkera i zbog toga su zastupljeniji u cementu [M. Achternbosch, K. R.
Bräutigam, N. Hartliebe; C. Kupsch, U. Richers, P. Stemmermann, i M. Gleis., Teški metali u
cementu i betonu kao rezultat suspaljivanja otpada u cementnoj peći u odnosu na na zakonske
zahtjeve za upotrebu otpada, FZK, Karlsruhe, 2003, str. 15 – 105 (engleski izvornik)].
Znatno viša koncentracija hlapljivog arsena i posebno olova prisutna je u CSA cementu u
odnosu na CEM I i CEM III. Niža temperatura nastajanja kalcijevog sulfoaluminatnog
klinkera i veće količine industrijskog otpada koje se mogu koristiti kao sirovina u proizvodnji
pogoduju ugradnji veće količine ovih elemenata tijekom proizvodnje u CSA klinker. Niže
vrijednosti koncenctracije antimona, kadmija i žive u CSA vjerojatno su posljedica manjih
vrijednosti u sirovinama i gorivima. Zastupljenost drugih elemenata u tragovima u CSA
cementu nalazi se unutar vrijednosti zabilježenih za CEM I i CEM III.
Čisti sastojci cementa, klinker, gips i zgura kao ni sirovinski materijali upotrjebljeni u
proizvodnji klinkera i cementa nisu bili dostupni za ovo istraživanje. Zbog toga, dublja
analiza izvora pojedinih elemenata u tragovima u cementu nije moguća. Istraživanja sadržaja
elemenata u tragovima u CSA cementu su slabo dostupna u literaturi.
Električna vodljivost, vrijednosti pH, tvrdoća i sadržaj TDS u deioniziranoj vodi
upotrjebljenoj za pripremu i njegovanje uzoraka cementne paste zadovoljavaju zahtjeve za
vrlo meku vodu. Izlužujuća svojstva deionizirane vode dodatno su potvrđena malim
sadržajem odabranih elementa u tragovima, kalcija i magnezija.
Difraktogrami su izvor vrijednih informacija, usproks ograničenjima u primjeni
rendgenske difrakcije na hidratiziranim cementnim pastama. Difraktogrami CEM I paste
pokazuju da se alit potroši tijekom 365 dana hidratacije. Kristalinične faze koje možemo
pratiti tijekom hidratacije i izluživanja mogu nam dati dragocijene informacije. Nakon 1, 5
dana hidratacije u difraktogramu je vidljiv portlandit čija količina, kao i količina etringita
raste do 7 dana hidratacije. Nije vidljiv značajniji prirast portlandita i etringita do 28 dana
hidratacije. Smanjenje etringita javlja se u periodu od 56 do 365 dana hidratacije. Rezultati
odgovaraju smanjenju čvrstoće zabilježenom za 365 dana hidratacije. Vrlo mali difrakcijski
maksimum pri 9,9° 2θ odgovara monosulfatu. Stvaranje kalicta uslijed karbonatizacije
vidljivo je za period 365 dana hidratacije.
Visok šum prisutan je u difraktogramima na početku hidratacije cementa CEM III što je
posljedica dodatka granulirane zgure visoke peći. Kristalini portlandit nastaje nakon 1, 5 dana

§ Prošireni sažetak xli
zajedno s etringitom. Smanjenje etringita prisutno u CEM I pasti uočeno i u CEM III pasti u
istom hidratacijskom vremenu, odgovara ponašanju čvrstoće. Kalcit raste s hidratacijom, a alit
je gotovo potpuno potrošen unutar 365 dana.
Uzorak CSA cementa reagira s vodom puno brže jer etringit nastaje već nakon 12 sati, a
dominantna faza jelimit je u potpunosti potrošen tijekom 7 dana hidratacije. Etringit i
stratlingit su glavne kristalinične faze nastale hidratacijom CSA cement. Nastajanje kalcita
raste hidratacijom.
Difraktogrami za XRPD in-situ mjerenja pokazuju da je karbonatizacija dominantan
proces na površini uzoraka jer difraktogram kalcita dominira difraktogramima svih cementnih
pasta. Ovaj rezultat ukazuje da XRPD in-situ mjeranja nisu prikladna za ispitivanje
izluživanja zbog stvaranja kalicta na površini uzoraka.
Konačne čvrstoće na savijanje i tlak za CEM I, CEM III i CSA cementnu pastu smanjuju
se uslijed izluživanja. U periodu od 28 dana nije zabilježeno smanjenje čvrstoća što ukazuje
na to da izluživanje u tom periodu ne utječe na hidrataciju sva tri tipa cementa. Prvo
smanjenje čvrstoće na savijanje i tlak uočeno je za CSA cementnu pastu nakon 56 dana
hidratacije. Smanjenje čvrstoće nastavlja se u periodu do 365 dana s konačnim smanjenjem
čvrstoće na savijanje za 70 % i čvrstoće na tlak za 13 %.
Smanjenje čvrstoće na savijanje cementne paste CEM III za 53 % uočeno je nakon 180
dana. Čvrstoća na tlak za CEM III smanjuje se za 61 %, a za CEM I za 13 % nakon 365 dana
izluživanja. CEM I pasta izgubi 53 % čvrstoće na savijanje. Smanjenje čvrstoće na savijanje i
tlak posljedica je dugotrajnog izluživanja. Rezultati upućuju na to da osjetljivost prema
izluživanju opada u slijedu CSA > CEM III > CEM I.
Gubitak čvrstoće kao posljedica izluživanja ili nekog drugog degradacijskog procesa
obično je popraćena smanjenjem modula elastičnosti. U periodu do 365 dana nije uočen pad
modula elastičnosti za CEM I, CEM III i CSA cementnu pastu. U suprotnosti, zabilježen je
porast modula elastičnosti za sva tri tipa cementne paste. Modul elastičnosti je usko povezan s
poroznošću cementne paste. Porastom poroznosti modul elastičnosti opada. Rezultati upućuju
da izluživanjem nije povećana poroznost CEM I, CEM III i CSA i da je smanjenje čvrstoće
posljedica promjene kemijskog sastava hidratacijskih produkata. Bubrenje i skupljanje
portlandskih cemenata kao i CSA cementa je uobičajeno. Nema značajnije promjene mase u
periodu od 365 dana. Dimenzionalna i masena stabilnost, potvrđuje izostanak nastajanja
ekspanzivnih produkata pod utjecajem dugotrajnog izluživanja.

§ Prošireni sažetak xlii
Pretražnom elektronskom mikroskopijom, u mikrostrukturi CEM I cementne paste
uočavaju se područja pločastog CH i grudastog C-S-H gela s igličastim etringitom. U
CEM III cementnoj pasti, portlandit je izmiješan s C-S-H gelom i nije vidljiv pločasti CH.
Najveća količina etringita uočena je u CSA cementnoj pasti. Nekoliko manjih pora vidljivo je
u CEM I, CEM III i CSA cementnoj pasti. Mikrostruktura i morfologija hidratacijskih
produkata ne pokazuju posljedice propadanja uslijed izluživanja. Mikrostruktura odgovara
prije uočenom porastu modula elastičnosti za sva tri tipa cementa.
Sadržaj zračnih pora u CEM I, CEM III i CSA cementu pokazuje promjene u periodu 365
dana hidratacije. Najmanje povećanje sadržaja pora od 7 % opaženo je za CEM I cementnu
pastu, a najviše od 60 % za CEM III cementnu pastu. CSA cementna pasta bilježi povećanje
sadržaja zračnih pora za 33%. Rezultati se u potpunosti slažu s rezultatima smanjenja tlačne
čvrstoće. Mikroskopsko određivanje sadržaja zračnih pora uključuje određivanje pora
promjera između 0 i 4000 µm.
Poroznost cementnih materijala dobro se može procijenit određivanje apsorpcije vode
uslijed kapilarnog upijanja. Materijali s većom apsorpcijom vode uslijed kapilarnog upijanja
su porozniji. Osjetljivost prema izluživanju raste s povećanjem poroznosti. Rezultati
istraživanja pokazuju da poroznost, a time i osjetljivost prema izluživanju opada u nizu
CSA > CEM I > CEM III.
Nije bilo moguće odrediti plinopropusnost za CEM I, CEM III i CSA cementnu pastu
zbog raspad uzorka. Vjerojatan uzrok raspada uzoraka je sušenje koje je neophodno provesti
prije mjerenja, iako je primijenjen modificirani postupak sušenja na nižoj temperaturi. Sušenje
uzrokuje razgradnju hidratacijskih produkata i raspad uzoraka.
Cementne paste CEM I, CEM III i CSA pokazuju smanjenje sadržaja kalcija, natrija i
kalija s vremenom. Rezultati odgovaraju izluživanju i u skladu su s rezultatima prethodnih
istraživanja. Cementna pasta CSA ima najveći gubitak kalcija. Najmanji gubitak zabilježen je
za CEM III cementu pastu što odgovara manjoj količini CH i C-S-H u pasti tog tipa nakon 2
dana hidratacije. Ovo je posljedica manjeg sadržaj C3S u usporedbi s cementom CEM I. Natrij
i kalij također izlužuju iz cementne paste. Sadržaj alkalijskih elemenata u cementnoj pasti i
pornoj otopini nije povezan s ukupnim sadržajem u nehidratiziranom cementu. Nehidratizirani
CEM I i CEM III pasta u hidratacijskom periodu od 2 dana sadrže najviše koncentracije
kalija. Rezultati upućuju da je kalij u cementu CEM III uglavnom ugrađen unutar klinkerskih
faza, a u cementu CEM I kao i u CSA cementu većinom je dostupan u obliku lako topljivih

§ Prošireni sažetak xliii
sulfatnih soli. Natrij je u cementu CEM I i CEM III glavninom ugrađen unutar faza klinkera, a
u CSA cementu prisutan u obliku lako topljivih soli sulfata. Izluživanje natrija je izraženije u
CSA pasti, a zatim u CEM III i CEM I što upućuje da otpornost prema izluživanju raste u
ovom nizu. Koncentracija aluminija i željeza se ne mijenja s vremenom, dok koncentracija
silicija i magnezija malo raste. Navedeni rezultati upućuju na to da izluživanje ne utječe na
hidratizirane faze koje sadrže aluminij i željezo.
Alkalitet CSA porne otopine znatno je niži u odnosu na cement CEM I i CEM III.
Opadanje pH vrijednosti s vremenom uočeno je u svim pornim otopinama i u skladu je s
opadanjem koncentracije alkalija i kalcija. Rezultati ispitivanja kemijskog sastava cementne
paste i pornih otopina ukazuju da je otpornost CEM I i CEM III cementne paste znatno bolja
u odnosu na CSA cementu pastu u danim eksperimentalnim uvjetima.
Koncentracija topljivih elemenata u tragovima u pornim otopinama podupire njihovu
slabu topljivost i dobru imobilizaciju u visoko alkalnim cementnim pastama. Koncentracija
bakra, kroma i vanadija je najviša u CSA pornim otopinama što je u skladu s visokom
zastupljenošću ovih elemenata u nehidratiziranom cementu. Ekstremno niske koncentracije
arsena, kadmija, žive i olova odgovaraju njihovoj niskoj zastupljenosti u nehidratiziranom
cementu CEM I i CEM III. Niska zastupljenost kadmija u nehidratiziranom cementu također
rezultira niskom i konstantnom koncentracijom ovog elementa u CSA pornim otopinama.
Ekstremno niska koncentracija olova u pornim otopinama nije u skladu s njegovom viskom
zastupljenošću u CSA cementu. Ovaj rezultat upućuje na dobru imobilizaciju olova u CSA
cementnoj pasti. Ponašanje ostalih elemenata u tragovima (Co, Cr, Cu, Hg, Ni, Sb i V) osim
cinka u CSA pasti je istovjetno. Vrlo visoke koncentracije nakon 2 dana hidratacije (posebno
za Cr i V) značajno opadaju s vremenom. Samo koncentracija cinka pokazuje vrlo mali rast.
Mobilnost odabranih elemenata u tragovima u CSA cementu ne raste sa smanjenjem pH
vrijednosti. Izluživanje ne utječe na imobilizaciju elementa u pornim otopinama. Visok
sadržaj AFm i AFt faze vjerojatno je odgovaran za dobru imobilizaciju elemenata u tragovima
u CSA cementnoj pasti.
Elementi u tragovima prisutni u cementu CEM I i CEM III nemaju istovjetno ponašanje
kao kod CSA cementa. Živa se u CEM I i CEM III pastama ponaša slično kadmiju i olovu ali
ima najveću topljivost među svim elementima u tragovima uključenima u ovo istraživanje.
Više koncentracije žive ugrađene u klinkerske faze portlandskog cementa mogu predstavljati
potencijalni rizik za okoliš. Mali rast u koncentraciji arsena odgovara smanjenju sadržaja CH

§ Prošireni sažetak xliv
u CEM I i CEM III cementnoj pasti. Veći sadržaj arsena u portlandskoj cementnoj pasti može
predstavljati potencijalni rizik za okoliš. Niže koncentracije antimona na početku hidratacije
rastu s vremenom u CEM i CEM III pornoj otopini. Imobilizacija antimona ovisi o vrijednosti
pH i koncentraciji kalcija. Povećanje topljivosti antimona podupire izluživanje kalcija iz
CEM I i CEM III cementne paste. Antimon ugrađen u klinkerske faze može potencijalno
predstavljati rizik za okoliš. Rast koncentracije bakra u CEM I i CEM III pornim otopinama
nakon 7 dana hidratacije upućuje na degradaciju C-S-H gela i potencijalni rizik za okoliš.
Visoke koncentracije cinka u CEM I i CEM III pornim otopinama smanjuju se s protekom
vremena. Mobilnost cinka povećava se u otopinama s pH vrijednošću ispod 7. Ponašanje
cinka u CEM I i CEM III pornim otopinama ne upućuje na štetne reakcije. Opadanje
koncentracije nikla u skladu je sa smanjenjem pH vrijednosti. Promjena koncentracije nikla
upućuje na degradaciju cementne paste CEM I i CEM III uslijed izluživanja. Koncentracija
kroma i vanadija pokazuje nejasan trend rasta. Koncentracija kobalta u CEM I i CEM III
pornim otopinama pokazuje velike varijacije i razlike u ponašanju između CEM I i CEM III
pastama. Ovo upućuje na različite načine imobilizacije kroma, vanadija i kobalta unutar
hidratiziranog i nehidratiziranog CEM I i CEM III. Nije moguće povezati koncentracije ovih
elemenata s degradacijom cementne paste uslijed izluživanja. Ponašanje ovih elementa treba
pažljivo uzeti u obzir prilikom procjene rizika za okoliš zbog izraženih varijacija u
koncentraciji.

§ Prošireni sažetak xlv
ZAKLJUČAK
Nastajanje kristaliničnih hidratacijskih produkata, portlandita i etringita i njhova zastupljenost
nakon 28 dana hidratacije ukazuju da portlandske cementne paste nisu pogođene
izluživanjem. Smanjenje etringita u periodu od 56 do 365 dana hidratacije odgovara
smanjenju čvrstoće portlandskih cementnih pasta u ovom periodu. Sastav hidratizirane
portlandske cementne paste ne podržava otapanje hidratacijskih produkata koji sadže aluminij
(npr. etringit). Rezultati upućuju da je mogući uzrok smanjenja etringta jendostavna
transformacija etringita u monosulfat. Zastupljenost kristaliničnih faza nastalih hidratacijom
kalcijevog sulfoaluminatnog cementa, ne upućuje na izluživanje u 365 dana hidratacije ovog
tipa cementne paste. Izluživanje kalcija i alkalijskih metala iz svih cementnih pasti i pornih
otopina, praćeno smanjenjem bazičnosti, upućuje na promjene u sastavu C-S-H ili količni CH.
Portlandit nije potvrđen u CSA cementnoj pasti. Karbonatizacija se pojavljuje u svim
uzorcima cementnih pasta s protekom vremena. Ona je značajna samo za rendgensku
difrakciju in-situ, jer se javlja na površini uzoraka. Karbonatizacija ne utječe na stvaranje
dodatnog etringita u kasnijem dobu hidratacije.
Mikrostuktura i morfologija hidratacijskih produkata nakon 365 dana hidratacije ne
upućuje na razaranje uzoraka uslijed izluživanja. Povećanje zatvorenog volumena pora u
periodu od 56 do 365 dana hidratacije upućuje na promjene u sustavu pora i odgovara
smanjenju čvrstoće.
Manja kapilarna poroznost portlanskih cementnih pasta u usporedbi s kalcijevom
sulfoaluminatnom cementnom pastom nakon 365 dana hidratacije smanjuje osjetljivost
portlandskih cementnih pasta prema izluživanju. Povećanje modula elastičnosti u
hidratacijskom periodu ukazuje da nema zančajnijeg porasta ukupne poroznosti s protekom
vremena. Difraktogrami cementnih pasta pokazuju da nema nastajanja ekspanzivnih spojeva
uslijed izluživanja, što odgovara volumnoj i masenoj stabilnosti.
Čvrstoće, najvažnije svojstvo cementne paste, pogođene su izluživanjem. Dugotrajno
izluživanje u danim eksperimentanim uvjetima smanjuje čvrstoću na savijanje i tlak nakon
56 dana ili više. Prema rezultatima čvrstoće, cement utemeljen na kacijevim sulfoaluminatnim
spojevima je osjetljiviji prema izluživanju nego portlandski cement utemeljen na kalcijevim
silikatnim i kalcijevim aluminatnim spojevima. Brzina izluživanja ovisi o tipu cementa.
Cementna pasta s višim saržajem C-S-H je manje osjetljiva prema izluživanju.

§ Prošireni sažetak xlvi
Rezultati istraživanja ukazuju da se kemijski sastav i struktura C-S-H gela mijenja što
rezultira gubitkom čvrstoće. Ove promjene treba potvrditi budućim istraživanjima.
Imobilizacija elemenata u tragovima u kalcijevoj sulfoaluminatnoj cementnoj pasti nije
pogođena izluživanjem, što onemogućava upotrebu koncentracija elemenata u tragovima u
pornim otopinama u ispitivanjima izluživanja. Porast koncentracije arsena, žive, antimona i
bakra i smanjenje koncentracije nikla u pornim otopinama portlanskog cementa podupire
kemijsko razaranje uslijed izluživanja. Ponašanje kroma, vanadija i kobalta ne može se
povezati s procesima razaranja zbog uočenih varijacija u koncentraciji.
Dugotrajna ispitivanja izluživanja, najmanje 365 dana ili duže, potrebna su kako bi se
jednoznačno odredio utjecaj izluživanja na cementnu pastu. Moguće je korsititi nezrele
cementne paste u ispitivnjima što može skratiti potrebno vrijeme za ispitivanje. Rendgenska
difrakcija in-situ nije prikladna metoda za ispitivanje izluživanja zbog stvaranja kalicta na
površini uzoraka.
Cement koji je utemeljen na kalcijevim sulfoaluminatnim spojevima nije preporučljiv za
primjenu u konstrukcijama koje su izložene izluživanju, ali je vrlo pogodan za imobilizaciju
metala u tragovima. Novi, održivi cement mogao bi biti utemljen na smjesi kalcijevih silikata,
kalcijevih aluminata i kalcijevih sulfoaluminata. Prikladne omjere pojednih spojeva treba
odrediti daljnjim istraživanjem.

§ 1. Introduction 1
Marija Đuroković PhD Thesis
§ 1. INTRODUCTION
1.1. Problem statement
Portland cement production accounts for around 5 to 8 % of anthropogenic CO2. Thus, the
sustainability has become one of the two main drivers for innovation in Portland cement
industry together with improving of properties.1
Different possibilities for achieving a substantial reduction in CO2 emissions have been
developed.1,2,3 The traditional solutions present improvements of common Portland cements
based on calcium silicates or calcium aluminates. More innovative solutions include
formulation of novel cements based on sulfoaluminate, sulfoferrite or fluoroaluminate.3
Portland cement production is closely tied to construction and it is appropriate to apply a
holistic approach for evaluation of new cement solutions. The concept of holistic approach,
originally developed for concrete, shown in Figure 1.1, is also suitable for evaluation of new
cement solutions.4
Figure 1.1. Holistic approach for the new cement solution according to F.P. Glasser4
originally developed for concrete
Constitutional properties:
composition, structure across length scales, formulation
Engineering properties strength,
dimensional stability etc.
Service Environment:
solids, aqueous and vapour phases
Interactions
Difficult and at present largely unknown with
respect to qualitative links
Proportionality factors and interaction coefficients

§ 1. Introduction 2
Marija Đuroković PhD Thesis
The modern construction is based on design codes and standards which are very conservative
since their objective is to minimize the possibility for catastrophic failure and loss of life.1
Introducing the new material into codes and standards requires durability data. Durability is
an abstract term usually understood as a demonstration of performances over long time scale.4
Wide range of methods for determination of chemistry, physics, mineralogy and structure of
Portland cement system are available.5 Tests of engineering properties are performed by well-
established standard methods. The critical element of this approach is deficiency of standard
test methods for durability assessment. Researches on closed systems (with respect to
transport of matter) are simple and give good starting data. However, common degradation
processes mostly occur in open or partly open systems. Open systems are more complicated
and require different sets of methods to be applied.4 This makes durability testing time and
labour consuming which is in conflict with legal requirements for rapid CO2 emissions
decrease.
Portland cement composite have the good durability in normal service life up to 70 years
or more.6 During the service life the Portland cement paste may be exposed to weathering and
degradation and may exhibit a reduced service life. Deionized water containing a low
concentration of dissolved ions in contact with the Portland cement paste induces
decalcification.7,8 The process is called leaching. The increased porosity and permeability and
loss of strength are the key consequences in the structures exposed to leaching.9-12
Leaching appears in Portland cement pastes exposed to steam, fog, rainwater or
groundwater.13 This is a significant issue for structures constantly exposed to soft or acid
waters such as dams, water tanks, pipes or nuclear waste storages.9 It is also very important
for the waste solidification and stabilization by Portland cement.14
Generic approach to testing of Portland cement paste resistance towards leaching has not
been developed yet. Initial tests were done by immersing solid samples in water to
characterize this process.8,15-17 Later, tests on milled samples were developed.18,19 Particular
deficiency has been observed in tests in which the changes in the chemical and mineralogical
composition are related to the changes in engineering properties such as strength, modulus of
elasticity, dimensions, etc. The absence of a general approach leads to inconsistence in
collected data, making them difficult to compare with each other and resulting in
impossibility to quantitatively define the relationship between chemical and mineralogical
properties of the cement paste and associated mechanical and physical properties. The

§ 1. Introduction 3
Marija Đuroković PhD Thesis
inability for reliable assessment of durability of Portland cement pastes exposed to leaching
prevents introduction of new cements into construction codes and standards.
1.2. Objectives, hypothesis and methods of research
The final objectives of the research are:
• determination of the changes in the chemical and phase composition and the
microstructure of immature cement pastes with different initial chemical and phase
compositions exposed to leaching by deionized water, without stopping hydration;
• determination of changes of physical and mechanical properties: strength, modulus of
elasticity, dimensional and mass stability caused by leaching;
• determination of the effect of initial composition of the cement on the leaching process
and the impact of leaching on the hydration process;
• determination of the possibility to use incorporated trace elements in leaching
researches;
• determination of the possibility to use immature cement pastes in a partly opened
system of leaching research.
The basic hypothesis is that resistance of cement paste to the action of deionized water
depends on the properties of all constituents of cement paste: hydration products, pore
solution and pore system. These properties are determined by the phase composition of
anhydrous cement and curing conditions in which hydration reactions are carried out. X-ray
diffraction is used to determine phase composition of anhydrous cements and to observe
changes in the phase composition of hydrated cement pastes in the course of time. Bulk
composition (major, minor and trace elements) of cement, cement pastes and pore solutions
are determined by wet chemistry methods or by inductively coupled plasma mass
spectrometry. The changes in pore system are observed by scanning electron microscopy,
determination of air voids content, water absorption due to capillary action and permeability
to gasses. The chemical resistance of cement pastes to the action of deionized water is
monitored by determination of performance properties: strength, modules of elasticity,
volume stability and loss of mass. The knowledge on the interdependence of cement phase
composition, microstructure of cement paste, curing conditions and resistance of cement paste
to the action of deionized water may facilitate design of new cement solutions with lower
environmental footprint.

§ 2. Literature review 4
Marija Đuroković PhD Thesis
§ 2. LITERATURE REVIEW
2.1. Portland cement
Cement is usually defined as an adhesive element in composite material, generally in
concrete, mortar or cement paste.20 It is a powder material which in contact with water
transferres to a hardened cement paste by chemical reactions and physical processes.21
Portland cement is produced by milling Portland cement clinker with a few percentages of
gypsum.
Portland cement was invented at the beginning of 19th century partly supported by
construction knowledge from Antique, Greece and Rome.22 Since then, it has made the great
contribution to the quality of life. Today, Portland cement is in the form of the final product ‒
concrete, the most widely used material of modern construction.13 Construction of roads,
bridges, buildings, dams, plants, skyscrapers etc. would not be possible without it. The
availability of raw materials, common production and relatively low prices has increased the
Portland cement mass production. The estimated world production of Portland cement in
2016 was 4.6 billion tones with China producing 52% of total world production (Figure
2.1).23 Portland cement industry plays an important role in the economic, social and
environmental development. It significantly contributes to the creation of employment, wealth
and progress of the local and wider communities.
Figure 2.1. World Portland cement production in 2016
Source: CEMBUREAU, Activity report 201723
China ; 51,9%
Japan; 1,2%India; 6,2%
Asia (excl. China, Japan, India);
21,1%
Africa; 4,6%
USA; 1,9%
America (excl. USA); 4,6%
Europe; 5,4%
CIS; 2,8% Oceania; 0,3%

§ 2. Literature review 5
Marija Đuroković PhD Thesis
2.2. Portland cement composition
2.2.1. Bulk composition of Portland cement
Portland cement is composed of different calcium compounds. The routine chemical analysis
of Portland cement is commonly reported in terms of mass fraction of oxides of the present
elements. Oxides of calcium (CaO), silicon (SiO2), aluminium (Al2O3) and iron (Fe2O3)
determine the bulk composition of Portland cement. Portland cement chemists commonly use
a form of notation to simplify the formula. This notation is given in Table 2.1.13
Table 2.1. Portland cement oxide notation
Oxide Notation
CaO C
SiO2 S
Al2O3 A
Fe2O3 F
MgO M
SO3 �̅
Na2O N
K2O K
H2O H
Titrimetric methods are used to estimate oxide composition of Portland cement. Complexing
agent 2,2’,2’’2’’’-(ethane-1,2-diyldinitrilo)tetraacetic acid (EDTA) in the form of disodium
salt is used to determine CaO, MgO, Al2O3 and Fe2O3 in Portland cement. EDTA forms
octahedral complexes with many metal ions. Selectivity is controlled by pH and by masking
interfering elements by suitable reagents. Silica is determined by traditional method of
treating the sample with hot strong hydrochloric acid (HCl) containing ammonium chloride
(NH4Cl) to dissolve other species. The dissolution is followed by titration and ignition. Well
know method of precipitation with barium chloride (BaCl2) followed by weighing of the dry
precipitate is used to determine sulfate.24
Some minor elements such as sodium, potassium, chloride or manganese are also
incorporated in Portland cement. Alkaline elements are determined by flame photometry and
spectrophotometric methods are commonly applied for manganese determination. Chloride is

§ 2. Literature review 6
Marija Đuroković PhD Thesis
determined by reacting the digested sample with silver nitrate solution and back titrating with
ammonium thiocyanate.24
The oxide composition of Portland cement is not related to its mechanical properties such
as strength and no final conclusion about Portland cement can be made from oxide analysis.24
Phases formed by series of chemical reactions over a range of temperatures during Portland
cement clinker production determine key properties of Portland cement.5,13,24 Typical oxide
composition of Portland cement clinker according Taylor is given in Table 2.2.5
Table 2.2. Typical Portland cement clinker composition
Oxide w / %
CaO 67
SiO2 22
Al2O3 5
Fe2O3 3
Other components 3
2.2.2. Portland cement phase composition
Portland cement has complex mineralogy, which is consequence of thermodynamic
relationship existing between different compounds during Portland cement clinker
production.24
Alite, belite, aluminate and ferrite are four majuor phases detected in Portland cement.
Cement notation for principal phases is given in Table 2.3. Some minor phases such as
alkaline sulfates, calcium oxide (free lime) and magnesium oxide (periclase) are also
incorporated.5
Table 2.3. Portland cement phase notation
Phase Notation Phase name
3CaO·SiO2 C3S tricalcium silicate, alite
2CaO·SiO2 C2S dicalcium silicate, belite
3CaO·Al2O3 C3A tricalcium aluminate, aluminate
4CaO·Al2O3·Fe2O3 C4AF tetracalcium aluminoferrite, ferrite
CaSO4· 2H2O C�̅H2 gypsum

§ 2. Literature review 7
Marija Đuroković PhD Thesis
Chemical composition of Portland cement phases is not exactly what is expressed by
commonly used formulas or notations. Compounds are modified in composition and crystal
structure by ion substitution with small amounts of impurities such as magnesium, sodium,
potassium or sulfate. Seven different alite polymorphs has been confirmed and phase
transformation is given in Figure 2.2.5
��
��°�
� ���
��°�
� ���
��°�
� ���
��°�
� ���
��°�
� ���
��°�
� ��.
T- triclinic M – monoclinic R-rhombohedral
Figure 2.2. Temperature phase transformations of pure C3S after Taylor5
Higher temperature C3S polymorphs require higher substitution by MgO, Al2O3 and Fe2O3
oxides. In industrially produced Portland cement alite incorporates 3 % to 4 % of substituent
oxides and at room temperature is mainly present in form of M1 or M3 polymorph, rarely as
T2.25-29,39 C3S crystallizes as the R polymorph at 1450 °C and inverts to lower temperature
polymorphs by cooling. The content of magnesium oxide (MgO) and sulfate (SO3) determine
whether transformation to M1 or M3 polymorph occurs. Mixture of M1 and M3 is also possible.
High MgO content favours M3 and high SO3 has an opposite effect.31,32 The formation of T2
polymorph is possible only in low substituted and slowly cooled Portland cement clinkers.
The superstructure of alite is built from silica tetrahedra, calcium and oxygen ions.
Coordination of oxygen ions around calcium is irregular with oxygen atoms being
concentrated on one side of each calcium ion. The large structural holes are formed which
increase lattice energy and reactivity of alite towards water.13
Belite has five different polymorphs given in Figure 2.3.34-36
Figure 2.3. Temperature phase transformations of pure C2S after Taylor5
§ 2. Literature review 8
Marija Đuroković PhD Thesis
Higher temperature polymorphs must be stabilized with substitute ions to be kept on lower
temperatures. In industrially produced Portland cement, belite is almost entirely present in
form of β-C2S with 4 % to 6 % of substituting oxides, mainly Al2O3 and Fe2O3.5 The structure
of belite in industrially produced Portland cements is irregular but with less interstitial holes
than alite, which accounts for less reactivity of belite compared to alite. The structure
observed for γ-belite accounts for its nonreactivity with water.
Pure calcium aluminate does not exhibit polymorphism. It has a cubic crystal cell built
from Ca2+ ions and six AlO4 tetrahedra.37 In industrially produced Portland cement, aluminate
is present in cubic or orthorhombic form alone or in a mix.5 Both phases are stabilized with
substituting oxides, with the cubic polymorph incorporating about 13 % and orthorhombic
about 20 % of substituting oxides. Orthorhombic phase is formed in rapid cooled Portland
cement clinker with sufficient alkali content.38
Ferrite phase is closely mixed with cubic aluminate in industrially produced Portland
cement.39 In the pure system ferrite forms series of solid solutions with the formula
Ca2(AlxFe1-x)2O5 where 0 < x < 0.7. In this series C4AF is the only possible composition for
which x is 0.5. The series members are not isostructural since space group changes when x =
0.33.40 Ferrite composition significantly differs from C4AF. It is much lower in Fe2O3 and
incorporates about 10% of substituent oxides. It corresponds to Ca2AlFe0.6Mg0.2Si0.15Ti0.05O5
which reflects substitution of Fe2+ by Mg2+ and Si4+ by Ti4+.5 Microanalysis has shown that
there is much variation in ferrite composition between Portland cement clinkers and within
the clinker.41
The part of MgO in Portland cement is incorporated within major phases (up to 2 %) and
the rest occurs as crystalline MgO, periclase. Uncombined or free calcium oxide is rarely
present in significant amounts in modern Portland cement. Both MgO and CaO have cubic
structures with calcium or magnesium ions surrounded with oxygen atoms in a regular
octahedron. Both phases react slowly with water and can cause unsoundness of Portland
cement, thus both phases are undesirable. Magnesium is the smaller ion thus well packed with
oxygen. Calcium is larger causing oxygen ions to force apart. This is the reason why periclase
is much less reactive than free lime.13
Alkaline originating form clay component of raw material are commonly expressed as
Na2O equivalent. In Portland cement they form double sulfates of alkalis such as langbeinite

§ 2. Literature review 9
Marija Đuroković PhD Thesis
(2C�̅·N�̅) or aphthitalite (3N�̅·K�̅). When there is no sufficient amount of sulfate available
from raw mix or fuel, alkalis are incorporated within alite or belite.5
2.2.3. Calculation of phase composition
When chemical composition of Portland cement is known, it is possible to estimate
quantitative phase composition using the following calculations developed by Bogue:
C3S = 4.0710C - 7.6024S - 6.7187A - 1.4297F
C4AF = 2.8675S - 0.7544C3S
C3A = 2.6504A – 1.6920F
C4AF = 3.0432F.42
Calculations have been refined by Taylor with intention to reduce deviation of the estimated
phase assemblage form reality.43 The Bogue calculation assumes that for major phases (C3S,
C2S, C3A and C4AF) are chemically pure and thus only CaO, SiO2, Al2O3, Fe2O3 and SO3
content are used in calculation. This is the major uncertainty source of Bogue calculation
since the phases in cement are actually solid solutions with composition deviating from pure
phases.44 The difference between the assumed and actual composition also arises from the
absence of equilibrium during clinkerization and cooling reactions. The existence of other
minor individual phases also affects accuracy of calculation.44,45 The modified Bogue
calculations based on more realistic phase compositions are still not commonly applied in
Portland cement production.46,47
2.3. X-ray diffraction
X-ray powder diffraction (further: XRPD) is the only physical method suitable to determine
phase composition of Portland cement clinker, Portland cement and Portland cement paste.5
The XRPD Portland cement phase determination is possible due to the fact that each cement
phase has a unique diffraction pattern independent of others. The intensity of each pattern is
proportional to the concentration of the phase in the mix. There are certain challenges in
XRPD Portland cement phase determination arising from the nature of material and from the
method itself. The patterns of Portland cement clinker or cement are very complex with many
overlaps especially from alite since it is the most abundant Portland cement phase.24 The peak
positions and relative intensities are affected by variations in composition and structural
variation of each phase. Peak broadening due to compositional zoning and imperfect
crystallinity has been observed especially for the ferrite phase.5
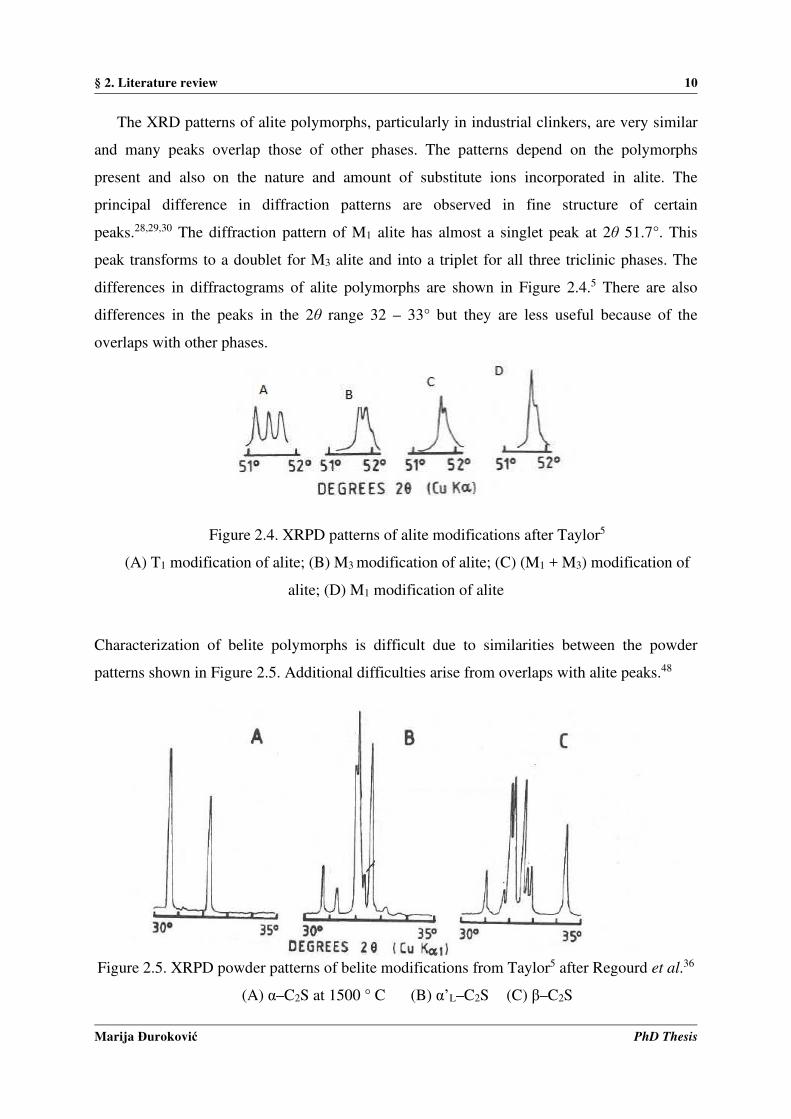
§ 2. Literature review 10
Marija Đuroković PhD Thesis
The XRD patterns of alite polymorphs, particularly in industrial clinkers, are very similar
and many peaks overlap those of other phases. The patterns depend on the polymorphs
present and also on the nature and amount of substitute ions incorporated in alite. The
principal difference in diffraction patterns are observed in fine structure of certain
peaks.28,29,30 The diffraction pattern of M1 alite has almost a singlet peak at 2θ 51.7°. This
peak transforms to a doublet for M3 alite and into a triplet for all three triclinic phases. The
differences in diffractograms of alite polymorphs are shown in Figure 2.4.5 There are also
differences in the peaks in the 2θ range 32 – 33° but they are less useful because of the
overlaps with other phases.
Figure 2.4. XRPD patterns of alite modifications after Taylor5
(A) T1 modification of alite; (B) M3 modification of alite; (C) (M1 + M3) modification of
alite; (D) M1 modification of alite
Characterization of belite polymorphs is difficult due to similarities between the powder
patterns shown in Figure 2.5. Additional difficulties arise from overlaps with alite peaks.48
Figure 2.5. XRPD powder patterns of belite modifications from Taylor5 after Regourd et al.36
(A) α–C2S at 1500 ° C (B) α’L–C2S (C) β–C2S

§ 2. Literature review 11
Marija Đuroković PhD Thesis
The powder patterns of cubic and orthorhombic aluminate phase differ in the peak at 2θ 33.3°
(Figure 2.6).36 The cubic phase is characterized by a strong single peak while for the
orthorhombic phase this peak is split into a strong singlet at 33.2° and a weak doublet in the
2θ range of 32.9–33.0°.
Figure 2.6. XRD powder patterns of aluminate from Taylor5 after Regourd et al.36
(A) cubic and (B) orthorhombic phase
The XRD patterns of ferrite from industrially produced Portland cement clinker are strongly
affected by the cooling rate. Rapid cooling causes poor crystallinity of the ferrite phase and,
as a consequence, disappearance of many peaks and broadening of the peaks.49
The major sources of systematic and random errors in XRPD are: sample displacement,
preferred orientation and limited interaction depth of the X-ray beam.50 The sample
displacement causes systematic shift in observed peaks but it does not affect the peak
intensities significantly. The preferred orientation affects the relative peaks intensities for a
given phase. The oversampling of one or more Portland cement phases is possible if the phase
domains are comparable with interaction depth of X-ray beam.51 Reduction of particle size by
grinding can significantly reduce all three of these errors. The anisometric particles are
crashed by grinding into smaller, more random shapes with reduced tendency for preferred
orientation. It is not possible to completely avoid the preferred orientation for alite, calcite and
gypsum due to the strong cleavage planes characteristic for these phases. The better packing is

§ 2. Literature review 12
Marija Đuroković PhD Thesis
produced with finely ground powder resulting in smoother surfaces and reduced sample
displacement. Internal standard is also used to minimize the error of the sample displacement.
The commonly used internal standards are rutile (TiO2), silicon (Si), potassium bromide
(KBr), calcium fluoride (CaF2) and corundum (Al2O3).5,48 Corundum is a very suitable
internal standard since it gives no overlaps with important cement peaks up to 2θ = 60°.5
Grinding improves representative phase sampling by reducing the average phase domain
size.50 Reduction of particle size to about 10 microns or less would be ideal to reduce this
source of possible errors. Wet grinding with an inert solvent such as benzene, isopropyl
alcohol or cyclohexane is recommended.48 The grinding is very challenging since it may
result in damage to the phases, reduced crystallinity and as a consequence peak broadening.
Collection and characterization of complex Portland cement powder difractograms
requires much skill and experience. Thus, the XRPD studies have been for more decades
more qualitative than quantitative. The quantitative X-ray powder diffraction (further:
QXRPD) can be obtained by number of methods.50 Nowadays it is mainly based on Rietveld
method and has become the most appropriate quantification method of the crystalline phases
in Portland cement, clinker and hydrated cement paste.44,50 The Rietveld method is the whole
powder pattern fitting method which uses a least squares approach to refine theoretical pattern
to match the best possible the measured powder difractogram. It does not require calibration
curve or internal standard but the crystal structures of all crystalline constituents must be
known.51 The Rietveld method of QXRPD is carried out by one of several specially
developed computer programs.51 The method has significantly improved the precision of
QXRPD cement phase determination and shows to be useful in Portland cement durability
studies.50,52,53
Unfortunately, implementation of XRPD on hydrated cement paste is limited mostly due
to the fact that the principal hydration phase of Portland cement is nearly amorphous. It can be
successfully implemented on other crystalline phases in Portland cement paste such as:
portlandite, ettringite, unreacted Portland cement phases or some minor hydrated phases.54
The X-ray diffraction in-situ is successfully implemented technique that offers the possibility
for time dependent observation of the Portland cement phase composition and in combination
with the Rietveld method, quantitative determination of present phases without influencing
the sample by further preparation.

§ 2. Literature review 13
Marija Đuroković PhD Thesis
2.4. Minor elements in Portland cement
The term trace element is generally used in analytical chemistry for any element having
average concentration less than 100 mg kg-1. In Portland cement it is applied to elements with
concentration above this limit to distinguish them from the main elements reaching
concentrations in the percentage range.55 The increased waste utilization as a partial
substitution of primary raw materials and fuels in Portland cement production has increased
interest for trace elements incorporated in Portland cement. Some of these elements are toxic
or carcinogenic (arsenic, cadmium, cobalt, chromium, copper, mercury, nickel, lead) or
present an important occupational risk (chromium, cobalt, nickel).56 Transition metals (cobalt,
chromium, copper, manganese, nickel, vanadium, titanium, zinc) also have influence on the
process reaction during clinkerization and on the properties of the final product.57 The
quantity of the trace elements present in Portland cement determines the mechanism and place
of immobilization.58 The immobilization in the principal clinker phases (C3S, C2S, C3A,
C4AF, free lime and periclase) is dominant at low concentration. When the concentration of
trace element exceeds the threshold limit, new phases are formed.58 The binding mechanism
of the specific trace element depends on the oxidative state of the element which is a function
of raw materials chemistry and production conditions.59,60
Oxidative states of chromium in Portland cement clinker are +3, +4, +5 and +6.61 At high
temperatures and in an oxidizing atmosphere during production the oxidative state +3 is the
most stable one. Chromium in this oxidative state is concentrated in C4AF due to its
replacement with Fe3+. Chromium ions in higher oxidative states (+4,+5) are smaller and
replacement for Al and Si in C3S and C2S is possible.60 The existence of individual phases of
chromium in different oxidative states has been also confirmed.61 The oxidative states +2 and
+3 have been confirmed for cobalt in Portland cement clinker, being concentrated in
C4AF.57,58,62 Copper and nickel are mainly incorporated in C4AF, followed by C3S, C3A and
C2S.63 Formation of a copper solid solution in free lime has been confirmed for higher
uptakes.64,65 Nickel can form an individual compound (MgNiO2) with magnesium.66
Vanadium in Portland cement clinker is present in the form of V2O5 and has preferential
partition towards C2S.67,63 Bolio-Arceo et al. have confirmed that most of the zinc is present
in form of a solid solution based on 6CaO·3ZnO·2Al2O3.67 A small amount of the zinc is
partitioned into the solid solution of the main clinker phases.63,68 Cadmium is incorporated in
C3S, C2S and free lime. Belite has higher ability to incorporate cadmium than alite.69

§ 2. Literature review 14
Marija Đuroković PhD Thesis
Metalloids, arsenic and antimony are present as individual phases, both in the oxidative state
+5.70-72 Incorporation of mercury and lead within the clinker phases has not been researched
well. These elements are difficult to stabilize within the Portland clinker due to their
volatility. They are concentrated in the filter dust or off gases.55
2.5. Portland cement hydration
Hydration of Portland cement includes all changes that occur in reactions between Portland
cement composite and water.73 Products that possess setting and hardening characteristic are
formed through these complex reactions.73,74 Setting usually occurs within a few hours from
mixing and no significant development of compressive strength is observed within this
period. Significant development of compressive strength is a slower process called hardening.
The mixture of cement and water in proportions enabling setting and hardening to occur is
called cement paste. Water to cement ratio (further: w/c) in the cement paste determines many
its properties. The term also includes the hardened material. Curing samples of cement pastes,
mortar or concrete means storage under conditions such that hydration occurs.73
The interpretation of complex hydration reactions of Portland cement is not possible
without deep understanding of hydration reactions of each individual Portland cement
phase.74
2.5.1. Hydration of alite
The rather complex hydration of C3S can be simplified and described by the following
equation:
2 C3S + 7 H C3S2H4 + 3 CH ∆ H = -1114 kJ mol-1.74
In the exothermic reaction two main products are formed: calcium hydroxide (CH) usually
called portlandite and calcium silicate hydrate usually denoted as C-S-H. Around 70 % of
alite present in Portland cement reacts within 28 days and virtually all within the 1-year
period.73,75
The phase C-S-H is amorphous or poorly crystalline calcium silicate hydrate. The dashes
in this generic name indicate that relation between components (C/S and H/S) is not constant
and no particular composition is implied. The composition depends on formation condition
and is altered during the hydration reactions.73,74 Calcium silicate hydrates can be found in
nature, synthesized in laboratory or formed during the hydration of Portland cement. More
than 30 of them are crystalline.73,76 Due to its structure and large specific surface, C-S-H
together with pore solution forms a rigid gel in which pores range in size from macroscopic to

§ 2. Literature review 15
Marija Đuroković PhD Thesis
nanometer dimensions. The term C-S-H gel is used only for calcium silicate hydrate formed
during hydration of Portland cement. It is primary responsible for development of mechanical
properties of Portland cement paste.73,74 The XRPD pattern of C-S-H gel shows that there is
no long-range order in its structure. Thus, determination of nanostructure is a more
appropriate term for the C-S-H gel than determination of the crystal structure. The structural
comparisons with crystalline silicate hydrates usually 1.4-nm tobermorite (C5S6H9) and
jennite (C9S6H11) has given much knowledge about the nanostructure of C-S-H gel.76 Both
minerals have layer structure and on heating lose interlayer water and undergo unidimensional
lattice shrinkage.73.77,78 They belong to the group of nature minerals having a silicate
dreierketten structure that is built of a central Ca–O layer bordered on both sides by chains of
tetrahedral silicates. The interlayer distance, distance between two Ca–O layers is usually
filled with calcium atoms and molecules of water. Schematic drawing of a dreierketten
structure is given in Figure 2.7.79
Figure 2.7. Schematic drawing of a dreierketten structure showing the central Ca–O layer
and chains of tetrahedral silicates with paired tetrahedra (P) and bridging tetrahedra (B)79
The structures of 1.4-nm tobermorite (Figure 2.8) and jennite (Figure 2.9) have been recently
completely resolved.80,81 The C/S ratio in 1.4-nm tobermorite is 0.83 and the prefix 1.4-nm
refers to the interlayer thickness. Two oxygen atoms from paired tetrahedra in 1.4-nm
tobermorite are coordinated to the central calcium ions. In jennite, only one oxygen atom
from paired tetrahedra is coordinated to the central calcium ion. The second oxygen atom is

§ 2. Literature review 16
Marija Đuroković PhD Thesis
provided by the hydroxide ion. Thus, jennite has a more corrugated structure in which every
other dreierketten is replaced with a row of hydroxyl groups. The C/S ratio in jennite is
1.50.76,79
Figure 2.8. Structure of 1.4-nm tobermorite (a) The structure as seen along [100], with two
Ca–O layers separated 1.4 nm apart82 (b) Connection of silicate chains (dark grey) to the layer
of calcium polyhedra (light grey), as seen down [100]83
Figure 2.9. Structure of jennite as seen along [010] (top) and [100] (bottom). “H” indicates
hydroxyl groups. Reproduced from Richardson who used data from Bonaccorsi 81,84

§ 2. Literature review 17
Marija Đuroković PhD Thesis
Both 1.4-nm tobermorite and jennite have ability to vary in composition, degree of
polymerization and extent of crystallinity while maintaining the essential features of the
composite layer structure. The variations of the C/S ratio, the silicate structure and contents of
Si–OH and Ca–OH in C-S-H are correlated.76
The XRPD pattern of C-S-H gel does not give unambiguous evidence which structure,
1.4-nm tobermorite or jennite, better approximates the nanostructure of C-S-H gel. The C/S
ratio 1.7 to 1.8 has been determined for the C-S-H gel by determination of the CH content,
residual C3S content and microanalysis using microprobe or transmission electron microscopy
(further: TEM).85-92 These observations together with other evidences support the hypothesis
that C-S-H gel is initially a mixture of 1.4-nm tobermorite and jennite–like structures with
later becoming dominant with age.93
The researches of microstructural development of calcium silicate pastes by scanning
electron microscopy (further: SEM) has confirmed the existence of massive and almost
structureless C-S-H gel formed form the larger anhydrous grains called inner product. The
outer product formed in the water filled space forms columns or fibres radiating from the
anhydrous grain.94-97 Further SEM investigations have confirmed four morphological types of
the C-S-H gel:
• Type I: fibrous material with fibres up to 2 µm long dominant at early ages of
hydration;
• Type II: honeycombs or reticular networks form as a normal early product;
• Type III: massive formed of tightly packed spherical grains up to 300 nm across
observed in older pastes;
• Type IV: more featureless and massive, inner–like product observed in older
pastes.95
The three principal stages of product development have been distinguished in C3S pastes:
• Early product formed during the first 4 hours;
• middle product formed between 4 and 24 hours;
• late product formed subsequently.98
The early product is characterized as consisting of foils, flakes and honeycombs and being
very similar to Type I.99,100 Rapid formation of the C-S-H gel and CH is characteristic for the
middle stage of hydration.91 Type I C-S-H is dominant but also the outer like product has
been observed. In the late stage Types III and IV C-S-H are formed together with more CH.98

§ 2. Literature review 18
Marija Đuroković PhD Thesis
Calcium hydroxide has a layer structure with calcium atoms octahedrally and the oxygen
atoms tetrahedrally coordinated.101,102 There are no experimental evidences that some of the
CH in calcium silicate pastes is amorphous.73
2.5.2. Hydration of belite
The hydration of C2S is similar to C3S hydration but the reaction is slower. Only 30% of
belite reacts within 28 days and 90% in 1 year.73 The hydration of C2S can be simplified and
described by the following equation:
2 C2S + 5 H C3S2H4 + CH ∆ H = - 43kJ mol-1.74
The equation shows that a significantly lower amount of CH is formed by hydration of C2S
than by C3S and the relative portion of C-S-H in the final product is higher for C2S. There are
no differences in the growth, morphology and composition of C-S-H formed by hydration of
belite and alite.103,104
2.5.3. Experimental considerations
The susceptibility of C-S-H to carbon dioxide, organic solvent and heating makes the
experimental research on Portland cement more complicated.73
C-S-H reacts with atmospheric CO2 with formation of CaCO3. This reaction decreases the
C/S ratio in the C-S-H gel. It is usually important to know how much CO2 is present in the
Portland cement paste or to conduct experiments in CO2–free atmosphere. It can be
determined by simple and accurate method based on decomposition with dilute acid and
absorption of the liberated CO2 in Ba(OH)2 solution which is then back titrated with HCl. The
XRPD method and thermogravimetry (further: TG) can be applied but less accuracy can be
achieved.73
Polar organic liquids such as methanol, propan-2-ol or acetone are usually used to stop
hydration before further experimental determinations. It is undesirable since removal of
organic liquids from Portland cement paste can cause seriously alternations.73 Acetone can
undergo aldol condensation at room temperature and methanol reacts with CH.105,106 Heating
at 105 °C or equilibration to constant mass at low relative humidity partially dehydrates the
C-S-H or decomposes other hydrated phases.73
2.5.4. Hydration of aluminate and ferrite phase
Pure C3A reacts with water immediately, liberating a large amount of heat of hydration.
Crystalline hydrates such as C3AH6, C4AH19 and C2AH8 are formed by this reaction.73,74
When C3A reacts with water in the presence of calcium sulfate, ettringite is formed which

§ 2. Literature review 19
Marija Đuroković PhD Thesis
reacts further to form aluminate ferrate monosulfate (further: AFm) phases. The reactions can
be described by further equations:
C3A + 3C�̅H2 + 26 H C6A�̅�H32
C3A + C6A�̅�H32 + 4 H 3 C4A�̅H12.73
Ettringite (C6A�̅�H32) is the first crystal hydrate formed in the Portland cement paste, within
30 minutes from contact between Portland cement and water. In the period 24 – 48 hours,
ettringite reacts further to form AFm phases. The hydration products formed by hydration of
C4AF are essentially similar to those formed by C3A hydration.73
Ettringite [Ca3(Al,Fe)(OH)6·12H2O]2·(SO4)3·2H2O or C6A�̅�H32 belongs to the family of
AFt phases having the general constitutional formula [Ca3(Al,Fe)(OH)6·12H2O]2·X3·xH2O
where x is normally ≤ 2 and X represents one doubly charged anion or two singly charged
anions. It also occurs as a natural mineral. Ettringite and other AFt phases form hexagonal
prismatic or acicular crystals. There are two distinct structural components: columns of
[Ca6(Al(OH)6)2·24H2O]6+ and channels with [(SO4)3·2H2O]6-. Figure 2.10 illustrates the
structure of ettringite.73
Figure 2.10. Schematic structure of ettringite after Taylor107

§ 2. Literature review 20
Marija Đuroković PhD Thesis
The AFm phases may be prepared from aqueous solutions containing ions necessary for this
formation or by the hydration of Portland cement. AFm form can form hexagonal crystals but
in Portland cement paste much is poorly crystalline and intimately mixed with C-S-H.
General formula of AFm phase is CaAl(OH)6·X·nH2O where X represents a single charged or
half a double charged anion. AFm has a layer structure derived from CH composed of two
layers: positively charged rigid layer [Ca2Al(OH)6]+ and negatively charged [X·nH2O]-.
Different anions (OH-, SO42-, CO3
2-, Cl-) and a number of water molecules can be present in
the interlayer region.73,108
The hydration of aluminate and ferrite phases is very important since it determines setting
behaviour, rheology of fresh Portland cement paste and early hardening.
2.5.5. Portland cement hydration
Hydration of Portland cement is very similar to hydration of C3S. The principal products
formed the C-S-H gel, and CH formed by hydration of calcium silicate, and AFt and AFm
phases formed by hydration of aluminate and ferrite are also present in hydrated Portland
cement paste. Amorphous CH was confirmed in hydrated Portland cement pastes in contrast
with the pure C3S pastes.109,110 Clinker phases are consumed at different rates and calcium
sulfate phases are usually no longer detectable after 24 hours. In the XRD pattern ettringite is
observed early, within few hours and usually reaches its maximum at about 1 day. Peaks
corresponding to AFm are observed subsequently. They are usually broad thus suggesting that
AFm is poorly crystalline.107 The appearance of AFm peaks usually corresponds to decrease
of SO42- concentration in solution that favours formation of monosulfate instead of ettringite.
In some cases, in Portland cement with a high �̅ / A ratio or sulfate resisting cement, ettringite
can be detected up to one year. Carbonatization of hydrated Portland cement paste also causes
ettringite formation in the late period of hydration.111
2.5.6. Hydration kinetics and mechanism of hydration
It is difficult to resolve the individual mechanisms of Portland cement hydration or the
parameters that determine their rates due to the complexity and interdependence of chemical
and microstructural processes. Portland cement hydration processes fall into one of the
following categories: (1) dissolution / dissociation, (2) diffusion, (3) growth, (4) nucleation,
(5) complexation and (6) adsorption.112 These processes are carried out in series, parallel or in
some more complex combination. Unfortunately, the application of chemical kinetics models
based on fundamental chemistry and physics is not efficient because of difficulties in isolating

§ 2. Literature review 21
Marija Đuroković PhD Thesis
individual chemical processes for further studies. Thus, the present models of cement
hydration are more empirical, less mechanistic. The overall hydration can be divided into four
stages: (1) initial reaction, (2) the period of slow reaction (3) acceleration period and (4)
deceleration period. The initial period corresponds to early product formation, while the
middle product is formed during acceleration and deceleration period.112
Two mechanisms of Portland cement hydration have been proposed: through–solution
hydration and solid–state hydration. Through–solution hydration involves dissolution of
anhydrous compounds to ionic constituents, formation and precipitation of hydration
products. In the solid–state hydration mechanism reaction takes place on the surface of the
anhydrous cement phases without ions dissolving in the solution. Through–solution
mechanism is dominant at early hydration and solid–state take place at later ages when the
mobility of ions in solution is restricted.13
2.6. Microstructure of hardened Portland cement paste
Hardened Portland cement paste has properties of a rigid gel. It is strong solid of high
porosity and internal surface area. Hardened Portland cement paste is built of hydration
products, unreacted cement grains, capillary pores and water solution called pore
solution.74,113 Water in hardened Portland cement paste can be categorized as: evaporable and
non - evaporable water. Non – evaporable water is incorporated within hydration products and
sometimes is used as measure of the degree of hydration.114 Evaporable water occupies
capillary pores and partly so-called gel pores within hydration products. Total porosity of
hardened Portland cement paste includes all types of pores shown in Figure 2.11: closed
(isolated), opened (passable and baggy).74

§ 2. Literature review 22
Marija Đuroković PhD Thesis
Figure 2.11 Schematic diagrams of pore types in hardened Portland cement paste after
Đureković74
According to the IUPAC proposal pores in hardened Portland cement paste are classified as:
micro pores in gel with the diameter less than 2.6 nm; capillary pores or mezzo pores with the
diameter between 2.6 and 50 nm and macro pores with the diameter larger than 50 nm.115
Portland cement type, water to cement ratio and hydration condition largely determine
features of the pore system in the hardened Portland cement paste.
The link between some microstructural descriptors such as porosity has been studied
extensively. Powers has established a connection between compressive strength and the ratio
of the volume of hydration products and capillary porosity. Microstructural models have also
been developed to link mechanical properties to microstructure of the material. Little has been
done to explain how the nature of hydration products impacts the mechanical properties of
cement. This is consequence of difficulties to quantify the volumes of the different phases in
the system and the lack of models to relate mineral assemblage to mechanical properties.
Recently it was determined that all hydrates do not contribute in the same way to compressive
strength. The C-S-H gel has a critical role compared to other hydrates in contributing to the
compressive strength of the cement paste. This is explained by the fact that C-S-H is
intermixed with porosity and other phases are just inclusions in C-S-H and porosity matrix.
2.6.1. Scanning electron microscopy
Scanning electron microscopy (further: SEM) can give important information about the
microstructure of hardened Portland cement paste.116 It is possible to use a wide range of

§ 2. Literature review 23
Marija Đuroković PhD Thesis
magnifications usually 20 × to 10 000 × and thus observe morphology of the hydration
products. The scanning electron microscope is usually equipped to do X-ray microanalysis
which enables determination of the composition of the features in the SEM image and thus
enables identification of different microstructural constituents.117 Secondary electron imaging
(further: SEI) or backscattered electron image (further: BSEI) are commonly recorded
depending on the type of detector used with microscope. The interaction of incident electron
beam with the sample generates different signals among which secondary electrons,
backscattered electrons and X-rays are commonly used for microstructural identification.
Energy dispersive X- ray spectrometry (further: EDS) can be usually done with the same
instrument. Different signals generating from different regions (Figure 2.12) are picked up by
different detector types, converted to electrical signal and used for imaging.11
PRIME BEAM
Figure 2.12. Schematic diagram of SEM signals generation
Compositional contrast as a result of different average atomic numbers of different features.
Hydration products appear less bright in BSE images due to their lower average atomic
number and present a strong contrast to bright unreacted Portland cement clinker phases with
higher average atomic numbers. Topographic contrast in SEI and BSE images enables
10 nm
1 – 2 µm
Auger electrons
Characteristic X-rays
Secondary electrons
Backscattered electrons
§ 2. Literature review 24
Marija Đuroković PhD Thesis
imagination of size, shape and texture of different features present in hardened Portland
cement paste.116,117
2.6.2. Distribution of the trace elements in hydrated Portland cement paste
Following the primary hydration, trace elements from anhydrous cement are transferred to the
hydration products in the Portland cement paste. The structure and chemistry of hydration
products favour immobilization of trace elements by multiple mechanisms: chemisorption,
precipitation, formation of surface compounds, inclusion and chemical incorporation.118
Ettringite acts as a host to a number of ions. Immobilization of Cd2+,Co2+, Pb2+ and Zn2+
within the AFt phase at the M2+ site has been reported.55,119,120 Elements present is the
oxidative state +3 (chromium, cobalt, nickel) can substitute Al3+ ions in AFt.119,121,122
Substitution of the sulfate ion in AFt with vanadate (VO4-), chromate (CrO4
2-) and arsenate
(AsO43-) has been experimentally confirmed as well as physical encapsulation of
mercury.119,123,124 Immobilization within the AFm phases is not so well researched mainly due
to the assumption that all ions immobilized in the AFt phases are transferred to the AFm
phases in the later period of hydration.55 Immobilization mechanisms of the trace elements
within C-S-H include: sorption (Co, Ni, Zn, As), substitution (Cu, Cr) and phase mixing
(nickel hydroxide, cadmium hydroxide).55,121,122,125-128 Many trace elements are present in the
form of individual phases. Cadmium, lead and zinc also precipitate in the form of hydroxide,
carbonate and nitrate mixed salts.119,129 Cadmium hydroxide provides the nucleation sites for
precipitation of calcium hydroxide and the C-S-H gel.129,130 Formation of Ni-Al layered
double hydroxides has been confirmed in the Portland cement paste.131,132 For higher zinc
concentrations precipitation of ß2-Zn(OH)2 and calcium zincate, Zn2Ca(OH)6·2H2O, has been
reported.123,133 Precipitation of magnesium and calcium arsenate in the amorphous rather than
in the crystalline form has been confirmed.71,134 Precipitation of calcium antimonate in the
Portland cement paste is not supported due to its pH independent solubility.135 Cornelis et al.
have shown that antimonate forms a solid solution predominantly with AFm and the C-S-H
gel. For the higher concentrations of antimony (1000 mg/kg), the formation of romeite with a
general formula Ca1+xSb2O6OH2-2x has been proposed.136 The composition and the structure
of romeite changes with pH and the concentration of available calcium ions.137 Substitution of
Ca2+ by Pb2+ ions in all hydrated phases was suggested by different authors.120,138 Small
fractions of trace elements are dissolved in pore solutions within the capillary pores of
hydrated Portland cement pastes.

§ 2. Literature review 25
Marija Đuroković PhD Thesis
2.6.3. Pore solution chemistry
Pore solution is essential but often the overlooked part of hydrated Portland cement paste. The
composition of pore solution reflects the chemical processes and interactions between the
solid and liquid phases. It can be useful in understanding of the mechanism and kinetics of
cement hydration as well as the thermodynamic modelling of hydration.139 The pore solution
is mainly responsible for transport of substances within Portland cement paste and also serve
as entry channels for external substances. Thus, the composition of the pore solution can be
used to evaluate different destructive reactions in the Portland cement paste related to
durability.140
Vacuum filtration or centrifugation can be used to extract the pore solution from the
hydrated Portland cement during the first hours of hydration.141,142 The high-pressure device
firstly described by Longet et al. is commonly used for pore solution expression from
hardened Portland cement paste. Pressures up to 250 MPa are usually applied since data
indicate that the composition of the pore solution does not change with pressure up to this
value.143,144
The pore solution has been considered as an alkali hydroxide solution with hydroxide
ions, sodium, potassium, calcium, sulfate, silicon and aluminium as the principle dissolved
ions. Sodium and potassium are usually present in the form of ready soluble alkali sulfates in
Portland cement and are partly incorporated within the main clinker phases. Alkali sulfates
dissolve within the first minute when water is added. A part of alkalis is bound in the C-S-H
gel.145,146 Concentration of sodium and potassium increases in the course of time due to
hydration processes and release of alkalis incorporated in the main clinker phases. Their
concentrations increase until reaching the maxima at about 7 days hydration period. A decline
is then observed until reaching constant values present for s long time. Concentration of
alkalis in the pore solution depends on total K2O and Na2O content in Portland cement and
w/c ratio of hydrated cement paste.139 The average pore solution concentrations of sodium and
potassium in pure Portland cement pastes obtained by statistical evaluation of data from
numerous researches are given in Figure 2.13.

§ 2. Literature review 26
Marija Đuroković PhD Thesis
Figure 2.13. Average pore solution concentrations of potassium and sodium in pure
Portland cement pastes with K2O content between 0.76 % - 1.03 % and Na2O content between
0.20 % - 0.31 %, after Vollpracht et al.139

§ 2. Literature review 27
Marija Đuroković PhD Thesis
The concentration of hydroxyl ions (OH-) is corelated with concentration of alkalis in the pore
solution. Usually it is expressed in the form of pH value. Common practice in experimental
research of pore solution is to calculate the pH value from the OH- concentration or vice
versa. The increase of alkalis concentration causes increase of the pH value (concentration of
OH). The w/c ratio also determines concentration of hydroxyl ions. For higher w/c ratio,
dilution is higher and thus the pH value lower. The average pore solution concentrations of
OH- ions in pure Portland cement pastes obtained by statistical evaluation of data from
numerous researches are given in Figure 2.14.
Figure 2.14. Average pore solution concentrations of OH- ions of pure Portland cement
pastes after Vollpracht 139
Calcium and sulfate concentration in the pore solutions depend on the solubility of the phases
present at the particular hydration time. The w/c ratio has a small impact, although the pH
values influence the calcium concentration. Higher concentrations of calcium and sulfate are
observed in the early period of hydration where they follow the gypsum (CaSO4·2H2O) and
anhydrite solubility. Decrease in the concentration corresponds with the acceleration period of
hydration and formation of ettringite. Within a longer period the concentration of calcium is
determined by the solubility of portlandite and thus depends on the pH value due to the
common ion effect. It decreases with an increase of the pH value. Ettringite limits the
concentration of sulfate ion on the long-term scale and the influence of the pH value is very
small. The average pore solution concentrations of calcium and sulfate in pure Portland

§ 2. Literature review 28
Marija Đuroković PhD Thesis
cement pastes obtained by statistical evaluation of data from numerous researches are given in
Figure 2.15
Figure 2.15. Average pore solution concentrations of calcium and sulfate of pure Portland
cement pastes after Vollpracht 139
Concentrations of silicon and aluminium are below 1 mmol / L and slightly increase with the
pH value. The addition of granulated blast furnace slag (further: GBFS), slightly lowers the
alkali concentrations and pH values of pore solutions. The stronger influence on alkalinity has
been observed for the higher GBFS amounts (>75%). The effect on the other ions is relatively
small.
Investigation of the trace elements in the pore solution is less often encountered in the
literature. Kempel et al. have reported the total content of the selected trace elements (lithium,
barium, strontium, iron, aluminium and silicon) in hydrated and carbonated Portland cement
pastes.147 The research of Díez et al. on immobilization of cadmium in the Portland cement
paste has shown a low concentration of cadmium in the pore solution.59 Vollpracht et al. have
investigated development of the concentrations of selected elements (antimony, barium,
chromium, lead, molybdenum and vanadium) in pore solutions of Portland cement pastes
exposed to leaching throughout a 28 days period.148 These researches were mainly focused on
mechanisms and places of the trace elements binding and less or not at all to deleterious
processes in Portland cement pastes.
§ 2. Literature review 29
Marija Đuroković PhD Thesis
2.7. Portland cement production
2.7.1. Production process
Portland cement is manufactured in a series of operations using one of four available process
routes:
• wet process;
• semi dry process;
• semi wet process;
• dry process.148
The principal difference between the four routes is the raw material preparation. In the dry
and semi dry processes, the raw materials are dried and ground together in defined and
controlled proportions to form a flowable powder. The slurry is created from the raw
materials in the wet process and the semi wet process. The resulting materials are called raw
meal (dry and semi dry process) or raw slurry (wet or semi wet process). The dry process is
favourable since it is more energy efficient because it does not require energy for evaporation
of water from the raw slurry. Only about 2.5 % of European production in 2007 originated
from the wet process kilns and around 7.5 % from semi dry/semi wet processes. The
remainder, around 90 %, accounts for the dry processes.148 The following sub-processes are
common to all process types:
• quarrying, raw materials storage and preparation;
• fuel storage and preparation;
• control and preparation of waste materials used as raw materials and/or fuels;
• clinker burning with emission reduction;
• cement grinding;
• cement dispatch.
The flow diagram of the dry process of the Portland cement production is shown in Figure
2.16.148

§ 2. Literature review 30
Marija Đuroković PhD Thesis
Figure 2.16. General overview of the cement manufacturing process (dry process) after BAT
reference document for the production of cement, lime and magnesium oxide148
Since calcium silicates are the primary constituents of Portland cement, the raw materials
used for Portland cement production must provide calcium and silica for its productions.
Cheap, naturally occurring materials such as limestone, chalk, marl, dolomite, clay and sand
are commonly used materials. Sometimes addition of bauxite or iron ore to the raw materials
are necessary to assure the required levels of aluminium or iron for the formation of calcium
aluminates or aluminoferrites.5,13
The raw meal (or raw slurry) is heated at about 1450°C in a cement kiln to produce black
nodular material, Portland cement clinker. The combustion of fossil fuels assures the required
high inputs of thermal energy necessary for Portland cement clinker production. Non fossil
fuels derived from industrial sources such as tyres, waste oil, plastics, solvents and many
more are commonly used as substitute fuels today.148 Finally, Portland cement clinker is
underground with a few percentages of gypsum to produce Portland cement. It is dispatched
packed in bags or as a bulk by road, rail or ships.

§ 2. Literature review 31
Marija Đuroković PhD Thesis
2.7.2. CO2 emission in Portland cement production
The key sources of CO2 emissions in cement industry are emissions from decarbonatization,
burning fuels and indirect emissions (electricity consumption and transport).149 The
contribution of different sources of emission to the overall CO2 emission from the Portland
cement production is reported in Figure 2.17. Over 50% of all CO2 emissions from cement
production accounts for decarbonatization, the simple transformation of limestone to lime:
CaCO3 (s) CaO (s) + CO2 (g) .
(limestone) (lime) (carbon dioxide)
Figure 2.17. Contribution of different sources to CO2 emissions from Portland cement
production149
The reduction of released CO2 due to reduced thermal energy requirements by more efficient
technology or by usage of alternative fuels is the traditional approach. It has limitations and
does not radically change the chemical composition and the required quantity of decarbonated
CaCO3.
The reduction of CO2 emission due to decarbonatization is the most challenging task in
Portland cement production. A typical Portland cement contains around 67% of calcium
expressed as oxide (CaO).5 If all calcium comes from limestone, production of one ton of
Portland cement clinker requires roughly 1.2 tonnes of limestone which releases about 526 kg
of CO2.150
Traditional approaches for decarbonated CO2 reduction are limited to improvement of
hydraulic activity of Portland cement clinker and to production of blended Portland cement
Indirect emissions ; 10%
Decarbonation; 54%
Fuel consumption;
39%

§ 2. Literature review 32
Marija Đuroković PhD Thesis
types.2 The addition of some elements such as fluoride (F-) in a minor percentage to the raw
meal may improve the hydraulic activity of Portland cement clinker and can thus enable the
reduction of total cement content in concrete. In blended Portland cement a part of Portland
cement clinker is substituted by supplementary cementitious materials (further: SCMs). The
production of blended cements is a very well established approach to reduce the CO2 footprint
of Portland cement. Different SCMs such as natural pozzolana, fly ash, granulated blast
furnace slag, silica fume or finely ground limestone are traditionally used.2 Usage of SCMs is
based on numerous scientific investigations which enabled finding of materials that can give
similar properties to cement but have a much lower amount of embodied CO2. Blended
Portland cement are a well established solution recognized by the European standard for
commonly use Portland cements.151
Currently the average clinker content in European cements is less than 80% and estimation
is that it can be reduced to 70%.149 The implementation of traditional solutions is not
sufficient to reduce even half the total required CO2.150 Further reduction requires more
radical solution such as a reduction in the CaO content of the Portland cement.2,152
The CO2 footprint of clinker phases decrease in order C3S > C3A > C2S > C4AF. CO2
emissions for clinker phases are reported in Table 2.4.150
Table 2.4. CO2 emissions from raw materials (RM), fuel and total CO2 emission for four main
Portland cement clinker phases. The mass of CO2 is per ton of clinker.
Clinker phase m(RM CO2)/ kg m(fuel CO2) /kg m(sum CO2 )/ kg
C3S 578 282 860
C2S 511 204 715
C3A 489 298 787
C4AF 362 208 570
free lime 785 486 1271
RM CO2 = emission from raw materials, decarbonatization
Fuel CO2 = emission from combustion of fuel
The production of Portland cement clinker and Portland cement containing more C2S than
C3S is possible but not favourable. Belite Portland cements achieve significantly lower early
strengths which do not correspond to the modern requirement for quick construction work
§ 2. Literature review 33
Marija Đuroković PhD Thesis
progress. The usage of larger quantities of SCMs as clinker substitute in belite cement would
be impossible due to the decreasing impact of some SCMs to early strength.152
Alternative to production of belite clinker is sintering clinkers using chemical systems based
on sulfoaluminate, sulfoferrite and fluoroaluminate.2
2.8. Calcium sulfoaluminate cement
Calcium sulfoaluminate cement (further: CSA cement) is characterized by high amounts of
tetracalcium trialuminate sulfate (C4A3�̅) also known as Ye’elimite or Klein’s salt. It
originates from China where it was developed by China Building Materials Academy in the
1970s.153,154 Other principal phases in the CSA clinker are C2S and C�̅H2 and some minor
phases such as CA, C3A, C4AF, mayenite and gehlenite.155-157 CSA cements have a very
variable phase composition. Ye’elimite crystallizes as the sodalite type structure with the
general composition Na8[Al6Si6O24]. Initially, three polymorphs (cubic, tetragonal and
orthorhombic) have been reported for pure Ye’elimite.158-161 The recent researches have
confirmed that the orthorhombic structure is the most stable one and that the cubic structure
can exist at room temperature only if dopant ions are available to stabilize it.162,163
Incorporation of different ions in the crystal structure of the solid solution leads to formation
of pseudo cubic or cubic Ye’elimite.164,165
In Europe, there is no standard for Ye’elimite containing cements thus, they can be
classified into three different groups according to their C4A3�̅ content:
• calcium sulfoaluminate cements with high Ye’elimite content;
• belite calcium sulfoaluminate cements;
• alite calcium sulfoaluminate cements.166
Calcium sulfoaluminate cements with high C4A3�̅ content (above 50 %) are usually
prepared from CSA clinker with addition of calcium sulfate (typically from 10 % to 25 %).
The addition of calcium sulfate determines the properties of CSA cement, thus the source and
quantity have to be customized for the specific application.167
In belite calcium sulfoaluminate cements β-C2S is the main phase with abundance higher
than 40%. Ye’elimite content is moderate, up to 30 %.168 The main disadvantage of this
cement type is lower early strength due to slower belite hydration. Two different formulations
with different phase composition are possible within this group: iron–rich and aluminium–
rich belite CSA cement.169,170 Aluminium–rich CSA cement may contain C12A7 or CA phases

§ 2. Literature review 34
Marija Đuroković PhD Thesis
as main clinker phases, while in the iron–rich cement they are substituted by C4AF. It is
possible to produce belite CSA cement in which high temperature α–C2S is stabilized with
borax. This type of belite CSA cement shows significant improvement of early strengths.171
Alite CSA cements are characterized by the simultaneous presence of two major phases
C3S and C4A3�̅ in combination with other phases usually present in clinkers such as C2S and
C3A. It is very hard to produce this cement type since optimum temperatures for two major
phases are considerably different. It can be produced by addition of small amounts of
compounds such as calcium fluoride (CaF2), copper or titanium oxide (CuO or TiO2) to the
raw meal. The content of C4A3�̅ may be higher compared to C3S.168,172
Hydration of CSA cement is complicated, but the most important reactions are the
formation and transformation of ettringite. Ettringite is formed rapidly by hydration of C4A3�̅
according the following equations:
C4A3�̅ + 2 C�̅H2 + 34 H C6A���H32 + 2AH3 (in the absence of CH)
3C4A3�̅ + 2 C�̅H2 + 6 CH + 74 H 3 C6A���H32 (in the presence of CH). 155
If gypsum is absent the following reactions occur:
C4A3�̅ + 18 H 3 C4A�̅H12 + 2AH3
C6A���H32 3 C4A�̅H12 + 2 C�̅H2 + 16H.155
Hydration reaction of C2S, C4AF and other phases are the same as in Portland cement. The
main crystal phases formed by hydration of CSA cement are ettringite and monosulfate.
C-S-H formed by C2S hydration and aluminium hydroxide (AH3) produced by Ye’elimite
hydration are gel products.
The group of CSA cements are very attractive for research mainly due to reduced
environmental impact and some improved properties. Only one third of the CO2 mass released
by the production of C3S is released during production of C4A�̅H12 (around 220 kg t-1
compared to 860 kg t-1).166 The production temperature for CSA clinker is approximately
200 °C lower than that for the Portland cement clinker. Natural raw materials limestone,
bauxite, iron ores and gypsum are used to prepare the raw meal for CSA clinker production.
Various industrial by-products such as fly ash, blast furnace slag, red mud or phosphogypsum
may be used for raw meal preparation also.173-176 Ye’elimite containing clinkers are easier to
grind than Portland cement clinkers.

§ 2. Literature review 35
Marija Đuroković PhD Thesis
The usage of CSA cement in Europe is very limited due to the lack of standards and codes.
CSA cement cannot be used for preparation of structural concrete. It is mainly used in blends
with Portland cement for quick repairs, pre–cast products and floor concrete.166
2.9. Leaching
Hydration products in hydrated Portland cement paste are in dynamic equilibrium with the
pore solution, thus the ion composition of pore solution varies as hydration proceeds.107 When
hydrated Portland cement paste is exposed to chemically aggressive environment chemical
compositions of solid products and pore solution change, causing disruption and
re-establishment of equilibrium, disappearance of solid products or precipitation of new ones.
This can have adverse consequence on engineering properties of Portland cement paste
causing its degradation and finally resulting in reduced service life and poor durability.
Water is involved both in creation and destruction of the Portland cement paste. It is
crucial for different forms of physical or chemical deterioration such as crystallization of salts
in pores, frost action, acidic solution attack, sulfate attack, alkali – aggregate reaction or steel
corrosion.177 In these processes water serves as transport media for aggressive ions but itself
can also be a source of chemical degradation. Soft water containing a low concentration of
dissolved ions in contact with Portland cement paste induces decalcification.178,179 This
process is called leaching. A decrease of calcium and hydroxide ions in the pore solution
induces hydrolysis and leaching of the calcium containing hydration products.180,181 Solid
products are dissolved depending on their solubility. The susceptibility towards soft water
decreases in the order CH, AFm, AFt, C-S-H.182 Dissolution of portlandite reduces the pH
value of the pore solution and induces macro-porosity of the cement paste.181,183,184
Decalcification of the C-S-H gel gradually decrease C/S ratio and induces micro-
porosity.181,183,185 In the leached Portland cement paste, the secondary precipitation of AFm,
AFt and calcite appears.186,187 The increased porosity and permeability and loss of mechanical
strength are the key consequences in the structures exposed to leaching.185,188-190 Alkali metals
are readily leached but without adverse effect on the Portland cement paste.184 Leaching may
affect immobilization of the trace elements and their concentration in the pore solution,
especially on the long-term scale. The increased mobility of the trace elements may increase
the possible environmental risk.
Leaching appears in Portland cement pastes exposed to steam, fog, rainwater or
groundwater. 184 This is a significant issue for structures constantly exposed to soft or acid

§ 2. Literature review 36
Marija Đuroković PhD Thesis
waters such as dams, water tanks, pipes and especially to nuclear waste storage.185 It is also
very important for the waste solidification and stabilization by Portland cement.191
It is not easy to develop methods to perform leaching experiments in such a way that
conditions normally present in real life are simulated in a laboratory. Immersion tests with
mineralized or deionized water are the most frequently used methods in leaching
research.8,15,16 Methods performed on ground material have been developed too.192,193
Procedures in which leaching is accelerated with a strongly acidified solution (such as
ammonium nitrate), organic acids or by applying an electrical potential are also used in
leaching process investigations.194,195,196,197
.

§ 3. Materials and methods 37
Marija Đuroković PhD Thesis
§ 3. MATERIALS AND METHODS
3.1. Introduction
The methods, procedures and results on characterization of starting materials (Portland
cements, CSA cement, deionised water), cement pastes and pore solutions are described in
this section.
Most of the analysis were carried out in the Institute IGH d.d., Zagreb, Department for
materials and structures, Laboratory for binders and ecology and Laboratory for materials.
The X-ray powder diffraction (XRD) and in-situ XRD were carried out in Pliva Croatia d.o.o.,
Research and Development Department. SEM analyses were carried out in the Institute Ruđer
Bošković, Zagreb, Division of Materials Physics, Laboratory for Molecular Physics and
Synthesis of New Materials.
3.2. Materials and methods
The research was performed in accordance with the research plan comprising sample
designation, determination of properties and hydration ages. The research plan is given in
Table 3.1.
The standard methods commonly applied to determine properties of Portland cement,
mortar or concrete were mainly applied within this research with some minor modifications
mainly concerning sample preparation or hydration ages. These methods as well as non-
standardised methods are well known with established accuracy and precision. The methods
were also applied to the CSA cement since there are no corresponding standards for this
cement type.

§ 3. Materials and methods 38
Marija Đuroković PhD Thesis
Table 3.1. The research plan
Sample designation Hydration age Properties
CEM I
anhydrous chemical composition, phase
composition, composition* CEM III
CSA cement
deionized water -
electric conductivity, pH,
trace elements, calcium and
magnesium, hardness, TDS
CEM I – CP**
days: 2, 7, 28, 56, 90,
180, 360
strength (flexural,
compressive), secant
modulus of elasticity, phase
composition, chemical
composition, dimensional
stability, mass loss
CEM III – CP
CSA cement – CP
CEM I – CP 28 days (air voids
content only)
365 days
water absorption due to
capillary action,
permeability to gasses,
SEM, air voids content
CEM III – CP
CSA cement – CP
CEM I – CP hours: 1-48
days: 7,14,28 in – situ phase composition CEM III – CP
CSA cement – CP
CEM I – PS***
days: 2, 7, 28, 56, 90,
180, 360
pH, chemical composition,
trace elements concentration CEM III – PS
CSA cement – PS
* only for CEM I and CEM III ** CP - cement paste *** PS – pore solution

§ 3. Materials and methods 39
Marija Đuroković PhD Thesis
3.2.1. Cement
Portland cement CEM I 42.5R (further: CEM I) according to the standard HRN EN 197-
1:2012 produced by Cemex Croatia, Portland blast furnace cement CEM III/A 52.5N SR LH
(further: CEM III) according to the same standard produced by Schwenk Zement KG
Germany and CSA cement Alipre® produced by Italcementi were used.151
The following criteria were used for the selection of cements:
• composition of hydration products in hydrated cement paste;
• CO2 emissions per ton of anhydrous cement;
• content of the selected trace elements levels.
3.2.1.1. Cement bulk composition
Standard wet chemistry methods described in the standard HRN EN 196-2:2013 were applied
to determine the major (CaO, SiO2, Al2O3, Fe2O3) and minor oxides (MgO, SO3, Na2O, K2O,
MnO, CO2 and inclusion of Cl).198 The loss on ignition (further: LOI) and insoluble residue
were also included within the chemical analysis. The standard method applied for
determination of each property is reported in Table 3.2.

§ 3. Materials and methods 40
Marija Đuroković PhD Thesis
Table 3.2. Methods applied to determine chemical compostion of CEM I, CEM III and CSA
cement
Property Article of standard
HRN EN 196-2:2013
Loss on ignition
(950 ± 50)°C 4.4.1
Insoluble residue in HCl and Na2CO3 4.4.3
Insoluble residue in HCl and KOH 4.4.4
CaO 4.4.5
MgO 4.5.15
SiO2 4.5.6
4.5.8
Al2O3 4.5.11
Fe2O3 4.5.10
SO3 4.4.2
S2- 4.4.5
Cl 4.5.16
CO2 4.5.17
MnO 4.4.6
K2O 4.5.19.4.1
Na2O 4.5.19.4.1
Na2Oequvivalent 4.5.19.6.2
Term trace element in analytical chemistry is used for a element with an average
concentration below 100 mg kg-1 ppm.200 In the cement chemistry it is applied to all elements
that do not reach concentrations in the percentage range.
Levels of the selected trace elements (As, Cd, Co, Cr, Cu, Hg, Ni, Pb, Sb, V and Zn) in
anhydrous CEM I, CEM III and CSA cement were measured by ICP-MS (Agilent 7800,
Agilent, Santa Clara, CA, USA). Anhydrous cement (0.2000 ± 0.0001) g was subjected to
digestion (ETHOS UP Milestone laboratory microwave) using the mixture of concentrated
nitric (2.0 ± 0.1 mL), hydrochloric (6.0 ± 0.1 mL), phosphoric (1.0 ± 0.1 mL) and
tetraflouroboric acid (1.0 ± 0.1mL). The acid mixture actually contains aqua regia with the
addition of tetraflouroboric acid to dissolve silicates, aluminium and iron oxide.201 The

§ 3. Materials and methods 41
Marija Đuroković PhD Thesis
digestion program included 20 min heating to 220 °C and 15 min at 220 °C. The applied
power of the digestion device was 1800 W. The digestion temperature, time program and acid
mixture were adjusted to ensure complete decomposition of the samples and provide a clear
solution.
The whole fully digested volume from the pressure vessel was transferred to a volumetric
flask and filled up with ultra-pure water to 50.0 mL volume. The samples were fully digested
without any solid residue. The digested cement samples were analysed on the ICP-MS device
with collision cell and using He mode to minimize the possible matrix and isobaric
interferences. Additionally, the high matrix introduction plasma mode with 1:8 dilutions was
used.
Ultrapure water taken through the entire sample preparation including digestion was used
as method blank. The calibration curves were created using a method blank and seven
calibration solutions. Composition of seven calibration solutions and QC solutions are
reported in Table 3.3.
Table 3.3. Composition of calibration solutions and QC solutions used for determination of
the trace elements in CEM I, CEM III, CSA cement by ICP-MS
Element Concentration* / µg mL-1
Cal.1 Cal.2 Cal.3 Cal.4 Cal.5 Cal.6 Cal.7 QC
As, Cd,
Co, Cr,
Cu, Hg,
Ni, Pb,
Sb, V,
Zn
1.0 5.0 10.0 50.0 100.0 250.0 500.0 50.0
Hg 0.01 0.02 0.5 1.0 1.5 2.0 5.0 1.0
*Concentration of each specified element
All calibration solutions were prepared by mixing stock solution A and stock solution C, nitric
acid and hydrochloric acid. Ultra-pure water was used to fill up to total volume. Steps for
calibration solution and QC solutions preparation are reported in Table 3.4.

§ 3. Materials and methods 42
Marija Đuroković PhD Thesis
Table 3.4. Volumes of calibration solutions for the determination of trace elements in CEM I,
CEM III and CSA cement by ICP-MS
Calibration
solution
Stock
solution A
Stock
solution C HNO3 HCl
Inter.
Stand. Sol.1 Total volume
Cal.1 50 µL 25 µL 0.25 mL 0.30 mL 250 µL 50 mL
Cal.2 250 µL 50 µL 0.25 mL 0.30 mL 250 µL 50 mL
Cal.3 0.5 mL 1.25 mL 0.25 mL 0.30 mL 250 µL 50 mL
Cal.4 2.5 mL 2.50 mL 0.25 mL 0.30 mL 250 µL 50 mL
Cal.5 5 mL 3.75 mL 0.25 mL 0.30 mL 250 µL 50 mL
Cal.6 1.25 mL 5.0 mL 0.25 mL 0.30 mL 250 µL 50 mL
Cal.7 2.50 mL 12.5 mL 0.25 mL 0.30 mL 250 µL 50 mL
QC 2.5 mL1 - 0.25 mL 0.30 mL 250 µL 50 mL 1Stock solution A' was used
Stock solution A, stock solution A’ and stock solution C were prepared by mixing standard
solution, nitric acid and hydrochloric acid. Ultra-pure water was used to fill up to total
volume. Steps for stock solutions preparation are reported in Table 3.5.
Table 3.5. Volumes of components for stock A, stock A’, stock B and stock C preparation
Stock
solution
Standard
solution 1
Standard
solution 2
Standard
solution 3 HNO3 HCl
Stock
solution
A
Total
volume
A 5 mL - - 0.25 mL 0.30 mL - 50 mL
B - - - 0.25 mL 0.30 mL 0.5 mL 50 mL
A' - 5 mL - 0.25 mL 0.30 mL - 50 mL
C - - 0.1 mL 0.25 mL 0.30 mL - 50 mL
The equal portions of internal standard solution were added to method blank, calibration
solutions, QC solutions and sample solution. For each of the analysed elements the
appropriate internal standard was selected (see Table 3.6).

§ 3. Materials and methods 43
Marija Đuroković PhD Thesis
Table 3.6. Elements and internal standards used for ICP-MS determination
Element Internal standard
Limit of
determination /
µg L-1
As Ge72 0.030
Cd In115 0.006
Co Sc45 0.008
Cr Sc45 0.056
Cu Sc45 0.203
Hg Bi209 0.009
Ni Sc45 0.042
Pb Bi209 0.080
Sb In115 0.005
V Sc45 0.020
Zn Ge72 1.06
Ca Sc45 0.013 mg L-1
Mg Sc45 0.003 mg L-1
The method blank, the calibration verification standard and QC solutions were used for the
quality control during batch analysis. All samples, calibration solutions, method blank,
calibration verification standard and QC solution were measured in triplicate and the final
result was given as an average. The detection limit for each element was calculated from the
average of ten-time repeated blank analysis plus the standard deviation. The sensitivity data,
the resolution/axis data and the lens parameters were checked by the tuning before the batch
with tune solution. The clear sampler and skimmer cone were used for each batch analysis.
The operating conditions of the instrument are reported in Table 3.7.

§ 3. Materials and methods 44
Marija Đuroković PhD Thesis
Table 3.7. Operating parameters for Agilent 7800 for CEM I, CEM III and CSA cement
analysis
Parameter Value
Plasma mode HMI
RF forward power / W 1600
Sampling depth / mm 10
Carrier gas flow / L min-1 0.33
Spray chamber temperature / °C 2
Extraction lens 1 / V 0
Kinetic energy discriminator / V 5
He cell gas flow / mL min-1 5
3.2.1.2. Cement composition
The composition of Portland cement is one of two criteria (the second is based on
performance criteria) commonly used to classify cements. The permitted cement composition
is defined within specifications given in a relevant standard. The different cement standards
are used worldwide but two major contributions to the cement classification has been done in
Europe by European Committee for Standardization (CEN) and in the USA through the
American Society for Testing and Materials (ASTM). The supporting standards for test
methods and assessment of conformity are also included in the well-defined framework for
Portland cement. No corresponding standards for classification, testing or assessment of
conformity of CSA cement has been developed till today.
The compositions of CEM I and CEM III were determined by the standard wet chemistry
method according HRI CEN/TR 196-4:2017.202 Portland cements CEM I and CEM III have
different main constituents. The substitution of 35 ‒ 65 % of clinker with granulated blast
furnace slag in CEM III is allowed by standard HRN EN 197-1.1 The maximum allowed
clinker replacement for CEM I given by the same standard is 5 %. Composition of CEM I and
CEM III are reported in Table 3.9. Composition data declared by the manufacturer were used
for CSA cement since an appropriate method for determination of CSA cement composition
was not available.

§ 3. Materials and methods 45
Marija Đuroković PhD Thesis
3.2.1.3. Cement phase composition
Crucial cement properties such as 28 days strength are mainly determined by its phase
(mineralogic) composition.203
The diffraction patterns for CEM I, CEM III and CSA cement were recorded by the X-ray
powder diffraction method (further: PXRD) on a Panalytical X’pert MPD PRO diffractometer
in Bragg-Brentano geometry with CuKα1 radiation (λ = 1.5406 Å). The Rietveld method was
used for quantitative phase analysis using the Panalytical HighScore Software Suite.204
3.2.2. Deionised water
Dissolved ions in water can be determined by a set of different analytical methods. The
overall concentration of dissolved ions can be estimated by measuring at least one of the three
so called sum parameters: electric conductivity, total dissolved solids (further: TDS) or ionic
strength. These parameters depend on concentration of all dissolved ions present in water and
are related to each other.
The electric conductivity of water is measure of the ability of water to conduct electricity.
It depends on total concentration, charge and mobility of the dissolved ions and on
temperature of measurment.205 Total dissolved solids is the portion of total solids in a water
sample that passes through filter with a normal pore size of 2.0 µm.206 It is a sum of dissolved
cations and anions. The following principal cations: Na+, Ca2+, K+, Mg2+ and anions: Cl-,
SO42-, CO3
2-, HCO3- and to lesser extent NO3
-, B- Fe3+, Mn2+ and F- are included in TDS.
Water hardness was originaly used as a measure of the capacity of water to precipitate
soap.207 Nowdays total hardness is defined as the sum of dissolved calcium and magnesium,
since soap is mainly precipitated with these two ions.
The amount of the trace metals in the water is usually determined by the ICP-MS method.
There is no scientific classification of water according to dissolved ions concentration. The
commonly used description classification is given in Table 3.8.

§ 3. Materials and methods 46
Marija Đuroković PhD Thesis
Table 3.8. Classification of water according to the concentration of dissolved ions
TDS /
mg kg-1 Electric conductivity / µS cm-1
Hardness
as CaCO3 mg L-1 Classification
0 – 70 0 – 140
0 - 60
very soft
70 - 150 140 – 300 soft
150 – 250 300 – 500 slightly hard
250 – 320 500 -640 61 – 120 moderately hard
320 - 420 640 – 840 121 -180 hard
> 420 > 840 > 180 very hard
Deionised water was prepared by Laboratory for binders and ecology by water purification
system (Direct Q3 UV, Merck Millipore, Germany).
The concentration of the selected trace elements (As, Cd, Co, Cr, Cu, Hg, Ni, Pb, Sb, V
and Zn), calcium (Ca) and magnesium (Mg) in deionised water was measured by ICP-MS
(Agilent 7800, Agilent, Santa Clara, CA, USA). The standard procedure according HRN EN
ISO 17294-2:2016 without previous digestion was applied.208 Water sample was stabilized
with addition of nitric acid and hydrochloric acid. The same acids were added to method
blank, QC solutions and calibration solutions to minimize matrix effect. The method blank
and five calibration solutions were used for the preparation of the calibration curve. Destilled
deionized water taken through the entire sample preparation was used as method blank.
Composition of five calibration solutions and QC solutions are reported in Table 3.9.

§ 3. Materials and methods 47
Marija Đuroković PhD Thesis
Table 3.9. Composition of calibration and QC solutions for trace elements, calcium and
magnesium determination in deionised water by ICP-MS
Element Concentration* / µg mL-1
Cal.1 Cal.2 Cal.3 Cal.4 Cal.5 QC
As, Cd, Co,
Cr, Cu, Hg,
Ni, Pb, Sb,
V, Zn
0.1 1.0 10 50 100 30
Hg 0.02 0.5 1 1.5 2 1.5
Concentration* / mg mL-1
Ca, Mg 0.01 0.1 1 5 10 3
*Concentration of each specified element
All calibration solutions were prepared by mixing stock solution A, stock solution B, nitric
acid, hydrochloric acid and internal standard solution except for mercury for which stock
solution C was used. Destilled deionized water was used to fill up to total volume. Steps for
calibration solution and QC solutions preparation are reported in Table 3.10 and Table 3.11.
Table 3.10. Volumes of components for trace elements (except Hg), calcium and
magnesium determination in deionised water by ICP-MS
Calibration
solution
Stock
solution A
Stock
solution B HNO3 HCl
Inter. Stand.
Sol. Total volume
Cal.1 - 0.5 mL 0.25 mL 0.30 mL 250 µL 50 mL
Cal.2 - 5 mL 0.25 mL 0.30 mL 250 µL 50 mL
Cal.3 0.5 mL - 0.25 mL 0.30 mL 250 µL 50 mL
Cal.4 2.5 mL - 0.25 mL 0.30 mL 250 µL 50 mL
Cal.5 5 mL - 0.25 mL 0.30 mL 250 µL 50 mL
QC 1.5 mL1 - 0.25 mL 0.30 mL 250 µL 50 mL 1Stock solution A' was used

§ 3. Materials and methods 48
Marija Đuroković PhD Thesis
Table 3.11. Volumes of components for Hg determination in deionised water by ICP-MS
Calibration
solution
Stock
solution C HNO3 HCl
Inter.
Stand. Sol. Total volume
Cal.1 0.05 mL 0.25 mL 0.30 mL 250 µL 50 mL
Cal.2 1.25 mL 0.25 mL 0.30 mL 250 µL 50 mL
Cal.3 2.50 mL 0.25 mL 0.30 mL 250 µL 50 mL
Cal.4 3.75 mL 0.25 mL 0.30 mL 250 µL 50 mL
Cal.5 5.00 mL 0.25 mL 0.30 mL 250 µL 50 mL
QC 3.75 mL1 0.25 mL 0.30 mL 250 µL 50 mL
Stock solution A, stock solution B, stock solution A' and stock solution C were prepared by
mixing standard solution, nitric acid and hydrochloric acid. Destilled deionized water was
used to fill up to total volume. Steps of stock solutions preparation are reported in Table 3.5.
The equal portions of internal standard solution were added to method blank and sample
solution. For each of the analyzed elements the appropriate internal standard was selected (see
Table 3.6)
The method blank, the calibration verification standard and QC solutions were used for the
quality control during batch analysis. All samples, calibration solutions, method blank,
calibration verification standard and QC solution were measured in triplicate and the final
result was given as an average.
The sensitivity data, the resolution/axis data and the lens parameters were checked by the
tuning before the batch with tune solution. The clear sampler and skimmer cone were used for
each batch analysis. The operating conditions of the instrument are reported in table 3.12.
Table 3.12. Operating parameters for Agilent 7800
Parameter Value Plasma mode General purpose
RF forward power / W 1550 Sampling depth / mm 10
Carrier gas flow / L min-1 0.99 Spray chamber temperature / °C 2
Extraction lens 1 / V 0 Kinetic energy discriminator /
V 5
He cell gas flow / mL min-1 4.5

§ 3. Materials and methods 49
Marija Đuroković PhD Thesis
The electric conductivity and pH of deionised water were measured by conductivity and pH
meter (MPC 227, Mettler Toledo, Greifensee, Switzerland). Hardness of deionised water
expressed as equivalent CaCO3 in mgL-1 was calculated from determined calcium and
magnesium concentration using the formula:
Hardness = 2.497 [Ca,mg L-1] + 4.118 [Mg,mg L-1]
Total dissolved solids were determined by standard procedure given in HRN EN
15216:2008.209
3.3. Sample preparation
3.3.1. Cement paste preparation
The sample preparation included mixing of cement and water to produce cement paste. The
preparation took place in the room with the maintained temperature of (20 ± 2 )°C and
relative humidity of not less than 50%. Cement pastes were prepared with the water to cement
ratio of 0.5 using the standard mortar mixer given in Figure 3.1 (ToniMix, Toni Technik
GmbH, Berlin, Germany) and the standard procedure with the modification in cement
content: 1000 g of cement was used and amount of water was adjusted to get w/c of 0.5.210
Deionised water used as leaching agent was used for cement paste preparation. Used cement,
water, mixer and moulds were at the temperature (20 ± 2)°C.
Immediately after the mixing procedure, the prepared cement pastes were transferred to
prismatic moulds or cylindric moulds or holders used for in - situ XRD measurements.
Figure 3.1 Standard mortar mixer

§ 3. Materials and methods 50
Marija Đuroković PhD Thesis
3.3.2. Prismatic samples compaction and curing
The standard moulds were used to prepare samples dimensions (40 × 40 × 160) mm.210 The
prepared cement pastes were transferred to moulds without undue compaction or vibration,
and the voids were removed by gently tapping. The excess of paste was removed by gentle
sawing motion with a straight-edged ruler. The filled standard mould is shown in Figure 3.2.
Figure 3.2 Filled standard prismatic moulds
The same moulds type but provided with a hole at the centre of each end face were used to
prepare prismatic samples for determination of volume stability. The stainless-steel stub was
fitted in the hole and embedded into the sample. This type of moulds is shown in Figure 3.3.
Figure 3.3 Moulds for preparation of samples for determination of volume stability
stainless – steel
stub

§ 3. Materials and methods 51
Marija Đuroković PhD Thesis
The filled prismatic moulds were stored in the moist air cabinet (L.T. d.o.o, Šentjernej,
Slovenia) at the temperature of 20.0 ± 1.0 °C and the relative humidity not less than 90% for
24 hours. Three prismatic samples dimensions (40 × 40 × 160) mm were prepared from each
mould. The prepared samples were exposed to the tank leaching test.
They were cured in plastic tanks filled with deionised water at a temperature of 20.0 ± 2.0 °C
after demoulding. Volume of water was adjusted to provide the ratio of the surface of samples
and the volume of water of 1:10. The plastic tanks with stored cement pastes were covered
with plastic cover to prevent evaporation. No additional protection against carbon dioxide
from air was used. Curing water was changed three times a week (Monday, Wednesday and
Friday) to provide the aggressive attack of water media during the hydration period. Cement
pastes were cured for 2, 7, 28, 56, 90, 180 and 365 days. The schematic description of tank
leaching test is shown in Figure 3.4.
Figure 3.4 Schematic description of tank leaching test
The cured prismatic samples were submitted for the further tests: determination of flexural
and compressive strength, secant modulus of elasticity, dimensional stability and mass loss.
XRD patterns were collected on the powder collected from prismatic samples. They were also
used for the chemical analysis of hydrated cement paste and pore solutions. The tests were
carried out at the particular hydration age.
3.3.3. Cylindric samples compaction and curing
Cement pastes prepared according to the procedure given in section 3.3.1 and the cylindric
mould shown in Figure 3.5 were used to prepare cylindric samples (100 × 200) mm
dimensions. The mould was filled by paste without undue compaction or vibration and the
voids were removed by gentle tapping. The excess of paste was removed by a gentle sawing
motion with a straight-edged ruler.

§ 3. Materials and methods 52
Marija Đuroković PhD Thesis
Figure 3.5 Cylindric mould (100 × 200) mm dimensions
After the compaction, cylindrical samples were cured for 24 hours at temperature
(20.0 ± 1.0) °C and the relative humidity not less than 90%. After demoulding, samples were
exposed to the tank leaching test under the same conditions applied to prismatic samples and
described in section 3.3.2. Two cylindrical samples were prepared for every cement type. The
cured cylindrical samples were submitted for the further tests: determination of water
absorption coefficient due to capillary action, determination of permeability to gasses,
determination of air voids content and SEM determination. The tests were carried out after
365 days hydration period. The suitable sub-samples were prepared from the cylindrical
sample. The preparation of sub-samples is shown in Figure 3.6. The concrete saw was used to
cut off sub-samples from the cylindrical sample.
Figure 3.6 Preparation of sub-samples from the cylindrical sample

§ 3. Materials and methods 53
Marija Đuroković PhD Thesis
3.3.4. Obtaining pore solution and prime characterisation
Pore solution was expelled from the prismatic samples using the apparatus shown in Figures
3.7 and 3.8. It consisted of the two steel bodies with the two inner concentric cylinders where
the testing sample was placed.
Figure 3.7 Schematic diagram of pore solution expression apparatus
1 – piston; 2,4 – inner concentric cylinder; 3 sample; 5 – drain tube; 6 - base
Figure 3.8 Parts of pore solution expression apparatus
1 – piston; 2,4 – inner concentric cylinder; 3 sample; 5 – drain tube; 6 – base
The prismatic sample was removed from the tap water at the particular hydration age and split
into two cubes using the standard strength testing machine (Toni NORM, Toni Technik
1
5
4 2
6

§ 3. Materials and methods 54
Marija Đuroković PhD Thesis
GmbH, Berlin, Germany).210 Two cubes were placed inside two inner concentric cylinders of
apparatus and were followed by a piston to which pressure of 150 MP and gain power of 0.5
kN mm-2 was applied. The porous steel lamina was fitted on the bottom of the lower steel
body just under the spiral recess connected with the drain tube which drained the fluid into the
laboratory dish. No additional grinding or the particle size reduction was applied. The pore
solution expression is shown on Figure 3.9.
Figure 3.9 Pore solution expression
The pH value of expelled pore solution was measured by a pH meter (MPC 227, Mettler
Toledo, Greifensee, Switzerland) immediately after it was expelled from the cement paste.
Obtained pore solution was stored in sealed plastic test tube to prevent reaction with
atmospheric carbon dioxide and submitted for further determination.
Position in press
5 drain tube

§ 3. Materials and methods 55
Marija Đuroković PhD Thesis
3.4. Testing methods
3.4.1. Determination of strength and preparation of samples for chemical analysis
Mechanical strength of cement is the key property for its structural use and is significant from
the durability viewpoint. The flexural and compressive strength was determined on prismatic
samples according to the procedure given in standard HRN EN 196-1:2016.210
The samples were removed from the water not more than 15 minutes before the test was
carried out. The standard strength testing machine (Toni NORM, Toni Technik, Berlin,
Germany) was used for strength determination (Figure 3.10). The flexural strength was
calculated as the arithmetic mean of the three individual results and compressive of the six
individual results.
Cubes left after the compressive strength determination were immediately gently ground
by hand in agate mortar and homogenised. The samples for XRD measurements and chemical
analysis of cement pastes were prepared by the quartering method.
Figure 3.10 The standard strength testing machine
3.4.2. Determination of secant modulus of elasticity
The secant modulus of elasticity in the compression was determined in accordance with the
standard HRN EN 12390-13:2013 usually applied for the hardened concrete samples.211 The
test sample was loaded under axial compression, the stresses and strains were recorded and
the slope of the secant to the stress-strain curve was determined after three loading cycles.
The secant moduls of elasticity in compression corresponds to the secant slope.
The testing machine according to the standard HRN EN 12390-13:2013 used for
determination (Toni NORM with deformation measurement device, Toni Technik GmbH,
Berlin, Germany) is shown in Figure 3.11. The measured compressive strength was used to

§ 3. Materials and methods 56
Marija Đuroković PhD Thesis
define the stress levels of the test cycle for the determination of secant modulus of elasticity.
The secant modulus of elasticity was calculated as the arithmetic mean of the three individual
results.
Figure 3.11. Determination of secant moduls of elasticity
3.4.3. Powder X-ray diffraction
The phase composition of hydrated cement paste was determined by powder X-ray diffraction
(further: PXRD). Two different measurement principles were applied:
• in–situ measurements;
• measurements on powder collected form prismatic samples.
The diffraction patterns were recorded on Panalytical X’pert MPD PRO diffractometer in
Bragg-Brentano geometry with CuKα1 radiation (λ = 1.5406 Å) with voltage 45 kV and
electric current 40 mA. The diffractograms were collected in the 2θ range 9° to 65°. The used
step was 0.039° 2θ with integration time of 200 s for each step. Time necessary for collection
of one diffractogram was 10.5 minutes.
The in-situ diffractograms were collected in period 1 to 48 hours from the start of
hydration for selected time periods. They were also performed for 7, 14 and 28 days hydration
period. Metal holders with a 27 cm diameter slot and 1.5 mm depth, were used to collect
diffraction patterns. The lower part of the holder was filled with the prepared cement paste,
gently aligned with edges and covered with Kapton foil and covered with the upper part of the
holder. Holder with its parts is shown on Figure 3.12. Kapton foil was removed after the first
measurement was finished due to hardening of the cement paste. After 48 hours, holders with

§ 3. Materials and methods 57
Marija Đuroković PhD Thesis
cement paste were stored in plastic vessels with regularly changed deionised water to assure
similar curing conditions as applied for the prismatic samples.
Figure 3.12. Metal holder for in–situ XRD measurements
The diffraction patterns were also collected on samples prepared after the compressive
strength determination using the same instrument and under the same measuring conditions.
3.4.4. Determination of chemical composition of cement paste
The cement paste composition was determined on powder samples prepared from cubic
samples left after the compressive strength determination. The analysis was performed
immediately afthe the sample preparation to avoid possible changes in bulk composition due
to proceeding hydration and carbonatization. The standard methods descibed in HRN EN 196-
2:2013 were applied to determine the next properties in hydrated cement paste: loss on
ignition, content of major oxides (CaO, SiO2, Al2O3, Fe2O3) and minor oxides (MgO, SO3,
Na2O, K2O, CO2). Detail list of methods applied for determination of each property is given
in Table 3.2.
3.4.5. Determination of chemical compostion of pore solution
The pH values were measured immediately after the expression and pH meter (Mettler Toledo
MPC 227). Expressed pore solutions were stored in sealed plastic test tubes to prevent
reaction with atmospheric carbon dioxide before further testing. The following properties
were determined in pore solutions: sodium (Na), potassium (K), calcium (Ca) and trace
elements (As, Cd, Co, Cr, Cu, Hg, Ni, Pb, Sb, V and Zn) concentration. The concentrations of
Na, K, Ca and trace elements were determined by the ICP-MS method using the same
instrument as for trace elements analysis in cement and deionised water.

§ 3. Materials and methods 58
Marija Đuroković PhD Thesis
A portion of 1.0 mL of pore solution was diluted to 50 mL volume by ultrapure water and
stabilized by addition of nitric acid and hydrochloric acid. The standard procedure denoted in
HRN EN ISO 17294-2:2016 and in detail described in article 3.2.2 was applied for further
analysis of pore solution composition.208 Calibration and QC solutions reported in Tables 3.9
to 3.11 were used to create calibration curves and perform analysis. Operating conditions of
the instrument are reported in Table 3.12.
3.4.6. Determination of dimensional stability
The method for determination of the dimensional stability in accordance with the standard
HRN EN 12617-4:2003, usually applied to grout, mortar or concrete, was applied to
determine the shrinkage and the expansion of the cement paste samples.212 The measurement
was carried on the prismatic moulds with the incorporated measurement studs made of
stainless steel. The instrument to measure the lengths of samples with accuracy of ± 0.001
mm and suitable fittings to receive the measurement stud was used. The instrument was
calibrated prior to each determination using the wood-lined rod made of invar metal 160 ± 1
mm in length. The instrument for determination of stability with the rod is shown in Figure
3.13.
Figure 3.13. Instrument for dimensional stability determination Each sample was marked using a waterproof felt tip-pen to ensure always the same position of
sample during the measurement. When the calibration rod or sample was rotated about its axis
during the measurement, a change less then ±0.001 mm was allowed. The sample was dabbed
with the moist cloth to remove excess water prior to the determination. The cleanliness and
fixity of the measurement studs were cheked before each measurement. The final
measurement result was caluculated as the arithmetic mean of the three individual results.
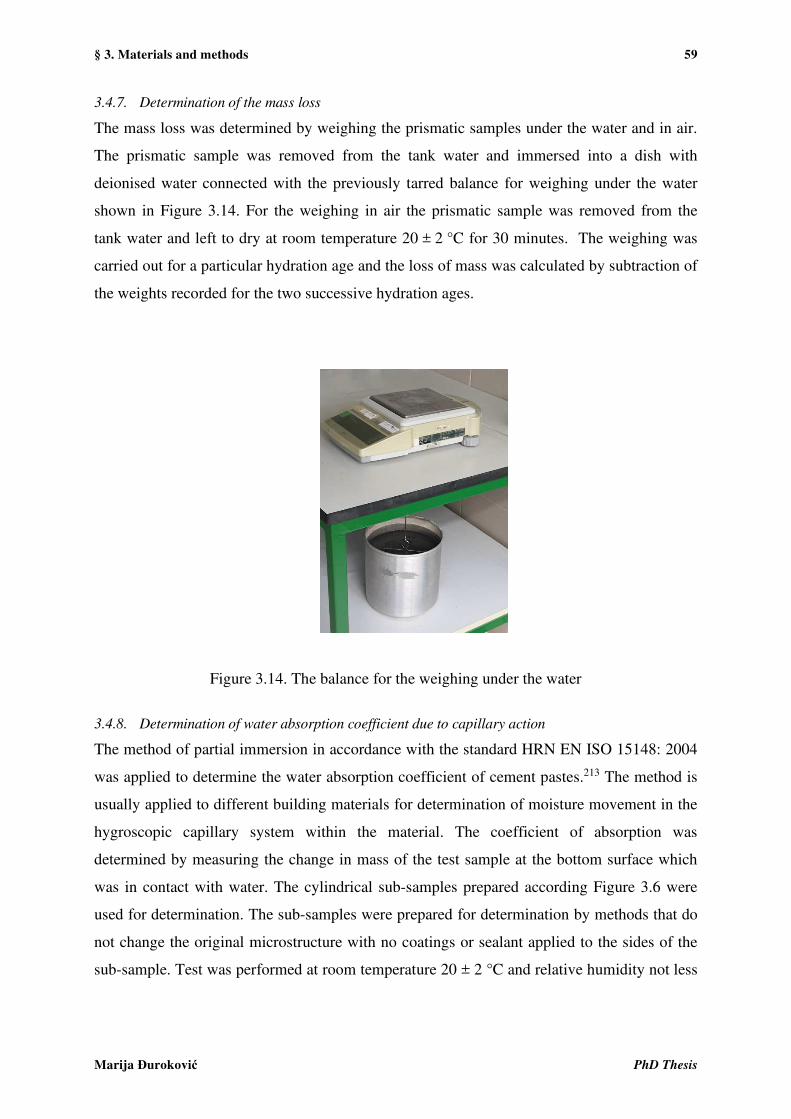
§ 3. Materials and methods 59
Marija Đuroković PhD Thesis
3.4.7. Determination of the mass loss
The mass loss was determined by weighing the prismatic samples under the water and in air.
The prismatic sample was removed from the tank water and immersed into a dish with
deionised water connected with the previously tarred balance for weighing under the water
shown in Figure 3.14. For the weighing in air the prismatic sample was removed from the
tank water and left to dry at room temperature 20 ± 2 °C for 30 minutes. The weighing was
carried out for a particular hydration age and the loss of mass was calculated by subtraction of
the weights recorded for the two successive hydration ages.
Figure 3.14. The balance for the weighing under the water
3.4.8. Determination of water absorption coefficient due to capillary action
The method of partial immersion in accordance with the standard HRN EN ISO 15148: 2004
was applied to determine the water absorption coefficient of cement pastes.213 The method is
usually applied to different building materials for determination of moisture movement in the
hygroscopic capillary system within the material. The coefficient of absorption was
determined by measuring the change in mass of the test sample at the bottom surface which
was in contact with water. The cylindrical sub-samples prepared according Figure 3.6 were
used for determination. The sub-samples were prepared for determination by methods that do
not change the original microstructure with no coatings or sealant applied to the sides of the
sub-sample. Test was performed at room temperature 20 ± 2 °C and relative humidity not less

§ 3. Materials and methods 60
Marija Đuroković PhD Thesis
than 40%. The samples were weighed with an accuracy of ± 0.1%. The setup for this
experiment is shown in Figure 3.15.
Figure 3.15. Setup for determination of the absorption coefficient due to capillary action
3.4.9. Determination of permeability to gasses
Permeability of material is defined as property by which the material allows a gas to pass
through it when it is exposed to differences in pressure. The standard method usually applied
to hardened concerte samples described in HRN EN 993-4:2008 was used to determine the
permeability of cement pastes with small modifications in sample dimensions and drying
temperature.214 The apparatus shown in Figure 3.16 was used for determination.
The cylindrical sub-samples prepared according to Figure 3.6 were used for determination
CEM I CEM III
CSA

§ 3. Materials and methods 61
Marija Đuroković PhD Thesis
Figure 3.16. The apparatus for determination of permeability to gasses
A stream of dry gas is passed through the test piece. The pressure drop across the test piece
was recorded and the permeability of cement paste was calculated using geometry data (size
and shape) of sample. The cylindrical sub-sample prepared according to Figure 3.7 with a
100 mm ± 0.5 mm diameter and 50 mm ± 0.5 mm height was used for determination. The
samples were dried to constant mass in drying oven at 105 ± 5°C before measurements. The
standard requires 50 mm ± 0.5 mm sample diameter and drying temperature of 110 ± 5°C.
The lower drying temperature was used to avoid changes in microstructure due to
decomposition of hydrated phases and formula used for calculation was adjusted to different
sample diameters.
3.4.10. SEM determination
The square sub-samples prepared according to Figure 3.6 were used for SEM determination.
Samples were polished prior to analysis by applying a procedure for preparation of the sample
surface for air voids content described in section 3.4.11. Field emission scanning microscope
JSM-7500F was used to obtain secondary electron images (SEI) with magnification between
100 × to 20 000 ×. EDS analysis was performed, too.
3.4.11. Air voids content
The air void structure of cement pastes was determined by the standard linear traverse method
usually applied to hardened concrete and described in HRN EN 480–11:2005 with
modifications in curing conditions and hydration age.215 The test surfaces of subsamples
prepared according to procedure given in section 3.3.2 were prepared for analysis in full
accordance with the standard. The determination was performed with an automated measuring
system (Rapid air 457, German Instruments, Inc., Illinois, USA) comprising a computerized

§ 3. Materials and methods 62
Marija Đuroković PhD Thesis
control unit with a monitor, a cross traverse table, a digital camera and a microscope
objective. The used system is shown on Figure 3.17.
Figure 3.17. System for determination of air voids content with microscope objective
The air void structure was determined by scanning along a series of traverse lines running
parallel to the surface. The number of air voids intersected by the traverse lines was recorded.
A mathematical analysis of the recorded data gave description of the air void system. The
cylindrical sub-samples prepared according to Figure 3.6 were used for determination of air
voids system.

§ 3. Materials and methods 63
Marija Đuroković PhD Thesis
3.4.12. Used chemicals and reagents
Chemicals and analytic reagents used for chemical analysis according to HRN EN
196-2: 2013, HRI CEN/TR 196-4:2007 and for ICP-MS analysis are listed in Table 3.13 and
Table 3.14
Table 3.13. List of the chemicals and analytic reagents used used for chemical analysis
according to standards HRN EN 196-2: 2013 and HRI CEN/TR 196-4:2017
Chemical / Analytic reagent Produced by Acetic acid, C2H4O2(aq), min. 99,5% p.a. CAS: 64-19-7 Kemika, Croatia Ammonia soulution, NH3(aq) min. 25%, CAS:1336-21-6 Kemika, Croatia
Ammonium acetate, C2H7NO2(s), p.a. CAS: 63-61-8 Kemika, Croatia Amonium chloride, NH4Cl(s), p.a., CAS: 12125-02-9 Kemika, Croatia
Ammonium heptamolybdate tetrahydrate, (NH4)6Mo7O24·4H2O (s), p.a., CAS:12054-85-2
Kemika, Croatia
Ammonium iron(III) – sulfate dodecahydrate, NH4Fe(SO4)2·12H2O(s),CAS:7783-83-7
Kemika, Croatia
Ammonium thiocyanate, NH4SCN p.a., CAS:1762-95-4 Kemika, Croatia Barium chloride dihydrate, BaCl2·2H2O(s) p.a.,
CAS: 10326-27-9 Kemika, Croatia
Boric acid, H3BO3(aq), p.a., CAS: 10043-35-3 Kemika, Croatia Calcium carbonate, CaCO3 (s), CAS: 471-34-1 Kemika, Croatia
Citric acid monohydrate, C6H8O7·4H2O (s) , CAS:5949-29-1
Kemika, Croatia
Concentrated hydrochloric acid, HCl(aq), min. 36% ,p.a., CAS: 7647-01-0
Kemika, Croatia
Concentrated nitric acid, HNO3 (aq), min. 65%, p.a., CAS:7697-37-2
Kemika, Croatia
Concentrated phosphoric acid, H3PO4 (aq), min. 85%, p.a., CAS: 7664-38-2
Kemika, Croatia
Concentrated sulfuric acid, H2SO4(aq), min. 96%, p.a., CAS: 7664-93-9
Kemika, Croatia
Copper(II) sulfate pentahydrate, CuSO4·5H2O(cryst), CAS: 7758-99-8
Merck, Germany
Glycine, C2H5NO2 (s) p.a., CAS: 56-40-6 Kemika, Croatia Hydroflouric acid, HF(aq), 48%, CAS: 7664-39-3 Merck, Germany
Magnesium perchlorate, Mg(ClO4)2 , CAS: 10034-81-8 Alfa Aesar, Germany Methylthymol blue sodium salt for complexometry,
C37H40N2Na4O13S(s) CAS:1945-77-3 Kemika, Croatia

§ 3. Materials and methods 64
Marija Đuroković PhD Thesis
Table 3.13. List of the chemicals and analytic reagents used used for chemical analysis
according to standards HRN EN 196-2: 2013,
and HRI CEN/TR 196-4:2017 – previos page extension
Chemical / Analytic reagent Produced by 5,5′-Nitrilodibarbituric acid monoammonium
salt, Ammonium purpurate, Murexid, C8H8N6O6(s)
CAS: 3051-09-0 Kemika, Croatia
Potassium chloride, KCl (s), CAS: 7447-40-7 Kemika, Croatia Potassium hydroxide, KOH(s),grains 2 to 5 mm, p.a.,
CAS: 1310-58-3 Kemika, Croatia
Potassium iodate, KIO3 (s), p.a., CAS:7758-05-6 Kemika, Croatia Potassium periodate, KIO4 (s) > 99,5% BDH Prolabo, UK
Pumice stone Kemika, Croatia Sodium carbonate, Na2CO3 (s), anhydrous,
CAS: 497-19-8 Kemika, Croatia
Sodium chloride, NaCl (cryst) ,p.a., CAS: 7647-14-5 Kemika, Croatia Sodium hydroxide, NaOH(s), pellets 2 – 5mm,
CAS: 1310-73-2 Kemika, Croatia
Sodium peroxide, Na2O2 (s), CAS:1313-60-6 Kemika, Croatia Sodium thiosulfate pentahydrate, Na2S2O3·5H2O(s),
CAS:7772-98-7 Merck, Germany
Starch, (C6H10O5)n (s), CAS: 9005-84-9 Merck, Germany 5-sulfosalicylic acid dihydrate, C7H6O6S·2H2O(s),
CAS: 5965-83-3 Kemika, Croatia
1-(2-Pyridylazo)-2-naphtol (s), PAN, CAS:85-85-8 Kemika, Croatia Tin (II) chloride dyhidrate, SnCl2·2H2O(s),
CAS: 7772-99-8 BDH PROLABO, UK
Triethanolamine, C6H15NO3 (l), CAS: 102-71-6 BDH PROLABO, UK Titrival concentrate silver nitrate 0.1 mol L-1 , AgNO3(l)
CAS:7761-88-8 Kemika, Croatia
Zinc sulfate heptahydrate, ZnSO4·7H2O(s), CAS:7446-20-0
Kemika, Croatia

§ 3. Materials and methods 65
Marija Đuroković PhD Thesis
Table 3.14. List of the chemicals and analytic reagents used used for ICP-MS analysis
Chemical / Analytic reagent Produced by
Nitric acid, HNO3 (aq); for trace elements analysis, ≥ 69 %
Honeywell FlukaTM
Hydrochloric acid, HCl (aq); for trace elements analysis, 34 % - 37 %
Honeywell FlukaTM
Tetraflouroboric acid, for trace elements analysis Honeywell FlukaTM Internal standard solution – Inernal standard mix
10 µg L-1 Bi, Ge, In, Li6, Sc, Tb, Y matrix 5 % HNO3 Agilent Technologies
Standard solution 1 – Stanadard IV – Stock 10 µg mL-1 Ag, Al, As, Ba, Be, Cd, Co, Cr, Cu, Mn,
Mo, Ni, Pb, Sb, Th, Tl, U, V, Zn 1000 µg mL-1 Ca, Fe, K, Mg, Na
Matrix tr. Tartaric acid, 5 % HNO3
Inorganic Ventures
Standard solution 2 – Environmental Calibration Standard
10 µg mL-1 Ag, Al, As, Ba, Be, Cd, Co, Cr, Cu, Mn, Mo, Ni, Pb, Sb, Th, Tl, U, V, Zn 1000 µg mL-1 Ca, Fe, K, Mg, Na
Matrix tr. Tartaric acid, 5 % HNO3
Agilent Technologies
Standard solution 3 Agilent Technologies Tuning solution for ICP-MS
1 ppb Li, Co, Y, Ce, Tl Agilent Technologies

§ 4. Results and discussion 66
Marija Đuroković PhD Thesis
§ 4. RESULTS AND DISCUSSION
4.1. Characterization of starting materials
The selection of Portland cement or some other cement type used in construction work is
usually based only on strength classification. Sometimes, composition of the selected cement,
expressed as amount of Portland cement clinker, is considered during selection. The chemical
and phase composition is usually skipped, although these are sources of valuable information
for cement implementation.
The chemical composition of CEM I, CEM III and CSA cement expressed as major and
minor oxides is reported in Table 4.1.
Table 4.1. Chemical composition (major and minor oxides) of CEM I, CEM III and CSA
Property w / %
CEM I CEM III CSA cement
LOI (950 ± 50)°C 2.89 1.40 0.92
Insoluble residue in HCl and Na2CO3 0.23 0.41 2.54
Insoluble residue in HCl and KOH 0.23 0.30 1.96
CaO 62.90 56.25 40.08
MgO 2.30 3.19 4.66
SiO2 19.53 26.29 9.12
Al2O3 4.58 6.20 32.82
Fe2O3 2.82 1.93 1.61
SO3 3.07 2.40 11.49
S2- 0.03 0.23 0.00
Cl 0.013 0.075 0.188
CO2 1.99 0.65 0.22
MnO 0.075 0.134 0.157
K2O 0.92 0.67 0.71
Na2O 0.17 0.15 0.48
Na2Oequvivalent 0.78 0.59 1.03

§ 4. Results and discussion 67
Marija Đuroković PhD Thesis
Mass fractions of the major and minor oxides show differences between Portland cements
CEM I and CEM III. LOI indicates the amount of material present in Portland cement that
was not treated at higher temperatures prior to cement production. It usually accounts for
natural gypsum and limestone. The higher mass fraction of LOI for CEM I compared to
CEM III indicates higher amounts of natural calcium sulfate (gypsum) or a possible presence
of limestone in CEM I. The higher sulfate and CO2 contents observed in CEM I are also in
line with these results. Major clinker phases: alite, belite, aluminate and ferrite in CEM I have
been confirmed, while the presence of limestone has not been confirmed by XRPD
(Figure 4.1).216-220
Figure 4.1. XRPD of CEM I in the 2θ range 29 – 35°
with the identified crystalline phases216-220
The peak at 51.7° and a shoulder at 51.9°, characteristic for the monoclinic M1 polymorph, is
observed in the CEM I diffractogram (Figure 4.2), as analysed by Taylor5 (see Fig. 2.4).216 As
the structure of this polymorph is not known, the structure of the very similar M3 was used for
Rietveld refinement.

§ 4. Results and discussion 68
Marija Đuroković PhD Thesis
Figure 4.2. Characteristic XRPD pattern of the observed monoclinic M1 alite polymorph
in CEM I (top) and the calculated pattern of the M3 polymorph (bottom)216
The quantitative XRPD analysis shows that alite and belite are the major phases in CEM I
(Figure 4.3). 216-226
Figure 4.3. QXRPD pattern of CEM I in the 2θ range 20 – 65° 216-226
The higher mass fractions of insoluble residues observed for CEM III indicate higher amounts
of insoluble silicon, which corresponds to higher silica content in CEM III. These results
indicate the possible presence of glassy material in CEM III which has been confirmed by
XRPD (Figure 4.4). Currently it is accepted for modern clinkers to contain the glass phase
only in rare cases.227 The glass phase content of 50 ‒ 95 % has been confirmed in the

§ 4. Results and discussion 69
Marija Đuroković PhD Thesis
granulated blast furnace slag depending on the cooling method type.227 The crystalline phases
identified in CEM I are also present in CEM III. The high background indicates a significant
amount of the amorphous phase in CEM III as a consequence of added granulated blast
furnace slag.216-218,220,221
Figure 4.4. XRPD of CEM III in the 2θ range 9 – 65°
with the identified crystalline phases216-218,220,221
Chemical composition of the CSA cement is significantly different in comparison to CEM I
and CEM III. Lower CaO and SiO2 and a higher Al2O3 mass fraction indicates that the prime
compounds in this cement are calcium sulfoaluminate compounds instead of calcium silicates
and calcium aluminate, the prime compounds in CEM I and CEM III. The higher sulfate
content and lower LOI also support this conclusion which was confirmed by phase analysis.
Ye’elimite is the prime phase in the CSA cement but the presence of belite and other minor
phases was also confirmed (Figure 4.5).216-219,223-225,229-233
The quantitative phase composition of the anlysed cements determined by the Rietveld
method is given in Table 4.2. The minor phases (<1.8 %) are not given.

§ 4. Results and discussion 70
Marija Đuroković PhD Thesis
Figure 4.5. QXRPD of CSA in the 2θ range 15 – 65° with the identified crystalline phases.
The numbers that correspond to the known structures of crystalline phases are from
Inorganic Crystal Structure Database216-219,223-225,229-233
Table 4.2. Phase composition of CEM I, CEM III and CSA cement
Mineral w / %
CEM I CEM III CSA cement
C3S 71.8 41.0 0
C2S 12.8 3.7 13.5
C3A 3.2 3.2 3.4
C4AF 3.7 8.1 0
C4A3Ŝ 0 0 70.7
C2AS 0 0 2.5
C12A7 0 0 2.6
anhydrite 0.5 0 1.8
calcite 4.8 2.2 0
periclase 0 0 2.4
glass phase 0 38.0 0

§ 4. Results and discussion 71
Marija Đuroković PhD Thesis
Results of the chemical and phase composition determination indicate that the principal
source of differences in the major and minor oxide fractions in CEM I and CEM III is the
granulated blast furnace slag. Substitution of 64 % of clinker in CEM III by the granulated
blast furnace slag was confirmed by composition determination, given in Table 4.3. Presence
of limestone in CEM I was not confirmed.
Table 4.3. Composition of CEM I and CEM III
Cement Mass fraction in %
Clinker Granulated blastfurance slag
CEM I 100 -
CEM III 36.0 64.0
Table 4.4 shows total concentrations of eleven trace elements in anhydrous CEM I,
CEM III and CSA cement. The concentration of all elements, except mercury and lead, are
lower in CEM I when compared to CEM III. These data correspond to the findings of other
authors for the same cement types.55 Substitution of clinker by granulated blast furnace slag
increases the trace elements concentration in CEM III, except for mercury and lead.
Determined trace elements can be divided in two groups: elements with the concentration
above 5 mg kg-1 (Co, Cr, Cu, Ni, Sb, Zn and V) and elements with the concentration below 5
mg kg-1 (As, Cd, Hg and Pb). Low concentration of some elements is connected to their
volatility. Arsenic, cadmium, mercury and lead are considered as highly or moderately
volatile elements in the Portland cement kiln system. They are hardly stabilized in Portland
cement clinker, while the other elements included in this research are considered as non-
volatile, well incorporated within the clinker phases and thus highly abundant in cement.55

§ 4. Results and discussion 72
Marija Đuroković PhD Thesis
Table 4.4. Content of the trace elements in CEM I, CEM III and CSA cement
w(trace element) / mg kg-1
Cement Sb As Cd Cr Co Cu Hg Ni Pb V Zn
CEM I 10.3 4.30 0.50 67.8 5.3 63.8 0.03 17.4 1.19 39.5 312
CEM III 36.4 4.40 0.60 547 15.6 2368 0.02 374 <0.080* 205 1056
CSA
cement 3.7 12.1 0.40 119.5 16.6 127.4 0.01 110 184 231.5 125.3
* In µg kg-1
Volatile arsenic and especially lead, show higher abundance in the CSA cement than in
CEM I and CEM III. The lower required formation temperature for the calcium
sulfoaluminate clinker and higher amounts of industrial waste materials potentially used as
raw materials in its production enable higher levels of lead and arsenic incorporation. Lower
levels of antimony, cadmium and mercury in the CSA cement are presumably the result of
lower input values through raw materials and fuels. The abundances of other trace elements
are in the range of values observed for CEM I and CEM III. Investigation of the trace
elements content in CSA cements is less often encountered in the literature.
The pure cement constituents, clinker, gypsum and slag as well as raw materials for
clinker preparation were not available for this research. Thus, a deep study of input pathways
of the trace elements in cement within this research was not possible.
Electrical conductivity, pH value, hardness and total dissolved solids content of deioinized
water used for preparation and curing of the cement paste samples, reported in Table 4.5,
satisfied the requirements for very soft water (classification is given in Table 3.8).
Table 4.5. Electric conductivity, pH value, TDS content and hardness of deionised water
Property Value Unit
El. conductivity 0.44 µS cm-1
TDS 0.22 mg L-1
pH 6.35 -
Hardeness 0.04 equivalent CaCO3 mg L-1

§ 4. Results and discussion 73
Marija Đuroković PhD Thesis
Leaching potential of deionized water was confirmed by the total concentration of the selected
eleven trace elements, calcium and magnesium, Table 4.6.
Table 4.6. Trace elements, calcium and magnesium in deionised water
Element Concentration/ µg mL-1
Soft water
As < 0.030*
Cd < 0.006*
Co < 0.008*
Cr < 0.056*
Cu < 0.203*
Hg < 0.009*
Ni < 0.042*
Pb < 0.080*
Sb < 0.005*
V < 0.020*
Zn < 1.06*
Ca 0.013 mg L-1
Mg 0.003 mg L-1
* Limit of determination for each specified element

§ 4. Results and discussion 74
Marija Đuroković PhD Thesis
4.2. Hydration of cement pastes
Despite limitations in implementation of XRPD on hydrated cement pastes, diffractograms
are valuable sources of information on hydration process. Powder patterns of the CEM I paste
show that alite from anyhdrous cement is consumed during the 365 days hydration period.
There is still some alite present after 365 days (Figure 4.6).216,221,234-235 Crystalline phases
during hydration and leaching observed by XRPD can give us valuable information. The
crystalline hydrated phase, portlandite was observed after the 1.5 day hydration period and
there is an increase up to 7 days during which the amount of ettringite also increases. In 28
days of the hydation period no further significant increase in portlandite or ettringite was
observed. This indicates that leaching does not affect the CEM I paste significantly and is in
line with the observed strength behaviour. Reduction of ettringite is observed from 56 to 365
days of hydration. This is in agreement with the strength decrease observed for the 365 days
hydration period. A very small peak at 9.9° 2θ corresponds to monosulphate. For the 365
days hydration period an increase of calcite due to carbonatization of the samples was
observed.
Figure 4.6. XRPD of CEM I cement paste in the 2θ range 8 – 55°. Observed powder patterns
for CEM III and the CEM III paste after 365 days of hydration and leaching are shown red
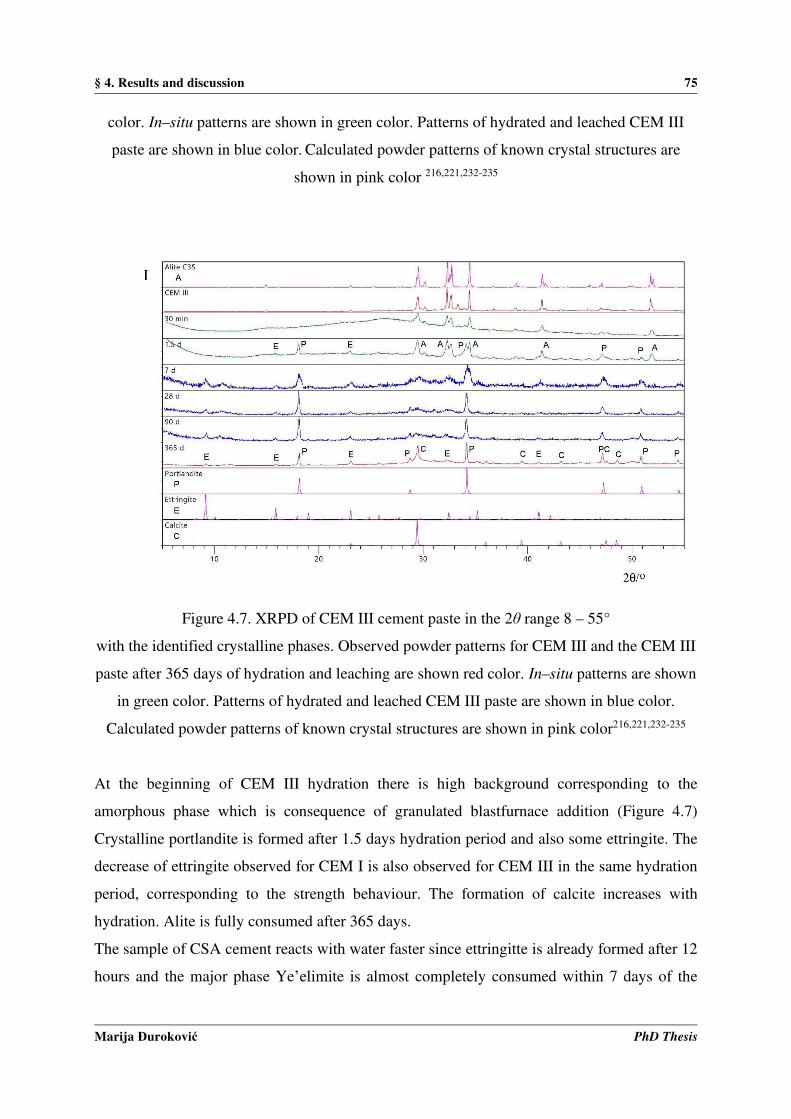
§ 4. Results and discussion 75
Marija Đuroković PhD Thesis
color. In–situ patterns are shown in green color. Patterns of hydrated and leached CEM III
paste are shown in blue color. Calculated powder patterns of known crystal structures are
shown in pink color 216,221,232-235
Figure 4.7. XRPD of CEM III cement paste in the 2θ range 8 – 55°
with the identified crystalline phases. Observed powder patterns for CEM III and the CEM III
paste after 365 days of hydration and leaching are shown red color. In–situ patterns are shown
in green color. Patterns of hydrated and leached CEM III paste are shown in blue color.
Calculated powder patterns of known crystal structures are shown in pink color216,221,232-235
At the beginning of CEM III hydration there is high background corresponding to the
amorphous phase which is consequence of granulated blastfurnace addition (Figure 4.7)
Crystalline portlandite is formed after 1.5 days hydration period and also some ettringite. The
decrease of ettringite observed for CEM I is also observed for CEM III in the same hydration
period, corresponding to the strength behaviour. The formation of calcite increases with
hydration. Alite is fully consumed after 365 days.
The sample of CSA cement reacts with water faster since ettringitte is already formed after 12
hours and the major phase Ye’elimite is almost completely consumed within 7 days of the

§ 4. Results and discussion 76
Marija Đuroković PhD Thesis
hydration period (Figure 4.8).216,221,235-236 Ettringite and stratlingite are the major crystalline
phases formed by CSA hydration. Formation of calcite increases with hydration.
Figure 4.8. XRPD of CSA cement paste in the 2θ range 8 – 55°
with the identified crystalline phases.216,221,235-236 Calculated powder patterns of known crystal
structures are shown in pink color. Observed powder patterns for CSA cement and the CSA
cement paste after 365 days of hydration and leaching are shown red color. In–situ patterns
are shown in green color. Patterns of hydrated and leached CSA cement paste are shown in
blue color. known crystal structures
The diffraction patterns for XRPD in–situ measurements show that carbonatization is
dominant process on the surface in all cement paste samples. Figure 4.9. shows that for 7 days
hyrdation period the pattern corresponding to calcite dominates in diffraction patterns of all
cement pastes.221 This indicates that XRPD in–situ measurements are not suitable for leaching
studies due to formation of calcite on the surface of the samples.
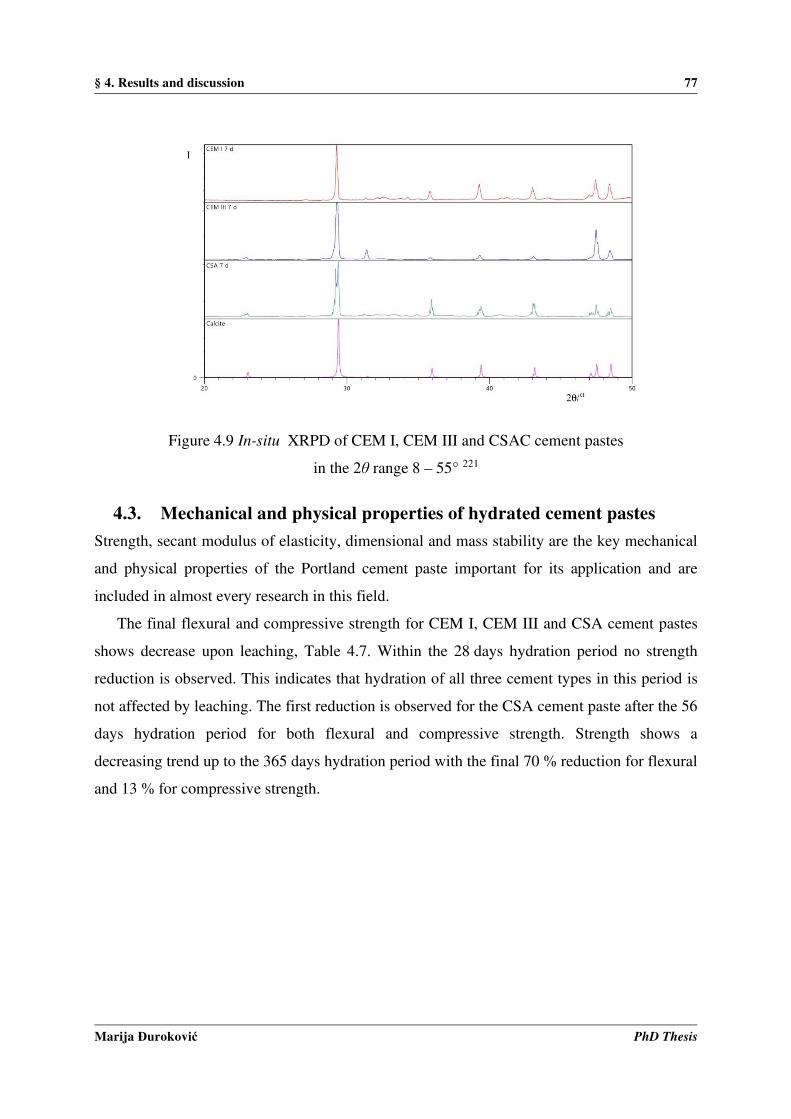
§ 4. Results and discussion 77
Marija Đuroković PhD Thesis
Figure 4.9 In-situ XRPD of CEM I, CEM III and CSAC cement pastes
in the 2θ range 8 – 55° 221
4.3. Mechanical and physical properties of hydrated cement pastes
Strength, secant modulus of elasticity, dimensional and mass stability are the key mechanical
and physical properties of the Portland cement paste important for its application and are
included in almost every research in this field.
The final flexural and compressive strength for CEM I, CEM III and CSA cement pastes
shows decrease upon leaching, Table 4.7. Within the 28 days hydration period no strength
reduction is observed. This indicates that hydration of all three cement types in this period is
not affected by leaching. The first reduction is observed for the CSA cement paste after the 56
days hydration period for both flexural and compressive strength. Strength shows a
decreasing trend up to the 365 days hydration period with the final 70 % reduction for flexural
and 13 % for compressive strength.

§ 4. Results and discussion 78
Marija Đuroković PhD Thesis
Table 4.7. Flexural and compressive strength for CEM I, CEM III and CSA cement pastes
after leaching
Hydration
period / days
Strength / MPa
Flexural Compressive
CEM I CEM III CSA
cement CEM I CEM III
CSA
cement
2 3.5 3.9 5.0 19.3 20.0 32.7
7 5.1 5.6 6.0 31.3 31.9 37.7
28 7.2 7.8 4.1 49.4 51.8 36.3
56 8.2 8.6 3.5 57.0 60.7 35.3
90 8.7 9.1 2.0 61.3 65.7 34.2
180 9.2 4.3 1.9 65.0 69.1 32.7
365 4.9 4.2 1.8 56.0 42.3 32.5
For the CEM III paste reduction of flexural strength of 53 % is observed after 180 days. The
decline of compressive strength of 13 % and 61 % for CEM I and CEM III, respectively, is
observed after the 365 days leaching period. The CEM I paste loses flexural strength for 53%.
The decrease of flexural and compressive strength is the result of the long–term leaching
process. It also indicates that susceptibility towards leaching increases in the order
CEM I < CEM III < CSA cement.
The loss of strength as a consequence of leaching or some other degradation process is
usually accompanied by a decline of the secant modulus of elasticity. No decline in secant
modulus of elasticity for CEM I, CEM III and CSA cement pastes are observed during the
leaching period of 365 days. On the contrary, increase is observed for all three cement types
(see Table 4.8). The secant modulus of elasticity is strongly correlated with porosity of the
cement paste. It increases with decrease of porosity. This indicates that long–term leaching
process did not increase porosity of CEM I, CEM III and CSA cement pastes and that the
observed loss of strength is a consequence of changes in the chemical composition of the
hydration products.

§ 4. Results and discussion 79
Marija Đuroković PhD Thesis
Table 4.8. Modulus of elasticity for CEM I, CEM III and CSA cement pastes after leaching
Hydration period /
days
Modulus of elasticity / GPa
CEM I CEM III CSA cement
2 7.45 7.26 9.80
7 10.83 10.99 11.02
28 14.26 14.50 11.19
56 15.05 15.32 11.34
90 15.91 15.80 11.00
180 16.51 19.40 13.41
365 21.33 22.35 15.78
Figure 4.10 shows that no significant dimensional instability is observed during the
hydration period. Shrinkage behaviour of both Portland cements as well as of the CSA cement
is common. Figure 4.11 shows that no significant change of mass is observed during the
hydration period. The observed volume and mass stability indicate that no expansive product,
such as expansive ettringite is formed during the long–term leaching process.
Figure 4.10. Dimensional stability for CEM I, CEM III and CSA cement pastes after 365 days
hydration
-1,50
-1,00
-0,50
0,00
0,50
1,00
1,50
2,00
2,50
3,00
0 1 2 7 14 28 56 90 180 365
mm
/ m
Dimensional stability
CEM I
CEM III
CSA

§ 4. Results and discussion 80
Marija Đuroković PhD Thesis
Figure 4.11. Mass changes for CEM I, CEM III and CSA cement pastes after leaching
210
220
230
2 14 28 56 90 180 365
ma
ss /
g
hydration period / days
CEM I
CEM III
CSAC

§ 4. Results and discussion 81
Marija Đuroković PhD Thesis
4.4. Microstructural properties
Figure 4.12 shows microstructure of CEM I, CEM III and CSA cement paste after the 365
days leaching period, observed by scanning electron microscopy. In the CEM I paste (Figure
4.5 A) large areas of plate-like portlandite and areas of tightly packed spherical grains of the
C-S-H gel together with needle-like ettringite are visible. In the CEM III paste (Figure 4.12
B), portlandite is closely intermixed with the C-S-H gel and needle-like ettringite. The highest
amount of ettringite is observed in the CSA cement paste (Figure 4.12 C and 4.12 D). The
microstructure and morphology of hydration products does not indicate any deterioration due
to leaching. The compositions of hydration phases confirmed by EDS spectra are shown in
Figures 4.13, 4.14 and 4.15. The microstructure corresponds to an increase of the modulus of
elasticity for all cement pastes.
Figure 4.12. Microstructure of A) CEM I, B) CEM III; C) and D) CSA cement paste after
leaching
Ettringite
4.12. B 4.12. A
4.12. C 4.12. D

§ 4. Results and discussion 82
Marija Đuroković PhD Thesis
Element Weight% Atomic%
C K 3.58 5.56
O K 70.41 82.13
Si K 1.00 0.67
Ca K 25.01 11.64
Totals 100.00
Figure 4.13. EDS spectra of portlandite from the CEM I paste after leaching
Element Weight% Atomic%
C K 12.29 18.99
O K 55.77 64.68
Mg K 0.96 0.73
Al K 1.12 0.77
Si K 4.84 3.20
S K 0.46 0.27
Ca K 24.56 11.37
Totals 100.00
Figure 4.14. EDS spectra of the C-S-H gel from the CEM III paste after leaching
Element Weight% Atomic%
O K 47.76 67.34
Al K 0.37 0.31
S K 22.41 15.77
Ca K 29.47 16.59
Totals 100.00
Figure 4.15. EDS spectra of ettringite from the CSA cement paste after leaching

§ 4. Results and discussion 83
Marija Đuroković PhD Thesis
The content of air voids for CEM I, CEM III and CSA cement pastes shows increase in the
365 days leaching period (Table 4.9). The lowest increase (around 7 %) is observed for
CEM I and the highest (around 60 %) for CEM III. The increase of around 33 % is observed
for CSA. This is fully in line with the observed decrease of compressive strength.
Microscopic determination of air voids content includes determination of closed microscopic
pores filled with air with a diameter between 0 and 4000 µm.
Table 4.9. Air void content in CEM I, CEM III and CSA cement paste after leaching
Leaching period /
days
Air voids content / %
CEM I CEM III CSA
28 days 0.29 0.12 0.12
365 days 0.31 0.19 0.16
Porosity of cementitious materials can be well estimated by measuring water absorption due
to capillary action. Materials with higher water absorption values are more porous.
Susceptibility towards leaching of Portland cement pastes increases with increased porosity.
Capillary action was measured on samples after a 365 days hydration period. Figure 4.16
shows that CSA cement paste is more porous than CEM I and CEM III. CEM III paste has the
lowest porosity. This indicates that susceptibility towards leaching decreases in the order
CSA > CEM I > CEM III.
Figure 4.16. Water absorption due to capillary action after 365 hydration period

§ 4. Results and discussion 84
Marija Đuroković PhD Thesis
It was not possible to determine permeability to gasses of CEM I, CEM III and CSA cement
pastes due to decomposition of samples during determination. The presumable cause of
sample decomposition is the necessary drying procedure before measurement, although
modified (lower temperature) drying procedure was applied. Drying may causes degradation
of hydration products and decomposition of cement samples.
4.5. Cement paste and pore solution composition
The composition of CEM I, CEM III and CSA cement pastes after leaching, given in Tables
4.10, 4.11 and 4.12, show decrease of calcium, sodium and potassium in all cement types in
the course of time. The results indicate leaching and correspond to the previous research
results. The highest loss (around 6 %) of calcium is observed for CSA and the lowest (around
1 %) for CEM III. The loss around 2 % is observed for CEM I.
Sodium and potassium are also leached from the cement paste. The abundances of
potassium in cement pastes and pore solutions are not correlated with its content in anhydrous
cements. The highest potassium levels are observed for anhydrous CEM I and CEM III
cement paste after 2 days hydration period. This indicates that potassium in CEM III is mainly
incorporated within the clinker phases, however in CEM I as well as in CSA it is
predominantly present in the form of the ready soluble sulfate salt. In CEM I and CEM III
sodium is mainly incorporated within the clinker phases but present in the form of ready
soluble sulfate salts in the CSA cement. The highest decline observed for sodium and
potassium is observed for the CSA cement, and then for CEM III and CEM I indicating that
susceptibility towards leaching decreases in this order. Aluminium and iron have a constant
concentration in the course of time, while silicon and magnesium show a slight increase. This
indicates that phases containing aluminium and iron are not affected by leaching.
Alkalinity of the CSA cement pore solution is lower than that of CEM I and CEM III (see
Table 4.13). Decline of the pH value in the course of time is observed for all pore solutions
and corresponds to the decline in the concentration of alkalis (Figure 4.17). The increase in
calcium concentration has been observed for 28 days hydration period for all cement types
(Figure 4.18). Exception is the CEM III pore solution after a 7 days hydration period. The
observed decrease of calcium corresponds with consumption of CH necessary for activation
of slag. The increase of calcium pore solution concentration in all three cement types in the 28
days hydration period indicates that pastes are not affected by leaching. The decline in
calcium pore soulution concentration is observed between 28 days and 180 days. This

§ 4. Results and discussion 85
Marija Đuroković PhD Thesis
indicates the loss of calcium caused by leaching. The finaly observed increase in calcium pore
solution concentration corresponds to the decease of calcium content in all three cement
pastes and indicates dissolution of calcium containing hydration products. Calcium pore
solution behaviour is fully in line with the observed strength behaviour. The results for
cement pastes and pore solutions indicate that the resistance towards leaching is significantly
better in CEM I and CEM III pastes under the given experimental conditions in comparison to
the CSA cement.
Table 4.10. Composition of the CEM I paste after leaching Hydration period
/ days
w / %
CaO MgO Al2O3 Fe2O3 SiO2 SO3 K2O Na2O
2 58.05 3.62 6.22 2.04 26.71 2.56 0.49 0.31
7 57.72 3.86 6.28 2.07 26.94 2.43 0.43 0.26
28 57.40 3.99 6.39 2.06 27.01 2.57 0.40 0.18
56 57.09 4.03 6.49 2.09 27.23 2.48 0.41 0.19
90 57.03 4.06 6.43 2.09 27.27 2.54 0.36 0.21
180 57.22 4.06 6.59 2.08 27.11 2.54 0.35 0.05
365 56.91 4.01 6.65 2.08 27.38 2.64 0.31 0.03
Table 4.11. Composition of the CEM III paste after leaching Hydration period
/ days
w / %
CaO MgO Al2O3 Fe2O3 SiO2 SO3 K2O Na2O
2 57.55 3.80 6.32 2.14 26.95 2.40 0.59 0.26
7 57.25 4.03 6.24 2.10 27.19 2.51 0.50 0.18
28 57.46 3.87 6.43 2.10 27.13 2.52 0.37 0.12
56 57.48 3.97 6.39 2.05 27.11 2.52 0.37 0.12
90 57.46 4.01 6.47 2.10 27.03 2.48 0.37 0.08
180 57.67 3.74 6.42 2.01 27.23 2.63 0.30 0.00
365 56.92 3.83 6.63 2.13 27.59 2.62 0.28 0.00
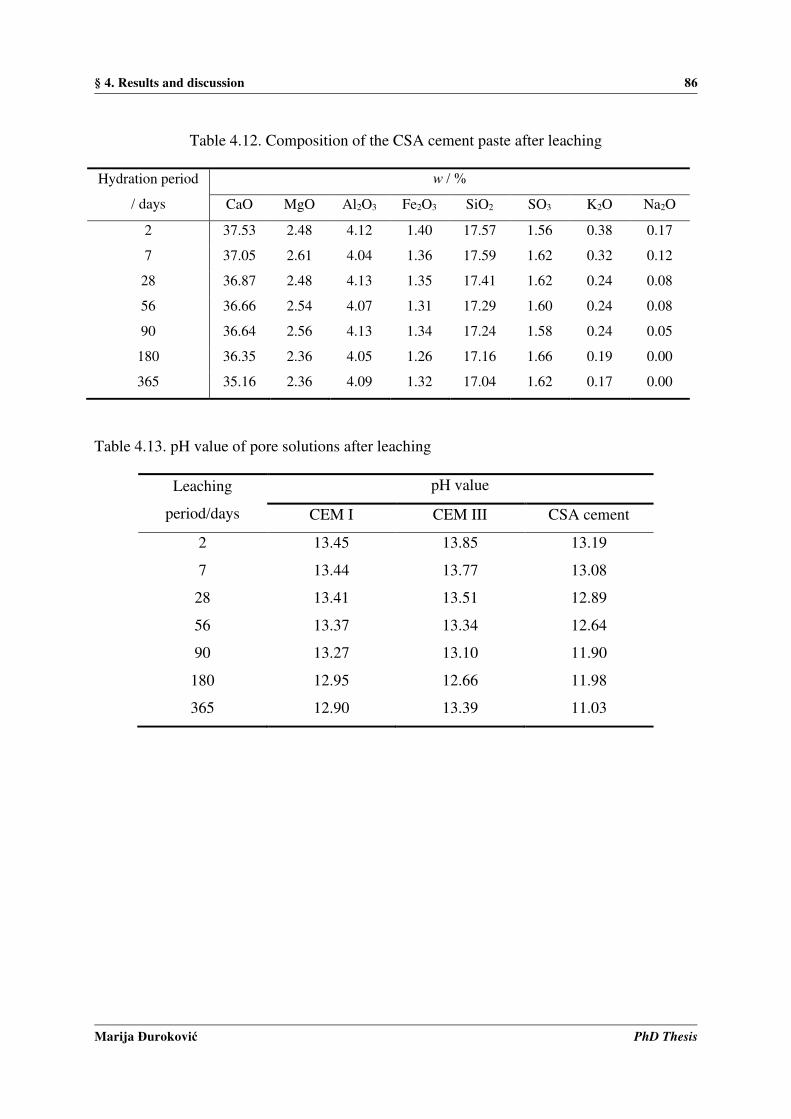
§ 4. Results and discussion 86
Marija Đuroković PhD Thesis
Table 4.12. Composition of the CSA cement paste after leaching
Hydration period
/ days
w / %
CaO MgO Al2O3 Fe2O3 SiO2 SO3 K2O Na2O
2 37.53 2.48 4.12 1.40 17.57 1.56 0.38 0.17
7 37.05 2.61 4.04 1.36 17.59 1.62 0.32 0.12
28 36.87 2.48 4.13 1.35 17.41 1.62 0.24 0.08
56 36.66 2.54 4.07 1.31 17.29 1.60 0.24 0.08
90 36.64 2.56 4.13 1.34 17.24 1.58 0.24 0.05
180 36.35 2.36 4.05 1.26 17.16 1.66 0.19 0.00
365 35.16 2.36 4.09 1.32 17.04 1.62 0.17 0.00
Table 4.13. pH value of pore solutions after leaching
Leaching
period/days
pH value
CEM I CEM III CSA cement
2 13.45 13.85 13.19
7 13.44 13.77 13.08
28 13.41 13.51 12.89
56 13.37 13.34 12.64
90 13.27 13.10 11.90
180 12.95 12.66 11.98
365 12.90 13.39 11.03

§ 4. Results and discussion 87
Marija Đuroković PhD Thesis
Figure 4.17. Development of the pore solution concentration of K and Na in the course of
time for leached cement pastes
Figure 4.18. Development of the pore solution concentration of Ca in the course of time for
leached cement pastes
Concentration of the soluble trace elements in the pore solution, shown in Figures 4.19, 4.20
and 4.21 support their low solubility and good immobilization in the high alkaline cement
paste. The highest concentrations are observed for copper, chromium and vanadium in CSA
cement paste and they correspond with high concentrations of these elements in anhydrous
CSA cement. The extremely low pore solution concentration of arsenic, cadmium, mercury
and lead corresponds to their low abundance in anhydrous CEM I and CEM III. The low
abundance of cadmium in CSA cement also results in constantly low concentration of this
element in pore solution. The extremely lower concentration of lead in CSA cement pore
solution does not correspond with its high abundance in CSA cement. This result indicates
very good immobilization of lead within CSA cement pastes. The behaviour of all other trace
elements (Co, Cr, Cu, Hg, Ni, Sb and V) except Zn is the same for CSA cement paste. The

§ 4. Results and discussion 88
Marija Đuroković PhD Thesis
very high concentrations (especially for Cr and V) are significantly reduced in the course of
time. Only Zn shows slight increasing tendency. The mobility of selected trace elements in
CSA cement pastes is not correlated with decline in pore solution pH value. This indicates
that leaching does not affect immobilization of CSA cement which makes it very suitable for
the waste immobilization. The high abundance of AFm and AFt phases is presumably
responsible for the good trace elements immobilization in CSA cement pastes.
Figure 4.19. Development of the pore solution concentration of Co, Cr and V in the course of
time for leached cement pastes
Mercury in CEM I and CEM III pastes behaves similarly to cadmium and lead but shows the
highest solubility among the trace elements included in this research. This indicates that the
higher content of mercury incorporated in the Portland cement clinker phases could
potentially present an environmental risk for Portland cement type. A slight increase of the
arsenic pore solution concentration indicates decrease in the calcium hydroxide content
caused by leaching, therefore the higher content of arsenic in the cement paste could possible
present an environmental risk. The lower concentration of antimony at the beginning of
hydration increases in the course of time in CEM I as well as in CEM III pore solutions. The
immobilization of antimony depends on the pH value and the calcium concentration. The
increased solubility of antimony supports decalcification of hydrated CEM I and CEM III
cement phases caused by leaching. Antimony incorporated in the clinker phases could
potentially present an environmental risk.

§ 4. Results and discussion 89
Marija Đuroković PhD Thesis
Figure 4.20. Development of the pore solution concentration of Sb, Cu, Zn and Ni in the
course of time for leached cement pastes
Increase of the copper concentration in CEM I and CEM III pore solution is observed after 7
days. Since the only indicated mechanism of copper immobilization in the cement paste is the
ion exchange with calcium from the C-S-H gel, this indicates degradation of C-S-H and a
potential environmental risk. A quite high concentration of zinc in CEM III and CEM I
decrease in the course of time. Despite the decrease of pH values of the pore solutions, they
are still alkaline. Mobility of zinc increases below pH 7. Behaviour of zinc in CEM I and
CEM III pore solution does not indicate any deleterious reaction. The decrease of nickel
concentration in the pore solution corresponds to the decrease in pH. Nickel behaviour in the
pore solution indicates a deleterious reaction in CEM I and CEM III cement paste. Chromium
and vanadium show an increasing but a less clear trend. Cobalt pore solution concentration is
scattered. A difference in behaviour of these elements in CEM I and CEM III pastes is
observed. This indicates possible different incorporation of chromium, vanadium and cobalt
within hydrated and non-hydrated CEM I and CEM III. It was not possible to correlate our
results for these elements with degradation of the cement paste caused by leaching. The
behaviour of these elements should be carefully considered in the environmental risk
assessment due to ups and downs observed for these elements.

§ 4. Results and discussion 90
Marija Đuroković PhD Thesis
Figure 4.21. Development of the pore solution concentration of Pb, Hg, As and Cd in the
course of time for leached cement pastes

§ 5. Conclusion 91
Marija Đuroković PhD Thesis
§ 5. CONCLUSION
The formation of crystalline hydrated phases, portlandite and ettringite and their
abundance after the 28 days hydration period indicates that Portland cement pastes are not
affected by leaching in this period. The reduction of ettringite observed from 56 days to 365
days of hydration for Portland cement pastes correpsonds to strength reduction observed in
this period. The composition of hydrated Portland cement pastes does not support dissolution
of aluminium containing hydration products (e.g. ettringite). This indicates that the simple
transformation of ettringite to monosulfate could be a possible source of ettringite reduction.
The abundance of the major crystalline phases formed by calcium sulfoaluminate cement
hydration, does not indicate any leaching after the 365 days hydration period. Leaching of
calcium and alkalis in all cement pastes and pore solutions, accompanied by alkalinity
decrease, indicates changes in chemical composition of C-S-H or quantity of CH. Portlandite
is not observed in the CSA cement paste. Carbonatization of the samples is observed in all
cement pastes in the course of time. It is only significant for XRPD in-situ measurements,
which are measured on the surface of the samples, and does not cause formation of ettringite
in the late period of hydration.
The microstructure and morphology of hydration products after the 365 hydration period
does not indicate any deterioration due to the leaching. The increase in closed pore volume
observed from 56 days to 365 days hydration period indicates changes in the pore system
which is in line with observed strength decrease. The lower capillary porosity of Portland
cement pastes compared to calcium sulfoaluminate cement paste after 365 days hydration
period reduces the susceptibility of Portland cement pastes towards leaching. Increase of the
modulus of elasticity in the hydration period indicates no substantial decrease in overall
porosity in the course of time. Powder patterns of cement pastes show that expansive
compounds are not formed by leaching, which corresponds with volume and mass stability.
Strength, the most important property of cement paste is affected by leaching. The long
term-leaching decreases the flexural and compressive strength of the cement pastes after 56
days or more under the given experimental conditions. According to strength, cement based
on calcium sulfoaluminate compounds is more susceptible towards leaching than Portland
cement based on calcium silicate and calcium aluminate compounds. The leaching rate

§ 5. Conclusion 92
Marija Đuroković PhD Thesis
depends decisively on the type of cement used. Cement paste with a higher C-S-H content is
less susceptible towards leaching.
Result of research indicates that leaching causes changes in chemical composition and
structure of the C-S-H gel which results in strength loss. These changes should be confirmed
by further investigations.
The immobilization of the trace elements in calcium sulfoaluminate cement paste is not
affected by leaching, thus the concentration of the trace elements in pore solution cannot be
used in leaching studies for this cement type. The increasing concentrations of arsenic,
mercury, antimony and copper and the decreasing trend of nickel in Portland cement pore
solutions support chemical degradation by leaching. Behaviour of chromium, vanadium and
cobalt cannot be related to degradation by leaching due to observed up and downs.
The long-term leaching tests, at least 365 days or longer, are necessary to unambiguously
determine the leaching effect on the cement pastes. The immature cement paste may be used
in leaching tests and can thus shorten the period of testing. XRPD in-situ and permeability to
gasses are not suitable techniques to be applied in leaching studies.
Cement based on calcium sulfoaluminate compounds are not recommended to be used in
structures exposed to leaching but are very suitable for trace metals immobilization. A new
sustainable cement solution could be based on the mixture of calcium silicate, calcium
aluminate and caclcium sulfoaluminate compounds. The suitable proportions should be
determined by further research.

§ 6. List of abreviations 93
Marija Đuroković PhD Thesis
§ 6. LIST OF ABREVIATIONS
Cement chemistry notation is used including abbreviations of oxides, phases in non-hydrated
cement (clinker) and hydrated cement. The abbreviations of analytical techniques and used
materials are aslo given.
A aluminium oxide (Al2O3)
AFm aluminate ferrate monosulfate
AFt aluminate ferrate trisulfate
AH3 aluminium hydroxide
BSEI backscattered electron image
C calcium oxide (CaO)
CA calcium aluminate
C4A3�̅ tetracalcium trialuminate
sulfate, Ye'elimite
CSA calcium sulfoaluminate
C-S-H calcium silicate hydrate
C3A tricalcium aluminate,
aluminate
C4AF tetracalcium alumino ferrite,
ferrite
CH2 calcium sulfate (gypsum)
C2S dicalcium silicate , belite
C3S tricalcium silicate, alite
EDS energy dispersive X-ray
spectrometry
F iron (III) oxide (Fe2O3)
H water (H2O)
ICP-MS inductively coupled plasma
mass spectrometry
K potassium oxide (K2O)
§ 6. List of abreviations 94
Marija Đuroković PhD Thesis
LOI loss on ignition
M magnesium oxide (MgO)
M1,2 monoclinic
N sodium oxide (Na2O)
QC quality control
QXRPD quantitative X-ray powder
diffraction
R rhombohedral
S silicon dioxide (SiO2)
�̅ sulfate (SO3)
SCM supplementary cementitious
materials
SEI scanning electron imaging
SEM scanning electron microscopy
T triclinic
TG thermogravimetry
TDS total dissolved solids
w/c water to cement ratio
XRPD X-ray powder diffraction

§ 7. Bibliography 95
Marija Đuroković PhD Thesis
§ 7. BIBLIOGRAPHY
1. K. L.Scrivener and R. J. Kirkpatrick, Cem. Concr. Res. 38 (2008) 128 – 136.
2. C. D. Lawrence, The production of Low – Energy cements, in: P. C. Hewlett (Ed.) Lea’s
Chemistry of Cement and Concrete Fourth Edition, Oxford, Elsevier, 2005, pp. 421 - 470.
3. C. Shi, A. F. Jiménez and A. Palomo, Cem. Concr. Res. 41 (2011) 750 - 763.
4. F. P. Glasser, Future directions in the cement industry, in: R.K. Dir, M.D. Newlands, L. J.
Csetenyi (Eds.) Role of Cement Science in Sustainable Development, London, Thomas Telford,
2003, pp. 1 - 16.
5. H. F. W. Taylor, Cement Chemistry 2nd Edition, London, Thomas Telford, 1997, pp. 1 - 28.
6. J. Radić and J. Bleiziffer, Durability of Concrete Structures, in: J. Radić (Ed.) Concrete Structures
4: Sanations, Hrvatska sveučilišna naklada, Građevinski fakultet Sveučilišta u Zagrebu, Secon
HDGK, 2008, pp. 83 – 164 (in Croatian).
7. F. Adenot and M. Buil, Cem. Conc. Res. 22 (1992) 489 - 496.
8. M. Mainguy, C. Tognazzi, J. M. Torrenti and F. Adenot, Cem. Concr. Res. 30 (2000) 83 - 90.
9. F. P. Glasser, J. Marchand and E. Samson, Cem. Concr. Res. 38 (2008) 226 - 246.
10. C. Carde, R. Franqois and J. M. Torrenti, Cem. Concr. Res. 26 (1996) 1257 - 1268.
11. F. H. Heukamp, F. J. Ulm and J. T. Germaine, Cem. Concr. Res. 31 (2001) 767 - 774.
12. G. J. Verbeck and R. H. Helmuth, Structures and phsycal properties of cement paste, Proceedings
of the 5th International Symposium on the Chemistry of Cement, Volume 1, Tokyo, Japan, 1968,
pp. 1 - 32.
13. P. K. Mehta and P. J. M. Monteiro, Concrete: Microstructure, Properties and Materials, New
York, McGraw-Hill, 2006, pp. 203 - 251.
14. Q. Y. Chen , M. Tyrer, C. D. Hills, X. M. Yang and P. Carey, Waste Manag. 29 (2009) 390 - 403.
15. P. Faucon, P. Le Bescop, F. Adenot, P. Bonville, J.F. Jacquinot, P. Pineau and B. Felix,
Cem.Concr.Res. 26 (1996) 1707 - 1715.
16. K. Haga, S. Sotou, M. Hironaga, S. Tanaka and S. Nagasaki, Cem.Concr.Res. 35 (2005)
1764 - 1775.
17. Y. Maltais, E. Samson and J. Marchand, Cem. Concr. Res. 34 (2004) 1579 - 1589.
18. A. Hildago, S. Petit, C. Domingo, C. Alonso and C. Andrade, Cem.Concr.Res. 37 (2007) 63 - 70.
19. K. Yokozeki, K. Watanabe, N. Sakata and N. Otsuki, Appl. Clay. Sci. 26 (2004) 293 - 308.
20. A. Đureković, Cement and cementitious composites and concrete additives, Školska knjiga,
Zagreb, 1996, pp. 1-20 (in Croatian).

§ 7. Bibliography 96
Marija Đuroković PhD Thesis
21. V. Ukrainczyk, Concrete, Alcor, Zagreb, 1994, pp. 11 - 39 (in Croatian).
22. R. G. Blezard, The History of Calcareous Cements, in: P. C. Hewlett (Ed.) Lea’s Chemistry of
Cement and Concrete Fourth Edition, Oxford, Elsevier, 2005, pp. 1-23.
23. https://cembureau.eu/media/1716/activity-report-2017.pdf (accsessed 28. February 2019.)
24. C. D. Lawrence, The Constitution and Specification of Portland cements, in: P. C. Hewlett (Ed.)
Lea’s Chemistry of Cement and Concrete Fourth Edition, Oxford, Elsevier, 2005, pp. 131 - 193
25. I. Maki and S. Chromý, Cem. Concr. Res. 8 (1978) 407 - 414.
26. I. Maki and S. Chromý, Cemento 75 (1978) 247 - 252.
27. I. Maki, Cemento 76 (1979) 167 - 176.
28. I. Maki and K. Kato, Cem. Concr. Res. 12 (1982) 93 - 100.
29. I. Maki, Relationship of processing parameters to clinker properties; influence o minor
components, Proceedings of the 8th International Congress on the Chemistry of Cement, Volume
1, Rio de Janeiro, Brasil 1986, pp. 34 - 47.
30. V. V. Timashev, Cinétique de la clinkérisation structure et composition du clinker et ses phases,
Proceedings of the 7th International Congress on the Chemistry of Cement, Volume 1, Paris,
1980, pp.I-3/1- I-3/19 (english translation).
31. I. Maki and K. Goto, Cem. Concr. Res. 12 (1982) 301 - 308.
32. I. Maki, Cemento 81 (1984) 165 - 174.
33. I. Maki, Porcessing Condtions of Portland Cement Clinker viewd from the Fine Textures of the
Constituent Minerals, in: E. M. Gartner and H. Uchikawa (Eds.), Cement Technology, America
Ceramic Society, Westerville, 1994, pp. 3-17.
34. P. Barnes, C. H. Fentiman and J. W. Jeffery, Acta. Cryst. A36 (1977) 353 - 356.
35. K. Niesel and P. Thormann, Tonind. Zeit. 91 (1967) 362 - 369.
36. M. Regourd and A. Guinier, The crystal chemistry of the constituents of portland cement clinker,
Proceedings of the 6th International Congress on Chemistry of Cement, Volume 1, Moscow,
Soviet Union, 1974, pp. 1 - 82.
37. P. Monda and J. W. Jeffery, Acta Cryst. B31 (1975) 689 - 697.
38. I. Maki, Cem. Concr. Res. 3 (1973) 295 - 313.
39. I. Maki, Cem. Concr. Res. 4 (1974) 87 - 97.
40. D. K. Smith, Acta Cryst. 15 (1962) 1146 - 1152.
41. I. G. Richardson, C. Hall and G.W. Groves, Adv. Cem. Res. 5 (1993) 15 - 21.
42. R. H. Bogue, Ind. Eng. Chem. 1 (1929) 192 – 197.
43. H. F. W. Taylor, Adv. Cem. Res. 2 (1989) 73 – 77.
44. G .L. Saoût, V. Kocaba and K. Scrivener Cem. Concr. Res. 41 (2011) 133 – 148.
45. P. Stutzman, A. Heckert, A. Tebbe and S. Leigh, Cem.Concr.Res. 61-62 (2014) 40 – 48.

§ 7. Bibliography 97
Marija Đuroković PhD Thesis
46. A. M. Harrisson, H. F.W. Taylor and N.B. Winter, Cem. Concr. Res. 15 (1985) 775 - 780
47. H. F. W. Taylor, Adv. Cem. Res. 2 (1989) 73 - 77.
48. A. K. Chatterjee, X – Ray Diffraction, in: V. S. Ramachandran and J.J. Beaudoin (Eds.),
Handbook of Analytical Tehniques in Concrete Science and Technology, Noyes Publications/
Wiliam Andrew Publishing, LLC New York, 2001, pp. 275 - 327.
49. A. I. Boikova, Chemical compositon of raw materials as the main factor responsible for the
composition, structure and properties of clinker phases, Proceedings of the 8th International
Symposium on the Chemistry of Cement, Volume 1, Rio de Janeiro, Brasil, 1986, pp. 19 - 33.
50. M. A. G. Aranda , A. G. De la Torre and L. León – Reina, Rew. Mineral. Geochem. 74
(2012) 169 - 209.
51. P. E. Stutzman, P. Feng and J.W. Bullard Journal of Resarch of the National Institute of Standards
and Technology 121 (2016) 47 - 107.
52. H. M. Rietveld, Appl. Cryst. 2 (1969) 65 - 71.
53. L. León – Reina, A. G. de la Torre, J. M. Porra – Vásquez, M. Cruz, L. M. Ordonez, X. Alcobé,
F. Gispert – Guirado, A. Larraǹaga – Varaga, M. Paul, T. Fuellman, R. Schmidt and A. M .G.
Aranda J. Appl. Cryst. 42 (2000) 1 - 11.
54. I .G. Richardson, Cem. Concr. Res. 38 (2008) 137 - 158.
55. M. Achternbosch, K. R. Bräutigam, N. Hartliebe; C. Kupsch, U. Richers, P. Stemmermann and M.
Gleis., Heavy metals in cement and concrete resulting from co-inceretion of wastes in cement
kilns with regard to the legitimacy of waste utilization, FZK, Karlsruhe, 2003, pp. 15 – 105.
56. S. Bodaghpour, N. B. Joo and S. Ahamdi, Int. J. Geol. 6 (2012) 62 - 67.
57. C. J. Engelsen, Effects of mineralizes in cement production, Concrete Innovation Centre,
Trondheim, 2007, pp. 4 - 15.
58. D. Herfort, G. K. Moir, V. Johansen, F. Sorrentino and H. Bollio - Arceo, Adv. Cem. Res. 22
(2010) 187 - 194.
59. J. M. Díez, J. Madrid and A. Macías, Cem. Concr. Res. 2 (1999) 479 - 485.
60. F. P. Glasser, The Burning of Portland Cement , in: P. C. Hewlett (Ed.) Lea’s Chemistry of
Cement and Concrete Fourth Edition, Oxford, Elsevier, 2005, pp. 195 - 240.
61. S. Sinyoung, P. Songsiriritthigul, S. Asavapisit and P. Kajitvichyanukul, J. Hazard. Mater. 191
(2011) 296 - 305.
62. J. I. Bhatty, Effect of Minor Elements on Clinker and Cement Performance, Portland Cement
Association, Shokie, Illinous, 2006, pp. 35.
63. H. Hornain, Rev. Mater. Constr. 671-672 (1971) 203 - 218.
64. K. Kolovos, T. Tsivilis and G. Kakali, Cem. Concr. Compos. 27 (2005) 163 - 170.
65. X. W. Ma, H. X. Chen and P. M. Wang, Cem. Concr. Res. 40 (2010) 1681 - 1687.

§ 7. Bibliography 98
Marija Đuroković PhD Thesis
66. S. Sinyoung, E. Taweekitwanit and P. Kajitvitchyanukul, Adv. Mater. Res. (Durnten – Zurich,
Switz.) 1103 (2015) 121 - 127.
67. H. Bolio - Arceo and F. P. Glasser, Adv. Cem. Res. 12 (2000) 173 - 179.
68. D. Knöefel, ZKG Int. 31 (1978) 157 - 161.
69. L. Wang, R. D. Li, Y. L. Li and L. H. Wei, Adv. Mat. Res. 347-353 (2010) 2160 - 2164.
70. Y. Yang and J. Xue, Q. Huang, Sci. World. J. 2103 (2013), 1 - 6
71. L. Wang,Y. Jin, R. D. Li and Y. Nie, J. Chem. Ind. Eng. 62 (2011) 816 - 822.
72. G. Cornelis, C. A. Johnson, T. V. Gerven and C. Vandercasteele, Appl. Geochem. 23 (2008)
955 - 976.
73. H.F.W. Taylor, Cement Chemistry 2nd Edition, London, Thomas Telford, 1997, pp.113 - 156.
74. A. Đureković, Cement and cementitious composites and concrete additives, Institut građevinarstva
Hrvatske i Školska knjiga, Zagreb 1996, pp 21 - 251.
75. H. F. W. Taylor, Chemistry of cement hydration, Proceedings of the 8th International Symposium
on the Chemistry of Cement, Volume 1, Rio de Janeiro, 1986, pp. 82 - 110.
76. J .J. Chen, J. J. Thomas, H. F. W. Taylor and H. M. Jennings, Cem. Concr. Res. 34 (2004)
1499 - 1519.
77. A. B. Carpenter, R. A. Chalmers, J. A. Gard, K. Speakman and H. F. W. Taylor, Am. Mineral. 51
(1966) 56 - 74.
78. N. Hara and N. Inoue, Cem. Concr. Res. 10 (1980) 677 - 682.
79. J. E. Rossen, Composition and morphology of C-A-S-H in pastes of alite and cement blended with
supplementary cementitious materials, PhD Thesis, École Polytechnique Fédérale de Lausanne,
Switzeland, 2004, pp. 9 - 12.
80. S. Merlino, E. Bonacorsi and A. R. Kampf, 14Å: crystal structure and OD character, in:
D. Rammlmair, J. Mederer, T. Oberthür, R. B. Heimann and H. Pentinghaus (Eds.), Applied
Mineralogy, Balkema, Rotterdam, 2000, pp 859-861.
81. E. Bonaccorsi, S. Merlino, and H. F.W. Taylor, Cem. Concr. Res. 34 (2004) 1481 - 1488.
82. K. Garbev, M. Bornefeld, G. Beuchle and P. Stemmermann, J. Am. Ceram. Soc. 91 (2008)
3015 - 3023.
83. E. Bonaccorsi, S.Merlino and A. R. Kampf, J. Am. Ceram. Soc. 88 (2005) 505 – 512.
84. I. G. Richardson, Cem.Concr.Res. 34 (2004) 1733 – 1777.
85. L. S. Dent Glasser, E. E. Lachowski, K. Mohan and H. F.W. Taylor, Cem. Concr. Res. 8 (1978)
733 - 740.
86. P. J. Le Sueur, D. D. Double and G. W. Groves, Chemical and porphological studies of the
hydration ot tricalcium silicate, Proc. Br. Ceram. Soc. 35 (1984) pp. 249 - 266.
87. M. W. Grutzeck and D. M. Roy, Nautre 223 (1969) 492 – 494.

§ 7. Bibliography 99
Marija Đuroković PhD Thesis
88. D. J. Rayment and A. J. Majumdar, Cem. Concr. Res. 12 ( 1982) 133 - 140.
89. H. F. W. Taylor and D. E. Newbuury, Cem. Concr. Res. 14 (1984) 565-573.
90. I. G. Richardson and G. W. Groves, J. Mater. Sci. 28 (1993) 265 - 277.
91. G. W. Groves, P. J. Le Sueur and W. Sinclair, J. Am. Ceram. Soc. 69 (1986) 353 - 356.
92. I. G. Richardson, Cem. Concr. Res. 29 (1999) 1131 - 1147.
93. H. F. W. Taylor, J. Am. Ceram. Soc. 69 (1986) 464 - 467.
94. S. Chatteriji and J. W. Jeffery, Nature 209 (1966) 1233 - 1234.
95. S. Diamond, Cement paste microstructure—an overview at several levels, in: Hydraulic cement
pastes: Their structure and properties; Proceedings of a conference held at the University of
Sheffield; 8–9th April 1976. Slough: Cement and Concrete Association; 1976. pp. 2 – 30.
96. S. Goto, M. Daimon, G. Hosaka and R. Kondo, J. Am. Ceram. Soc. 59 (1976) 281 - 284.
97. R. B. Williamson, Prog. Mater. Sci. 15 (1972) 189 - 286.
98. H. M. Jennings, B. J. Dalgleish and P. L. Pratt, J. Am. Ceram. Soc. 64 (1981) 567 - 572.
99. K. Fujii and W. Kondo, Hydration of Tricalcium Silicate in a Very Early Stage, Proceedings of
5th International Symposium on the Chemistry of Cement, Volume II, Tokyo, Japan, 1968,
pp. 362 - 371.
100. G. W. Groves, Mater. Res. Soc. Symp. Proc. 85 (1985) 3 - 12.
101. J .D. Bernal and H .D. Megaw, Proc. Roy. Soc. A151 (1935) 384 - 420.
102. H. E. Petch, Acta. Cryst. 14 (1961) 950 - 957
103. R. J. Bartlett and G. D. Purvis, Int. J. Quantum Chem. 14 (1978) 561 – 581.
104. J. Skalny and J.F. Young, Mechanisams of portland cement hydration, Proceedings of the 8th
International Symposium on the Chemistry of Cement, Volume 2, Paris, France 1980, pp.
II - 1/3 - 1/45.
105. J. J. Beaudoin, Matér. Constr. 20 (1987) 27 - 31.
106. H. F. W. Taylor and A. B. Turner, Cem. Concr. Res. 17 (1987) 613 - 623.
107. H .F. W. Taylor, Cement Chemistry 2nd Edition, London, Thomas Telford, 1997,
pp. 187 - 225.
108. G. Renaudin, A. Mesbah, B. Z. Dilnesa, M. Fracois and B. Lottenbach, Curr. Ingorg. Chem.
5 (2015) 1 - 10.
109. G. W. Groves, Cem. Concr. Res. 11 (1981) 713 - 718.
110. D. Viehland, J. - F. Li, L. - J. Yuan and Z. Xu, J. Am. Ceram. Soc. 79 (1996) 1731 - 1744.
111. G. Strohbauch and H.-J. Kuzel, ZKG Int. 41 (1988) 358 - 360.
112. J. W. Bullard, H. M. Jennings, R. A. Livingston, A. Nonat, G. W. Scherer, J. S. Sweitzer, K.
L. Scrivener and J. J. Thomas, Cem. Concr. Res. 41 (2011) 1208 - 1223.

§ 7. Bibliography 100
Marija Đuroković PhD Thesis
113. H. F. W. Taylor, Cement Chemistry 2nd Edition, London, Thomas Telford, 1997,
pp. 227 - 259.
114. T. C. Powers, Physical Properties of Cement Paste, Proceedings of the 4th International
Conference on the Chemistry of Cement, Volume 2, Washington, USA, 1960, pp. 577 - 613.
115. IUPAC Manual of symbols and terminology Appendix 2, Part 1 „Colloid and surface
chemistry, Pure Appl.Chem, 31 (1972) 578 - 638.
116. S. Diamond, Cem. Concr. Comp. 26 (2004) 919 – 933.
117. K. L. Scrivener, Cem. Concr. Comp. 26 (2004) 935 – 945.
118. D. L. Coke and M. Y. A. Mollah, J. Hazard. Mater. 24 (1990) 231 - 253.
119. D. Bonen and S. L. Sarkar, The Present State – of – the – art of Immobiliaztion of Hazardous
Heavy Metals in Cement – based Materials, in: M. W. Grutzeck and S. L. Sarkar (Eds.) Advances
in Cement and Concrete Research, Engineering Foundation Conference held at New England
Center, the University of Hampshire, Durham, NH, American Society of Civil Engineers, New
York, 1994, pp. 481 - 498.
120. F. P. Glasser, Chemistry of Cement – Solidified Forms, in: R. D. Spence (Ed.) Chemistry and
Microstructure of Solidified Waste Forms, Boca Raton, Lewis Publishers, 1993, pp. 1 - 39.
121. A. Poletitini, R. Pomi and P. Sirini, Environ. Sci. Technol. 36 (2002) 1584 - 1591.
122. I. Moulin, J. Rosea, W. Stone, J. - Y. Bottereo, F. Mosnier and C. Haelmel, Lead, zinc and
chromium (III) and (VI) speciaction in hydrated cement phases, in: G. R. Woolley, J. J. J.
Goumans, P. J. Wainwright (Eds.), Waste Materials in Construction, Elsevier, Amsterdam, 2000,
pp. 269-280.
123. F. Ziegler, R. E. M. Scheidegger, C. A. Johnosn, R. Dahen and E. Wieland, Environ. Sci.
Technol. 35 (2001) 1550 - 1555.
124. P. Kumarathasan, G. J. McCarthy, D. J. Hassett and D. F. Pflughoeft - Hassett, Oxyanion
substituted ettringites: synthesis and characterization, and their potential role in immobilization of
As, B, Cr, Se and V, Proceedings of the Material Research Society Symposium, Volume 178,
Cambridge University Press, 1989, pp. 83 - 104.
125. O. P. Shrivastava and F.P. Glasser, React. Solids 2 (1986) 261 - 268.
126. K. Noshita, T. Nishi, T. Yoshida, H. Fujihara, N. Saito and S. Tanaka, Categorization of
cement hydrates by radionuclide sorption mechanism, Proceedings of the Material Research
Society Symposium, Volume 663, Cambridge University Press, 2001, pp. 115 - 121.
127. T. Phenrat, T. F.Marhaba and M. Rachakornkij, J. Hazard. Mat. 118 (2005) 185 - 195.
128. M. Atkins, F. P. Glasser, L. P. Moroni and J. J. Jack, Thermodynamic modeling of blended
cements at elevated temperatures (50-90°C), Aberdeen University, United Kingdom, 811
DoE1HMIP1RR/94.011, 1994.

§ 7. Bibliography 101
Marija Đuroković PhD Thesis
129. F. K. Cartledge, L. G. Butler, D. Chalasani, H. Eaton, F. P. Frey, E. Herrera, M. T. Tittlebaum
and S. Yang, Envirnon. Sci. Technol. 24 (1990) 867 - 873.
130. C. H. Mattus, A. J. Mattus, Literature review of the interaction of select inorganic species the
set and properties of cment and mehods of abatement through pretreatment in: T.M. Gilliam, C.C.
Wiles (Eds.), Stabilization and Solidification of Hazardous, Radioactive and Mixed Wastes: 3rd
Volume, ASTM, Philadelphia, 1996, pp. 609 - 633.
131. A. M. Scheidegger, E. Wieland, A. C. Scheinost, R. Dähn and P. Spieler, Environ. Sci.
Technol. 34 (2000) 4545 - 4548.
132. M. Vespa, D. Raehn, E. Wielnad, D. Grolimund and A. M. Scheidegger, Czech. J. Phys. 56D
(2006) D599 - D607
133. F. Ziegler, R. Giere and C. A. Johnoson, Environ. Sci. Technol. 35 (2001) 4556 - 4561.
134. V. Dutré and C. Vandecasteele, Waste Manag. 1 (1995) 55 - 68.
135. J. E. Aubert, B. Husson and N.Sarramone, J. Hazard. Mater. 147 (2007) 12 - 19.
136. G. Cornelis, B. Etschmann, T. V. Gerven and C. Vandecasteele, Cem. Concr. Res. 42 (2012)
1307 - 1316.
137. G. Cornelis, T. V. Gerven, R. Snellings, J. Elsen and C. Vandercasteele, Appl. Geochem. 26
(2011) 809 - 817.
138. D. C. Johnson, N. J. Coleman, J. Lane, C. D. Hills and A. B. Pole, A preliminary investigation
of the removal of heavy metal species from aqueous media using crushed concrete fines, in: G. R.
Woolley, J. J. J. Goumans, P. J. Wainwright (Eds.), Waste Materials in Construction, Elsevier,
Amsterdam, 2000, pp. 1044 - 1049.
139. A. Vollpracht, B. Lothenbach, R. Snellings and J. Haufe, Mater. Struct. 49 (2016)
3341 - 3367.
140. R. D. Hooton, M .D. A. Thomas and T. Ramlochan, Adv. Cem. Res. 22 (2010) 203 - 210.
141. A. Goldschmit Cem. Concr. Res. 12 (1982) 743 - 746.
142. M. Michaux, P. Fletcher and B. Vidick, Cem. Concr. Res. 19 (1989) 443 - 456
143. J. Duchesne and M. A. Bérubé, Cem. Concr. Res. 24 (1994) 221 - 230.
144. J. Tritthart, Cem. Concr. Res. 19 (1989) 586 - 594.
145. B. Lottenbach and F. Winnefeld, Cem. Concr. Res. 36 (2006) 209 - 226.
146. S - Y. Hong and F. P. Glasser, Cem. Concr. Res. 29 (1999) 1893 - 1903.
147. J. Kempel, O. Çorpuroğlu, The interaction of pH, pore solution composition and solid phase
composition of carbonated blast furnace slag cement activated with aqueous Na-MFP,
Proceedings of the15th Euroseminar on Microscopy Applied to Building materials, Delft
University of Technology, Deft, 2015, pp. 287 - 296.

§ 7. Bibliography 102
Marija Đuroković PhD Thesis
148. Institute for Prospective Technological Studies, Sustainable Production and Consumption
Unit, European IPPC Bureau, Best Available Techniques (BAT) Reference Document for the
Production of Cement, Lime and Magnesium Oxide, 2013.
149. https://cembureau.eu/media/1500/cembureau_2050roadmap_lowcarboneconomy_2013-09-01.pdf
(accsessed 28 February 2019).
150. L. Bacarelo, J. Kline, G. Walenta and E. Gartner, Mater. Struct. 47 (2014) 1055 – 1065.
151. Croatian Standards Institute, HRN EN 197-1:2012 Cement – Part 1: Composition,
specification and conformity criteria for common cements (EN 197-1:2011).
152. E. Gartner, Scientific and Societal Issues involved in developing sustainable cements, in: R.K.
Dir, M.D. Newlands, L. J. Csetenyi (Eds.) Role of Cement Science in Sustainable Development,
London, Thomas Telford, 2003, pp. 445 - 458.
153. L. Zhang, M. Su and Y. Wang, Adv. Cem. Res. 11 (1999) 15 - 21.
154. T. Sui and Y. Yao, Recent progress in special cements in China, Proceedings of the 11th
International Congress on the Chemistry of Cement, Volume 4, Durban, South Africa, 2003,
pp. 2028 - 2032.
155. J. Péra and J. Ambroise, Cem. Concr. Res. 34 (2004) 671 - 676.
156. D. Gastaldi, F. Canonico and E. Boccaleri, J. Mater. Sci. 44 (2009) 5788 - 5794.
157. W. Lan and F.P. Glasser, Adv. Cem. Res. 8 (1996) 127 - 134.
158. H. Saalfeld and W. Depmeier, Krist. Tech. 7 (1972) 229 - 233.
159. P. E. Halstead and A. E. Moore, J. Appl. Chem. 12 (1962) 413 - 417.
160. Z. Peixing, C. Yimin, S. Piping, Z. Guanying and H. Wenmel, The crystal structure of C4A3�̅,
Proceedings of the 9th International Congress on the Chemistry of Cement, New Delhi, India
1992, pp. 201 - 208.
161. W. J. Calos, C. H. Kennard, A. K. Whittaker and R. L. Davis, J. Solid State. Chem. 119 (1995)
1 - 7.
162. I. Pajares, A. G. Dela Torre, S. Martinez - Ramirez, S. Puertas, M. T. Blanco - Varela and M.
A. G. Aranda. Powder Diffr 17 (2002) 281 - 286.
163. C. W. Hargis, J. Moon, B. Lothenbach, F. Winnefled, H. R. Wenk and P. J. M. Monteiro, J.
Am. Ceram. Soc. 97 (2014) 892 - 898.
164. A. Cuesta, A.G. Dela Torre, E. R. Losilla, K.V. Petterson, P. Rejmak, A. Ayuela, C. Frontera
and M.A.G. Aranda, Chem. Mater. 25 (2013) 1680-1687.
165. F. Bullerjahn, D. Schmitt and M. Ben Haha, Cem. Concr. Res. 59 (2014) 87-95
166. M. A. G. Aranda and A .G. Dela Torre, Sulfoaluminate cements, in F. Pacheo – Torgal, S.
Jalali and J. Labrinda (Eds.) Eco – efficient concrete, Cambridge, Woodhead Publishing Limited,
2013, pp. 488 - 522.

§ 7. Bibliography 103
Marija Đuroković PhD Thesis
167. F. Winnefeld and S. Barlag, J. Them. Anl. Calorim. 101 (2010) 949 - 957.
168. G. Álvaerz - Pinazo, A. Cuesta, M. García - Maté, I. Santacruz, E. R. Losilla, A. G. De la
Torre, L. León - Reina and M. A. G. Aranda, Cem. Concr. Res. 42 (2012) 960 - 971.
169. I. Janotka, U. Krajci and S. C. Mojumdar, Cerm. Silik. 51 (2007) 74 - 81.
170. M. C. Martín - Sedeño , A. J. M. Cuberos, A. G. De la Torre, G. Álvaerz - Pinazo, L. M.
Ordónez, M. Gateshki and M. A. G. Aranda, Cem. Concr. Res. 40 (2010) 359 - 369.
171. Q. Zhou, N. B. Milestone and M. Hayes, J. Hazard. Mater. 136 (2006) 120 - 129.
172. J. Li, H. Ma and H. Zhao, Key Eng. Mater. 334-335 (2007) 421 - 424.
173. J. Beretka, B. De Vito, L. Santoro, N. Sherman and G. L. Valenti, Cem. Concr. Res. 23 (1993)
1205 - 1214.
174. S. Sahu and J. Majling, Cem. Concr. Res. 24 (1994) 1065 - 1072.
175. J. Majling and J. Strigac, Adv. Cem. Res. 11 (1999) 27 - 34.
176. P. Arjunan, M. Silsbee and D. M. Roy, Cem. Concr. Res. 29 (1999) 1305 - 1311.
177. P. K. Mehta and P. J. M. Monteiro, Concrete: Microstructure, Properties and Materials,
McGraw-Hill, New York, 2006, pp. 177 - 203.
178. F. Adenot and M. Buil, Cem. Concr. Res. 22 (1992) 489 - 496.
179. M. Mainguy, C. Tognazzi, J. M. Torrenti and F. Adenot, Cem. Concr. Res. 30 (2000) 83 - 90.
180. T. H. Wee, J. Zhua, H. T. Chua and S. F. Wong, ACI. Mater. J. 98 (2001)184 - 193.
181. S. Kamali, B. Gerrard and M. Moranville, Cem. Concr. Compos. 25 (2003) 451 - 458.
182. J. Jain and N. Neithalath, Cem. Concr. Comps. 31 (2009) 176 - 185.
183. F. P. Glasser, J. Marchand and E. Samson, Cem. Concr. Res. 38 (2008) 226 - 246.
184. R. D. Hooton, M. D. A. Thomas and T. Ramlochan, Adv. Cem. Res. 22 (2010) 203 - 210.
185. P. K. Mehta and P. J. M. Monteiro, Concrete: Microstructure, Properties and Materials,
McGraw-Hill, New York, 2006, pp. 203 - 251.
186. P. Faucon, F. Adenot, M. Jorda and R. Cabrillac, Mater. Struct. 30 (1997) pp. 480 - 485.
187. P. Faucon, F. Adenot, J. F. Jacquinot, J. C. Petit, R. Cabrillac and M. Jorda, Cem. Concr. Res.
28 (1998) 847 - 857.
188. C. Carde, R. Franqois and J. M. Torrenti, Cem. Concr. Res. 26 (1996) 1257 - 1268.
189. F. H. Heukamp, F. J. Ulm and J. T. Germaine, Cem. Concr. Res. 31 (2001) 767 - 774.
190. G. J. Verbeck and R. H. Helmuth, Structure and physical properties f hardened cement,
Proceedings of the 5th International Symposium on the Chemistry of Cement, Volume 3, Tokyo,
Japan, 1968, pp. 1-32.
191. Q. Y. Chen, M. Tyrer, C. D. Hills, X.M. Yang and P. Carey, Waste Manag. 29 (2009) 390 –
403.

§ 7. Bibliography 104
Marija Đuroković PhD Thesis
192. A. Hidalgo, S. Petit, C. Domingo, C. Alonso and C. Andrade, Cem. Concr. Res. 37 (2007)
63 - 70.
193. K. Yozeki, K. Watanabe, N. Sakata and N. Otsuki, Appl Clay Sci, 26 (2004) 293 - 308.
194. C. Carde, R. François and J. M. Torrenti, Cem. Concr. Res. 26 (1996) 1257 - 1268
195. T. Matschei, B. Lotenbach and F. P Glasser, Cem. Concr. Res. 37 (2007) 118 - 130
196. A. Berton, J. Duchesne and G. Escadeillas, Cem. Concr. Res. 35 (2005) 155 - 166
197. H. Saito and A. Deguchi, Cem. Concr. Res. 30 (2000) 1815 - 1825.
198. Croatian Standards Institute, HRN EN 196-2: 2013 Methods of testing cement – Part 2.
Chemical analysis of cement (EN 196-2:2013).
199. American Society for Testing and Materials, ASTM C 114 – 07 Standard test methods for
analysis of hydraulic cement.
200. G. Morrsion, H. Cheng and M. Grasserbauer, Pure Appl. Chem. 51 (1979) 2243 - 2250.
201. A. Santro, A. Held, T.P.J. Linsinger, A. Perez and M. Ricci, Trends Analyt. Chem. 89 (2017)
34 - 40.
202. Croatian Standards Institute, HRI CEN/TR 196-4:2017 Methods of testing cement – Part 4:
Quantitative determination of constituents (CEN/TR 196-4:2007).
203. K. Scrivener and A. Nonat, Cem. Concr. Res. 41 (2011) 651 - 665.
204. T. Degen, M. Sadki, E. Bron, M. König, G. Nènert, Powder. Diffr. 29 (S2) (2014) S13 – S18
205. American Public Health Association, American Water Works Association, Water
Envrionmental Federation, R. B. Barid A. D. Eaton, E.W. Rice, Standard methods 23rd editon
Washington DC, 2017, pp. 2 - 56.
206. American Public Health Association, American Water Works Association, Water
Envrionmental Federation, R. B. Barid A. D. Eaton, E.W. Rice, Standard methods 23rd editon
Washington DC, 2017, pp. 2 - 66.
207. American Public Health Association, American Water Works Association, Water
Envrionmental Federation, R. B. Barid A. D. Eaton, E.W. Rice, Standard methods 23rd editon
Washington DC, 2017, pp. 2 - 48.
208. Croatian Standards Institute, HRN EN 17294-2:2016 Water quality – Application of
inductively coupled plasma mass spectrometry (ICP-MS) – Part 2: Determination of selected
elements including uranium isotopes (ISO 17294-2:2016; EN ISO 17294-2:2016).
209. Croatian Standards Institute, HRN EN 15216:2008 Characterization of waste - Determination
of total dissolved solids (TDS) in water and eluates (EN 15216:2007).
210. Croatian Standard Institute, HRN EN 196-1: 2016 Methods of testing cement – Part 1:
Determination of strength (EN 196-1:2016).

§ 7. Bibliography 105
Marija Đuroković PhD Thesis
211. Croatian Standards Institute, HRN EN 12390-13:2003 Testing hardened concrete - Part 13:
Determination of secant modulus of elasticity in compression (EN 12390-13:2013).
212. Croatian Standards Institute, HRN EN 12617-4:2003 Products and systems for the protction
and repair of concrete structures – Test methods – Part 4: Determination of shirnkage and
expansion (EN 12617-4:2002).
213. Croatian Standards Institute, HRN EN ISO 15148:2004 Hygrothermal performance of
building materials and products - Determination of water absorption coefficient by partial
immersion (ISO 15148:2002; EN ISO 15148:2002).
214. Croatian Standards Institute, HRN EN 993-4:2008 Methods of test for dense shaped refractory
products - Part 4: Determination of permeability to gases (EN 993-4:1995).
215. Croatian Standards Institute, HRN EN 480-11: 2005 Admixtures for concrete, mortar and
grout - Test methods - Part 11: Determination of air void characteristics in hardened concrete (EN
480-11:2005)
216. F. Nishi, Y. Takeuchi, Y. Maki, Z. Kristallogr. Cryst. Mater. 172 (1985) 297 – 314
217. K. H. Jost, B. Ziemer, R. Seydel, Acta Crystallogr. B 33 (1977) 1696 – 1700
218. P. Mondal, J. W. Jeffery, Acta Crystallogr. B 31 (1975) 689 – 697
219. Y. Takeuchi, Maki I., Z. Kristallogr. Cryst. Mater. 152 (1980) 259 – 307
220. A. C. Jupe, J. K. Cockoroft, P. Barnes, S. L. Colston, G. Sankar, C. Hall, J. Appl. Cryst. 34
(2001) 55 – 61
221. T. Pialti, F. Demartin, C.M. Gramaccioli, Acta Crystallogr. B 54 (1998) 515 – 523
222. K. Ojima, Y. Nishihata, A. Sawada, Acta Crystallogr. B 51 (1995) 287 – 293
223. C. Bezon, A. Nonant, A. N. Christensen, M. S. Lehmann, J. Solid State Chem. 117 (1995)
165 – 176
224. P. F. Schofield, C. C. Wilson, I. C. Stretton, Z. Kristallogr. Cryst. Mater. 215 (2000) 707 - 710
225. A. Kirfel, G. Will, Acta Crystallogr. B 36 (1980) 2881 – 2890
226. P. Ballirano, G. Belardi, A. Maras, Neu. Jb. Mineral. Abh. 182 (2005) 15 – 21
227. H. F. W. Taylor, Cement Chemistry 2nd Edition, London, Thomas Telford, 1997, pp. 55 - 87.
228. H. F. W. Taylor, Cement Chemistry 2nd Edition, London, Thomas Telford, 1997,
pp. 261 - 295.
229. A. Guesta, A. G. De la Torre, E. R. Losilla, V. K. Peterson, P. Rejmak, A. Ayuela, C.
Frontera, M. A. G. Aranda, Chem. Mater. 25 (2013) 1680 - 1687
230. A. Saalfeld, W. Depmeier, Krist. Tech. 7 (1972) 229 – 233
231. V. I. Mokeera, E. S. Makarov, Geokhimiya 1979 (1979) 1541 – 1544
232. H. Bartl, T. Scheller, Z. Kristallogr. Cryst. Mater. 95 (1936) 175 – 175
233. S. Sasaki, K. Fujino, Y. Takeuchi, Proceedings of the Japan Academy 55 (1979) 43 – 48

§ 7. Bibliography 106
Marija Đuroković PhD Thesis
234. H. E. Petch, Acta Crystallogr. 14 (1961) 950 – 957
235. M. R. Hartman, R. Berliner, Cem. Concr. Res. 36 (2006) 364 – 370
236. I. Santacruz, G. Alvarez-Pinazo, A. Cabeza, A. Cuseta, J. Sanz, M.A.G. Aranda, Adv. Cem.
Res. 28 (2016) 13 - 22