childhood obesity: is there a public health crisis in...
TRANSCRIPT

MDM4U Summative Assignment
________________________________________________________________________
________________________________________________________________________ January 2011
Childhood Obesity: Is there a Public Health Crisis in Canada?

MDM4U Summative Assignment
________________________________________________________________________
_______________________________________________________________________ 1 January 2011
Abstract
This study investigated childhood obesity in Canada to determine whether an
epidemic existed. Potential contributing factors, such as levels of physical activity,
sedentary activity and family income were also examined. All the data examined
from the Canadian Community Health Survey were extracted from E-Stat and
Statistics Canada and analyzed using correlation analysis and descriptive
statistics. Findings revealed no relation between levels of inactivity and obesity,
and a negative correlation between levels of physical activity and obesity. It was
concluded that there is an obesity epidemic among children in Canada.

MDM4U Summative Assignment
________________________________________________________________________
_______________________________________________________________________ 2 January 2011
Executive Summary
The focus of this study was to investigate the obesity epidemic in Canada and to
determine what factors potentially have played a role in the high levels of obese
and overweight children in Canada. Studies examined through a literature review
found that two major causes of obesity were over eating and lack of physical
exercise. Along with no exercise, levels of inactivity or sedentary activity have
increased greatly as well. The studies unanimously concluded that prevention was
key to ending the worldwide obesity epidemic.
This study focused specifically on Canada with analyses illustrating that
approximately one in four Canadian children aged 2 to 17 were struggling with a
weight problem. It was also deduced that higher concentrations of overweight or
obese children were found in the Maritime Provinces. Analyses indicated that in
regions with increased levels of physical activity, the percentage of overweight or
obese children was lower, and that provinces with higher percentages of families
with low income had higher percentages of overweight or obese children. Data
concerning sedentary activity was limited and did not provide conclusive results.
Data were not available for children in the Northwest Territories and Yukon.
The research concluded that Canada is facing an obesity epidemic but there is no
single factor that has led to such high levels of overweight and obese children. It
was also discovered that the Maritime Provinces contained higher concentrations
of obese children than the other regions of Canada and that a negative correlation
exists between obesity rates and hours of physical activity. This means that the
more time spent exercising, the lower the percentage of obese or overweight
children. Lastly the study deduced that the percentage of low income families is
directly proportional to the percentage of the population who are overweight or
obese.

MDM4U Summative Assignment
________________________________________________________________________
_______________________________________________________________________ 3 January 2011
Table of Contents
Rational for the Study 4-5
Literature Review 6-10
Research Methodology 11-12
Analyses & Findings
i. Is there an obesity epidemic in Canada? 13-15
ii. Is there a correlation between level of obesity and physical activity? 15-18
iii. Is there a correlation between level of obesity and sedentary activity? 18-21
iv. Is there a relationship between obesity and household income? 21-22
Conclusions 23-24
Appendices
i. Appendix A – Data Tables 25-27
ii. Appendix B – Newspaper Articles 28-29
References 30
Glossary 31

MDM4U Summative Assignment
________________________________________________________________________
_______________________________________________________________________ 4 January 2011
Rationale for the Study
This study investigated the following four research questions:
Is there an obesity epidemic in Canada?
Is there a correlation between level of obesity and physical activity?
Is there a correlation between level of obesity and sedentary activity?
Is there a relationship between obesity and household income?
The study examined whether Canada, as a nation, was facing a childhood obesity
epidemic. From this, further analysis explored whether the percentage of obese or
overweight children varied from province to province, and if province of residence
had an effect on body mass index (BMI).
Following the initial analysis, the study examined possible factors linked to obesity
levels in Canada. Factors identified from the literature review, such as levels of
physical activity and levels of sedentary activity were investigated first. Cross-
province comparisons were done to determine linkage between levels of obesity or
overweight children residing in each province and levels of physical activity or
sedentary behaviour. A third factor, family income level, was researched with the
prospect of potentially detecting a link between low income and obesity.
The study was feasible however limitations to the data must be taken into
consideration. Limitations were as follows:
Children from the Northwest Territories and the Yukon were not included
in the study as there was no data available.
There was only data on physical activity for children between the ages of
6-11 and sedentary activity between the ages of 12-17 making a
comparison between the data sets unfeasible.

MDM4U Summative Assignment
________________________________________________________________________
_______________________________________________________________________ 5 January 2011
No longitudinal data was available to look at changes over time so the
study examined only one point in time, the year 2004.
Based on the literature review, it was anticipated that results from the analysis
would lead to findings that supported other documented research which identified
physical inactivity as a contributing factor in obesity.
This study should appeal to educators, health practitioners, public health
educators and Canadian parents concerned with their children’s well-being.
From a personal point of view, this study is of interest because I am planning to
study medicine and hope to become actively involved in the field of child health.
For this reason, I am concerned about the impact on health care that childhood
obesity will have on our generation as a whole and for those to follow.

MDM4U Summative Assignment
________________________________________________________________________
_______________________________________________________________________ 6 January 2011
Literature Review
Numerous issues related to obesity were identified in an important article
published in the prestigious medical journal The Lancet (Ebbeling, Pawlak, &
Ludwig, 2002). The study revealed that there had been a dramatic increase in
childhood obesity worldwide over the past two decades. Being overweight or
obese were major risk factors for a number of chronic diseases, including
diabetes, cardiovascular disease and cancer. Once considered a problem only in
developed countries, obesity was found to be on the rise in developing, low-
income countries as well.
Ebbeling et al., (2002) illustrated how research has provided new insights into the
causes of childhood obesity. Although genetic factors have played a role, the
sharp increase in childhood obesity rates suggested that it is predominantly
environmental factors that are the cause. Lack of physical activity, particularly TV
viewing, has been identified as a key factor. A national study in the U.S. showed
that children who engaged in little physical activity or spent long hours watching
TV were the most overweight. TV viewing not only replaced physical activity, it
increased the eating of energy-dense foods. The study also revealed that U.S. and
British children saw on average 10 food commercials per hour advertising fast
food, soft drinks, and sugar-sweetened cereals. This increased the likelihood that
children would make poor food choices.
According to the study (Ebbeling et al., 2002), fat intake has decreased over the
years and the proportion of total calories consumed as fat in the average diet is
diminishing. This however does not mean that fats are not a contributing factor in
the diet of obese children. Trans fats, commonly found in fast foods, have been
linked to an increased risk for heart disease and type 2 diabetes. While fat intake

MDM4U Summative Assignment
________________________________________________________________________
_______________________________________________________________________ 7 January 2011
Literature Review Methodology As a first step, a comprehensive article in a well-known, prestigious journal that was identified. Ebbeling et al., (2002) identified 164 pieces of original research, reviews, and commentaries by searching computer databases—eg, Medline, PsycINFO, Agricola, Lexis-Nexis—and by reviewing issues of journals that publish obesity research. Next the findings of Ebbeling et al., (2002) were validated by comparing their study to several other childhood obesity studies found through a Google search. The findings of these studies reached many of the same conclusions as the Ebbeling et al., (2002) study. Finally, in order to determine if the same childhood obesity issues were present in Canada, a comprehensive study completed by Statistics Canada was compared to findings from the other studies reviewed.
has decreased, carbohydrate intake in the form of refined foods (such as bread,
cereal, soft drinks etc) has increased. Large portions of carbohydrate rich foods
produce high blood sugar levels which stimulate hunger and cause overeating.
Soft drinks are a common source of carbohydrates. Research has shown that total
energy intake was 10% higher among school children who drank soft drinks when
compared to those who did not. By contrast, milk (a low-sugar drink) has been
found to protect young adults from becoming obese.
The study (Ebbeling et al., 2002) also discussed how everyday family life had
changed over the past 20 years. Trends had developed in which eating out and
watching TV have become more
frequent and common activities.
At restaurants, children
consumed more energy due to
the larger serving sizes of energy
dense foods. It was also observed
that the presence of a TV in the
bedroom increased viewing by
approximately 38 minutes a day.
By contrast, eating family dinners
together reduced the hours of TV viewing and improved diet quality. Time spent
together as a family also provided social support for children which in turn
increased participation in physical activity.
Ebbeling et al., (2002) also investigated prevention and treatment of childhood
obesity. Treatment solutions such as eating smaller portions and being more
active have proved to be challenging. Earlier studies had determined that long-
term weight loss was very difficult to achieve, thus, prevention had become more

MDM4U Summative Assignment
________________________________________________________________________
_______________________________________________________________________ 8 January 2011
of a main focus. Unfortunately, many have invested in family-based or school-
based programs and few of these programs have shown any long-term benefits.
The study (Ebbeling et al., 2002) concluded that childhood obesity has risen at
alarming rates worldwide. It was also found that obesity has been linked to the
development of serious medical complications both physically and psychologically.
Better prevention and treatment methods need to be developed and more
research and study is required to solve this public health crisis.
In order to further validate the findings of Ebbeling et al., (2002), a comparison
was done between their findings and a number of other childhood obesity studies.
The first study examined (Daniels et al., 2005) came to a similar conclusion that
the number of overweight children and adolescents had increased dramatically
and that this in turn had led to a number of negative health effects including type
2 diabetes and high blood pressure. Their research suggested that the best
approach to this problem was prevention of abnormal weight gain.
A second study (Dehghan, Akhtar-Danesh, & Merchant, 2005) stated that
childhood obesity had reached epidemic levels in developed countries. Twenty-five
percent of children in the U.S. were overweight and 11% were found to be obese.
In the future, this will have serious impacts on both physical and psychological
health. Dehghan et al., (2005) found that both over eating and reduced physical
activity were causes of childhood obesity. They found that almost all researchers
agreed that prevention could be the key strategy for controlling the epidemic.
Efforts to change behavior of individuals in diet and exercise have not worked in
stopping the epidemic. Because it is difficult to lose weight once it has been
gained, they concluded that children should be the priority for intervention
strategies and that pre-school, in-school, and after-school should be the target
periods for changing diet and exercise.

MDM4U Summative Assignment
________________________________________________________________________
_______________________________________________________________________ 9 January 2011
The literature review indicated consistent findings across all research reviewed.
The following are key points of agreement:
Childhood obesity has reached epidemic proportions in developed
countries.
The main causes are over eating and lack of physical exercise (this includes
eating too much fast food and watching too much TV).
Childhood obesity leads to serious medical problems (both physical, such
as heart disease and type 2 diabetes, and psychological, such as
depression and poor self esteem).
Prevention appears to be the key because once extra weight is gained, it is
extremely difficult to lose it.
Although eating less and being more active seem like simple steps to take,
efforts to prevent childhood obesity haven’t worked and this serious
problem has grown to epidemic proportions.
More research is required to find better ways to prevent the childhood
obesity epidemic.
The next step in the literature review was an examination of the Canadian
context. It was essential to determine if a similar epidemic was in existence in
Canada. A Statistics Canada study (Shields, 2008) showed that in 1978/79, 12%
of 2 to 17 year olds in Canada were overweight, and 3% were obese—a
combined overweight/obesity rate of 15%. By 2004, the overweight rate for this
age group was 18% (an estimated 1.1 million), and 8% were obese
(approximately half a million) for a combined rate of 26%.

MDM4U Summative Assignment
________________________________________________________________________
_______________________________________________________________________ 10 January 2011
Shields (2008) suggests that contributing factors involved in the increase of
childhood obesity in Canada included increased consumption of fast food and
more time spent watching TV, playing video games and computer usage. The
study also showed that children who were overweight reported more health
problems. The research concluded that some of the factors causing overweight
and obesity among young people could be changed. Increased consumption of
fruit and vegetables, more physical activity and less time spent watching TV and
playing video games could contribute to reversing the problem.
Two recent articles published in the Ottawa Citizen illustrated that prevention is
still a main focus in the battle against obesity. Sibley (2011) wrote that First Lady
Michelle Obama and Walmart had formed an alliance in which Walmart will now
cut the amounts of sodium and added sugars in packaged foods and reduce the
costs of fruits, vegetables, and healthy alternatives to snack foods. This will
increase the availability of healthy foods to low income families and help in
promoting a healthy diet – a key factor in reducing levels of obesity. Walmart
Canada Corp has stated that it will aim to buy locally grown foods in order to
reduce the prices of fresh produce in stores across the nation.
The second article (Cleary, 2011) stated that in Ottawa, Mayor Jim Watson, had
proposed in his 2011 draft budget that recreational venue user fees would be
frozen for the next four years. High rental fees have kept many children out of
sports and if they continue to climb, would threaten the activity levels of more
children. The Mayor stated that obesity has become a huge problem and freezing
user fees will remove financial barriers and encourage people to get active – the
second key ingredient in lowering obesity rates.

MDM4U Summative Assignment
________________________________________________________________________
_______________________________________________________________________ 11 January 2011
Research Methodology
With the research questions in mind, relevant data sets on E-Stat and Statistics
Canada were scanned to determine which would be most appropriate to support
the analyses and address the research questions.
Data regarding the body mass index of children in the age categories of 2 to 17; 6
to 11; and 12 to 17 were extracted from the 2004 Canadian Community Health
Survey (CCHS) located on E-Stat. Data were found in the category – health,
subcategory lifestyle and social conditions, Table 105-2002 – Measured child body
mass index (BMI), by age group and sex, household population aged 2 to 17
excluding pregnant females, Canadian Community Health Survey cycle 2.2,
Canada and provinces, occasional.
Data concerning the number of hours of physical activity and sedentary activity
were extracted from the same category, subcategory and study on E-Stat. Hours
of physical activity were determined using Table 105-2003 – Children's
participation in physical activities, in hours per week, by sex, household
population aged 6 to 11, Canadian Community Health Survey cycle 2.2, Canada
and provinces, occasional. Hours of sedentary activity were determined from Table
105-2005 – Children's participation in sedentary activities, in hours per week, by
age group and sex, household population aged 12 to 17, Canadian Community
Health Survey cycle 2.2, Canada and provinces, occasional.
Low income data were collected from Statistics Canada under publication
13F0022X – Income Trends in Canada, Table 2020408 – Distribution of total
income, by census family type, 2007 constant dollars, Canada, provinces and
select CMAs. Data from the year 2004 was used. To determine the percentage of
Canadian families who qualified as low income earners, the low income cut off

MDM4U Summative Assignment
________________________________________________________________________
_______________________________________________________________________ 12 January 2011
(LICO) rates of 2004 were determined using the model developed by the Canadian
Council on Social Development. The LICO rate of 2004 was rounded to an annual
salary figure of $24,999.

MDM4U Summative Assignment
________________________________________________________________________
_______________________________________________________________________ 13 January 2011
Analyses & Findings
Is there an obesity epidemic in Canada?
Over the past few decades, childhood obesity has become an increasing issue in
nations all over the world. Is there a similar concern in Canada?
An initial search was conducted to find and determine the breakdown, in
percentage, of Canadian children with or without a weight problem. Figure 1
illustrates the percentage of Canadian children with a healthy body mass index
(BMI) versus those who would be considered overweight or obese. Despite the
high percentage of children who are not overweight or obese, there is still a large
number of children carrying unhealthy weight. The combined percentage of
children who are overweight or obese is approximately 26.2%. This indicates that
approximately one in four Canadian children, aged 2 – 17 are struggling with a
weight problem. A more in-depth analysis was needed to better understand this
figure and the following sub-questions were explored: how does the percentage of
Figure 1. Measured BMI of Canadian children, 2004. Data sourced from E-Stat. Data Table found in Appendix A, Table 1.1.

MDM4U Summative Assignment
________________________________________________________________________
_______________________________________________________________________ 14 January 2011
overweight and obese children differ from one province to another?; and, does
geography have an effect on BMI?
0
10
20
30
40
50
60
70
80
90
Neither Overweight Nor Obese
Overweight Obese
Pe
rce
nta
ge o
f P
op
ula
tio
n
Measured Child BMI
Measured BMI of Children Aged 2-17 By Province
Newfoundland & Labrador
Prince Edward Island
Nova Scotia
New Brunswick
Quebec
Ontario
Manitoba
Saskatchewan
Alberta
British Colummbia
A more thorough look at the breakdown of BMI by province was conducted to
further examine obesity in Canadian children. Figure 2 shows the breakdown of
BMI for Canadian children by province relative to each province`s population. The
graph is further subdivided into three regions with dark blue representing the
Maritime Provinces, Central Canada in green, and the Western Provinces in light
blue.
After reviewing, it is evidence that the Maritime Provinces have the largest
concentration of obese or overweight children, averaging around 16.6% of their
population aged 2 – 17 years. Three of the four highest percentile provinces of
obese children come from the Maritimes. Newfoundland (16.6%) is the highest,
followed by New Brunswick (13.1%) and Nova Scotia (9.4%). Central Canada and
Figure 2. Measured BMI of Canadian children by individual province, 2004. Graph reads from left to right in correspondence to the legend. Data sourced from E-Stat. Data Table
found in Appendix A, Table 1.2.

MDM4U Summative Assignment
________________________________________________________________________
_______________________________________________________________________ 15 January 2011
the Western provinces have on average only 13.2% of their populations in the
obese or overweight categories.
It is also noted that Central Canada and the West have five of the top six highest
concentrations of children who are neither obese nor overweight.
This information would suggest that Canada is part of the childhood obesity
epidemic. Further analysis examining potential contributing factors will assist in
understanding why the percentage of overweight or obese children in Canada is so
high? It will also be important to understand why the Maritime Provinces have
such high percentages of obese children? A closer look at these factors will help
determine answers to these questions.
Is there a correlation between level of obesity and physical activity?
Exercise and physical activity are known methods of staying fit, keeping in shape,
and maintaining a healthy weight. Therefore it is logical that the more hours of
physical activity undertaken should lower the percentage of overweight and obese
children.
0
10
20
30
40
50
60
Less Than 7 Hours Per
Week
7 to 13 Hours Per
Week
14 to 20 Hours Per
Week
21 Or More Hours Per
Week
Per
cen
tage
of
Po
pu
lati
on
Hours of Physical Activity Per Week
Hours of Physical Activity Per Week of Children Aged 6-11
Newfoundland & Labrador
Prince Edward Island
Nova Scotia
New Brunswick
Quebec
Ontario
Manitoba
Saskatchewan
Alberta
British Columbia
Figure 3. Hours of physical activity per week, 2004. Graph reads from left to right in
correspondence to the legend. Data sourced from E-Stat. Data Table found in Appendix A, Table 1.3.

MDM4U Summative Assignment
________________________________________________________________________
_______________________________________________________________________ 16 January 2011
Figure 3 shows the number of hours of physical activity for children aged 6-11.
As is evident from the figure, most children spend between 7 and 20 hours a week
engaging in physical activity. At this age, children are in elementary school where
physical education classes are a mandatory requirement of the curriculum. This
helps keep kids active, a key factor in maintaining a healthy weight.
Figure 4 illustrates the BMI breakdown of children aged 6-11 by province
(excluding the 2-5 year olds and 12-17 year olds). With this smaller age sample,
the Maritimes continue to have a larger percentage of obese children than other
regions of Canada but the gap is not as significant as the one in Figure 2 (ages 2-
17).
0102030405060708090
Neither Overweight Nor Obese
Overweight Obese
Pe
rce
nta
ge o
f P
op
ula
tio
n
Measured BMI
Measured BMI of Children Age 6-11 By Province
Newfoundland & Labrador
Prince Edward Island
Nova Scotia
New Brunswick
Quebec
Ontario
Manitoba
Saskatchewan
Alberta
British Columbia
Using Figure 3 as a reference point, it has been observed that Newfoundland has
the lowest percentage of children participating in physical activity for 21 hours or
more a week. Newfoundland also has a higher percentage of overweight or obese
children than other provinces.
Figure 4. Measured BMI of Canadian children aged 6-11 by individual province, 2004. Graph reads from left to right in correspondence to the legend. Data sourced from E-Stat.
Data Table found in Appendix A, Table 1.4.
MDM4U Summative Assignment
________________________________________________________________________
_______________________________________________________________________ 17 January 2011
Quebec has the lowest percentage of obese children, second lowest percentage of
overweight children, and the highest percentage of normal weight children. Based
on these statistics and given the strong link between physical activity and healthy
weight, one would assume that children in Quebec would be participating in a high
number of hours of physical activity per week. However, Quebec has by far the
highest concentration of children participating in less than 7 hours a week and a
very small percentage participating in 14 hours of physical activity or more a
week. These findings are counter to what was originally hypothesized.
Furthermore, British Columbia has the highest percentage of children participating
in 21 or more hours of physical activity a week. It also has the second lowest
percentage of obese children at 7.5%.
R² = -0.8048
0
2
4
6
8
10
12
14
0 5 10 15
Pe
rce
nta
ge o
f P
op
ula
tio
n
Average Number of Hours of Physical Activity Per Week
Average Number of Hours of Physical Activity Versus Provincial BMI Breakdown
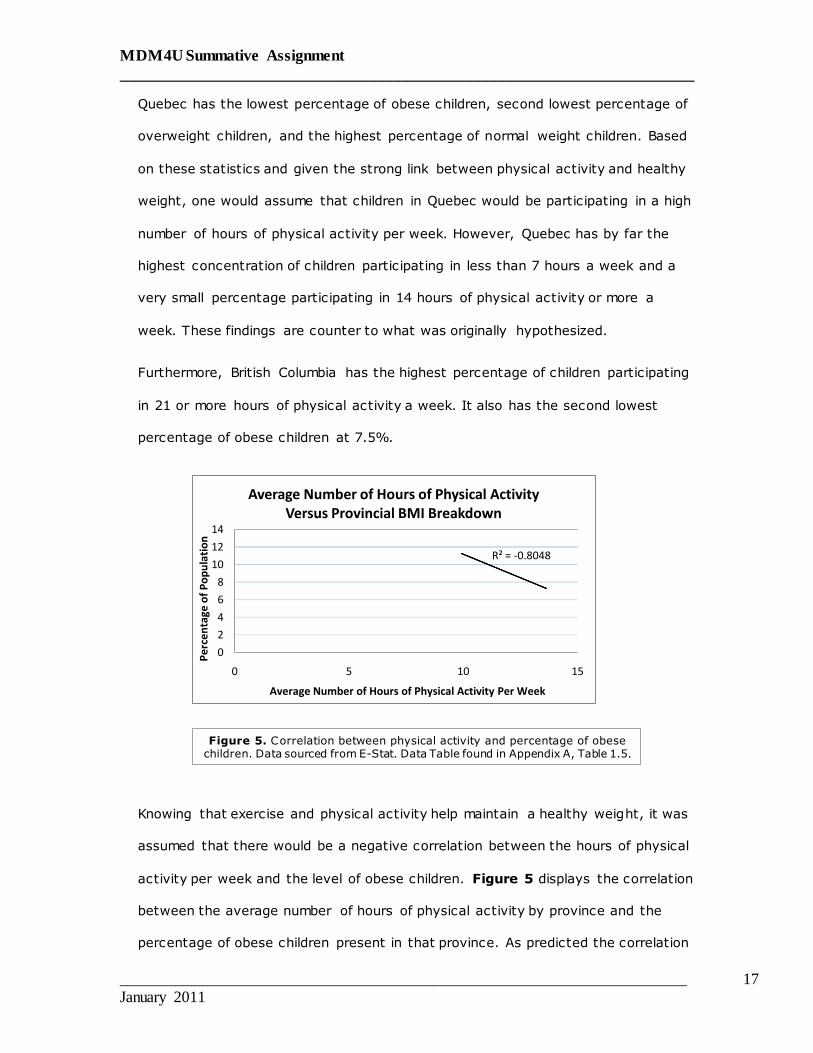
Knowing that exercise and physical activity help maintain a healthy weight, it was
assumed that there would be a negative correlation between the hours of physical
activity per week and the level of obese children. Figure 5 displays the correlation
between the average number of hours of physical activity by province and the
percentage of obese children present in that province. As predicted the correlation
Figure 5. Correlation between physical activity and percentage of obese children. Data sourced from E-Stat. Data Table found in Appendix A, Table 1.5.

MDM4U Summative Assignment
________________________________________________________________________
_______________________________________________________________________ 18 January 2011
was negative, however it was not very strong, R2=-0.1273. When Quebec and
Saskatchewan data were excluded, the correlation increased drastically,
R2=-0.8048. In this case Quebec and Saskatchewan were outliers in that their
data did not follow the trend set by the other provinces. Quebec had an extremely
low percentage of obese children and Saskatchewan had the highest average
hours of physical activity per week yet still had a high percentage of obese
children.
Is there a correlation between level of obesity and sedentary activity?
Based on the literature in which there is a clear link between inactivity and
obesity, one would assume a similar relationship should exist for Canadian
children.
0
5
10
15
20
25
30
35
40
Less Than 10 Hours
Per Week
10 to 19 Hours Per
Week
20 to 29 Hours Per
Week
30 to 39 Hours Per
Week
40 Hours Or More
Per Week
Pe
rce
nta
ge o
f P
op
ula
tio
n
Hours of Sedentary Activity Per Week
Hours of Sedentary Activity Per Week of Children Aged 12-17 Newfoundland &
LabradorPrince Edward Island
Nova Scotia
New Brunswick
Quebec
Ontario
Manitoba
Saskatchewan
Alberta
British Columbia
Figure 6 shows the average number of hours of sedentary activity per week of
children aged 12 – 17. The largest percentages of children spend between 20 to
29 hours a week simply doing nothing. This averages out to approximately a full
day per week of watching TV or playing video games. Provinces with high
Figure 6. Hours of sedentary activity per week, 2004. Graph reads from left to right in correspondence to the legend. Data sourced from E-Stat. Data Table found in Appendix
A, Table 1.6.

MDM4U Summative Assignment
________________________________________________________________________
_______________________________________________________________________ 19 January 2011
concentrations of sedentary activity were thought to have higher percentages of
obese children between the ages of 12 and 17.
Figure 7 shows the measured BMI of children aged 12-17 by province. It is
important to note that in comparison to the data presented in Figure 4, the
population of Canadian children who are obese has increased. As in the two
previous BMI graphs, the Maritimes, and more specifically Newfoundland, had the
highest percentage of obese children, averaging to approximately 14.2% of the
total population. However, Figure 6 illustrated that Newfoundland and New
Brunswick, the two provinces with the highest percentage of obese children, had
the least sedentary population of children. The percentage of children participating
in 30 hours of sedentary activity or more was noticeably lower than the majority
of the other provinces. This observation contradicts the findings in Figure 7.
It was also observed that in Figure 4, Quebec had the lowest percentage of obese
children. In Figure 7, the percentage of obese children in Quebec increased by
2.7% when we shifted to the older age group. This indicated that an increase in
age does have an effect on levels of obesity.
Figure 7. Measured BMI of Canadian children aged 12-17 by individual province, 2004. Graph reads from left to right in correspondence to the legend. Data
sourced from E-Stat. Data Table found in Appendix A, Table 1.7.

MDM4U Summative Assignment
________________________________________________________________________
_______________________________________________________________________ 20 January 2011
Additionally, Figure 7 showed that British Columbia had the lowest percentage of
obese children. This however does not align with Figure 6 which indicated that
British Columbia had the second highest percentage of children participating in
over 40 hours of sedentary activity per week.
R² = -0.822
0
5
10
15
20
25
30
35
0 5 10 15 20 25
Per
cen
tage
of
Po
pu
lati
on
Average Number of Hours of Sedentary Activity Per Week
Average Number of Hours of Sedentary Activity Versus Provincial BMI Breakdown
In order to examine the relationship between obesity and sedentary activity, a
correlation was completed. Figure 8 shows the correlation between average
number of hours of sedentary activity versus the percent of obese children. It was
originally believed the correlation would be positive, the more time spent being
inactive would lead to more obese children. Surprisingly, the correlation was
negative, suggesting that the more hours of sedentary activity, the lower the
percentage of obese children. Figure 8 does not include the provinces of Quebec
and Ontario because they were outliers. Quebec had a very low average number
of hours of sedentary activity yet still had a low percentage of obese children and
Ontario had a very high average of sedentary activity and a relatively high
percentage of obese children.
Figure 8. Correlation between sedentary activity and percentage of obese children. Data sourced from E-Stat. Data Table found in Appendix A, Table 1.8.

MDM4U Summative Assignment
________________________________________________________________________
_______________________________________________________________________ 21 January 2011
Is there a relationship between obesity and household income?
Enrolling children in organized sport or going to the gym to exercise can be
expensive. Some families are able to afford this additional cost, however, others
struggle to have food on the table.
This final analysis examines the relationship between low income families and
obese children. Figure 9 demonstrates the breakdown of Canadian families whose
annual salaries fall below the low income cut off (LICO) and those whose salaries
lie above. Figure 9 indicates that on average the Maritimes have a higher
percentage of families below the LICO.
It was determined that Newfoundland has a combined total of approximately
35.6% of youth who are obese or overweight. This was the highest combined total
of any province. Newfoundland also has the highest percentage of low income
families at 37.7%. When the combined percentages of overweight and obese
children of every province were compared to the percentage of low income
families, it was observed that the two values were similar. Table 1 shows the
Figure 9. Low income family distribution across Canada, 2004 LICO figure. Data sourced from Statistics Canada. Data Table found in Appendix A, Table
1.9.

MDM4U Summative Assignment
________________________________________________________________________
_______________________________________________________________________ 22 January 2011
comparison between low income and overweight or obese children in each
province. Both values tend to differ by only a few percentile with exception to
Quebec and British Columbia.
Province Percentage of Low Income
Families
Combined Percentage of Overweight and
Obese Children
NL 37.7% 35.6%
PEI 29.3% 30.2%
NS 32.2% 32.0%
NB 32.9% 34.2%
QC 30.4% 22.6%
ON 27.2% 27.5%
MN 29.7% 30.8%
SK 32.2% 29.1%
AB 24.9% 21.8%
BC 31.0% 26.3%
Table 1. Percentage of low income families compared to the combined percentages of overweight and obese children, by province. Data sourced from E-Stat and
Statistics Canada.

MDM4U Summative Assignment
________________________________________________________________________
_______________________________________________________________________ 23 January 2011
Conclusions
Findings from the study demonstrated that Canada is facing a childhood obesity
epidemic. It was also identified that there is no single factor that has led to the
high levels of overweight and obesity among Canadian children. More research
needs to be conducted in order to better understand factors contributing to the
epidemic.
Findings revealed that the Maritime Provinces have higher levels of overweight
and obese youth than other regions of Canada. However, this area of research
needs to be examined more closely in order to uncover the causal factors
influencing the high obesity rates on the East coast.
Furthermore, it was concluded that a negative correlation existed between levels
of physical activity and childhood obesity. Meaning that the more time spent
exercising, the lower the percentage of obese children in Canada. This finding is
encouraging in that it is supported by the existing research literature and helps to
explain at least in part why Canada`s children are overweight. Further research
will be required into a number of areas in order to understand additional factors
contributing to obesity. For example, it would be interesting to conduct a
provincial comparison across physical education policies in elementary and high
schools to determine whether mandatory physical education programming has an
influence on the incidence of overweight or obese children.
The study also looked at the relationship between sedentary activity and levels of
obesity. Unfortunately, findings did not align with the current research literature
and in fact, showed the opposite relationship to the anticipated trend. It`s
possible the data that was used for analysis was not sensitive enough to detect
the correlation. A study designed to specifically examine the impact of low activity

MDM4U Summative Assignment
________________________________________________________________________
_______________________________________________________________________ 24 January 2011
levels on BMI would be required as follow-up. One possible design could include a
longitudinal study in which a group of children are monitored throughout high
school and post-secondary education (into young adulthood) in order to observe
more closely contributing factors related to weight gain, sedentary behaviour and
physical activity.
It was observed that obesity levels did increase with age, but due to time
limitations, no analyses were done to examine this more closely. It was also
unclear whether or not the sample of children reporting high levels of sedentary
activity participated in physical activity as well. If this were the case, any negative
effects of inactivity would be negated by the activity.
The low income analysis produced interesting results and some potential insights
for future research. It was determined that the percentage of families below the
LICO was proportional to the percentage of overweight and obese children.
Nonetheless, the data did not take into account families just above the LICO
whose annual salaries may be ten to twenty thousand dollars above the cut off but
who are still struggling. This however was only a link and further examination
needs to be done to understand how income might be a contributing factor in
childhood obesity.
Findings from this study would be of interest to public health policy and program
experts working in the area of child health. For example, if the federal and
provincial governments were interested in making improvements in the health of
the child population, they could look at these data to determine whether the
Maritimes are a specific concern or if targeting low income families would aid in
lowering the childhood obesity levels across Canada.

MDM4U Summative Assignment
________________________________________________________________________
_______________________________________________________________________ 25 January 2011
Appendix A – Data Tables
Table 1.1 - Measured BMI of Children Aged 2-17 in Canada
Table 1.2 - Measured BMI of Children Aged 2-17 in Canada by Province
Table 1.3 - Hours of Physical Activity per Week of Children Aged 6-11 by Province
Table 1.4 - Measured BMI of Children Aged 6-11 in Canada by Province
Measured Child BMI Percentage
Measured Child BMI, neither overweight nor obese
73.8
Measured Child BMI, overweight 18
Measured Child BMI, obese 8.2
Measured Child BMI Newfoundland
& Labrador Prince Edward
Island Nova Scotia
New Brunswick
Quebec Ontario Manitoba Saskatchewan Alberta British
Columbia
Measured Child BMI, neither overweight nor obese 64.4 69.8 68 65.8 77.4 72.5 69.2 70.9 78.2 73.6
Measured Child BMI, overweight 19 22.4 22.6 21.1 15.5 19 21.9 18.8 14.3 19.7
Measured Child BMI, obese 16.6 7.8 9.4 13.1 7.1 8.5 8.9 10.3 7.5 6.6
Hours of Physical Activity Per Week
Newfoundland & Labrador
Prince Edward Island
Nova Scotia
New Brunswick
Quebec Ontario Manitoba Saskatchewan Alberta British
Columbia
Children's physical activity, less than 7 hours per week 18.5 8.8 16.9 14 26.4 13.4 12.3 11.4 9.4 14.3 Children's physical activity, 7 to 13 hours per week 54.3 40.5 41.7 44.1 44.1 42.8 39 31.3 34.8 35
Children's physical activity, 14 to 20 hours per week 23.1 42.2 29.1 30.7 22.2 33.9 37.6 44 42.1 34.9
Children's physical activity, 21 or more hours per week 4.1 8.5 12.3 11.2 7.3 8.7 10.9 12.9 11.4 15
Measured Child BMI Newfoundland
& Labrador Prince Edward
Island Nova Scotia
New Brunswick
Quebec Ontario Manitoba Saskatchewan Alberta British
Columbia
Measured Child BMI, neither overweight nor obese
62.4 70.7 75 72.9 81.6 70.5 70.3 76.6 80.6 70.2
Measured Child BMI, overweight
25.1 21.1 16.8 16.7 12.5 20.8 21.9 13.5 11.1 22.3
Measured Child BMI, obese 12.5 8.2 8.2 10.5 5.9 8.7 7.8 9.9 8.3 7.5

MDM4U Summative Assignment
________________________________________________________________________
_______________________________________________________________________ 26 January 2011
Table 1.5 – Average Number of Hours of Physical Activity vs. Percentage of Obese Children
Table 1.6 - Hours of Sedentary Activity per Week of Children Aged 12-17 by Province
Table 1.7 - Measured BMI of Children Aged 12-17 in Canada by Province
Province Average number of hours
of physical activity per week
Percentage of Population
Newfoundland & Labrador
9.91 12.5
Prince Edward Island 13.28 8.2
Nova Scotia 11.84 8.2
New Brunswick 10.04 10.5
Quebec 10.47 5.9
Ontario 12.27 8.7
Manitoba 12.95 7.8
Saskatchewan 13.64 9.9
Alberta 13.31 8.3
British Columbia 13 7.5
Hours of Sedentary Activity Per Week
Newfoundland & Labrador
Prince Edward Island
Nova Scotia
New Brunswick
Quebec Ontario Manitoba Saskatchewan Alberta British
Columbia
Children's sedentary activities, less than 10 hours per week
26.1 12.2 12.6 24.8 20.5 12.4 12.8 18.4 14.1 13.2
Children's sedentary activities, 10 to 19 hours per week
29.5 33.1 30 28.6 33.7 24.3 26.4 27.4 30.5 25.5
Children's sedentary activities, 20 to 29 hours per week
22.2 33.5 32.6 28.6 29.9 34.4 35.2 31.9 29.5 32.6
Children's sedentary activities, 30 to 39 hours per week
12.1 11.1 16.9 6.5 9 15.3 13.5 12.9 14.6 15
Children's sedentary activities, 40 hours or more per week
9.8 10.1 8 11.4 6.8 13.3 12.2 9.3 11 12.5
Measured Child BMI Newfoundland
& Labrador Prince Edward
Island Nova
Scotia New
Brunswick Quebec Ontario Manitoba Saskatchewan Alberta
British Columbia
Measured child BMI, neither overweight nor obese
59.5 70.9 65.4 58.1 75.6 71.4 63.8 62.7 69.7 70.9
Measured child BMI, overweight
20.3 20.8 24.1 23.9 15.8 19.4 25.7 26.5 20.2 22.3
Measured Child BMI, obese 20.2 8.2 10.5 18 8.6 9.2 10.5 10.9 10.1 6.9

MDM4U Summative Assignment
________________________________________________________________________
_______________________________________________________________________ 27 January 2011
Table 1.8 - Average Number of Hours of Sedentary Activity vs. Percentage of Obese Children
Province Average number of hours of sedentary activity per
week
Percentage of Population
Newfoundland & Labrador
19 20.2
Prince Edward Island 21.4 8.2
Nova Scotia 21.9 10.5
New Brunswick 19.1 18
Quebec 14.6 8.6
Ontario 23.1 9.2
Manitoba 22.6 10.5
Saskatchewan 20.8 10.9
Alberta 21.7 10.1
British Columbia 22.4 6.9
Table 1.9 - Low Income Distribution in Canada by Province
Income Status Newfoundland
& Labrador Prince Edward
Island Nova Scotia
New Brunswick
Quebec Ontario Manitoba Saskatchewan Alberta British
Columbia
Annual Salary Below LICO ($24,999 and below)
37.7 29.3 32.2 32.9 30.4 27.2 29.7 32.2 24.9 31
Annual Salary Above LICO ($25,000 and above)
62.3 70.7 67.8 67.1 69.6 72.8 70.3 67.8 75.1 69

MDM4U Summative Assignment
________________________________________________________________________
_______________________________________________________________________ 28 January 2011
Appendix B – Newspaper Articles
Cleary, M. (2011, January 22). Watson’s freeze a crowd favourite. The
Ottawa Citizen, pp. G1, G2.

MDM4U Summative Assignment
________________________________________________________________________
_______________________________________________________________________ 29 January 2011
Sibley, R. (2011, January 21). New alliance in the war on obesity. The Ottawa
Citizen, p. A6.

MDM4U Summative Assignment
________________________________________________________________________
_______________________________________________________________________ 30 January 2011
References
Cleary, M. (2011, January 22). Watson’s freeze a crowd favourite. The Ottawa
Citizen, pp. G1, G2.
Daniels, S. R., Arnett, D.K., Eckel, R.H., Gidding, S.S., Hayman, L.L., Kumanyika,
S, et al. (2005). Overweight in Children and Adolescents Pathophysiology,
Consequences, Prevention and Treatment. Retrieved January 9, 2011 from
http://circ.ahajournals.org/cgi/content/full/111/15/1999#SEC3
Dehghan, M., Akhtar-Danesh, N., Merchant, A., (2005). Childhood obesity,
prevalence and prevention. Retrieved January 9, 2011 from
http://www.nutritionj.com/content/4/1/24
Ebbeling, C.B., Pawlak, D.B., Ludwig, D.S., (2002). Childhood obesity: public
health crisis, common sense cure. Retrieved January 2, 2011 from
http://www.allhealth.org/briefingmaterials/lancetobesityrev-393.pdf
Shields, Margot. (2008). Overweight Canadian children and adolescents.
Retrieved January 9, 2011 from http://www.statcan.gc.ca/pub/82-620-
m/2005001/article/child-enfant/8061-eng.htm
Sibley, R. (2011, January 21). New alliance in the war on obesity. The Ottawa
Citizen, p. A6.
MDM4U Summative Assignment
________________________________________________________________________
_______________________________________________________________________ 31 January 2011
Glossary
Body Mass Index (BMI)
A measure of someone's weight in relation to height; to calculate one's BMI,
multiply one's weight in pounds and divide that by the square of one's height in
inches; overweight is a BMI greater than 25; obese is a BMI greater than 30.
Chronic Disease
A serious disease lasting for a long time.
Epidemic
Of disease or anything resembling a disease; attacking or affecting many
individuals in a community or a population simultaneously.
Low Income Cut Off (LICO)
Commonly known as poverty lines, the low income cut off is an annual salary
figure that unofficially measures poverty. Individuals falling below the LICO are
considered to have a low income and be living in poverty.
Obesity
Overweight and obesity are defined as abnormal or excessive fat accumulation
that presents a risk to health. A crude population measure of obesity is the body
mass index (BMI), a person’s weight (in kilograms) divided by the square of his or
her height (in metres). A person with a BMI of 30 or more is generally considered
obese. A person with a BMI equal to or more than 25 is considered overweight.
Sedentary
Accustomed to sit or rest a great deal or to take little exercise.
Type 2 Diabetes
Diabetes mellitus type 2 or type 2 diabetes (formerly called non -insulin-
dependent diabetes mellitus (NIDDM), or adult-onset diabetes) is a disorder that
is characterized by high blood glucose in the context of insulin resistance and
relative insulin deficiency.