children s worlds national report vietnam
TRANSCRIPT
Children’s Worlds National Report
VIETNAM
Truong Thi Khanh Ha1, Nguyen Van Luot1,
Tran Ha Thu2, Truong Quang Lam2
University of Social Sciences and Humanities
Vietnam National University, Hanoi
1 Associate Professor, Faculty of Psychology, University of Social Sciences and Humanities, Vietnam National
University, Hanoi. 2 PhD, Faculty of Psychology, University of Social Sciences and Humanities, Vietnam National University, Hanoi.

Children's Worlds 3rd
wave Vietnam National Report
2
1. Introduction
The aim of this report is to provide the results from the descriptive analyses of the
Children’s Worlds survey conducted in North Vietnam at 2018. Detailed analyses of
children’s well-being in Vietnam will be completed after this initial report, and future
analyse will also include comparison of children’s well-being across the countries
participating in the international project.
1.1 Context and population
Population
As of 2017, the population of the Vietnam was about 96 millions.3
Population 96,160,163 (July 2017 est.)
Age structure 0-14 years: 23.55% (male 11,909,326/ female 10,735,324)
15-24 years: 16.23% (male 8,098,019/ female 7,509,021)
25-54 years: 45.56% (male 22,087,095/ female 21,719,615)
55-64 years: 8.55% (male 3,798,928/ female 4,419,837)
65 years and over: 6.12% (male 2,281,923/ female 3,601,075) (2017 est.)
Population growth rate 0.93% (2017 est.)
Urbanization urban population: 34.9% of total population (2017)
rate of urbanization: 2.59% annual rate of change (2015-20 est.)
Sex ratio at birth: 1.11 male(s)/female
Total fertility rate 1.81 children born/woman (2017 est.)
Religions Buddhist 7.9%, Catholic 6.6%, Hoa Hao 1.7%, Cao Dai 0.9%, Protestant 0.9%, Muslim 0.1%,
none 81.8% (2009 est.)
Geography
Vietnam is in South East Asia, facing China on the North, Laos and Cambodia on the West,
and Pacific Ocean on the East. Vietnam is thin and long, and is divided into three parts:
North, Midle, and South.
The North Vietnam can be divided into two regions: Red River Delta; Northern Midland and
Mountain. The Red River Delta comprises 10 provinces and cities: Thai Binh, Nam Dinh, Ha
Noi, Ninh Binh, Ha Nam, Bac Ninh, Hung Yen, Vinh Phuc, Hai Duong, Hai Phong. Population
was about 20.5 million. The Northern Midland and Mountain areas includes 15 provinces:
Lao Cai, Lai Chau, Dien Bien, Son La, Hoa Binh, Yen Bai, Ha Giang, Cao Bang, Bac Kan, Thai
Nguyen, Lang Son, Tuyen Quang, Bac Giang, Phu Tho, Quang Ninh. Population was about
11.5 million.
3 Statistics Vietnam (https://www.indexmundi.com/vietnam/demographics_profile.html)

Children's Worlds 3rd
wave Vietnam National Report
3
Children
In 2017, the number of children between the ages of 0 and 14 years in Vietnam was about
22.7 million, which was 23.55% of the population. From this, the number of children up to
14 years old in the Red River Delta was 4.7 million (approximately 22.7 %) and in the
Northern Midland and Mountain was 3 million (about 26.5% of the region’s population)
Religion
Overall, Vietnam is a benign country. About 85% of Vietnamese regularly visit Buddhist
pagodas, but most are not purely Buddhist, not all of them actively participate in Buddhist
rituals at the pagodas. Due to statistic, the most common religions in Vietnam are Buddhist
7.9%, Catholic 6.6%, Hoa Hao 1.7%, Cao Dai 0.9%, Protestant 0.9%, Muslim 0.1%, none
81.8% (2009 est.)
Ethnicity
Vietnam is considered as a homogeneous country, almost 86% of the population is from one
ethnicity, Kinh, which is also known as Viet, 14% of the population is from other 53 distinct
ethnicities. Most of these minor ethnic groups are concentrated in northern mountainous
regions and central highlands of Vietnam4
Economic context
Vietnam GDP per capita was $2.563 in 2018, compared with $1.149 in 20085, is a lower
middle-income country.
Education
Preschool is optional for children under six, however primary school is compulsory for all
children between 6 and 11.
Elementary education (primary school) lasts five years (grades 1 to 5, ages 6 - 11).
Lower Secondary Education (middle school) lasts 4 years (grades 6 to 9, ages 11 – 15).
Upper secondary education (high school): Most children move to high school at 15. It lasts
three years (grades 10 to 12, ages 15-18).
Children’s Rights
Vietnam has been a party to the UN Convention on the Rights of the Child since 1990 6
4 Statistics Vietnam (https://www.asiahighlights.com/vietnam/people.htm)
5 https://data.worldbank.org/indicator/NY.GDP.PCAP.CD?locations=VN
6 https://treaties.un.org/Pages/ViewDetails.aspx?src=IND&mtdsg_no=IV-11&chapter=4&lang=en

Children's Worlds 3rd
wave Vietnam National Report
4
1.2 Sampling strategy and outcomes
The North Vietnam sample was designed to achieve a regional representative sample of
children in the 3rd grade (aged 8), the 5th grade (aged 10), and the 7th grade (aged 12).
Children in the 3rd and 5th grades are in primary schools and those in the 7th grade are in
middle schools. Each age group’s total sample size was set at about 1.000. The primary
sampling unit was areas.
First, base on the number of the provinces and children under 14 years old in two regions
(Red River Delta area; Northern Midland and Mountain), we choose randomly 3 provinces in
the Red River Delta (Vinh Phuc, Ha Noi, Ha Nam) and 4 provinces in the Northern Midland
and Mountain (Son La, Bac Giang, Thai Nguyen, Quang Ninh). The urban, rural, and
mountainous areas (depend on geographical characteristics of each province) are identified
as the first sampling strata. There are 14 strata representing geographical regions of the
North Vietnam, including:
Region Red River Delta: (1) Hanoi - urban, (2) Hanoi - rural, (3) Ha Nam - urban, (4) Ha
Nam - rural, (5) Vinh Phuc - urban, (6) Vinh Phuc - rural;
Region Northern Midland and Mountain: (7) Thai Nguyen - Urban, (8) Thai Nguyen -
rural, (9) Son La - urban, (10) Son La - mountain; (11) Bac Giang - urban, (12) Bac Giang
- rural, (13) Quang Ninh - urban, (14) Quang Ninh – mountain.
Second, a list of public schools of each stratum was completed.
Third, schools were selected with uniform probability within each stratum from the list.
Fourth, within each school one or two, or three class groups was randomly selected with
uniform probability. The number of class groups depends on the estimated class group size,
which is different in every school and every area. For example one class in mountainous
areas may have only 9 pupils, while one class in urban areas of big cities may have more
than 50 pupils.
There was no requirement of parental consent for children to participate in the survey in
Vietnam. However school rector board and teachers’ consent required for children to
participate in the survey.
The survey was administered by researchers, university students, and school teachers. The
group survey, using pen and paper, was conducted in all school classes.
The survey began in early 2018 and was completed by September 2018.
The number of participants was expected to be bigger, however the survey was unable to
be conducted in some provinces for many subjective and objective reasons.
Children's Worlds 3rd
wave Vietnam National Report
5
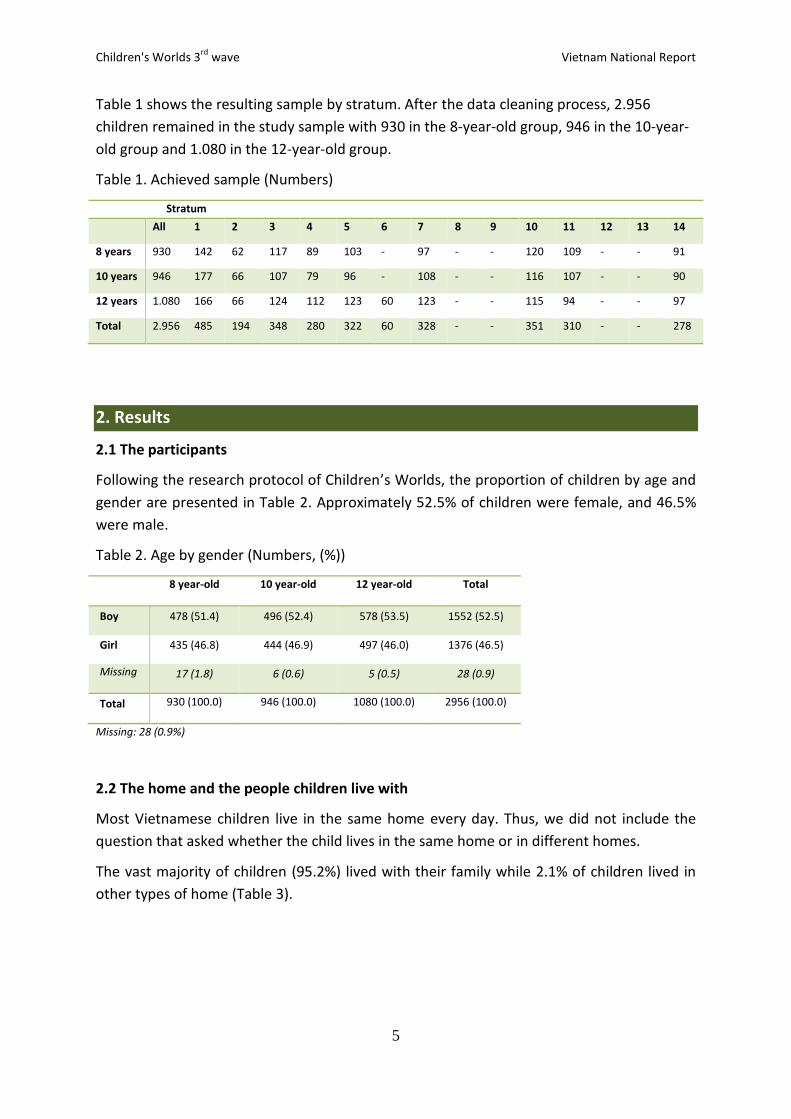
Table 1 shows the resulting sample by stratum. After the data cleaning process, 2.956
children remained in the study sample with 930 in the 8-year-old group, 946 in the 10-year-
old group and 1.080 in the 12-year-old group.
Table 1. Achieved sample (Numbers)
Stratum
All 1 2 3 4 5 6 7 8 9 10 11 12 13 14
8 years 930 142 62 117 89 103 - 97 - - 120 109 - - 91
10 years 946 177 66 107 79 96 - 108 - - 116 107 - - 90
12 years 1.080 166 66 124 112 123 60 123 - - 115 94 - - 97
Total 2.956 485 194 348 280 322 60 328 - - 351 310 - - 278
2. Results
2.1 The participants
Following the research protocol of Children’s Worlds, the proportion of children by age and
gender are presented in Table 2. Approximately 52.5% of children were female, and 46.5%
were male.
Table 2. Age by gender (Numbers, (%))
8 year-old 10 year-old 12 year-old Total
Boy 478 (51.4) 496 (52.4) 578 (53.5) 1552 (52.5)
Girl 435 (46.8) 444 (46.9) 497 (46.0) 1376 (46.5)
Missing 17 (1.8) 6 (0.6) 5 (0.5) 28 (0.9)
Total 930 (100.0) 946 (100.0) 1080 (100.0) 2956 (100.0)
Missing: 28 (0.9%)
2.2 The home and the people children live with
Most Vietnamese children live in the same home every day. Thus, we did not include the
question that asked whether the child lives in the same home or in different homes.
The vast majority of children (95.2%) lived with their family while 2.1% of children lived in
other types of home (Table 3).
Children's Worlds 3rd
wave Vietnam National Report
6
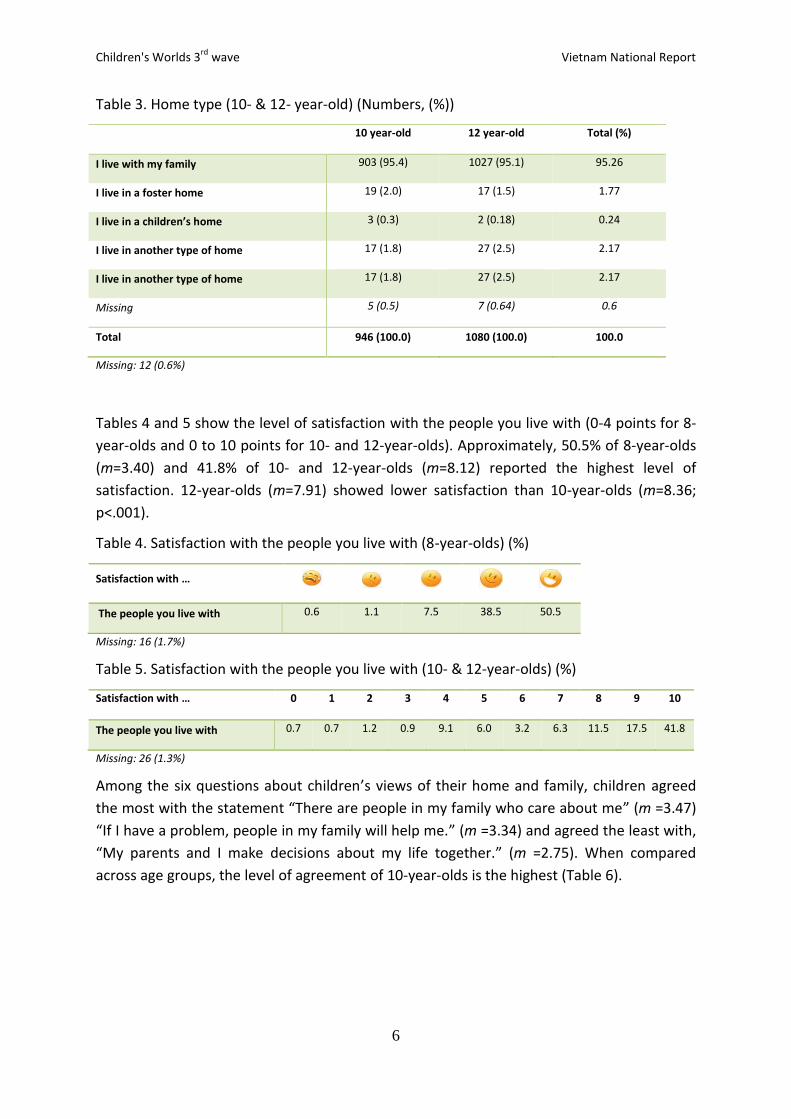
Table 3. Home type (10- & 12- year-old) (Numbers, (%))
First home % 10 year-old 12 year-old Total (%)
I live with my family 903 (95.4) 1027 (95.1) 95.26
I live in a foster home 19 (2.0) 17 (1.5) 1.77
I live in a children’s home 3 (0.3) 2 (0.18) 0.24
I live in another type of home 17 (1.8) 27 (2.5) 2.17
I live in another type of home 17 (1.8) 27 (2.5) 2.17
Missing 5 (0.5) 7 (0.64) 0.6
Total 946 (100.0) 1080 (100.0) 100.0
Missing: 12 (0.6%)
Tables 4 and 5 show the level of satisfaction with the people you live with (0-4 points for 8-
year-olds and 0 to 10 points for 10- and 12-year-olds). Approximately, 50.5% of 8-year-olds
(m=3.40) and 41.8% of 10- and 12-year-olds (m=8.12) reported the highest level of
satisfaction. 12-year-olds (m=7.91) showed lower satisfaction than 10-year-olds (m=8.36;
p<.001).
Table 4. Satisfaction with the people you live with (8-year-olds) (%)
Satisfaction with …
The people you live with 0.6 1.1 7.5 38.5 50.5
Missing: 16 (1.7%)
Table 5. Satisfaction with the people you live with (10- & 12-year-olds) (%)
Satisfaction with … 0 1 2 3 4 5 6 7 8 9 10
The people you live with 0.7 0.7 1.2 0.9 9.1 6.0 3.2 6.3 11.5 17.5 41.8
Missing: 26 (1.3%)
Among the six questions about children’s views of their home and family, children agreed
the most with the statement “There are people in my family who care about me” (m =3.47)
“If I have a problem, people in my family will help me.” (m =3.34) and agreed the least with,
“My parents and I make decisions about my life together.” (m =2.75). When compared
across age groups, the level of agreement of 10-year-olds is the highest (Table 6).
Children's Worlds 3rd
wave Vietnam National Report
7
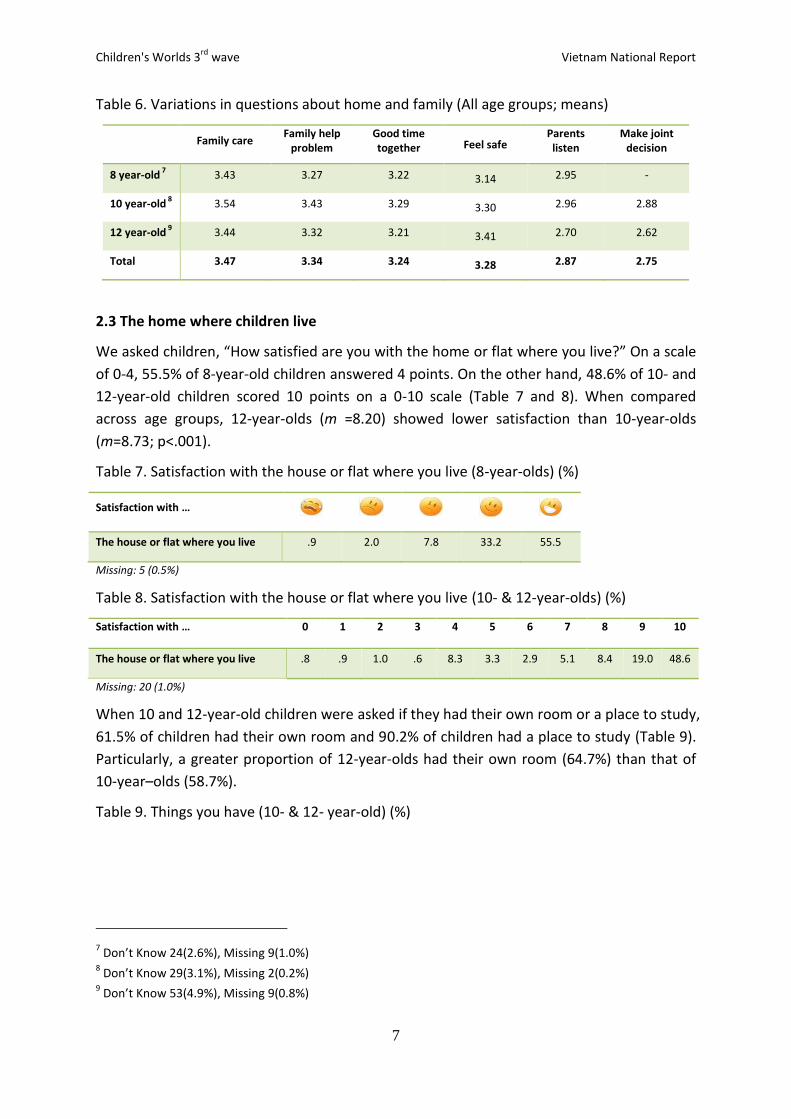
Table 6. Variations in questions about home and family (All age groups; means)
Family care
Family help problem
Good time together Feel safe
Parents listen
Make joint decision
8 year-old 7
3.43 3.27 3.22 3.14 2.95 -
10 year-old 8
3.54 3.43 3.29 3.30 2.96 2.88
12 year-old 9
3.44 3.32 3.21 3.41 2.70 2.62
Total 3.47 3.34 3.24 3.28 2.87 2.75
2.3 The home where children live
We asked children, “How satisfied are you with the home or flat where you live?” On a scale
of 0-4, 55.5% of 8-year-old children answered 4 points. On the other hand, 48.6% of 10- and
12-year-old children scored 10 points on a 0-10 scale (Table 7 and 8). When compared
across age groups, 12-year-olds (m =8.20) showed lower satisfaction than 10-year-olds
(m=8.73; p<.001).
Table 7. Satisfaction with the house or flat where you live (8-year-olds) (%)
Satisfaction with …
The house or flat where you live .9 2.0 7.8 33.2 55.5
Missing: 5 (0.5%)
Table 8. Satisfaction with the house or flat where you live (10- & 12-year-olds) (%)
Satisfaction with … 0 1 2 3 4 5 6 7 8 9 10
The house or flat where you live .8 .9 1.0 .6 8.3 3.3 2.9 5.1 8.4 19.0 48.6
Missing: 20 (1.0%)
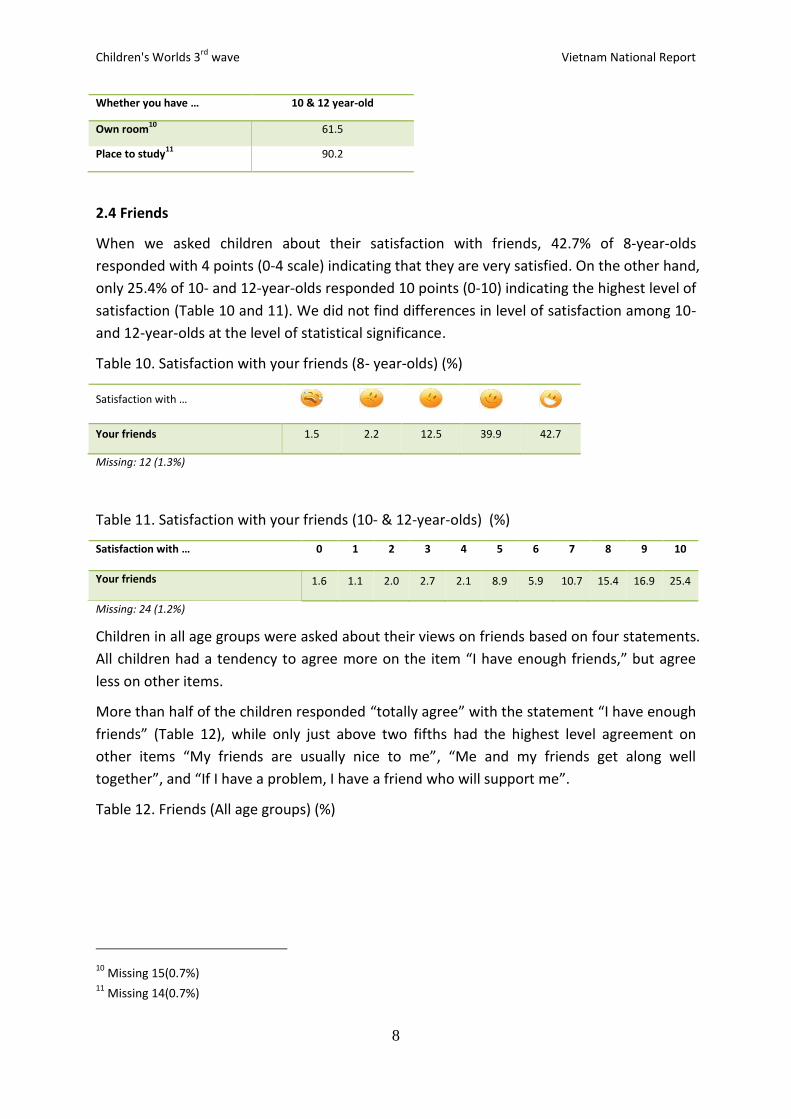
When 10 and 12-year-old children were asked if they had their own room or a place to study,
61.5% of children had their own room and 90.2% of children had a place to study (Table 9).
Particularly, a greater proportion of 12-year-olds had their own room (64.7%) than that of
10-year–olds (58.7%).
Table 9. Things you have (10- & 12- year-old) (%)
7 Don’t Know 24(2.6%), Missing 9(1.0%)
8 Don’t Know 29(3.1%), Missing 2(0.2%)
9 Don’t Know 53(4.9%), Missing 9(0.8%)
Children's Worlds 3rd
wave Vietnam National Report
8
Whether you have … 10 & 12 year-old
Own room10
61.5
Place to study11
90.2
2.4 Friends
When we asked children about their satisfaction with friends, 42.7% of 8-year-olds
responded with 4 points (0-4 scale) indicating that they are very satisfied. On the other hand,
only 25.4% of 10- and 12-year-olds responded 10 points (0-10) indicating the highest level of
satisfaction (Table 10 and 11). We did not find differences in level of satisfaction among 10-
and 12-year-olds at the level of statistical significance.
Table 10. Satisfaction with your friends (8- year-olds) (%)
Satisfaction with …
Your friends 1.5 2.2 12.5 39.9 42.7
Missing: 12 (1.3%)
Table 11. Satisfaction with your friends (10- & 12-year-olds) (%)
Satisfaction with … 0 1 2 3 4 5 6 7 8 9 10
Your friends 1.6 1.1 2.0 2.7 2.1 8.9 5.9 10.7 15.4 16.9 25.4
Missing: 24 (1.2%)
Children in all age groups were asked about their views on friends based on four statements.
All children had a tendency to agree more on the item “I have enough friends,” but agree
less on other items.
More than half of the children responded “totally agree” with the statement “I have enough
friends” (Table 12), while only just above two fifths had the highest level agreement on
other items “My friends are usually nice to me”, “Me and my friends get along well
together”, and “If I have a problem, I have a friend who will support me”.
Table 12. Friends (All age groups) (%)
10
Missing 15(0.7%) 11
Missing 14(0.7%)

Children's Worlds 3rd
wave Vietnam National Report
9
I do not
agree
Agree a
little bit
Agree
somewhat
Agree a
lot
Totally
agree
I have enough friends12
4.1 7.6 11.5 16.1 56.1
My friends are usually nice to me13
5.1 11.0 17.3 22.3 40.5
Me and my friends get along well together14
4.5 11.4 15.9 22.8 40.8
If I have a problem, I have a friend who will support me15
6.4 10.4 12.2 19.2 43.6
2.5 School
Children’s views about school were not very positive. On a scale of 0 to 4, the number of 8-
year-olds were responded 4 points (very satisfied) regarding their school life is closed to a
half (Table 13). For 10- and 12-year-olds, 20.8 to 47.4% of children responded 10 points on a
scale of 0 to 10 indicating that they are very satisfied with school life (Table 14). Among
three school life’s dimentions, children of all age groups had a tendency to be less satisfied
with other children in their class.
Table 13. Satisfaction with school life (8- year-olds) (%)
Satisfaction with …
Life as a student16
1.0 1.3 9.9 39.6 46.6
Things you have learned17
.4 1.0 8.3 31.5 57.7
Other children in your class18
1.8 4.5 12.7 36.7 43.2
Table 14. Satisfaction with school life (10- & 12-year-olds )(%)
12
Don’t Know 103(3.5%), Missing 31(1.0%) 13
Don’t Know 93(3.1%), Missing 19(0.6%) 14
Don’t Know 107(3.6%), Missing 27(0.9%) 15
Don’t Know 203(6.9%), Missing 30(1.0%) 16
Missing 16(1.7%) 17
Missing 10(1.1%) 18
Missing 10(1.1%) 19
Missing 15(0.7%) 20
Missing 20(1.0%)
Satisfaction with … 0 1 2 3 4 5 6 7 8 9 10
Life as a student19
.6 .5 1.1 .7 7.7 4.7 4.3 7.7 13.2 20.8 37.9
Things you have learned20
.3 .1 .6 .5 7.4 3.3 3.6 6.1 10.7 19.0 47.4
Children's Worlds 3rd
wave Vietnam National Report
10
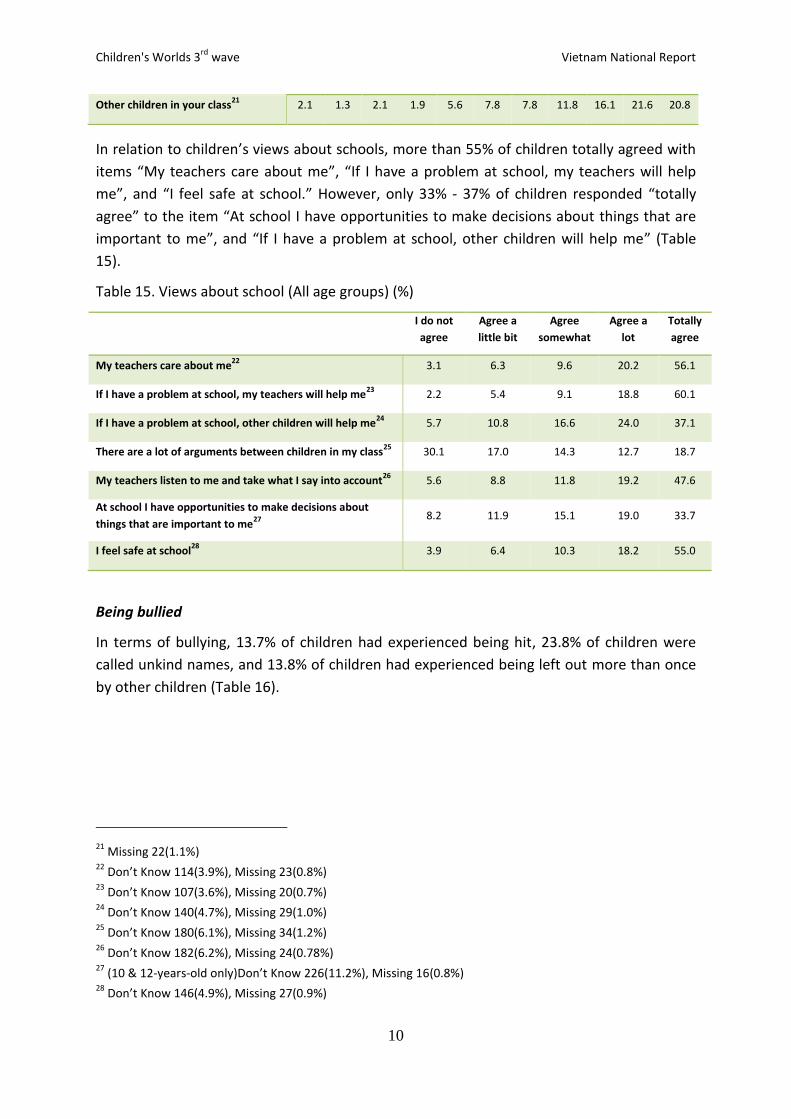
In relation to children’s views about schools, more than 55% of children totally agreed with
items “My teachers care about me”, “If I have a problem at school, my teachers will help
me”, and “I feel safe at school.” However, only 33% - 37% of children responded “totally
agree” to the item “At school I have opportunities to make decisions about things that are
important to me”, and “If I have a problem at school, other children will help me” (Table
15).
Table 15. Views about school (All age groups) (%)
I do not
agree
Agree a
little bit
Agree
somewhat
Agree a
lot
Totally
agree
My teachers care about me22
3.1 6.3 9.6 20.2 56.1
If I have a problem at school, my teachers will help me23
2.2 5.4 9.1 18.8 60.1
If I have a problem at school, other children will help me24
5.7 10.8 16.6 24.0 37.1
There are a lot of arguments between children in my class25
30.1 17.0 14.3 12.7 18.7
My teachers listen to me and take what I say into account26
5.6 8.8 11.8 19.2 47.6
At school I have opportunities to make decisions about
things that are important to me27
8.2 11.9 15.1 19.0 33.7
I feel safe at school28
3.9 6.4 10.3 18.2 55.0
Being bullied
In terms of bullying, 13.7% of children had experienced being hit, 23.8% of children were
called unkind names, and 13.8% of children had experienced being left out more than once
by other children (Table 16).
21
Missing 22(1.1%) 22
Don’t Know 114(3.9%), Missing 23(0.8%) 23
Don’t Know 107(3.6%), Missing 20(0.7%) 24
Don’t Know 140(4.7%), Missing 29(1.0%) 25
Don’t Know 180(6.1%), Missing 34(1.2%) 26
Don’t Know 182(6.2%), Missing 24(0.78%) 27
(10 & 12-years-old only)Don’t Know 226(11.2%), Missing 16(0.8%) 28
Don’t Know 146(4.9%), Missing 27(0.9%)
Other children in your class21
2.1 1.3 2.1 1.9 5.6 7.8 7.8 11.8 16.1 21.6 20.8

Children's Worlds 3rd
wave Vietnam National Report
11
Table 16. Bullying (All age groups) (%)
How often: Never Once Two or 3 times More than
three times
Hit by other children in your school29
64.3 15.2 7.4 6.3
Called unkind names by other children
in your school30
54.4 14.1 8.9 14.9
Left out by other children in your class31
59.9 13.8 7.4 5.9
2.6 The area where children live
The next three questions covered children’s satisfaction with their local area. On a scale of
0-4, 60.6% of children rated the highest level of satisfaction with their local area. On the
other hand, 36.1% of 10 and 12-year-old children rated the highest level of satisfaction on a
scale 0-10 (Table 17 and 18).
Table 17. Satisfaction with local area (8- year-olds) (%)
Satisfaction with …
The area where you live32
1.5 1.6 6.2 28.7 60.6
Table 18. Satisfaction with local area (10- & 12-year-olds) (%)
Satisfaction with: 0 1 2 3 4 5 6 7 8 9 10
The area where you live33
1.7 .7 .7 .8 8.1 4.9 3.9 7.7 13.3 21.2 36.1
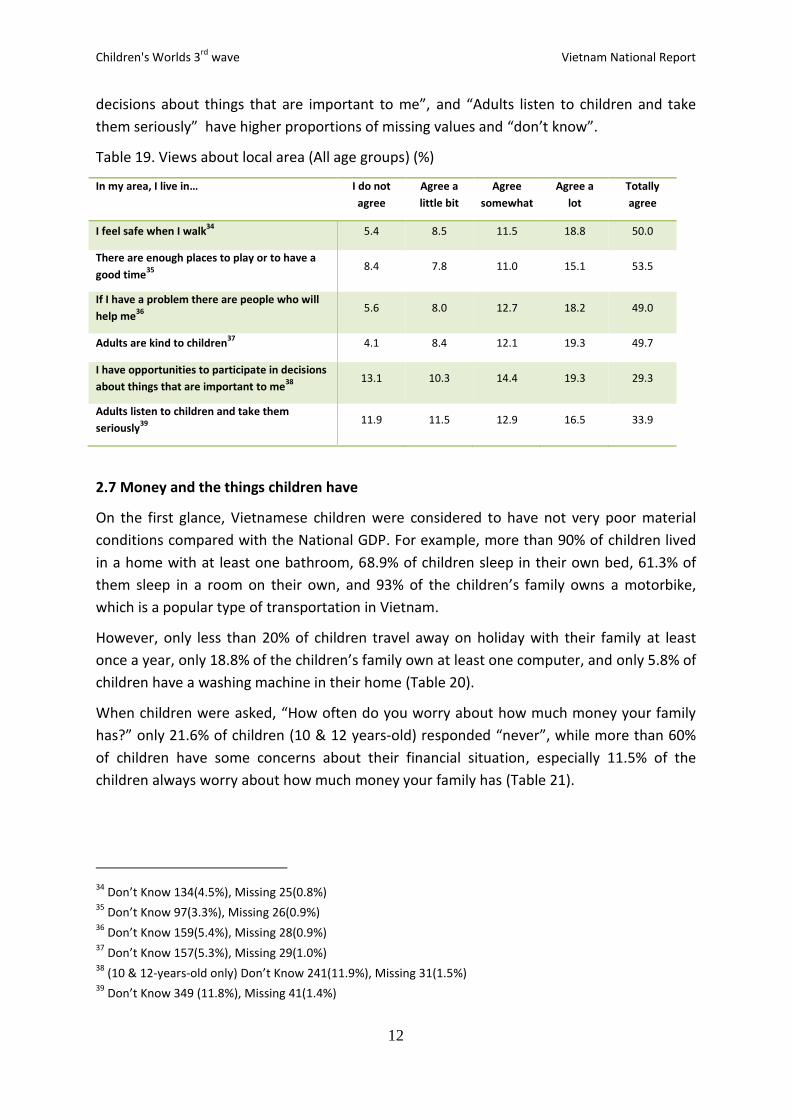
Children’s views of their local area are presented in Table 19 for all age groups. Relatively
lower levels of agreement were reported for these items. For example, approximately 35%
of children responded “totally agree” for items “There are enough places to play or to have
a good time,” “If I have a problem there are people who will help me,” and “Adults are kind
to children.” Even fewer proportion of children totally agreed with items like “I feel safe
when I walk,”(25.6%) “I have opportunities to participate in decisions about things that are
important to me,” (19.5%), and “Adults listen children and take them seriously” (23.5%)
Moreover, items such as “Adults are kind to children”, “I have opportunities to participate in
29
Don’t Know 182(6.2%), Missing 16(0.5%) 30
Don’t Know 203(6.9%), Missing 15(0.5%) 31
Don’t Know 339(11.5%), Missing 25(0.8%) 32
Missing 12(1.3%) 33
Missing 16(0.8%)
Children's Worlds 3rd
wave Vietnam National Report
12
decisions about things that are important to me”, and “Adults listen to children and take
them seriously” have higher proportions of missing values and “don’t know”.
Table 19. Views about local area (All age groups) (%)
In my area, I live in… I do not
agree
Agree a
little bit
Agree
somewhat
Agree a
lot
Totally
agree
I feel safe when I walk34
5.4 8.5 11.5 18.8 50.0
There are enough places to play or to have a
good time35
8.4 7.8 11.0 15.1 53.5
If I have a problem there are people who will
help me36
5.6 8.0 12.7 18.2 49.0
Adults are kind to children37
4.1 8.4 12.1 19.3 49.7
I have opportunities to participate in decisions
about things that are important to me38
13.1 10.3 14.4 19.3 29.3
Adults listen to children and take them
seriously39
11.9 11.5 12.9 16.5 33.9
2.7 Money and the things children have
On the first glance, Vietnamese children were considered to have not very poor material
conditions compared with the National GDP. For example, more than 90% of children lived
in a home with at least one bathroom, 68.9% of children sleep in their own bed, 61.3% of
them sleep in a room on their own, and 93% of the children’s family owns a motorbike,
which is a popular type of transportation in Vietnam.
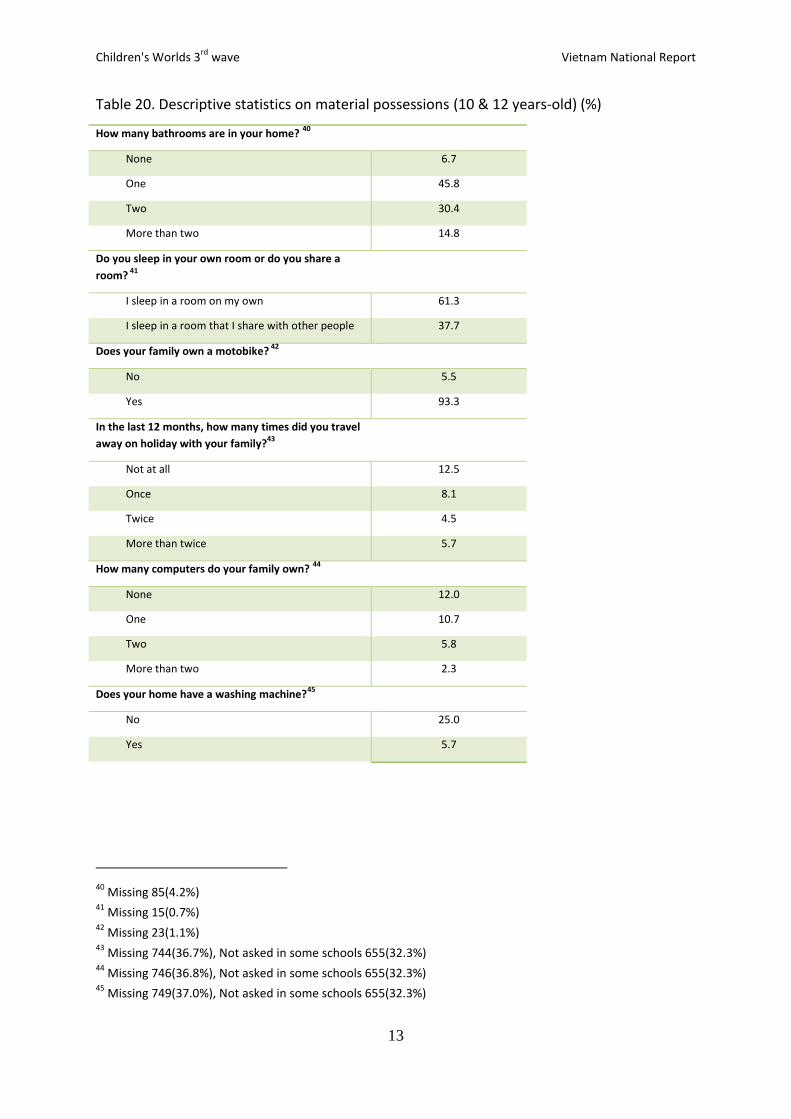
However, only less than 20% of children travel away on holiday with their family at least
once a year, only 18.8% of the children’s family own at least one computer, and only 5.8% of
children have a washing machine in their home (Table 20).
When children were asked, “How often do you worry about how much money your family
has?” only 21.6% of children (10 & 12 years-old) responded “never”, while more than 60%
of children have some concerns about their financial situation, especially 11.5% of the
children always worry about how much money your family has (Table 21).
34
Don’t Know 134(4.5%), Missing 25(0.8%) 35
Don’t Know 97(3.3%), Missing 26(0.9%) 36
Don’t Know 159(5.4%), Missing 28(0.9%) 37
Don’t Know 157(5.3%), Missing 29(1.0%) 38
(10 & 12-years-old only) Don’t Know 241(11.9%), Missing 31(1.5%) 39
Don’t Know 349 (11.8%), Missing 41(1.4%)
Children's Worlds 3rd
wave Vietnam National Report
13
Table 20. Descriptive statistics on material possessions (10 & 12 years-old) (%)
How many bathrooms are in your home? 40
None 6.7
One 45.8
Two 30.4
More than two 14.8
Do you sleep in your own room or do you share a
room? 41
I sleep in a room on my own 61.3
I sleep in a room that I share with other people 37.7
Does your family own a motobike? 42
No 5.5
Yes 93.3
In the last 12 months, how many times did you travel
away on holiday with your family?43
Not at all 12.5
Once 8.1
Twice 4.5
More than twice 5.7
How many computers do your family own? 44
None 12.0
One 10.7
Two 5.8
More than two 2.3
Does your home have a washing machine?45
No 25.0
Yes 5.7
40
Missing 85(4.2%) 41
Missing 15(0.7%) 42
Missing 23(1.1%) 43
Missing 744(36.7%), Not asked in some schools 655(32.3%) 44
Missing 746(36.8%), Not asked in some schools 655(32.3%) 45
Missing 749(37.0%), Not asked in some schools 655(32.3%)

Children's Worlds 3rd
wave Vietnam National Report
14
Table 21. How often do you worry about how much money your family has? (10 & 12 years-
old) (%) 46
10-12 year-old
Never 21.6
Sometimes 40.1
Often 9.2
Always 11.5
Children were asked to rate the level of satisfaction they felt with things they have. Eight-
year-old children were asked to respond on a 5-point Likert scale, whereas older children
were asked to respond on an 11-point scale. 56.6% of 8 year-olds were happy with things
they had at the highest level, while 38.5% of 10 and 12 year-olds felt the most satisfaction
with things they had (Table 22 and 23). Moreover, 10 year-olds (m=8.49) were more
satisfied with their possessions than 12 year-olds (m=7.92) (p <0.001)
Table 22. Satisfaction with all the things you have (8- year-olds) (%)
Satisfaction with …
All the things you have47
1.4 1.9 7.8 30.5 56.6
Table 23. Satisfaction with all the things you have (10- & 12-year-olds) (%)
Satisfaction with … 0 1 2 3 4 5 6 7 8 9 10
All the things you have48
1.0 .6 1.2 .7 7.1 4.4 4.2 6.1 13.9 21.4 38.5
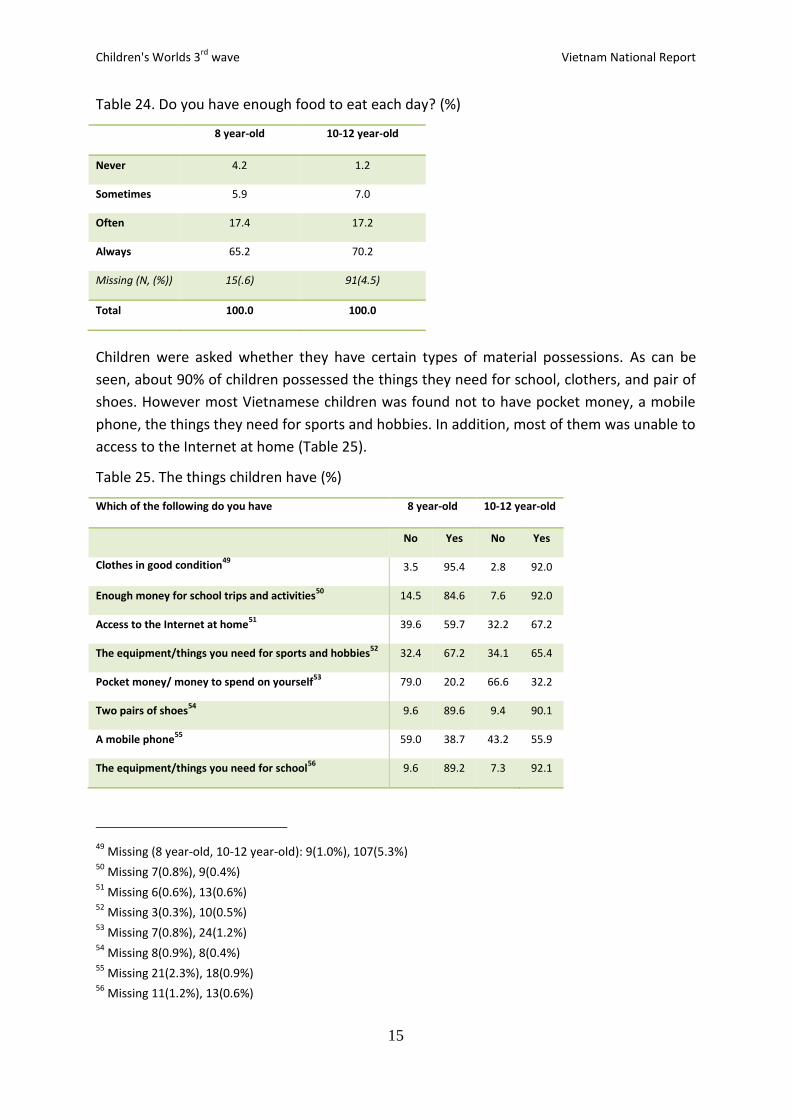
When children were asked do you have enough food to eat each day, 4.2% of 8 year-olds
and 1.2% 10-12 year-olds responded that they never have enough food (Table 24).
46
Don’t Know 334(16.5%), Missing 16(0.8%) 47
Missing 16(1.7%) 48
Missing 15(0.7%)
Children's Worlds 3rd
wave Vietnam National Report
15
Table 24. Do you have enough food to eat each day? (%)
8 year-old 10-12 year-old
Never 4.2 1.2
Sometimes 5.9 7.0
Often 17.4 17.2
Always 65.2 70.2
Missing (N, (%)) 15(.6) 91(4.5)
Total 100.0 100.0
Children were asked whether they have certain types of material possessions. As can be
seen, about 90% of children possessed the things they need for school, clothers, and pair of
shoes. However most Vietnamese children was found not to have pocket money, a mobile
phone, the things they need for sports and hobbies. In addition, most of them was unable to
access to the Internet at home (Table 25).
Table 25. The things children have (%)
Which of the following do you have 8 year-old 10-12 year-old
No Yes No Yes
Clothes in good condition49
3.5 95.4 2.8 92.0
Enough money for school trips and activities50
14.5 84.6 7.6 92.0
Access to the Internet at home51
39.6 59.7 32.2 67.2
The equipment/things you need for sports and hobbies52
32.4 67.2 34.1 65.4
Pocket money/ money to spend on yourself53
79.0 20.2 66.6 32.2
Two pairs of shoes54
9.6 89.6 9.4 90.1
A mobile phone55
59.0 38.7 43.2 55.9
The equipment/things you need for school56
9.6 89.2 7.3 92.1
49
Missing (8 year-old, 10-12 year-old): 9(1.0%), 107(5.3%) 50
Missing 7(0.8%), 9(0.4%) 51
Missing 6(0.6%), 13(0.6%) 52
Missing 3(0.3%), 10(0.5%) 53
Missing 7(0.8%), 24(1.2%) 54
Missing 8(0.9%), 8(0.4%) 55
Missing 21(2.3%), 18(0.9%) 56
Missing 11(1.2%), 13(0.6%)

Children's Worlds 3rd
wave Vietnam National Report
16
2.8 Time use
When children were asked about their level of satisfaction with their use of time and free
time, 42.6% of 8 year-olds reported the maximum score on satisfaction with their use of
time (Table 26). For 10- and 12-year-olds, 33.6% of children were completely satisfied
(score=10) with their free time and 31.6% of children satisfied with time use (Table 27).
When 10- and 12-year-olds were compared with each other, 10 year-olds were much more
satisfied with their time use (i.e., m (10-year-olds) = 8.24 vs. m (12-year-olds)= 7.84) and
their free time (i.e., m (10-year-olds) = 7.99 vs. m (12-year-olds)= 7.44) than 12 year-olds.
Table 26. Satisfaction with time use (8- year-olds) (%)
Satisfaction with …
How you use your time57
.8 2.4 14.0 39.4 42.6
Table 27. Satisfaction with time use (10- & 12-year-olds) (%)
Satisfaction with: 0 1 2 3 4 5 6 7 8 9 10
How you use your
time58
1.6 .5 1.0 1.3 6.2 6.0 5.4 8.2 15.7 21.7 31.6
How much free time
you have59
2.6 .90 1.7 2.2 7.8 5.2 4.7 9.1 14.2 17.1 33.6
2.9 Subjective well-being: how children feel about their lives
The Children’s Worlds survey includes a variety of different measures asking about overall
subjective well-being.
Overall life satisfaction (OLS)
Children who are 8 year-olds are asked to use a 5-point scale, and children who are 10- and
12-year-olds are asked to rate their overall life satisfaction using an 11-point scale. On life as
a whole, 41.8% of 8-year-olds responded with a maximum score on the overall life
satisfaction scale and 45.4% of 10- and 12-year-olds were completely satisfied with their life.
When 10- and 12-year-olds were compared with each other, 10-year-olds (m=8.80) were
more likely to be satisfied with their life than their 12-year-old (m=8.28) counterparts (Table
28 and 29).
57
Missing 9(1.0%) 58
Missing 13(0.6%) 59
Missing 13(0.6%)

Children's Worlds 3rd
wave Vietnam National Report
17
Table 28. Overall life satisfaction (8- year-olds) (%)
Satisfaction with …
Your life as a whole 60
2.2 2.3 12.6 29.8 41.8
Table 29. Overall life satisfaction (10- & 12-year-olds) (%)
Satisfaction with: 0 1 2 3 4 5 6 7 8 9 10
Your life as a whole61
1.3 .6 .7 1.1 1.4 5.3 3.5 6.8 12.6 21.1 45.4
CW-SWBS (Children’s Worlds Subjective Well-Being Scale)
CW-SWBS scale is a reduced version of Student’s Life Satisfaction Scale, developed by
Huebner (1991). This scale is based on six statements about children’s overall life
satisfaction, and children are asked to indicate how far they agree with each statement. In
the Children’s Worlds survey, children aged 10 and 12 were asked to respond using an 11-
point scale ranging from “do not agree” to “totally agree” (Table 30). The questions used in
this analysis comprised of: I enjoy my life; My life is going well; I have a good life; The things
that happen in my life are excellent; I like my life; I am happy with my life.
Table 30. CW-SWBS items (10- & 12- year-old) (%)
0 1 2 3 4 5 6 7 8 9 10
I enjoy my life.62
1.8 .8 1.5 1.8 8.3 6.2 5.4 7.2 12.4 17.6 36.1
My life is going well.63
1.5 .5 1.0 1.2 6.9 5.2 3.8 5.7 12.5 19.2 41.2
I have a good life.64
2.2 .6 1.4 1.3 7.2 4.8 4.1 7.1 11.0 16.9 40.0
The things that happen in
my life are excellent.65
4.3 1.5 2.5 2.7 7.8 7.4 6.0 10.7 13.8 18.4 23.7
I like my life.66
2.1 1.1 1.5 1.4 8.1 3.9 4.2 5.8 10.9 19.0 41.0
I am happy with my life.67
2.5 .7 1.1 1.4 8.8 4.1 3.5 5.4 10.6 19.4 41.7
60
Missing 30(3.2%) 61
Missing 8(0.4%) 62
Missing 20(1.0%) 63
Missing 26(1.3%) 64
Missing 61(3.0%) 65
Missing 24(1.2%) 66
Missing 20(1.0%) 67
Missing 17(0.8%)

Children's Worlds 3rd
wave Vietnam National Report
18
The six items that were found to form a single factor of subjective well-being were utilized.
The distribution of each individual items are provided in Table 30. The scale was formed by
summing all of the items and transforming the scale from 0 to 100. The distribution of
responses on this scale is shown in Table 31. Approximately 13% of children scored highest
possible levels of satisfaction. In general, 11.2% of children reported low levels of
satisfaction, scoring the mid-point or below of the CW-SWBS. When CW-SWBS were
compared by age groups, 10-year-old children (m=82.4) had higher levels of satisfaction
than 12-year-olds (m=76.1), p <0.001.
Table 31. The distribution of CW-SWBS (Transform into 100 scale) (10 & 12 year-old) (%)
%
0 to less than 10 .5
10 to less than 20 .9
20 to less than 30 1.4
30 to less than 40 2.2
40 to less than 50 6.2
50 to less than 60 5.5
60 to less than 70 7.3
70 to less than 80 11.7
80 to less than 90 16.7
90 to less than 100 28.4
100 13.2
Total 100.0
Missing 103 (5.1%)
CW-DBSWBS (Children’s Worlds Domain Based Subjective Well-Being Scale)
Children’s Worlds Domain Based Subjective Well-Being Scale, originally proposed by
Seligson, Huebner and Valois, consists of five domains – family, friends, school, living
environment and self. An adapted version of this scale was calculated using the questions
about satisfaction with family life, friends, school experience, local area and body. The total
score was calculated by summing these five items and transforming it so that the score
ranges from zero to 100. The distribution of the scores for individual items are presented in
Table 32. The item with the lowest level of satisfaction was “your friend” and “the way that
you look.” The distribution of scores is shown in Table 33. In general, 5.1% of children
reported low levels of satisfaction, scoring less than 50 points of the CW-SWBS.

Children's Worlds 3rd
wave Vietnam National Report
19
Table 32. CW- DBSWBS items (10 & 12 year-old) (%)
Satisfaction with 0 1 2 3 4 5 6 7 8 9 10
The people you live
with68
.7 .7 1.2 .9 9.1 6.0 3.2 6.3 11.5 17.5 41.8
Your friends69
1.6 1.1 2.0 2.7 8.1 8.9 5.9 10.7 15.4 16.9 25.4
Your life as a student70
.6 .5 1.1 .7 7.7 4.7 4.3 7.7 13.2 20.8 37.9
The area where you
live71
1.7 .7 .7 .8 8.1 4.9 3.9 7.7 13.3 21.2 36.1
The way that you
look72
2.3 .9 1.4 2.0 3.3 8.6 6.5 10.1 13.9 19.9 28.8
Table 33. The distribution of CW- DBSWBS (Transform into 100 scale) (10 & 12 year-old) (%)
%
0 to less than 10 .0
10 to less than 20 .1
20 to less than 30 .3
30 to less than 40 .9
40 to less than 50 3.8
50 to less than 60 9.0
60 to less than 70 9.9
70 to less than 80 15.0
80 to less than 90 22.4
90 to less than 100 26.6
100 6.3
Total 100.0
Missing 115(5.7%)
CW-PNAS (Children’s Worlds Positive and Negative Affects Scale)
Six items measuring affective subjective well-being: positive and negative affect (derived
from Barrett and Russell’s measures, 1998) was asked to 10- and 12-year-old children.
68
Missing 26(1.3%) 69
Missing 23(1.1%) 70
Missing 15(0.7%) 71
Missing 16(0.8%) 72
Missing 45(2.2%)
Children's Worlds 3rd
wave Vietnam National Report
20
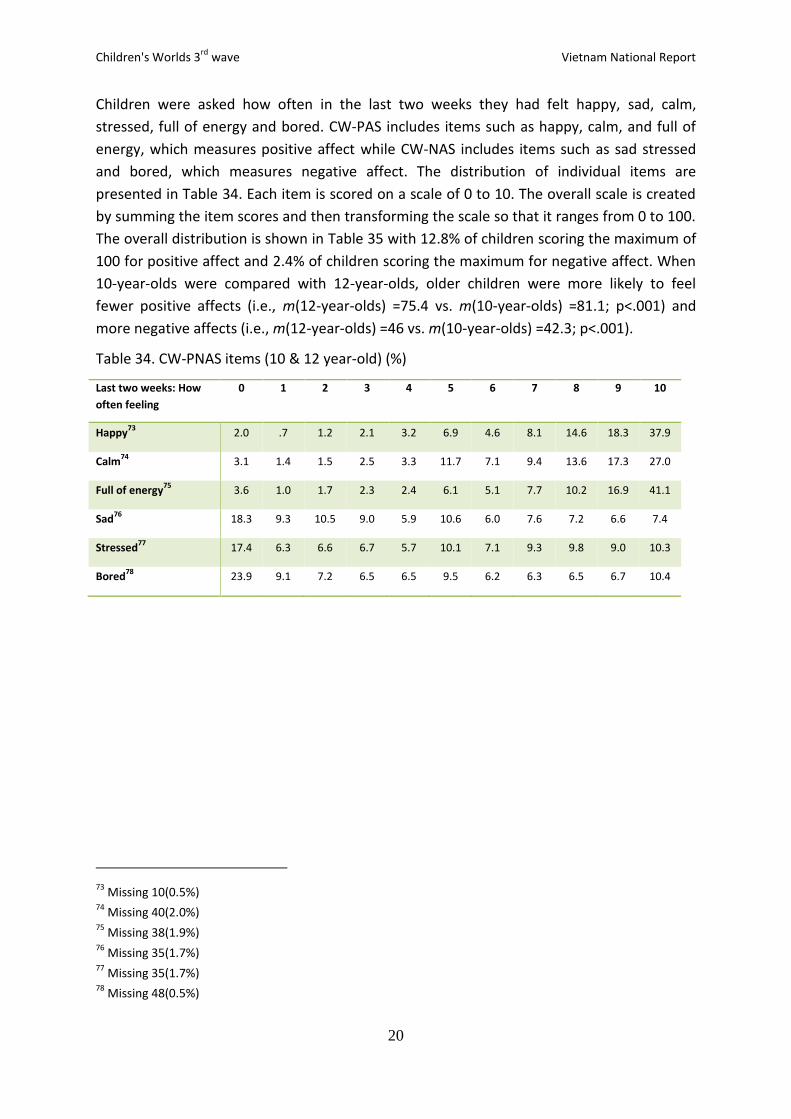
Children were asked how often in the last two weeks they had felt happy, sad, calm,
stressed, full of energy and bored. CW-PAS includes items such as happy, calm, and full of
energy, which measures positive affect while CW-NAS includes items such as sad stressed
and bored, which measures negative affect. The distribution of individual items are
presented in Table 34. Each item is scored on a scale of 0 to 10. The overall scale is created
by summing the item scores and then transforming the scale so that it ranges from 0 to 100.
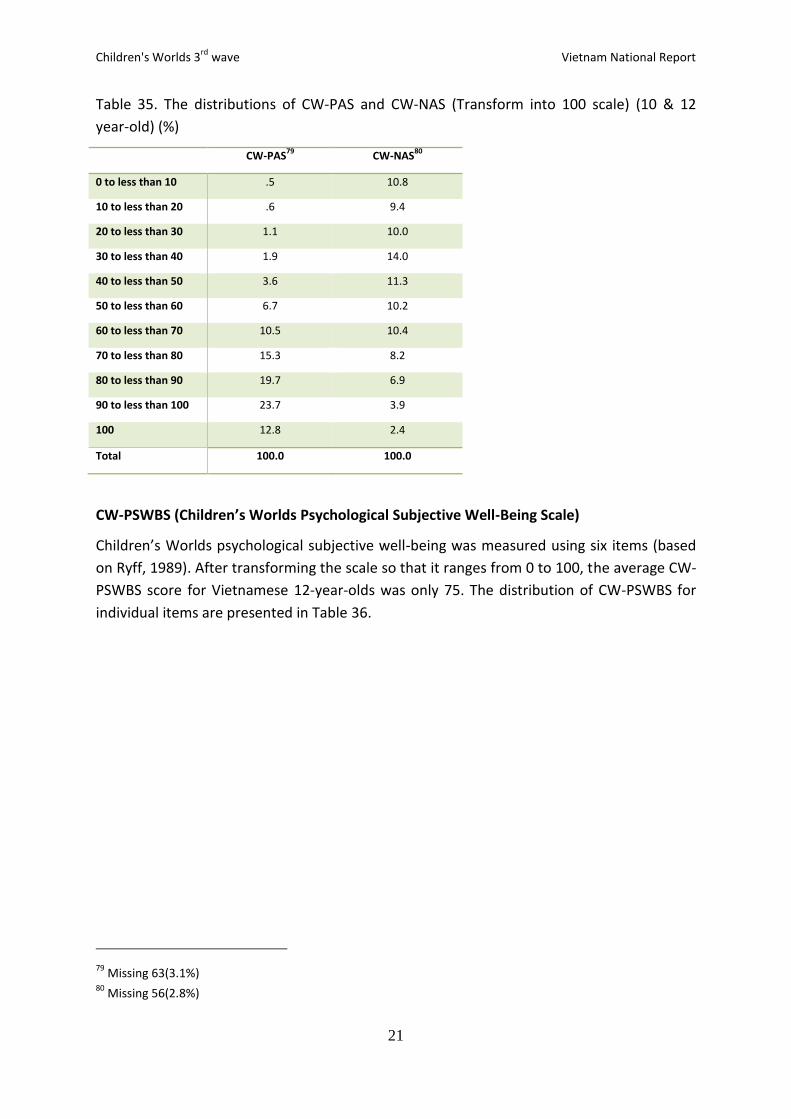
The overall distribution is shown in Table 35 with 12.8% of children scoring the maximum of
100 for positive affect and 2.4% of children scoring the maximum for negative affect. When
10-year-olds were compared with 12-year-olds, older children were more likely to feel
fewer positive affects (i.e., m(12-year-olds) =75.4 vs. m(10-year-olds) =81.1; p<.001) and
more negative affects (i.e., m(12-year-olds) =46 vs. m(10-year-olds) =42.3; p<.001).
Table 34. CW-PNAS items (10 & 12 year-old) (%)
Last two weeks: How
often feeling
0 1 2 3 4 5 6 7 8 9 10
Happy73
2.0 .7 1.2 2.1 3.2 6.9 4.6 8.1 14.6 18.3 37.9
Calm74
3.1 1.4 1.5 2.5 3.3 11.7 7.1 9.4 13.6 17.3 27.0
Full of energy75
3.6 1.0 1.7 2.3 2.4 6.1 5.1 7.7 10.2 16.9 41.1
Sad76
18.3 9.3 10.5 9.0 5.9 10.6 6.0 7.6 7.2 6.6 7.4
Stressed77
17.4 6.3 6.6 6.7 5.7 10.1 7.1 9.3 9.8 9.0 10.3
Bored78
23.9 9.1 7.2 6.5 6.5 9.5 6.2 6.3 6.5 6.7 10.4
73
Missing 10(0.5%) 74
Missing 40(2.0%) 75
Missing 38(1.9%) 76
Missing 35(1.7%) 77
Missing 35(1.7%) 78
Missing 48(0.5%)
Children's Worlds 3rd
wave Vietnam National Report
21
Table 35. The distributions of CW-PAS and CW-NAS (Transform into 100 scale) (10 & 12
year-old) (%)
CW-PAS79
CW-NAS80
0 to less than 10 .5 10.8
10 to less than 20 .6 9.4
20 to less than 30 1.1 10.0
30 to less than 40 1.9 14.0
40 to less than 50 3.6 11.3
50 to less than 60 6.7 10.2
60 to less than 70 10.5 10.4
70 to less than 80 15.3 8.2
80 to less than 90 19.7 6.9
90 to less than 100 23.7 3.9
100 12.8 2.4
Total 100.0 100.0
CW-PSWBS (Children’s Worlds Psychological Subjective Well-Being Scale)
Children’s Worlds psychological subjective well-being was measured using six items (based
on Ryff, 1989). After transforming the scale so that it ranges from 0 to 100, the average CW-
PSWBS score for Vietnamese 12-year-olds was only 75. The distribution of CW-PSWBS for
individual items are presented in Table 36.
79
Missing 63(3.1%) 80
Missing 56(2.8%)

Children's Worlds 3rd
wave Vietnam National Report
22
Table 36. CW- PSWBS items (12 year-old) (%)
How much you agree with 0 1 2 3 4 5 6 7 8 9 10
I like being the way I am.81
4.1 .9 1.2 1.0 3.1 8.8 4.4 8.9 14.0 15.2 38.0
I am good at managing my
daily responsibilities.82
6.9 1.2 1.9 3.1 4.9 11.3 7.8 12.3 15.1 13.5 21.3
People are generally pretty
friendly towards me.83
2.7 .6 1.4 1.5 3.1 6.9 8.1 10.1 15.6 19.4 29.4
I have enough choice
about how I spend my
time.84
6.3 1.8 .8 2.4 4.1 8.2 6.5 11.3 15.2 15.4 27.3
I feel that I am learning a
lot at the moment.85
3.1 .6 .9 1.3 2.2 6.9 6.5 10.6 12.8 17.4 37.0
I feel positive about my
future.86
6.2 1.8 1.2 1.6 4.1 6.5 7.3 9.0 13.5 19.0 29.3
Table 37. The distribution of CW- PSWBS (Transform into 100 scale) (12 year-old) (%)
%
0 to less than 10 .9
10 to less than 20 .9
20 to less than 30 10.0
30 to less than 40 2.2
40 to less than 50 4.8
50 to less than 60 9.0
60 to less than 70 12.9
70 to less than 80 18.7
80 to less than 90 21.7
90 to less than 100 19.4
100 6.2
Total 100.0
Missing 28(2.6%)
81
Missing 6(0.6%) 82
Missing 8(0.7%) 83
Missing 12(1.1%) 84
Missing 8(0.7%) 85
Missing 8(0.7%) 86
Missing 7(0.6%)

Children's Worlds 3rd
wave Vietnam National Report
23
2.10 Children perceptions about children’s rights
When children were asked about their rights, approximately 44% of children responded “yes”
to the question “I know what rights children have.” On the other hand, only 12.71%
responded “yes” to the question ”I know about the children’s rights convention.” 8-year-
olds were less to know about their rights and UN Convention on the Rights of the Child than
their older counterparts (Table 38).
Table 38. Children’s rights (%)
8-year-olds 10-year-
olds
12-year-
olds
Total
I know what rights children have87
No 40.8 18.0 8.9 21.9
Not sure 26.6 39.7 29.4 31.7
Yes 32.6 42.3 61.7 46.3
Total 100.0 100.0 100.0 100.0
I know about the UN Convention on the Rights
of the Child88
No 57.5 33.4 10.4 31.4
Not sure 24.0 43.6 25.6 31.1
Yes 18.5 23.0 64.0 37.5
Total 100.0 100.0 100.0 100.0
2. Conclusions
This report presents the findings of an initial descriptive analysis of North Vietnam
Children’s Worlds dataset. We found that most Vietnamese children in the North live with
both parents at their home. Only more than half of 8-year-old children were satisfied with
the people they live and the housing where they live, and more than two fifths of 10-12
year-olds reported the high level of satisfaction.
When asked about their friends, children were generally not much satisfied with their
friends and generally only about half of all children agreed with the statements about their
friends. Accordingly, Vietnamese children’s in the North view about their school were also
generally not very positive. In addition, children of all ages showed lower levels of
satisfaction with school life when compared with their assessment of other domains such as
home, family, and friends. While bullying at school was not a problem for more than half of
the children, it was a problem for nearly two-firths of all children, especially being called
unkind names were the most common form of bullying experienced by Vietnamese children
(45%).
87
Missing 36(1.2%) 88
Missing 33(1.1%)
Children's Worlds 3rd
wave Vietnam National Report
24
Children’s level of satisfaction with the area where they live were generally high for 8-year-
olds. However, only 36.1% of 10- & 12-year-olds reported highest levels of satisfaction.
When children’s views about local area were analysed, we found that fewer children
participated in the decision-making process about things that were important to them in the
local area. Beside, only one third of all children reported that adults listen to children and
take them seriously.
For many Vietnamese children in the North, owning necessary material things was still a
problem. Less than one-fifth of the children said that their family owned a computer, and
less than 6% owned a car. In addition, they only more than half of 8-year-olds and less than
two-fifths of 10- and 12-year-olds reported high levels of satisfaction with the things that
they have. The proportion of children that were satisfied with how they used their time was
also less. Only one-third of 10- and 12-year-olds reported highest level of satisfaction for
how they use their time and how much free time they have.
Overall, children were satisfied with their lives. Approximately 40% or more children
reported satisfaction on the domain-based satisfaction scale. However, Vietnamese children
showed lower levels of satisfaction on their friends and on the way they look, compared
with other domains. In terms of positive and negative affects, approximately 13% of children
reported the maximum score for positive affect, and 2.5% of children reported the
maximum score for negative affect. Vietnamese children were less likely to feel calm when
compared with other domains of positive affect, and less likely to feel sad when compared
with other domains of negative affect.
When we compared children’s subjective well-being across age groups that for most areas
older children reported lower levels of subjective well-being than their younger
counterparts. The level of SWB may related to increasing knowledge about children rights
and UN Convention on the Rights of the Child from 8- to 10- and 12-year-olds. Children may
have more and more demands for their right and for other life’s dimensions when they get
older.