chilled water thermal energy storage: providing value even
TRANSCRIPT
Chilled Water Thermal Energy Storage:
providing value
even in the Great White North
John S. Andrepont, President
The Cool Solutions Company
International District Energy Association (IDEA) Annual Conference
Vancouver, British Columbia, Canada – June 11-14, 2018

1
Outline
• Introduction
– Chilled Water (CHW) Thermal Energy Storage (TES)
– Background: Why and Where CHW TES Is Used
• Examples of Saving Both Operating and Capital Costs
• Case Studies of Seasonally Cold Climate (Canadian) CHW TES
– U of Guelph – Guelph, Ontario
– U of Alberta – Edmonton, Alberta
• Why Not Battery Storage? Why CHW TES?
• Summary, Conclusions, and Recommendations
2
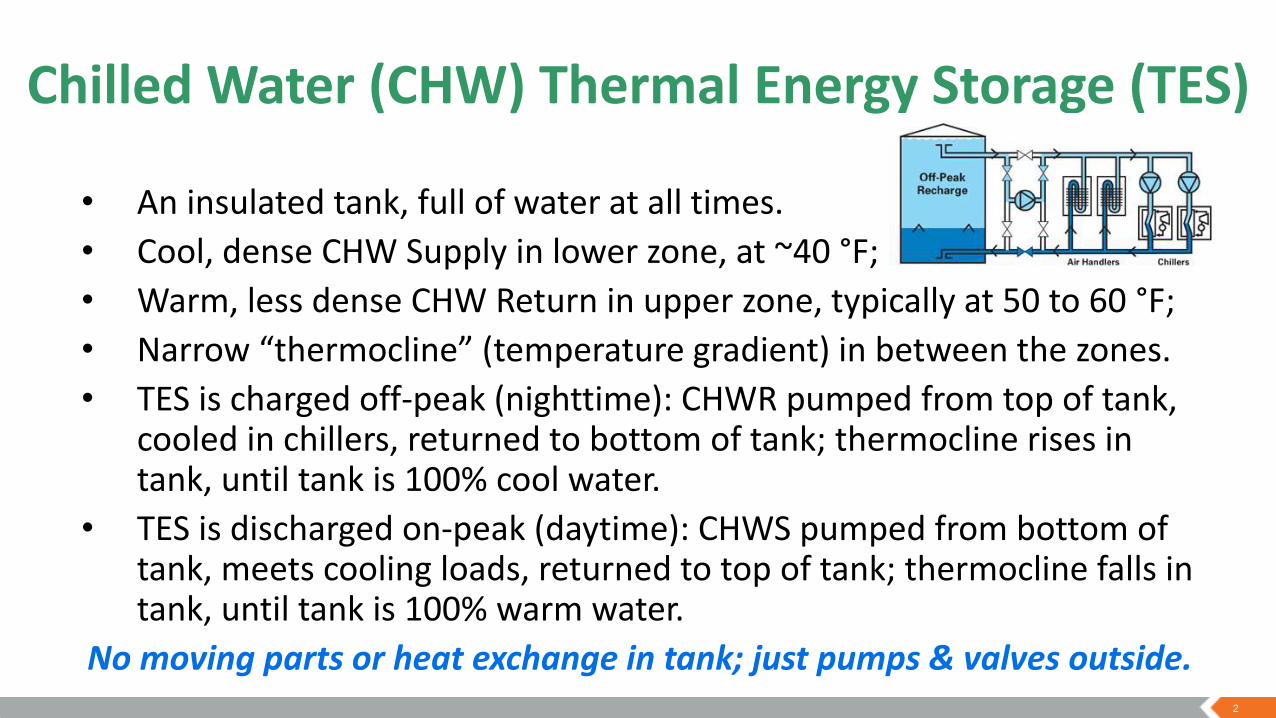
Chilled Water (CHW) Thermal Energy Storage (TES)
• An insulated tank, full of water at all times.
• Cool, dense CHW Supply in lower zone, at ~40 °F;
• Warm, less dense CHW Return in upper zone, typically at 50 to 60 °F;
• Narrow “thermocline” (temperature gradient) in between the zones.
• TES is charged off-peak (nighttime): CHWR pumped from top of tank, cooled in chillers, returned to bottom of tank; thermocline rises in tank, until tank is 100% cool water.
• TES is discharged on-peak (daytime): CHWS pumped from bottom of tank, meets cooling loads, returned to top of tank; thermocline falls in tank, until tank is 100% warm water.
No moving parts or heat exchange in tank; just pumps & valves outside.

3
Background: Why and Where It Is Used
Chilled Water (CHW) Thermal Energy Storage (TES):
• Has long been understood to save operating electric cost.
• Has long been understood to apply in hot weather locales.
• Hundreds of installations in hot locales, including as examples:
– Los Angeles, CA; Phoenix, AZ; Houston, TX; Orlando, FL;
– Rio de Janeiro, Brazil; Kuala Lumpur, Malaysia; Dubai, U.A.E.
But perhaps surprisingly, CHW TES:
• Often saves on immediate capital cost.
• Many dozens of installations in seasonally cold climates.
4
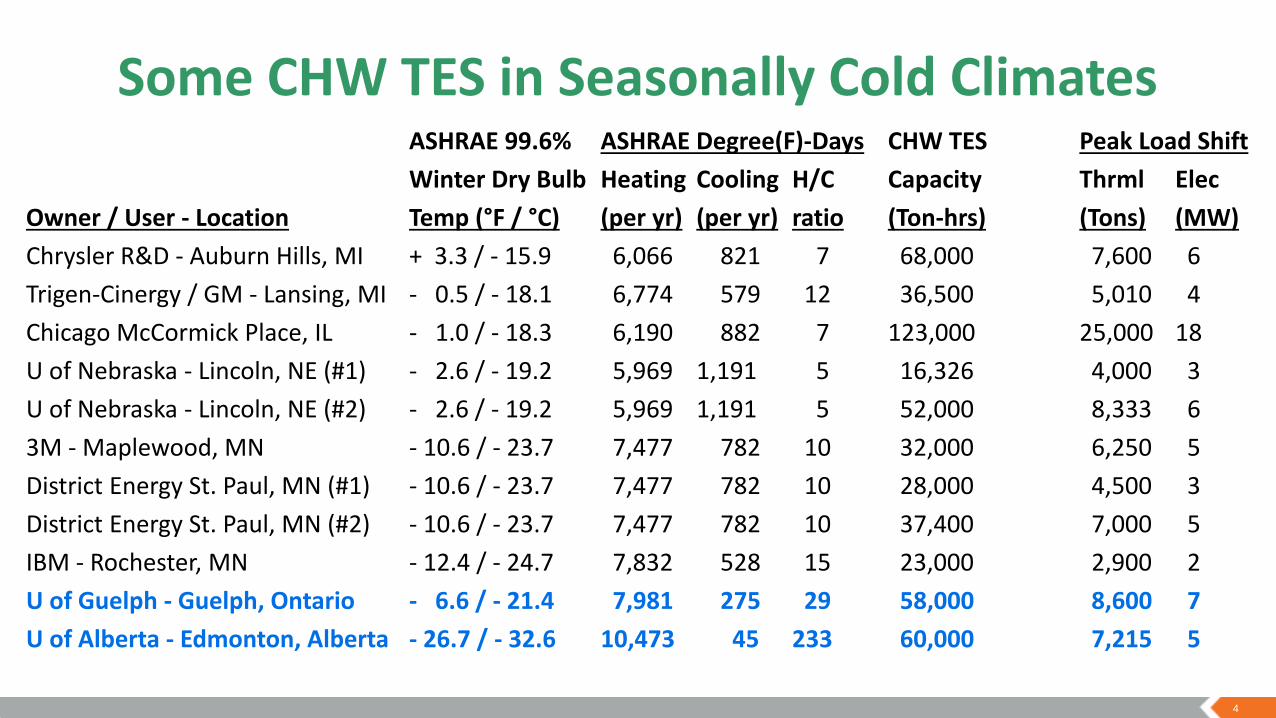
Some CHW TES in Seasonally Cold ClimatesASHRAE 99.6% ASHRAE Degree(F)-Days CHW TES Peak Load Shift
Winter Dry Bulb Heating Cooling H/C Capacity Thrml Elec
Owner / User - Location Temp (°F / °C) (per yr) (per yr) ratio (Ton-hrs) (Tons) (MW)
Chrysler R&D - Auburn Hills, MI + 3.3 / - 15.9 6,066 821 7 68,000 7,600 6
Trigen-Cinergy / GM - Lansing, MI - 0.5 / - 18.1 6,774 579 12 36,500 5,010 4
Chicago McCormick Place, IL - 1.0 / - 18.3 6,190 882 7 123,000 25,000 18
U of Nebraska - Lincoln, NE (#1) - 2.6 / - 19.2 5,969 1,191 5 16,326 4,000 3
U of Nebraska - Lincoln, NE (#2) - 2.6 / - 19.2 5,969 1,191 5 52,000 8,333 6
3M - Maplewood, MN - 10.6 / - 23.7 7,477 782 10 32,000 6,250 5
District Energy St. Paul, MN (#1) - 10.6 / - 23.7 7,477 782 10 28,000 4,500 3
District Energy St. Paul, MN (#2) - 10.6 / - 23.7 7,477 782 10 37,400 7,000 5
IBM - Rochester, MN - 12.4 / - 24.7 7,832 528 15 23,000 2,900 2
U of Guelph - Guelph, Ontario - 6.6 / - 21.4 7,981 275 29 58,000 8,600 7
U of Alberta - Edmonton, Alberta - 26.7 / - 32.6 10,473 45 233 60,000 7,215 5
5
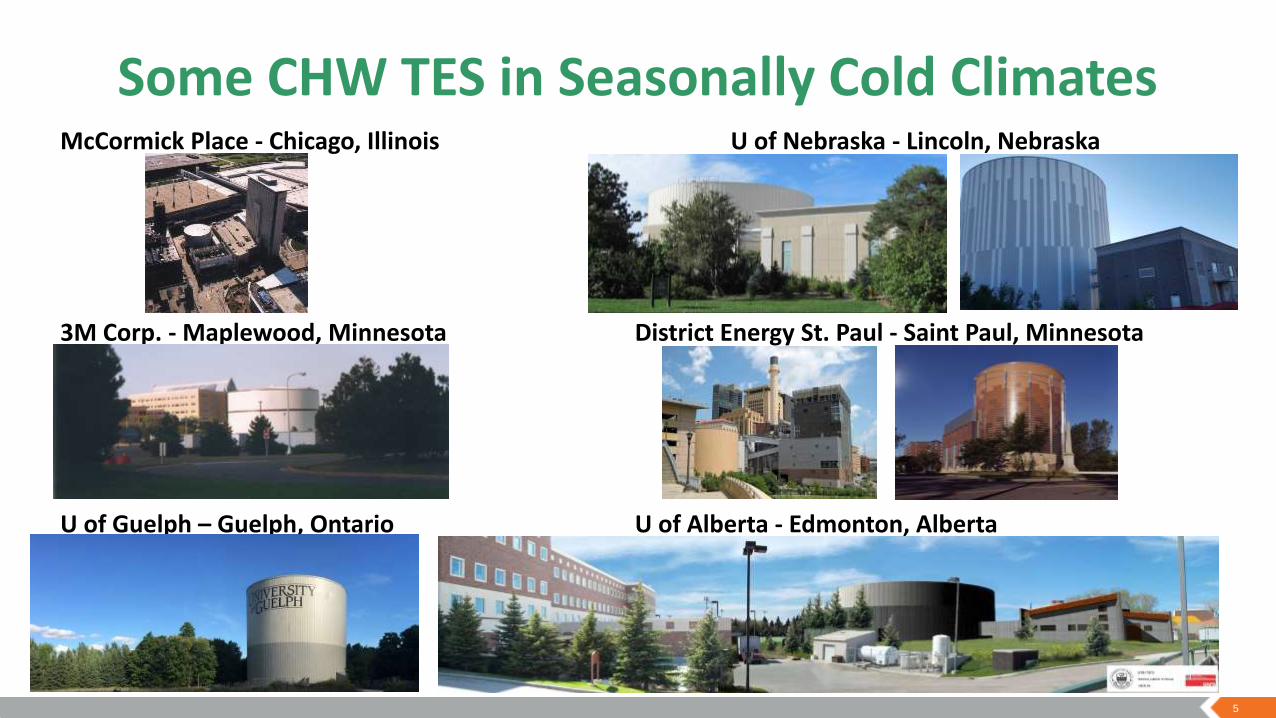
Some CHW TES in Seasonally Cold ClimatesMcCormick Place - Chicago, Illinois U of Nebraska - Lincoln, Nebraska
3M Corp. - Maplewood, Minnesota District Energy St. Paul - Saint Paul, Minnesota
U of Guelph – Guelph, Ontario U of Alberta - Edmonton, Alberta
6
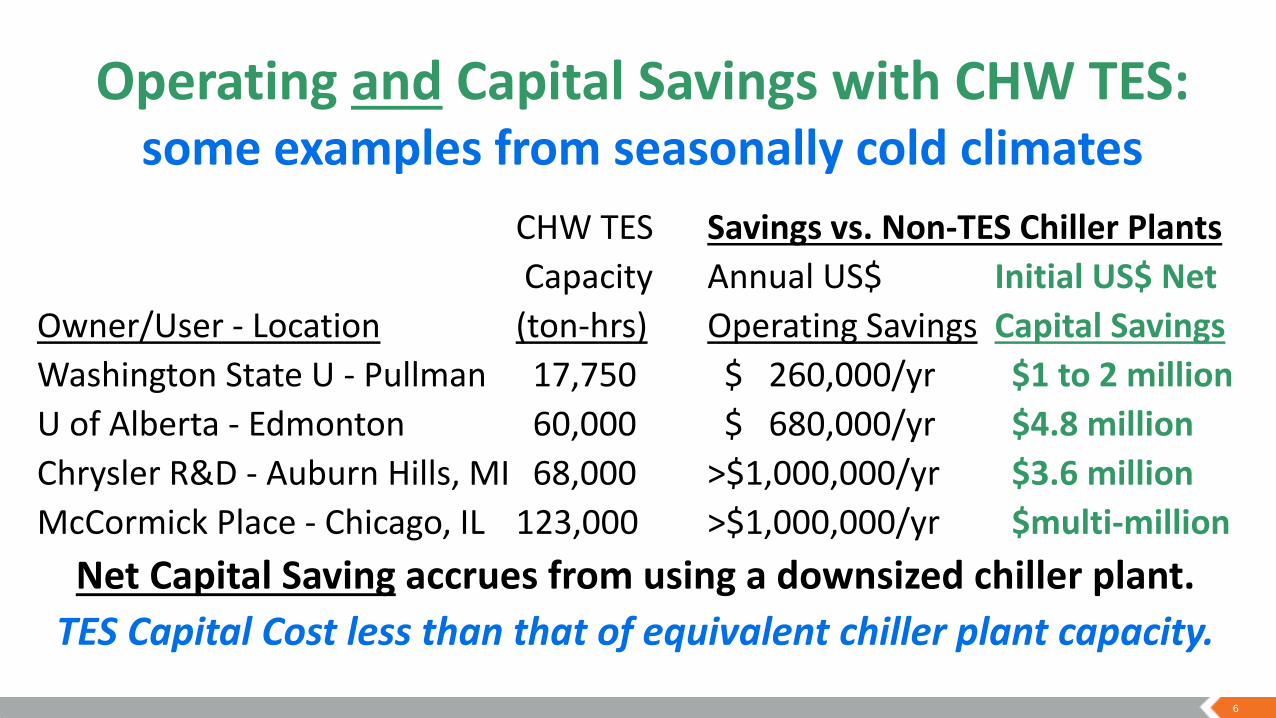
Operating and Capital Savings with CHW TES:some examples from seasonally cold climates
CHW TES Savings vs. Non-TES Chiller Plants
Capacity Annual US$ Initial US$ Net
Owner/User - Location (ton-hrs) Operating Savings Capital Savings
Washington State U - Pullman 17,750 $ 260,000/yr $1 to 2 million
U of Alberta - Edmonton 60,000 $ 680,000/yr $4.8 million
Chrysler R&D - Auburn Hills, MI 68,000 >$1,000,000/yr $3.6 million
McCormick Place - Chicago, IL 123,000 >$1,000,000/yr $multi-million
Net Capital Saving accrues from using a downsized chiller plant.
TES Capital Cost less than that of equivalent chiller plant capacity.
7
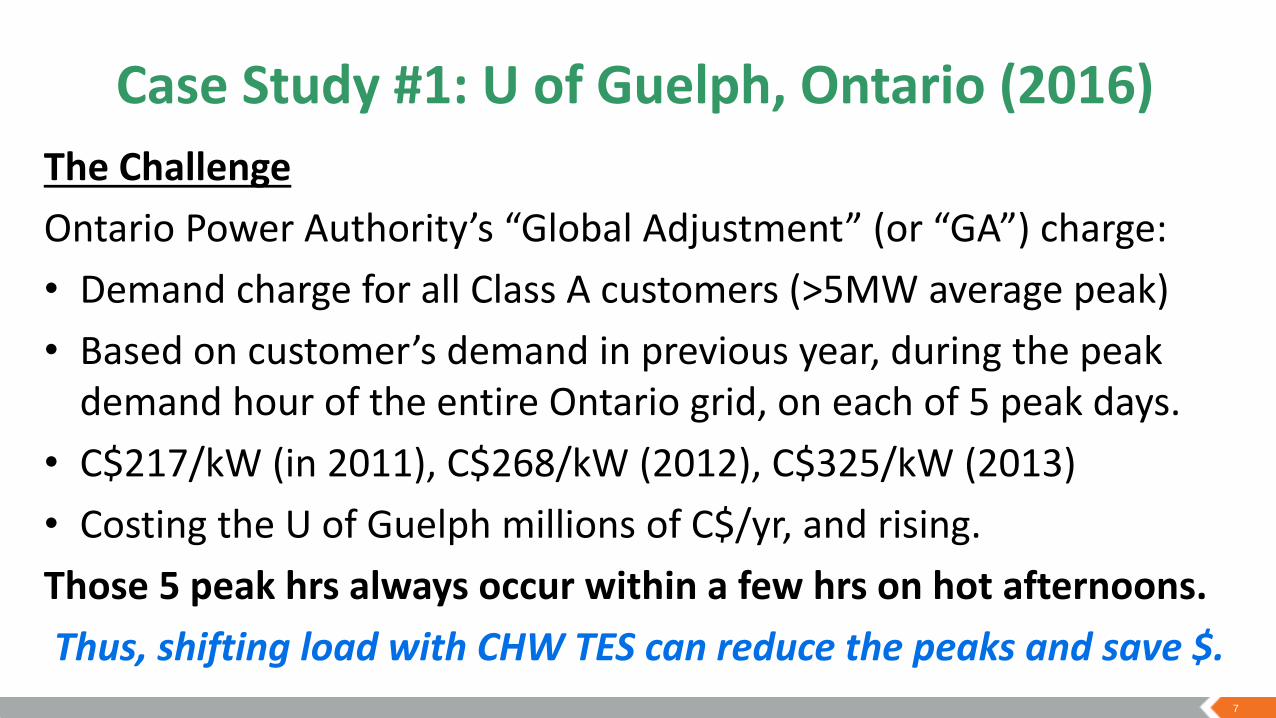
Case Study #1: U of Guelph, Ontario (2016)
The Challenge
Ontario Power Authority’s “Global Adjustment” (or “GA”) charge:
• Demand charge for all Class A customers (>5MW average peak)
• Based on customer’s demand in previous year, during the peak demand hour of the entire Ontario grid, on each of 5 peak days.
• C$217/kW (in 2011), C$268/kW (2012), C$325/kW (2013)
• Costing the U of Guelph millions of C$/yr, and rising.
Those 5 peak hrs always occur within a few hrs on hot afternoons.
Thus, shifting load with CHW TES can reduce the peaks and save $.

8
Case Study #1: U of Guelph, Ontario (2016)
Chosen solution: CHW TES
5.6 million US gallons (100 ft D x 96 ft H)
58,000 Ton-hrs at CHWS/R of 40/56 °F
Peak shift: 8,600 Tons (~6.5 MW elec)
CHW TES vs. Business-as-Usual (no TES):
• CapEx = C$15.0M – C$5.8M (Ont. energy incentive) = C$9.2M net
• 2016 Oper’g Cost Saving = ~C$2.5M/yr (for a 3.7 yr payback)
• 2018 Oper’g Cost Saving = ~C$3.3M/yr (as GA rose to C$515/kW)
Strategic reduction in summer peak = tens of millions C$ in NPV.
9
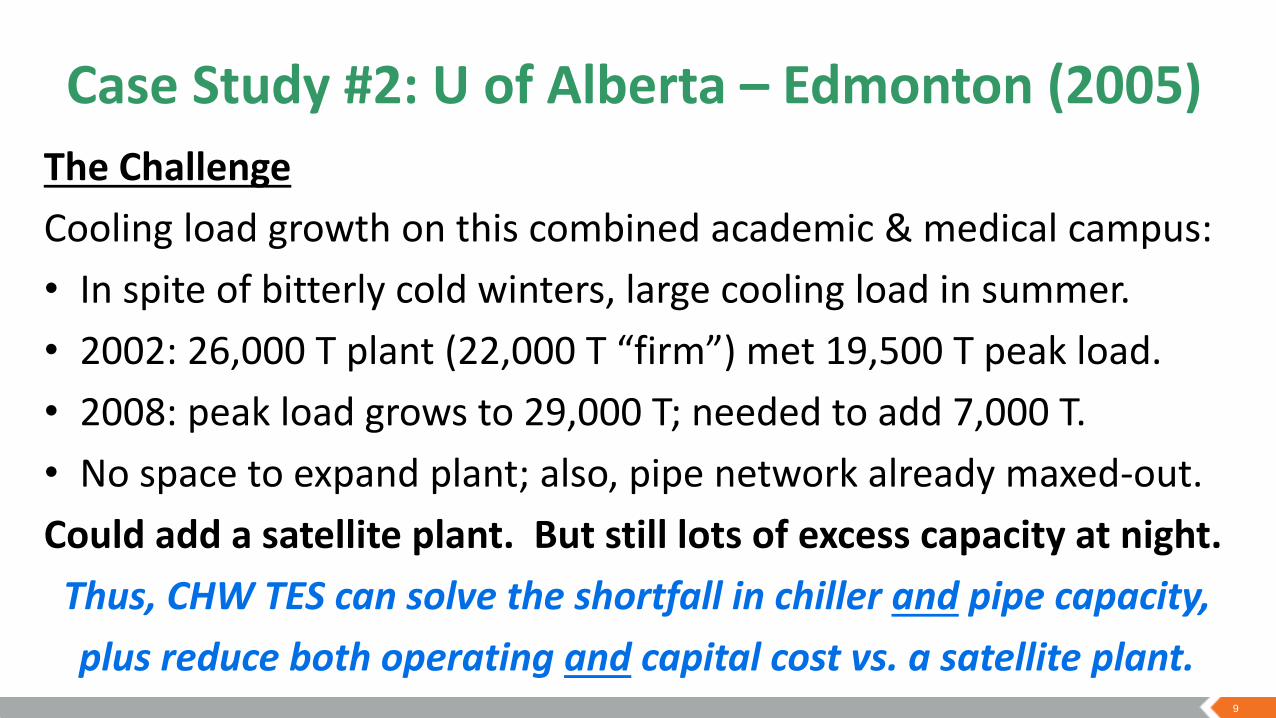
Case Study #2: U of Alberta – Edmonton (2005)
The Challenge
Cooling load growth on this combined academic & medical campus:
• In spite of bitterly cold winters, large cooling load in summer.
• 2002: 26,000 T plant (22,000 T “firm”) met 19,500 T peak load.
• 2008: peak load grows to 29,000 T; needed to add 7,000 T.
• No space to expand plant; also, pipe network already maxed-out.
Could add a satellite plant. But still lots of excess capacity at night.
Thus, CHW TES can solve the shortfall in chiller and pipe capacity,
plus reduce both operating and capital cost vs. a satellite plant.
10
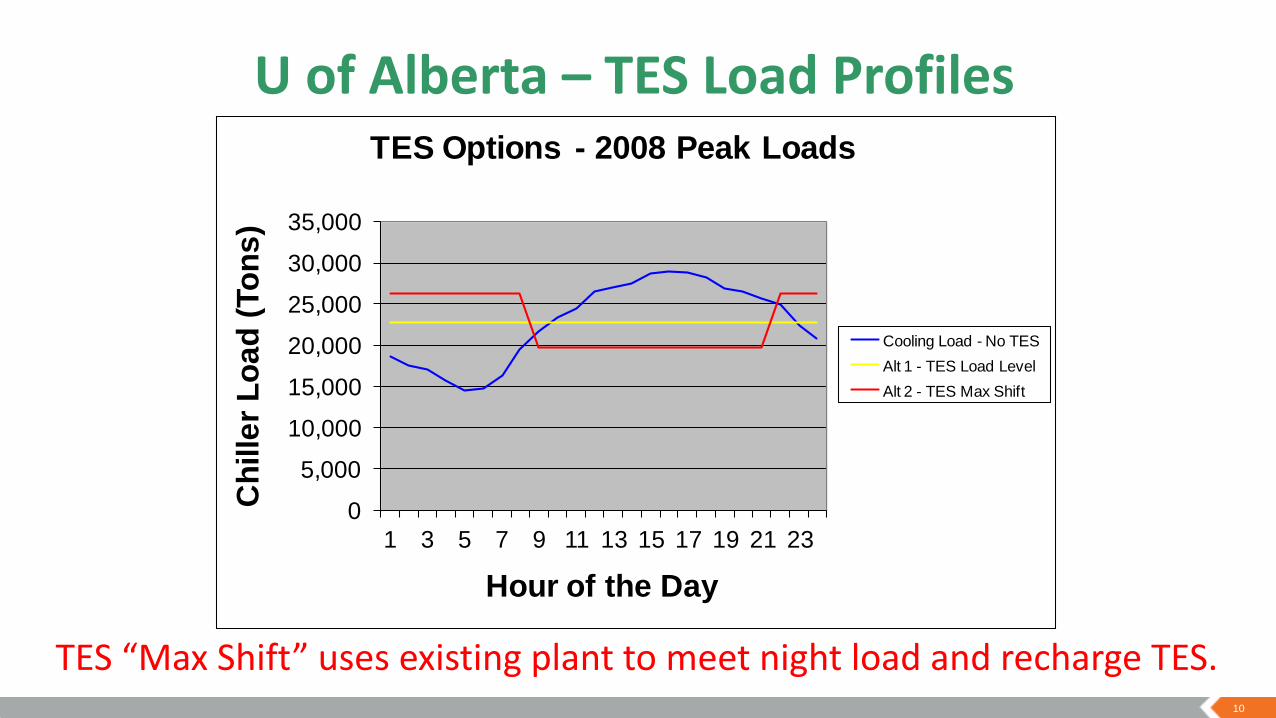
U of Alberta – TES Load Profiles
TES “Max Shift” uses existing plant to meet night load and recharge TES.
0
5,000
10,000
15,000
20,000
25,000
30,000
35,000
1 3 5 7 9 11 13 15 17 19 21 23
Ch
ille
r L
oa
d (
To
ns
)
Hour of the Day
TES Options - 2008 Peak Loads
Cooling Load - No TES
Alt 1 - TES Load Level
Alt 2 - TES Max Shift
11
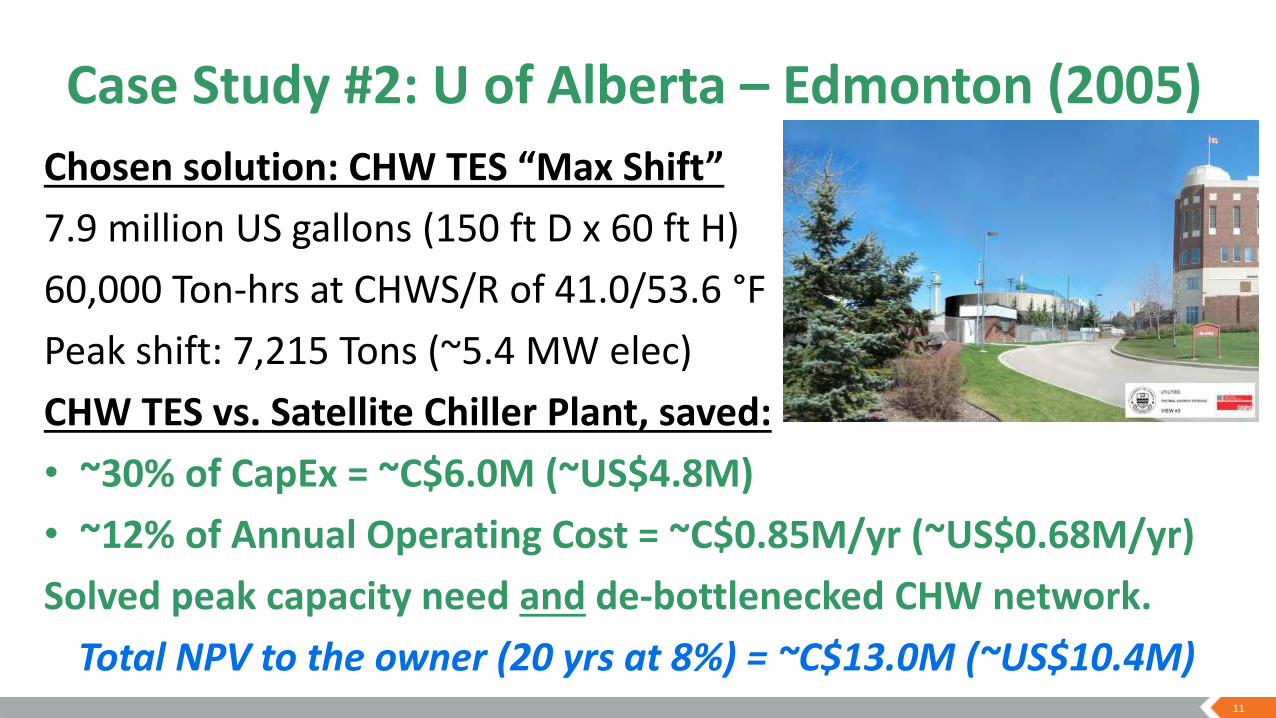
Case Study #2: U of Alberta – Edmonton (2005)
Chosen solution: CHW TES “Max Shift”
7.9 million US gallons (150 ft D x 60 ft H)
60,000 Ton-hrs at CHWS/R of 41.0/53.6 °F
Peak shift: 7,215 Tons (~5.4 MW elec)
CHW TES vs. Satellite Chiller Plant, saved:
• ~30% of CapEx = ~C$6.0M (~US$4.8M)
• ~12% of Annual Operating Cost = ~C$0.85M/yr (~US$0.68M/yr)
Solved peak capacity need and de-bottlenecked CHW network.
Total NPV to the owner (20 yrs at 8%) = ~C$13.0M (~US$10.4M)

12
U of Alberta – Start of TES Construction (2004)

13
U of Alberta – Completed TES Tank (2005)with partial screen-wall & landscapingfacing the adjacent university hospital
TES is near NE corner of campus, opposite Chiller Plant at SW corner.
Chillers charge TES at night, using excess plant & network capacity.
Both feed campus during peak load times, enhancing network capacity.

14
Why Not Battery Storage?Peak load management can use batteries, e.g. Lithium-Ion; however:
• Material Sourcing (exotic, costly materials; from unreliable locales)
• Safety (explosions & fires; + environmental issues extracting mat’l)
• Round-trip Energy Efficiency (typically only 80-85%)– Tesla Li-Ion in S. Australia, Dec 2017: 2.42 GWh out/3.06 GWh in = 79%
• Capital Cost (typical installed project costs of US$500-800/kWh)– AEP Li-Ion proposal in Texas: $2.3M / 3.0 MWh = US$767/kWh
• Life Expectancy (typically only 7-10 yrs, and with reducing capacity)
• Peaking CHW Capacity (batteries add none, while TES does)
But an application with both electric and thermal networks
can consider using Thermal Energy Storage (TES).
15
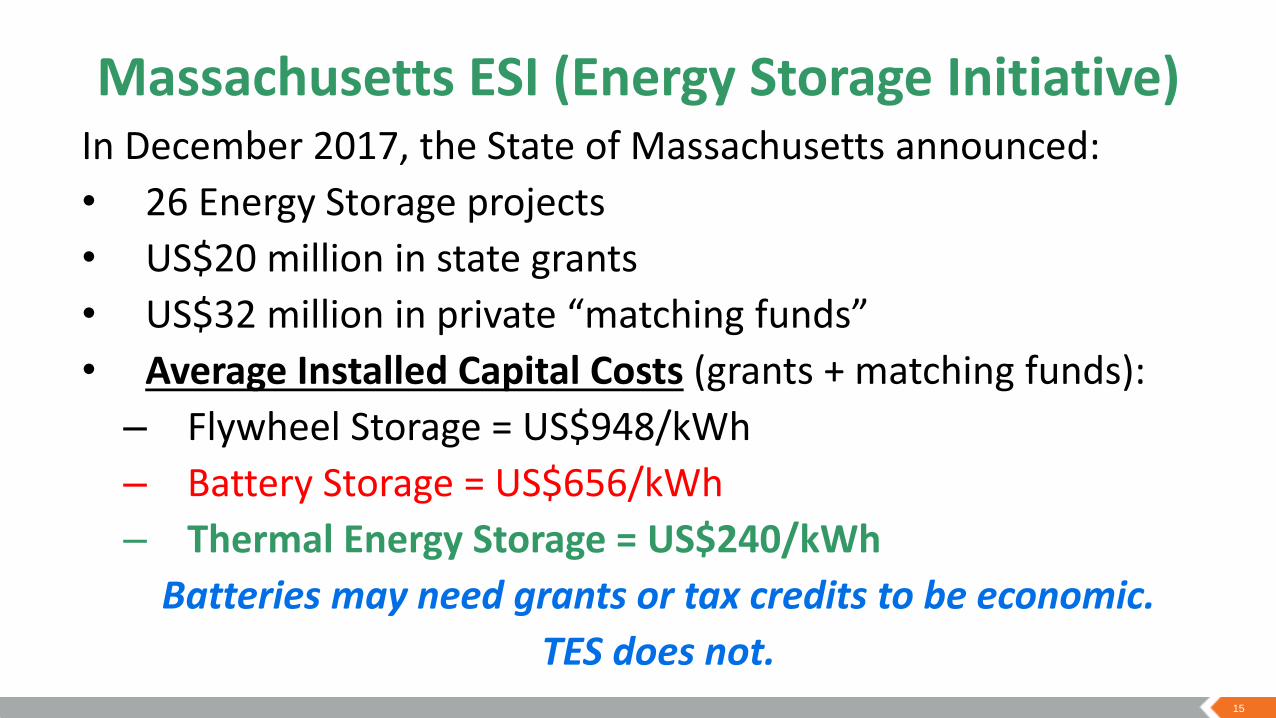
Massachusetts ESI (Energy Storage Initiative)In December 2017, the State of Massachusetts announced:
• 26 Energy Storage projects
• US$20 million in state grants
• US$32 million in private “matching funds”
• Average Installed Capital Costs (grants + matching funds):
– Flywheel Storage = US$948/kWh
– Battery Storage = US$656/kWh
– Thermal Energy Storage = US$240/kWh
Batteries may need grants or tax credits to be economic.
TES does not.
16
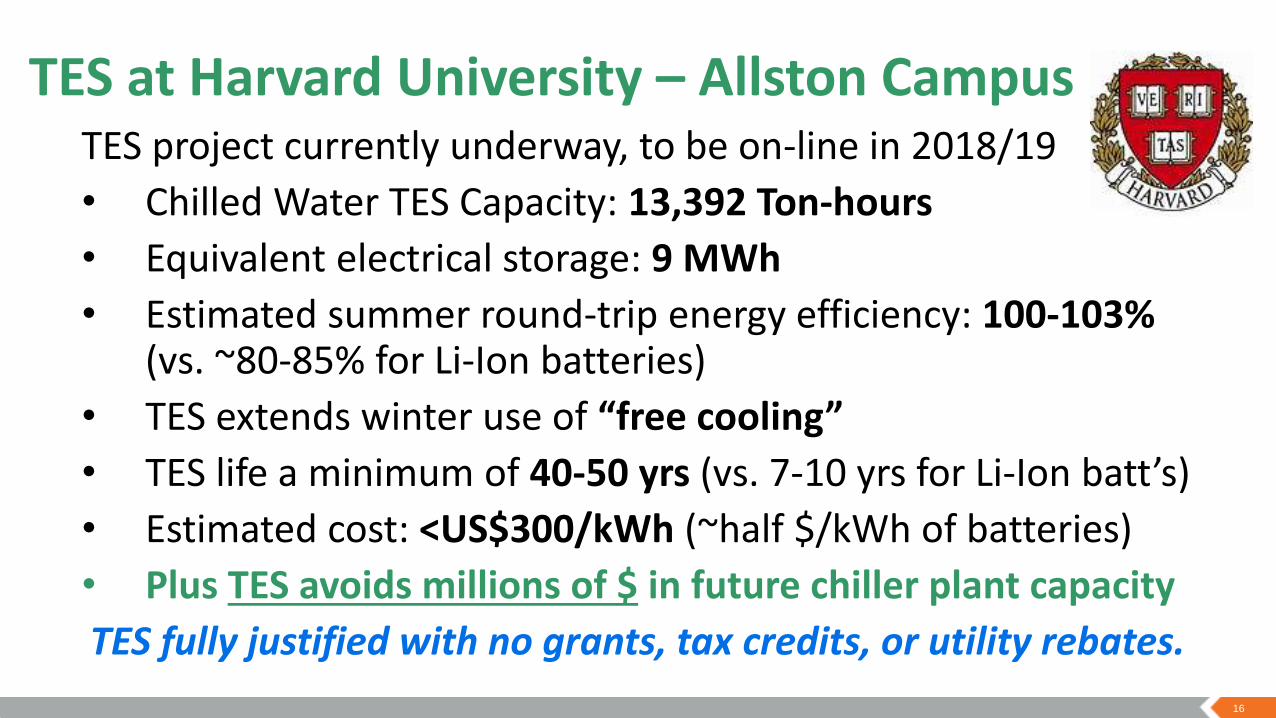
TES at Harvard University – Allston CampusTES project currently underway, to be on-line in 2018/19
• Chilled Water TES Capacity: 13,392 Ton-hours
• Equivalent electrical storage: 9 MWh
• Estimated summer round-trip energy efficiency: 100-103% (vs. ~80-85% for Li-Ion batteries)
• TES extends winter use of “free cooling”
• TES life a minimum of 40-50 yrs (vs. 7-10 yrs for Li-Ion batt’s)
• Estimated cost: <US$300/kWh (~half $/kWh of batteries)
• Plus TES avoids millions of $ in future chiller plant capacity
TES fully justified with no grants, tax credits, or utility rebates.

17
Additional Benefits of TES
• Mission Critical Facility back-up (e.g. Princeton U data center)
• Better CHP Economics from flat cooling & electric profiles (TECO)
• Turbine Inlet Cooling maximizes hot weather CT output (SEC)
• Fire Protectiondual-use (3M)
18
Thermal Energy Storage“Although battery technologies are continuing to evolve and improve,
their costs are high. . . . ASHRAE’s recently completed research project, RP-1607, found that thermal energy storage is currently the most cost-effective means to enable greater renewable energy generation deployment.”
– Douglas Reindl, Ph.D, P.E., Professor of Mechanical Engineering and Chair of Dept of Engineering Professional Development at Univ. of Wisconsin-Madison (ASHRAE Journal, February 2018, p.20)
“Chilled water and hot water stratified thermal storage is the world’s most viable storage technology.”
– George Berbari, founder and CEO of DC PRO Engineering, Sharjah, UAE (speaking at the District Cooling and Trigeneration Summit 2016, Riyadh, KSA)

19
Summary and Conclusions• Chilled Water (CHW) Thermal Energy Storage (TES), long known for
reducing operating savings and applications in hot weather locales, also can often achieve initial capital cost savings vs. conventional (non-TES) chiller plant capacity, and is often applied in seasonally cold climates.
• One case study illustrated how even a “pure retrofit” of CHW TES can achieve a rapid simple payback by reducing the Ontario “Global Adjustment” demand charge.
• A 2nd case study illustrated how CHW TES, added at a time of cooling load growth, saved operating and capital costs vs. a satellite CHW plant.
Each cold climate example achieved an NPV of >$10M for the owner.
And CHW TES provides far superior cost and performance
versus that of battery storage.

20
RecommendationsConsider (and where justified, adopt) CHW TES whenever:
1. TES can offset otherwise necessary investments in CHW capacity, e.g.
A. at times of new construction,
B. at times of retrofit expansions, or
C. at times of retirement / replacement of CHW plant capacity.
2. TES can reduce particularly high peak electric demand costs (e.g. the Ontario “Global Adjustment” charge).
Any of the first set of conditions can lead to an immediate CapEx saving,
while the second scenario can provide a rapid simple payback.
In all those cases,
a large CHW TES can produce a multi-million $ NPV.

Questions / Discussion ?Or for a copy of this presentation, contact:
John S. Andrepont
The Cool Solutions Company
tel: 1-630-353-9690