china: a disruptive influence in east asia - siepr · 1 working paper no. 196 china: a stabilizing...
TRANSCRIPT

1
Working Paper No. 196
China: A Stabilizing or Deflationary Influence
in East Asia? The Problem of Conflicted
Virtue by
Ronald McKinnon
Gunther Schnabl1
Edited January 2004
1E-mail:[email protected], [email protected] URL: http://www.stanford.edu/~mckinnon/, http://www.uni-tuebingen.de/uni/wwa/homegs.htm. Thanks to Winnie Choi, Marcio Garcia, Nick Hope, Lawrence Lau, Michael Kurtz, Hong Qiao, Mark Spiegel, and Geng Xiao.
Stanford University John A. and Cynthia Fry Gunn
Building 366 Galvez Street | Stanford, CA |
94305-6015

2
Abstract: Rapidly growing Chinese exports are middle-tech—and increasingly high-tech—manufactured goods. China runs a huge and growing bilateral trade surplus with the United States, and the position of Japan has changed radically from being a net exporter to China in the 1980s and most of the 1990s to being a net importer today. China’s smaller East Asian industrial competitors such as Taiwan, Korea, and Singapore face fairly difficult readjustment problems. However, China is a huge importer of primary products and industrial raw materials and runs large import surpluses with the ASEAN group. On the macroeconomic side, China has been a stabilizing influence. While maintaining sustained fast growth and exchange rate stability at 8.28 yuan per dollar since 1994, China has largely avoided, and thus dampened, the business cycles of its East Asian trading partners. But there are potential clouds on this horizon. Since 1995, China has run with moderate multilateral trade surpluses coupled with large inflows of foreign direct investment. The resulting balance-of-payments surpluses have led to a rapid buildup of liquid dollar claims on foreigners—both in official exchange reserves and, less obviously, in stocks held privately or in China’s nonstate sectors. This increasing private dollar overhang leads to what we call the syndrome of “conflicted virtue.” If there is no threat that the renminbi will appreciate, private portfolio equilibrium for accumulating and holding both dollar and renminbi assets can be sustained. However, foreigners, particularly Japanese, are upset with China’s “excessive” mercantile competitiveness. They are urging China’s government to appreciate the renminbi—and show greater future exchange rate flexibility, which could lead to repetitive appreciations. The result would be severe deflation throughout China’s economy and a zero-interest liquidity trap—as in Japan, when forced into repeated appreciations of the yen from the 1980s into the mid 1990s.
F15, F31, F33

3
1. Introduction ......................................................................................................................................... 4
2. China’s Trade and Transformation since 1980 ............................................................................... 5
3. China’s Stabilizing Macroeconomic Role in East Asia .................................................................. 8
3.1. The Exchange Rate Regime ...................................................................................................... 8
3.2. China’s Role as a Regional Stabilizer ....................................................................................... 9
3.3. The Post 1997 Keynesian Stimulus to China’s Domestic Demand ................................. 10
3.4. China’s Impact on Other Countries: Deflation or Structural Adjustment? .................... 13
4. Conflicted Virtue: The Deflationary Threat .................................................................................. 15
4.1. Parallels with the Japanese Experience ................................................................................. 16
4.2. Direct Investment and the Dollar Overhang ....................................................................... 18
5. Conclusion .......................................................................................................................................... 22

4
1. Introduction
These days, even the most casual retail shopper must be impressed by the incredible
proliferation of “made-in-China” labels on items from apparel to bicycles to toys, and to almost
any middle-level electronic or mechanical gadget. From 2000 into 2003, China was the only truly
booming part of the world economy. But this surge in exports provokes outcries in the older
industrial economies that Chinese goods are too cheap. Is China the engine of growth or an
economic threat in Asia?
In section 2, we sketch the broad dimensions of China’s trade-led industrial expansion since
1980. We then consider China’s monetary and exchange rate policies for accommodating this
remarkable growth. Of course, when a large country like China grows unusually rapidly,
industrial readjustment—sometimes quite painful—is inevitable in some neighboring countries.
But has Chinese growth made the East Asian macroeconomy less stable in a cyclical sense? In
section 3, we examine this issue empirically by looking at China’s exchange rate policy and its
own macroeconomic instability.
Since 1990, China’s economic growth has been nurtured by large inflows of foreign direct
investment (FDI), and since 1995 these have been coupled with trade surpluses—leading to
substantial balance-of-payments surpluses overall. Is this financial regime sustainable?
In section 4, we develop the idea of conflicted virtue that applies to international creditor
countries that cannot lend in their own currencies. We compare China’s to Japan’s earlier
experience with conflicted virtue. Japan has a much longer track record of running balance-of-
payments surpluses and building up liquid dollar claims on foreigners, both through its high
growth phase before 1990, and then in its subsequent deflationary slump and zero interest
liquidity trap of the late 1990s. Domestic monetary policy is then rendered ineffective for
reflating the economy; see McKinnon and Ohno (1997) and Goyal and McKinnon (2003) on the
foreign exchange origins of Japan’s liquidity trap.
China’s foreign exchange problem is uncomfortably similar to Japan’s, yet it differs in some
important respects, specifically in the huge inflow of foreign direct investment. In section 4.2, we
give alternative estimates of the build up of liquid foreign assets, both government and private, in
China—and then discuss whether this increasing “overhang,” mainly dollars, is sustainable.

5
2. China’s Trade and Transformation since 1980
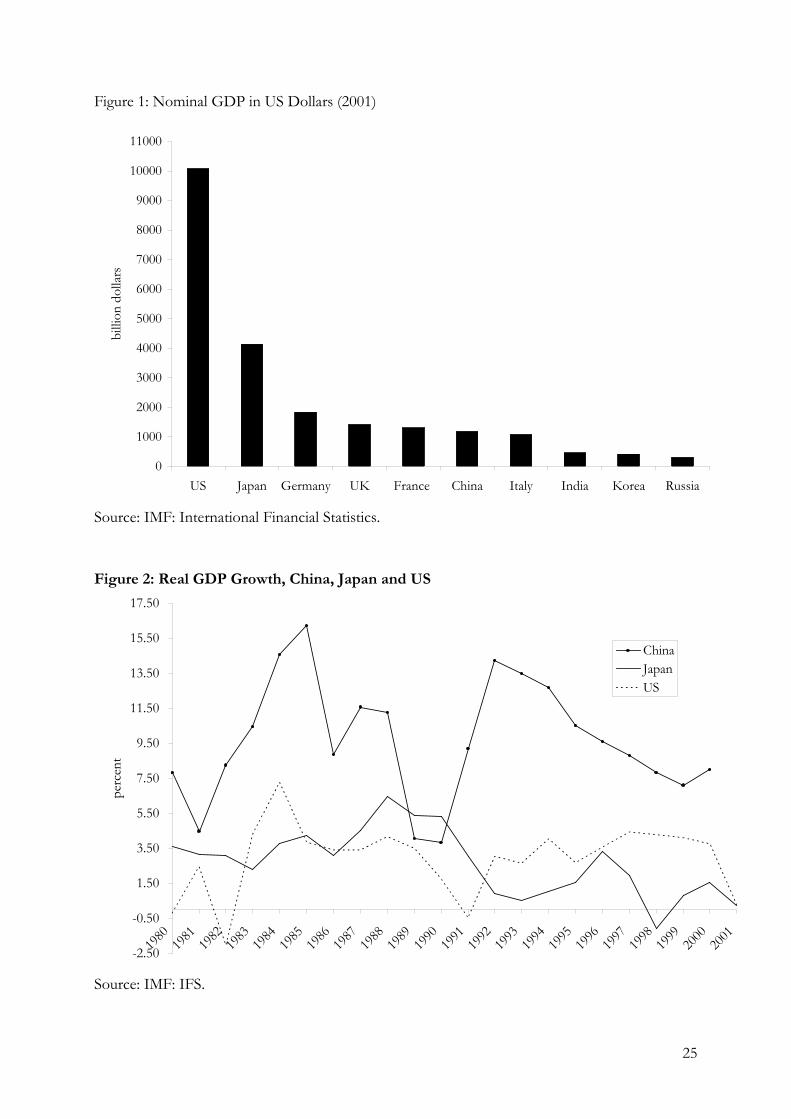
China’s economy is now huge. Although in terms of GDP per capita China still remains far
behind the industrialized countries, because of its large population China has become the world’s
sixth largest economy. Today its nominal GDP (in US dollars) is larger than Italy’s and is just
slightly smaller than the GDP of France (Figure 1). If GDPs were compared at exchange rates
reflecting purchasing power parities, i.e., after adjusting for price differences in the respective
economies, China would rank even higher.
Notwithstanding the already significant size of China’s economy, a record of sustained high
real growth rates portends an increasing impact on the world economy in general and that of East
Asia in particular. With an average real GDP growth rate of almost 10 percent per year since
1980, the wakening giant is catching up fast (Figure 2). For the last two decades, China has
outperformed the (average) 2.7 percent growth rate of its ailing neighbor Japan and of its more
robust neighbor the United States, which had only a 2.9 percent growth rate. Despite criticism
about the accuracy of official real GDP data, few doubt that China has become the world’s most
dynamic economy.
[Figure 1 and Figure 2 about here]
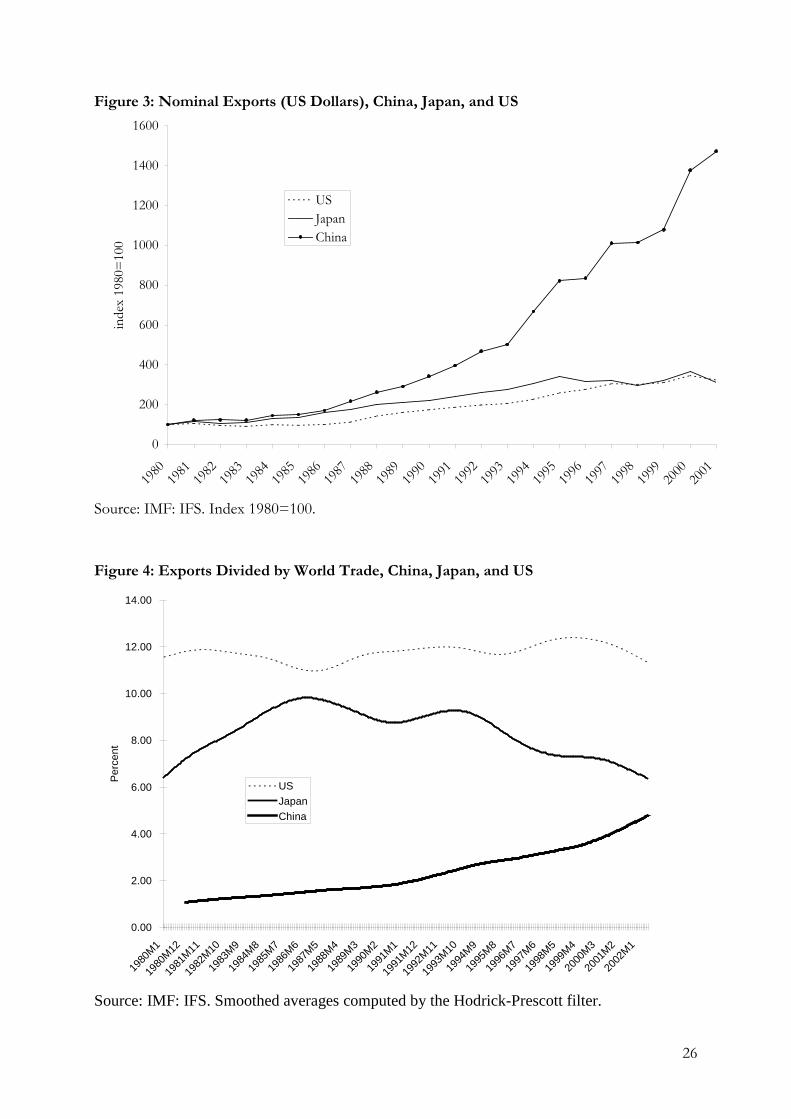
The country’s trade performance reflects its growth dynamics. Exports plus imports are now
equal to about 48 percent of China’s GDP (15 percent in 1982). Although production for the
large domestic market was the main driving force in the first decade of China’s transition to a
market economy, production for export—and consumption of imports—now adds great
momentum to the fast output expansion. As shown in Figure 3—which plots Chinese, Japanese
and US exports compared to the base year 1980—Chinese exports have expanded much faster
than those of Japan and the United States. This process has accelerated since the early 1990s and
today China has become the world’s sixth largest exporting nation—likely to surpass France, the
UK, and probably even Japan within few years (Figure 4).
[Figure 3 and Figure 4 about here]
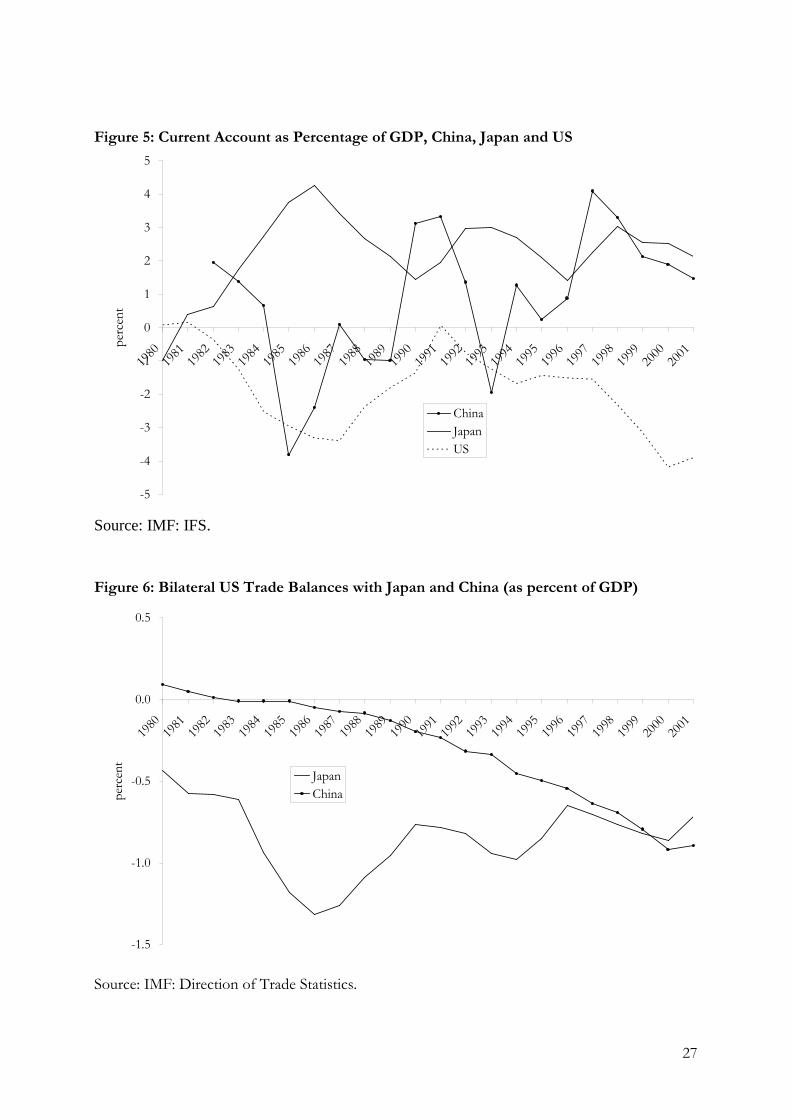
Before 1994, China showed no sustained tendency to run trade surpluses: the net current-
account balance was sometimes positive and sometimes negative (Figure 5). Since 1995, a more
persistent tendency toward current-account surplus, of the order of 1 or 2 percent of China’s
6
GDP, seems evident. But the net current-account numbers are erratic, and there is no strong
presumption that China will continue to run trade surpluses multilaterally.
[Figure 5 about here]
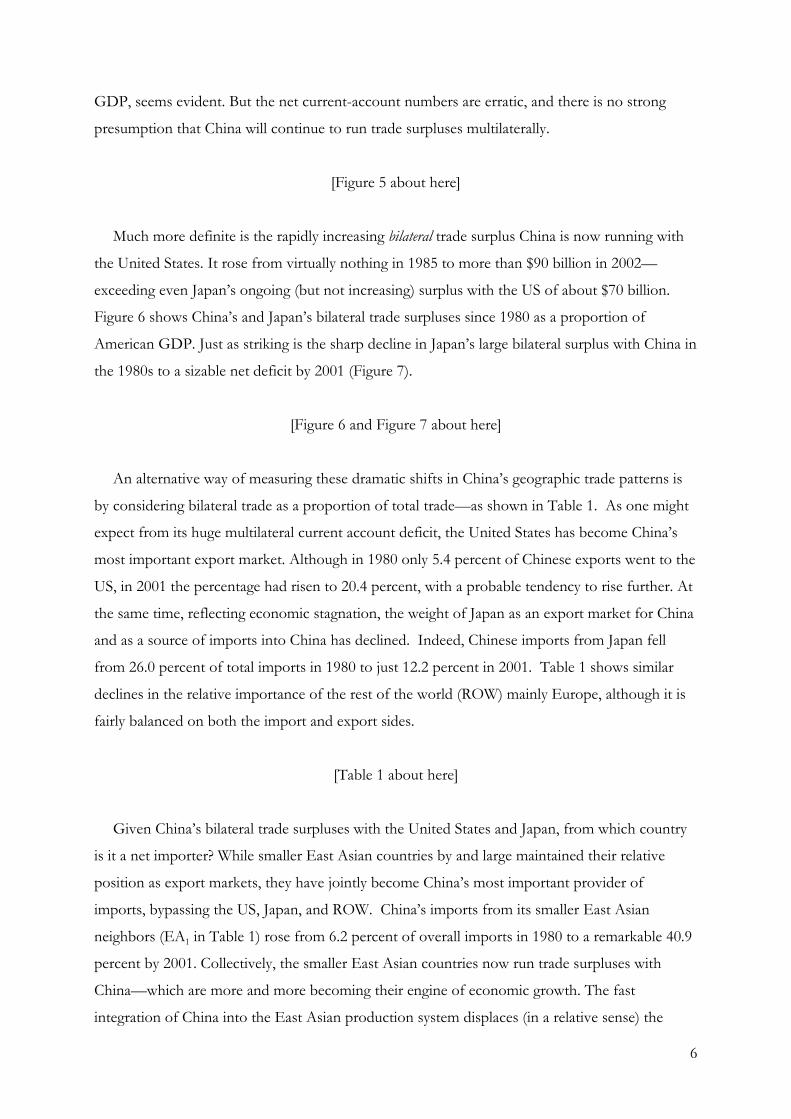
Much more definite is the rapidly increasing bilateral trade surplus China is now running with
the United States. It rose from virtually nothing in 1985 to more than $90 billion in 2002—
exceeding even Japan’s ongoing (but not increasing) surplus with the US of about $70 billion.
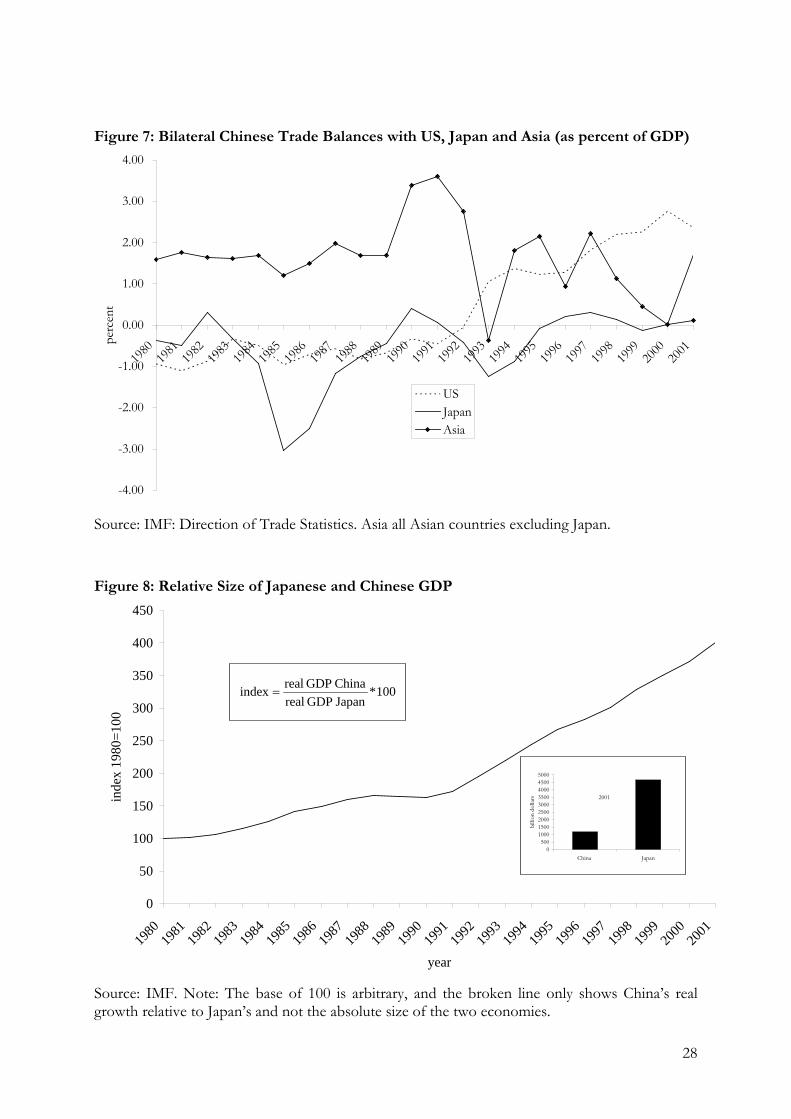
Figure 6 shows China’s and Japan’s bilateral trade surpluses since 1980 as a proportion of
American GDP. Just as striking is the sharp decline in Japan’s large bilateral surplus with China in
the 1980s to a sizable net deficit by 2001 (Figure 7).
[Figure 6 and Figure 7 about here]
An alternative way of measuring these dramatic shifts in China’s geographic trade patterns is
by considering bilateral trade as a proportion of total trade—as shown in Table 1. As one might
expect from its huge multilateral current account deficit, the United States has become China’s
most important export market. Although in 1980 only 5.4 percent of Chinese exports went to the
US, in 2001 the percentage had risen to 20.4 percent, with a probable tendency to rise further. At
the same time, reflecting economic stagnation, the weight of Japan as an export market for China
and as a source of imports into China has declined. Indeed, Chinese imports from Japan fell
from 26.0 percent of total imports in 1980 to just 12.2 percent in 2001. Table 1 shows similar
declines in the relative importance of the rest of the world (ROW) mainly Europe, although it is
fairly balanced on both the import and export sides.
[Table 1 about here]
Given China’s bilateral trade surpluses with the United States and Japan, from which country
is it a net importer? While smaller East Asian countries by and large maintained their relative
position as export markets, they have jointly become China’s most important provider of
imports, bypassing the US, Japan, and ROW. China’s imports from its smaller East Asian
neighbors (EA1 in Table 1) rose from 6.2 percent of overall imports in 1980 to a remarkable 40.9
percent by 2001. Collectively, the smaller East Asian countries now run trade surpluses with
China—which are more and more becoming their engine of economic growth. The fast
integration of China into the East Asian production system displaces (in a relative sense) the

7
dependence of the smaller economies on exporting directly to the more mature industrialized
countries, i.e., US, Japan, and ROW. More and more, China is dominating direct exports from
East Asia to the United States and Europe.
In summary, a new geographical pattern in China’s foreign trade has emerged. Exports are
driven by strong import demand from the United States and, to a lesser extent, from Japan.
China’s smaller neighbors are an increasingly important input source for the fast growing Chinese
economy. Although Japan and Europe are still important sources of foreign direct investment
into China, their share of East Asian trade in general—and of China’s in particular—is in decline.
The remarkable transformation in the commodity composition of China’s trade over the last
two decades is consistent with these geographical changes in the overall trade-balance statistics.
In the early 1980s, Chinese commodity trade showed the characteristics of a developing country.
Exports were largely agricultural products, raw materials and basic manufactures (Table 2).
Imports were predominantly sophisticated manufacturing products such as machinery and
transportation equipment (Table3).
Table 2 also shows that Chinese exports have shifted away from agricultural products and raw
materials to manufacturing. In 1985, the year for which data first became available, agricultural
products (14.9 percent) and raw materials (35.6 percent) accounted for about half of Chinese
exports. Basic manufactures (leather, wood, paper, textile yarn, iron and steel, nonferrous metals,
etc.) and chemicals were another 21 percent.
Today the composition of Chinese exports shows the characteristics of an industrialized
country. In the year 2001 the combined weight in exports of agricultural products (4.9 percent)
and raw materials (4.9 percent) has fallen to less than 10 percent. The percentage of basic
manufacturing products including chemicals has remained much the same, while the share of
machines, transport equipment, and miscellaneous manufacturing goods (clothing and
accessories, precision instruments, photo and optical equipment) has risen to almost 70 percent.
The commodity composition of imports also shows marked changes, but more or less in the
opposite direction. Table 3 shows the rising share of raw material imports from 8 to 18 percent
of total imports, and some decline in imports of basic manufactures, as China’s own middle-tech
industries have taken off. China looks more and more like an industrialized country and less like
an agricultural developing one. Although average per capita income in China remains much lower
than in the older industrial economies, the gap is narrowing. And China’s recent accession to the
WTO will likely reinforce these trends.
[Table 2 and Table 3 about here]
8
3. China’s Stabilizing Macroeconomic Role in East Asia
The impact of China’s middle-tech industrial growth on other East Asian manufacturing
countries has been considerable, often resulting in difficult adjustments for them. Higher-tech
countries such as Japan and Korea can resolve the problem, in part, by moving further upstream.
Others must seek less obvious ways to find their comparative advantages in exporting—where
the China market itself is becoming increasingly important. Mercantile complaints from the
industrial world—including Europe, Japan, and the United States—about “unfair” Chinese
competition are commonplace. However, China’s large size and rapid economic growth make
substantial industrial restructuring in other manufacturing economies inevitable, no matter what
the nature of the WTO’s trading rules or the exchange rate regime might be.
Nevertheless, in some important respects, China has been an important stabilizing influence
on the East Asian economy overall. Consider the cyclical stability of the smaller East Asian
economies—Hong Kong, Indonesia, Korea, Malaysia, Philippines, Singapore, Taiwan, and
Thailand. Let us denote these countries collectivity by EA1. At the macroeconomic level, let us
investigate China’s impact on the stability of these EA1 countries.
3.1. The Exchange Rate Regime
A key aspect of the East Asian macroeconomy is the propensity of countries in the region
(except for Japan) to informally peg their exchange rates to the US dollar in noncrisis periods
(McKinnon 2001). For the developing countries of East Asia, this “fear of floating” is rational
economically—as shown by Calvo and Reinhart (2002) and by McKinnon and Schnabl (2003a).
And since 1994, China has kept the renminbi stable at 8.28 yuan per dollar.
Of course, during the great crisis of 1997-98 when the currencies of the debtor economies—
Indonesia, Korea, Malaysia, Philippines, and Thailand—were attacked, they had to suspend their
dollar pegs—and deep overshooting depreciations of their currencies of 50 percent or more
followed. To try to preserve their international competitiveness, even the smaller net creditor
countries, Singapore and Taiwan, allowed their currencies to depreciate by 10 to 15 percent—
although they did not have to do so. And the Region’s major creditor country, Japan, saw the
yen depreciate by more than 30 percent from mid-1996 to mid-1998.
The cross-country spillover effects of such devaluations among closely connected trading
partners, who are also mercantile competitors in third markets, was enormous. Although largely
inadvertent, these beggar-thy-neighbor devaluations imposed severe deflationary pressure on the

9
dollar prices of goods and services traded in the region (McKinnon 2001). Fortunately, China
did not devalue despite a loss of mercantile competitiveness against its neighbors and despite
severe internal deflationary pressure (discussed in Section 3.3 below.) That China and Hong
Kong withstood the foreign exchange storm and maintained their exchange rates lessened the
exchange depreciations of the others—and quickened the pace at which the other currencies
(except for the Indonesian rupiah) could recover much, although not all, of their pre-1997 dollar
values. The steep regional downturn of 1997-98 was thereby ameliorated.
Equally important, China’s and Hong Kong’s steadfastness sets a precedent for a possible
return to a regime of more stable regional exchange rates. Malaysia pegged the ringgit at 3.8 to
the dollar in September 1998, and since then the other crisis economies have intervened
massively to smooth movements in their dollar exchange rates (McKinnon and Schnabl, 2003a).
However, the East Asian exchange rate system is hardly secure. The big problem is actual and
potential fluctuations in the yen/dollar exchange rate—the “loose cannon” in the regional
exchange rate system. Japan’s economy is still very large relative to China’s, although China’s is
growing much faster (Figure 8); and Japan is the most important source of foreign direct
investment (FDI) to other economies in the region. When the yen appreciates against the dollar
as in 1986 or 1995, Japanese FDI surges and the others’ exports become more competitive
against Japan’s. Similarly, their output growth slumps when the yen depreciates against the dollar
(as in 1997-98) because FDI from Japan dries up and their exports become less competitive.
Consequently, the wide fluctuations in the yen/dollar rate over the past 20 years or more have
generated a synchronized, mutually reinforcing business cycle in the smaller East Asian
economies (Kwan 2001, McKinnon and Schnabl 2003b). For more details on how to tether the
loose cannon, see McKinnon and Ohno (1997), and Goyal and McKinnon (2003).
[Figure 8 about here]
3.2. China’s Role as a Regional Stabilizer
Despite these fluctuations in the yen/dollar rate, China has assumed the role of a natural
stabilizer in the increasingly integrated East Asian region. Not only has China’s GDP growth
been the highest in the region for the last two decades, but also it has been more stable than in
any other East Asian country. Table 4 compares the coefficients of variation in the annual growth
rates in GDP of the East Asian economies from 1980 to 2001. China’s is the lowest, at 0.35, by a
substantial margin.
[Table 4 about here]
10
The other East Asian countries show much greater variability in their rates of output
growth—in large measure due to the strong impact of fluctuations in the yen/dollar rate. In
Table 4, the coefficient of variation for EA1, i.e., the aggregate growth in all the East Asian
countries except China and Japan, shows the effect of this collective business cycle. For EA1
alone, the coefficient is 0.49, but if China is added to EA1 to form EA2, the coefficient of
variation drops to 0.29. China’s growth rate is indeed more stable than that of the smaller East
Asian economies.
Conversely, if Japan is included in the collectivity of East Asian economies to form EA3, the
coefficient of variation in collective output growth rises to 0.38 in Table 4. By this measure, high
variability in Japanese GDP growth is a source of instability to the region.
What are the reasons for China’s greater macroeconomic stability? First, as is generally the
case for a large economy, the openness of the Chinese economy is comparatively small. While
international trade (exports + imports) as a percentage of GDP ranged from 78 percent (in
Indonesia) to 181 percent (in Singapore) for the smaller East Asian countries in 2000, China’s
trade was only 48 percent of GDP. Because of the comparatively large size of China’s domestic
sector, external shocks play a less prominent role in its business cycle.
Table 5 demonstrates this point econometrically. Annual output growth rates in China and in
EA1 are regressed on Japanese output growth and on the yen/dollar exchange rate concurrently,
and lagged one period. China has been relatively immune to output fluctuations in its neighboring
countries – as well as immune from fluctuations in the yen/dollar exchange rate. The regression
coefficients are insignificant in the Chinese case, but significant for EA1. Indeed, if the yen
depreciates against the dollar by 1 percent, Table 5 shows that growth in EA1 falls by 0.17
percent. That is, the long-run exchange rate multiplier (LRM in Table 5) is 17 percent for the
smaller East Asian economies. Because China managed to smooth its own domestic output
growth in the face of external exchange rate and other shocks, and because of its ongoing trade
with its more vulnerable smaller neighbors, their cyclical volatility was thereby dampened.
[Table 5 about here]
3.3. The Post-1997 Keynesian Stimulus to China’s Domestic Demand
However, China’s stable growth can’t be attributed only to the momentum of its large
domestic market. Particularly during the late 1990s, macroeconomic policy—i.e., a strong peg to
the dollar coupled with an effective counter-cyclical fiscal policy operating on domestic aggregate
demand—contributed significantly to economic stability in China itself and for the whole region.

11
Let us consider China’s behavior during the crisis of 1997-98 and its aftermath. China’s
exchange rate stabilization is not the whole story. Beginning in Thailand in June 1997 but
extending to Korea in December 1997 and Japan in early 1998, depreciations in all these
countries imposed strong deflationary pressure on China. Then, starting in March 1998, China
took bold “Keynesian” measures to slow its internal deflation. Its “New Deal” encompassed a
huge expansion of government expenditure on infrastructure and on mass residential housing.
Since 1998 public works have increased by 20 percent per year. In 2001 as well as in 2002, the
(announced) stimulus package amounted to $18 billion (RMB 150 billion yuan).
The Keynesian demand packages were financed by the sale of government bonds and by
heavy borrowing from China’s state-owned banking system in the form of so-called policy
loans—which are not counted as a part of the official deficit. Excluding such loans, official yearly
budget deficits rose from 0.7 percent of GDP in 1997 to 2.8 percent in 2000 and 2.5 percent in
2001—which greatly understates the true deficit if policy loans are considered to be government
borrowing. This high-level of fiscal spending seems to be sustainable into the near future. At the
meeting of the International Monetary Fund and the World Bank in Ottawa in November 2001,
China’s finance minister, Xiang Huaicheng, stated that the country would continue its proactive
domestic policy to spur the economy (Fidler 2001).
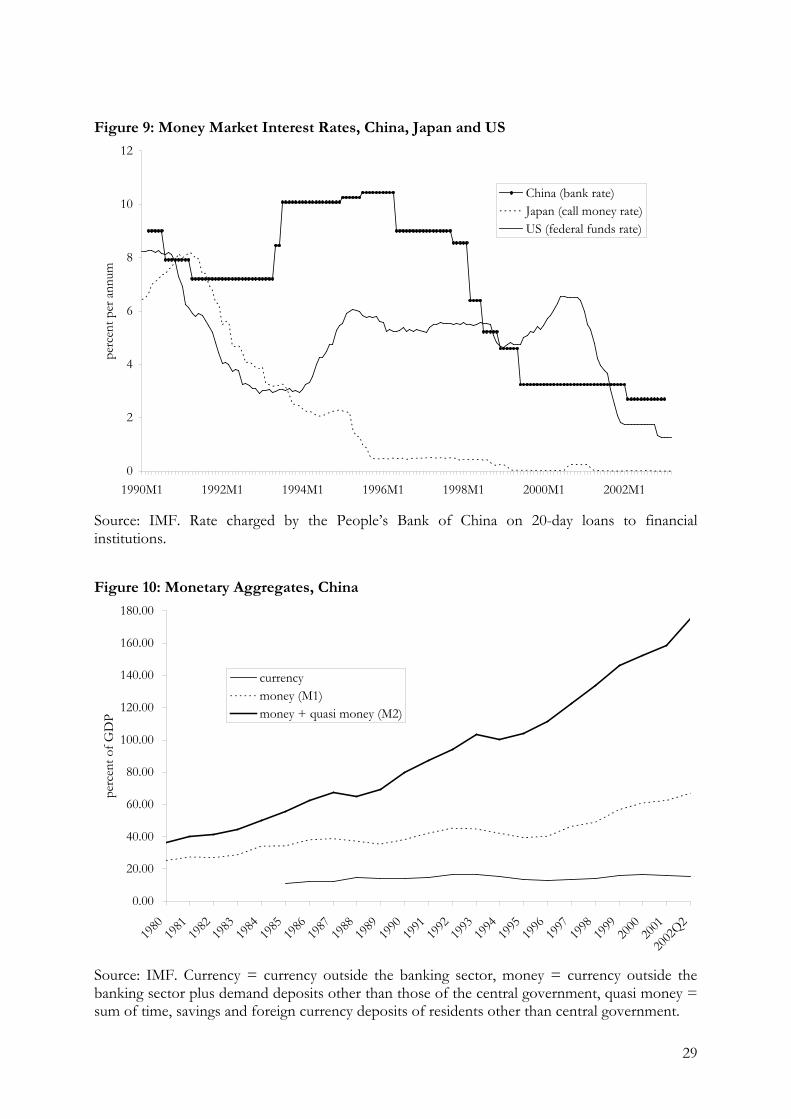
Further, the fiscal expansion was facilitated by a monetary expansion. Figure 9 shows the
decline in China’s interbank rate from 9 percent in 1996 to 2.7 percent by the end of 2002.
Although this 2.7 rate is somewhat higher than in the United States (1.25 percent) and Japan (0
percent), it is in the context of a rapid growth in China’s economy, slow growth in the United
States, and no growth in Japan. Indeed, in China’s case, fiscal and monetary policies can hardly be
distinguished. The People’s Bank of China also eased the austerity policy, which had been
adopted in 1993, by pressuring the state banks to extend credit for the construction industry,
exporters, home purchases, and infrastructure projects as well as to the struggling state-owned
enterprises. The standard lending rate fell from 10 percent in 1997 to 5.3 percent in early 2003.
[ Figure 9 about here]
China’s Keynesian economic policy can be evaluated from several perspectives. First, many
observers have pointed out that China’s murky banking sector is a considerable threat to
economic stability. The lending of the state-owned banks is driven not by mere profit
considerations, but also by political pressures. The central government often uses the banking
sector to support unprofitable state-owned enterprises. A large percentage of bank credits might

12
eventually default. These nonperforming loans, which are estimated to be anywhere from 6
percent to 40 percent of GDP, could drive up the future cost of recapitalizing the banking system
and thus should be considered government debt (McKinnon 1993).
Is this explicit and implicit public debt manageable? If all components of public debt (official
state debt and estimated non-performing loans of the banks) are taken into account, China’s
public debt ratio is approximately 70 percent of GDP. Therefore, the recent anti-cyclical
stabilization measures pose no substantial danger for the economy’s stability. In contrast,
Japanese public debt has risen to more than 140 percent of GDP, not including the cost of
recapitalizing defaulting Japanese banks.
Second, the debt to GNP ratio is not the only measure of sustainability. The overall size of the
financial system is equally important. In China, monetary instruments still dominate the domestic
financial system. Figure 10 shows the rapid buildup of M2, currency and bank deposits, from
1978 (just before China began liberalizing) through 2002. The current ratio of M2 to GNP
approaches 180 percent, which is enormous by international standards and particularly so for a
developing country. Thus, China’s financial system can cope with a rapid buildup of explicit and
implicit government borrowing without resorting to printing money in the Latin American mode.
Of course a rapid buildup of government debt cannot be sustained indefinitely. But China has a
lot of financial leeway to finance changes in government expenditures without provoking a
general loss of confidence in the public finances and a flight from the currency.
[Figure 10 about here]
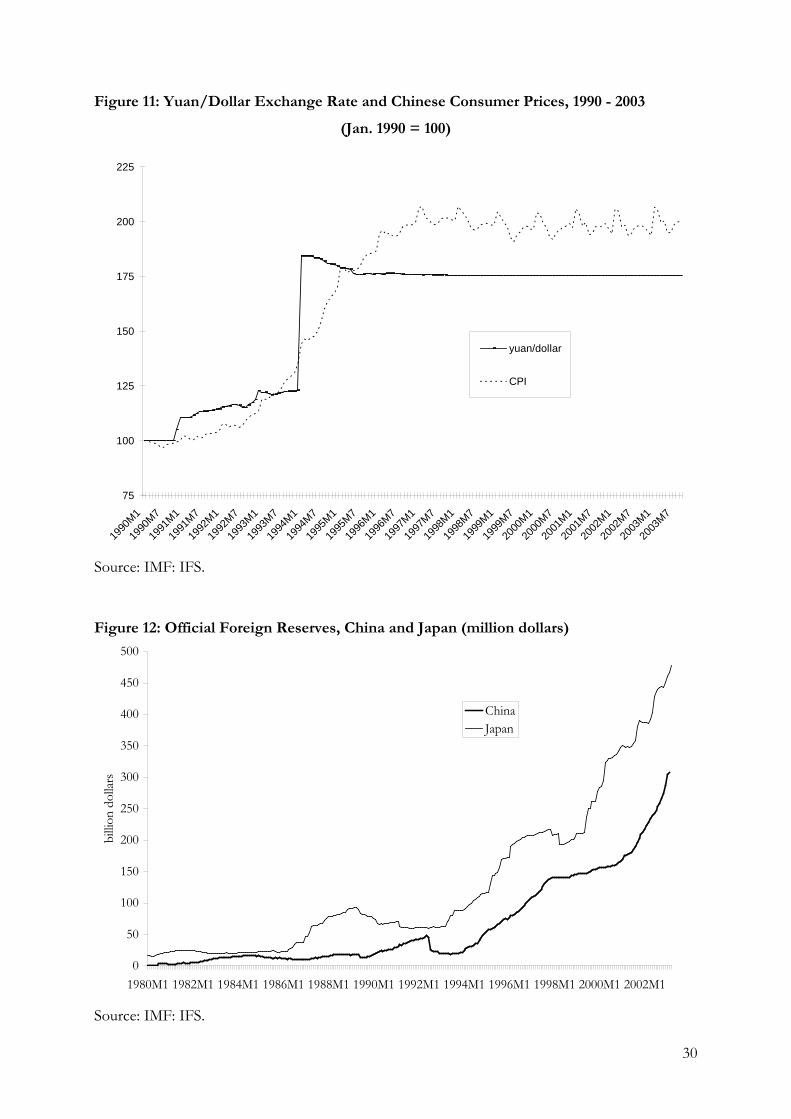
Beyond budgetary leeway, however, stationary expectations about the price level, domestic
interest rates, and the foreign exchange rate, are also necessary for maximum effectiveness of
countercyclical fiscal policy. This theoretical point was well established in the textbook Mundell-
Fleming model (1963) of how monetary and fiscal policies work themselves out in an open
economy. If China had failed to stabilize its exchange rate while undertaking fiscal expansion,
Mundell-Fleming predicts that the incremental capital inflows would have forced an appreciation
of the RMB, thus choking off the expansion. Since 1994, China’s exchange rate has been stable,
since 1996 its price level has been quite stable (Figure 11), and since 1996 its deposit rates of
interest converged to low levels—below 2 percent in early 2003—as if expectations of future
inflation and interest rates were also low.
[Figure 11 about here]
13
Thus, in response to Premier Zhu Rongji’s one trillion dollar multi-year program of new
public expenditure beginning in March 1998, confidence (stationary expectations) that there
would be no deflationary exchange rate appreciation, or a flight from yuan-denominated assets
necessitating a rise in domestic interest rates, was central to the remarkable success in expanding
domestic aggregate demand. The strong deflationary pressure from abroad arising out of the
Asian crisis was successfully offset. Not only did this help maintain China’s real economic
growth, but also it ameliorated the synchronized downturns in the other East Asian economies.
The policy of fixing the reminbi/dollar exchange rate at some “traditional” level, by now 8.28
yuan per dollar, was and is central to China’s emerging role as the balance wheel in the East Asian
system. During a major crisis, this policy limits competitive depreciations among the smaller East
Asian economies and facilitates their return to exchange stability in its aftermath. On the other
hand, stationary exchange rate expectations enable countercyclical fiscal policy within China itself
to be more effective—thus helping to further dampen the regional business cycle.
3.4. China’s Impact on Other Countries: Deflation or Structural Adjustment?
China’s rapid growth and increasingly large size is bound to cause problems of structural re-
adjustment in other countries. But in a world economy with significant deflationary pressure,
industrial competitors have, perhaps unsurprisingly, claimed that China is exporting deflation.
Japan has been at the forefront of such complaints. Consider what the Japanese Minister of
Finance Masajuro Shiokawa had to say early in 2003.
“Before the meeting of the financial ministers of the G7 to be held in Paris this year the Japanese financial minister announced by availing himself of all occasions that he would work out a so-called program combating the global disinflation. And he would ask the other countries to jointly adopt an agreement together with Japan in order to force China to inflate the exchange rate of the people’s currency just as did the western countries in 1985 to force Japan to inflate the yen by adopting the “Plaza Agreement”. When the meeting of the financial ministers of the ”Seven Countries Group” was going on, Masajuro Shiokawa the Japanese Finance Minister once again condemned and protested China’s people’s currency. […] “Too much importation of China’s cheap goods has not only caused the currency constraint in Japan,” he said, “but also the root-cause of the global economic depression.”
People’s Daily Internet Edition under the Title “Japan wants to have the Renminbi ‘Demonized’: Analysis” Internet Edition (03/12/2003)
As long as China’s economy provides a major and growing market for goods from all
over the world, as well as exporting to the rest of the world, China’s influence on the world

14
economy on net balance is not deflationary unless China’s expansion forces a monetary
contraction at home or abroad. Are either or both possible?
Consider first a situation where other countries could be forced into a monetary
contraction. If the world were now on a gold standard, as in the nineteenth century up to 1913,
there would be a problem. Under a gold standard, China's rapid growth and demand for base
money would necessarily require, and be satisfied by, a gold drain from other countries. With an
inelastic supply of gold in the world economy, China’s expansion certainly would impose
deflation on other countries—much like the rapid growth of the United States and Germany in
the late 19th century caused worldwide deflation from the 1870s to 1896.
However, for better or for worse, most of the world is on a dollar standard—with the
European countries being on a euro standard. In Asia, where exports, imports, and capital flows
are overwhelmingly dollar invoiced, the dollar standard predominates. Governments strive (not
always successfully) to keep their exchange rates stable against the dollar. And the meta central
bank for the system is the US Federal Reserve (the Fed). Fortunately, Fed Chairman Alan
Greenspan has ample means to keep feeding large amounts of base money into the world system
through open market operations in the United States. Thus the fact that China engages in a huge
buildup of dollar exchange reserves, with Japan showing an even bigger buildup (as shown in
Figure 12), need not reduce the supply of base money anywhere else.
[Figure 12 about here]
Worldwide deflationary pressure now mainly arises from the aftermath of the American
bubble economy (1995-2000) and deflationary pressure in the United States, the center country.
The nature of the world dollar standard makes it difficult for any country on the dollar’s
periphery to take independent action to re-inflate. Mired in a deflationary slump, Japan is the
extreme case with its zero-interest liquidity trap being tightened by the recent (2002-03) fall in
interest rates in the United States (Goyal and McKinnon, 2003). So let us hope that the Fed can
pull everybody every country out without falling into a liquidity trap itself!
But apart from what America might do, China itself could be caught in a full-scale
domestic deflation, which is monetary in the sense of being related to exchange rates much like
Japan’s own liquidity trap. To this potential problem of “conflicted virtue”, we now turn.

15
4. Conflicted Virtue: The Deflationary Threat
One of the peculiarities of the dollar’s role as key currency in East Asia is that creditor
countries such as Japan and now China have difficulty lending internationally in their own
currencies. When they run balance-of-payments surpluses resulting in the buildup of liquid claims
on foreigners, these claims are largely denominated in dollars rather than in yen or renminbi. Why
should this matter?
Currency risk, i.e., the risk that the dollar will fluctuate against the domestic currency,
cumulates as these dollar claims get larger. The natural currency habitat of domestic nationals is
their home currency—unless the country has an unusually flamboyant financial history of
debasing the national money, as in some Latin American and African countries. But China has
had a relatively stable financial history. Household consumption expenditures are in renminbi
yuan, wages are paid in yuan, and claims on financial intermediaries such as banks (deposits) and
insurance companies (annuities) are mainly in yuan. Unsurprisingly, households and business
firms seek to accumulate most of their liquid wealth mainly in yuan, the real purchasing power of
which over domestic goods and services has been quite stable.
Chinese firms and households will hold dollar assets only if there is a substantial business
convenience in doing so, or the interest rate on dollar assets is higher, or they see a political need
to hold dollar assets illegally offshore. The primary downside risk is for the yuan to appreciate
against the dollar, and thus reduce the yuan value of their dollar assets. Depending on how
sensitive domestic holders of dollar assets are to this risk, periodic runs from dollars into yuan
could occur just on rumors of appreciation.
Notice that foreigners whose domestic currency habitat is dollars, or tied to the dollar,
will be less sensitive. Only foreign professional speculators would go out of their way to
circumvent China’s remaining capital controls in order to short the dollar and go long in the
renminbi if they thought it might appreciate. In contrast, most Chinese holders of dollar assets,
both legally inside the system of capital controls and extra-legally outside them, are not
speculators. But if they thought yuan appreciation was in the offing, they could be quite defensive
about protecting their wealth positions. Thus, the potential speculative upward pressure on the
yuan comes, and would come, mainly from the domestic accumulation of foreign exchange.
However, for the world economy at large, the problem is more general. Any international
creditor country that cannot lend in its own currency cumulates a currency mismatch that we call

16
the syndrome of conflicted virtue.2 Countries that are “virtuous” by having a high saving rate (most
unlike the United States!) tend to run surpluses in the current account of their international
balance of payments, i.e., lend to foreigners. But, with the passage of time, two things happen.
(1) As the stock of dollar claims cumulates, domestic holders of dollar assets worry more
about a self-sustaining run into the domestic currency forcing an appreciation.
(2) Foreigners start complaining that the country’s ongoing flow of trade surpluses is
unfair, and results from an undervalued currency.
Of course (1) and (2) interact. The greater are foreign mercantilist pressures for
appreciation of the domestic currency, the greater is the concern of the domestic holders of
dollar assets. As runs out of dollars into the domestic currency begin, the government is
“conflicted” because appreciation could set in train serious deflation ending with a zero interest
liquidity trap—particularly if the domestic price level was already stable or falling slightly. But
foreigners may threaten trade sanctions if the creditor country in question does not allow its
currency to appreciate. Herein lies the syndrome of conflicted virtue3.
4.1. Parallels with the Japanese Experience
The earlier Japanese experience with conflicted virtue is instructive. Postwar Japanese
industrial growth—although more oriented toward such heavy industry as shipbuilding, steel,
automobiles, machine tools, semiconductors, and so forth, than is China’s current “middle tech”
expansion—was as remarkably rapid. In the 1960s and 1970s, industrialists and trade unionists in
Europe and the United States became irate with the “unfair” competition from Japan.
Compounding their adjustment problems, in the 1980s Japan began to run large trade surpluses
that have continued to the present day. Beginning in the 1970s but intensifying by the mid
1980s, there developed intense mercantile pressure on Japan from its trading partners—
particularly the United States—to appreciate the yen (McKinnon and Ohno, 1997). And the yen
rose all the way from 360 to the dollar in 1971 to peak at 80 to the dollar in April 1995.
2 After one of McKinnon’s seminars on Japan’s problems, Marcio Garcia of the Pontifico Catholic University in
Rio de Janeiro suggested that this creditor syndrome be called “constructed virtue”. We changed his terminology somewhat to “conflicted virtue”, which connotes more of a dilemma or impasse.
3 Notice that conflicted virtue would not arise in international creditor countries whose money is internationally accepted. Britain was the world’s dominant creditor country in the 19th century, but sterling was used to denominate most British claims on foreigners—sometimes with gold clauses. Similarly, for two and half decades after World War II, the US had large trade surpluses and was the world’s biggest creditor country—but its claims on foreigners were largely in dollars.

17
These massive appreciations failed to eliminate Japanese trade surpluses, which simply
reflected Japan’s high saving propensity compared to that of the United States. However, the
appreciating yen did impose great deflationary pressure on Japan. In open economies, the
ongoing current-account surplus is all about net saving propensities— which are not predictably
affected by exchange rate changes. But how the exchange rate moves eventually determines
domestic inflation or deflation.
Nevertheless, most foreign and many Japanese economists genuinely believed, and still
believe, that yen appreciation should have reduced Japan’s trade surpluses. To some extent, the
problem was, and is, doctrinal. Economists are largely in thrall to the old elasticities model of the
balance of trade where an appreciation is presumed to reduce a country’s exports relative to its
imports. However McKinnon and Ohno (1997, Chs 6 and 7) show that the simple elasticities
approach to the trade balance is generally invalid in financially open economies—a point which
was ignored by critics of Japan’s exchange rate policy and is ignored now by the critics of China’s
policy of keeping its exchange rate stable. This false theory, combined with more immediate
mercantile concerns, influenced official American policy to favor repeated yen appreciations.
Fortunately, in April 1995, the US Secretary of the Treasury, Robert Rubin, announced a
“strong dollar” policy, and the end of American “arm twisting” to appreciate the yen. Even so,
the yen continued to fluctuate against the dollar: 20 percent annual swings in the yen/dollar rate
were and are not unusual. Thus, Japanese insurance companies, trust funds, banks, and so on,
holding large stocks of dollar assets—which had cumulated to very high levels by the late
1990s—continued to see very high risk in doing so. Goyal and McKinnon (2003) show how a
negative risk premium in interest rates on yen assets is one important consequence.
Within Japanese financial institutions, how did (does) conflicted virtue lower interest rates
on yen assets relative to those on dollar assets? The liabilities of Japanese financial institutions are
mainly in yen, but they hold both yen and dollar assets. If the yen/dollar rate is free to fluctuate,
however, these yen-based institutions view the dollar assets as riskier. In order to maintain
portfolio balance between riskier dollar assets and safer yen assets, they must see a higher yield
on the former. But since the yield on dollar assets is given on world markets, the yield on yen
assets is forced lower, reflecting a negative risk premium in Japanese interest rates. Thus, when
American interest rates came down in the 1990s, Japanese interest rates fell toward zero.
The Bank of Japan (BoJ) responds endogenously to pressure coming through the foreign exchanges. By dramatically expanding the domestic monetary base from the mid 1990s to the present, the BoJ continually lowered interest rates on yen assets to limit the conversion of dollars into yen—and thus limit upward pressure on the yen in the foreign exchange markets. But dollar assets in private hands continued to accumulate because of Japan’s ongoing trade surpluses. The result was that by the end of 1996 Japanese short-term interest rates had fallen close to zero (

18
Figure 9). Within this zero interest liquidity trap, the BoJ can neither reflate the slumping
economy nor prevent further conversions of private Japanese dollar assets into yen. To prevent
the yen from appreciating, the BoJ then enters the foreign exchange market to buy the “surplus”
dollars. The result is the rapid increase in Japan’s official exchange reserves seen in Figure 12.
From 2001 to 2003, the foreign pressure on China to appreciate the renminbi is
uncomfortably reminiscent of the earlier pressure on Japan. Ironically, Japanese industrial and
political leaders are now leading advocates of renminbi appreciation! The attempt of the
Japanese Finance Minister, Masajuro Shiokawa, to “demonize” the renminbi (as quoted above)
reflected a prominent segment of Japanese official and popular opinion. However, the view that
China should appreciate its currency is also widespread in the Western financial press. Editorials
in The Financial Times (3 Feb 2003) and The Economist (15 Feb 2003) link China’s bourgeoning
balance-of-payments surpluses to its fixed exchange rate. The editorials suggest that the renminbi
should be appreciated discretely now; then, once China cleans up its banks, liberalizes its financial
markets, and gets rid of its remaining exchange controls on capital movements, the renminbi
should be floated—presumably with continual, albeit erratic, appreciation.
In resisting this external pressure, China has one big advantage over Japan. The renminbi
has been stable at 8.28 yuan to the dollar since 1994—including throughout 1997-98, thereby
limiting the great crisis. Thus China has not been manipulating its exchange rate—and indeed
has grown into this external monetary standard in the sense that its price level has stabilized at
that rate (Figure 11). In contrast, the yen/dollar exchange rate has fluctuated so much that the
Japanese government’s credibility in choosing any single rate at which to stabilize is more limited.
4.2. Direct Investment and the Dollar Overhang
However, in dealing with conflicted virtue, China also has a disadvantage compared to
Japan. Although its multilateral trade surpluses have been relatively smaller and more recent
(beginning in 1995), since 1990 China has received large inflows of foreign direct investment
(FDI); Figure 13 compares them. Since 1995, China’s annual current-account surplus has been
about $20 to $30 billion and seems to be falling slightly—and indeed may have (temporarily?)
approached zero in early 2003. In contrast, China’s annual FDI inflows have been of the order of
$40 billion and seem to be rising slightly—with no significant outflows of FDI.
By comparison with Japan’s much larger economy, Figure 14 shows that Japan’s annual
current account surpluses run at about $100 billion. However, gross FDI inflows into Japan have
been small, and FDI outflows —particularly to the rest of East Asia—have been very large.
Subtracting outflows from inflows, Figure 14 also shows that net inflows of FDI into Japan have

19
actually been negative— at about $25 billion per year. Insofar as Japanese net FDI abroad has
covered about one-quarter of its current account surplus, this part of the build up of claims on
foreigners is in a somewhat less liquid form—and thus is less of an “overhang.”
[Figures 13 and 14 about here]
In contrast to Japan, China’s build up of liquid, mainly dollar, claims on foreigners has
been much greater than its cumulative current account surpluses. The large inflows of FDI into
China cumulate into a large stock of liabilities to foreign corporations—but liabilities that are very
illiquid in the sense that they cannot be suddenly withdrawn. Because China has not run current
account deficits to match the inflow of FDI, its liquid dollar claims—some in official exchange
reserves, and some private—are growing proportionately faster than in Japan.
These foreign exchange flows can be characterized by a simple balance-of-payments
identity. Let CA be the current account surplus and let FDI be net foreign inflows of direct
investment. The country’s capital controls were not applied to FDI inflows in the form of joint
ventures with local enterprises, which became very popular. We assume that other forms of
foreign capital inflows into China and FDI outflows from China were restricted, and their
cumulated amounts are negligible. Let ∆OER be the change in official exchange reserves, largely
US Treasury bonds; and let ∆PFA be the change in private foreign assets—largely dollar claims
against banks. Then, in any one year
(1) ∆PFA = CA + FDI − ∆OER
Integrating backward to 1990 or earlier and assuming no asset valuation adjustments, we
then get China’s international balance sheet position.
CHINA: INTERNATIONAL BALANCE SHEET
Liquid Assets Liabilities and Net Worth Official Exchange Reserves (OER)
Private Foreign Assets (PFA)
Cumulated Foreign Direct Investment (FDI)
Cumulated Current Account Surpluses (CA)
Using data from the International Monetary Fund, Table 6 approximates each side of this
international balance sheet. We can then estimate China’s private and official net holdings of
liquid foreign assets both directly and indirectly.
20
[Table 6 about here]
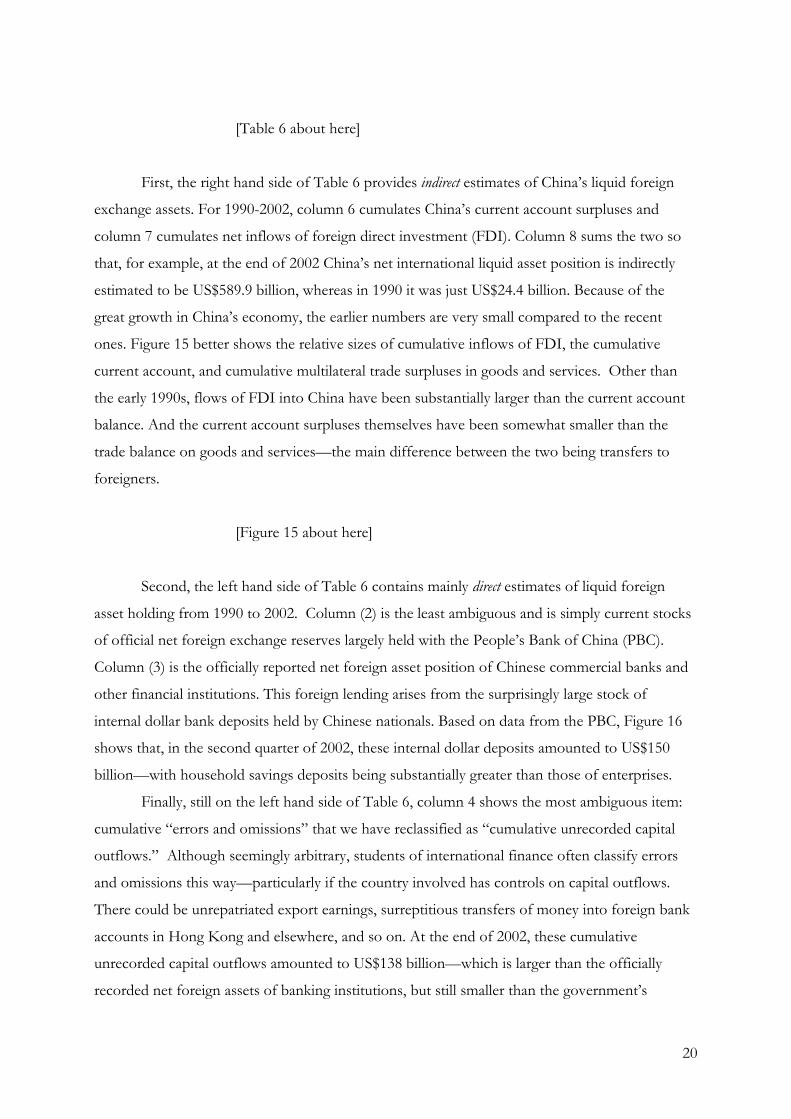
First, the right hand side of Table 6 provides indirect estimates of China’s liquid foreign
exchange assets. For 1990-2002, column 6 cumulates China’s current account surpluses and
column 7 cumulates net inflows of foreign direct investment (FDI). Column 8 sums the two so
that, for example, at the end of 2002 China’s net international liquid asset position is indirectly
estimated to be US$589.9 billion, whereas in 1990 it was just US$24.4 billion. Because of the
great growth in China’s economy, the earlier numbers are very small compared to the recent
ones. Figure 15 better shows the relative sizes of cumulative inflows of FDI, the cumulative
current account, and cumulative multilateral trade surpluses in goods and services. Other than
the early 1990s, flows of FDI into China have been substantially larger than the current account
balance. And the current account surpluses themselves have been somewhat smaller than the
trade balance on goods and services—the main difference between the two being transfers to
foreigners.
[Figure 15 about here]
Second, the left hand side of Table 6 contains mainly direct estimates of liquid foreign
asset holding from 1990 to 2002. Column (2) is the least ambiguous and is simply current stocks
of official net foreign exchange reserves largely held with the People’s Bank of China (PBC).
Column (3) is the officially reported net foreign asset position of Chinese commercial banks and
other financial institutions. This foreign lending arises from the surprisingly large stock of
internal dollar bank deposits held by Chinese nationals. Based on data from the PBC, Figure 16
shows that, in the second quarter of 2002, these internal dollar deposits amounted to US$150
billion—with household savings deposits being substantially greater than those of enterprises.
Finally, still on the left hand side of Table 6, column 4 shows the most ambiguous item:
cumulative “errors and omissions” that we have reclassified as “cumulative unrecorded capital
outflows.” Although seemingly arbitrary, students of international finance often classify errors
and omissions this way—particularly if the country involved has controls on capital outflows.
There could be unrepatriated export earnings, surreptitious transfers of money into foreign bank
accounts in Hong Kong and elsewhere, and so on. At the end of 2002, these cumulative
unrecorded capital outflows amounted to US$138 billion—which is larger than the officially
recorded net foreign assets of banking institutions, but still smaller than the government’s
21
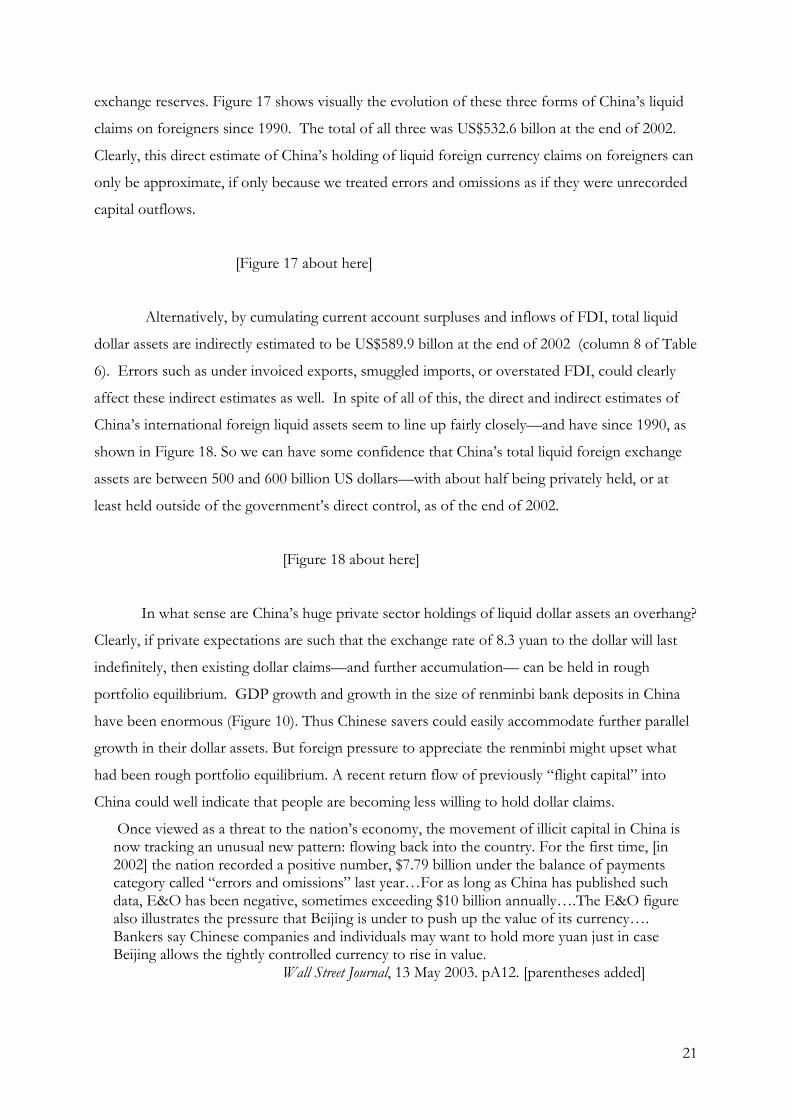
exchange reserves. Figure 17 shows visually the evolution of these three forms of China’s liquid
claims on foreigners since 1990. The total of all three was US$532.6 billon at the end of 2002.
Clearly, this direct estimate of China’s holding of liquid foreign currency claims on foreigners can
only be approximate, if only because we treated errors and omissions as if they were unrecorded
capital outflows.
[Figure 17 about here]
Alternatively, by cumulating current account surpluses and inflows of FDI, total liquid
dollar assets are indirectly estimated to be US$589.9 billon at the end of 2002 (column 8 of Table
6). Errors such as under invoiced exports, smuggled imports, or overstated FDI, could clearly
affect these indirect estimates as well. In spite of all of this, the direct and indirect estimates of
China’s international foreign liquid assets seem to line up fairly closely—and have since 1990, as
shown in Figure 18. So we can have some confidence that China’s total liquid foreign exchange
assets are between 500 and 600 billion US dollars—with about half being privately held, or at
least held outside of the government’s direct control, as of the end of 2002.
[Figure 18 about here]
In what sense are China’s huge private sector holdings of liquid dollar assets an overhang?
Clearly, if private expectations are such that the exchange rate of 8.3 yuan to the dollar will last
indefinitely, then existing dollar claims—and further accumulation— can be held in rough
portfolio equilibrium. GDP growth and growth in the size of renminbi bank deposits in China
have been enormous (Figure 10). Thus Chinese savers could easily accommodate further parallel
growth in their dollar assets. But foreign pressure to appreciate the renminbi might upset what
had been rough portfolio equilibrium. A recent return flow of previously “flight capital” into
China could well indicate that people are becoming less willing to hold dollar claims.
Once viewed as a threat to the nation’s economy, the movement of illicit capital in China is now tracking an unusual new pattern: flowing back into the country. For the first time, [in 2002] the nation recorded a positive number, $7.79 billion under the balance of payments category called “errors and omissions” last year…For as long as China has published such data, E&O has been negative, sometimes exceeding $10 billion annually….The E&O figure also illustrates the pressure that Beijing is under to push up the value of its currency…. Bankers say Chinese companies and individuals may want to hold more yuan just in case Beijing allows the tightly controlled currency to rise in value. Wall Street Journal, 13 May 2003. pA12. [parentheses added]

22
This return flow of previously flight capital is consistent with the evidence shown in
Table 6 and Figure 17: cumulative unrecorded capital outflows dropped from $145.9 billion at
the end of 2001 to $138.3 billion at the end of 2002. And the private sector seems to be
increasingly reluctant to maintain its share of dollar holdings. Since 2000, the percentage increases
in the official holding of exchange reserves have exceeded increases in private holdings. Thus
pressure to switch private dollar holdings into renminbi is occurring and could increase in the
future.
In order to prevent the renminbi from appreciating, the PBC must intervene in the
foreign exchange market to buy the excess dollars. Failure to sterilize these interventions relieves
the pressure: the domestic monetary base expands and drives down domestic interest rates
relative to those on dollar assets. As long as interest rates on renminbi assets remain well above
zero, such increases in the monetary base could be effective in expanding the domestic economy
while slowing the growth of official exchange reserves. Nevertheless, China’s build up of foreign
exchange reserves in 2003 has been so massive that the government has had to sterilize much of
it in order to prevent runaway increases in domestic bank credit.
Unfortunately, the appreciation threat for China is a repetitive one—similar to the earlier Japanese experience with repetitive yen appreciations. As in the Japanese case, China’s surplus saving, i.e., its trade surplus, is unlikely to fall as its currency appreciates. Instead, economic growth would slow and China’s price level would fall. Markets would anticipate that, once the traditional 8.28 yuan per dollar is undermined by an appreciation to say, 7 yuan per dollar, further appreciations—particularly if the renminbi were to be floated—become very likely. By the principle of open interest parity coupled with a negative risk premium, such anticipations would bid down interest rates on yuan assets toward zero. China could then find itself in a deflationary liquidity trap like Japan’s: monetary policy would then become helpless to reflate the economy or to slow the conversion of private dollar assets into renminbi. (But Figure 9 indicates that money market interest rates in China are still well above the near zero
interest rates prevalent in Japan.)
5. Conclusion
China has benefited enormously from the massive FDI inflows, largely in joint ventures
with domestic enterprises, that have accelerated its access to modern technology and made
possible a stunning export-led surge in the economy’s overall productivity. However, from a
more purely financial and monetary point of view, we have emphasized the downside. By not
running current account deficits of the same order of magnitude as the FDI inflows, China faces
the syndrome of conflicted virtue arising from the rapid build up of a liquid dollar overhang—
much of it in private or non-state hands.
What should China do? Consider three medium-term options. First, it should take policy
measures to reduce—and even reverse—its current-account surplus: let imports expand more
rapidly by reducing trade barriers faster than its WTO timetable requires, and eliminate special
incentives given to exporters. Second, reduce the financial magnitude of the FDI inflows by

23
letting joint ventures finance more of their operations within China—by borrowing from Chinese
banks, or by issuing more stocks and bonds domestically4. The absorption of foreign technology
would remain as high as ever even if net financial inflows were substantially reduced. Third,
while China has done a good job of expanding aggregate demand domestically, it should continue
to push vigorously in this direction even if some sterilization of the domestic monetary effects of
the huge build up of foreign exchange reserves remains necessary.
In the short term, however, China must face the problem of conflicted virtue and work to
defuse upward pressure on the renminbi in the foreign exchanges. Expectations are all-important
in determining whether or not a given exchange rate regime is sustainable. China has gone
through many anxious moments in keeping its exchange rate at 8.28 yuan per dollar. To the great
benefit of the East Asian region, China withstood market pressure—and a lot of bad foreign
advice—to depreciate the RMB during the 1997-98 crisis. Now, after 10 years of exchange rate
stability, the Chinese government should treat 8.28 yuan/dollar as its long-term "parity" rate that
will be unaltered by the ebb and flow of financial events into the indefinite future.
What about the possibility of making the exchange rate regime and the system of capital
controls more flexible? Indeed, what should be the meaning of “flexibility” in this context? As
financial constraints on international capital flows are loosened, it is natural to allow a soft band
of variation around this central rate—say from 8.2 to 8.4—in order to further devolve the
clearing of international payments from the PBC to the commercial banks. As long as the PBC
stands ready to intervene to drive any rate on the edge of the band back toward 8.28, and
everybody assumes it will do so, then actual intervention by the PBC should seldom be necessary.
In non-crisis periods, the commercial banks will act as stabilizing speculators (dealers) and take
open positions in foreign exchange to nudge the market rate toward the central rate—as long as
the central rate of 8.28 yuan per dollar itself is never in question.
4 We are grateful to Professor Lawrence Lau of Stanford University for this suggestion.

24
References Calvo, Guillermo / Reinhart, Carmen 2002: “Fear of Floating”. Quarterly Journal of Economics 117,
379-408. Fidler, Stephen 2001: Beijing Rules out Devaluation to Spur Exports. The Financial Times
11/19/01. Goyal, Rishi / McKinnon, Ronald 2003: Japan’s Negative Risk Premium in Interest Rates: The
Liquidity Trap and Fall in Bank Lending. The World Economy 26, 3, 339-363. Kwan, Chi-Hung 2001: Yen Bloc: Toward Economic Integration in Asia, Washington, D.C. McKinnon, Ronald 1993: Financial Growth and Macroeconomic Stability in China, 1978-1992:
Implications for Russia and Eastern Europe. In McKinnon, Ronald: The Order of Economic Liberalization, Baltimore and London, 187-216.
McKinnon, Ronald 2000: The East Asian Dollar Standard, Life after Death? Economic Notes by
Banca Monte dei Paschi di Siena 29, 31-82. McKinnon, Ronald 2001: After the Crisis, the East Asian Dollar Standard Resurrected. In:
Stiglitz, Joseph / Shahid, Yusuf (eds.): Rethinking the East Asian Miracle. New York, 197-244. McKinnon, Ronald / Ohno, Kenichi 1997: Dollar and Yen. Resolving Economic Conflict between the
United States and Japan, Cambridge (Massachusetts). McKinnon, Ronald / Schnabl, Gunther 2003a: The East Asian Dollar Standard, Fear of Floating,
and Original Sin. Stanford University Working Paper 03-001. McKinnon, Ronald / Schnabl, Gunther 2003b: Synchronized Business Cycles in East Asia and
Fluctuations in the Yen/Dollar Exchange Rate. The World Economy 26 (8). Pp. 1067-88. Mundell, Robert 1963: “Capital Mobility and Stabilization Policy Under Fixed and Flexible Exchange Rates” Canadian Journal of Economics and Political Science, 29, 475-485. People’s Daily 2003: Japan wants to Have Renminbi ‘Demonized’: Analysis (March 12 Internet
Edition). The Economist, 2003, February 15. The Financial Times , 2003, February 3. Wall Street Journal, 2003, “Illicit Inflows Help Chinese Payments Balance”, May 13, p12A
25
Figure 1: Nominal GDP in US Dollars (2001)
Source: IMF: International Financial Statistics.
Figure 2: Real GDP Growth, China, Japan and US
-2.50
-0.50
1.50
3.50
5.50
7.50
9.50
11.50
13.50
15.50
17.50
1980
1981
1982
1983
1984
1985
1986
1987
1988
1989
1990
1991
1992
1993
1994
1995
1996
1997
1998
1999
2000
2001
perc
ent
ChinaJapanUS
Source: IMF: IFS.
0
1000
2000
3000
4000
5000
6000
7000
8000
9000
10000
11000
US Japan Germany UK France China Italy India Korea Russia
billi
on d
olla
rs
26
Figure 3: Nominal Exports (US Dollars), China, Japan, and US
0
200
400
600
800
1000
1200
1400
1600
1980
1981
1982
1983
1984
1985
1986
1987
1988
1989
1990
1991
1992
1993
1994
1995
1996
1997
1998
1999
2000
2001
inde
x 19
80=
100
USJapanChina
Source: IMF: IFS. Index 1980=100.
Figure 4: Exports Divided by World Trade, China, Japan, and US
0.00
2.00
4.00
6.00
8.00
10.00
12.00
14.00
1980
M1
1980
M12
1981
M11
1982
M10
1983
M9
1984
M8
1985
M7
1986
M6
1987
M5
1988
M4
1989
M3
1990
M2
1991
M1
1991
M12
1992
M11
1993
M10
1994
M9
1995
M8
1996
M7
1997
M6
1998
M5
1999
M4
2000
M3
2001
M2
2002
M1
Perc
ent
USJapanChina
Source: IMF: IFS. Smoothed averages computed by the Hodrick-Prescott filter.
27
Figure 5: Current Account as Percentage of GDP, China, Japan and US
-5
-4
-3
-2
-1
0
1
2
3
4
5
1980
1981
1982
1983
1984
1985
1986
1987
1988
1989
1990
1991
1992
1993
1994
1995
1996
1997
1998
1999
2000
2001
perc
ent
ChinaJapanUS
Source: IMF: IFS.
Figure 6: Bilateral US Trade Balances with Japan and China (as percent of GDP)
-1.5
-1.0
-0.5
0.0
0.5
1980
1981
1982
1983
1984
1985
1986
1987
1988
1989
1990
1991
1992
1993
1994
1995
1996
1997
1998
1999
2000
2001
perc
ent
JapanChina
Source: IMF: Direction of Trade Statistics.
28
Figure 7: Bilateral Chinese Trade Balances with US, Japan and Asia (as percent of GDP)
-4.00
-3.00
-2.00
-1.00
0.00
1.00
2.00
3.00
4.00
1980
1981
1982
1983
1984
1985
1986
1987
1988
1989
1990
1991
1992
1993
1994
1995
1996
1997
1998
1999
2000
2001
perc
ent
USJapanAsia
Source: IMF: Direction of Trade Statistics. Asia all Asian countries excluding Japan.
Figure 8: Relative Size of Japanese and Chinese GDP
0
50
100
150
200
250
300
350
400
450
1980
1981
1982
1983
1984
1985
1986
1987
1988
1989
1990
1991
1992
1993
1994
1995
1996
1997
1998
1999
2000
2001
year
inde
x 19
80=1
00
100*Japan GDP realChina GDP realindex =
0500
100015002000250030003500400045005000
China Japan
billi
on d
olla
rs 2001
Source: IMF. Note: The base of 100 is arbitrary, and the broken line only shows China’s real growth relative to Japan’s and not the absolute size of the two economies.
29
Figure 9: Money Market Interest Rates, China, Japan and US
0
2
4
6
8
10
12
1990M1 1992M1 1994M1 1996M1 1998M1 2000M1 2002M1
perc
ent p
er a
nnum
China (bank rate)Japan (call money rate)US (federal funds rate)
Source: IMF. Rate charged by the People’s Bank of China on 20-day loans to financial institutions.
Figure 10: Monetary Aggregates, China
0.00
20.00
40.00
60.00
80.00
100.00
120.00
140.00
160.00
180.00
1980
1981
1982
1983
1984
1985
1986
1987
1988
1989
1990
1991
1992
1993
1994
1995
1996
1997
1998
1999
2000
2001
2002
Q2
perc
ent o
f GD
P
currencymoney (M1)money + quasi money (M2)
Source: IMF. Currency = currency outside the banking sector, money = currency outside the banking sector plus demand deposits other than those of the central government, quasi money = sum of time, savings and foreign currency deposits of residents other than central government.
30
Figure 11: Yuan/Dollar Exchange Rate and Chinese Consumer Prices, 1990 - 2003
(Jan. 1990 = 100)
75
100
125
150
175
200
225
1990
M1
1990
M7
1991
M1
1991
M7
1992
M1
1992
M7
1993
M1
1993
M7
1994
M1
1994
M7
1995
M1
1995
M7
1996
M1
1996
M7
1997
M1
1997
M7
1998
M1
1998
M7
1999
M1
1999
M7
2000
M1
2000
M7
2001
M1
2001
M7
2002
M1
2002
M7
2003
M1
2003
M7
yuan/dollar
CPI
Source: IMF: IFS.
Figure 12: Official Foreign Reserves, China and Japan (million dollars)
0
50
100
150
200
250
300
350
400
450
500
1980M1 1982M1 1984M1 1986M1 1988M1 1990M1 1992M1 1994M1 1996M1 1998M1 2000M1 2002M1
billi
on d
ollar
s
ChinaJapan
Source: IMF: IFS.

31
Figure 13: China: Current Account and Net FDI inflows
-20
-10
0
10
20
30
40
50
1980
1981
1982
1983
1984
1985
1986
1987
1988
1989
1990
1991
1992
1993
1994
1995
1996
1997
1998
1999
2000
2001
2002
billi
on d
ollar
s
current accountnet FDI inflow
Source: IMF: IFS: Net FDI Inflows=Gross FDI Inflows-Gross FDI Outflows
Figure 14: Japan: Current Account and Net FDI inflows
-60
-40
-20
0
20
40
60
80
100
120
140
160
1980
1981
1982
1983
1984
1985
1986
1987
1988
1989
1990
1991
1992
1993
1994
1995
1996
1997
1998
1999
2000
2001
2002
billi
on d
olla
rs
current accountnet FDI inflow
Source: IMF: IFS. Net FDI Inflows=Gross FDI Inflows-Gross FDI Outflows

32
Figure 15 China's Cumulative Surpluses on Current Account,
Trade and Net Foreign Direct Investment, 1990 - 2002
0
50
100
150
200
250
300
350
400
1990 1991 1992 1993 1994 1995 1996 1997 1998 1999 2000 2001 2002
billio
n U
S do
llars
Cumulative CurrentAccount Surpluses
Cumulative TradeSurpluses (Goods andServices)
Cumulative Net InwardForeign DirectInvestment (FDI)
Source: IFS, International Monetary Fund
Figure 16 Foreign Exchange Deposits in Chinese Banking Institutions, 2002-2003
0
20
40
60
80
100
120
140
160
2002 Q1 2002 Q2 2002 Q3 2002 Q4 2003 Q1 2003 Q2
billi
on U
S do
llars
Total DepositsDeposits by EnterprisesHousehold saving deposits
Source: People’s Bank of China

33
Figure 17 China's Liquid Foreign Assets, Capital Account Estimates: 1990 - 2002
-50.0
50.0
150.0
250.0
350.0
450.0
550.0
1990 1991 1992 1993 1994 1995 1996 1997 1998 1999 2000 2001 2002
billio
n U
S d
olla
rs
Official Reserves(1)
Net Foreign Assetsof BankingInstitutions (2)
CumulativeUnrecorded CapitalOutflows (errorsand omissions) (3)
Total Private andOfficial LiquidForeign Assets (1) +(2) +(3)
Source: IFS, International Monetary Fund
Figure 18 Alternative Estimates of China's International Liquid Asset Position, 1990 -
2002
0.0
100.0
200.0
300.0
400.0
500.0
600.0
1990 1991 1992 1993 1994 1995 1996 1997 1998 1999 2000 2001 2002
billi
on U
S do
llars
Total Liquid Foreign Assets(Official Reserves + NetForeign Assets of BankingInstitutions + CumulativeUnrecorded CapitalOutflows)
Cumulative Current AccountSurplus Plus Net InwardForeign Direct Investment(FDI)
Source: IFS, International Monetary Fund

34
Table 1: Chinese Trade with Japan, US, EA1 and ROW as Percent of Overall Trade
Chinese Exports to Chinese Imports from US Japan EA1 ROW US Japan EA1 ROW 1980 1985 1990 1995 2001
5.4 8.6 8.2 16.6 20.4
22.2 22.3 14.3 19.1 16.9
30.7 36.4 48.4 36.8 30.1
41.7 32.8 29.1 27.5 32.7
19.2 12.2 12.1 12.2 13.1
26.0 35.7 14.1 22.0 12.2
6.2 13.9 32.7 32.6 40.9
48.7 38.3 41.1 33.3 33.9
Source: IMF: Direction of Trade Statistics. EA1 = Hong Kong, Indonesia, Korea, Malaysia, Philippines, Singapore, Taiwan, Thailand. ROW=Rest of the World.

35
Table 2: Chinese Exports by Commodity
AP CM CH BM MT MM SITC 0,1,4 2, 3 5 6 7 8
1980
1985 14.92% 35.61% 5.00% 16.49% 2.81% 12.81%
1990 11.40% 14.13% 6.04% 20.61% 17.45% 28.23%
1995 7.90% 6.51% 6.01% 22.11% 21.06% 36.11%
2000 4.92% 4.93% 4.78% 17.38% 33.08% 34.34%
Source: United Nations: Yearbook of International Trade Statistics Trade by Commodity. AP = agricultural products, CM = crude materials including fuels, CH = chemicals, BM = basic manufactures (leather manufactures, wood manufactures, paper manufactures, textile yarn, iron and steal, non-ferrous metals etc.), MT = machines and transport equipment (power generating equipment, machines for special industries, metal working machinery, general industrial machinery, office machines, telecommunication and sound equipment, electric machinery, road vehicles, other transport equipment), MM = miscellaneous manufactured goods (clothing and accessories, precision instruments, photo and optical equipment). Numbers don’t sum to 100%, as goods not classified (SITC 9) are unreported.
Table 3: Chinese Imports by Commodity
AP CM CH BM MT MM SITC 0,1,4 2, 3 5 6 7 8
1980
1985 4.41% 7.99% 10.45% 27.95% 38.95% 4.52%
1990 8.62% 10.08% 12.50% 21.71% 40.33% 6.22%
1995 6.90% 11.39% 12.76% 22.06% 39.70% 5.98%
2000 2.53% 17.97% 13.23% 18.88% 40.81% 5.64%
Source: United Nations: Yearbook of International Trade Statistics Trade by Commodity. AP = agricultural products, CM = crude materials including Fuels, CH = chemicals, BM = basic manufactures (leather manufactures, wood manufactures, paper manufactures, textile yarn, iron and steal, non-ferrous metals etc.), MT = machines and transport equipment (power generating equipment, machines for special industries, metal working machinery, general industrial machinery, office machines, telecommunication and sound equipment, electric machinery, road vehicles, other transport equipment), MM = miscellaneous manufactured goods (clothing and accessories, precision instruments, photo and optical equipment). Numbers don’t sum to 100%, as goods not classified (SITC 9) are unreported.

36
Table 4: Annual Variation in Output Growth in East Asia, 1980 – 2001 mean standard deviation variation coefficient
China 9.55 3.35 0.35
Hong Kong 5.51 4.25 0.77
Indonesia 4.96 4.60 0.93
Korea 6.82 4.30 0.63
Malaysia 6.36 4.39 0.69
Philippines 2.52 3.73 1.48
Singapore 7.18 4.05 0.56
Taiwan 6.62 3.00 0.42
Thailand 5.99 4.97 0.83
Japan 2.67 1.89 0.71
EA1 6.06 2.96 0.49
EA2 7.46 2.13 0.29
EA3 4.19 1.58 0.38 Data source: IMF, Central Bank of China.
Notes: EA1 = Hong Kong, Indonesia, Korea, Malaysia, Philippines, Singapore, Taiwan, Thailand. EA2 = EA1 + China. EA3 = EA2 + Japan
Table 5: Output and Exchange Rate Effects: China versus East Asia (EA1), 1980 – 2001
Japan EA1 yen/dollar yen/dollart-1 LRM R2adj. (R2)
China -0.14 (-0.28)
-0.23 (-0.61)
-0.10 (-1.17)
-0.11 (-1.36)
-0.21 (-1.07)
-0.00 (0.19)
EA1 0.80*** (3.01)
-0.12** (-2.95)
-0.05 (-1.92)
-0.17* (-1.92)
0.50 (0.59)
Data source: IMF, Central Bank of China. Yearly data. EA1 = Hong Kong, Indonesia, Korea, Malaysia, Philippines, Singapore, Taiwan, Thailand. LRM = long-run multiplier; t-statistics in parentheses; * significant at the ten percent level; ** significant at the five percent level; *** significant at the one percent level.

37
Table 6 China’s Cumulative Current Account Surpluses and Net Inward Foreign Direct Investment (FDI)
in Comparison to Estimated Holdings of Liquid Dollar Assets
(1) (2) (3) (4) (5) (6) (7) (8)
Year
Total Net
Foreign
Assets
(Banking
Survey)
Official
Reserves
Net
Foreign
Asset of
Banking
Institutions
Cumulative
Unrecorded
Capital
Outflows i
Total Liquid
Foreign
Assets
(2)+(3) +(4)
Cumulative
Current
Account
Surplus
Cumulative
Net Inward
FDI to
China
Alternative
Estimate of
Liquid
Foreign
Assets
(6) +(7)
1990 21.7 28.6 5.1 3.2 36.9 21.7 2.7 24.4
1991 27.4 42.7 1.1 10.0 53.7 35.0 6.1 41.1
1992 30.6 19.4 6.4 18.2 44.1 41.4 13.3 54.7
1993 38.6 21.2 11.7 28.3 61.2 29.8 36.4 66.2
1994 58.8 51.6 7.1 37.4 96.1 36.7 68.2 104.9
1995 76.5 73.6 -3.4 55.2 125.4 38.3 102.0 140.3
1996 110.7 105.0 -4.3 70.7 171.4 45.5 140.1 185.6
1997 164.8 139.9 5.2 92.8 237.9 82.5 181.8 264.3
1998 181.7 145.0 17.9 111.7 274.6 114.0 222.9 336.9
1999 205.7 154.7 31.0 129.4 315.1 135.1 259.9 394.9
2000 243.0 165.6 59.6 141.1 366.3 155.6 297.3 453.0
2001 319.1 212.2 85.4 145.9 443.4 173.0 334.7 507.7
2002 383.4 286.4 107.8 138.3 532.6 208.4 381.5 589.9
Source: IFS, International Monetary Fund i Note: Errors and Omissions in International Payment Flows