chip seal design and specifications final report€¦ · chip seals or seal coats, ... special...
TRANSCRIPT

CHIP SEAL DESIGN AND SPECIFICATIONS
Final Report
SPR 777

CHIP SEAL DESIGN AND SPECIFICATIONS
Final Report
SPR 777
by Ashley Buss
Minas Guriguis Benjamin Claypool
Doug Gransberg R. Christopher Williams
for
Oregon Department of Transportation Research Section
555 13th Street NE, Suite 1 Salem OR 97301
and
Federal Highway Administration 400 Seventh Street, SW
Washington, DC 20590-0003
December 2016


i
Technical Report Documentation Page
1. Report No. FHWA-OR-RD-17-03
2. Government Accession No. 3. Recipient’s Catalog No.
4. Title and Subtitle
Chip Seal Design and Specifications
5. Report Date
December 2016
6. Performing Organization Code
7. Author(s) Ashley Buss, Minas Guriguis, Benjamin Claypool, Doug Gransberg, and R. Christopher Williams
8. Performing Organization Report No.
SPR 777
9. Performing Organization Name and Address
Oregon Department of Transportation Research Section 555 13th Street NE, Suite 1 Salem, OR 97301
10. Work Unit No. (TRAIS)
11. Contract or Grant No.
12. Sponsoring Agency Name and Address
Oregon Dept. of Transportation Research Section and Federal Highway Admin. 555 13th Street NE, Suite 1 400 Seventh Street, SW Salem, OR 97301 Washington, DC 20590-0003
13. Type of Report and Period Covered
Final Report
14. Sponsoring Agency Code
15. Supplementary Notes 16. Abstract
Chip seals or seal coats, are a pavement preservation method constructed using a layer of asphalt binder that is covered by a uniformly graded aggregate. The benefits of chip seal include: sealing surface cracks, keeping water from penetrating the surface, provides an anti-glare surface, minimizes the effect of aging as it seals the pavement surface, provides a highly skid-resistant surface and is cost effective. This study summarizes performance and the methodology used for developing specifications and a rational chip seal design in Oregon. Test sections included both emulsified asphalt and hot-applied chip seal applications. The pre and post construction pavement performance information is presented and analyzed. Post-construction analysis of the chip seals includes macrotexture analysis, dynamic friction testing to measure microtexture and pavement performance surveys. The underlying pavement conditions were classified from being very good to very poor performance. In this study, a comparison of field performance on test section is developed to recommend best practices and develop a rational design methodology. A comparative study between the application of McLeod method and New Zealand method is performed to evaluate the best chip seal design methodology for adoption into the State chip seal specifications. The results will also determine if the macro-texture based New Zealand chip seal performance specification is applicable for Oregon chip seals.
17. Key Words
chip seal, asphalt emulsion, hot-applied, chip seal design, chip seal specifications
18. Distribution Statement
Copies available from NTIS, and online at http://www.oregon.gov/ODOT/TD/TP_RES/
19. Security Classification (of this report) Unclassified
20. Security Classification (of this page)
Unclassified
21. No. of Pages
167
22. Price
Technical Report Form DOT F 1700.7 (8-72) Reproduction of completed page authorized Printed on recycled paper

ii
SI* (MODERN METRIC) CONVERSION FACTORS APPROXIMATE CONVERSIONS TO SI UNITS APPROXIMATE CONVERSIONS FROM SI UNITS
Symbol When You Know
Multiply By To Find Symbol Symbol When You
Know Multiply
By To Find Symbol
LENGTH LENGTH in inches 25.4 millimeters mm mm millimeters 0.039 inches in ft feet 0.305 meters m m meters 3.28 feet ft yd yards 0.914 meters m m meters 1.09 yards yd mi miles 1.61 kilometers km km kilometers 0.621 miles mi
AREA AREA
in2 square inches 645.2 millimeters squared mm2 mm2 millimeters
squared 0.0016 square inches in2
ft2 square feet 0.093 meters squared m2 m2 meters squared 10.764 square feet ft2 yd2 square yards 0.836 meters squared m2 m2 meters squared 1.196 square yards yd2 ac acres 0.405 hectares ha ha hectares 2.47 acres ac
mi2 square miles 2.59 kilometers squared km2 km2 kilometers
squared 0.386 square miles mi2
VOLUME VOLUME fl oz fluid ounces 29.57 milliliters ml ml milliliters 0.034 fluid ounces fl oz gal gallons 3.785 liters L L liters 0.264 gallons gal ft3 cubic feet 0.028 meters cubed m3 m3 meters cubed 35.315 cubic feet ft3 yd3 cubic yards 0.765 meters cubed m3 m3 meters cubed 1.308 cubic yards yd3
NOTE: Volumes greater than 1000 L shall be shown in m3. MASS MASS
oz ounces 28.35 grams g g grams 0.035 ounces oz lb pounds 0.454 kilograms kg kg kilograms 2.205 pounds lb
T short tons (2000 lb) 0.907 megagrams Mg Mg megagrams 1.102 short tons (2000 lb) T
TEMPERATURE (exact) TEMPERATURE (exact)
°F Fahrenheit (F-32)/1.8 Celsius °C °C Celsius 1.8C+3
2 Fahrenheit °F
*SI is the symbol for the International System of Measurement

iii
ACKNOWLEDGEMENTS
The authors would like to thank the Oregon Department of Transportation for supporting this research. Thank you to the technical advisory committee for their suggestions and assistance. Special thanks to Jon Lazarus and Larry Ilg. Thank you to the Oregon DOT special operations crew for traffic control. Thank you to the chip seal contractors and asphalt suppliers for providing information and their assistance on the construction site. Thank you to Paul Ledtje, Marie Grace Mercado, Jinhua Yu, and Jesse Studer at Iowa State University for their help in collecting field data.
DISCLAIMER
This document is disseminated under the sponsorship of the Oregon Department of Transportation and the United States Department of Transportation in the interest of information exchange. The State of Oregon and the United States Government assume no liability of its contents or use thereof.
The contents of this report reflect the view of the authors who are solely responsible for the facts and accuracy of the material presented. The contents do not necessarily reflect the official views of the Oregon Department of Transportation or the United States Department of Transportation.
The State of Oregon and the United States Government do not endorse products of manufacturers. Trademarks or manufacturers’ names appear herein only because they are considered essential to the object of this document.
This report does not constitute a standard, specification, or regulation.

iv
TABLE OF CONTENTS
1.0 INTRODUCTION............................................................................................................. 1
1.1 OVERVIEW ........................................................................................................................ 1 1.2 BACKGROUND AND SIGNIFICANCE OF WORK .................................................................... 1 1.3 PROBLEM STATEMENT ...................................................................................................... 2 1.4 OBJECTIVES ...................................................................................................................... 2
2.0 LITERATURE REVIEW AND CHIP SEAL SPECIFICATIONS ............................. 5
2.1 CHIP SEAL INTRODUCTION ................................................................................................ 5 2.2 TYPES OF CHIP SEAL ......................................................................................................... 5 2.3 CHIP SEAL MATERIALS ...................................................................................................... 7
2.3.1 Asphalt Binder ....................................................................................................................................... 8 2.3.2 Chip Seal Aggregate ............................................................................................................................ 11
2.3.2.1 Aggregate Size, Gradation and Uniformity ..................................................................................................... 11 2.3.2.2 Particle Shape and Flakiness ........................................................................................................................... 12 2.3.2.3 Aggregate Cleanliness ..................................................................................................................................... 12 2.3.2.4 Strength, Durability and Resistance to Abrasion ............................................................................................. 12 2.3.2.5 Aggregate Pre-coating ..................................................................................................................................... 13 2.3.2.6 Aggregate Imaging System and Equations ...................................................................................................... 13
2.4 CHIP SEAL DESIGN .......................................................................................................... 15 2.4.1 McLeod Design .................................................................................................................................... 16
2.4.1.1 McLeod Binder Application Rate ................................................................................................................... 17 2.4.1.2 Aggregate Characteristics Considered in McLeod Design: ............................................................................. 19 2.4.1.3 Traffic Volume adjustments in the McLeod Design ....................................................................................... 19 2.4.1.4 McLeod Design Loss of Aggregate Due to Traffic (Traffic Whip-Off) .......................................................... 19 2.4.1.5 McLeod Considerations for Existing Pavement Condition ............................................................................. 20 2.4.1.6 McLeod Considerations for Embedment ......................................................................................................... 20 2.4.1.7 McLeod Aggregates Application Rate ............................................................................................................ 21
2.4.2 New Zealand Design ............................................................................................................................ 21 2.5 RECENT CHIP SEAL RESEARCH ........................................................................................ 24 2.6 CHIP SEAL PERFORMANCE .............................................................................................. 25 2.7 CHIP SEAL CONSTRUCTION AND PERFORMANCE MONITORING ........................................ 27
2.7.1 Preparation of Surface ......................................................................................................................... 27 2.7.2 Materials .............................................................................................................................................. 27 2.7.3 Weather Conditions ............................................................................................................................. 28 2.7.4 Traffic Control ..................................................................................................................................... 28 2.7.5 Joints .................................................................................................................................................... 28 2.7.6 Equipment ............................................................................................................................................ 29
2.7.6.1 Spraying Equipment and Distributor ............................................................................................................... 29 2.7.6.2 Chip Seal Spreader .......................................................................................................................................... 31 2.7.6.3 Haul Trucks ..................................................................................................................................................... 32 2.7.6.4 Roller .............................................................................................................................................................. 32 2.7.6.5 Brooming ........................................................................................................................................................ 32
2.8 FOG SEALS ...................................................................................................................... 33 2.9 CHIP SEAL TROUBLESHOOTING ....................................................................................... 33 2.10 QUALITY CONTROL AND QUALITY ASSURANCE ............................................................... 35 2.11 STATE OF THE PRACTICE FOR CHIP SEAL SPECIFICATIONS IN THE USA ............................. 37
2.11.1 Introduction ..................................................................................................................................... 37 2.11.2 Spread Rates ................................................................................................................................... 37
2.11.2.1 Oregon spread Rates compared to the Other States ................................................................................... 37

v
2.12 TIME/DISTANCE ALLOWED AFTER EMULSION IS PLACED BEFORE PLACING COVER AGGREGATE ............................................................................................................................... 38
2.12.1 Oregon Time/Distance Specifications Compared to the Other States ............................................ 39 2.13 ROLLER SPECIFICATIONS ................................................................................................ 40
2.13.1 Oregon Roller Specifications Compared to the Other States .......................................................... 41 2.14 WEATHER LIMITATIONS/DATES ALLOWED FOR CONSTRUCTION ...................................... 43
2.14.1 Oregon Weather Limitations Compared to the Other States .......................................................... 43 2.15 WARRANTY, INCENTIVE, AND PERFORMANCE SPECIFICATIONS ....................................... 45
2.15.1 Oregon Warranties, Performance Specifications and Incentives Compared to the Other States ... 46 2.16 LITERATURE REVIEW SUMMARY AND RECOMMENDATIONS ............................................ 46
3.0 FIELD AND LABORATORY EXPERIMENTAL PLAN ......................................... 49
3.1 IDENTIFICATION OF FIELD PROJECTS ............................................................................... 49 3.2 CLIMATE ........................................................................................................................ 54 3.3 CHIP SEAL TYPE AND MATERIALS ................................................................................... 56
3.3.1 Testing Methods ................................................................................................................................... 58
4.0 EXPERIMENTAL RESULTS AND ANALYSIS ........................................................ 63
4.1 CHIP SEAL CONSTRUCTION ............................................................................................. 63 4.2 FIELD PERFORMANCE MONITORING ................................................................................ 66
4.2.1 Mean Texture Depth ............................................................................................................................ 66 4.2.1.1 Discussion of applying New Zealand chip seal MTD performance specification ........................................... 72
4.2.2 Dynamic Friction Test ......................................................................................................................... 73 4.2.3 Pavement Performance Monitoring ..................................................................................................... 80
4.3 LABORATORY ANALYSIS OF CHIP SEAL MATERIALS ........................................................ 88 4.3.1 Aggregate Material Properties ............................................................................................................ 88
4.3.1.1 Sieve Analysis ................................................................................................................................................. 88 4.3.1.2 Flakiness Index ............................................................................................................................................... 89 4.3.1.3 Micro Deval .................................................................................................................................................... 89
4.3.2 Aggregate Imaging System Properties ................................................................................................. 91 4.4 CORRELATIONS BETWEEN LAB AND FIELD ..................................................................... 92 4.5 CHIP SEAL DESIGN .......................................................................................................... 94
4.5.1 McLeod Design based on Minnesota Seal Coat Design Guide (Wood et al. 2006) ............................. 94 4.5.2 McLeod Design Parameter Sensitivity ............................................................................................... 102 4.5.3 New Zealand Design and comparison to McLeod ............................................................................. 105
4.5.3.1 Determination and Comparison of Chip Application Rate ............................................................................ 105 4.5.3.2 Determination of Binder Application Rate .................................................................................................... 107 4.5.3.3 Estimation of the change in binder and chip application rates between lab design and field application ...... 109
5.0 CONCLUSION AND RECOMMENDATIONS ........................................................ 113
5.1 PROJECT CONCLUSIONS AND FINDINGS ......................................................................... 113 5.2 PROJECT RECOMMENDATIONS ...................................................................................... 114
5.2.1 Specification Recommendations ........................................................................................................ 115 5.2.2 Chip Seal Performance Specification and Recommendations ........................................................... 115
5.2.2.1 Draft Performance Specification ................................................................................................................... 116
6.0 REFERENCES .............................................................................................................. 118
APPENDIX A APPENDIX B APPENDIX C APPENDIX D
vi
LIST OF TABLES
Table 2.1: Grades of aggregate size in New Zealand (Gundersen 2008) .................................................................... 11 Table 2.2: Application Rate Correction (Caltrans 2003). ........................................................................................... 19 Table 2.3: Whip-off Correction Factor (Caltrans 2003) .............................................................................................. 20 Table 2.4: Existing pavement condition factor (Caltrans 2003). ................................................................................. 20 Table 2.5: Embedment Factor (Caltrans 2003). .......................................................................................................... 21 Table 2.6: Spread Rates of Various States ................................................................................................................... 38 Table 2.7: Intervals Between Spraying and Covering ................................................................................................. 40 Table 2.8: Rolling Specifications by State ................................................................................................................... 42 Table 2.9: Date Ranges and Allowed Temperatures for Chip Sealing ........................................................................ 44 Table 3.1: Location and average daily traffic rate for different units .......................................................................... 54 Table 3.2: Chip seal type, AADT and Binder for Each Section .................................................................................. 56 Table 3.3: Binder Application Rate, Chip Application Rate and Aggregate Source ................................................... 57 Table 4.1: An Example of Pavement Distress Data for Unit A ................................................................................... 81 Table 4.2: Identification of crack type coding ............................................................................................................. 82 Table 4.3: Laboratory Measured Aggregate Properties ............................................................................................... 89 Table 4.4: Flakiness Index ........................................................................................................................................... 89 Table 4.5: Micro Deval Test Results ........................................................................................................................... 90 Table 4.6: General Aggregate Properties ..................................................................................................................... 90 Table 4.7: Opening Size per Sieve .............................................................................................................................. 94 Table 4.8: Median Size for each ODOT chip seal section ........................................................................................... 95 Table 4.9: FI and AADT for different Sections ........................................................................................................... 95 Table 4.10: ALD for different sections ........................................................................................................................ 96 Table 4.11: LUW for different test sections ................................................................................................................ 97 Table 4.12: LUW, Bulk Specific Gravity and V ......................................................................................................... 98 Table 4.13: Aggregate absorption after correction factor ............................................................................................ 99 Table 4.14: Traffic Factors ........................................................................................................................................ 100 Table 4.15: McLeod vs actual rates ........................................................................................................................... 101 Table 4.16: Application Rates per Section ................................................................................................................ 105 Table 4.17: Chip Rate using different Methods ......................................................................................................... 106 Table 4.18: Factors of different sections ................................................................................................................... 108 Table 4.19: Texture depth of different sections ......................................................................................................... 108 Table 4.20: Comparison of different binder application rates ................................................................................... 109 Table 4.21: Changes in Binder and Chip Application Rates between Design and Field ........................................... 110
LIST OF FIGURES
Figure 2.1: Types of chip seals (Gransberg and James 2005) ...................................................................................... 7 Figure 2.2: Effects on voids in cubical aggregate (California Division of Maintenance 2003; FHWA 1992) ............ 17 Figure 2.3: Rounded and Non-uniform Aggregates (California Division of Maintenance 2003; South Australian
Department of Transportation 1995) ................................................................................................................. 19 Figure 2.4: Sand circle test (Photo courtesy of Paul Ledtje) ....................................................................................... 23 Figure 2.5: Percentage of bicyclists who consider a roadway “acceptable” as a function of mean profile depth
(adopted from Li and Thigpen 2013) ................................................................................................................. 25 Figure 2.6: Compared Date Ranges for Chip Sealing .................................................................................................. 45 Figure 3.1: Map of all project locations ....................................................................................................................... 50 Figure 3.2: 2014 Chip Seal Projects (Google Earth 2015) .......................................................................................... 51 Figure 3.3: Klamath Chip Seal Project Details ............................................................................................................ 51 Figure 3.4: Klamath Falls Pavement Conditions. Underlined labels indicate hot applied and bold indicates
emulsified (ODOT 2012). .................................................................................................................................. 52 Figure 3.5: Emulsified Asphalt Chip seals ADT section in Klamath Falls.................................................................. 53 Figure 3.6: Hot Applied Asphalt Chip Seal Sections in Klamath Falls ....................................................................... 53

vii
Figure 3.7: Oregon Plant Hardiness Zone Map (USDA 2016) ..................................................................................... 55 Figure 3.8: Rainfall precipitation in Oregon (PRISM 2014) ........................................................................................ 55 Figure 3.9: Illustration of Macro and Microtexture ..................................................................................................... 58 Figure 3.10: Pavement Friction Model (Pidwerbesky et al 2006; Hall 2006) ............................................................. 59 Figure 3.11: (a) Macrotexture Testing in Progress (Photo courtesy of Paul Ledtje) (b) Dynamic Friction Test
Equipment (c) Skid Testing equipment (Photo courtesy of Oregon DOT) ........................................................ 60 Figure 4.1: Chip Seal Distributer (Photo credit: Paul Ledtje) ...................................................................................... 63 Figure 4.2: Chip Seal Distributor Spray Bar (Photo credit: Paul Ledtje) .................................................................... 64 Figure 4.3: Haul Truck Loading Chip Spreader (Photo credit: Paul Ledtje) ............................................................... 64 Figure 4.4: Aggregate Laydown Operation (Photo credit: Paul Ledtje) ...................................................................... 65 Figure 4.5: Pneumatic Tire Roller (Photo credit: Paul Ledtje) .................................................................................... 65 Figure 4.6: Unit A Mean Texture Depth Measurements and Performance Criteria .................................................... 68 Figure 4.7: Mean Texture Depth for Units B and C with Performance Criteria .......................................................... 69 Figure 4.8: Mean Texture Depth for Units D and E with Performance Criteria .......................................................... 69 Figure 4.9: Unit F and Unit G Mean Texture Depth Measurements and Performance Criteria .................................. 70 Figure 4.10: Unit H Mean Texture Depth Measurements and Performance Criteria .................................................. 70 Figure 4.11: Prairie and Parkway Mean Texture Depth Measurements and Performance Criteria ............................. 71 Figure 4.12: Lewis & Clark and Sunset Beach Mean Texture Depth and Performance Criteria ................................. 71 Figure 4.13: Heppner and Condon Mean Texture Depth and Performance Criteria ................................................... 72 Figure 4.14: Unit A Dynamic Friction Test Results .................................................................................................... 74 Figure 4.15: Units B and C Dynamic Friction Test Results ........................................................................................ 75 Figure 4.16: Units D and E Dynamic Friction Test Results ........................................................................................ 76 Figure 4.17: Units F and G Dynamic Friction Test Results ......................................................................................... 77 Figure 4.18: Unit H Dynamic Friction Test Results .................................................................................................... 78 Figure 4.19: Parkway and Prairie Dynamic Friction Test Results ............................................................................... 79 Figure 4.20: Sunset Beach Ln. Dynamic Friction Test Results ................................................................................... 79 Figure 4.21: Lewis and Clark Dynamic Friction Test Results ..................................................................................... 80 Figure 4.22: Klamath Falls Monthly Rainfall Totals from July 2014 to July 2016 (NOAA 2016) .............................. 80 Figure 4.23: Average transverse crack length vs. unit performance over time per 100 linear ft. of road .................... 83 Figure 4.24: Average Longitudinal Crack Length versus Unit Performance Over Time per 100 linear ft. of road .... 84 Figure 4.25: Fatigue cracking in all observed roadways per 100 linear ft. of road ...................................................... 84 Figure 4.26: Average Pothole Area versus Unit Performance Over Time ................................................................... 85 Figure 4.27: Average Patching Crack Length versus Unit Performance Over Time ................................................... 86 Figure 4.28: Average Bleeding Crack Length versus Unit Performance Over Time .................................................. 87 Figure 4.29: Average Loss of Aggregate Cover versus Unit Performance Over Time ............................................... 87 Figure 4.30: 0.45 Power Chart for Aggregate Gradations with Arrow Indicating Median Aggregate Size ................ 88 Figure 4.31: Gradient Angularity for Different Sections ............................................................................................. 91 Figure 4.32: Distribution for Gradient Angularity of Cover Aggregates for Unit A ................................................... 92 Figure 4.33: Comparison Between Oregon and ODOT Micro-Deval Averages ......................................................... 93 Figure 4.34: Binder Application Rate on a Hot-Applied Chip Seal as a function of ALD and Percent Waste Allowed
......................................................................................................................................................................... 102 Figure 4.35: Binder Application Rate on a Hot-Applied Seal as a function of Traffic and Surface Texture ............ 103 Figure 4.36: Chip Application Rate on an Emulsified Asphalt Chip Seal as a Function of ALD and Percent Waste
Allowed ............................................................................................................................................................ 104 Figure 4.37: Binder Application Rate for an Emulsified Chip Seal as a function of Traffic and Surface Texture .... 104 Figure 4.38: Comparison of different chip rates per section ...................................................................................... 106 Figure 4.39: Example of Chip Seal Design Comparisons ......................................................................................... 107 Figure 4.40: Changes between design and field application rates for McLeod Method ............................................ 111 Figure 4.41: Changes between design and field application rates for New Zealand Method .................................... 112

viii

1
1.0 INTRODUCTION
This research report documents the investigation of using a chip seal design methodology in Oregon. An overview of chip seal design methodologies and a review of chip seal specifications are also outlined. The research project tracked the performance of multiple chip seal sections throughout the state. The chip seal aggregate and binder application rates were compared to standard chip seal design methods.
1.1 OVERVIEW
This report details a comprehensive performance analysis of chip seals in Oregon. Chip seals are often referred to as seal coats and bituminous surface treatments. Applicability of chip seal designs and specifications were reviewed and outlined as part of the study. Chip seals are a tool used for pavement preservation and are not suitable as a replacement for roads requiring rehabilitation. As part of this study, the research project tracked the performance of 12 chip seal projects at various locations in the State of Oregon. Two primary types of chip seal performance were studied: hot-applied and emulsified asphalt applications, performance of both types were evaluated. This works to establish a benchmark of chip seal performance in Oregon, recommend performance-based specifications and provide guidance for implementing chip seal designs.
1.2 BACKGROUND AND SIGNIFICANCE OF WORK
Chip seals are a key component to any pavement preservation program which seeks to “put the right treatment on the right road at the right time” (Galehouse et al. 2003). However, NCHRP Synthesis 342 (Gransberg and James 2005) concluded that research into chip design in the United States essentially stopped in 1969 after the development of the McLeod methodology. Use of a rational chip seal design process provides a decision making tool for choosing the starting application rates for aggregate and binder in the field. Additionally, the chip seal design process walks designers through a checklist of considerations that account for whether or not a chip seal is going to be appropriate for the particular roadway. Taking into account individual roadway characteristics at a project level in a systematic fashion is the pathway for improving chip seal performance and construction. A systematic approach to designing a chip seal will also improve technology transfer in terms of knowledge transfer between agencies and contractors as well as between experienced and less experienced personnel.
NCHRP Synthesis 342 also found that many US public road agencies treat chip seal as a commodity to be purchased in bulk rather than an important pavement preservation tool that requires a rational design approach based on sound engineering principles and a strong construction quality management effort to insure that it is properly installed, which exacerbates the problem of developing a strong chip seal program (Gransberg and James 2005).
Chip sealing practices used by the New Zealand Transport Agency (NZTA) have developed into a strong chip seal program by incorporating rational chip seal design and construction practices

2
that have evolved over a number of years through research and monitoring performance in the field (Pidwerbesky et al. 2006). The seal design procedure is a rational system, based on the volumetric characteristics of the sealing aggregate, for calculating the amount of aggregate to spread and the quantity of binder required to hold the aggregate in place. There are a number of factors, such as the condition of surface on which the seal is to be placed, terrain, pavement geometry, etc. that influence the volume of voids in the seal and the rate at which these decrease under trafficking. Allowances are used in the seal design formula which increases or decrease the binder application rate as required calibrating the final design rates for variations encountered along the length of a given project.
In the NZTA design method, the substrate upon which a new seal is to be placed must be quantitatively characterized to calculate the binder application rates (TNZ 2005). The rate varies as required along the length of the road and depends upon the size, shape and orientation of theaggregate particles, embedment of aggregate into the underlying pavement, texture of the surface onto which the seal is being applied, and absorption of binder into either the pavement or aggregates. The aim of the NZTA design process is for the residual binder to be ½ to 2/3 the mean depth of the aggregate (TNZ 2005). New Zealand mandates that pavement type selection be based on life cycle cost. A key factor in this economic analysis procedure is that a discount rate of 10% is mandated to discount all future benefits and costs to their present value. This effectively limits the use of structural asphalt pavements to those roads carrying over 25,000 AADT, and precludes the use of rigid (concrete) pavements. Thus, greater than 90% of New Zealand’s road network is unbound pavements, surfaced with chip seals, due to their low initial cost (Waters et al. 2013; Waters 2004). Field trials of high quality chip seals on private forestry roads have proven that high quality chip seals over granular pavements can carry extremely heavy loads (up to 16 tons per single axle) and high numbers of load repetitions (> 15 million ESAL) (Arnold and Pidwerbesky 1996).
1.3 PROBLEM STATEMENT
This study has been developed to revisit Oregon DOT’s chip seal design methodology and specifications using common chip seal design methodologies found in the US and internationally as a benchmark to identify potential approaches to improve the ODOT chip seal program. The crux of the issue revolves around the upcoming loss of experienced maintenance personnel and the fact that the current ODOT “The technique used to apply chip seals is currently referred to as more of an ‘art’ than ‘science’ and is based on “an experienced person conducting a visual inspection during the application and making adjustments in binder and/or aggregate (chip) rate.” Therefore, ODOT requires a rational chip seal design methodology based on quantitative measurements that can be successfully replicated by contractors in the field and which does not demand the current amount of professional judgment to be successful.
1.4 OBJECTIVES
The objective of this research is to document methods and report the performance of chip seals designed using different methodologies. Once quantified, the research will identify best practices that can be implemented. The chip seal design methodologies will be compared and presented. In the field, pavement macrotexture was measured before construction, right after construction, followed by one and two-year post-construction evaluations. The microtexture surface

3
characteristics were measured one and two-years post construction. Pre-construction pavement conditions were also considered. In the lab, traditional aggregate tests such as flakiness index, micro-Deval and gradation were measured. Moreover, AIMS measurements were taken to further assess shape characteristics. The laboratory tests are compared with the field measurements to understand the interplay between the various test results and influence on performance. Finally, the recorded applied chip seal binder and aggregate application rates are compared with the back-calculated design application rates in the lab.
The project benefits are providing sustainable design solutions to the state’s construction and maintenance projects. The result is a more cost effective treatment which minimizes the amount of virgin material required and greatly reduces the carbon footprint of the typical resurfacing job. In many cases, the chip seal’s increased surface macrotexture will enhance safety by providing enhanced surface drainage to remove more water from the traveled way faster than hot mix asphalt surfaces.

4
5
2.0 LITERATURE REVIEW AND CHIP SEAL SPECIFICATIONS
2.1 CHIP SEAL INTRODUCTION
Aging infrastructure has required roadway agencies to focus on implementing cost-effective pavement preservation strategies. The characteristics of a pavement’s surface can markedly affect its performance. Chip seal is a common technique used to preserve pavements, restore surface characteristics and enhance performance life. Chip seal applications have many advantages such as: keeping water from penetrating the road structure, filling and sealing cracks, providing an anti-glare surface and increasing reflective surface for wet/night driving (WSDOT 2015). Their primary purpose is to protect the pavement surface from sun, water and traffic while providing added surface texture and skid resistance to the roadway surface (Asphalt Institute 2009; Roberts and Nicholls 2008). This additional surface texture enhances the pavement drainability in rainy-weather conditions. Chip seals seal the surface of the road to prevent water infiltration which will prevent further deterioration of the roadway surface and provide a longer service life. They have shown to be a cost effective way to preserve the roadway while providing a highly skid-resistant surface. Chip seal design and construction practices have evolved over a number of years through research and field performance monitoring (Pidwerbesky et al. 2006).
There are multiple chip seal types that are available. This study focuses on a single-layer of binder followed by a single-layer of aggregate chips but additional techniques will be discussed in the literature review as well as an explanation of the benefits for using additional layers. There are a number of different techniques for chip sealing depending on the binder type, number of layers, and stone sizes. These include but are not limited to single, double, raked-in, sandwich and inverted double surface dressings (Read and Whiteoak 2003; Roberts and Nicholls 2008). The most commonly used technique is the single-layer chip seal system. Each of these techniques can be evaluated based on roadway needs, traffic, available aggregate, binders, and cost. Use of these techniques can be evaluated based on underlying pavement condition, pavement geometrics, traffic level, urban or rural traffic, costs, and life cycle expectations (NZTA 2005). Certain roadways are not good candidates for chip seals including significantly distressed roadways and roads with traffic making sudden turning, accelerating or stopping movements. The reason for this is the relatively low ability of the aggregates to resist tangential forces (Read and Whiteoak 2003).
2.2 TYPES OF CHIP SEAL
There are many types of chip seals, the most common of them are single and multiple chip seal (Caltrans Division of Maintenance 2003). However, there are many other types of chip seals presented in Figure 2.1 (Gransberg and James 2005).
1. A single chip seal is an application of binder followed by an aggregate. This is used as a pavement preservation treatment and provides a new skid resistant wearing

6
surface, arrests raveling, and seals minor cracks. It is mostly used for normal situations where no special considerations would indicate that a special type of chip seal is warranted
2. Multiple chip seal is simply a built-up seal coat consisting of multiple applications of binder and aggregate. Multiple chip seals are commonly used when a harder wearing and longer lasting surface treatment is needed. It mainly includes a spraying application of binder, spreading a layer of aggregate, rolling the aggregate for embedment, applying an additional application of binder, spreading another layer of aggregate, and rolling with sweeping being done between applications.
3. Racked-in Seal is a special seal in which a single-course chip seal is temporarily protected from damage through the application of choke stone that becomes locked in the voids of the seal (Gransberg and James 2005). The choke stone provides an interlock between the aggregate particles of the chip seal and prevent aggregate particles from dislodging before the binder is fully cured. These chip seals are in order in areas where there are large numbers of turning movements to lock in the larger pieces of aggregate with the smaller aggregate and prevent the aggregate from being dislodged before the seal is fully cured.
4. Cape Seal Cape seals are a single chip seal followed by a slurry seal. Cape seals are very robust and provide a shear resistance comparable to that of asphalt (Gransberg and James 2005).
5. Inverted Seal where larger-sized aggregate goes on top of the smaller-sized aggregate and is an inverted double seal. These seals are commonly used to repair or correct an existing surface as bleeding. Another use is for restoring uniformity to surfaces with variation in transverse surface texture (Gransberg and James 2005).
6. Sandwich Seal is a chip sealing technique that involves one binder application sandwiched between two separate aggregate applications. Sandwich seals are particularly useful for restoring surface texture on raveled surfaces. Geotextile-Reinforced Seal Reinforcing a chip seal with geotextile products can enhance the performance of a conventional chip seal over extremely oxidized or thermal cracked surfaces. The geotextile is carefully rolled over a tack coat, followed by a single chip seal being placed on top.

7
Figure 2.1: Types of chip seals (Gransberg and James 2005)
2.3 CHIP SEAL MATERIALS
There are various chip seal materials available and the surface to which they are applied can also vary. Minnesota performed an in-depth study of what was lacking in their chip seal design

8
practices. The major component that was missing were good, systematic engineering practices that guided the chip seal design. For example, the original MnDOT specification provided a binder application rate without consideration of the percent of residual asphalt in the emulsified binder and an aggregate application rate without consideration of nominal maximum aggregate size (Wood and Olson 2007). Chip seals are a layered system in which binder and aggregate chips need to work together to create desired properties. Overlooking fundamental design components leaves more room for failure. The purpose of this section is to present a summary of desirable characteristics of chip seal aggregates and typical asphalt binders used in chip seal.
Chip seal aggregates should be uniformly graded. McCloud recognized the importance of aggregate uniformity and developed the uniformity index (McLeod 1960). Lee and Kim developed the performance uniformity coefficient (PUC) to provide an index of uniformity. The PUC considers the nominal maximum aggregate size by considering aggregate shape relative to the gradation curve. The percent of aggregate that are too small and will contribute to bleeding are considered as well as the percent of aggregate that are too large and are likely to be cast off curing the construction and brooming process because they are too large to be embedded to the required depth of approximately 70% embedment (Lee and Kim 2009). Excess fines and dust particles on a roadway surface or in the aggregate stockpiles are especially problematic. Proper adhesion of the binder requires a clean substrate of the roadway surface. In addition, aggregate particles must not be coated in fines which will interfere with the binder-aggregate chip bond. The sealing performance is better when large aggregates are used because a higher volume of asphalt binder is required to retain the aggregate chips but larger aggregates tend to produce more traffic noise, have a rougher texture and a higher potential to damage vehicles (Shuler et al. 2011); however, larger aggregates may not provide desirable texture for bicycling surfaces.
2.3.1 Asphalt Binder
The function of the asphalt in the chip seal system is to adhere to the roadway substrate and bond to the aggregate chips. Binder must be applied in sufficient quantity, evenly without streaking and chip seals can be placed in two-board categories based on the binder used: hot-applied and cold-applied. These binders can be formulated in numerous ways and may include polymers, anti-stripping additives, coating improvers, etc. The hot-applied chip seals use asphalts similar to typical hot-mix asphalt paving and the asphalt grading system uses the performance grading (PG) binder specifications. The PG grading system provides useful information about the rheology of the binder at high and low temperatures. Climate conditions can be considered when choosing the PG grade of the asphalt using state PG requirements. There are two main binder types used for chip seal operations: asphalt cements and emulsified asphalts. Climate and weather are the two key factors in selecting the binder type (Zaman et al. 2013; McLeod 1969). Ambient air temperature is another environmental factor to account for when using any bituminous binder. It is established that ambient temperatures at the time of construction closely affect the quality of chip seal (Gransberg et al. 1998). In hot weather, bleeding can be prevented with binder selection directed toward the use of “harder” hot applied asphalts and emulsions. During construction with low ambient air temperatures, high humidity, or damp aggregate and pavement surfaces, emulsions are generally believed to be more successful than hot asphalts (Zaman et al. 2013).

9
The following is a list of binder types that can be used in single and multiple chip seals (Caltrans 2003):
• Asphalt Emulsion: Polymer-modified emulsions
• Performance-Based Asphalt (PBA) Cements: Hot applied modified binders that can be placed at night and in conditions where water evaporation from an emulsion would not be favorable.
• Asphalt Rubber Binder: Binders modified with high levels of crumbed tire rubber and a high natural rubber content material. These binders are sprayed hot and require hot chips Pre-coated with asphalt. Hot applied AR binders can be placed at cooler temperatures than emulsion binders and can be placed at night.
• Rejuvenating Emulsion: These are emulsions modified with rejuvenating oils (and sometimes formulated with polymers) that are used to penetrate and soften existing asphalt pavements.
Cold applied chip seals can also use emulsified asphalts or cutback/fluxed asphalts; however, due to environmental impacts of cutback and fluxed asphalts and their relatively low use, they are not discussed in detail. Asphalt emulsions are more commonly used consist of approximately 32% water and 68% asphalt bitumen. The emulsified asphalts contain asphalt globules dispersed in water stabilized by an emulsifying agent. The asphalt-in-water emulsion has undergone a manufacturing process through a colloidal mill that allows for the binder to be applied at lower temperatures than the hot-applied asphalt. Asphalt emulsions (also referred to as “emulsions” in this report) are graded based on the electric charge surrounding the asphalt particles: anionic, cationic and non-ionic. Typically, cationic emulsions are used in chip sealing. Emulsions are also categorized based how quickly they “break” or “set”, meaning the asphalt globules coalesce and the water is removed from the system creating the asphalt-aggregate bond. Asphalt emulsions are classified as rapid set, medium set, slow set and quick set (Asphalt Institute and AEMA 2008). There are also high float emulsions that have a gel structure and resists flow of the emulsion residue (O’Connor 1982). For chip seals, rapid set or medium set emulsions are used but rapid-set is the most common. The rate at which the emulsion breaks will depend on the emulsion chemistry, ambient temperature, moisture content and absorption properties of the aggregate, wind speed and the traffic/compaction loading. One of the most critical factors is humidity. One commonly referenced manual recommends that at 80% humidity and above, the emulsion should only be applied on minor roads where the traffic can be slowed to 10-20 mph (Read and Whiteoak 2003).
To summarize, considerations of choosing an asphalt binder include (Asphalt Institute 2009):
• Temperature at the time of application
• Air temperature
• Humidity and wind

10
• Condition of the surface
• The type and condition of the aggregate that will be applied
In dry, hot weather, softer grades of asphalts may be used but in general, rapid-set emulsions are the most suitable.
In the UK, approximately 80% of surface dressings used polymer modified binders in 2004 (Read and Whiteoak 2003). Both hot-applied and emulsified asphalts can be polymer modified. Research has documented that polymer modified binders retain aggregate particles at higher percentages compared to non-modified binders (Johnston and King 2012). In Oregon, all of the chip seal projects included in this study used polymer-modified binders. Polymers also provide improved aggregate retention in the Vialit test when applied in a low-temperature environment (Johnston and King 2012), making the system more robust to temperature changes. The benefit of using polymer binders in chip seals are they remain sufficiently stiff at high temperatures to resist shoving and will also reduce the formation of non-load associated thermal cracks that may occur when the binders become very stiff at low temperatures (Read and Whiteoak 2003; Johnston and King 2012). The pavement temperature gradients are most extreme at the surface. The pavement surface layers are subject to the greatest temperature fluctuations, exposure to UV light, moisture and traffic loading. Polymer modified binders perform better at wider temperature ranges, have higher cohesive strengths and provides additional tack, which is especially early in the early-stages. The New Zealand chip seal design manual does warn that when hot-applied PMBs are used, the seal can peel from the substrate if it is dusty or cold, leading to poor bond development and pre-coated chips are highly recommended (NZTA 2005).
Consideration of the binder is extremely important for longevity and performance of chip seals treatments. A study compared performance and cost of emulsion-chip seals with hot-applied chip seals found emulsion performance was equivalent to hot-applied seals although tended to be used on lower-volume roads with lower condition ratings (Gransberg and Zaman 2005). The asphalt emulsion can have especially low early-strength. Conditions such as skinning of the emulsion and retarded set times can occur. The asphalt globules can go through a state where agglomeration has occurred but full coalescence has not (Read and Whiteoak 2003). Traffic must be kept to very low speeds when this occurs as the binder has little ability to resist shearing loads from tangential forces. Keeping traffic at very reduced speeds until after the emulsion has fully set and been broomed will reduce damage to windshields.
Common factors and considerations between all chip seal binders include cost, long-term performance, use of an asphalt distributer and be physically and chemically stable. Viscosity of the binder must be balanced between remaining in a uniform layer, not running off of the superelevated road, especially at the crown, ability to wet the applied aggregate and create a sufficient asphalt-aggregate bond (Asphalt Institute 2009). Emulsion viscosity is a function of the percent binder content making this a dynamic variable during construction. For example, the emulsion visco-elastic behavior in high shear conditions during pumping will be different than under low shear conditions, immediately post-application on the road. The changes in flow, or viscosity, behavior highlights the need for careful monitoring of the chip seal application. If an asphalt emulsion is applied in a streaking pattern from the distributer’s spray bar, the emulsion’s ability to level out is a function of the residual binder content and flow properties. This

11
emphasizes the need for careful attention to uniform binder application during construction. Chip seals have been used successfully with both hot-applied and cold-applied techniques. The asphalt application rate will be a function of the aggregate size because the aggregate particles should be embedded in the asphalt in a single layer at approximately 2/3 to 70 percent of the voids filled.
2.3.2 Chip Seal Aggregate
Aggregate durability, shape, cleanliness, Shape of the aggregate play a key role. McLeod’s chip seal design methodology evaluates this by a flakiness index. This can also be correlated to average least dimension which is important in understanding how aggregates will embed into the layer of asphalt binder. Challenges regarding aggregate availability in the Oregon coastal region have been documented in literature (Burchfield and Hicks 1981). Costs of aggregate transportation and processing are primary consideration when evaluating placing a chip seal on a road. If aggregates suitable for chip seal are not within an economical haul distance, other pavement preservation strategies should be evaluated. The following sections present aggregate characteristics that make an aggregate particle suitable for use in chip seals.
Aggregate Size, Gradation and Uniformity 2.3.2.1
Aggregate size must offset the gradual embedment into the pavement substrate caused by traffic and still maintain adequate pavement macro- and microtexture characteristics (Read and Whiteoak 2003). Uniformly graded aggregates perform best in chip seals and the aggregates should be as uniform as economically possible. The uniform aggregate size allows for a consistent single-layer of aggregate. The rule of thumb is the largest size should not be greater than twice the smallest size (Asphalt Institute 2009). In New Zealand aggregate specifications, uniformity, average least dimension and nominal maximum aggregate size are considered. Chip seals have a “grade” ranked from 2-6 based on the aggregate size and average least dimension. Table 2.2 takes the New Zealand table and converts it into English units (Gundersen 2008).
Table 2.1: Grades of aggregate size in New Zealand (Gundersen 2008)
Grade Average Least Dimension Sieve Size (approximately)
2 3/8 in to 1/2 in 3/4 max 3 0.3 in to 0.39 in 5/8 max 4 0.22 in to 0.31 in 9/16 max 5 - 3/8 to 3/16 (graded) 6 - 1/4 to 1/8 (graded)
The New Zealand method specifies particle size uniformity to within a given percentage of 0.1 inch (2.5 mm) (Gundersen 2008). The uniformity coefficient is a measure of uniformity used in the McLeod design method. Further development led to the performance uniformity coefficient (PUC). Small aggregates will embed more fully into the binder layer and contribute to bleeding, conversely, the large aggregate particles will

12
not be embedded enough and contribute to aggregate loss. The aggregate size is relative to the median size of the aggregate. For each gradation, the percent aggregates that contribute to bleeding and aggregate loss are calculated. The closer the PUC is to zero, the more uniform the gradation. This provides a better metric than McLeod’s uniformity coefficient (Lee and Kim 2009). The gradation of the aggregate will influence its loose unit weight, a parameter used in the McLeod chip seal design methodology.
Particle Shape and Flakiness 2.3.2.2
Cubical aggregates are the ideal shape for chip seals but truly cubical aggregates are rare. The aggregate shape contains a length, width and depth. The aspect ratios of the aggregate dimensions determine how “flaky” or “flat or elongated” a particle is. Flat or elongated particles tend to orient with the longest axis embedded in the roadway, reducing surface texture. The embedded particles lead to reduced service life so flat/elongated particles are measured and there is a maximum allowable percentage. Aggregate handling can influence the amount of aggregate breakdown and this should be taken into consideration when developing quality control procedures. The flakiness index can be measured suing a plate with openings of pre-selected widths as outlined in Tex-224 (TxDOT 2005). The test measures the number of flat or elongated particles that may cause texture loss or aggregate loss.
Aggregate Cleanliness 2.3.2.3
Adhesion between the aggregate and binder is critical to the chip seal performance. The adhesive bond cannot be formed when aggregate is coated in dust, silt or clay. Handling of the aggregates can create additional dust particles and aggregate breakage. To reduce contaminates, aggregates can be washed and drained to remove dust and fine particles. For hot-applied chip seals, aggregates should be pre-coated with asphalt. When emulsified asphalts are used, slightly damp aggregates adhere better (Asphalt Institute 2009). Loss of cover aggregate can occur if aggregates are too dirty (Asphalt Institute and AEMA 2008).
Strength, Durability and Resistance to Abrasion 2.3.2.4
Aggregates used in chip seals should be resistant to polishing and abrasion. Traditional tests for measuring abrasion resistance in includes the LA abrasion test. The amount of degradation is a function of the aggregate’s abrasion and impact resistance. The Los Angeles (LA) Abrasion test and the Micro-Deval test provide information about aggregate abrasion and impact resistance. The LA Abrasion and Impact Test following (AASHTO T 96 2015) is the most widely used method for measuring aggregate resistance for abrasion and aggregate toughness. It represents the degradation during transport, mixing, and compaction (Gransberg et al. 2005).
This test is performed in a dry condition and provides a measure of an aggregates resistance to impact resistance and ability to withstand heavy wheel loading (Gransberg et al 2010)

13
The Micro-Deval test evaluates the aggregate degradation due to abrasion. The Micro-Deval test follows “Standard Test Method for Resistance of Coarse Aggregate to Degradation by Abrasion in the Micro-Deval Apparatus” (AASHTO T 327 2015). The micro-Deval test represents the aggregate resistance to abrasion and weathering. The micro-Deval test is performed in a wet condition and measures the resistance of abrasion and polishing. Previous studies in Oregon have documented mixed results micro-Deval to indicate performance of chip seals. This comparison is further expanded on in the results and analysis section of this report.
Aggregate Pre-coating 2.3.2.5
For hot-applied chip seals, pre-coating aggregate is recommended (Gransberg and Zaman 2005). Pre coating applies a thin film of bitumen applied at an asphalt plant. The asphalt film eliminates surface dust and provides rapid adhesion. Pre-coated aggregates should not be used with asphalt emulsions. The pre-coated aggregates typically have a “salt and pepper” appearance. Pre-coating can be used with cutback asphalts and is especially useful in areas where higher traffic volumes require the use of higher viscosity binder. Literature from New Zealand states that in this situation, placing the pre-coated aggregate while it is still hot is preferred (Gundersen 2008). Precoating can also be applied to aggregates to be stockpiled using hot-applied asphalt but the coating should be light (NZTA 2005). If pre-coated aggregate has an adhesive coating that is too thick, this increases the risk of tires picking up the aggregate (NZTA 2005). Hot applied chip seals can be applied at night or when conditions for water evaporation from emulsified asphalts is not favorable but pavement surfaces and aggregates must be dry.
Aggregate Imaging System and Equations 2.3.2.6
AIMS provides information about the aggregate shape and texture. The aggregate imaging system (AIMS) captures aggregate characteristics in terms of shape, angularity, and surface texture through image processing and analysis techniques. The shape and texture of the chip seal aggregate shows the angularity and sphericity of each particle which affect the quality of the bond formed between the aggregate and the binder (Gransberg et al. 2005). Findings of previous research shows that these parameters influence the performance. For example, an angular aggregate has better bond than a smoother one. On the other hand, the sphericity relates to the ease with which the aggregate can be placed during construction. During rolling, the individual particles are reoriented to their least dimension and embedded in the binder. If proper embedment is achieved, the probability of premature loss of aggregate is minimized (Gransberg et al. 2005). The AIMS is able to provide all necessary information regarding the angularity, sphericity, form and texture analysis. The aggregate imaging system uses a camera and imaging software to calculate the angularity, sphericity and texture of tested aggregate. The aggregate images are taken using different lighting schemes and pictures are taken at different resolutions. The series of images that are generated can be analyzed to quantify aggregate shape properties. The following section summarizes the different aggregate particle shape characteristics.

14
Angularity (Gradient): Angularity, a measurement of the roundedness of particles, plays a major role in the final skid resistance of pavements. The principle of the gradient method is that the direction of the gradient vector changes fast for the aggregates having sharp particle images while the direction changes slowly along the profile of rounded particles. The angularity index is calculated by the sum of angularity values for all the boundary points accumulated around the edge of the aggregate particle whose values are calculated by the values of angle of orientation of these edge points (ϴ) and the magnitude of difference of these values (Δϴ). The calculation process is mathematically shown as Equation 2.1. In this equation, (n) is the total number of points on the edge of the particle with the subscript i denoting the ith point on the edge of the particle (Masad 2005).
Angularity Index (Gradient Method) =3
30/ /
n
i iθ
θ θ−
+=
−∑ (2.4)
Angularity (Radius): Masad’s study analyzes angularity by using black and white images and the method of the radius (Masad et al. 2001). In this method, the angularity index is a measurement of the sum of the difference between the particle radii in a specific direction to that of an equivalent ellipse, where the radius of the particle at an angle of ϴ is represented as Rϴ, and the radius of the equivalent ellipse at an angle of ϴ is represented as REEϴ. The angularity index can be calculated by Equation 2.2 (Masad et al, 2001):
Angularity Index (Radius Method) = e0(/ R /) /
n
EE EER Rθ θθ =
−∑ (2.2)
Sphericity: Sphericity is a measurement of the roundness of the shape of a particle in three dimensions. The value of sphericity index is from 0 to 1, higher values means closer to fully sphere shape, while lower values means more flat and/or elongated shape. The longest, intermediate, and shortest dimension are represented as (dL), (dI) and (ds) respectively, which are used in the Equations 2.3 and Equation 2.4 for sphericity and shape factor. (Gransberg et al. 2010)

15
Sphericity = (ds d1 dL2)1/3 (2.3)
Shape Factor=ds /(dL d1) ½ (2.4)
Texture: The texture index is measured by taking a grayscale image of the surface of the particle. Wavelet method is usually used to measure surface texture. Both short high-frequency basis functions and long low-frequency basis functions are used in this method to isolate coarse variations and fine variations in texture measurement. The texture index is then calculated as the sum of squares of the values for all parts of the particle as shown in the Equation 2.5 (Masad 2005).
Texture Index = 1/3N*3
2,
1 1(D (x, y))
N
i ji j= =∑∑ (2.5)
In this equation, N represents number of parts in image to calculated texture; i takes values for the three detailed images of texture; j is the wavelet value index; (x, y) is the location of the parts in the transformed domain (Masad 2005).
Recent research has shown that AIMs texture measurements are sensitive to aggregate shading and color (Roque et al. 2013). The aggregates for this study are relatively similar in color and shading. Due to the similarities in color for this research project, the associated challenges with using texture are likely reduced but potential for influence should be considered when evaluating conclusions.
2.4 CHIP SEAL DESIGN
Design of a chip seal system has two primary approaches: (1) incorporate a systematic approach robust to changes or (2) develop design parameters that are consistently measured and easily adjustable. In the New Zealand approach, existing roadway conditions are taken into consideration such as existing seals, macrotexture, hardness of the surface, pavement condition and structural capacity. Once the field conditions are evaluated, material selection takes place. Material selection must consider the best type of binder for the job, traffic and the budget constraints. Aggregate gradation, uniformity, angularity, resistance to degradation and absorption will play significant roles performance of chip seals. In Australia, agencies are willing to ship high quality aggregate materials long distances to ensure successful performance of their roadway surface treatments. Improved characterization of asphalt emulsions is slowly being implemented. Current standards and methods standards that provide little understanding of how, when and where the emulsions should be used leaving engineers to rely on experience rather than a scientific design process (Salomon 2006). The critical role of the asphalt in chip sealing is to ultimately adhere to the roadway surface as well as bond and embed the aggregate. Chip seals aggregates work with the binder to create a surface-layer system within the larger pavement structure. Research has shown that aggregate-emulsion interaction is a significant factor in chip retention (Rahman et al. 2012).
Chip seals should be thought of as an engineered system (Gransberg et al. 2010, Gransberg and James 2005). Current research has focused considerably on binder application rates and aggregate material characteristics whose performance is of utmost importance but are not the

16
only consideration for successful chip seal design and subsequent performance. Consideration of the overall pavement system is required. Knowledge of underlying pavement performance and materials establish overall suitability of the roadway for chip seal. Traffic can play a key role in the success of a surface treatment and special design considerations are necessary with high average daily traffic (ADT) (Shuler 1990). Research has progressed by improving methods of material characterization and many states now collect pavement management information system data to track performance but current chip seal design approaches have fallen short of implementing the newest findings on a national level.
The major hurdle for agencies trying to implement a robust pavement preservation program is the lack of rational chip design methodologies that can be incorporated into design and construction specifications. A design framework grounded in engineering design principles based on quantifiable measurements will lead to broader implementation and improved guidance. The design will act as a conduit of information in the construction process. A proper design coupled with sound construction techniques will be the most effective way to achieve the greatest benefit of the preservation application.
Nationally and internationally, rational chip seal designs were developed more than 60 years ago by Hanson (Hanson 1934-35, Hanson 1955) and Kearby (Kearby 1953). The McLeod chip seal methodology expanded chip seal design in the 1960’s (McLeod 1960, McLeod 1969) and was improved by Epps in the early 1980’s (Epps et al. 1981). A great deal of research on chip seals has been performed in Australia, Canada, New Zealand, South Africa, the United Kingdom, and the United States (Beatty et al. 2002, Broughton et al. 2012, Gransberg and James 2005). Best practices, design techniques and specifications that have been used successfully for decades can be easily implemented broadly and tailored to roadway agencies throughout the U.S. This proposal works to leverage the investments made by domestic and international agencies with well-established chip seal design procedures and construction specifications. Implementation of the best design practices and construction techniques will lead to longer performing chip seals, larger cost savings and lower user delays. New Zealand’s considerable success with chip seals has led to a requirement of 25,000 ADT before a roadway is a candidate for hot mix asphalt (HMA) (Gransberg 2005).
2.4.1 McLeod Design
A General Method of Design for Seal Coats and Surface Treatments is advocated by McLeod. According to McLeod Chip seal design consists of three variables which are:
• Binder Application Rate
• Aggregate Application Rate
• Traffic, climate, and existing surface condition.

17
McLeod Binder Application Rate 2.4.1.1
The main concept behind indicating a binder application rate is to ensure that there is enough binder to hold the aggregates in place, but not so much that the binder fills, or is forced by traffic action to cover the aggregate. The average least dimension can be determined by Equation 2.6 (Caltrans Division of Maintenance 2003):
𝑯𝑯 = 𝑴𝑴𝟏𝟏.𝟏𝟏𝟏𝟏𝟏𝟏𝟏𝟏𝟏𝟏𝟏𝟏
+ (𝟎𝟎.𝟎𝟎𝟏𝟏𝟏𝟏𝟏𝟏𝟎𝟎𝟎𝟎) ∗ 𝑭𝑭𝑭𝑭 (2.6)
Where: H = Average Least Dimension, or (ALD) M = Median Particle Size FI = Flakiness Index
Moreover, ASTM C29 is used to measure the loose unit weight. This approximates the voids in the loose aggregate when it is dropped onto the pavement. The voids in this state are assumed as 50% for cubical single size aggregate and lower for well-graded aggregate. It is assumed that once rolled a cubical aggregate will reduce its unit weight to a point where the voids content is 30% and finally to 20% once trafficked. These
Figure 2.2: Effects on voids in cubical aggregate (California Division of Maintenance 2003; FHWA 1992)

18
assumptions are adjusted when using well graded aggregates. Figure 2.2 shows the average least dimension (ALD) concept, along with the effects of flakiness and changes in voids based on compaction. ALD is the average of the smallest dimension of the aggregate.
The voids in loose aggregate may be calculated using Equation 2.7 (Caltrans Division of Maintenance 2003):
𝑽𝑽 = 𝟏𝟏 −𝑾𝑾/(𝟏𝟏𝟎𝟎𝟎𝟎𝟎𝟎 ∗ 𝑮𝑮) (2.7)
Where: V = Voids in the Aggregate W = Loose Unit Weight of the Aggregate G = Bulk Specific Gravity of the Aggregate Most design methods calculate the specific requirements for each job by considering the required corrections in addition to the basic application rate (the rate designed to result in 70 percent embedment).
Finally, calculating the binder content can be measured using Equation 2.8 (Caltrans Division of Maintenance 2003):
𝑩𝑩 = [0.40 (H) × T × V + S + A + P] / R) (2.8)
Where: B = Binder Content (l/m2) H = ALD (mm) T = Traffic Factor – (See Table 2.3) V = Voids in Loose Aggregate (%) S = Surface Condition Factor (l/m2) A = Aggregate Absorption (l/m2) P = Surface Hardness Correction for Soft Pavement (L/m2) R = Percent Binder in the Emulsion (%) (Provided by emulsion manufacturer)
Corrections to the basic application rate for the aggregate address variables that affect the level to which it becomes embedded in the binder. The corrections are ultimately applied to the calculation of the binder application rate. These variables include:
• Aggregate Characteristics
• Traffic Volume
• Existing Pavement Condition
• Embedment

19
Aggregate Characteristics Considered in McLeod Design: 2.4.1.2
Two important aggregate characteristics include absorption and shape. Corrections for absorption are based on experience and the characteristics of the local aggregates. Chip shape effects are variable: rounded chips leave greater voids and do not interlock and are not recommended. This type of chip also requires additional binder. Non-uniform sized aggregates produce uneven surfaces. Figure 2.3 displays both rounded and non-uniform chip applications (Gransberg and James 2005).
Traffic Volume adjustments in the McLeod Design 2.4.1.3
This factor accounts for the role that traffic volumes play in achieving the ultimate embedment of 80 percent (20 percent void space). Table 2.3 lists the application rate correction factors associated with varying traffic levels.
Table 2.2: Application Rate Correction (Caltrans 2003).
Vehicles/ Day
0-100 101-500 501-1000 1001-2000 >2000
Correction Factor
0.85 0.75 0.7 0.65 0.6
McLeod Design Loss of Aggregate Due to Traffic (Traffic Whip-Off) 2.4.1.4
A traffic whip-off correction factor mainly accounts for the effects of traffic operations on removing aggregates from newly chip sealed roads. Table 2.4 lists road types and associated whip-off correction factors.
Figure 2.3: Rounded and Non-uniform Aggregates (California Division of Maintenance 2003; South Australian Department of Transportation 1995)

20
Table 2.3: Whip-off Correction Factor (Caltrans 2003)
Road Type Percent Wastage (%) Whip off Factor (E)
Rural & Residential 5 1.05
Higher Volume Roads 10 1.10
State High Ways 15 1.15
McLeod Considerations for Existing Pavement Condition 2.4.1.5
Existing pavement conditions play a very important role in determining the optimum binder content. Table 2.5 details the correction factors associated with various existing pavement conditions.
Table 2.4: Existing pavement condition factor (Caltrans 2003).
Existing Pavement Correction (l/m2)
Black, flushed asphalt -0.04-0.27 (depending on severity)
Smooth, non-porous or smooth 0
Slightly porous and oxidized or matte +0.14
Slightly pocked, porous, and oxidized +0.27
Badly pocked, porous and oxidized +0.4
McLeod Considerations for Embedment 2.4.1.6
Aggregates may be punched or embedded into soft pavement surfaces by roller compaction and traffic. Table 2.6 provides corrections based on surface hardness and relate traffic volume using a ball penetrometer test. It is anticipated these values may have to be adjusted as the design is implemented in Oregon.

21
Table 2.5: Embedment Factor (Caltrans 2003).
Surface Hardness
Traffic Volume (AADT per Lane)
150-300 300-625 625-1250 1250-2500 >2500
Hard (ball value 1-2)
Nil Nil Nil -0.1 L/m2 -0.21 L/m2
Hard (ball value 3-4)
Nil Nil -0.1 L/m2 -0.2 L/m2 -0.3 L/m2
Soft (ball value 5-8)
-0.1 L/m2 -0.1 L/m2 -0.2 L/m2 -0.3 L/m2 -0.4 L/m2
McLeod Aggregates Application Rate 2.4.1.7
Calculation of the design aggregate application rate is based on determining the amount of aggregate needed to create an even, single coat of chips on the pavement surface. The amount of cover aggregate required can be determined using Equation 2.9 (Caltrans 2003).
𝑪𝑪 = (1 - 0.4V) × H × G × E (2.9)
Where: C = Cover Aggregate (kg/m2) V = Voids in Loose Aggregate (%) H = ALD (mm) G = Bulk Specific Gravity E = Wastage Factor (%)
2.4.2 New Zealand Design
The first published work describing any kind of rational design of single coat seals was a paper by F.M. Hanson, presented to the New Zealand Society of Civil Engineers in 1935 (Hanson, 1934). Hanson found that chips when first placed on the binder, had a percentage of voids of 50%, which reduced to 30% by construction rolling, and further to 20% by traffic compaction. This resulted in a single layer of chips that is bedded with shoulder-to-shoulder contact after trafficking. Hanson’s conclusion was that, for a successful seal on a smooth surface, the rate of binder application should be such that the 20% of voids volume after trafficking become 70% filled with binder. He expressed this as a simple formula as shown in Equation 2.10 (The NZ Transport Agency, 2015):
𝑹𝑹 = 𝟎𝟎.𝟏𝟏𝟏𝟏 𝑨𝑨𝑨𝑨𝑨𝑨 (𝟏𝟏.𝟏𝟏𝟎𝟎)
Where: R = residual binder application rate (liter/m2) ALD = Average least dimension of the chip (mm)

22
In the 1960’s more studies and experimental work was proceeded and they developed a very similar equation to Hanson’s but includes an allowance for the existing texture and a varying application rate for traffic volume. Equation 2.11 is as follows (NZTA 2015).
𝑹𝑹 = (𝟎𝟎.𝟏𝟏𝟏𝟏𝟏𝟏 𝑨𝑨𝑨𝑨𝑨𝑨 + 𝒆𝒆) 𝑻𝑻𝑻𝑻 (𝟏𝟏.𝟏𝟏𝟏𝟏)
Where: R = residual binder application rate (liter/m2) ALD = Average Least Dimension of the chip (mm) e = a surface texture correction factor (liter/m2) Tf = an adjustment factor for traffic
In the New Zealand design, the texture depth plays a very important role. If the existing surface has significant texture depth (i.e. macrotexture), this first needs to be filled with binder before enough binder is left available to secure the new chip. Allowance for this is made by increasing the binder application rate. The texture depth is determined by using the sand circle test in which the diameter of the circle that a standard volume of sand makes when spread on the substrate surface is measured, see Figure 2.4. The test is following TNZ T/3:1981 specification (Transit New Zealand 1981). The relationship between ‘e’ and texture depth was determined during the 1965–66 state high way trials that developed using Equation 2.12.
𝒆𝒆 = 𝟎𝟎.𝟏𝟏𝟏𝟏𝑻𝑻𝟐𝟐 − 𝟎𝟎.𝟎𝟎𝟏𝟏 (𝟏𝟏.𝟏𝟏𝟏𝟏)
Where: Td = texture depth (mm) derived from the sand circle test e = the surface correction factor (liters/m2)
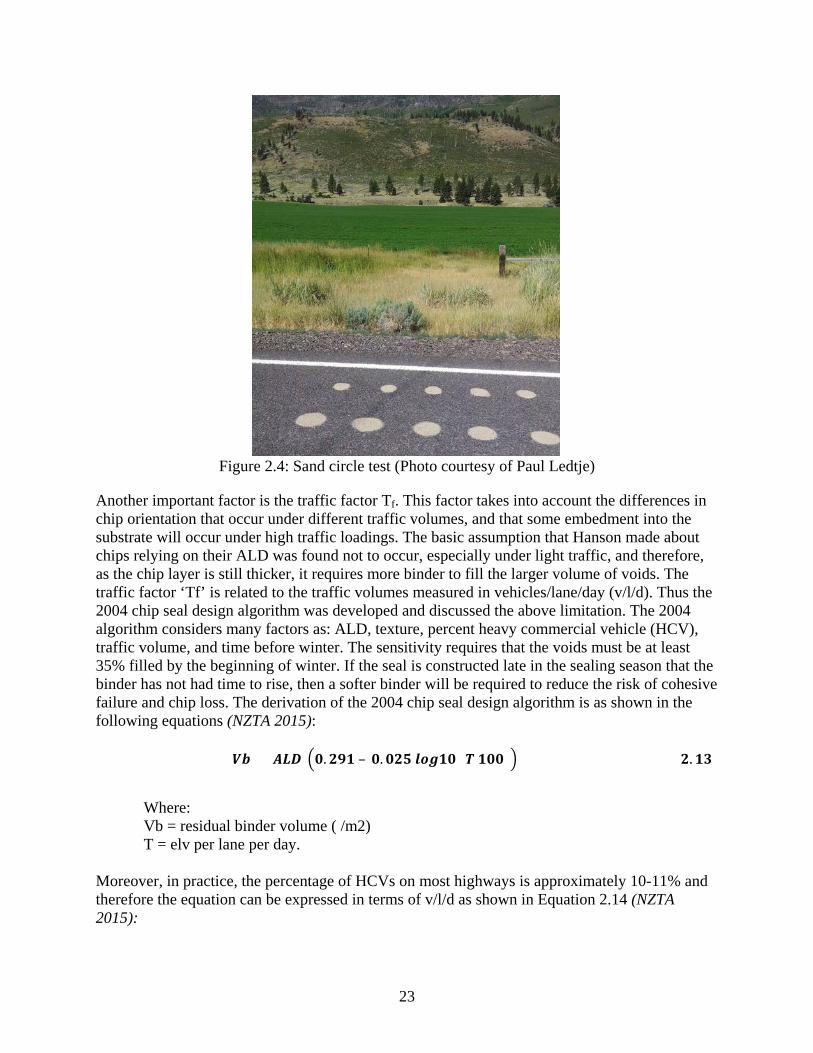
23
Figure 2.4: Sand circle test (Photo courtesy of Paul Ledtje)
Another important factor is the traffic factor Tf. This factor takes into account the differences in chip orientation that occur under different traffic volumes, and that some embedment into the substrate will occur under high traffic loadings. The basic assumption that Hanson made about chips relying on their ALD was found not to occur, especially under light traffic, and therefore, as the chip layer is still thicker, it requires more binder to fill the larger volume of voids. The traffic factor ‘Tf’ is related to the traffic volumes measured in vehicles/lane/day (v/l/d). Thus the 2004 chip seal design algorithm was developed and discussed the above limitation. The 2004 algorithm considers many factors as: ALD, texture, percent heavy commercial vehicle (HCV), traffic volume, and time before winter. The sensitivity requires that the voids must be at least 35% filled by the beginning of winter. If the seal is constructed late in the sealing season that the binder has not had time to rise, then a softer binder will be required to reduce the risk of cohesive failure and chip loss. The derivation of the 2004 chip seal design algorithm is as shown in the following equations (NZTA 2015):
𝑽𝑽𝑽𝑽 = 𝑨𝑨𝑨𝑨𝑨𝑨 �𝟎𝟎.𝟏𝟏𝟏𝟏𝟏𝟏 – 𝟎𝟎.𝟎𝟎𝟏𝟏𝟏𝟏 𝒍𝒍𝒍𝒍𝒍𝒍𝟏𝟏𝟎𝟎 (𝑻𝑻 𝟏𝟏𝟎𝟎𝟎𝟎)� (𝟏𝟏.𝟏𝟏𝟏𝟏)
Where: Vb = residual binder volume ( /m2) T = elv per lane per day.
Moreover, in practice, the percentage of HCVs on most highways is approximately 10-11% and therefore the equation can be expressed in terms of v/l/d as shown in Equation 2.14 (NZTA 2015):

24
𝒆𝒆𝒍𝒍𝒆𝒆 =2.0 v/l/d (2.14)
In which the factor of 2.0 can be considered to be a heavy vehicle factor ‘Tf’. Finally, the basic equation that can be used for determining application rates (Vb) assuming 11% HCVs is as follows in Equation 2.15 (NZTA 2015):
𝑽𝑽 = (ALD + 0.7 Td) (0.291 – 0.025 log10 (2.0 v/l/d 100)) (2.15)
Where: Td = texture depth (mm) derived from the sand circle test
2.5 RECENT CHIP SEAL RESEARCH
In 2011, NCHRP published Report 680: Manual for Emulsion-Based Chip Seals for Pavement Preservation. The report discusses factors influencing emulsion-chip seal performance, design, seal types, materials, construction considerations and quality control. The study provided laboratory procedures including the modified sweep test to determine time before sweeping and traffic and estimated embedment depth. The study shows good correlation between the Wagner cup flow and Saybolt viscosity but ultimately recommends using rheological properties to evaluate emulsions (Shuler 2011). In the New Zealand chip seal design method, the emulsion application rates can be adjusted to account for surface texture changes in the roadway. Also, depth of embedment will change based on the stiffness of the substrate. The softer the underlying roadway, the more the chips will be embedded into the roadway surface (Read and Whiteoak 2003).
According to the chip seal syntheses, a majority of U.S. public road agencies rely on empirical design methods which in some cases are no more than methods to calculate estimated quantities of binder and aggregate to create a unit price contract. The chip seal designs used in countries with mature pavement preservation programs provide a meaningful laboratory design for field construction.
The overseas experience is easily translated to the US. New Zealand has done the most extensive adaptation of chip seal design and as a result, furnishes a ready model for how to adapt the chip seal design methods to account for local requirements.
Preparation for chip seal projects can include laboratory and construction performance evaluations. In a published Oklahoma chip seal report, the field performance findings correlated with the Aggregate Imaging System (AIMS) and the Performance Uniformity Coefficient (PUC). As a result of the excellent correlations to performance, chip seal specifications and best practices for the Oklahoma DOT were develop and implemented (Zaman et al. 2013). One of the challenges facing Oregon is climate is regionally variable (high-precipitation, mountains, and desert areas).
Recently, Minnesota performed an analysis of determining how long a pavement preservation technique needs to last in order to be considered cost-effective. This analysis highlighted the large cost disparity between rehabilitation and preservation techniques using recent cost data (Wilde et al. 2014). The cost disparity is likely to grow when improved performance is recognized as more improved designs and construction specifications are implemented for chip

25
seals. Pittenger et al. extensively analyzed life-cycle cost analysis (LCCA) for pavement preservation techniques. The recommended analysis employs the equivalent uniform annual cost to allow practitioners to better relate the annual maintenance budget with LCCA output (Pittenger et al. 2011). True construction data and stochastic life cycle cost analysis can be used to better predict the overall LCCA of preservation techniques (Pittenger et al. 2012).
Chip seal design can be adjusted for roadways with heavy bicycle traffic by using finer chips to provide a smoother surface with increased uniformity (Li and Thigpen 2013). Other considerations for bicycles may include only chip sealing the main-line traffic area and leaving a smoother surface on the shoulder. A study in California correlated mean profile depth, similar to mean texture depth, with roadways that bicyclists considered “acceptable” pavement and bicycle ride quality level. The Figure 2.5 illustrates the percentage of bicyclists who found a roadway acceptable as a function of mean profile depth. This study also found that tire pressure and sociodemographic variables such as recent rider mileage and cycling companionship influenced the results (Li et al. 2013). Other likely influencing factors include the type of tire, the type of bicycle and bicycle suspension.
Figure 2.5: Percentage of bicyclists who consider a roadway “acceptable” as a function of mean
profile depth (adopted from Li and Thigpen 2013)
2.6 CHIP SEAL PERFORMANCE
There are many aggregate characteristics that would affect the chip seal performance. Therefore, various laboratory and field tests are conducted to ensure proper chip seal design especially in big projects or if problems occur in segments and the design needs to be readjusted. The most used laboratory testing includes Aggregate imaging system (AIMS) to determine aggregate shape and texture properties, Los Angeles Abrasion test and Micro-Deval tests (Masad 2005). Moreover, Sessile Drop and Universal Sorption Device are other tests that evaluate aggregate-binder compatibility. Finally, field testing includes measurement of micro texture and macrotexture.
0102030405060708090
100
1.5 1.7 1.9 2.1 2.3 2.5 2.7 2.9
Perc
enta
ge o
f bic
yclis
ts th
at
cons
ider
ed th
e ro
ad "a
ccep
tabl
e", %
Mean Profile Depth, mm
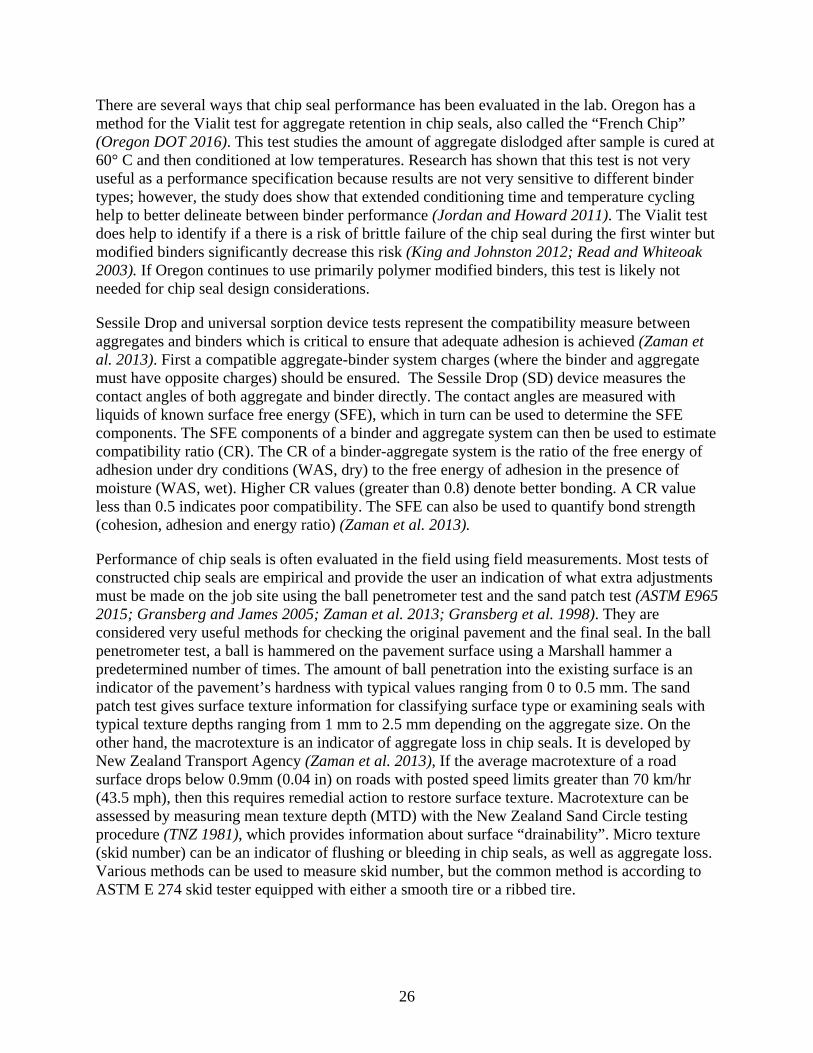
26
There are several ways that chip seal performance has been evaluated in the lab. Oregon has a method for the Vialit test for aggregate retention in chip seals, also called the “French Chip” (Oregon DOT 2016). This test studies the amount of aggregate dislodged after sample is cured at 60° C and then conditioned at low temperatures. Research has shown that this test is not very useful as a performance specification because results are not very sensitive to different binder types; however, the study does show that extended conditioning time and temperature cycling help to better delineate between binder performance (Jordan and Howard 2011). The Vialit test does help to identify if a there is a risk of brittle failure of the chip seal during the first winter but modified binders significantly decrease this risk (King and Johnston 2012; Read and Whiteoak 2003). If Oregon continues to use primarily polymer modified binders, this test is likely not needed for chip seal design considerations.
Sessile Drop and universal sorption device tests represent the compatibility measure between aggregates and binders which is critical to ensure that adequate adhesion is achieved (Zaman et al. 2013). First a compatible aggregate-binder system charges (where the binder and aggregate must have opposite charges) should be ensured. The Sessile Drop (SD) device measures the contact angles of both aggregate and binder directly. The contact angles are measured with liquids of known surface free energy (SFE), which in turn can be used to determine the SFE components. The SFE components of a binder and aggregate system can then be used to estimate compatibility ratio (CR). The CR of a binder-aggregate system is the ratio of the free energy of adhesion under dry conditions (WAS, dry) to the free energy of adhesion in the presence of moisture (WAS, wet). Higher CR values (greater than 0.8) denote better bonding. A CR value less than 0.5 indicates poor compatibility. The SFE can also be used to quantify bond strength (cohesion, adhesion and energy ratio) (Zaman et al. 2013).
Performance of chip seals is often evaluated in the field using field measurements. Most tests of constructed chip seals are empirical and provide the user an indication of what extra adjustments must be made on the job site using the ball penetrometer test and the sand patch test (ASTM E965 2015; Gransberg and James 2005; Zaman et al. 2013; Gransberg et al. 1998). They are considered very useful methods for checking the original pavement and the final seal. In the ball penetrometer test, a ball is hammered on the pavement surface using a Marshall hammer a predetermined number of times. The amount of ball penetration into the existing surface is an indicator of the pavement’s hardness with typical values ranging from 0 to 0.5 mm. The sand patch test gives surface texture information for classifying surface type or examining seals with typical texture depths ranging from 1 mm to 2.5 mm depending on the aggregate size. On the other hand, the macrotexture is an indicator of aggregate loss in chip seals. It is developed by New Zealand Transport Agency (Zaman et al. 2013), If the average macrotexture of a road surface drops below 0.9mm (0.04 in) on roads with posted speed limits greater than 70 km/hr (43.5 mph), then this requires remedial action to restore surface texture. Macrotexture can be assessed by measuring mean texture depth (MTD) with the New Zealand Sand Circle testing procedure (TNZ 1981), which provides information about surface “drainability”. Micro texture (skid number) can be an indicator of flushing or bleeding in chip seals, as well as aggregate loss. Various methods can be used to measure skid number, but the common method is according to ASTM E 274 skid tester equipped with either a smooth tire or a ribbed tire.

27
2.7 CHIP SEAL CONSTRUCTION AND PERFORMANCE MONITORING
There are many considerations regarding the chip seal construction and performance monitoring. These steps include preparation of surface, materials, weather conditions, traffic control, joints and equipment (Caltrans Division of Maintenance 2003).
2.7.1 Preparation of Surface
Preparation of the surface is one of the most important factors in the performance of chip seal pavements. A clean, dry surface at a temperature suitable for the emulsion is important. Check for favorable weather conditions prior to cleaning. Potholes should be patched and, if present, large cracks should be sealed. According to a report by Gransberg, patches should be completed at least six months in advance and crack seals should be applied at least three months before chip seal application (Gransberg and James 2005). This will help promote better adhesivity between the patch/asphalt sealer and the chip seal binder application. Roads with significant structural failures should be carefully evaluated for chip seal suitability. It is also important to avoid the use of cold mix for patching prior to applying the chip seal (Caltrans Division of Maintenance 2003). The prepared surface must be clean, dry and free of any loose material before applying the binder. Motorized brooms that can apply a vertical pressure should be used to clean and remove the surface (Wood et al. 2006). Preparation for a chip seal project may include: (1) milling of the surface (not typical for Oregon), (2) crack sealing, (3) patching any deteriorated areas, (4) cleaning/ brooming any loose material from the surface and finally (5) removing pavement markers and delineators.
In areas where asphalt emulsion may spray onto iron surfaces, provide suitable coverage such as plywood disks over manholes (Wood et al. 2006).
2.7.2 Materials
Asphalt binders and Aggregate characteristics have been discussed in Sections 2.3.1 and 2.3.2 but there are construction considerations regarding these materials. Aggregate stockpiles should be located in well-drained areas and when possible, on a paved surface (Caltrans Division of Maintenance 2003). Handling and transport of aggregate can lead to break down aggregate particles. Use aggregate that is durable and avoid excessive handling of aggregates. Chip seals typically use uniformly graded aggregate; however, if aggregate with a broader particle size gradation is used, ensure stockpiling practices do not create unintended segregation. The stockpile should be protected from contamination with foreign material. If contamination occurs, the aggregates should be washed on screens and loaded on a conveyer where it can dry. If washing is not an option and only dusty aggregates persist, wetting agents in high-float medium-set emulsions can be used at up to 5% passing #200 (Wood et al. 2006). Working closely with emulsion suppliers will be important when executing this option. According to TxDOT, when using dusty and possibly very absorptive aggregates, an anionic emulsion will be better than a cationic such as HFRS-2 or HFRS-2P (TxDOT 2005). This can also be done for dusty limestone and pre-coating could be performed for the limestone material as well. According to TxDOT guidance, the anionic emulsions will not cure as fast as the cationic emulsions.

28
If stockpiling at a job site, any remaining aggregate left after chip seal construction must be removed from the stockpile site and the site restored to its original condition before being used as a stockpile site (Caltrans Division of Maintenance 2003).
2.7.3 Weather Conditions
Oregon specifications limit chip sealing to two months, July and August. The preferred weather should be clear, dry and warm. Weather can impact the hardness of an asphalt pavement surface and the higher the temperature, the more influence the binder properties have on the stiffness of the roadway. Field inspectors and supervisors should come to an accord if the weather conditions are suitable for chip sealing (Wood et al 2006). In cooler weather and when aggregate may be damp, emulsified asphalts are more favorable. If pavement temperatures are high, a hot-applied cement binder will be more appropriate. In general, pavement surface temperatures should be 10°C (55°F) and rising, and the humidity should be 50% or lower. Gransberg found that agencies who specified increased the temperature specifications experienced better chip seal performance (Gransberg 2007). Like all materials, asphalt emulsions expand when they are heated which can be useful but too high of application the high temperatures and humidity would delay the breaking of the emulsion. Wind may also cause the emulsion spray to be diverted and compromise uniformity of application rate. A gentle breeze will assist in accelerating curing times. Any rainfall immediately before, during or after the construction of the chip seal will contribute to failure of the treatment. Thus, placement of chip seals should be avoided during such conditions.
2.7.4 Traffic Control
Chip seals fall into the category of a mobile work zone but are often opened up to traffic prior to final brooming. This actually helps work the cover aggregate into the binder layer however, during this period, the chip seal is especially susceptible to damage from high shearing or tangential forces and drives are most prone to windshield cracks. Traffic must be kept at a low speed such as 20 mph. The inspector must approve the traffic control plan. The signs and devices used must match the traffic control plan. All workers must have all required safety equipment and clothing. After chipping, pilot cars should be used for between 2 and 24 hours to ensure that traffic speed is limited to approximately 30 kph (20 mph) (Caltrans Division of Maintenance 2003). Ensure that any traffic control devices or structures in the roadway are protected from the binder application.
2.7.5 Joints
Joint deterioration is a common problem for pavements. Deteriorated joints should be repaired prior to chip sealing (Wood et al. 2006). The longitudinal joints typically have higher voids compared to the travel lane. This can result in higher absorption of the binder at the joint, resulting in a higher aggregate loss. The centerline also tends to be more prone to snowplow damage. To address both of these challenges, the Minnesota seal coat manual recommends a 2-3 ft. wide fog seal application at a rate of 0.02-.2 gallons/sy using CRS-2 emulsion. After the fog seal has fully cured, the chip seal can be placed.
29
Chip seal passes should begin and end on felt paper. This ensures that the transverse joints are clean and sharp. Longitudinal joints may be made with an overlap. In this process a wet edge of 75 to 100 mm (3 to 4 in) is left and the next run overlaps this wet edge (Caltrans Division of Maintenance 2003).
2.7.6 Equipment
Chip seal equipment primarily consists of (Gransberg and James 2005):
• Asphalt binder distributors,
• Aggregate (chip) spreaders,
• Rollers,
• Dump trucks, and
• Sweeping equipment.
Spraying Equipment and Distributor 2.7.6.1
The main purpose of the distributor is to uniformly apply the binder over the surface at the designed rate. This uniformity and rate control are critical to the chip seal success. Typically, spray distributors are truck mounted, but trailer units have also been used. A distributor should have a heating, circulation, and pumping system, along with a spray bar, and all necessary controls to guarantee proper application. To verify application rate, the following formula can be used (Asphalt Institute 2009):
𝑹𝑹 = 𝑻𝑻𝑴𝑴𝑾𝑾𝑨𝑨
(2.16) Where: R = Rate of application, gallons/square yard (liter/square meter) T = Total gallons (liters) applied W= Width of spread, yards (meters) L = Length of spread, yards (meters) M = Multiplier for correcting emulsion volume to basis of 60°F
In 2005, 63% of agencies in the US and Canada specified computerized asphalt distributers and many manufacturers offer binder distributors with parallel spray bars that enable variable spray rates across the lane (Gransberg and James 2005). This study also found that 88% of the international agencies specified the computerized distributors.
If the distributer pressure is too low, the binder may result in streaking. If high pressure is applied, the pressure will distort the fan (Asphalt Institute 2009). The pumping speed and pressure settings may need to be adjusted for the type of asphalt emulsion.
The distributer height should be adjusted to the proper height to allow for a double or triple coverage. The nozzle spacing will dictate whether double or triple coverage can be

30
achieved. AI explains that best results are achieved for a 4-inch nozzle spacing when triple coverage is set but with 6-inch nozzle spacing, the spray bar height will become too high to evenly apply triple coverage. Higher bar heights make the uniform spray more difficult and wind will impact the spray uniformity. The uniformity of the binder application should be closely followed because even if the application rate is kept constant, pavement surfaces can be non-uniform. When this occurs in the field, the binder rate may need to be adjusted. The reality of chip seal design is that a binder is applied to a non-uniform substrate that may absorb more or less in certain areas. The chip seal design provides a design rate that has a higher likelihood of success, and can be adjusted based on the dynamic environmental conditions. One calibration standard is ASTM D2995, Standard Recommended Practice for Determining Application Rates of Bituminous Distributers (ASTM D2995 2014). Checking calibrations of binder distributers at the beginning of every season is recommended to ensure accurate applications. Minnesota seal coat manual recommends calibrating the distributor on day one of chip seal activities (Wood et al. 2006).
The asphalt distributor uses pumps to move the asphalt throughout the system during loading, circulation, pumping material to the spray bar, pulling material back from the spray bar and when pumping material back into a storage tank (Asphalt Institute 2009). The pumping speed will create pressure in the lines, controlling the spray from distributer nozzles.
Distributor Preparation The steps associated with preparing the distributor include (Caltrans Division of Maintenance 2003):
1. Calibrate the distributor by spraying a pre-weighed area of carpet and subtracting the initial weight from that of the sprayed carpet, then dividing the difference by the area of the carpet. Although this is the responsibility of the contractor, the inspector should verify that the distributor is spraying the binder at the correct application rate.
2. Blow the spray nozzles to ensure there are no blockages and checking the nozzle angles to ensure they spray at an angle 15 to 30 degrees from the spray bar axis. Often, the outer-most nozzles will be turned in to give a sharp edge with no over spray. This should NOT be permitted. Instead, half-spray end-nozzles should be used. Deflector shields and turning nozzles to a different angle (60-90 degrees with respect to the spray bar) at the edge of the distributer will produce a heavier streak of binder application at the edge and disrupt the spray from the adjacent nozzle. Best practices recommend using a special end nozzle and setting all nozzles to the same angle (Asphalt Institute 2009), however, there is conflicting reports with the FHWA checklist recommending the end nozzle be turned 90° (FHWA 2002).
3. Check the distributor bar’s height. The height is usually set so that a double or triple overlap is obtained.
4. Check the distributor bar’s transverse alignment to ensure it is closely perpendicular to the centerline of the pavement

31
5. Check the binder temperature to ensure it is in the appropriate range for proper application. Chip seal emulsion should be between 40 and 85 °C (104 and 185°F)
Chip Seal Spreader 2.7.6.2
Chip spreaders must be able to spread an even coating of aggregate one layer thick over the entire sprayed surface. The steps associated with preparing the chip seal spreader include the following (Caltrans Division of Maintenance 2003):
1. Calibrate the spreader by spreading chips over a pre-weighed area of carpet and subtracting the initial weight from that of the carpet with chips spread onto it, then dividing the difference by the area of the carpet.
2. Ensure all gates in the spreader open correctly.
3. Ensure the spreader applies the aggregate is an even, single-layer thickness.
4. Ensure that the spreader is not leaving piles of aggregate and is not spreading too thick a layer.
5. Ensure an adequate supply of aggregate is available prior to applying the binder.
The Chip Spreading Process involves the following:
1. The application of aggregate should follow the binder application by no more than 90 seconds in order to obtain the best possible aggregate retention.
2. A good visual check is that the spreader should be no more than 100ft behind the distributor truck. The first chip spreading pass is usually done against traffic to allow good centerline match up.
3. The direction for spreading is chosen mostly to minimize truck movements on the fresh oil.
4. Visual checks of the spreading include checking that the aggregate does not roll or bounce when applied.
5. The flow of aggregate should also be checked. If a wave of binder forms in front of the blanket of aggregate, the binder application may be too heavy.
6. The scalping screen should also be checked for buildup of clay or other contaminants.
7. If such contamination is heavy, it may be necessary to re-screen the stockpile.
8. The spread pattern should be even without ripples or streaks. If ripples or streams occur, the spreading gates may need to be lowered and the machine slowed down.

32
Haul Trucks 2.7.6.3
Haul trucks are responsible for providing a continuous supply of binder to the site and aggregate to the spreader (Caltrans Division of Maintenance 2003). A front end loader is typically used to load the trucks (Wood et al. 2006). Tires on the trucks should be examined for binder pick up. If pick up occurs, it may severely damage the mat. Tires should be cleaned and sanded. Trucks should not drive on the new surface unnecessarily and should never brake sharply. When driving on the fresh mat, wheel paths should be staggered to assist in embedding the aggregate uniformly. When pulling away from the spreader, trucks should move smoothly and slowly to prevent wheel spin and mat damage.
Roller 2.7.6.4
The function of the roller is to embed the aggregate into the binder and orient it into an interlocking mosaic. This is initially accomplished with pneumatic rollers. Compaction applied by traffic finish the process. A picture of a pneumatic roller is shown in a following chapter discussing construction , Figure 4.5. Rolling should be expedited in hotter weather to ensure proper embedment of the aggregate (Caltrans Division of Maintenance 2003). Steel rollers are not normally recommended because they can crush the aggregate. The important variables when rolling chip seals are:
• Contact pressure
• Number of passes and pattern
• Speed
• Smoothness of tires
• Adequate number of rollers
Brooming 2.7.6.5
Brooming is required before, after, and sometimes during the chip seal operation. Before applying the chip seal, the pavement must be swept clean of dust and debris. During a multi-coat sealing operation, excess aggregate shall be broomed off between coats. After the chip seal has been constructed, excess aggregate must be broomed off to minimize whip-off by traffic. Brooming is done using rotary brooms with nylon or steel bristles or with vacuum mobile pickup brooms. The broom should not be worn, and should not be operated in such a manner that removes embedded aggregate. Mobile pickup brooms are usually capable of picking up aggregate and storing it. “Kick brooms” are sometimes used as they move the aggregate into a windrow so that is can be collected, but they often generate dust and may sweep aggregate into watercourses or gutters (Wood et al. 2006). Brooming can generally be done within two to four hours after sealing. Hot-applied chip seals can be swept within 30 minutes while conventional chip seals can be swept in two

33
to four hours. A fog seal can be applied after brooming to eliminate further rock loss and improve durability prior to opening the pavement to uncontrolled traffic.
2.8 FOG SEALS
Sometimes fog seals are placed over chip seals and help with performance and chip retention. They also reduce the amount of paint required to re-stripe the roadway (Wood and Olson 2011).
Fog seal is the application of asphalt emulsion to the surface of an aged/oxidized pavement surface. They are usually used to restore flexibility to an existing HMA pavement surface. Sometimes they are used specifically to temporarily postpone the need for surface repair through treatment or overlay. That is why it is considered a preventive maintenance method that has proven to be easy and effective for pavement preservation (Yang and Su 2006). It is named after its spray application, sometimes referred to as “fogging.” Emulsions used contain globules of paving asphalt, water, an “emulsifying agent”/ surfactant, and a “rejuvenator.” It is worth mentioning that using a thick emulsion would not penetrate efficiently to the surface pores leaving some parts of the asphalt particles on the surface. When the emulsion breaks, it will be expected to have a skid free pavement (Prapaitrakul et al. 2005). Soap is another common form of a surfactant. The surfactant role is to keep the paving asphalt globules in suspension until it is applied to the pavement surface after the water evaporates from the surface. On the other hand, a “rejuvenator” is applied to soften the pavement and provide a better bond (Johnson 2000). Additionally, rejuvenating oils play another role by filling the voids in the pavement and minimizing further emulsion oxidation (Prapaitrakul et al. 2005).
For construction steps, First, the surface should be prepared by ensuing that the surface is clean and any distresses are repaired. Fog seals are usually applied by asphalt distributors that should be calibrated to achieve uniform coverage. Spray nozzles with (1/8” to 3/16”) openings are recommended by the Asphalt Emulsion Manufacturers Association. Moreover, the emulsion is usually sprayed at ambient temperature but can sustain up till 122 °F. (Asphalt Emulsion Manufacturers Association 1990) usually a random section is tested to represent the entire surface to approximate application rates (California Department of Transportation 1990). Typical application rates for diluted emulsion (1:1) range from 0.15 to 1.0 liter/m2 (0.03 to 0.22 gal/yd2) depending on the surface conditions (Hicks and Holleran 2002).
Traffic control is another issue that should be addressed. Traffic control includes construction signs, construction cones and/or barricades, flag personnel, and pilot cars to direct traffic clear of the construction operation (Fog Seal Guidelines 2003). On the other hand, the curing time for the fog seal material vary depending on the pavement surface conditions and the weather conditions. Under ideal conditions, it is suggested that traffic be kept off the pavement at least two hours and acceptable skid test (CT 342) values are achieved (Fog Seal Guidelines 2003).
2.9 CHIP SEAL TROUBLESHOOTING
Chip seals are mainly used to provide better performance as well as including other service life benefits as enhanced skid values of the pavement, uniform looking surface and improved visibility of traffic lane striping. Chip seals have no structural capacity since they are effectively one rock thick (Zaman et al. 2013). In general, chip seals are generally effective in sealing the
34
cracks existing on roadway surface, unless there are the indicators of heavy base distresses. In this section, there will be identification to the different factors that contribute to chip seal possible failure modes and summarizing different preventive maintenance perspective methods including corrective maintenance, or in some cases emergency maintenance.
Texture loss is one of the defined main causes of chip seal failures. Texture loss could take place due to many reasons as the following which will be discussed in details (Lawson and Senadheera 2009; Gransberg and James 2005; Hicks and Daleiden 1999):
• Flushing
• Bleeding
Flushing occurs due to many reasons. One of which is due to high traffic occurrence and thus it takes place after the end of the design period. The seal flushes in the wheel paths before the binder has hardened and this leads to wearing of the chip and chip loss. On the other hand, premature flushing occurs when the binder application is higher for the traffic volume. It might also occur where the existing surface varies in texture or hardness. Chip embedment is another cause of flushing, if it is greater than normal. Other causes include the presence of softer substrates as first coat seals, fresh asphaltic concrete, new grader-laid asphalt, or OGEMs (open graded emulsion mix). Furthermore, repairs to poorly/weak constructed pavements, presence of water, binder-rich surface or the build-up of successive seals with an excess of bitumen >12% by weight might all be the reason of flushing (Hicks et al. 1999). Finally, Binder rise which is a natural phenomenon which occurs over the life of a chip seal and can cause flushing.
To avoid flushing in wheel paths, the design has to compromise between the wheel path application rate and the application rate that suits the rest of the road. Moreover, controlled trafficking during the first period can be also used to compact chip on areas outside the wheel paths. The previous mentioned methods are preventative methods that could be employed to avoid flushing. However, if flushing occurs, other basic maintenance methods could be addressed. One of which is to retexture the existing surface or to add a new textured surface over the flushed pavement. Many studies also promote the use of different materials with chip seals as lime water, or using ultrahigh pressure water cutting, or implement the racked-in seal at intersections (Lawson and Senadheera 2009).
Bleeding is another phenomenon that often take place during the chip seal performance and is caused by many factors (Hicks et al. 1999). Binder rise is one of the main reasons which occurs when the surface tension of the binder is broken and water movement upwards would take place. Pavements bleed if not flushed since truck tires indent up to 1.5 mm into the seals.
It is important to note that if bleeding is not treated promptly, tracking occurs with low skid resistance, damage to the seal could take place and the blackened top surface absorbs heat, and will become hotter than the original seal by 10°C or more (Lawson and Senadheera 2009). This hotter surface will help in spreading bleeding along the whole pavement width.
Bleeding can be avoided if the used binder is hard enough, the temperature is relatively cold, or the binder is contaminated with fines from the road surface (Gransberg and James 2005). Moreover, bleeding can be treated by applying a top layer aggregate of various types and

35
gradations, cooling off the pavement surface by applying water or additives, and removing the bleeding asphalt and rebuilding the pavement seal (Lawson and Senadheera 2009).
Chip loss is another defined main causes of chip seal failures (Lawson and Senadheera 2009; Gransberg and James 2005; Hicks and Daleiden 1999). Possible causes of chip loss include binder related problems as using cold binder, applying low application rates, binder oxidization, or other problems as traffic stress, cold weather, wet weather, lack of diluent or adhesion agent, repairing over previous weak layers or using un cleaned chips on the other hand, there are three main types of chip loss which are: stripping, attrition and scabbing. The first one occurs along wheel paths in long strips, the second one is worn away by friction and the third type includes chip loss from patches of chip seal (NZTA 2005).
Any area that is exposed to chip loss should be immediately addressed. Repairs might include the use of geotextile fabrics, OGM, use of granular overlay or simply replacing the lost parts with new/recycled chips (Lawson and Senadheera 2009).
2.10 QUALITY CONTROL AND QUALITY ASSURANCE
In New Zealand, every chip seal project has a quality assurance plan. The contractors provide evidence of quality controls to the client. The chip producers provide proof of aggregate material compliance, especially in terms of polished stone value (NZTA 2011).
FHWA provides chip seal inspection check-off list that is helpful in systematically reviewing the chip seal surface prep, equipment, weather, traffic control, application rates, truck operation, rolling, longitudinal joints, transverse joints and brooming (FHWA 2002).
Minnesota’s seal coat handbook also has a detailed field inspector checklist and guidance (Wood et al. 2006).
Uniform aggregate size allows for easier inspection.
Oregon specifications require the chip spreader to be calibrated each morning and sometimes mid shift. Each individual gate is calibrated. During calibration, the chip spreader is driven over mats of a known size and weight. The spreader should begin placing chips about 6-8 feet before the mats used in calibration. The chip spreader speed and tachometer should be the same as what is used during construction and the inspector should record these values.
With regards to inspecting the sweeping operation, Minnesota recommends the inspector drive the project route (windshield inspection) to check the following important items:
• Ensure all roads sealed are swept
• Note any defects in the seal coat that require contractor attention
• Ensure that all the roadway structures are uncovered
• Efficient monitoring of progress and quality of sweeping operation

36
At the beginning of chip seal placement, construction of a 100-foot-long test section provides several important verifications. (1) Check the embedment depth of the aggregate into the asphalt binder. (2) Application rates can be adjusted to field conditions if needed based on weather, distributer or spreader conditions, and adjusting for surface irregularities. (3) The application rate of the binder on a large scale can be checked. (4) Demonstrates all equipment is operational, in good working order and is ready to begin the project.
The quantities of materials can be calculated at the conclusion of each lift thus verifying if the correct application rates were placed (NCDOT 2015).
The primary areas of concern for the inspectors are:
• Weather – temperature and rain,
• Calibration – 100-foot test section,
• Cleanliness of roadway,
• Total square yards to be paved,
• Temperature of emulsion,
• Application rate of emulsion,
• Amount of emulsion used,
• Square yards of aggregate placed,
• Timeliness of emulsions and aggregate laydown,
• Timeliness of rolling,
• Proper signage and traffic control, and
• Quality of both emulsion and aggregate.
In North Carolina a compatibility test based on AASHTO T59, (AASHTO T59 2015) is required,
“A Certificate of Compatibility must be obtained from the asphalt supplier showing that the proposed aggregate and emulsion are approved for use. This certificate must be provided prior to beginning work.” (NCDOT 2015).
The compatibility test is a simple and inexpensive procedure. The test procedure involves creating a disposable bowl from a milk jug and blending measured amounts of asphalt and emulsified binder together to ensure the binder coats the aggregate adequately after the emulsion sets. Compatibility is measured as good, fair or poor based on coated-uncoated aggregate.

37
2.11 STATE OF THE PRACTICE FOR CHIP SEAL SPECIFICATIONS IN THE USA
2.11.1 Introduction
As the development of the chip seal process is improving, various states have begun to compile similar specifications. To correlate with the chip seal project in conjunction with the Oregon DOT, findings will be compared and contrasted to the specifications created by the Oregon DOT.
It is to be noted that the information collected is representative of the standards for road and bridge construction that could be found available to the general public and may not represent all states or be the most current standards to date.
2.11.2 Spread Rates
The spread rate refers to the quantity of aggregate or “chip” that needs to be placed on freshly sprayed asphaltic emulsion to ensure a proper chip seal. Table 2.7 shows the specified quantities by state. Most states specified a range of allowable quantity in either cubic yards per square yard or pounds per square yard. The ranges were either specified when the given state just gave a range directly while some ranges were evaluated from tables within specifications that provided varying quantities depending on aggregate type or number of seals on a given section of pavement.
Another topic to consider when looking at Table 2.7 is that the states that provided an application rate in cubic yards per square yard were converted to pounds per square yard in column two by using 3200 pounds as a standard unit weight for a cubic yard of crushed gravel.
Oregon spread Rates compared to the Other States 2.11.2.1
Oregon has a specified range of 0.004 – 0.018 cubic yards of aggregate per square yard of chip seal. When the 3200 pound calculations are made, Oregon is within a similar region of other states. With a median value of 35.2 pounds, Oregon sits 5.8 pounds from the average median value. This is marginally larger than the average but differences in stone and estimated weights may affect the results.

38
Table 2.6: Spread Rates of Various States State Application
Rate (No. cy per sy)
Application Rate (No. lb per sy using 3200 lb as unit weight of a
cy of crushed gravel)
Application Rate (No. lb
per sy)
Median Value (lb
per sy) Arizona 0.011 32 - 32
Delaware - - 17 – 502 33.5 Florida - - 18 - 22 20 Georgia 0.001 – 0.032 3.2 - 96 - 49.6 Illinois - - 15 - 251 20 Indiana - - 12 - 322 22 Iowa - - 15 - 302 22.5
Kansas 0.006 – 0.0112 19.2 – 35.2 - 27.2 Louisiana 0.0075 – 0.022 24 - 64 - 44 Maryland - - 20 - 502 35 Michigan - - 20 - 241 22
Mississippi 0.018 – 0.0212 57.6 – 67.2 - 62.4 Missouri - - 25 - 301 27.5
North Carolina - - 9 – 222 15.5 Oklahoma - - 25 - 352 30 OREGON 0.004 – 0.0182 12.8 – 57.6 - 35.2
Pennsylvania - - 15-251 20 Rhode Island - - At Least 30 30
South Carolina - - 12 - 202 16 Tennessee - - 17 - 302 23.5
Washington - - 20 - 452 32.5 West Virginia - - 8 - 452 26.5
Note: 1 – refers to a state standard that gave a range for the engineer to determine correct rate 2 – refers to a state standard that gave various rates depending of the number of seals or type
Average 29.4
2.12 TIME/DISTANCE ALLOWED AFTER EMULSION IS PLACED BEFORE PLACING COVER AGGREGATE
The time/distance allowed after emulsion is placed before placing cover aggregate is a commonly specified interval for most states. The general design of chip seals suggests the sooner the cover aggregate is placed, the better bonding between the stone and the emulsion there is.
Based on this practice, Table 2.8 reveals how most of the states have included this interval within the specifications. Twenty of the states directly use the word “immediately” in their phrasing. Other states follow suit, however, specific distances or times are called into play.

39
2.12.1 Oregon Time/Distance Specifications Compared to the Other States
Oregon sits along within the 20 states that specify “immediately” as the time/distance interval for covering the emulsion. While this is apparent common ground, it can be interpreted differently depending on the contractor/engineer. A fixed distance or time frame that could be legitimately measured would provide for the best execution as desired by the state.

40
Table 2.7: Intervals Between Spraying and Covering State Time Distance Alabama - As Close As Possible Alaska Immediately - Arizona Immediately - Arkansas Immediately - Colorado Immediately - Delaware Immediately - Florida Within 1 Minute - Georgia Immediately - Idaho Immediately - Indiana Within 1 Minute - Iowa Within 2 Minutes - Kansas Immediately - Kentucky Immediately - Louisiana - Directly Behind Michigan Within 30 Seconds Within 150 Feet Mississippi Less Than 20 Minutes - Missouri Within 30 Seconds - New York Immediately - North Carolina Immediately - North Dakota Immediately - Oklahoma Immediately - Oregon Immediately - Pennsylvania Immediately - Rhode Island Immediately As Close As Possible South Carolina Immediately Within 200 Feet South Dakota Within 5 Minutes or Before Breaking - Tennessee - As Close As Possible Texas Immediately - Virginia Before Emulsion Breaks - Washington After Emulsion Is Placed - West Virginia Immediately - Wisconsin After Asphaltic Material Develops
Tackiness -
Wyoming Immediately - 2.13 ROLLER SPECIFICATIONS
After the spraying and covering the chip seal, the process of rolling must occur to properly embed the stone into the emulsion. This typically appears to be performed with pneumatic rollers, however, a number of states do allow steel drum rollers to be used as well.

41
Some of the typical features found in the specifications were the type, gross load, number used, speed allowed, and time between the cover coat and initial roll. Table 2.9 illustrates these categories, by state, if they were specified. The type was either pneumatic or steel. The gross load applied to pneumatic rollers only and was given in either psi of ground pressure or lb./inch width of roller. The number used was specified as the typical quantity required for a chip seal operation. The speed allowed was given due to the ease in which the chips could be picked, rolled over, or shoved. A set speed limit greatly impacts the quality of the finished seal. Lastly, the time between cover coat and the initial pass of the rollers was given to ensure a solidified bond at 50 to 70 percent of the chip thickness. This also helps prevent chip loss from traffic.
2.13.1 Oregon Roller Specifications Compared to the Other States
Oregon only specifies three of the five categories that were noted. Of those three categories, Oregon specified the type and speed of the rollers. For the type of roller, Oregon was one of the few states that allowed/specified a combination of both steel and pneumatic. Generally seen within the states that allowed steel rollers was a clause stating when steel rollers are used, the contractor much carefully observe the operation. This ensured if stones began crushing, the use of steel rollers is halted.
The quantity specified for a typical project was two pneumatic rollers and one steel roller. Oregon was the one of three states, including Arkansas and Delaware, which specified the use of steel as a requirement. Four other states list steel as an alternative to the pneumatic roller. Those states are Georgia, Maryland, Mississippi, and West Virginia. Oregon also specified a 5mph max speed for rolling. This similar with the general consensus, as well as being the same as the most conservative speed allowance specified. Internationally, rubber covered steel wheeled rollers are liked but no states specify this type of roller.
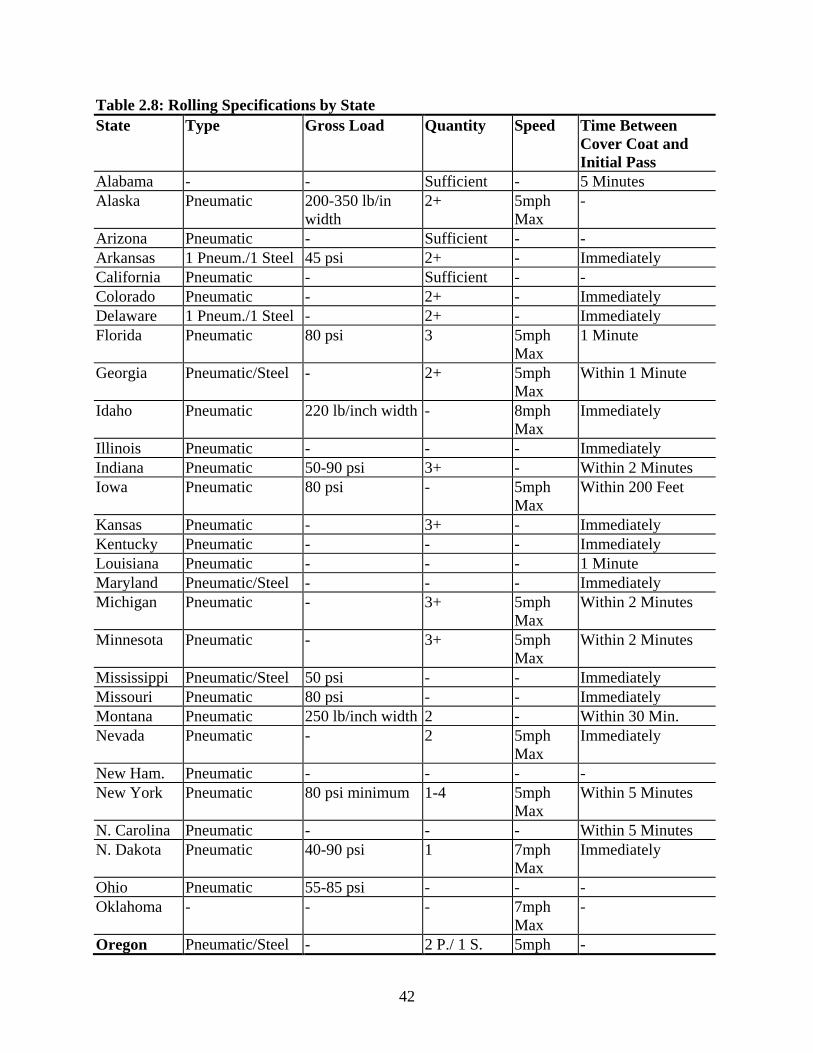
42
Table 2.8: Rolling Specifications by State State Type Gross Load Quantity Speed Time Between
Cover Coat and Initial Pass
Alabama - - Sufficient - 5 Minutes Alaska Pneumatic 200-350 lb/in
width 2+ 5mph
Max -
Arizona Pneumatic - Sufficient - - Arkansas 1 Pneum./1 Steel 45 psi 2+ - Immediately California Pneumatic - Sufficient - - Colorado Pneumatic - 2+ - Immediately Delaware 1 Pneum./1 Steel - 2+ - Immediately Florida Pneumatic 80 psi 3 5mph
Max 1 Minute
Georgia Pneumatic/Steel - 2+ 5mph Max
Within 1 Minute
Idaho Pneumatic 220 lb/inch width - 8mph Max
Immediately
Illinois Pneumatic - - - Immediately Indiana Pneumatic 50-90 psi 3+ - Within 2 Minutes Iowa Pneumatic 80 psi - 5mph
Max Within 200 Feet
Kansas Pneumatic - 3+ - Immediately Kentucky Pneumatic - - - Immediately Louisiana Pneumatic - - - 1 Minute Maryland Pneumatic/Steel - - - Immediately Michigan Pneumatic - 3+ 5mph
Max Within 2 Minutes
Minnesota Pneumatic - 3+ 5mph Max
Within 2 Minutes
Mississippi Pneumatic/Steel 50 psi - - Immediately Missouri Pneumatic 80 psi - - Immediately Montana Pneumatic 250 lb/inch width 2 - Within 30 Min. Nevada Pneumatic - 2 5mph
Max Immediately
New Ham. Pneumatic - - - - New York Pneumatic 80 psi minimum 1-4 5mph
Max Within 5 Minutes
N. Carolina Pneumatic - - - Within 5 Minutes N. Dakota Pneumatic 40-90 psi 1 7mph
Max Immediately
Ohio Pneumatic 55-85 psi - - - Oklahoma - - - 7mph
Max -
Oregon Pneumatic/Steel - 2 P./ 1 S. 5mph -

43
Max Pennsyl. Pneumatic 40-50 psi Sufficient - - Rhode Is. Pneumatic - 2+ - Immediately S. Carolina Pneumatic - 2 7mph
Max Before Em. Break
S. Dakota Pneumatic 250 lb/inch width 4+ 5mph Max
Immediately
Tennessee Pneumatic - - - Immediately Utah Pneumatic - - - Before Em. Break Virginia Pneumatic 200-350 lb/in
width 1+ 5mph
Max -
Washingt. Pneumatic - 3+ 8mph Max
Immediately
W. Virginia Pneumatic/Steel - - - Immediately Wisconsin Pneumatic 30 psi - - Immediately 2.14 WEATHER LIMITATIONS/DATES ALLOWED FOR CONSTRUCTION
The chip seal process is very delicate towards the weather in which it is constructed. For that reason, many states have a standard timeframe allotted where chip sealing can occur during the calendar year. Other specified featured are allowed ambient air temperature or pavement temperature at time of construction.
2.14.1 Oregon Weather Limitations Compared to the Other States
Oregon specifies the date range allowed to construct a chip seal as well as the pavement temperature. The pavement temperature Oregon specifies is at least 70 degrees Fahrenheit. Of the states that specify a pavement temperature, only two, Arizona and Idaho, ask for a higher temperature, and only three other states, Colorado, Kansas, and Oklahoma, ask for 70 degrees Fahrenheit as well. The other specified temperatures by the states are less conservative and range anywhere from 60 down to 45 degrees Fahrenheit. These values can be seen in Table 2.10.
Figure 2.6 takes the information regarding constructability dates and merges them into an infographic displaying the ranges in a statewide comparison. From Figure 2.6, it is evident that Oregon takes a more conservative date range. This is likely because some of the areas of the state experience very heavy rainfall.

44
Table 2.9: Date Ranges and Allowed Temperatures for Chip Sealing State Date Range(s) to Place Allowed
Ambient Air Temp. (F)
Pavement Temp. (F)
Alabama June – September 60+ - Alaska - - 60+ Arizona March 15 – May 31, September 1 – October 31 75+ 85+ Arkansas April 15 – September 30 - 60+ California - 60 – 105 55+ Colorado - 70+ 70+ Delaware April 15 – September 30 50+ - Florida - 60+ 60+ Georgia April 15 – October 15 60 – 85 60 - 125 Idaho June 15 – September 1 - 80 – 140 Illinois May 1 – October 1 (or 30 if certain conditions are
met 60+ -
Indiana May 1 – October 1 60+ - Iowa Before September 1 - - Kansas June 1 – September 15 60+ 70+ Kentucky - 45+ - Louisiana - 60+ 60+ Maryland - 50+ 50+ Michigan June 1 – Aug 1 (Conservative), May 15 – Sept 15 55+ 55 - 130 Minnesota May 15 – Aug 10 (Conservative), May 15 – 31 60+ 60+ Mississippi March 1 – October 15 60+ - Montana May 1 – August 31 - - Nevada - 50+ - New Jersey - 50+ 50+ New York May 1 – September 7 50+ 60+ N. Carolina April 1 – October 15 50 – 98 50+ N. Dakota - 45+ 45+ Ohio May 1 – September 1 70+ 60 – 140 Oklahoma May 15 – September 15 60+ 70+ OREGON July 1 – August 31 - 70+ Rhode Isla. - - 50+ S. Carolina March 15 – October 15 60+ - S. Dakota May 15 – Aug 31 (Conservative), May 15 – Sept.
15 70+ -
Tennessee April 15 – October 1 - - Utah May 15 – August 31 70+ 70 – 120 Washington May 1 – August 31 60+ 55 – 130 W. Virginia May 1 – October 1 - 50+ Wyoming June 15 – August 31 60+ 60+
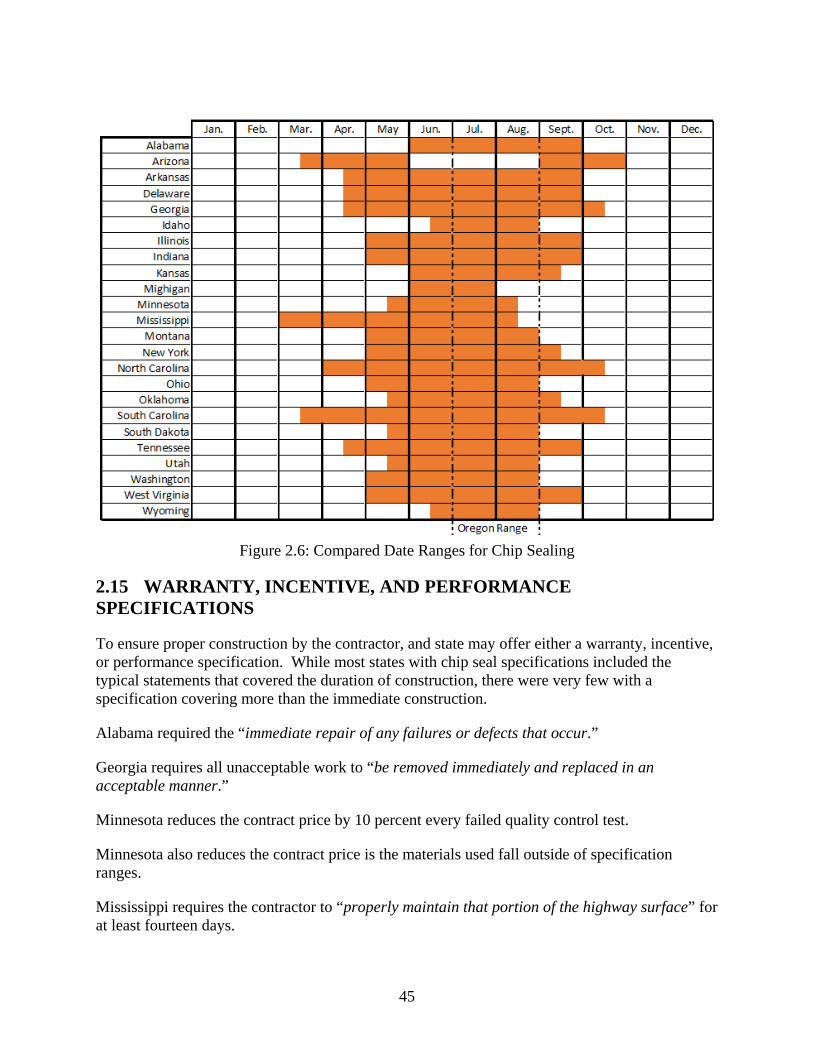
45
Figure 2.6: Compared Date Ranges for Chip Sealing
2.15 WARRANTY, INCENTIVE, AND PERFORMANCE SPECIFICATIONS
To ensure proper construction by the contractor, and state may offer either a warranty, incentive, or performance specification. While most states with chip seal specifications included the typical statements that covered the duration of construction, there were very few with a specification covering more than the immediate construction.
Alabama required the “immediate repair of any failures or defects that occur.”
Georgia requires all unacceptable work to “be removed immediately and replaced in an acceptable manner.”
Minnesota reduces the contract price by 10 percent every failed quality control test.
Minnesota also reduces the contract price is the materials used fall outside of specification ranges.
Mississippi requires the contractor to “properly maintain that portion of the highway surface” for at least fourteen days.

46
New York requires the contractor to remedy “any areas deficient by the State” one year after construction.
North Carolina hold fault to the contractor for one year for any repairs required based on workmanship and construction issues.
Ohio will “review the completed work 25 to 35 days after placement.” The work must be as specified or the contractor must remedy the issues.
Tennessee requires the contractor to provide maintenance for 10 calendar days.
Montana Department of Transportation has a seal coat warranty administration guide for troubleshooting and administrating a chip seal warranty. The guide contains pictures of chip seal success, failures and strategies to address the failures. The guide also has a warranty deduction calculation based on material prices per square yard, affected area and square yards (MT DOT 2008).
2.15.1 Oregon Warranties, Performance Specifications and Incentives Compared to the Other States
Oregon does not currently include a warranty, performance, or incentive specification.
2.16 LITERATURE REVIEW SUMMARY AND RECOMMENDATIONS
Chip seals are a widely used but often under designed system. The literature shows that the types of chip seal placed on a roadway can impact future performance. The simplest of these designs is the single-layer chip seal. Designs such as the racked-in seal provide more aggregate interlock for greater shear resistance. The chip seal consists of asphalt binder, emulsified or hot-applied, and aggregate chips that are uniformly graded and have very little dust content. Typically, polymer modified asphalt is recommended for use in chip seals. When hot-applied binders are used, the aggregate is generally pre-coated. The McLeod chip seal design is used in both California and Minnesota. Minnesota requires a design in their construction specifications. Minnesota literature credits the engineering approach to design, good construction practices and a payment method that doesn’t incentivize over or under placement of materials with the “rebirth of chip sealing in Minnesota” (Wood and Olson 2007). New Zealand has implemented a performance specification that determines whether a chip seal meets agency expectations one-year post construction. The performance metric is based on macrotexture measurements and desired design life, typically four to seven years. Available chip seal specifications and guidelines for all states were reviewed and compared with current Oregon specifications. This provides a benchmark of US specifications and based on the research findings in the remainder of the report, changes will be developed.
Based on the literature review recommendations include implementation of an engineered approach to chip seal design to establish initial chip seal application rates by using a design guide and written into specifications similar to current Minnesota specifications. The New Zealand performance specification provides a reliable metric to measure the performance of a chip seal based on macrotexture. The field and laboratory experiment conducted though this research will

47
provide a scientific determination of whether the performance specification should be adopted as a metric of chip seal performance in Oregon.

48

49
3.0 FIELD AND LABORATORY EXPERIMENTAL PLAN
The objective of the experiment is to report on the performance of chip seals constructed in Oregon using both cold- and hot-applied methods. The performance of these chip seal projects will be monitored for at least one year but the majority of sections will be monitored for two years. The application rates of the binder and aggregate will be back calculated based on project information and analyzed. Several benefits are recognized by conducting a field study:
• The State of Oregon will have chip seal examples and performance information in a variety of regions throughout the state.
• Field studies highlight factors that lead to good performance. Good performance leads to cost savings and increased user satisfaction.
• Back calculation of design parameters compared with field-placed application rates helps to develop the design methodology that is most suited to Oregon. Optimal chip application rates are also determined in the laboratory.
3.1 IDENTIFICATION OF FIELD PROJECTS
A variety of chip seal projects were located throughout the State during the 2014 and 2015 construction seasons. Figure 3.1 shows all project locations throughout the state for the project. Figure 3.2 shows all of the sections constructed during the 2014 construction period. During the 2014 construction season, a large chip seal project Klamath Falls had multiple sections used for the study. Figure 3.3 shows a detailed project map and the units within the project. This project used both emulsified asphalt and hot-applied asphalt during chip seal application. This project is especially valuable to the study because it allows for a good comparison between the performances of hot- and cold-applied chip seals multiple years. Table 3.1 provides a summary of the project sections. The Oregon DOT’s website provided a general condition of the roadway prior to chip sealing. These condition ratings are shown in Figure 3.4.

50
Figure 3.1: Map of all project locations

51
Figure 3.2: 2014 Chip Seal Projects (Google Earth 2015)
Figure 3.3: Klamath Chip Seal Project Details

52
Figure 3.4: Klamath Falls Pavement Conditions. Underlined labels indicate hot applied and bold
indicates emulsified (ODOT 2012).
Traffic is a primary consideration in chip seal design. The annual average daily traffic is shown in Figure 3.5 for the Klamath falls projects that use emulsified asphalts. Figure 3.6 shows the ADT for the hot-applied chip seal Klamath falls section. Traffic is represented by Average Annual Daily Traffic (AADT) of the test section. Annual average daily traffic is the total volume for the year divided by 365 days. In general, low traffic roads have AADT < 800 and high traffic roads have AADT > 800. AADT can be found from the transportation maps on Oregon DOT's website. Table 2 presents the average daily traffic rate (ADT) for all chip seal section sections included in this study.

53
Figure 3.5: Emulsified Asphalt Chip seals ADT section in Klamath Falls
Figure 3.6: Hot Applied Asphalt Chip Seal Sections in Klamath Falls
0
1000
2000
3000
4000
5000
6000
Klamath Unit A Klamath Unit F Klamath Unit G Klamath Unit H
AD
T, v
ehic
les p
e da
y
0
1000
2000
3000
4000
5000
6000
Klamath UnitB
Klamath UnitC
Klamath UnitD
Klamath UnitE
*Prairie RoadSouth Section
ParkwaySection
AD
T, v
ehic
les p
e da
y

54
Table 3.1: Location and average daily traffic rate for different units
Section Name General Location Road Annual ADT
Parkway Eugene OR – 222 2800
Prairie Rd Eugene Prairie Rd. 5200
Unit A Klamath Falls OR - 62 460
Unit B Klamath Falls OR - 140 2300
Unit C Klamath Falls OR - 66 2900
Unit D Klamath Falls Trigley Ln./Miller Isle Rd. 1280
Unit E Klamath Falls OR - 140 1345
Unit F Klamath Falls Hwy 50 2650
Unit G Klamath Falls OR - 70 670
Unit H Klamath Falls OR - 31 690
Heppner Heppner OR - 207 1000
Condon Condon OR - 206 470
Sunset Beach Seaside Sunset Beach Ln. 1521
Lewis & Clark Seaside Lewis & Clark Rd. 465
3.2 CLIMATE
According to the USDA, Oregon has a range of climates. The climate regions, represented by plant hardiness zones are detailed in the USDA map shown in Figure 3.7 (USDA 2016). The rainfall information, with respect to the project locations, is presented in Figure 3.8. As discussed in the literature review, Oregon, chip seals are only constructed in July and August. East of the Cascades, the precipitation is greatly reduced. Chip sealing conditions highly favor dry weather. Chip seal weather considerations, discussed in Section 2.7.3. can provide guidance when determining if conditions are favorable or not for chip sealing.

55
Figure 3.7: Oregon Plant Hardiness Zone Map (USDA 2016)
Figure 3.8: Rainfall precipitation in Oregon (PRISM 2014)

56
3.3 CHIP SEAL TYPE AND MATERIALS
Table 3.2 shows the 2014 and 2015 chip seal-type, ADT and binder. In the 2014 construction season, six hot-applied chip seal sections (shaded in Table 3.2) and four emulsified chip seal sections (white background) were constructed and monitored as part of this study. The grey shaded rows in Table 3.2 represents sections constructed in the 2015 construction season. The 2015 sections include sections in the Northeast and Northwest regions of Oregon. Table 3.3 shows the binder application rate, chip application rate and aggregate source for each section.
Table 3.2: Chip seal type, AADT and Binder for Each Section Test Section
Name Seal Type Est. AADT Binder Details
Klamath Unit A Single Application Emulsified Asphalt Surface Treatment 460 CRS-2P
Klamath Unit B Pre-Coated Aggregate Asphalt Surface Treatment 2300 AC-15P
Klamath Unit C Pre-Coated Aggregate Asphalt Surface Treatment 2900 AC-15P
Klamath Unit D Pre-Coated Aggregate Asphalt Surface Treatment 1280 AC-15P
Klamath Unit E Pre-Coated Aggregate Asphalt Surface Treatment 1345 AC-15P
Klamath Unit F Single Application Emulsified Asphalt Surface Treatment 2650 CRS-2P
Klamath Unit G Single Application Emulsified Asphalt Surface Treatment 670 CRS-2P
Klamath Unit H Single Application Emulsified Asphalt Surface Treatment 690 CRS-2P
*Prairie Road Section
Single Seal, Pre-coated aggregate, CSS-1H Dilute Fog Seal 4000-5200 AC-15P
Parkway Section
Single Seal, Pre-coated aggregate, CSS-1H Dilute Fog Seal 2800 AC-15P
Lewis & Clark Rd. Single Application Emulsion 465 CRS3P (Blue line oils)
Sunset Beach Ln Single Application Emulsion 1521 CRS3P (Blue line oils)
Condon Single Application Emulsion 470 HFE-100-S or HFRS-2P
Heppner Single Application Emulsion 1000 HFRSP2/HFE100S (Albina Oil located in Madras)

57
Table 3.3: Binder Application Rate, Chip Application Rate and Aggregate Source
Test Section Name
Binder Application Rate
Approximate Chip Application Rate
Aggregate Origin (Quarry)
Klamath Unit A 0.48 gallons / sy Graded Medium, 0.013 cy / sy Lyon Pit (gravel)
Klamath Unit B 0.37 gallons / sy varied 18 - 20 lbs / sy Farmers S & G (quarry)
Klamath Unit C 0.37 - 0.38 gallons /sy start at 20, then down to 18 lbs / sy Farmers S & G (quarry)
Klamath Unit D 0.37 gallons / sy 20 lbs / sy Farmers S & G (quarry)
Klamath Unit E 0.36 gallons / sy 19 lbs / sy Farmers S & G (quarry)
Klamath Unit F 0.50 gallons / sy Graded Medium, 0.013 cy / sy Farmers S & G (quarry)
Klamath Unit G 0.50 gallons / sy Graded Medium, 0.013 cy / sy Farmers S & G (quarry)
Klamath Unit H 0.52 gallons / sy Graded Medium, 23 Lbs / sy Picture Rock Pit (gravel)
*Prairie Road Section 0.4 gallons / sy 3/8 Pre-coated, 20 lbs
/sq yd Wildish Pit - Eugene
Oregon
Parkway Section 0.41 gallons / sy 3/8 Pre-coated, 20 lbs /sq yd
Wildish Pit - Eugene Oregon
Lewis & Clark Rd. 0.45 gallons / sy 16.4 lbs/sy Teevin Fisher Quarry, Seaside
Sunset Beach Ln 0.45 gallons / sy 16.4 lbs/sy Teevin Fisher Quarry, Seaside
Condon 0.48 gallons/ sy 25 lbs/sy Jaeger
Heppner -- 21-22 lbs/sy Cason Canyon

58
3.3.1 Testing Methods
This study investigated traditional laboratory tests for aggregates, specialized aggregate imaging system, field testing performance and pavement conditioning surveys to monitor performance. The traditional aggregate test methods will help in developing the design parameters and included sieve analysis, specific gravity, absorption, flakiness index, and loose unit weight. The analysis of the AIMS test will help determine if this may be a useful tool for Oregon chip seals. The AIMS measurements include gradient angularity, sphericity, radius angularity and texture which are all used to describe the shape properties of aggregates. The aggregate test results were compared with the field measurements collected from chip seal test sections.
The aggregate sieve analysis was performed by wet sieve following ASTM C117 (ASTM C117 2013). A clean, uniformly graded and durable aggregate is desired for chip seals. Specific gravity testing of the aggregate followed ASTM C127 (ASTM C127 2013). The flakiness index procedure outlined by the FLH T508 (Wood 2006) was followed. The Utah DOT also has a similar procedure (Utah DOT 2004). Flakiness index is required for the McLeod chip seal design. A flakiness index plate was made by a local precision machinist. The flakiness index is the ratio of the total particles passing slots of a specified size, based on the gradation of the aggregate, to the total mass of all fractions (Utah DOT 2004). The aggregates passing through the slots are the flaky particles and aggregates with a high flakiness index can cause problems in chip seal mat finish, construction and embedment. The aggregate loose unit weight was also determined based on ASTM C29 (ASTM C29 2016) using the shoveling procedure. This is similar to the method used in the Minnesota Seal Coat Manual (Wood et al. 2006). The loose unit weight is used in determining chip application rate.
Figure 3.9: Illustration of Macro and Microtexture Field measurements for the chip seal field sections include: mean texture depth (MTD) to measure Macrotexture and the coefficient of friction (Mu) to measure microtexture. Microtexture and macrotexture are illustrated in Figure 3.9. The sand circle test was used to measure the MTD and Mu was measured using the dynamic friction tester (DFT). In Australia and New Zealand, extensive work has been done to manage deterioration through the remediation of the MTD, or

59
macrotexture. In North America, extensive work has been done to manage the skid number for safer roads performance.
Figure 3.10: Pavement Friction Model (Pidwerbesky et al 2006; Hall 2006) Research has shown that aggregate shape can influence chip seal performance. The AIMS equipment takes a series of aggregate images that can be analyzed using imaging software to quantify aggregate shape properties such as: angularity, sphericity and texture of aggregate. The aggregate images are taken using different lighting schemes and resolutions. Prior to imaging, aggregates must be sieved into different size categories. Aggregate particles must be individually placed on the imaging location as part of the sample preparation. The images are analyzed for angularity, sphericity, and texture.
The skid resistance of a highway pavement is the result of a “complex interplay between two principal frictional force components: adhesion and hysteresis” (Hall 2006). There are other components such as tire shear, but they are not nearly as significant as the adhesion and hysteresis force components. The force of friction (F) can be modeled as the sum of the friction forces due to adhesion (FA) and hysteresis (FH) as shown in Equation 1:
F = FA+ FH (3.1)
The frictional forces of adhesion and hysteresis are illustrated in Figure 3.10. Since the frictional force of adhesion is “proportional to the real area of adhesion between the tire and surface asperities” (Hall 2006) and the hysteresis force is “generated within the deflecting and visco-elastic tire tread material, and is a function of speed” (Hall 2006), then the improvement of skid resistance of pavement should be based on improving both the surface microtexture and macrotexture (Zaman et al. 2013).
Macrotexture is an indicator of aggregate loss in chip seals and can be assessed by measuring MTD using the New Zealand sand circle testing procedure (TNZ T/3 1981) that provides information about surface “drainability”. Figure 3.11 (a) shows the sand circle test measuring macrotexture in the field. The New Zealand performance specification uses macrotexture to

60
judge the success or failure of chip seal surface treatments after one year (TNZ 2002). A study conducted on pavement surface texture was completed in Texas and proved that the test procedure and the performance specifications are suitable for use in the US (Gransberg 2007).
(a) (b)
(c)
Figure 3.11: (a) Macrotexture Testing in Progress (Photo courtesy of Paul Ledtje) (b) Dynamic Friction Test Equipment (c) Skid Testing equipment (Photo courtesy of Oregon DOT)
The sand circle test is a volumetric test, performed by placing a known volume of sand, 45 ml, which is then spread by a disc until the sand is level with the top of the surface aggregate (TNZ 2002). The diameter is measured in two directions and the average diameter of the circle is used in Equation 2. The surface texture is inversely proportional to the diameter of the circle on the surface of the pavement.
𝑀𝑀𝑒𝑒𝑎𝑎𝑛𝑛 𝑇𝑇𝑒𝑒𝑥𝑥𝑡𝑡𝑢𝑢𝑟𝑟𝑒𝑒 𝐷𝐷𝑒𝑒𝑝𝑝𝑡𝑡ℎ (𝑚𝑚𝑚𝑚)=57,300 / 𝐷𝐷𝑖𝑖𝑎𝑎𝑚𝑚𝑒𝑒𝑡𝑡𝑒𝑒𝑟𝑟 (𝑚𝑚𝑚𝑚2) (3.2)
Research has shown that the sand circle test is similar to ASTM E965 (ASTM E965 2015) sand patch method which uses glass spheres (ASTM 2005; Aktas et al. 2011).
61
The DFT can be used to measure microtexture and Mu, Figure 3.11 (b). The equipment has three rubber sliders positioned on a disk with a diameter of 13.75 inches suspended above the pavement surface. When the tangential velocity reaches a pre-set speed, water is applied to the surface and the sliders make contact with the pavement. Results for friction measurements are recorded across the range of speeds as the sliders slow to a stop. A DFT value obtained at 20 kph, along with texture measurement provides a good indication of International Friction Index (IFI) (Henry 2000).
The most popular way agencies measure pavement friction is by using the lock wheel skid trailer, Figure 3.11 (c). This test provides a pavement’s skid number which can be an indicator of aggregate loss, flushing or bleeding in chip seals, as well as aggregate loss. Pavement skid numbers are often a combination of micro- and macrotexture measurements. During testing, water is applied in front of the tire just before the tire’s brakes force the tire to lock up. The resultant force is measured and converted into a skid number value (ASTM E274 2015).

62

63
4.0 EXPERIMENTAL RESULTS AND ANALYSIS
Testing of the field sections began prior to construction with pre-construction pavement condition surveys following LTPP guidelines. Construction took place in favorable chip sealing conditions.
4.1 CHIP SEAL CONSTRUCTION
The figures in this section illustrate the chip seal construction process that occurred for each project. First the surface was preapred. Then the chip seal distributer applied the asphalt binder as shown in Figure 4.1. Figure 4.2 shows the spray fans of the spreader. At close inspection, it appears that fans are providing triple coverage, this is optimal when conditions allow, according to the asphalt institute (Asphalt Insitute 2009). Figure 4.3 and Figure 4.4 show the chip spreader in operation and being loaded by a haul truck. Finially, Figure 4.5 shows the pneumatic roller.
Figure 4.1: Chip Seal Distributer (Photo credit: Paul Ledtje)

64
Figure 4.2: Chip Seal Distributor Spray Bar (Photo credit: Paul Ledtje)
Figure 4.3: Haul Truck Loading Chip Spreader (Photo credit: Paul Ledtje)

65
Figure 4.4: Aggregate Laydown Operation (Photo credit: Paul Ledtje)
Figure 4.5: Pneumatic Tire Roller (Photo credit: Paul Ledtje)

66
4.2 FIELD PERFORMANCE MONITORING
4.2.1 Mean Texture Depth
Macrotexture levels can indicate when a chip seal has reached the end of its useful life. The surface of the texture is critical in providing pavement friction. If aggregate loss or bleeding in the chip seal occurs, this can be assessed by measuring mean texture depth (MTD). The MTD was measured before and right after construction on all sections. Follow up measurements were taken at one year and two-years post-construction.
New Zealand has a performance specification based on MTD. MTD failure is defined as 0.9 mm and below. The performance specification takes into account the average least dimension of the aggregate and the design life. The McLeod method provides a correlation between median particle size and the average least dimension. The equation is (Wood et al. 2006):
𝑯𝑯 = 𝑴𝑴𝟏𝟏.𝟏𝟏𝟏𝟏𝟏𝟏𝟏𝟏𝟏𝟏𝟏𝟏+(𝟎𝟎.𝟎𝟎𝟏𝟏𝟏𝟏𝟏𝟏𝟎𝟎𝟎𝟎)(𝑭𝑭𝑭𝑭)
(4.1)
Where:
H = Average Least Dimension, inches or mm M = Median Particle Size, inches or mm FI = Flakiness Index, in percent Chip seals using the same aggregates will have the same MTD criteria. Each chip seal section included in the study is shown in the sections below. The MTD is compared with the New Zealand performance criteria for four- and seven-year design life. The performance criteria is evaluated at one year post-construction of before. The performance criteria line extends to two-years for comparison purposes only. Also, the performance criterion applies to the wheel path because this is where texture is most critical. For comparison purposes, both WP and BWP measurements are shown in the analysis. The MTD graphs report the rate of MTD decrease over time which is of particular interest in developing recommendations and evaluating performance.
Figure 4.6 represents the MTD measurements over time in Unit A before, after and up to two-years post-construction. An emulsified asphalt was used. The exposed aggregate surface of the emulsion greatly increased the MTD. There MTD was reduced one year after construction. The rate of MTD decreased after the first year. Unit A was well above the New Zealand performance specification. There was no difference between the WP (BWP) and measurements taken in the wheel paths (WP). From MTD, Unit A appears to be performing well.
Figure 4.7 represents the MTD measurements for Units B and C. This is a hot-applied seal. Both of these sections have similar AADT, B has 2300 AADT and C is 2900 AADT. The initial improvement in MTD was recognized and the decrease in MTD over the first year was relatively small but the MTD in the two-year post-construction measurements show a significant decrease

67
in MTD. Unit B has fallen below the New Zealand criteria of 0.9 mm in the wheel path. In Units B and C, the WP has approximately 0.25 mm lower MTD compared to between the wheel path.
Figure 4.8 represents the MTD measurements for Units D and E, which used the same binder and aggregate as B and C with similar application rates. The AADT is lower for D and E compared to B and C. For these units there was an approximate 0.7 mm differential between the wheel path and wheel path measurements for the first year after construction. The rate of MTD loss was highest for Unit E between the wheel paths between one and two years post construction as indicated by the green, dash-dot line. Both sections exhibited most of the MTD loss in the WP during the first year.
Figure 4.9 shows the MTD results for Units F and G. These sections were constructed with emulsified asphalt. The decrease in MTD occurred more quickly in the wheel path the first year after construction and the rate of decrease in MTD was reduced after one year of construction. The two-year post-construction MTD showed little difference between WP and BWP MTD measurements. The TMD measurements were above the NZ performance criteria for one year. The traffic levels between F and G are quite different with Unit F having significantly more traffic. Although large contrasts between MTD are not evident Unit F exhibited a slightly higher difference between WP and BWP MTD measurements.
Figure 4.10 displays the MTD measurements for Unit H. This chip seal was constructed using emulsified asphalt The MTD decreased the highest during the first year and the rate of decrease in MTD leveled off between one and two years post construction. The MTD values passed the NZ performance criteria. The MTD for BWP and WP measurements were similar for two-years post-construction.
Figure 4.11 shows the Parkway and Prairie Rd. chip seal MTD measurements. These seals were hot-applied on roads with AADTs of 2800 and approximately 4000 for Parkway and Prairie, respectively. These sections had the most uniformly graded aggregate used in construction. These sections exhibited a fairly steady decrease in MTD over one- and two-years post-construction. The one-year MTD values met the NZ performance criteria. There is approximately a 0.6 mm difference in the MTD for the WP and BWP measurements.
The chip seal MTD measurements for sections located in the NW, high rainfall region are shown in Figure 4.12. Aggregate testing was not conducted for those sections but MTD measurements show good performance and low similar performance as the other seals and thus would pass the NZ performance criteria. The emulsion used in constructed is slightly different as it is a CRS3P and its performance is comparable to the other chip seals in the study. This region of Oregon see especially high rainfall and chip seals are primarily constructed in July. In addition to the reduced construction season, this area sees a large increase in seasonal traffic during the optimal construction weather due its proximity to the beach.
The chip seal MTD sections constructed in Northeast Oregon are shown in Figure 4.13. These sections performed very well and had no visible surface distresses.

68
For measurements in the wheel path (OWP, to indicate outer-wheel-path) measurements, all units (A, B, C, D, E, G, H, Prairie and parkway) have exhibited an increase in their MTD except unit F which the MTD has decreased.
Figure 4.6: Unit A Mean Texture Depth Measurements and Performance Criteria
0
0.5
1
1.5
2
2.5
3
3.5
4
4.5
Pre-Construction Post-Construction One-Year Post-Construction
Two-Year Post-Construction
Mea
n Te
xtur
e D
epth
, mm
UNIT A WP Unit A BWPUnit A 4 year design life Unit A 7 year design life
UNIT A Summary Binder: CRS-2P, 0.48 gal/sy Aggregate: Least uniform gradation and finest gradation in the study, gravel, 0.013 cy/sy

69
Figure 4.7: Mean Texture Depth for Units B and C with Performance Criteria
Figure 4.8: Mean Texture Depth for Units D and E with Performance Criteria
0
0.5
1
1.5
2
2.5
3
3.5
4
Pre-Construction Post-Construction One-Year Post-Construction
Two-Year Post-Construction
Mea
n Te
xtur
e D
epth
, mm
UNIT B WP Unit B BWPUnit C WP Unit C BWPUnits B-E 4-year design life Units B-E 7-year design life
UNIT B Summary Binder: AC-15P Aggregate: 18-20 lbs/sy, Pre-coat (PC)
UNIT C Summary Binder: AC-15P Aggregate: 18 lbs/sy, PC Traffic: 2900 AADT
0
0.5
1
1.5
2
2.5
3
3.5
4
Pre-Construction Post-Construction One-Year Post-Construction
Two-Year Post-Construction
Mea
n Te
xtur
e D
epth
, mm
UNIT D WP Unit D BWPUnit E WP Unit E BWP
UNIT D Summary Binder: AC-15P, 0.37 gal/sy Aggregate: 20 lbs/sy, PC
UNIT E Summary Binder: AC-15P, 0.37 gal/sy Aggregate: 19 lbs/sy, PC Traffic: 1345 AADT

70
Figure 4.9: Unit F and Unit G Mean Texture Depth Measurements and Performance Criteria
Figure 4.10: Unit H Mean Texture Depth Measurements and Performance Criteria
00.5
11.5
22.5
33.5
44.5
5
Pre-Construction Post-Construction One-Year Post-Construction
Two-Year Post-Construction
Mea
n Te
xtur
e D
epth
, mm
UNIT H WP Unit H BWPUnit H 4-year design life Unit H 7-year design life
UNIT H Summary Binder: CRS-2P, 0.52 gal/sy Aggregate: 23 lbs/sy, graded medium gravel Traffic: 690 AADT
0
1
2
3
4
5
6
Pre-Construction Post-Construction One-Year Post-Construction
Two-Year Post-Construction
Mea
n Te
xtur
e D
epth
, mm
UNIT F WP Unit F BWPUnit G WP Unit G BWPUnits F-G 4-year design life Units F-G 7-year design life
UNIT F Summary Binder: CRS-2P, 0.5 gal/sy Aggregate: 0.013 cy/sy Traffic: 2650 AADT
UNIT G Summary Binder: CRS-2P, 0.5 gal/sy Aggregate: 0.013 cy/sy Traffic: 670 AADT

71
Figure 4.11: Prairie and Parkway Mean Texture Depth Measurements and Performance Criteria
Figure 4.12: Lewis & Clark and Sunset Beach Mean Texture Depth and Performance Criteria
0
1
2
3
4
5
Pre-Construction Post-Construction One-Year Post-Construction
Two-Year Post-Construction
Mea
n Te
xtur
e D
epth
, mm
Prairie Rd WP Prairie Rd BWPParkway WP Parkway BWPPrairie and Parkway 4-year design life Prairie and Parkway 7-year design life
Prarie Rd. Summary Binder: AC-15P, 0.4 gal/sy Aggregate: 3/8 Pre-coated 20 lbs/sy Traffic: ~4000 AADT CSS-1H Dilute Fog Seal
Parkway Summary Binder: AC-15P, 0.41 gal/sy Aggregate: 3/8 Pre-coated 20 lbs/sy Traffic: 2800 AADT CSS-1H Dilute Fog Seal
0
1
2
3
4
5
6
Pre-Construction Post-Construction One-Year Post-Construction
Mea
n Te
xtur
e D
epth
, mm
Lewis & Clark WP Lewis & Clark BWPSunset Beach WP Sunset Beach BWP
Lewis & Clark Summary Binder: CRS3P, 0.45 gal/sy Aggregate: 16.4 lbs/sy Traffic: 465 AADT
Sunset Beach Ln. Summary Binder: CRS3P 0.45 gal/sy Aggregate: 16.4 lbs/sy Traffic 1521 AADT
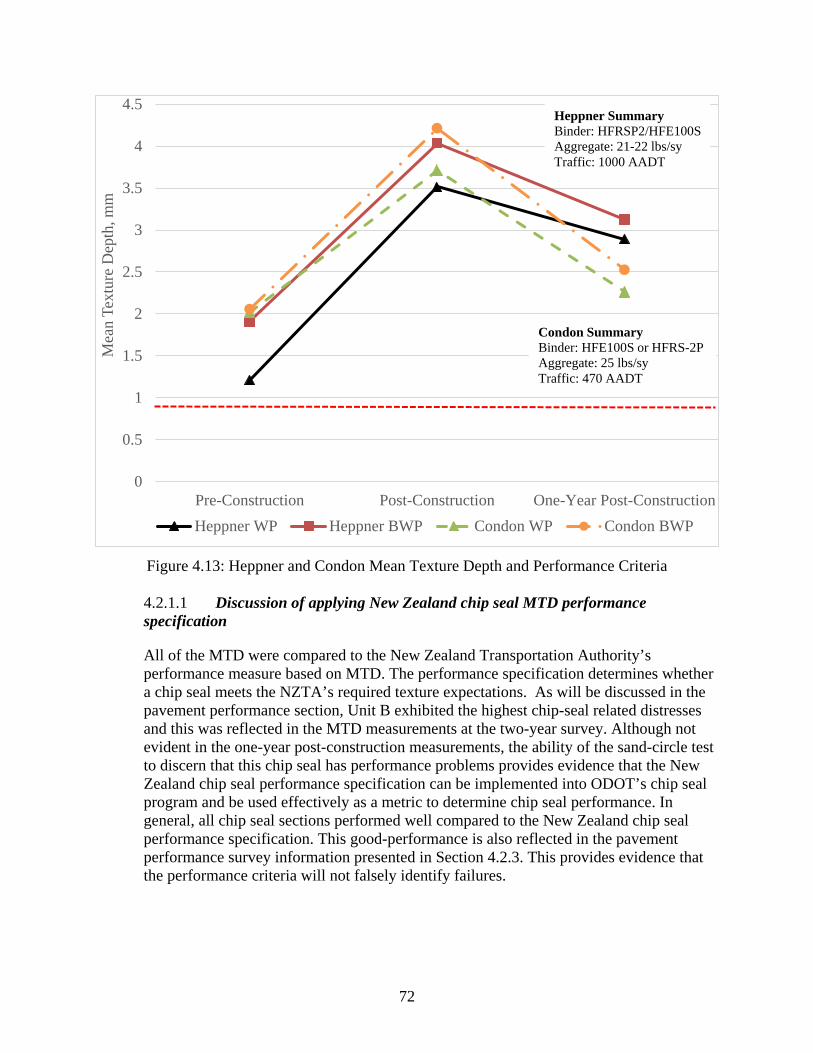
72
Figure 4.13: Heppner and Condon Mean Texture Depth and Performance Criteria
Discussion of applying New Zealand chip seal MTD performance 4.2.1.1
specification
All of the MTD were compared to the New Zealand Transportation Authority’s performance measure based on MTD. The performance specification determines whether a chip seal meets the NZTA’s required texture expectations. As will be discussed in the pavement performance section, Unit B exhibited the highest chip-seal related distresses and this was reflected in the MTD measurements at the two-year survey. Although not evident in the one-year post-construction measurements, the ability of the sand-circle test to discern that this chip seal has performance problems provides evidence that the New Zealand chip seal performance specification can be implemented into ODOT’s chip seal program and be used effectively as a metric to determine chip seal performance. In general, all chip seal sections performed well compared to the New Zealand chip seal performance specification. This good-performance is also reflected in the pavement performance survey information presented in Section 4.2.3. This provides evidence that the performance criteria will not falsely identify failures.
0
0.5
1
1.5
2
2.5
3
3.5
4
4.5
Pre-Construction Post-Construction One-Year Post-Construction
Mea
n Te
xtur
e D
epth
, mm
Heppner WP Heppner BWP Condon WP Condon BWP
Heppner Summary Binder: HFRSP2/HFE100S Aggregate: 21-22 lbs/sy Traffic: 1000 AADT
Condon Summary Binder: HFE100S or HFRS-2P Aggregate: 25 lbs/sy Traffic: 470 AADT

73
4.2.2 Dynamic Friction Test
The DFT can be used to measure coefficient of friction, Mu, and is related to a pavement’s microtexture. The equipment has three rubber sliders positioned on a disk with a diameter of 13.75 inches suspended above the pavement surface. When the tangential velocity reaches a pre-set speed, water is applied to the surface and the sliders make contact with the pavement. Results for friction measurements are recorded across the range of speeds as the sliders slow to a stop. A DFT value obtained at 40 kph provides a reasonable average.
Measurements were first conducted, for comparison reasons, using initial speeds of 80 and 60 kilometers per hour. Due to similarities in the measurements, only 80 was tested in the second year follow up data collection. The measurements were taken both dry and wet for comparison purposes between the different chip seal types. Dynamic friction testing was performed one- and two-years post construction. The dynamic friction test is not effective shortly after post-construction. The values will be high but the tangential forces from the test dislodges the aggregates from the chip seal.
Dynamic friction test data for Unit A are shown in Figure 4.14. The data collected in the second year (mid-July 2016) appears to be slightly higher with a larger differential in the wet section. The hot-applied seals located in Klamath falls are Units B, C, E and F and are shown in Figure 4.15 and Figure 4.16, respectively. These sections also showed the 2016 friction data being higher compared to 2015 except the Mu differential for the wet was low between the two years. Figure 4.17 displays the results for Units F and G, and are presented together because they use the same aggregates. Unit H, an asphalt emulsion is shown in Figure 4.18. Units D, F, and H exhibited lower Mu values the second year compared to the first year of testing. Units D, E, F, G and H exhibited large differences in the dry values between the first and second year observations. The DFT results taken in a wet condition appear to provide more consistent data.
DFT tests for Prairie and Parkway, both hot-applied chip seals with a fog seal, produced less variable results, shown in Figure 4.19.
Pre-construction DFT measurements were taken for Sunset Beach Ln. and Lewis and Clark Rd. Results show that the friction for the wet condition, was improved for both sections, with Lewis and Clark seeing a larger improvement in Mu. Sunset Beach and Lewis and Clark Mu values are shown in Figure 4.20 and Figure 4.21, respectively.
Further seasonal trends were investigated to explain the Klamath Falls observations. The New Zealand ship seal manual (NZTA 2005) discusses in detail the role that seasonal variations play in microtexture frictional surface measurements. Precipitation plays an especially important role. In the summer, dryer periods, vehicles will grind down the rock and produce a fine flour which acts a polisher. In the wet winter months, the small particle fines are washed away and the coarser grit is left in the roadway increasing skid resistance. The increase of winter skid resistance followed by the decrease in the summer creates a cyclical skid resistance pattern throughout the year. New Zealand research has also shown that year-to-year variations also can affect skid resistance. New Zealand has developed a correction factor to account for the between-year climate changes. This is based on control sections that are measured typically four to five

74
years. It’s long enough to observe changes between years but not long enough to be masked by actual changes in condition.
To determine if seasonal variation may be playing a role in the DFT results in the Klamath Falls sections, the monthly precipitation total for Klamath Falls was studied. Figure 4.22 presents NOAA’s monthly precipitation data for Klamath Falls, Oregon from July 2014 to July 2016. The months of May and June, 2016 were slightly wetter than May and June, 2015. New Zealand reports higher skid values in wetter weather. The Klamath Falls dry-DFT results showed higher coefficient of frictions in the 2016 measurements compared to 2015. The DFT field observations and recorded weather data are in agreement with the explanation of seasonal variation provided by NZTA. The slightly higher precipitation totals leading up to the 2016 measurements may have played a role in removing fine dust that settles on a road leaving a grittier, higher skid resistant surface. No extreme weather conditions were observed from the NOAA Klamath Falls data. The pavement sections were not controlled to specifically observe trends in seasonal variations but the observations show it likely plays a role in DFT measurements in Oregon.
In other parts of the state, winter weather records in Portland were broken in December 2015 as the wettest month recorded at the airport. This may have influenced skid values in the Northwest Oregon pavement sections but is difficult to tell the significance of its role.
Figure 4.14: Unit A Dynamic Friction Test Results
Unit A- One Year
Unit A- Two Year00.10.20.30.40.50.60.70.80.9
Dry 60Wet 60
Dry 80Wet 80
Coe
ffic
ient
of F
rictio
n, M
u

75
Figure 4.15: Units B and C Dynamic Friction Test Results
Unit B- One Year
Unit B- Two Year
Unit C- One YearUnit C- Two Year
0
0.1
0.2
0.3
0.4
0.5
0.6
0.7
0.8
0.9
Dry 60Wet 60
Dry 80Wet 80
Coe
ffic
ient
of F
rictio
n, M
u

76
Figure 4.16: Units D and E Dynamic Friction Test Results
Unit D- One Year
Unit D- Two Year
Unit E- One YearUnit E- Two Year
0
0.2
0.4
0.6
0.8
1
1.2
1.4
Dry 60Wet 60
Dry 80Wet 80
Coe
ffic
ient
of F
rictio
n, M
u

77
Figure 4.17: Units F and G Dynamic Friction Test Results
Unit F- One Year
Unit F- Two Year
Unit G- One Year
Unit G- Two Year
0
0.2
0.4
0.6
0.8
1
1.2
1.4
Dry 60Wet 60
Dry 80Wet 80
Coe
ffic
ient
of F
rictio
n, M
u

78
Figure 4.18: Unit H Dynamic Friction Test Results
Unit H- One Year
Unit H- Two Year0
0.2
0.4
0.6
0.8
1
1.2
Dry 60Wet 60
Dry 80Wet 80
Coe
ffic
ient
of F
rictio
n, M
u

79
Figure 4.19: Parkway and Prairie Dynamic Friction Test Results
Figure 4.20: Sunset Beach Ln. Dynamic Friction Test Results
Parkway- One Year
Parkway- Two Year
Prairie- One Year
Prairie- Two Year
0
0.1
0.2
0.3
0.4
0.5
0.6
0.7
0.8
0.9
1
Dry 60Wet 60
Dry 80Wet 80
Coe
ffic
ient
of F
rictio
n, M
u
Sunset- Pre-ConstructionSunset- Year One
00.10.20.30.40.50.60.70.80.9
1
Dry 60 Wet 60 Dry 80 Wet 80
Coe
ffic
ient
of F
rictio
n, M
u
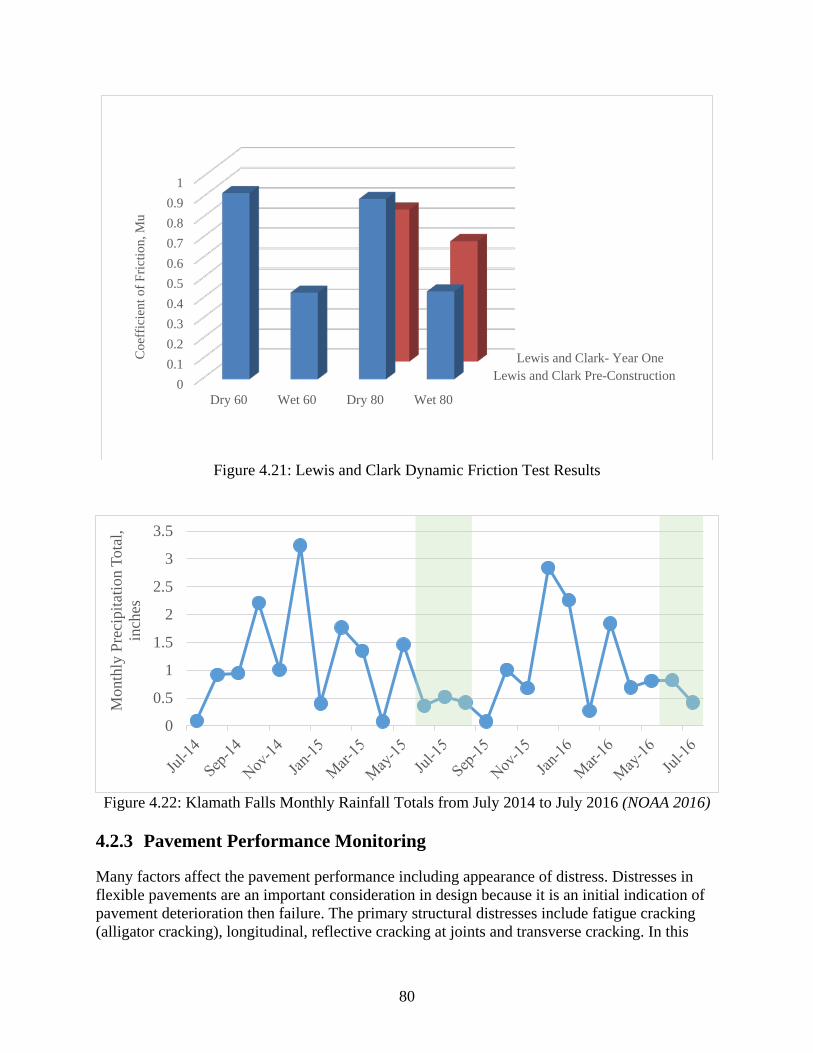
80
Figure 4.21: Lewis and Clark Dynamic Friction Test Results
Figure 4.22: Klamath Falls Monthly Rainfall Totals from July 2014 to July 2016 (NOAA 2016)
4.2.3 Pavement Performance Monitoring
Many factors affect the pavement performance including appearance of distress. Distresses in flexible pavements are an important consideration in design because it is an initial indication of pavement deterioration then failure. The primary structural distresses include fatigue cracking (alligator cracking), longitudinal, reflective cracking at joints and transverse cracking. In this
Lewis and Clark Pre-ConstructionLewis and Clark- Year One
00.10.20.30.40.50.60.70.80.9
1
Dry 60 Wet 60 Dry 80 Wet 80
Coe
ffic
ient
of F
rictio
n, M
u
0
0.5
1
1.5
2
2.5
3
3.5
Mon
thly
Pre
cipi
tatio
n To
tal,
inch
es

81
study, sample roads were selected to represent various ages, traffic volumes and pavement conditions and its equivalent evaluations were made. In order to evaluate the pavement performance, the following distress data of each road section was collected, processed and analyzed.
• Identification of crack type (Transverse, Longitudinal, Fatigue, Pothole, Patching, Bleeding, Loss of Aggregate Cover, Rutting and Raveling)
• Length of longitudinal/transverse cracks
• Width of longitudinal/transverse cracks
• Area of rutting/alligator crack/block crack/edge crack/patching
An example of pavement distress data assembled for Unit A is shown in Table 4.1. After identifying which section, the location of the crack within the 500-foot section, is recorded. Then crack type is identified based on Table 4.2. Then the crack length is also recorded. Finally, the crack thickness (width) is recorded as H (high severity) or L (low severity). Low severity is usually a crack with a mean ≤ 6 mm; while high severity is a crack with a mean ≤ 19 mm (Miller and Bellinger 2003).
Table 4.1: An Example of Pavement Distress Data for Unit A
Unit Section Location of Crack (ft.)
Crack Type
(Code) (Feet) Thickness Unit A 1 29 1 12 H Unit A 1 29-60 2 31 L Unit A 1 60 1 12 H Unit A 1 91 1 12 H Unit A 1 108 1 12 H Unit A 1 130 1 12 H Unit A 1 159 1 12 H Unit A 1 184 1 12 H Unit A 1 208 1 2 L Unit A 1 212 1 12 H Unit A 1 229 1 12 H Unit A 1 232 1 4 L Unit A 1 244 1 8 L

82
Table 4.2: Identification of crack type coding Crack Type Code Transverse 1 Longitudinal 2 Fatigue 3 Pothole 4 Patching 5 Bleeding 6 Loss of Aggregate Cover 7 Rutting 8 Raveling 9 Each type of cracking was analyzed over one- or two- years post-construction. The cracking analyzed for each section includes: transverse, longitudinal, fatigue, any potholes, patching, occurrence of bleeding, loss of aggregate cover, rutting distress and raveling. Each pavement had three 500 foot sections that were surveyed except for Parkway where two sections were surveyed. The following figure present each type of cracking. For section built in the 2014 construction season, two years of construction data are presented. The 2014 season roadways include: Unit A-H, Parkway and Prairie. The roadways constructed in the 2015 construction season include: Lewis & Clark, Sunset Beach, Condon, and Heppner. The post-construction performance cracking information right after the chip seal is not presented because no cracking was visible after the chip seal construction. Figure 4.23 shows the transverse cracking performance of different units pre construction at 2014, 1-year post construction and 2 years post construction. In all cases the roadway transverse cracking length (ft./100 ft. of road) has decreased in the post construction stage than the pre-construction stage. Post-construction assessments were taken within a week or so of the chip seal construction but no distresses were visible. In the cases where no pre-construction transverse cracking was present, no additional cracking has occurred since the placement of the chip seal. Units A, E and H are likely to reach their pre-construction cracking levels within three years but the chip seal has reduced overall cracking in all sections. Showing that for transverse cracking, chip seals have effectively preserved the pavement.
Severity of cracking likely plays a large role on how quickly the cracks are reflected through the chip seal. The crack severity was rated as low, medium or high. Definitions follow the Miller and Bellinger (2003) distress survey manual. The graphs categorizing cracking severity for transverse and longitudinal cracking are shown in Appendix D.

83
Figure 4.23: Average transverse crack length vs. unit performance over time per 100 linear ft. of road
Moreover, Figure 4.24 shows the average longitudinal crack length in different sections from preconstruction to post construction to 2-years construction. Unit D showed the most initial transverse cracking but this was non-load related edge-cracking. The chip seal covered this cracking and no additional longitudinal cracking on the edge was observed on Unit D for two-years post-construction. Unit F showed a significantly higher amount of cracking compared to the other sections. It is apparent that introducing the chip seal has decreased the length of longitudinal cracking in all units. Also the change in longitudinal cracking length between one and two-years post-construction is considered minimal.
Figure 4.25 shows the fatigue cracking in all sections prior to construction. No fatigue cracking was observed in the follow up pavement surveys. This finding is significant in showing that the chip seals are effective in preserving the pavement surfaces. Unit B had the highest fatigue cracking. This was in the wheel path and of low-severity. The chip seal has helped reduced this distress. Fatigue cracks are often a pre-curser to potholes and the observation of sustained reduction in fatigue cracking emphasizes the success of this preservation technique.
0102030405060708090
Tran
sver
se C
rack
ing,
ft./1
00 ft
. Pre-Construction
1-Year Post-Construction
2-Year Post-Construction

84
Figure 4.24: Average Longitudinal Crack Length versus Unit Performance Over Time per 100 linear ft. of road
Figure 4.25: Fatigue cracking in all observed roadways per 100 linear ft. of road
0
20
40
60
80
100
120Lo
ngitu
dian
l Cra
ckin
g, ft
./100
ft.
Pre-Construction
1-Year Post-Construction2-Year Post-Construction
0
20
40
60
80
100
120
Fatig
ue C
rack
ing,
ft2 ./
100
ft. Pre-Construction
1-Year Post-Construction
2-Year Post-Construction

85
Figure 4.26 further shows the effect of chip seal construction on reducing potholes for the sections observed. On these sections, Pre-construction observations were made in 2014 immediately prior to chip sealing, followed by 1 and 2 years after construction. This graph shows total pothole area observed on all three 500 ft. sections. Pothole cracking have initially appeared in three units which are F, G and H. Only a few isolated areas for all sections were found two-years post construction. Sunset Beach, Lewis and Clark, Heppner, and Condon showed no pothole distresses.
Figure 4.26: Average Pothole Area versus Unit Performance Over Time
Patching was also analyzed in different units and is shown in Figure 4,27. No patching was observed during the one-year post-construction survey. In Unit C, the wheel paths were ground and patched in advance of the chip sealing project. From the graph, it shows that Unit C required re-patching two-years post-construction. The initial patching lasted one year. Based on this observation, the chip seal did not preserve the patching in the distressed wheel paths. Figure 10 shows that patching has initially appeared in two sections C and E. Unit E had 1000 square feet of patching along the center line. Sunset Beach, Lewis and Clark, Heppner, and Condon had no patching to report.
0
1
2
3
4
5
6
7
Unit A Unit B Unit C Unit D Unit E Unit F Unit G Unit H Parkway PrarieRoad
Poth
ole
area
(ft2 )
pre-2014 2016

86
Figure 4.27: Average Patching Crack Length versus Unit Performance Over Time Finally, two chip-seal related distresses are studied which are bleeding and loss of aggregate cover. Figure 4.28 shows there was some bleeding in Prairie Road before construction. On Unit E, 1000 sq. feet of aggregate loss was reported in 2015. The aggregate loss led to what looked like bleeding in in the 2016 survey but due to the aggregate loss, this was reported in the aggregate loss category. The occurred mostly in the wheel paths. Unit G exhibited loss of aggregate in the two-year post construction condition survey. Unit C exhibited loss of aggregate, mostly in the wheel paths as this was the section with the distressed, patched wheel paths. The patching was reapplied as indicated in Figure 4.10 and this is the reason no loss of aggregate was reported in the 2016 survey. Two-years post-construction, Unit G exhibited loss of aggregate along the center line. After two-years post-construction bleeding started to appear in units B, D, E and Prairie Roads having the most crack length in Unit B. Figure 4.29 shows the performance against the loss of aggregate cover. In 2015, it appeared in Unit C and D in 2016, it was only depicted in Unit G. Bleeding and loss of aggregate cause a similar problem in that roadway texture is reduced. Sunset Beach, Lewis and Clark, Heppner, and Condon had no bleeding of loss of aggregate to report one-year post-construction.
02000400060008000
1000012000
Patc
hing
Are
a (f
t2 )
Pre-Construction Two-Years Post-Construction

87
Figure 4.28: Average Bleeding Crack Length versus Unit Performance Over Time
Figure 4.29: Average Loss of Aggregate Cover versus Unit Performance Over Time
0
50
100
150
200
250
300B
leed
ing
Are
a (f
t2 ) p
er 1
00 ft
. of
Roa
dway
Pre-Construction One-Year Post-Construction Two-Year Post-Construction
0
10
20
30
40
50
60
70
Loss
of A
ggre
gate
Are
a (f
t2 ) p
er 1
00 ft
. of
Roa
dway
One-Year Post-Construction Two-Year Post-Construction

88
4.3 LABORATORY ANALYSIS OF CHIP SEAL MATERIALS
4.3.1 Aggregate Material Properties
Sieve Analysis 4.3.1.1
A sieve analysis was performed on the aggregates for all test sections. The aggregate gradations are shown in Figure 4.30. An ideal gradation for chip seal is the uniform gradation. All aggregates were found to be uniformly graded, with the Parkway aggregates having the most uniform gradation and Unit A with the least uniformity.
Figure 4.30: 0.45 Power Chart for Aggregate Gradations with Arrow Indicating Median Aggregate Size
The aggregate laboratory results, Table 4.3, show a low percentage of flat particles compared to the recommendation of 25 for < 1500 vehicles per day (Shuler et al. 2011). The performance uniformity coefficient (PUC) was also calculated and shown in Table 4.3. The percent aggregates that contribute to bleeding and aggregate loss are shown. The closer the PUC is to zero, the more uniform the gradation. This provides a better metric than McLeod’s uniformity coefficient (Lee and Kim 2009). Unit H has the most uniform gradation but PUC is similar for Units H, G and F.
0
10
20
30
40
50
60
70
80
90
100
% P
ASS
ING
SIEVE SIZES ^ 0.45
Klamath Unit A Chip
Klamath Unit F Chip
Klamath Unit H Chip
Klamath Hot Mix After TolueneWashParkway Hot Mix After TolueneWash

89
Table 4.3: Laboratory Measured Aggregate Properties
Sample ID Flakiness Index
Aggregate contributing to bleeding (PEM), %
Aggregate contributing to
loss (100-P2EM), %
Performance Uniformity Coefficient
Unit A Klamath Chips 13.1 33 20 0.41
Unit F &G Klamath Chips 6.4 11 10 0.12
Unit H Klamath Chips 12.1 11 6 0.12
Hot Applied Klamath Chips
(Units B-E) 5.2 16 18 0.20
Flakiness Index 4.3.1.2
Flakiness index represents the percentage of flaky aggregates present in each sample. Table 4.4 represents the flakiness index for different units. Unit H exhibited the highest percentage of 6.4%.
Table 4.4: Flakiness Index
Sample Flakiness Index
Unit H Chips 12.1 Unit F & G Chips 6.4
Hot Applied Klamath Chips 5.2 Hot Applied Parkway Chips 5.2
Micro Deval 4.3.1.3
The Micro-Deval test is used to measure the abrasion resistance. It was conducted on different section’s chips and Table 4.5 represents a summary of results. The tested chips had equivalent performance of percentage loss (6-7%) with highest loss of 8.6% for Unit H Klamath. Micro-Deval test results were relatively similar for all aggregates tested.

90
Table 4.5: Micro Deval Test Results
Sample ID Dry Weight of Sample
Weight of Sample After Abrasion
Percent Loss
Unit A Klamath Chips (above #4 sieve) 1500.7 1409.3 6.09
Unit F Klamath Chips (above #4 sieve) 1500.6 1388.8 7.45
Unit H Klamath Chips (above #4 sieve) 1500.3 1371.3 8.60
Hot Applied Klamath Chips (above #4 sieve) 1500.2 1392.1 7.21
Parkway Eugene Chips (above #4 sieve) 1500.7 1399.3 6.76
The general aggregate properties as specific gravity, density and percent absorption are presented in Table 4.6.
Table 4.6: General Aggregate Properties
Sample ID Specific Gravity (OD)
Specific Gravity (SSD)
Apparent Specific Gravity
Density (OD)
(lb/ft³)
Density (SSD) (lb/ft³)
Apparent Density (lb/ft³)
Absorption, %
Unit A Klamath Chips (above #8
sieve) 2.615 2.667 2.760 162.8 166.1 171.85 2.01
Unit F Klamath Chips (above #8
sieve) 2.584 2.638 2.730 160.9 164.3 169.99 2.06
Unit H Klamath Chips (above #8
sieve) 2.512 2.579 2.691 156.4 160.6 167.57 2.65
Hot Applied Klamath Chips
(above #8 sieve) 2.559 2.601 2.670 159.4 162.0 166.29 1.63
Parkway Eugene Chips (above #8
sieve) 2.633 2.672 2.740 164.0 166.4 170.65 1.49

91
4.3.2 Aggregate Imaging System Properties
The Aggregate Imaging System (AIMS) provides a useful tool to determine aggregate shape and texture properties. The purpose for using AIMS is to illustrate the surface structure of the chip seal aggregate samples. The primary factors assessed are shape, angularity and texture. Moreover, the aggregate imaging system was used for the following units.
1. Klamath Unit A Chip - test samples for: 3/8, #4, #8
2. Klamath Unit F Chip - test samples for: 3/8, #4
3. Klamath Unit H Chip- test samples for: 3/8, #4
4. Klamath Hot Mix- test samples for: 3/8, #4
5. Parkway Hot Mix- test samples for: #4
Aggregate angularity is important for assessing the skid resistance on different pavement surfaces and binder-aggregate adhesion properties. The gradient angularity is expressed as a relative range of zero to 10000 with a perfect circle having a value of zero. A higher value which is desired indicates a more angular shape. The gradient angularity is shown in 4.31. The average gradient angularity is relatively similar for all of the aggregates collected for the test sections. From results, one can notice that all division samples are composed primarily of sub-rounded aggregates. On the other hand, 4.32 represents an example of gradation for Unit A. Graphs for gradation for the rest of units is available in Appendix B.
Figure 4.31: Gradient Angularity for Different Sections

92
Figure 4.32: Distribution for Gradient Angularity of Cover Aggregates for Unit A 4.4 CORRELATIONS BETWEEN LAB AND FIELD
Aggregate gradation and micro-Deval testing were performed on the chip seal aggregates. All the gradations are uniform with Unit A having slightly higher aggregates passing #4 sieve. The hot-applied chip seal sections (Units B, C, D and E) have the same aggregate and Units F and G have the same aggregates. The flakiness index was measured and results showed a low percentage of flat particles compared to the recommendation of 25 for <1500 vehicles per day. Micro-Deval test results were similar for all aggregates tested. Results were compared with past Oregon micro-Deval research, and the aggregates with a lower percentage of loss in micro-Deval testing have shown to perform well but results vary because of the abundant factors that influence chip seal performance. Micro-Deval is not always a good indicator because aggregates showing a higher percentage of loss have also performed adequately. The performance uniformity coefficient (PUC) was also calculated and the closer the PUC is to zero, the more uniform the gradation. This provides a better metric than McLeod’s uniformity coefficient. Unit H has the most uniform gradation but PUC is similar for Units H, G and F. AIMS testing was further performed to study aggregate angularity, sphericity and texture. Results were compared with past Oregon micro-Deval research, Figure 4.33. In general, the aggregates with a lower percentage of loss in micro-Deval testing have shown to perform well but results vary because of the abundant factors that influence chip seal performance. Micro-Deval is not always a good indicator because aggregates showing a higher percentage of loss have also performed adequately as illustrated in Figure 4.33.
0
10
20
30
40
50
60
70
80
90
100
0 2000 4000 6000 8000 10000
Cum
ulat
ive
% o
f Par
ticle
s
UNIT A
Unit A 3/8 Unit A #4 Unit A #8
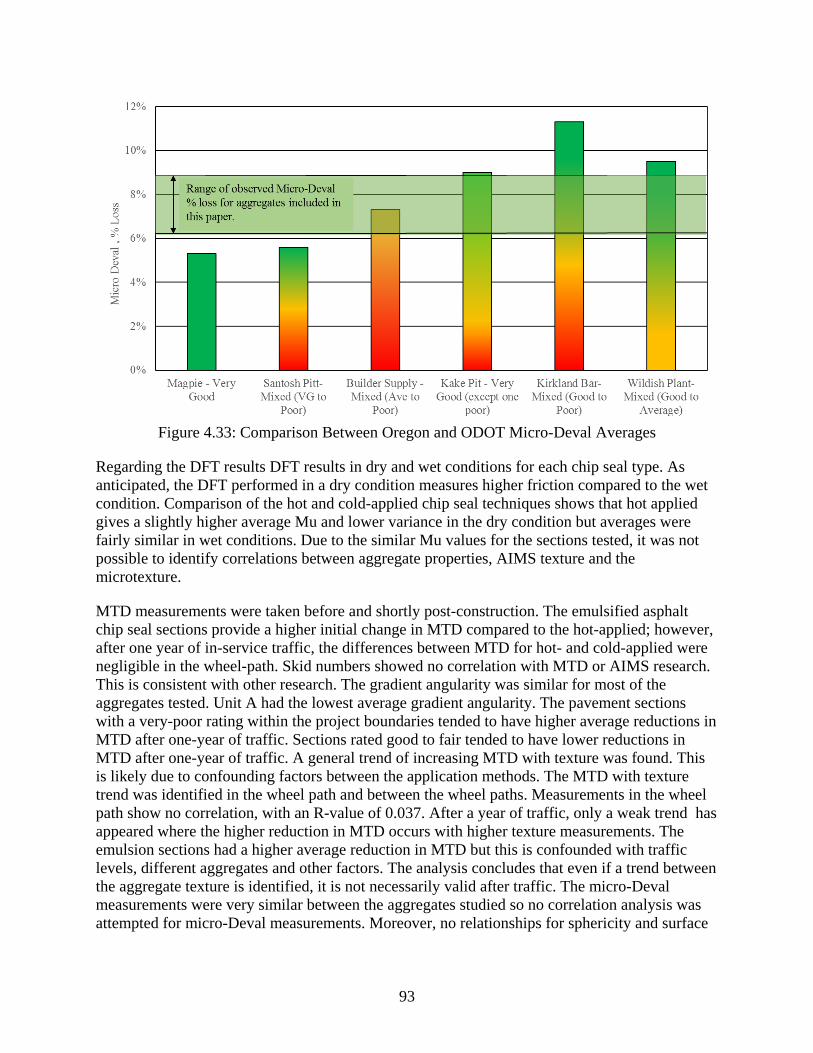
93
Figure 4.33: Comparison Between Oregon and ODOT Micro-Deval Averages
Regarding the DFT results DFT results in dry and wet conditions for each chip seal type. As anticipated, the DFT performed in a dry condition measures higher friction compared to the wet condition. Comparison of the hot and cold-applied chip seal techniques shows that hot applied gives a slightly higher average Mu and lower variance in the dry condition but averages were fairly similar in wet conditions. Due to the similar Mu values for the sections tested, it was not possible to identify correlations between aggregate properties, AIMS texture and the microtexture.
MTD measurements were taken before and shortly post-construction. The emulsified asphalt chip seal sections provide a higher initial change in MTD compared to the hot-applied; however, after one year of in-service traffic, the differences between MTD for hot- and cold-applied were negligible in the wheel-path. Skid numbers showed no correlation with MTD or AIMS research. This is consistent with other research. The gradient angularity was similar for most of the aggregates tested. Unit A had the lowest average gradient angularity. The pavement sections with a very-poor rating within the project boundaries tended to have higher average reductions in MTD after one-year of traffic. Sections rated good to fair tended to have lower reductions in MTD after one-year of traffic. A general trend of increasing MTD with texture was found. This is likely due to confounding factors between the application methods. The MTD with texture trend was identified in the wheel path and between the wheel paths. Measurements in the wheel path show no correlation, with an R-value of 0.037. After a year of traffic, only a weak trend has appeared where the higher reduction in MTD occurs with higher texture measurements. The emulsion sections had a higher average reduction in MTD but this is confounded with traffic levels, different aggregates and other factors. The analysis concludes that even if a trend between the aggregate texture is identified, it is not necessarily valid after traffic. The micro-Deval measurements were very similar between the aggregates studied so no correlation analysis was attempted for micro-Deval measurements. Moreover, no relationships for sphericity and surface

94
characteristics were identified. It is important to note many factors contribute to a pavement’s MTD.
4.5 CHIP SEAL DESIGN
In this section two design methodologies would be investigated which are the McLeod (MnDOT) and the New Zealand Chip Seal Design Methodologies. This section is designed as a step-by-step guide to developing the chip seal design rates. Moreover, aggregate application rate and binder application rates are discussed with considerations as traffic, climate, and existing surface condition. The two methods, the McLeod and the New Zealand Chip Seal Design, are presented in this section. The equations and concepts used to calculate the application rates for aggregates and binder for each section are presented and compared to the actual rates used in the field.
4.5.1 McLeod Design based on Minnesota Seal Coat Design Guide (Wood et al. 2006)
Step 1: The aggregate gradation must be conducted to determine the median particle size which is a theoretical sieve size through which 50 percent of the material passes (50 percent passing size). The aggregate gradations and determination of the median particle size is illustrated in Figure 4.30. The sieves used in determining the gradation are shown in Table 4.7.
Table 4.7: Opening Size per Sieve
Sieve Name Opening U.S. Customary Units
Opening S.I. Metric Units
1 inch 1.000 in. 25.0 mm
¾ inch 0.750 in. 19.0 mm
½ inch 0.500 in. 12.5 mm
3/8 inch 0.375 in. 9.5 mm
¼ inch 0.250 in. 6.3 mm
No. 4 0.187 in. 4.75 mm
No. 8 0.0937 in. 2.36 mm
No. 16 0.0469 in. 1.18 mm
No. 50 0.0117 in. 300 µm
No. 200 0.0029 in. 75 µm

95
Step 2: Determine the median aggregate size based on aggregate gradation charts. The following Table 4.8 shows the median particle size for the chip seal sections studied.
Table 4.8: Median Size for each ODOT chip seal section
Test Section Median Size (inches)
Parkway 0.28
Unit A 0.25
Unit B 0.30
Unit C 0.30
Unit D 0.30 Unit E 0.30 Unit F 0.28
Unit G 0.28
Unit H 0.28 Step 3: Determine the flakiness index for the aggregate. The FI and the AADT is shown in Table 4.9.
Table 4.9: FI and AADT for different Sections
Test Section Flakiness Index AADT
Parkway 5.2 4000
Unit A 13.1 460
Unit B 5.2 2300
Unit C 5.2 2900
Unit D 5.2 1280
Unit E 5.2 1345
Unit F 6.4 2650
Unit G 6.4 670
Unit H 12.1 690

96
Step 4: Calculate the average least dimension (ALD) was also calculated for all sections and shown in Table 4.10. The following equation is used to find the ALD:
𝑯𝑯 = 𝑴𝑴𝟏𝟏.𝟏𝟏𝟏𝟏𝟏𝟏𝟏𝟏𝟏𝟏𝟏𝟏+(𝟎𝟎.𝟎𝟎𝟏𝟏𝟏𝟏𝟏𝟏𝟎𝟎𝟎𝟎)(𝑭𝑭𝑭𝑭)
(4.2)
Table 4.10: ALD for different sections
Test Section ALD (in.) Parkway 0.23
Unit A 0.20
Unit B 0.25
Unit C 0.25
Unit D 0.25
Unit E 0.25
Unit F 0.23
Unit G 0.23
Unit H 0.22 Step 5: Determine the loose unit weight (LUW) of the aggregate. This is calculated for different sections as shown in Table 4.11. Due to limited aggregate quantities, the experiment included a metal cylinder with the volume of 0.50 ft3 which was loosely filled with aggregate until full. The weight of the aggregate was then determined.
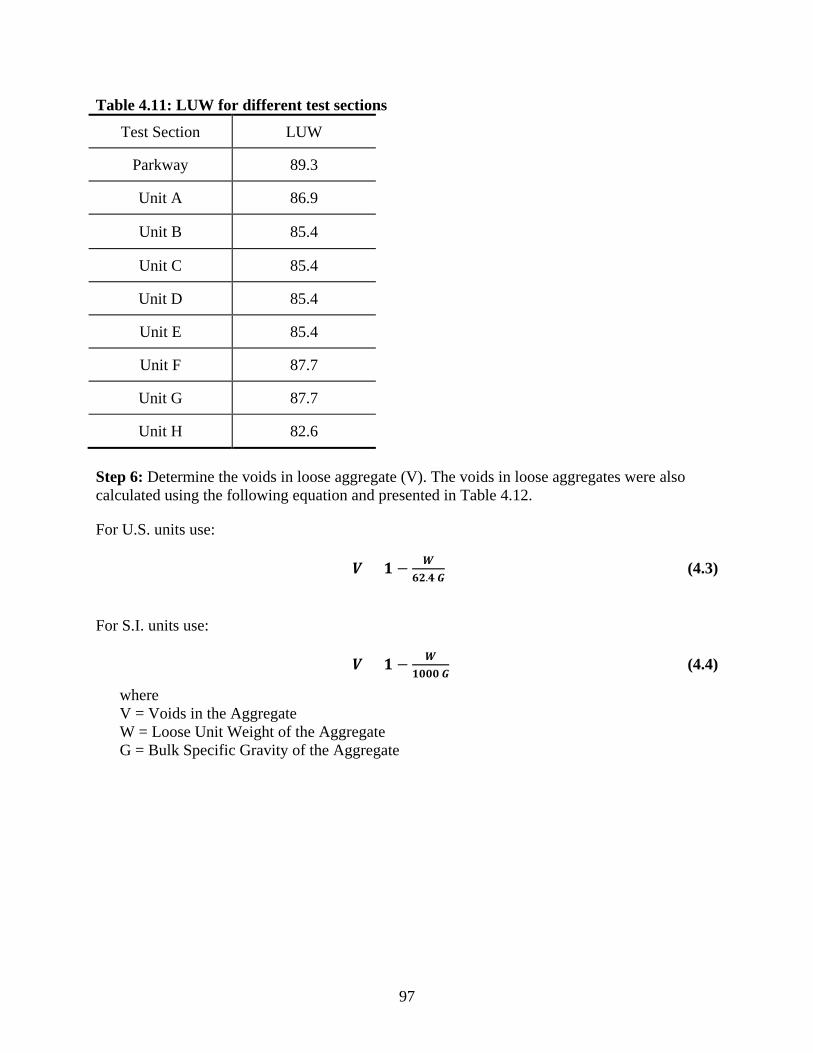
97
Table 4.11: LUW for different test sections
Test Section LUW
Parkway 89.3
Unit A 86.9
Unit B 85.4
Unit C 85.4
Unit D 85.4
Unit E 85.4
Unit F 87.7
Unit G 87.7
Unit H 82.6
Step 6: Determine the voids in loose aggregate (V). The voids in loose aggregates were also calculated using the following equation and presented in Table 4.12.
For U.S. units use:
𝑽𝑽 = 𝟏𝟏 − 𝑾𝑾𝟎𝟎𝟏𝟏.𝟏𝟏 𝑮𝑮
(4.3)
For S.I. units use:
𝑽𝑽 = 𝟏𝟏 − 𝑾𝑾𝟏𝟏𝟎𝟎𝟎𝟎𝟎𝟎 𝑮𝑮
(4.4)
where V = Voids in the Aggregate W = Loose Unit Weight of the Aggregate G = Bulk Specific Gravity of the Aggregate

98
Table 4.12: LUW, Bulk Specific Gravity and V Test Section LUW Bulk Specific
Gravity Voids in Loose Aggregate, V
Parkway 89.3 2.633 0.46
Unit A 86.9 2.615 0.47
Unit B 85.4 2.559 0.47
Unit C 85.4 2.559 0.47
Unit D 85.4 2.559 0.47
Unit E 85.4 2.559 0.47
Unit F 87.7 2.584 0.46
Unit G 87.7 2.584 0.46
Unit H 82.6 2.512 0.47
Step 7: Determine aggregate, pavement surface and traffic factors for design. The aggregate absorption is considered in the binder application rate. The aggregates have absorptions ranging from 1.5 to 2.5%. The aggregate absorption factor (“A”) used for the aggregates is 0.02 gal/yd2. Table 4.13.

99
Table 4.13: Aggregate absorption after correction factor
Test Section Aggregate Absorption
Parkway 1.49
Unit A 2.01
Unit B 1.63
Unit C 1.63
Unit D 1.63
Unit E 1.63
Unit F 2.06
Unit G 2.06
Unit H 2.65
Also different factors are obtained as traffic volume and traffic whip off factor as shown in Table 4.14. The traffic correction factor is needed in the binder application rate and the traffic whip-off factor, or percent allowable waste (E) is used in determining the percent excess aggregate allowed on the roadway.

100
Table 4.14: Traffic Factors
Test Section AADT Traffic
Correction Factor
Traffic whip-off Factor, E
Parkway 4000 0.6 1.1
Unit A 460 0.75 1.05
Unit B 2300 0.6 1.1
Unit C 2900 0.6 1.1
Unit D 1280 0.65 1.1
Unit E 1345 0.65 1.1
Unit F 2650 0.6 1.1
Unit G 670 0.7 1.1
Unit H 690 0.7 1.1
Step 8: Determine the cover aggregate application rate. With all factors and calculations, the aggregate application rate was obtained using McLeod method using the following equation: U.S. Units:
𝐶𝐶 = 46.8�1 − (0.4)(𝑉𝑉)�(𝐻𝐻)(𝐺𝐺)(𝐸𝐸) (4.3)
Where: C = Cover Aggregate (lbs/yd2 ) V = Voids in Loose Aggregate (%) H = ALD (inches) G = Bulk Specific Gravity E = Wastage Factor (%)
S.I. Units:
𝐶𝐶 = �1 − (0.4)(𝑉𝑉)�(𝐻𝐻)(𝐺𝐺)(𝐸𝐸) (4.4)
Where: C = Cover Aggregate (kg/m2 ) V = Voids in Loose Aggregate (%) H = ALD (mm) G = Bulk Specific Gravity E = Wastage Factor (%)
The McLeod aggregate chip application rates and different sections as shown in Table 4.15:
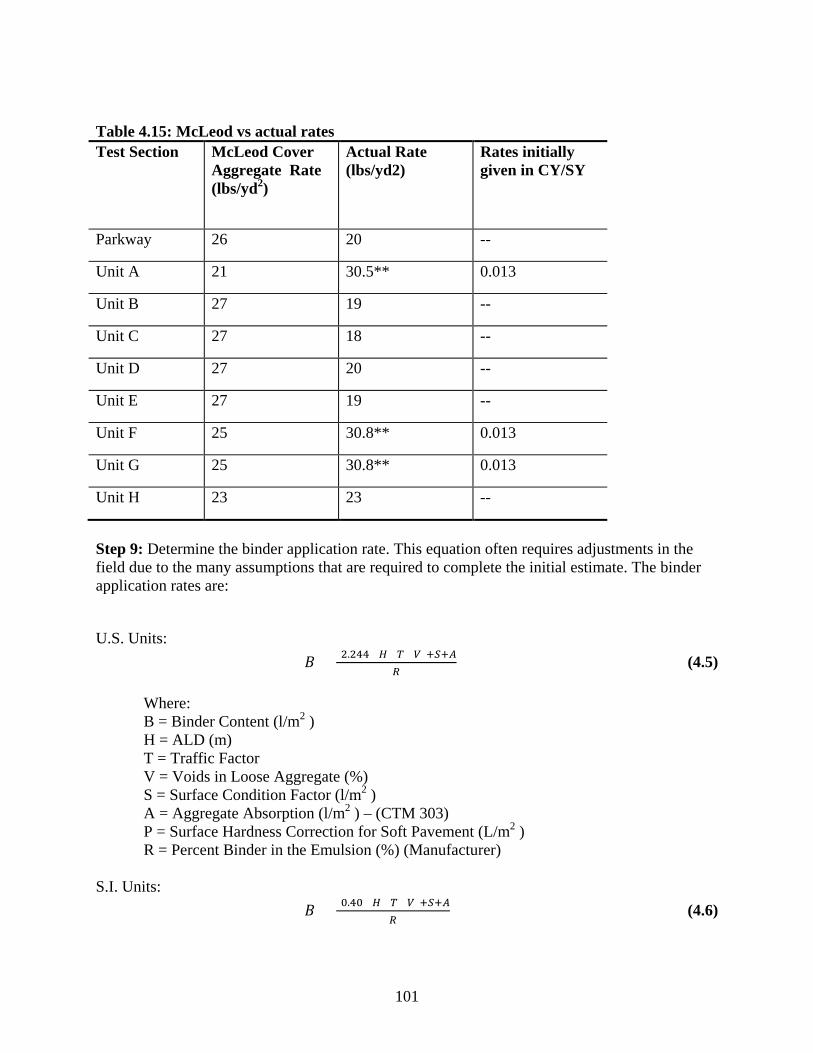
101
Table 4.15: McLeod vs actual rates Test Section McLeod Cover
Aggregate Rate (lbs/yd2)
Actual Rate (lbs/yd2)
Rates initially given in CY/SY
Parkway 26 20 --
Unit A 21 30.5** 0.013
Unit B 27 19 --
Unit C 27 18 --
Unit D 27 20 --
Unit E 27 19 --
Unit F 25 30.8** 0.013
Unit G 25 30.8** 0.013
Unit H 23 23 --
Step 9: Determine the binder application rate. This equation often requires adjustments in the field due to the many assumptions that are required to complete the initial estimate. The binder application rates are:
U.S. Units:
𝐵𝐵 = (2.244)(𝐻𝐻)(𝑇𝑇)(𝑉𝑉)+𝑆𝑆+𝐴𝐴𝑅𝑅
(4.5)
Where: B = Binder Content (l/m2 ) H = ALD (m) T = Traffic Factor V = Voids in Loose Aggregate (%) S = Surface Condition Factor (l/m2 ) A = Aggregate Absorption (l/m2 ) – (CTM 303) P = Surface Hardness Correction for Soft Pavement (L/m2 ) R = Percent Binder in the Emulsion (%) (Manufacturer)
S.I. Units:
𝐵𝐵 = (0.40)(𝐻𝐻)(𝑇𝑇)(𝑉𝑉)+𝑆𝑆+𝐴𝐴𝑅𝑅
(4.6)
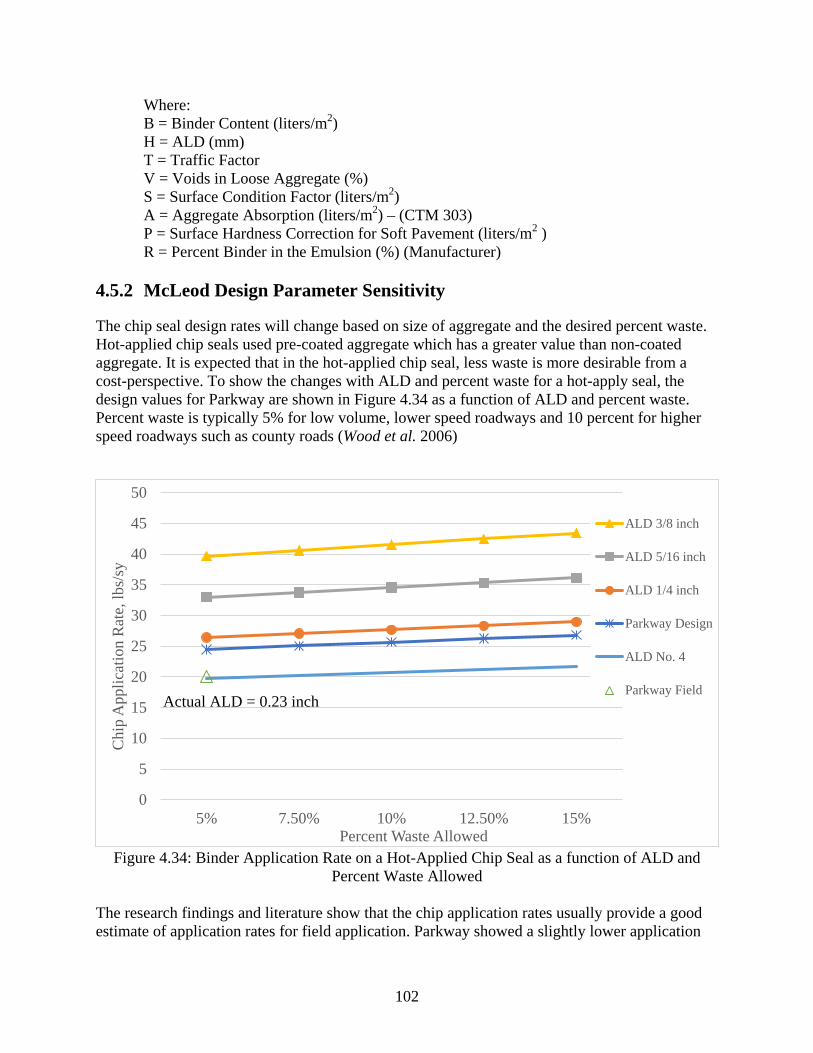
102
Where: B = Binder Content (liters/m2) H = ALD (mm) T = Traffic Factor V = Voids in Loose Aggregate (%) S = Surface Condition Factor (liters/m2) A = Aggregate Absorption (liters/m2) – (CTM 303) P = Surface Hardness Correction for Soft Pavement (liters/m2 ) R = Percent Binder in the Emulsion (%) (Manufacturer)
4.5.2 McLeod Design Parameter Sensitivity
The chip seal design rates will change based on size of aggregate and the desired percent waste. Hot-applied chip seals used pre-coated aggregate which has a greater value than non-coated aggregate. It is expected that in the hot-applied chip seal, less waste is more desirable from a cost-perspective. To show the changes with ALD and percent waste for a hot-apply seal, the design values for Parkway are shown in Figure 4.34 as a function of ALD and percent waste. Percent waste is typically 5% for low volume, lower speed roadways and 10 percent for higher speed roadways such as county roads (Wood et al. 2006)
Figure 4.34: Binder Application Rate on a Hot-Applied Chip Seal as a function of ALD and
Percent Waste Allowed The research findings and literature show that the chip application rates usually provide a good estimate of application rates for field application. Parkway showed a slightly lower application
0
5
10
15
20
25
30
35
40
45
50
5% 7.50% 10% 12.50% 15%
Chi
p A
pplic
atio
n R
ate,
lbs/
sy
Percent Waste Allowed
ALD 3/8 inch
ALD 5/16 inch
ALD 1/4 inch
Parkway Design
ALD No. 4
Parkway FieldActual ALD = 0.23 inch

103
rate than the design but was within a reasonable estimate. The binder application for Parkway was also calculated and is shown in Figure 4.35. There is a large discrepancy between the field and the design binder application rate. This binder application equation uses assumptions about the roadway surface, voids in aggregates and porosity of the road surface. In addition, the viscosity of the binder will influence the rate of absorption and the final thickness of the binder layer. It is likely that the viscosity differences between hot-apply and emulsified asphalts requires consideration in the design as well. Due to the assumptions, the binder rate often requires adjustment in the field, generally requiring an adjustment upward (Wood et al. 2006) as demonstrated in this example. Developing the chart shown in Figure 4.35 for each chip seal design, provides the field inspector a better understanding of the influence of rate adjustments during construction.
Figure 4.35: Binder Application Rate on a Hot-Applied Seal as a function of Traffic and Surface
Texture Since Parkway was a hot-applied chip seal, the McLeod chip seal design is also presented for Unit H, an emulsified asphalt chip seal. The chip rate as a function of ALD and percent waste allowed is shown in Figure 4.36. The binder application rate as a function of pavement surface and traffic volume is shown in Figure 4.37.
0.1
0.15
0.2
0.25
0.3
0.35
0.4
Under 100 100-500 500-1000 1000-2000 Over 2000
Bin
der A
pplic
atio
n R
ate,
gal
/sy
Traffic Volume, (AADT)
Badly Pocked,Porous &OxidizedSlightly Porous& Oxidized
ParkwayDesign
Smooth, Non-Porous Surface
Black, FlushedAsphalt
Actual AADT = 4000 Actual Field Rate = 0.41 gal/sy
Embedment: 85% 75% 70% 65% 60%
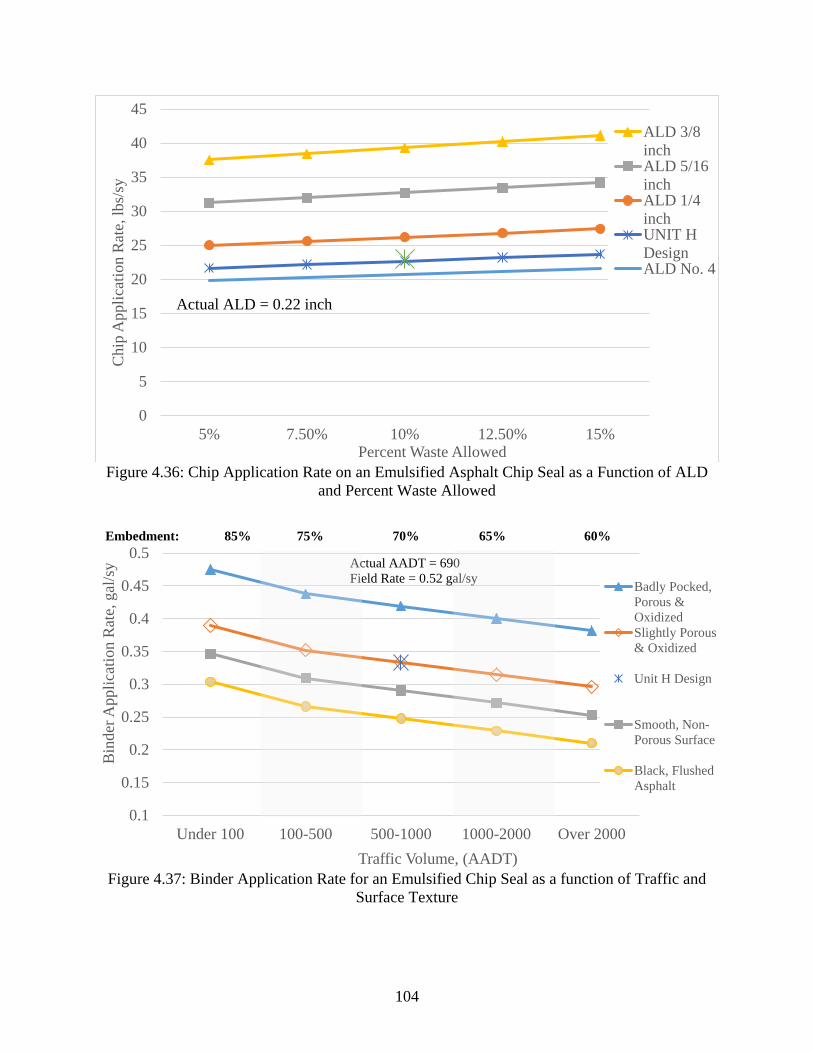
104
Figure 4.36: Chip Application Rate on an Emulsified Asphalt Chip Seal as a Function of ALD
and Percent Waste Allowed
Figure 4.37: Binder Application Rate for an Emulsified Chip Seal as a function of Traffic and
Surface Texture
0
5
10
15
20
25
30
35
40
45
5% 7.50% 10% 12.50% 15%
Chi
p A
pplic
atio
n R
ate,
lbs/
sy
Percent Waste Allowed
ALD 3/8inchALD 5/16inchALD 1/4inchUNIT HDesignALD No. 4
Actual ALD = 0.22 inch
0.1
0.15
0.2
0.25
0.3
0.35
0.4
0.45
0.5
Under 100 100-500 500-1000 1000-2000 Over 2000
Bin
der A
pplic
atio
n R
ate,
gal
/sy
Traffic Volume, (AADT)
Badly Pocked,Porous &OxidizedSlightly Porous& Oxidized
Unit H Design
Smooth, Non-Porous Surface
Black, FlushedAsphalt
Actual AADT = 690 Field Rate = 0.52 gal/sy
Embedment: 85% 75% 70% 65% 60%

105
After calculations done using the McLeod method, other calculations for application rates are also presented using the New Zealand design.
4.5.3 New Zealand Design and comparison to McLeod
Determination and Comparison of Chip Application Rate 4.5.3.1
For Single Coat Seals, the rate is calculated using the following equation:
Rate = 750/ALD (m2/m3) (4.7)
Based upon Equation 4.7, Table 4.16 was developed.
Table 4.16: Application Rates per Section
Test Section
New Zealand Chip Rate (lbs/yd2)
McLeod Cover Aggregate Rate
(lbs/yd2)
Actual Applied Rate
(lbs/yd2)
Rates (cy/yd2)
Parkway 21 26 20
Unit A 17 21 30.5** 0.013
Unit B 21 27 19
Unit C 21 27 18
Unit D 21 27 20
Unit E 21 27 19
Unit F 20 25 30.8** 0.013
Unit G 20 25 30.8** 0.013
Unit H 18 23 23
Moreover, Table 4.17 provides a comparison between different design methods and an optimum method determined based upon single layer of chips and the percent over chipping was calculated per section. All the chip seal application rates were compared using a 1 square yard box shown in Figure 4.39. All chip seal sections with collected aggregate are shown in Appendix C. The pre-coated aggregate had the lowest percent

106
over-chipping. This finding shows that the emulsified asphalt sections are likely being over-chipped.
Table 4.17: Chip Rate using different Methods Chip Rate Lb/SY
Zone New Zealand McLeod Actual Optimum % over chipping
Parkway 21 26 20 17.8 12.5
Unit A 17 21 30.5 17.6 73.1
Unit B 21 27 19 17.6 7.9
Unit C 21 27 18 17.6 2.2
Unit D 21 27 20 17.6 13.6
Unit E 21 27 19 17.6 7.9
Unit F 20 25 30.8 15.6 97.9
Unit G 20 25 30.8 (Same as UNIT F)
Unit H 18 23 23 16.8 36.8 Moreover, Figure 4.38 shows the different aggregate chip rates in a graphical form.
Figure 4.38: Comparison of different chip rates per section
05
101520253035
Chi
p R
ate
lbs/
sy
New Zealand McLeod Actual Optimum

107
Figure 4.39: Example of Chip Seal Design Comparisons
Determination of Binder Application Rate 4.5.3.2
The New Zealand design uses equivalent light vehicles (elv) and volume of voids as a function of “elv”. Heavy commercial vehicle (HVC) was estimated at 10% for each section.
elv= v/l/d x (1+0.99xm), (4.8)
where m is percentage of HCVs and v/l/d is vehicle per lance per day.
And v/l/d = AADT/2 (4.9)
Table 4.18 displays the design factors for each chip seal studied and the assumptions made for the calculations.

108
Table 4.18: Factors of different sections Test Section
AADT Percent Trucks
HCV ELV Tf
Parkway 4000 10 400 3800 1.9
Unit A 460 10 46 437 1.9
Unit B 2300 10 230 2185 1.9
Unit C 2900 10 290 2755 1.9
Unit D 1280 10 128 1216 1.9
Unit E 1345 10 134.5 1277.75 1.9
Unit F 2650 10 265 2517.5 1.9
Unit G 670 10 67 636.5 1.9
Unit H 690 10 69 655.5 1.9
In the New Zealand design, texture is taken into considerations for determining the binder application rate and is shown in Table 4.19.
Table 4.19: Texture depth of different sections Test Section Texture depth
Parkway N/A
Unit A 1.197888
Unit B 0.888918
Unit C 0.640725
Unit D 1.13102
Unit E 0.994088
Unit F 0.818836
Unit G 1.06713
Unit H 1.897657
Finally, Table 4.20 was developed to compare the binder application rate using different design methods and the actual rate used on site.

109
Table 4.20: Comparison of different binder application rates
Test Section
Binder Application Starting Rate in Field (gal/sy)
(Different surface factors: S=0.06 / S=0.09)
New Zealand Method (gal/sy)
Actual Binder Rate (gal/sy)
Parkway 0.24/0.25 * 0.41 gallons / sy
Unit A 0.43/0.44 0.36 0.48 gallons / sy
Unit B 0.25/0.27 0.37 0.37 gallons / sy
Unit C 0.25/0.27 0.36 0.37 - 0.38 gallons / sy
Unit D 0.26/0.28 0.40 0.37 gallons / sy
Unit E 0.26/0.28 0.39 0.36 gallons / sy
Unit F 0.39/0.42 0.34 0.50 gallons / sy
Unit G 0.44/0.46 0.39 0.50 gallons / sy
Unit H 0.44/0.45 0.41 0.52 gallons / sy
Estimation of the change in binder and chip application rates between lab 4.5.3.3design and field application
This section uses the data from the back-calculated chip seal design application rates and compares the field application rates for both binder and chips. Each design method was evaluated for the difference between the field application rate and the design application rate for chips and binder. The calculated differences are shown in Table 4.21. The negative numbers indicate design application rates are higher than the field application rates. Conversely, a positive number indicates that more material was required in the field application. The change in binder application rate and the change in chip application rate were graphed to identify trends in the data and the changes between the two design methods. Figure 4.40 plots the McLeod differences between design and field applications and Figure 4.41 plots the New Zealand differences. The Minnesota seal coat manual indicates that binder application rates are often higher that what is required in the design. The data indicates that if no changes in the chip application rate are required the increased binder requirement may be around 0.08 gal/sy. The range of data shows 0.11-0.04 increase in binder rates based on differences between the field and design. The New Zealand method shows an opposite trend compared to the McLeod method. The trend observed for the New Zealand design method is more intuitive because as the field section is over-chipped more, the binder rate increases as well. The New Zealand design

110
method also gave values that matched the field application rates quite well for both binder and chip application rates in half of the sections.
Table 4.21: Changes in Binder and Chip Application Rates between Design and Field
Test Section
Binder delta (gal/sy) Chip Application Rate Delta (lbs/yd2),
Delta = Actual Rate – Design: The negative numbers indicate design application rate is higher
than field application
McLeod New Zealand McLeod New
Zealand 1-Layer
thick
S=0.06 S=0.09 Parkway 0.17 0.16 * -6 -1 2.2 Unit A 0.05 0.04 0.12 9.5 13.5 12.9 Unit B 0.12 0.1 0 -8 -2 1.4 Unit C 0.13 0.11 0.02 -9 -3 0.4 Unit D 0.11 0.09 -0.03 -7 -1 2.4
Unit E 0.1 0.08 -0.03 -8 -2 1.4
Unit F 0.11 0.08 0.16 5.8 10.8 15.2
Unit G 0.06 0.04 0.11 5.8 10.8 15.2
Unit H 0.08 0.07 0.11 0 5 6.2

111
Figure 4.40: Changes between design and field application rates for McLeod Method
R² = 0.5047
R² = 0.494
0
0.02
0.04
0.06
0.08
0.1
0.12
0.14
0.16
0.18
-10 -5 0 5 10 15
Cha
nge
in B
inde
r App
licat
ion
Rat
e, (g
al/s
y)
(The
add
ition
al a
mou
nt o
f bin
der r
equi
red
in th
e fie
ld)
Change in Chip Application Rate, lbs/yd2
McLeod S=0.06
McLeod S=0.09
Linear (McLeod S=0.06)
Linear (McLeod S=0.09)
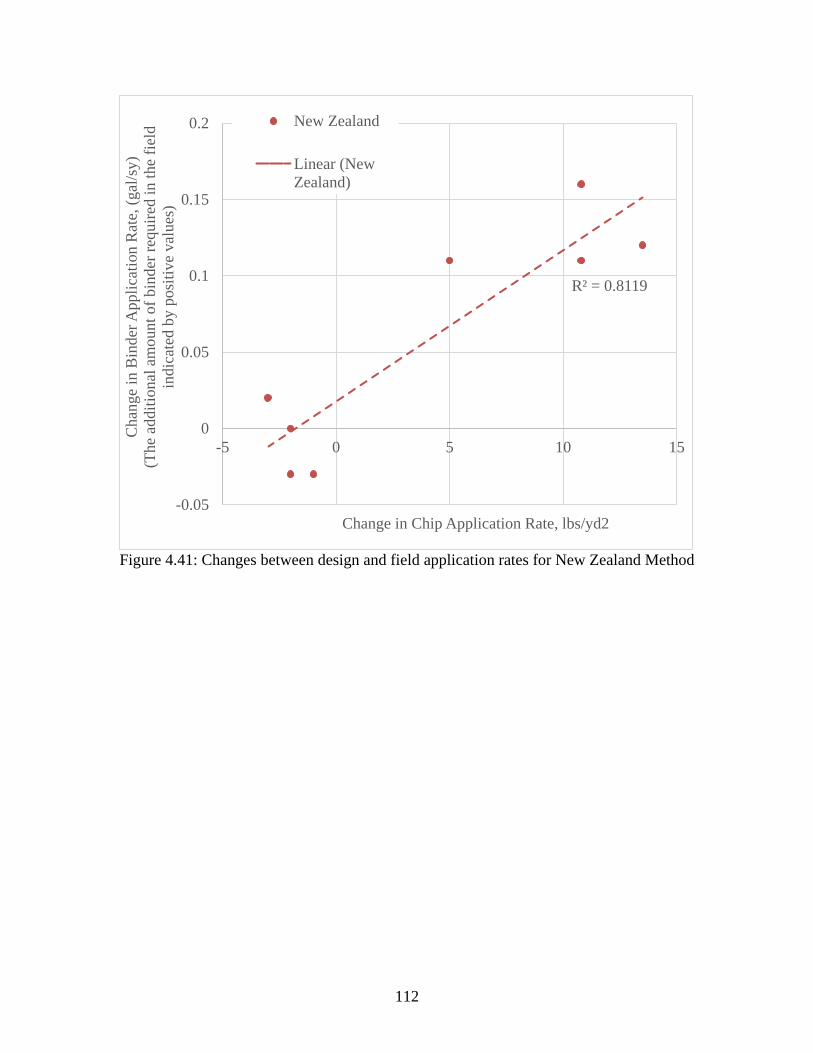
112
Figure 4.41: Changes between design and field application rates for New Zealand Method
R² = 0.8119
-0.05
0
0.05
0.1
0.15
0.2
-5 0 5 10 15
Cha
nge
in B
inde
r App
licat
ion
Rat
e, (g
al/s
y)
(The
add
ition
al a
mou
nt o
f bin
der r
equi
red
in th
e fie
ld
indi
cate
d by
pos
itive
val
ues)
Change in Chip Application Rate, lbs/yd2
New Zealand
Linear (NewZealand)
113
5.0 CONCLUSION AND RECOMMENDATIONS
5.1 PROJECT CONCLUSIONS AND FINDINGS
The findings of this study show that Oregon chip seal specifications are similar to other states with active chip seal programs. Overall performance of the chip seal sections was good and chip sealing proves to be an effective pavement preservation strategy by reducing cracking and improving the surface macrotexture. The study shows reduced pavement distresses in all sections.
Throughout the chip seal literature review, common themes between chip seal best practices were identified. First, roadway selection plays a key role in the performance and longevity of a chip seal pavement. For the pavement sections included in this study, there was a strong correlation between pre-construction condition surveys and post-construction chip seal performance. The pavement sections that required pre-construction patching had the highest required patching post-construction. The chip seal type selection can influence performance. The most common is a single layer seal, used in all Oregon sections for this study. Multiple layer seals can be used when higher resistance to shear forces are needed. The materials used in chip sealing play an important role in developing and maintaining good performance. Knowledge of the chip seal materials available to the project are important because aggregate size, fines, gradation and binder type all work together to create the new surface layer. Requiring a chip seal design ensures that the party installing the chip seal have a basic, fundamental understanding of the materials being used in construction. For example, basic aggregate knowledge such as gradation, the flakiness index, loose unit weight and shape parameters provide a baseline knowledge of how these aggregates will behave during construction. The chip seal design requires compiling basic project information for the chip seal treatment and will help to prevent potential compatibility and constructability challenges in the field. North Carolina requires an inexpensive aggregate-binder compatibility test. The aggregate/binder combinations for this project did not exhibit compatibility issues but this inexpensive test could be implemented if this is a concern for ODOT.
The design is also expected to reduce the amount of over chipping in the field, leading to an opportunity for cost reduction. The hot-applied seals had less over chipping when compared to the emulsified asphalt. The actual chip application rate was compared to the design application rate. If aggregate chips are over applied, this causes a surplus of aggregate on the shoulders after brooming. Too much aggregate will reduce embedment, and result in increased chip loss and greater potential for windshield damage. Literature recommends the contractor is responsible for all vehicle damage (Wood and Olson 2011).
The binder application rate often requires more adjustments in the field and thus more experienced personnel. However, the chip seal design can provide additional guidance in determining the correct application rate. The chip seal binder application rate should be plotted as a function of surface condition and traffic level to provide a visual and influence of different

114
binder application rates. The chip seal binder application chart provides guidance for the field-inspectors when changing the binder application rate. The Minnesota seal coat design manual states the binder rate almost always requires an increase in binder compared to the initial calculated design rate. This trend was also observed in the Oregon chip seal sections. More binder was required than what the initial design called for. If this change is studied further and the difference between the design and actual application rates tend to be relatively consistent, the delta could eventually be formalized as part of the design process to provide an improved initial estimate. One missing consideration in standard design procedures is determining the influence of temperature on the binder layer thickness and rheological behavior. In general, improved understanding of asphalt emulsions and their rheological behavior in field settings is a research that is needed on a national level.
A large portion of this project was to determine if the performance specification of macrotexture can be applied in Oregon. Also, the role of microtexture was investigated. The chip seal sections included in the study, adequately performed according to the New Zealand performance specification. The chip seal section that had the most distresses, did not pass the MTD specification. The MTD results showed good-performing seals with adequate MTD and underperforming seals with lower MTD. All seals passed the one-year MTD performance criteria. The mean texture depth (MTD) considers average least dimension (ALD) and the design life. Failure is considered to be 0.9 mm of macrotexture. The design life is generally 4-7 years. In this study, the design life for the chip seal did not come close to influencing the pass/fail criteria of the chip seal. The study results showed that all chip seals passed the performance specification. In the two-year follow up survey, the MTD had better values compared to the sections exhibiting distresses. Based on these findings, the proof of concept for this test in Oregon has been validated and is recommended for implementation. This could be implemented as an incentive or a performance specification requirement.
Microtexture is variable with seasonal changes. Conducting the test in a dry state is more susceptible to surface conditions such as dust or grit on the roadway and does not provide as repeatable results. The wet-condition provides more consistent results and can be used in spot-checking microtexture values for a roadway. Seasonal changes in microtexture has been documented in New Zealand and is likely the reason for variable results in the Oregon study.
Oregon has several climate regions which can limit chip seal activities in certain locations of the state, especially the Northwestern section where heavier amounts of rainfall occur. Best practices recommend dry weather for chip seal.
5.2 PROJECT RECOMMENDATIONS
The Oregon chip seal specifications were compared with all publically available chip seal specifications. In addition to the design requirement and the performance specification, a promising method for payment was identified in the literature. This payment method pays for the binder and the aggregate separately. The binder is paid for by the gallon and the aggregate is paid for by the square yard. This payment structure provides no incentive to reduce binder application rates and does not provide incentive to over-chip the sealed section (Wood and Olson 2011).

115
It is recommended that the following specifications be reviewed for potential implementation as part of a collaborative effort between the owner agencies, contractors, and binder suppliers.
5.2.1 Specification Recommendations
Design implementation (adopted from Minnesota specification) (MnDOT 2016) Recommended changes to 00710.44 and 00711.44:
Use the Oregon Chip Seal Design Guide, available on the Oregon Department of Transportation website to develop a chip seal design. This will determine the starting application rate for the bituminous material and seal coat aggregate. Base the mix design on the traffic volume and pavement conditions.
Provide the following to the Engineer at least 2 weeks before beginning construction:
1. Gradation and all quality test results as specified in 00710.10 [00711.10],
2. Seal coat aggregate design application rate,
3. Bituminous material design application rate and
4. 150 lb sample of aggregate from each proposed aggregate source.
The Department may postpone the start of work until receipt of the design and approval by the Engineer in accordance with the requirements of this section.
Roller specification, proposed addition to 00710.43 and 00711.43 (based on Minnesota specification):
Complete the initial rolling within 2 minutes after applying the aggregate at a speed no greater than 5 mph to prevent turning over aggregate.
The specification language for hot applied may want to reduce the time for hot chip. Many agencies use the wording, “immediately” or “promptly”.
Payment item recommendation for 00710.90 Payment, based on Minnesota specification:
a) Bituminous Material for Seal Coat – payed by the gallon or ton
b) Bituminous Seal Coat – payed by the square yard
5.2.2 Chip Seal Performance Specification and Recommendations
Reasons that chip seals do not attain their desired expected are due to polishing, chip loss, cracking or flushing (NZTA 2011). The macrotexture performance specification addresses these potential issues. Performance specification begins the process of moving away from method-based, or prescriptive, specifications to a performance-based specification. The MTD performance specification is based on the New Zealand sand circle test. With full

116
implementation of a performance specification, there are reduced inspection costs, lower chip seal design costs, an incentive for innovation and consistent quality. The performance specification requires the contractor to have a knowledge of chip seal design, the materials and equipment variability, assessment of risk and quality assurance (Patrick and Donbavand 1996).
Performance specification or incentive specification (adopted from Gundersen 2008, NZTA 2005, NZTA 2011, Patrick 1996):
The project showed proof of concept for a performance specification to be implemented in Oregon. The following outlines the performance specification. This should be further refined and collaboratively developed by owner agency, consultants, contractors and researchers. The draft specification is based on Gundersen 2008, NZTA 2005, NZTA 2011, Patrick 1996.
Draft Performance Specification 5.2.2.1
After one year of traffic, the pavement macrotexture must be sufficient to ensure the texture changes have not reduced below minimum requirements.
For single-coat seals the design life is calculated as follows:
Yd = 4.916 + 1.68 (ALD) - (1.03 + 0.219 ALD) log10 (elv) (5.1)
Where: Yd = design life in years elv = equivalent light vehicles per lane per day (where one heavy vehicle is assumed to be equivalent to 10 light vehicles) ALD = average least dimension of the sealing chip in mm
For single-coat seals the required mean texture depth at one year required is calculated as follows:
TD1 = 0.07 ALD log10 Yd + 0.9 (5.2)
Where: TD1 = Texture depth after one year in mm (7) Yd = design life in years
ACCEPTANCE AND PAYMENT The texture will be measured along a 500-foot length section on which five texture measurements are performed in transverse locations chosen by the Department. The texture measurements are taken by the sand circle method. The minimum value of the average texture depth calculated from the sand circle measurements shall be:
X - 0.519S > 0.07 ALD log10 Yd + 0.9 (5.3)
Where: X = average of the 5 texture depth measurements

117
S = sample standard deviation calculated for the 5 tests Note: X - 0.519S is commonly termed the ‘texture depth criterion’
If the texture depth is below the minimum to achieve the design life Yd, then the expected life Yf can be calculated from equation 4 above. Payment is then reduced by a factor based on Uniform Series Present Worth Factor (USPWF) up to a reduction in life of 25%. If the reduction in life is greater than 25% then the payment reduces proportionally until no payment is given for a loss in life greater than 60%.
The final specification development and payment formula should be further developed in collaboration between the Department and contractors.

118
6.0 REFERENCES
Aktas, B., D. Gransberg, C. Riemer, and D. Pittenger. Comparative Analysis of Macrotexture Measurement Tests for Pavement Preservation Treatments. In Transportation Research Record: Journal of the Transportation Research Board, No. 2209, Transportation Research Board of the National Academies, Washington, D.C., 2011, pp. 34-40.
American Association of State Highway and Transportation Officials (AASHTO). T 96-02 Resistance to Degradation of Small-Size Coarse aggregate by Abrasion and Impact in the Los Angeles Machine. Standard Specifications for Transportation Materials and Methods of Sampling and Testing (35th Edition) and AASHTO Provisional Stands. 2015.
American Association of State Highway and Transportation Officials (AASHTO). T 327-12 Resistance of Coarse Aggregate by Abrasion in the Micro-Deval Apparatus. Standard Specifications for Transportation Materials and Methods of Sampling and Testing (35th Edition) and AASHTO Provisional Stands. 2015.
American Association of State Highway and Transportation Officials (AASHTO). T 59-15 Emulsified Asphalts. Standard Specifications for Transportation Materials and Methods of Sampling and Testing (35th Edition) and AASHTO Provisional Stands. 2015.
American Society for Testing and Materials (ASTM). Calculating Pavement Macrotexture Profile Depth. ASTM Standard Practice E-1845, IHS online ASTM Standards, West Conshohocken, PA, 2005.
Arnold, G., and B.D. Pidwerbesky. Polymer-Modified Bitumens in Chip Seals for High Stress Conditions. Proceedings Joint 18th ARRB Transport Research Conference and Transit NZ Land Transport Symposium, Part 2, Christchurch, New Zealand, 1996, pp. 197-209.
Asphalt Emulsion Manufacturers Association. Recommended Performance Guidelines. AEMA, Washington, D.C., 1990.
ASTM C117-13. Standard Test Method for Materials Finer than 75-μm (No. 200) Sieve in Mineral Aggregates by Washing. ASTM International, West Conshohocken, PA, 2013. http://dx.doi.org/10.1520/C0117-13.
ASTM C127-15. Standard Test Method for Relative Density (Specific Gravity) and Absorption of Coarse Aggregate. ASTM International, West Conshohocken, PA, 2015. http://dx.doi.org/10.1520/C0127-15.
ASTM C29/C29M-16. Standard Test Method for Bulk Density (“Unit Weight”) and Voids in Aggregate. ASTM International, West Conshohocken, PA, 2016. http://dx.doi.org/10.1520/C0029_C0029M-16.

119
ASTM D2995-14. Standard Practice for Estimating Application Rate and Residual Application Rate of Bituminous Distributors. ASTM International, West Conshohocken, PA, 2014. http://dx.doi.org/10.1520/D2995-14.
ASTM E965-15. Standard Test Method for Measuring Pavement Macrotexture Depth Using a Volumetric Technique. ASTM International, West Conshohocken, PA, 2015. http://dx.doi.org/10.1520/E0965-15.
ASTM E274/E274M-15. Standard Test Method for Skid Resistance of Paved Surfaces Using a Full-Scale Tire. ASTM International, West Conshohocken, PA, 2015. http://dx.doi.org/10.1520/E0274_E0274M-15.
Asphalt Institute. Asphalt in Pavement Preservation and Maintenance. MS-16. Fourth Edition. Asphalt Institute, Lexington, KY, 2009.
Asphalt Institute and Asphalt Emulsion Manufacturers Association (AEMA). Basic Asphalt Emulsion Manual. Fourth Edition. Asphalt Institute, Lexington, KY, 2008.
Beatty T.L., D. Jackson, D. Dawood, R. Ford, J. Moulthrop, G. Taylor, F. Danchetz, D. Blanck, J. Fay, and D. Keough. Pavement Preservation Technology in France, South Africa, and Australia. Publication FHWA-PL-03-001. FHWA, U.S. Department of Transportation, 2002.
Broughton B., S-J. Lee, and Y-J. Kim. 2012. 30 Years of Microsurfacing: A Review. ISRN Civil Engineering, Vol 2012, No. 279643, 2012.
Burchfield, R.M., and R.G. Hicks. Construction Aggregates Available Along the Oregon Coast. Special Report 614. Extension Marine Advisory Program. Oregon State University. October 1981. Available at: https://ir.library.oregonstate.edu/xmlui/bitstream/handle/1957/4821/SR%20no.%20614_ocr.pdf?sequence=1. Accessed August 31, 2016.
California Department of Transportation. Caltrans Code of Safe Operating Practices. Chapter 12, Sacramento, CA, 1999.
Caltrans Division of Maintenance. Fog Seal Guidelines. California Department of Transportation. 2003. http://www.dot.ca.gov/hq/maint/TAGFogSealsGuidelines.pdf
Caltrans Division of Maintenance. Chip Seals. Chapter 5. October 2003. http://www.dot.ca.gov/hq/maint/mtag/ch5_chip_seals.pdf
Federal Highway Administration (FHWA). Pavement Preservation Checklist Series: 2 Chip Seal Application. Report Number: FHWA-IF-02-046. FHWA, Washington D.C. 2002. Available at: http://www.fhwa.dot.gov/pavement/preservation/ppcl02.pdf. Accessed on August 31, 2016.
Federal Highway Administration, U.S. Department of Transportation (FHWA). An Overview of Surface Rehabilitation Techniques for Asphalt Pavements. FHWA-PD-92-008, FHWA, Washington, D.C., 1992.

120
Epps, J.A., B.M. Gallaway, and C.H. Hughes. Field Manual on Design and Construction of Seal Coats. College Station, TX, 1981.
Galehouse, L., J.S. Moulthrop, and R.G. Hicks. Principles of Pavement Preservation: Definitions, Benefits, Issues, and Barriers. TR News, Vol. 228, 2003, p. 228.
Gransberg, D. Chip Seal Program Excellence in the United States. In Transportation Research Record: Journal of the Transportation, No. 1933, Transportation Research Board of the National Academies, Washing, D.C., 2005, pp. 72-82.
Gransberg, D., and D.M.B. James. Chip Seal Best Practices, National Cooperative Highway Research Program (NCHRP), Synthesis 342. Transportation Research Board, National Research Council, National Academies, Washington, D.C., 2005.
Gransberg, D., B. Pidwerbesky, and D.M. James. Analysis of New Zealand Chip Seal Design and Construction Practices. Transportation Research Circular No. E-C078: Roadway Pavement Preservation 2005: Papers from the First National Conference on Pavement Preservation, Kansas City, MO, 2005. pp. 3-15.
Gransberg, D.D. Using a New Zealand Performance Specification to Evaluate US Chip Seal Performance. Journal of Transportation Engineering, ASCE, Vol. 133, No. 12, 2007, pp. 688-695.
Gransberg, D.D., and M. Zaman. Analysis of Emulsion and Hot Asphalt Cement Chip Seal Performance. Journal of Transportation Engineering, Vol. 131, No. 3, 2005, pp. 229-238.
Gransberg, D.D., M. Zaman, and B. Aktas. Performance Analysis of Aggregate/Binder Combinations Used for the ODOT Chip Seal Program. Report No. FHWA-OK-10-03, Oklahoma Department of Transportation, 2010.
Gransberg, D.D., M. Zaman, and B. Aktas. Analysis of Aggregates and Binders Used for the ODOT Chip Seal Program. Norman, Oklahoma: University of Oklahoma. 2010.
Gundersen, B., G. Hart, and P.M. Muir. Developing and Use of Performance-Based Chipsealing Contracts in New Zealand. 1st Sprayed Sealing Conference- Cost Effective High Performance Surfacings. Adelaide, Australia 2008.
Gundersen, B. Chipsealing Practice in New Zealand. 1st Sprayed Sealing Conference- Cost Effective High Performance Surfacings. Adelaide, Australia 2008. Available at: https://www.arrb.com.au/sealing/PDF/Gundersen-1.pdf. Accessed August 31, 2016.
Hanson, F.M.. Bituminous Surface Treatments of Rural Highways. New Zealand Society of Civil Engineers, 1934.
Hanson, F.M. Symposium on Seal Coats on Surface Treatments for Existing Bituminous Surfaces. Proceedings, Association of Asphalt Paving Technologists. 1955.

121
Henry, J. Evaluation of Pavement Friction Characteristics. National Cooperative Highway Research Program (NCHRP), Synthesis No. 291. Transportation Research Board, Washington D.C., 2000.
Hicks R.G., and G. Holleran. Purpose and Use of Fog Seals and Rejuvenators. Sealer Binder Workshop, Foundation for Pavement Preservation, Federal Highway Administration, 2002.
Hicks, R., J. Moulthrop, and J. Daleiden. Selecting a Preventive Maintenance Treatment for Flexible Pavements. In Transportation Research Record: Journal of the Transportation Research Board, No. 1680, Transportation Research Board of the National Academies, Washington, D.C., 1999, pp. 1-12.
Johnston, J., and G. King. Polymer Modified Asphalt Emulsions Composition, Uses, and Specifications for Surface Treatments. Federal Highway Administration, Central Federal Lands Highway Division. Lakewood, CO. 2012. https://www.pavementpreservation.org/wp-content/uploads/2012/04/Polymer_Modfied_Asphalt_Emulsions.pdf. Accessed August 30, 2016.
Jordan, W.S., and I.L. Howard. Applicability of Modified Vialit Adhesion Test for Seal Treatment Specifications. Journal of Civil Engineering and Architectur,.Vol. 5, No. 3, 2011, pp. 215-223.
Kearby, J.P. Tests and Theories on Penetration Surfaces. Proceedings of the Highway Research Board. 1953.
Lawson, W., and S. Senadheera. Chip Seal Maintenance: Solutions for Bleeding and Flushed Pavement Surfaces. In Transportation Research Record: Journal of the Transportation Research Board, No. 2108, Transportation Research Board of the National Academies, Washington, D.C., 2009, pp. 61-68.
Lee, Ju, and Y. Kim. Performance-Based Uniformity Coefficient of Chip Seal Aggregate. In Transportation Research Record: Journal of the Transportation Research Board, No. 2108, Transportation Research Board of the National Academies, Washington, D.C., 2009, pp. 53-60.
Li, H., J.T. Harvey, C. Thigpen, and R. Wu. Surface Treatment Macrotexture and Bicycle Ride Quality. California Department of Transportation. Research Report: UCPRC-RR-2016-07. University of California Pavement Research Center, Davis and Berkeley, CA, 2013.
Masad, E. Aggregate Imaging System (AIMS) Basics and Applications. Report No. FHWA/TX-05/5-1707-01-1, Texas Department of Transportation and Federal Highway Administration, Washington, D.C., 2005.
Masad, E., D. Olcott, T. White, and L. Tashman. Correlation of Fine Aggregate Imaging Shape Indices with Asphalt Mixture Performance. In Transportation Research Record: Journal of the Transportation Research Board, No. 1757, Transportation Research Board of the National Academies, Washington, D.C., 2001, pp. 148–156.

122
McLeod, N.W. Basic Principles for the Design and Construction of Seal Coats and Surface Treatments with Cutback Asphalts and Asphalt Cements. Proceedings of the Association of Asphalt Paving Technologists. 1960.
McLeod, N.W. A General Method of Design of Seal Coats and Surface Treatments. Proceedings of the Association of Asphalt Paving Technologists. 1969.
Miller, J.S., and W.Y. Bellinger. Distress Identification Manual for the Long-Term Pavement Performance Program. Report FHWA-RD-03-031. FHWA, McLean, VA, 2003.
Minnesota Department of Transportation (MnDOT). Standard Specifications for Construction. 2016 Edition. St. Paul, MN. 2016. Available at: http://www.dot.state.mn.us/pre-letting/spec/2016/2016-spec-book.pdf. Accessed on August 30, 2016.
Montana Department of Transportation (MT DOT). Seal Coat Warranty Administration Guide. Montana Department of Transportation. 2008. Available at: https://www.mdt.mt.gov/other/webdata/external/const/manuals_guidelines/seal_coat_warranty_admin_guide.pdf. Accessed on August 31, 2016.
New Zealand Transport Agency (NZTA). Chipsealing in New Zealand. New Zealand Transport Agency. New Zealand. 2005. https://www.nzta.govt.nz/resources/chipsealing-new-zealand-manual/chipsealing-in-new-zealand.html. Accessed August 30, 2016.
New Zealand Transportation Agency (NZTA). Notes on Specification for Sealing Chip. NZTA M6 Notes: 2011. Available at: https://www.nzta.govt.nz/assets/resources/sealing-chip/docs/sealing-chip-notes.pdf. Accessed on August 31, 2016.
North Carolina Department of Transportation (NCDOT). Chip Seal Best Practices Manual. 2015. Available at: http://www.carolinaasphalt.org/aws/CAPA/asset_manager/get_file/106296?ver=1303. Accessed on August 31, 2016.
O’Connor, D.L. Properties and Uses for High Float Emulsions. State Department of Highways and Public Transportation Materials and Tests Division. Paris, TX, 1982. http://library.ctr.utexas.edu/digitized/texasarchive/82-8-5.pdf. Accessed August 31, 2016.
Oregon Department of Transportation (ODOT). Laboratory Manual of Test Procedures. Oregon Department of Transportation. Salem, OR. 2016. https://www.oregon.gov/ODOT/HWY/CONSTRUCTION/docs/materials_laboratory_manual.pdf.
Patrick, J.E., and J. Donbavand. Development of a Performance Based Chipseal Specification. Proceedings from Roads 96 Conference. 1996.
Pidwerbesky, B.D., D.D. Gransberg, R. Stemprok, and J. Waters. Road Surface Texture Measurement Using Digital Image Processing and Information Theory, Land Transport New Zealand Research Report 290, New Zealand, 2006.

123
Pittenger D., D. Gransberg, M. Zaman, and C. Riemer. Life-Cycle Cost-Based Pavement Preservation Treatment Design. In Transportation Research Record: Journal of the Transportation Research Board, No. 2235, Transportation Research Board of the National Academies, Washington, D.C., 2011, pp. 28-35.
124
Pittenger D., D. Gransberg, M. Zaman, and C. Riemer. Stochastic Life-Cycle Cost Analysis for Pavement Preservation Treatments. In Transportation Research Record: Journal of the Transportation Research Board, No. 2292, Transportation Research Board of the National Academies, Washington, D.C., 2012, pp. 45-51.
Prapaitrakul, N., T. Freeman, and C.J. Glover. Analyze Existing Fog Seal Asphalts and Additives: Literature Review, Report FHWA/TX-06/0-5091-1. FHWA, U.S. Department of Transportation, 2005.
PRISM Climate Group. “Average Annual Precipitation Oregon”. Oregon State University. 2014. http://prism.oregonstate.edu/gallery/view.php?state=OR
Rahman F., M. Islam, H. Musty, and M. Hossain. Aggregate Retention in Chip Seal. In Transportation Research Record: Journal of the Transportation Research Board, No. 2267, Transportation Research Board of the National Academies, Washington, D.C., 2012, pp. 56-64.
Read, J., and D. Whiteoak. The Shell Bitumen Handbook. Fifth Edition. Shell Bitumen, Thomas Telfor Publishing. London, UK. 2003. ISBN: 072773220
Roberts, C., and J.C. Nicholls. Design Guide for Road Surface Dressing. Sixth Edition. TRL, Berkshire, UK. 2008. http://www.trl.co.uk/umbraco/custom/report_files/RN39.pdf. Accessed August 30, 2016.
Roque, R., A. Ravanshad, and G. Lopp. Use of Aggregate Image Measurement System (Aims) to Evaluate Aggregate Polishing in Friction Surfaces. Florida Department of Transportation. Tallahassee, FL, 2013.
Salomon, D.R. Asphalt Emulsion Technology. Transportation Research Circular, No. E-C102. 2006.
Shuler S. Chip Seals for High Traffic Pavements. In Transportation Research Record: Journal of the Transportation Research Board, No. 1259, Transportation Research Board of the National Academies, Washington, D.C., 1990.
Shuler, S., A. Lord, A. Epps-Martin, and D. Hoyt. NCHRP Report 680: Manual for Emulsion-Based Chip Seals for Pavement Preservation.In National Cooperative Highway Research Program, Report 680, Transportation Research Board of the National Academies, Washington, D.C.,10, 2011, pp. 20-30.
South Australian Department of Transportation. Bituminous Sealing Manual. 1995.
Texas Department of Transportation (TxDOT). Asphalt Emulsions. Construction Division Texas Department of Transportation. 2005. Available at: ftp://ftp.dot.state.tx.us/pub/txdot-info/cst/AsphaltEmulsions.pdf. Accessed August 31, 2016.
Transit New Zealand (TNZ). Notes for the Specification for Bituminous Reseals, TNZ P17, Wellington, New Zealand, 2002.

125
Transit New Zealand (TNZ). Road Controlling Authorities, and Roading New Zealand. 2011 Edition. Chip Sealing in New Zealand. 2011.
Transit New Zealand (TNZ). Standard Test Procedure for Measurement of Texture by the Sand Circle Method. New Zealand Transportation Authority. 1981. https://www.nzta.govt.nz/assets/resources/texture-by-the-sand-circle-method-measurements/docs/texture-by-the-sand-circle-method-measurements.pdf. Accessed August 30, 2016.
United States Department of Agriculture. Regional and State Plant Hardiness Zones: Oregon. USDA Agricultural Research Service. 2016. Available at: http://planthardiness.ars.usda.gov/PHZMWeb/Maps.aspx. Accessed August 31, 2016.
Utah Department of Transportation. Method for Determining Aggregate Flakiness Index. Materials Manual. 2004. Available at: https://www.udot.utah.gov/main/uconowner.gf?n=21059128969197158. Accessed August 31, 2016.
Washington Department of Transportation (WSDOT). Why Chip Seal? 2015.www.wsdot.wa.gov/Regions/Eastern/ChipSeal/. Accessed July 27, 2016.
Waters, J. Retexturing Polished Surfaces Using the Watercutting Process, In Fulton Hogan Ultra-High Pressure Watercutter CD ROM, Fulton Hogan, Ltd., Christchurch, New Zealand, 2004
Waters, J., S.A. Rainsford, and M. Topp. Delivering Polishing Resistance Performance on Curves. IPENZ Transportation Group Conference Dunedin. 2013. http://conf.hardingconsultants.co.nz/workspace/uploads/waters-jeff-ipenztg2013-d-5191ad0968d8d.pdf. Accessed August 30, 2016.
Wilde, W.J., L. Thompson, and T.J. Wood. Cost-effective Pavement Preservation Solutions for the Real World. Department of Transportation, Research Services and Library. 2014.
Wood, T., D.W. Janisch, and F.S. Gaillard. Minnesota Seal Coat Handbook. Final Report. Minnesota Department of Transportation. St. Paul, Minnesota. Revised 2006. Available at: http://dotapp7.dot.state.mn.us/ResearchTracking/pdf/200634.pdf. Accessed 8-31-2016.
Wood T., and R. Olson. Nine Steps to Constructing High-Quality Chip Seals. In Transportation Research Record: Journal of the Transportation Research Board, No. 2204, Transportation Research Board of the National Academies, Washington, D.C., 2011, pp. 54-57.
Wood, T., and R. Olson. Rebirth of Chip Sealing in Minnesota. In Transportation Research Record: Journal of the Transportation Research Board, No. 1989, Transportation Research Board of the National Academies, Washington, D.C., 2007, pp. 260-264.
Yang, M., and W.G. Su. Practice of Fog Seal Experiment Road for Highway Preventive Maintenance. College of Traffic and Communications, South China University of Technology, China. 2006

126
Zaman M., D. Gransberg, R. Bulut, S. Commuri, and D. Pittenger. Develop Draft Chip Seal Cover Aggregate Specification Based on AIMS Angularity, Shape and Texture Test Results. Report No. OTCREOS11. Oklahoma Transportation Center. 2013.

127

128

APPENDIX A


A-1
Pre-ConstructionPost Construction
1-year2-Year
0
1
2
3
4
5
OWP BWP
unit A
Unit A
Pre-Construction Post Construction 1-year 2-Year
Pre-ConstructionPost-Construction
1-yr2-yr
0
1
2
3
4
OWP BWP
Unit B
Unit B
Pre-Construction Post-Construction 1-yr 2-yr
Unit A MTD measurements vs time
Unit B MTD measurements vs time

A-2
Pre-ConstructionPost-Construction
1-yr2-yr
0
1
2
3
4
OWP BWP
Unit C
Unit C
Pre-Construction Post-Construction 1-yr 2-yr
Pre-Construction
Post-Construction
1-yr 2-yr
2-yr
0
1
2
3
4
OWP BWP
Unit D
Unit D
Pre-Construction Post-Construction 1-yr 2-yr 2-yr
Unit C MTD measurements vs time
Unit D MTD measurements vs time
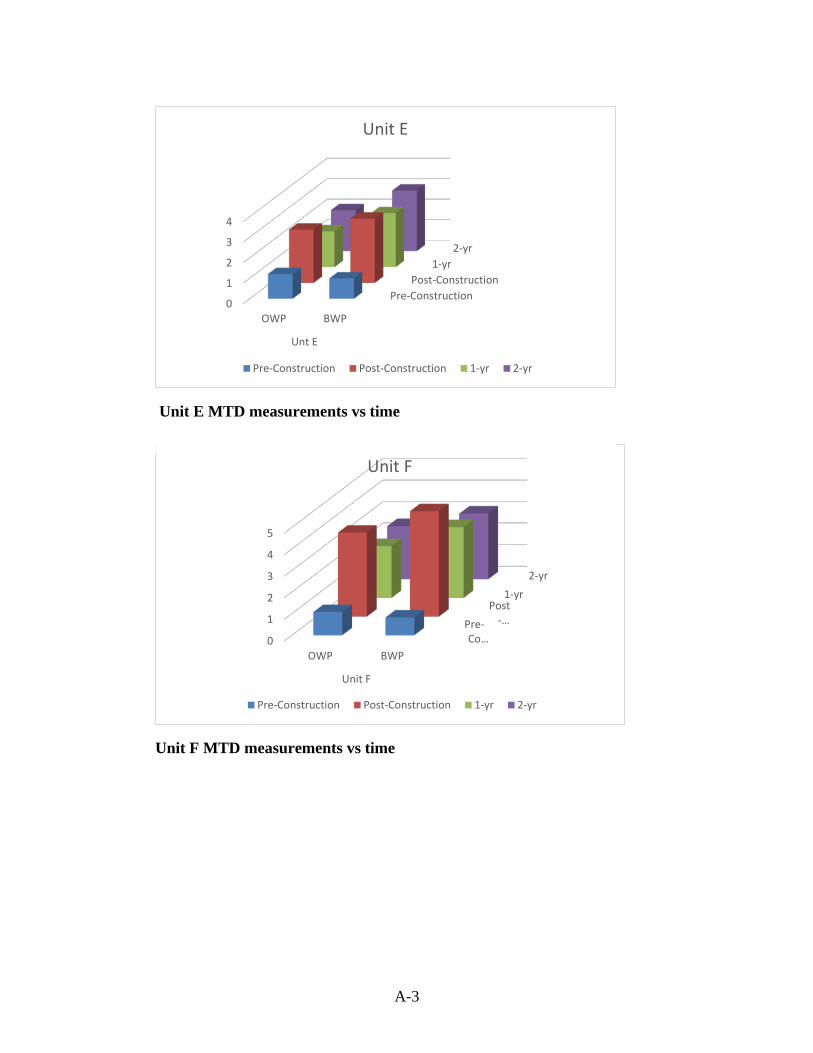
A-3
Pre-ConstructionPost-Construction
1-yr2-yr
0
1
2
3
4
OWP BWP
Unt E
Unit E
Pre-Construction Post-Construction 1-yr 2-yr
Pre-Co…
Post-…
1-yr2-yr
0
1
2
3
4
5
OWP BWP
Unit F
Unit F
Pre-Construction Post-Construction 1-yr 2-yr
Unit E MTD measurements vs time
Unit F MTD measurements vs time
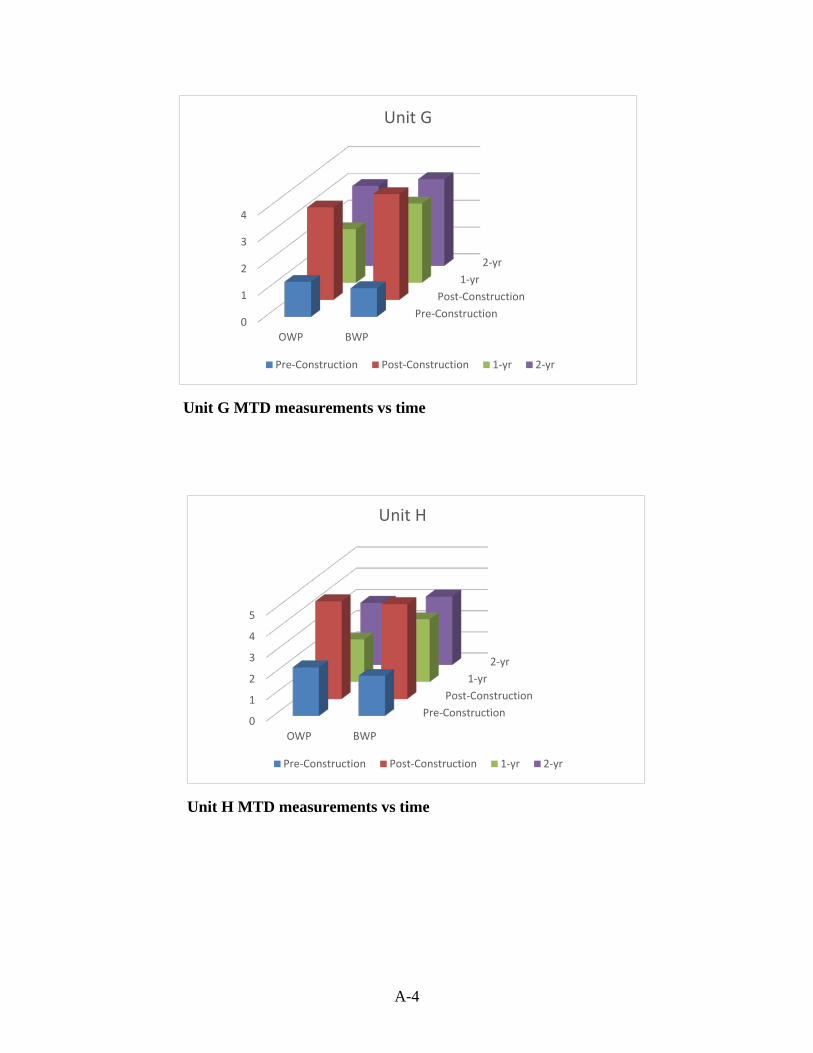
A-4
Pre-ConstructionPost-Construction
1-yr2-yr
0
1
2
3
4
OWP BWP
Unit G
Pre-Construction Post-Construction 1-yr 2-yr
Pre-ConstructionPost-Construction
1-yr2-yr
0
1
2
3
4
5
OWP BWP
Unit H
Pre-Construction Post-Construction 1-yr 2-yr
Unit G MTD measurements vs time
Unit H MTD measurements vs time

APPENDIX B

B-1
CUMULATIVE ANALYSIS OF UNITS FOR ANGULAR GRADIENT
AGGREGATES FOR UNIT A
0
10
20
30
40
50
60
70
80
90
100
0 1000 2000 3000 4000 5000 6000 7000 8000 9000 10000
Cum
ulat
ive
% o
f Par
ticle
s
UNIT A
Unit A 3/8 Unit A #4 Unit A #8

B-2
AGGREGATES FOR KLAMATH (HOT APPLY)
0
10
20
30
40
50
60
70
80
90
100
0 1000 2000 3000 4000 5000 6000 7000 8000 9000 10000
Cum
ulat
ive
% o
f Par
ticle
s Klamath HM
Klamath 3/8 Klamath #4

B-3
AGGREGATES FOR PARKWAY (HOT APPLY)
0
10
20
30
40
50
60
70
80
90
100
0 1000 2000 3000 4000 5000 6000 7000 8000 9000
Cum
ulat
ive
% o
f Par
ticle
s Parkway HM
Parkway #4

B-4
AGGREGATES FOR UNIT H
0
10
20
30
40
50
60
70
80
90
100
0 1000 2000 3000 4000 5000 6000 7000 8000 9000 10000
Cum
ulat
ive
% o
f Par
ticle
s
Unit H
UNIT H 3/8 Unit H #4

B-5
AGGREGATES FOR UNIT F (AND UNIT G)
0
10
20
30
40
50
60
70
80
90
100
0 2000 4000 6000 8000 10000 12000
Cum
ulat
ive
% o
f Par
ticle
s
Unit F
Unit F #4 UNIT F 3/8

APPENDIX C


C-1
APPENDIX C: CHIP SEAL DESIGN COMPARISON
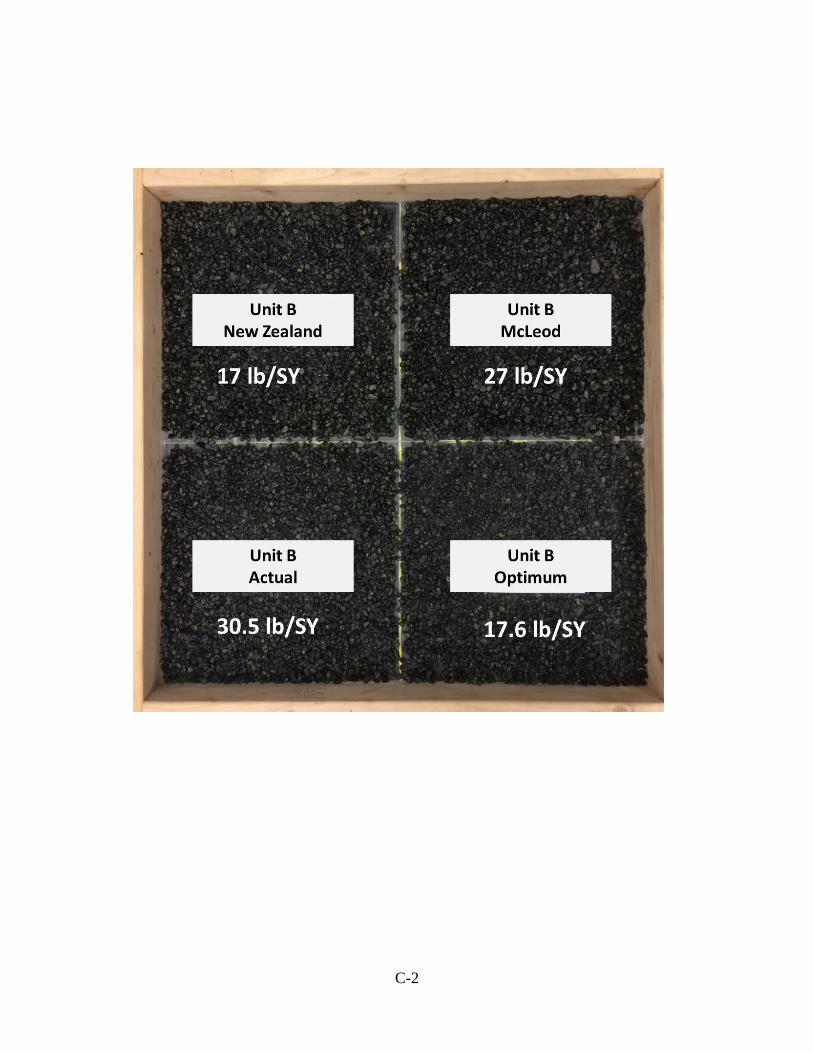
C-2

C-3

C-4
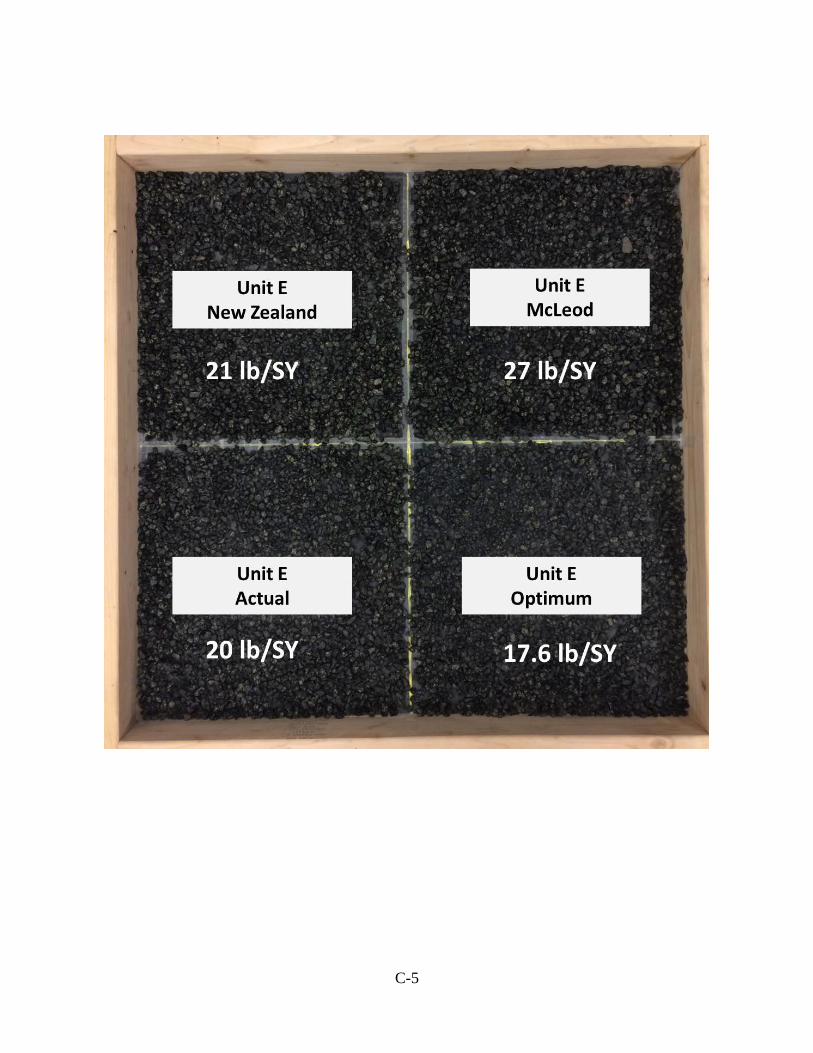
C-5
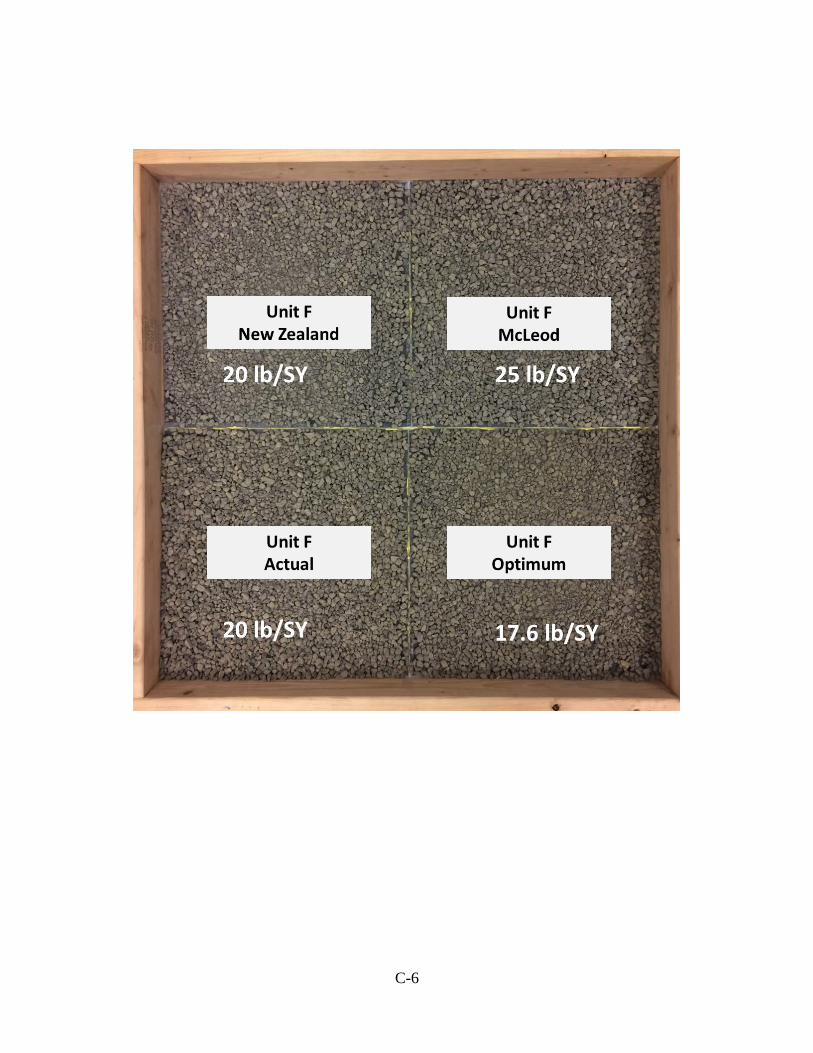
C-6

C-7

C-8

D-1
APPENDIX D

D-2
APPENDIX D: GRAPHS OF CRACKING SEVERITY

D-3