chma - jacksonville, florida
TRANSCRIPT

C O M P R E H E N S I V E H O U S I N G M A R K E T A N A L Y S I S
As of April 1, 2007U.S. Department of Housing and Urban Development Office of Policy Development and Research
Jacksonville, Florida
Mexico
Duval
Clay
Baker
Putnam
Nassau
Charlton
Alachua
St. Johns
Camden
Ware
Flagler
Union
Bradford
Florida
Georgia
Atlantic O
cean
Housing Market Area
The Jacksonville, Florida Housing Market Area (HMA) consists of Baker, Clay, Duval, Nassau, and St. Johns Counties in northeast Florida. Other communities in the HMA include St. Augustine, Orange Park, and Fernandina Beach. For this analysis, Duval County, which includes the city of Jacksonville, constitutes one submarket. A second submarket (the Suburban Counties) consists of the combined surrounding counties.
Market DetailsEconomic Conditions ............. 2
Population and Households ... 4
Housing Market Trends .......... 5
Data Profiles ......................... 12
Summary
Economy The economy of the Jacksonville HMA is diverse and has experienced steady nonfarm employment growth in the past 4 years. The area is a major port and transportation hub, financial services center, and regional medical center. Leading employers include the U.S. Navy, BlueCross BlueShield of Florida, and healthcare provider Baptist Health. During the 12 months ending March 2007, nonfarm employment has increased by nearly 3 percent compared with the previous 12 months. The construction, professional and business services, and education and health sectors had the highest rates of employment growth.
Sales Market The sales housing market in the HMA is currently somewhat soft. Home sales have slowed from a
year ago, and inventories of unsold homes have increased. Residential construction has slowed considerably, with single-family production falling by about half compared with a year ago. Anticipated continued household growth during the next 3 years will create a demand for an estimated 29,700 new units (see Table 1).
Rental Market Conditions in the HMA rental market are currently balanced. A large number of condominium conversions between 2003 and 2006 reduced the supply of apartments, and additions to inventory have been limited; however, conversions have virtually halted, and conditions now favor increases in the rental supply. During the forecast period, demand for 5,400 new rental units is expected (see Table 1).
Notes: Total demand represents estimated production necessary to achieve a balanced market at the end of the forecast period. Units under construction as of April 1, 2007.Source: Estimates by analyst
JacksonvilleHMA
Duval County Submarket
Suburban Counties Submarket
SalesUnits
RentalUnits
SalesUnits
RentalUnits
SalesUnits
RentalUnits
Table 1. Housing Demand in the Jacksonville HMA, 3-Year Forecast, April 1, 2007 to April 1, 2010
Total Demand
Under Construction
29,700 5,400 14,700 4,600 15,000 800
7,500 2,400 4,200 2,000 3,300 400

Ja
ck
so
nv
ille
, F
L •
CO
MP
RE
HE
NS
IVE
HO
US
ING
MA
RK
ET
AN
ALY
SIS
� Economic Conditions
an average of 13,100 jobs a year, or 2.7 percent. The unemployment rate fell from 5.3 percent in 1990 to 3.1 percent in 2000 (see Figure 1). Employment growth slowed after 2000, but recent growth has been strong. Since 2000, nonfarm employ- ment has increased by an average of 11,300 jobs a year, or 1.9 percent. During the 12 months ending March 2007, nonfarm employ-ment in the HMA has increased by 17,800 jobs, or 2.9 percent, to 628,200 compared with the previ-ous 12 months. See Figure 2 for the percentage change in each sector from 1990 through the current date. The unemployment rate has fallen from 3.5 percent during the 12 months ending March 2006 to 3.3 percent during the 12 months ending March 2007.
The fastest growing employment sector in the past 12 months was construction, which added 3,600 jobs, a 7.8-percent increase. Most of the building activity in the past
The Jacksonville HMA has a well-diversified economy,
and it is a regional center for health care, financial activities, and business services. Northeast Florida has relatively low business costs compared with other parts of the country, which makes it attractive to companies. The area also has a favorable climate and a relatively low cost of living, which make it easier for firms to attract workers.
Nonfarm employment in the HMA grew steadily during the 1990s, by
Figure 1. Trends in Labor Force, Resident Employment, and Unemployment Rate in the Jacksonville HMA, 1990 to 2006
Source: U.S. Bureau of Labor Statistics
Lab
or F
orce
&R
esid
ent
Em
plo
ymen
t
Une
mp
loym
ent
Rat
e
710,000
660,000
610,000
560,000
510,000
460,000
410,0001990 1992 1994 1996 1998 2000 2002 2004
Labor Force Resident Employment Unemployment Rate
8.0
7.0
6.0
5.0
4.0
3.0
2.0
1.0
0.02006
20
Figure 2. Sector Growth in the Jacksonville HMA, Percentage Change, 1990 to Current
100
Note: Current is based on 12-month averages through March 2007.Source: U.S. Bureau of Labor Statistics
Total Nonfarm Employment
Goods Producing
Natural Resources, Mining, & Construction
Manufacturing
Service Providing
Trade
Information
Financial Activities
Professional & Business Services
Education & Health Services
Government
Other Services
Leisure & Hospitality
Transportation & Utilities
– 20 0 80 12040 60 140 160

Ja
ck
so
nv
ille
, F
L •
CO
MP
RE
HE
NS
IVE
HO
US
ING
MA
RK
ET
AN
ALY
SIS
�Economic Conditions Continued
employers overall are the Naval Air Station Jacksonville, with more than 25,000 total personnel (military and civilian), and the Naval Station Mayport, with more than 16,000 personnel (see Table 3). Mayport, the third largest U.S. naval facility in the continental United States, was home port for the U.S.S. John F. Kennedy until the aircraft carrier was decommis-sioned in March 2007. The ship, with its crew of 3,000, contrib-uted an estimated $250 million a year to the local economy.
Nonfarm sectors with a large share of employment include trade, pro-fessional and business services, and education and health services (see Figure 3). Together, these three sec-tors account for nearly half of the total private nonfarm employment in the HMA. BlueCross BlueShield of Florida, with 8,100 area work-ers, is the leading private-sector employer, followed by Publix Super Markets, with 7,100 workers, and Baptist Health, with 6,900 workers.
12 months has been in residential construction. The professional and business services sector also expanded, adding 5,300 jobs, a 5.8-percent increase, as did the education and health services sec-tor, which increased by 3,200 jobs, or 4.5 percent (see Table 2).
The military has a major presence in Jacksonville. The two largest
Figure 3. Current Employment in the Jacksonville HMA, by Sector
Note: Based on 12-month averages through March 2007.Source: U.S. Bureau of Labor Statistics
Government 11.8%
Other Services 4.4%
Leisure &Hospitality 10.0%
Education & Health Services 12.0%
Professional & Business Services 15.4%
Trade 16.6%
Manufacturing 5.2%
Construction 7.9%
Transportation & Utilities 5.2%
Financial Activities 9.8%
Information 1.8%
Table 3. Major Employers in the Jacksonville HMA
Name of Employer Employment Sector
Number of Employees
U.S. Navy Government 41,400Duval County Public Schools Government 15,000City of Jacksonville Government 9,400BlueCross BlueShield of Florida Financial Services 8,100Publix Super Markets Retail 7,100Baptist Health Health Services 6,900Winn-Dixie Stores, Inc. Retail 6,500Wal-Mart Stores, Inc. Retail 6,000Mayo Clinic Health Services 5,000Bank of America Financial Services 4,500
Source: Jacksonville Business Journal, 2006 Book of Lists
Notes: Based on 12-month averages through March 2006 and March 2007. Numbers may not add to totals because of rounding.Source: U.S. Bureau of Labor Statistics
Table 2. 12-Month Average Employment in the Jacksonville HMA, by Sector
Employment Sector12 Months
EndingMarch 2006
12 MonthsEnding
March 2007
Percent Change
Total Nonfarm Employment 610,400 628,300 2.9
Goods Producing 80,200 83,200 3.7
Construction 46,300 49,900 7.8
Manufacturing 33,500 32,900 – 1.7
Service Providing 530,200 545,100 2.8
Trade 102,300 104,300 2.0
Transportation & Utilities 31,300 32,500 3.9
Information 11,800 11,400 – 3.6
Financial Activities 59,500 60,400 1.4
Professional & Business Services 91,200 96,500 5.8
Education & Health Services 72,000 75,300 4.5
Leisure & Hospitality 60,900 63,000 3.5
Other Services 26,900 27,400 1.9
Government 74,300 74,200 – 0.1

Ja
ck
so
nv
ille
, F
L •
CO
MP
RE
HE
NS
IVE
HO
US
ING
MA
RK
ET
AN
ALY
SIS
�Economic Conditions Continued
Population and Households
With a growing economy, pleasant climate, and
relatively low cost of living, the Jacksonville HMA has experienced steady population growth in the
past 2 decades. During the 1990s the population increased by 19,800 a year, or 2 percent (see Figure 4). More than 60 percent of the growth, or 12,300 people a year, resulted from net in-migration, while net natural change (resident births minus deaths) accounted for the remaining 7,500 a year. As of 2000, the popula-tion of the HMA was 1,122,800, with 778,900 in Duval County and 343,900 in the Suburban Counties.
Since 2000, the HMA population has increased by 23,900 a year, or 2 percent. In Duval County, the aver-age annual increase has been about 12,600, or 1.5 percent, while in the Suburban Counties it has increased by 11,400 a year, or 3 percent. Although net natural change has slowed to 7,200 a year, net in-migration has accelerated to about 16,700 people a year, accounting for 70 percent of the population growth (see Figure 5). Although the HMA may be starting to attract more retirees, most of the in-migration continues to result from employment opportunities. A large share of the in-migration has been to
Shipping and distribution are also important to the economy. Jackson-ville has one of the largest ports in the southeastern United States. In the fiscal year ending September 2006, Jacksonville Port Authority (JaxPort) handled 8.7 million tons of cargo, including more than 600,000 vehicles, making it one of the top two automobile handling ports in the United States. More than 7,000 workers are employed
Population Households
Figure 4. Population and Household Growth in the Jacksonville HMA, 1990 to Forecast
Sources: 1990 and 2000—U.S. Census; current and forecast—estimates by analyst
1990 to 2000 2000 to Current Current to Forecast
Ave
rage
Ann
ual C
hang
e
30,000
25,000
20,000
150,00
10,000
5,000
0
at the port. CSX Corporation, Inc., parent company of the largest rail-road in the eastern United States, has its headquarters in Jacksonville and employs 4,000 area workers.
Employment in the HMA is expected to continue expanding during the next 3 years. Resident employment is expected to grow by 2.2 percent a year, or 14,200 jobs, during the forecast period.
Figure 5. Components of Population Change in the Jacksonville HMA, 1990 to Forecast
1990 to 2000 2000 to Current Current to Forecast
20,000
18,000
16,000
14,000
12,000
10,000
8,000
6,000
4,000
2,000
0
Ave
rage
Ann
ual C
hang
e
Sources: 1990 and 2000—U.S. Census; current and forecast—estimates by analyst
Net Natural Change Net Migration

Ja
ck
so
nv
ille
, F
L •
CO
MP
RE
HE
NS
IVE
HO
US
ING
MA
RK
ET
AN
ALY
SIS
�Population and Households Continued
With steady economic growth and in-migration, the population of the HMA is expected to expand during the 3-year forecast period by an average of 26,700 a year, or 2 percent. Slightly more than half of that increase, or 13,400 a year, will be in the Suburban Counties, for an annual growth rate of 3.1 percent. The population of Duval County is expected to increase by 13,300 a year, or 1.5 percent. The number of households in the HMA is expected to increase by about 11,200 a year, or 2.1 percent, during the forecast period. In Duval County the number of households will increase by 5,700 a year, or 1.6 percent, while the number of households in the Suburban Counties is expected to increase by 5,500 a year, or 3.2 percent.
the Suburban Counties. Since 2000, net in-migration has averaged about 9,800 people a year for the Suburban Counties, compared with 6,900 people a year for Duval County. Currently, the HMA population is estimated to be 1,290,200, with 866,800 in Duval County and 423,400 in the Suburban Counties.
During the 1990s the number of households increased by about 8,400 a year, or 2.2 percent. Since 2000, household growth has increased to about 11,100 a year, or 2.4 percent. Currently, the Jacksonville HMA has an estimated 510,300 households, with 342,200 in Duval County and 168,100 in the Suburban Counties. See Table DP-1 at the end of the report for additional information about population and households in the HMA from 1990 to the current date.
Housing Market Trends
Sales Market—Duval County SubmarketDuval County, which includes the city of Jacksonville, accounts for nearly two-thirds of the HMA population. It is the largest submar-ket in terms of home sales.
From 2002 to 2006, the combina-tion of population growth, relatively affordable housing, low mortgage rates, and favorable lending terms created a very strong sales market in the Jacksonville HMA. Single-family home sales peaked at 17,800 for the 12 months ending March 2006, according to the Florida As-sociation of REALTORS® (FAR). Lending conditions have tightened
in the past year, however, and sales demand has declined, resulting in slightly soft conditions. During the 12 months ending March 2007, approximately 15,300 single-family homes were sold in the HMA, a decline of 14 percent from the peak. The number of condominiums sold during the same period declined from about 2,300 to 1,700, or by 25 percent.
Although single-family home prices continue to increase, the rate of appreciation has slowed dramati-cally. According to the National Association of REALTORS®, the

Ja
ck
so
nv
ille
, F
L •
CO
MP
RE
HE
NS
IVE
HO
US
ING
MA
RK
ET
AN
ALY
SIS
�
1990 2000 Current
Renter Owner
Sources: 1990 and 2000—U.S. Census; current—estimates by analyst
Figure 7. Number of Households by Tenure in the Duval County Submarket, 1990 to Current
250,000
200,000
150,000
100,000
50,000
0
2000
2001
2002
2003
2004
2005
2006
Figure 6. Single-Family Building Permits Issued in the Duval County Submarket, 1990 to 2007
Notes: Includes only single-family units. Includes data through March 2007.Source: U.S. Census Bureau, Building Permits Survey
1992
1993
1994
1995
1996
1997
1998
1999
1991
1990
10,000
8,000
6,000
4,000
2,000
0
2007
Housing Market TrendsSales Market—Duval County Submarket Continued
median sales price for homes in the HMA was $197,600 in the first quarter of 2007, compared with $195,600 a year earlier, an increase of 1 percent. The rate of increase is down considerably from first quarter 2006, when the year-over-year rate of price appreciation was 19 percent. Condominium prices have fallen recently. The median price for condominiums in the HMA was $148,000 for the first quarter of 2007, compared with $160,900 a year ago, a decline of 8 percent.
With declining sales, the supply of unsold homes has increased. According to data from the National Association of REALTORS® nearly 10,000 homes were for sale in the HMA as of April 2007, which represents more than a 7-month supply, an increase from a year ago. The number of vacant units
for sale has also increased, much of that as a result of an excess supply of newly constructed homes. Currently, the sales vacancy rate in Duval County is estimated to be 2.2 percent, up from 1.8 percent in 2000, with about 5,100 vacant units available for sale. See Table DP-2 at the end of the report for additional information on housing inventories and sales vacancy rates in Duval County from 1990 to the current date.
From 2002 to 2006, residential construction in Duval County, as measured by the number of building permits issued, increased dramatically. In 2005, the number of permits issued for single-family homes peaked at 8,300 (see Figure 6). Since then, builders have scaled back production in response to de-clining sales. During the 12 months ending March 2007 5,000 permits were authorized for single-family homes in Duval County, down from about 9,000 for the same period a year earlier, a drop of 44 percent.
Much of the new owner-occupied housing built since 2004 has been in multifamily developments. An estimated three-quarters of multi-family units authorized in the past 3 years have been for condominiums rather than rental apartments. In addition, many of the new condo-miniums have been second homes or seasonal homes, especially those near the coast.
The number of owner households in Duval County grew from 191,700 in 2000 to 227,900 currently (see Figure 7). Despite the relative softness of the market, household growth in Duvall County should remain strong during the forecast

Ja
ck
so
nv
ille
, F
L •
CO
MP
RE
HE
NS
IVE
HO
US
ING
MA
RK
ET
AN
ALY
SIS
�Housing Market TrendsSales Market—Duval County Submarket Continued
Price Range ($) Units of Percent
From To Demand of Total
90,000 104,999 560 3.8
105,000 119,999 900 6.1
120,000 139,999 1,250 8.5
140,000 159,999 1,460 9.9
160,000 179,999 1,590 10.8
180,000 199,999 1,600 10.9
200,000 224,999 1,540 10.5
225,000 249,999 1,400 9.5
250,000 289,999 1,160 7.9
290,000 349,999 960 6.5
350,000 429,999 760 5.2
430,000 549,999 600 4.1
550,000 and higher 920 6.3
Source: Estimates by analyst
Table 4. Estimated Demand for New Market-Rate Sales Housing in the Duval County Submarket, April 1, 2007 to April 1, 2010
Rental Market—Duval County SubmarketThe rental market in Duval County was somewhat soft in 2000, with a vacancy rate of 9 percent. Condi-tions have tightened during the
past 2 years, partly as a result of the large volume of apartment-to-condominium conversions, and are now considered balanced. Accord-ing to RealData, Inc., from mid-2003 through December 2006, nearly 7,000 apartments in the entire Jacksonville HMA were converted to condominiums; however, conver-sion activity in recent months has nearly stopped. The current rental vacancy rate for Duval County is estimated at 8.2 percent, down from 9 percent in 2000 (see Figure 8). The average monthly rent for apartments in the HMA as of December 2006 was $773, an increase of 4.3 percent from a year earlier.
The number of multifamily units permitted in Duval County peaked in 2005 at 5,200 (see Figure 9). During the 12 months ending March 2007 about 3,800 multifamily units were permitted, down from 4,500 for the same period a year earlier, a drop of 17 percent. As noted above, most of the new units are condominiums. Only
Sources: 1990 and 2000—U.S. Census; current—estimates by analyst
1990 2000 Current
12.5
9.0 8.2
14.012.010.08.06.04.02.00.0
Figure 8. Rental Vacancy Rates in the Duval County Submarket, 1990 to Current
period. Demand is expected for 14,700 new sales units in Duval County during the next 3 years (see Table 4). Currently, an estimated 4,200 units are already under con-struction, with another 600 units in the development pipeline. Most of the units now planned or under construction will be completed during the first year of the forecast period, leaving an estimated demand for about 9,900 units to be completed during the last 2 years of the forecast period.
Notes: Includes all multifamily units in structures with two or more units. Includes data through March 2007.Source: U.S. Census Bureau, Building Permits Survey
Figure 9. Multifamily Building Permits Issued in the Duval County Submarket, 1990 to 2007
2000
2001
2002
2003
2004
2005
2006
1992
1993
1994
1995
1996
1997
1998
1999
1991
1990
6,000
5,000
4,000
3,000
2,000
1,000
0
2007

Ja
ck
so
nv
ille
, F
L •
CO
MP
RE
HE
NS
IVE
HO
US
ING
MA
RK
ET
AN
ALY
SIS
�Housing Market TrendsRental Market—Duval County Submarket Continued
Notes: Distribution above is noncumulative. Demand shown at any rent represents demand at that level and higher.Source: Estimates by analyst
1 Bedroom 2 Bedrooms 3 or More Bedrooms
Monthly Gross Rent ($)
Units of Demand
Monthly Gross Rent ($)
Units of Demand
Monthly Gross Rent ($)
Units of Demand
the Jacksonville HMA ranges from $776 to $1,671 a month, depending on the service person’s rank and the number of dependants the service person has. More than 20,000 active duty personnel live off base; this figure is expected to decline slightly during the forecast period.
Since 2000, the number of renter households in Duval County has increased very little as compared with owner households. Duval County had 112,000 renter house-holds in 2000; currently, there are an estimated 114,300 renter house-holds. Factors such as low mortgage rates and favorable lending terms supported homeownership. With changing lending conditions, demand for approximately 4,600 new rental units is expected during the next 3 years. Roughly half of that demand will be met by units cur-rently under construction. Table 5 shows the estimated distribution by bedroom size and monthly rent.
Table 5. Estimated Demand for New Market-Rate Rental Housing in the Duval County Submarket, April 1, 2007 to April 1, 2010
750 1,375 900 2,200 1,000 1,025
800 1,225 950 1,850 1,050 900
850 1,125 1,000 1,675 1,100 825
900 1,000 1,050 1,500 1,150 700
950 875 1,100 1,300 1,200 600
1,000 750 1,150 1,100 1,250 525
1,050 625 1,200 925 1,300 450
1,150 500 1,300 750 1,400 325
1,250 400 1,400 500 1,500 250
1,350 325 1,500 325 1,600 175
1,450 250 1,600 225 1,700 150
and higher and higher and higher
about 3,500, or 26 percent, of the 13,400 multifamily units added since 2004 were apartments. In the 1990s, approximately 70 percent of the multifamily units produced were rental units.
About one-third of the existing rental inventory in Duval County is composed of single-family homes. With slower home sales, more homes are expected to become available in the rental market. In addition, many apartments previ-ously converted to condominiums were bought by investors; many of these units have returned to the rental market.
Military housing for area Navy personnel is limited, with approxi-mately 1,900 government housing units for service personnel. Waitlists for government units mean that new personnel generally are referred to local area rental housing. The Navy provides a housing allowance for those living off base, which in
Ja
ck
so
nv
ille
, F
L •
CO
MP
RE
HE
NS
IVE
HO
US
ING
MA
RK
ET
AN
ALY
SIS
�
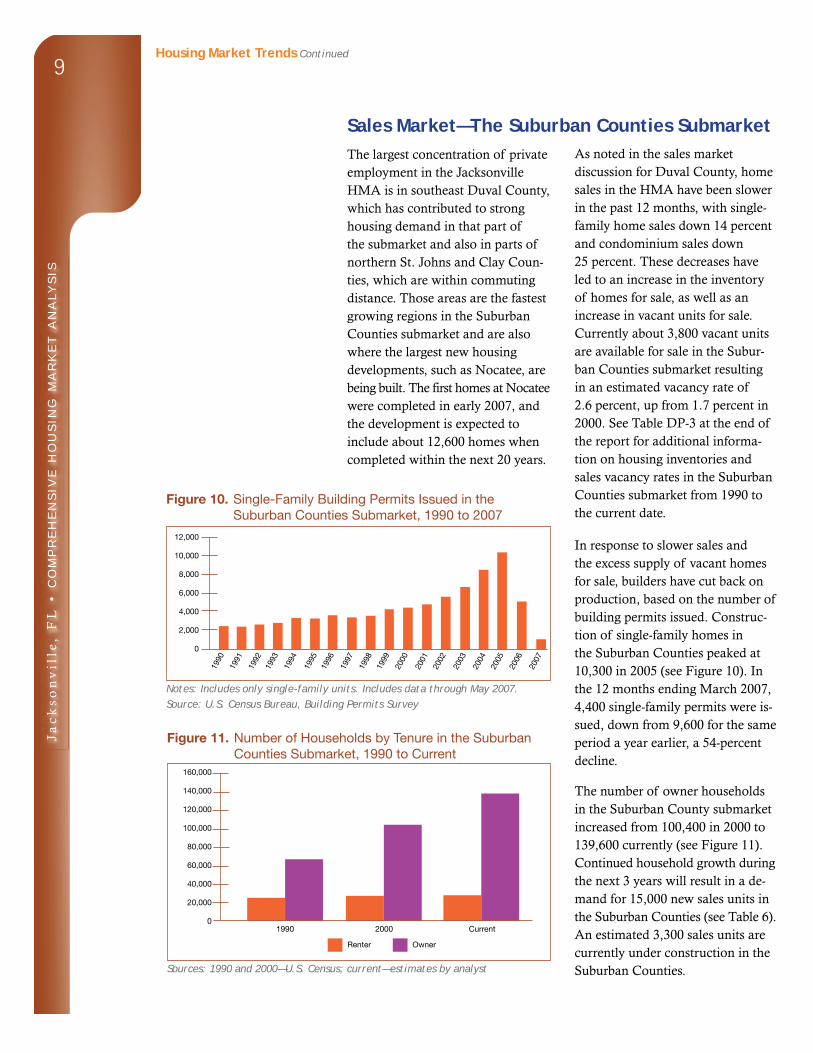
Sales Market—The Suburban Counties SubmarketThe largest concentration of private employment in the Jacksonville HMA is in southeast Duval County, which has contributed to strong housing demand in that part of the submarket and also in parts of northern St. Johns and Clay Coun-ties, which are within commuting distance. Those areas are the fastest growing regions in the Suburban Counties submarket and are also where the largest new housing developments, such as Nocatee, are being built. The first homes at Nocatee were completed in early 2007, and the development is expected to include about 12,600 homes when completed within the next 20 years.
As noted in the sales market discussion for Duval County, home sales in the HMA have been slower in the past 12 months, with single-family home sales down 14 percent and condominium sales down 25 percent. These decreases have led to an increase in the inventory of homes for sale, as well as an increase in vacant units for sale. Currently about 3,800 vacant units are available for sale in the Subur-ban Counties submarket resulting in an estimated vacancy rate of 2.6 percent, up from 1.7 percent in 2000. See Table DP-3 at the end of the report for additional informa-tion on housing inventories and sales vacancy rates in the Suburban Counties submarket from 1990 to the current date.
In response to slower sales and the excess supply of vacant homes for sale, builders have cut back on production, based on the number of building permits issued. Construc-tion of single-family homes in the Suburban Counties peaked at 10,300 in 2005 (see Figure 10). In the 12 months ending March 2007, 4,400 single-family permits were is-sued, down from 9,600 for the same period a year earlier, a 54-percent decline.
The number of owner households in the Suburban County submarket increased from 100,400 in 2000 to 139,600 currently (see Figure 11). Continued household growth during the next 3 years will result in a de- mand for 15,000 new sales units in the Suburban Counties (see Table 6). An estimated 3,300 sales units are currently under construction in the Suburban Counties.
Housing Market Trends Continued
1990 2000 Current
Renter Owner
Sources: 1990 and 2000—U.S. Census; current—estimates by analyst
Figure 11. Number of Households by Tenure in the Suburban Counties Submarket, 1990 to Current
160,000
140,000
120,000
100,000
80,000
60,000
40,000
20,000
0
2000
2001
2002
2003
2004
2005
2006
Figure 10. Single-Family Building Permits Issued in the Suburban Counties Submarket, 1990 to 2007
Notes: Includes only single-family units. Includes data through May 2007.Source: U.S. Census Bureau, Building Permits Survey
1992
1993
1994
1995
1996
1997
1998
1999
1991
1990
12,000
10,000
8,000
6,000
4,000
2,000
0
2007

Ja
ck
so
nv
ille
, F
L •
CO
MP
RE
HE
NS
IVE
HO
US
ING
MA
RK
ET
AN
ALY
SIS
10
Rental Market—The Suburban Counties Submarket
The rental market in the Suburban Counties is much smaller than in Duval County. In addition,
almost all household growth in the Suburban Counties submarket since 2000 has been in owner households. The rental market in the Suburban Counties has tightened in recent years, but it remains somewhat soft. The current rental vacancy rate for the Suburban Counties is estimated at 11.5 percent, down from 12.7 percent in 2000 (see Figure 12).
Although single-family construction was slowing in 2006, the number of multifamily units authorized by permits continued to increase, reaching 1,800 (see Figure 13). Dur-ing the 12 months ending March 2007, about 1,900 multifamily units were permitted, up from 1,300 for the same period a year earlier, a 46-percent increase. As in Duval County, about three-quarters of the multifamily units built since 2004 were condominiums, including many owner-occupied second or seasonal homes, especially those located in coastal areas.
Housing Market TrendsSales Market—The Suburban Counties Submarket Continued
Price Range ($) Units of Percent
From To Demand of Total
90,000 104,999 180 1.2
105,000 119,999 830 5.5
120,000 139,999 1,310 8.7
140,000 159,999 1,620 10.8
160,000 179,999 1,770 11.8
180,000 199,999 1,800 12.0
200,000 224,999 1,650 11.0
225,000 249,999 1,430 9.5
250,000 289,999 1,230 8.2
290,000 349,999 990 6.6
350,000 429,999 740 4.9
430,000 549,999 540 3.6
550,000 and higher 910 6.1
Source: Estimates by analyst
Table 6. Estimated Demand for New Market-Rate Sales Housing in the Suburban Counties Submarket, April 1, 2007 to April 1, 2010
Sources: 1990 and 2000—U.S. Census; current—estimates by analyst
1990 2000 Current
15.0
12.611.5
16.014.012.010.08.06.04.02.00.0
Figure 12. Rental Vacancy Rates in the Suburban Counties Submarket, 1990 to Current
Notes: Includes all multifamily units in structures with two or more units. Includes data through March 2007.Source: U.S. Census Bureau, Building Permits Survey
Figure 13. Multifamily Building Permits Issued in the Suburban Counties Submarket, 1990 to 2007
2000
2001
2002
2003
2004
2005
2006
1992
1993
1994
1995
1996
1997
1998
1999
1991
1990
2,000
1,500
1,000
500
0
2007

Ja
ck
so
nv
ille
, F
L •
CO
MP
RE
HE
NS
IVE
HO
US
ING
MA
RK
ET
AN
ALY
SIS
11Housing Market TrendsRental Market—The Suburban Counties Submarket Continued
Approximately 20 percent of the apartment-to-condominium conversions in the Jacksonville HMA were in the Suburban Coun-ties submarket, which had fewer apartment complexes to begin with. Population growth and limited rental construction have contributed to the somewhat tighter rental market conditions in the Suburban Counties.
Tighter lending conditions and a slower sales market likely will lead to an increase in the number of renter households during the next
3 years. Much of that increased demand will be met by existing single-family homes, which currently make up about 40 percent of the rental market in the Suburban Counties; however, there will be an estimated demand for approxi-mately 800 new rental units in the Suburban Counties during the forecast period. Approximately half of that demand will be met by the 400 units currently under construc-tion. Table 7 shows the estimated distribution by number of bedrooms and monthly rent.
Notes: Distribution above is noncumulative. Demand shown at any rent represents demand at that level and higher.Source: Estimates by analyst
1 Bedroom 2 Bedrooms 3 or More Bedrooms
Monthly Gross Rent ($)
Units of Demand
Monthly Gross Rent ($)
Units of Demand
Monthly Gross Rent ($)
Units of Demand
Table 7. Estimated Demand for New Market-Rate Rental Housing in the Suburban Counties Submarket, April 1, 2007 to April 1, 2010
750 170 950 440 1,050 190
800 150 1,000 370 1,100 170
850 140 1,050 330 1,150 160
900 120 1,100 300 1,200 130
950 110 1,150 260 1,250 110
1,000 90 1,200 220 1,300 100
1,050 80 1,250 190 1,350 90
1,150 60 1,350 150 1,450 60
1,250 50 1,450 100 1,550 50
1,350 40 1,550 70 1,650 40
1,450 30 1,650 40 1,750 30
and higher and higher and higher

Ja
ck
so
nv
ille
, F
L •
CO
MP
RE
HE
NS
IVE
HO
US
ING
MA
RK
ET
AN
ALY
SIS
1�
Note: Median family incomes are for 1989, 1999, and 2006.Sources: Estimates by analyst; U.S. Census Bureau; U.S. Department of Housing and Urban Development
Table DP–1. Jacksonville HMA Data Profile, 1990 to Current
Average Annual Change (%)
1990 2000 Current 1990 to 2000 2000 to Current
Total Resident Employment 456,200 562,900 633,100 2.1 1.7
Unemployment Rate (%) 5.3 3.1 3.3
Nonfarm Employment 428,300 549,200 628,200 2.7 1.9
Total Population 925,200 1,122,800 1,290,200 2.0 2.0
Total Households 349,000 432,500 510,300 2.2 2.4
Owner Households 226,900 292,100 367,500 2.6 3.3
Percent Owner (%) 65.0 67.5 72.0
Renter Households 122,100 140,400 142,800 1.4 0.2
Percent Renter (%) 35.0 32.5 28.0
Total Housing Units 390,200 475,000 577,000 2.0 2.8
Owner Vacancy Rate (%) 2.8 1.8 2.4
Rental Vacancy Rate (%) 13.0 9.8 8.9
Median Family Income $34,300 $50,200 $52,800 3.9 0.7
Data Profiles
Note: Median family incomes are for 1989, 1999, and 2006.Sources: Estimates by analyst; U.S. Census Bureau; U.S. Department of Housing and Urban Development
Table DP–2. Duval County Submarket Data Profile, 1990 to Current
Average Annual Change (%)
1990 2000 Current 1990 to 2000 2000 to Current
Total Population 673,000 778,900 866,800 1.5 1.5
Total Households 257,200 303,700 342,200 1.7 1.7
Owner Households 159,400 191,700 227,900 1.9 2.5
Percent Owner (%) 62.0 63.1 66.6
Rental Households 97,800 112,000 114,300 1.4 0.3
Percent Renter (%) 38.0 36.9 33.4
Total Housing Units 284,600 329,800 380,600 1.5 2.1
Owner Vacancy Rate (%) 2.9 1.8 2.2
Rental Vacancy Rate (%) 12.5 9.0 8.2
Median Family Income $33,500 $47,700 $50,100 3.6 0.7
Note: Median family incomes are for 1989, 1999, and 2006.Sources: Estimates by analyst; U.S. Census Bureau; U.S. Department of Housing and Urban Development
Table DP–3. Suburban Counties Submarket Data Profile, 1990 to Current
Average Annual Change (%)
1990 2000 Current 1990 to 2000 2000 to Current
Total Population 252,200 343,900 423,400 3.1 3.0
Total Households 91,800 128,800 168,100 3.4 3.9
Owner Households 67,500 100,400 139,600 4.1 4.8
Percent Owner (%) 73.5 78.0 83.0
Rental Households 24,300 28,400 28,500 1.6 0.1
Percent Renter (%) 26.5 22.0 17.0
Total Housing Units 105,600 145,200 196,400 3.2 4.4
Owner Vacancy Rate (%) 2.7 1.8 2.6
Rental Vacancy Rate (%) 15.0 12.6 11.5
Median Family Income $35,400 $55,100 $57,900 4.5 0.7

Ja
ck
so
nv
ille
, F
L •
CO
MP
RE
HE
NS
IVE
HO
US
ING
MA
RK
ET
AN
ALY
SIS
1�
Data Definitions and Sources
1990: 4/1/1990—U.S. Decennial Census
2000: 4/1/2000—U.S. Decennial Census
Current date: 4/1/2007—Analyst’s estimates
Forecast period: 4/1/2007–4/1/2010—Analyst’s
estimates
Demand: The demand estimates in the analysis
are not a forecast of building activity. They are
the estimates of the total housing production
needed to achieve a balanced market at the end
of the 3-year forecast period given conditions on
the as-of date of the analysis, growth, losses, and
excess vacancies. The estimates do not account
for units currently under construction or units in
the development pipeline.
For additional data pertaining to the housing
market for this HMA, go to www.huduser.org/
publications/pdf/CMARtables_JacksonvilleFL.
pdf.
Contact Information
James H. Conner, Field Economist
Jacksonville HUD Field Office
904–232–1777, ext. 2112
This analysis has been prepared for the assistance and
guidance of the U.S. Department of Housing and
Urban Development (HUD) in its operations. The
factual information, findings, and conclusions may also
be useful to builders, mortgagees, and others concerned
with local housing market conditions and trends. The
analysis does not purport to make determinations
regarding the acceptability of any mortgage insurance
proposals that may be under consideration by the
Department.
The factual framework for this analysis follows the
guidelines and methods developed by HUD’s Economic
and Market Analysis Division. The analysis and
findings are as thorough and current as possible based
on information available on the as-of date from local
and national sources. As such, findings or conclusions
may be modified by subsequent developments. HUD
expresses its appreciation to those industry sources and
state and local government officials who provided data
and information on local economic and housing market
conditions.
For additional reports on other market areas, please go to www.huduser.org/publications/econdev/mkt_analysis.html.