chris bayliss - world aluminium · chris bayliss . deputy secretary general . international...
TRANSCRIPT


Geographical Shift in Centres of Production & Consumption
Primary Production
0
5
10
15
20
25
30
35
40
45
1995 2000 2005 2010
Mill
ion
tonn
es p
rimar
y Al
China
Arabian Gulf
India
Other Asia
Africa
CIS/E Europe
W Europe
Oceania
S America
N America
Primary Consumption
0
5
10
15
20
25
30
35
40
45
1995 2000 2005 2010
Mill
ion
tonn
es p
rimar
y Al
China
Arabian Gulf
India
Japan
Other Asia
Africa
Russia/Ukraine
Europe
Oceania
S America
N America

“Disintegration” & contraction of
corporate value chain
Increasing demand from customers for
“responsibly sourced” materials
Industry needs to demonstrate...
1. that it produces responsibly, by mitigating environmental impacts and positively impacting the communities in which it operates;
2. that its products bring a net benefit to society in terms of energy efficiency & emissions reduction, quality of life, health and sustainable development;
3. that at the end of product life, the value of the material, the energy that went into its production and the socio-economic benefit is retained and realised as another product, through collection and recycling or energy recovery.


The Aluminium Story
Products “Use Phase”
Processes “Production Phase”
Recycling “End of Life Phase”

Industry Performance
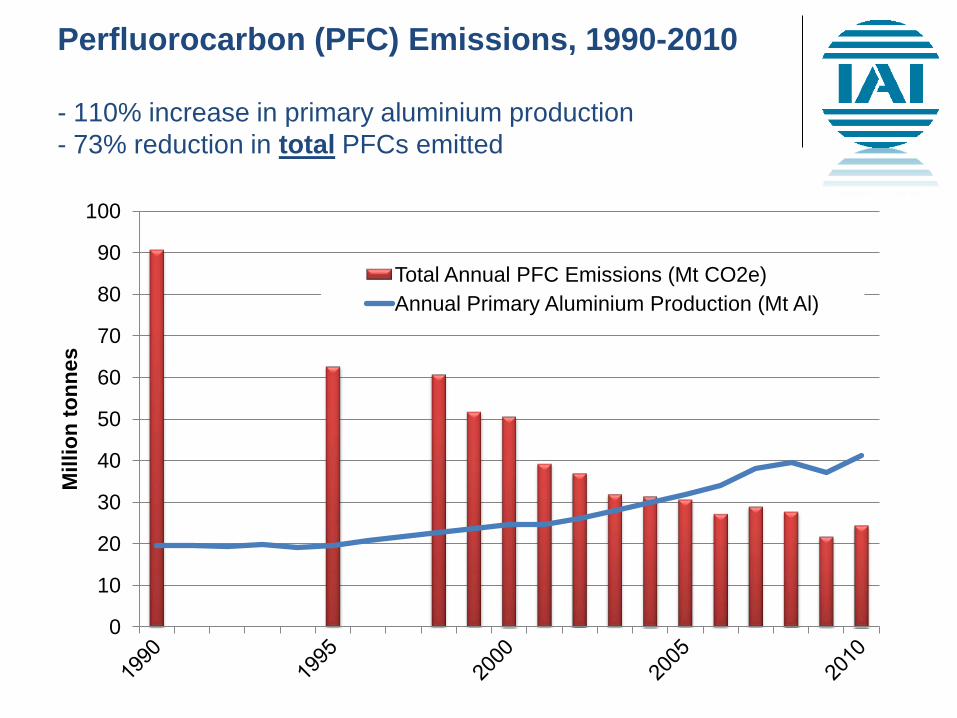
Perfluorocarbon (PFC) Emissions, 1990-2010 - 110% increase in primary aluminium production - 73% reduction in total PFCs emitted
0
10
20
30
40
50
60
70
80
90
100
Mill
ion
tonn
es
Total Annual PFC Emissions (Mt CO2e) Annual Primary Aluminium Production (Mt Al)

Total Direct GHGs from All Primary Aluminium Processes (Mine to Casthouse), 1990-2010
0
6
12
18
24
30
36
42
48
0
50
100
150
200
250
300
350
400
Mill
ion
tonn
es A
l
Mill
ion
tonn
es C
O2e
Mining (Mt CO2e) Casting (Mt CO2e) Anode Production (Mt CO2e) Alumina Refining (Mt CO2e) Anode Consumption (Mt CO2e) PFCs (Mt CO2e) Aluminium Production (Mt Al)

Energy Efficiency
Smelting
13.0
13.5
14.0
14.5
15.0
15.5
16.0
16.5
17.0
MW
h/t A
l
AC DC
Refining
13.0
13.5
14.0
14.5
15.0
15.5
16.0
16.5
17.0
GJ/
t Al 2O
3

Bauxite Mine Rehabilitation
One square metre mined annually per tonne of primary aluminium produced
Land area footprint neutral

COMING SOON: Bauxite & Alumina and Primary Aluminium
websites will be launched in early 2012

Recycling
Total ProductsStored in UseSince 1888693.4
FinishedProducts (output)48.8
OtherApplications3
1.0
Semi-fabricatedand FinishedProducts (input)80.5
TradedNewScrap7
10.1
FabricatorScrap2
21.6
TradedNew
Scrap1 1.7
Ingots9 83.2
Metal Losses 1.9 Recovery and Disposal8 4.3 Under Investigation4 3.0
OldScrap
10.6
Bauxite5 217.0
Bauxite Residues 91.3and Water 46.5
Alumina*6 79.2
METAL FLOW
PrimaryAluminium used
41.1
MATERIAL FLOW
RemeltedAluminium 42.1
incl.RecycledAluminium 20.4
Building 33% Transport 28%a.o.Automotive16%
Net Addition 2010: 29.9
Packaging 1%
and Cable 28%EngineeringOther 10%

Promoting recovery & value retention through recycling
Approximately 75% of all aluminium ever produced is still in productive use.
Recycling aluminium products saves almost 100 million tonnes of CO2 pa.
Aluminium recycling avoids up to 95% of the energy required & emissions from primary production.
Globally, aluminium achieves high recycling rates, with over 90% for transport and construction applications.
While aluminium accounts for less than 10% of a car’s total weight, it represents up to 50% of the total material scrap value.
13

Global aluminium flow 2010 (DRAFT)
Transport 28% o.a.Automotive16%
Building 31%
Packaging 1%
Other 11% Engineering and Cable 29%
Source: GARC, September 2011
Total ProductsStored in UseSince 1888693.4
FinishedProducts (output)48.8
OtherApplications3
1.0
Semi-fabricatedand FinishedProducts (input)80.5
TradedNewScrap7
10.1
FabricatorScrap2
21.6
TradedNew
Scrap1 1.7
Ingots9 83.2
Metal Losses 1.9 Recovery and Disposal8 4.3 Under Investigation4 3.0
OldScrap
10.6
Bauxite5 217.0
Bauxite Residues 91.3and Water 46.5
Alumina*6 79.2
Values in millions of metric tonnes. Values might not add up due to rounding. *Change in stocks not shown1 Aluminium in skimmings; 2 Scrap generated by foundries, rolling mills and extruders. Most is internal scrap and not taken into account in statistics; 3 Such as deoxidation aluminium (metalproperty is lost ) 4 Area of current research to identify final aluminium destination (reuse, recycling, recovery or disposal); 5 Calculated based on IAI LCI report - update 2005. Includes,depending on the ore, between 30% and 50% alumina; 6 Calculated. Includes on a global average 52% aluminium; 7 Scrap generated during the production of finished products from semis;8 Either incinerated with/without energy recovery, material recovery or disposal; 9 Estimated stock increase 980,000 tonnes.
METAL FLOW
PrimaryAluminium used
41.1
MATERIAL FLOW
RemeltedAluminium 42.1
incl.RecycledAluminium 20.4
Building 33% Transport 28%a.o.Automotive16%
Net Addition 2010: 29.9
Packaging 1%
and Cable 28%EngineeringOther 10%

High End of Life Recycling Rates in Key Markets
Automotive – up to 95% recycling rate The transport sector used 14 million tonnes in 2010
Buildings – up to 98% recycling rate The building, construction & cabling sector used 20 million tonnes of aluminium in 2010
Beverage cans: 2006: 61% 2007: 63% 2008: 69% 2009: 70% The packaging sector used 8.5 million tonnes in 2010
15

Promoting recovery & value retention through recycling
0
20
40
60
80
100
120
Mill
ion
tonn
es A
l
Required primary Demand met from recycled
Update: August 5, 2008

http://recycling.world-aluminium.org


Global Metal Flow

Regional Reports

Product Stewardship

Anthropogenic GHG Emissions by Sector (2004)
Industry
...of which Al production
Energy Supply ...of which Al production Transport
Residential & Commercial
Buildings
Agriculture
Forestry
Waste & Wastewater
IPCC 2007, IAI

Opportunities for GHG Reductions from Aluminium Use
Efficient Machinery
Efficient Cabling,
Turbines & Solar Panels;
Efficient Consumer Durables & Intelligent Control …
Lightweight Vehicles
Green Buildings
Protective Packaging
IPCC 2007, IAI

http://transport.world-aluminium.org
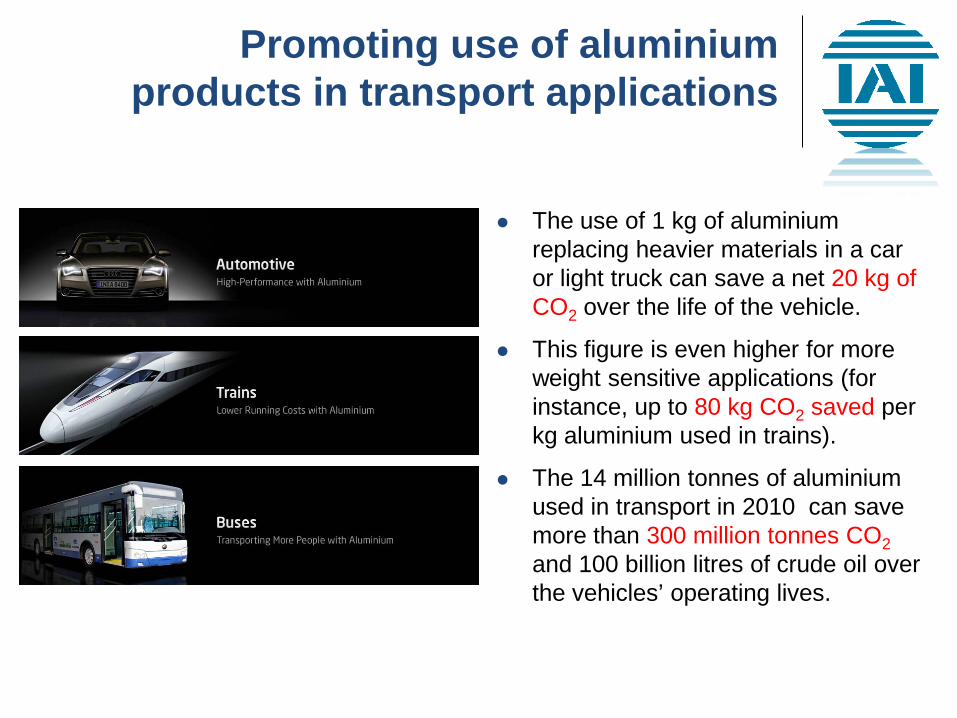
Promoting use of aluminium products in transport applications
The use of 1 kg of aluminium replacing heavier materials in a car or light truck can save a net 20 kg of CO2 over the life of the vehicle.
This figure is even higher for more weight sensitive applications (for instance, up to 80 kg CO2 saved per kg aluminium used in trains).
The 14 million tonnes of aluminium used in transport in 2010 can save more than 300 million tonnes CO2 and 100 billion litres of crude oil over the vehicles’ operating lives.


http://greenbuilding.world-aluminium.org

Greatest potential for building energy & emissions reduction is use phase
Carbon footprint of UK construction in 2008 (300 Mt CO2e)
Design <1%
Manufacture (inc. materials) 15%
Distribution 1%
Construction 1%
Operation (in use) 83%
End of Life
Source: Low Carbon Construction IGT (2010), UK BIS


http://packaging.world-aluminium.org
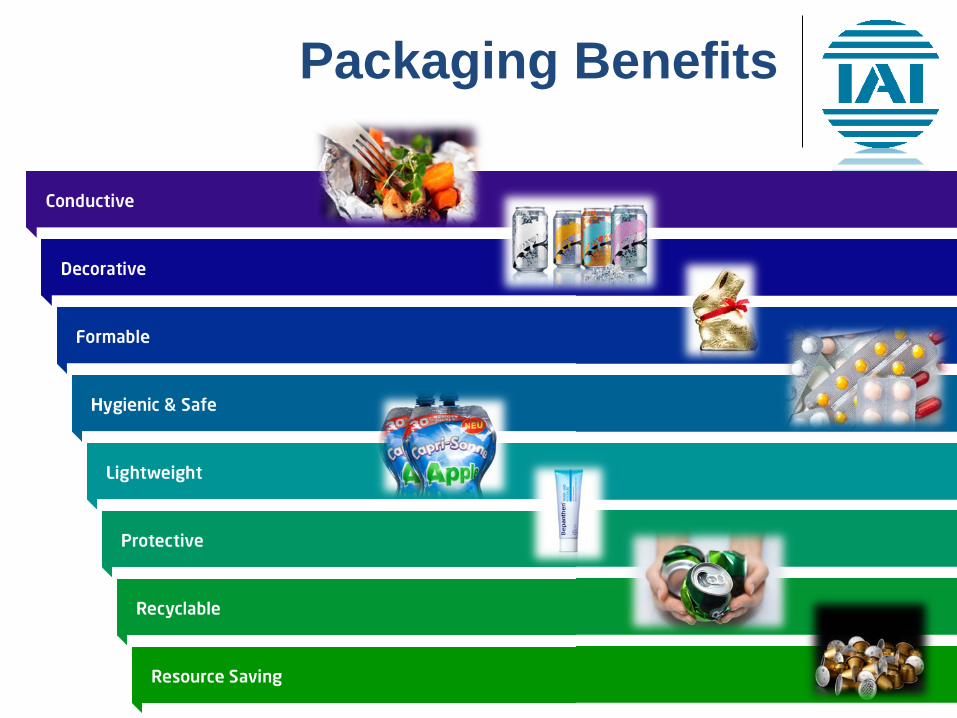
Packaging Benefits


Demonstrate
1.Responsible production
2.Net benefit of aluminium products to society
3.Benefits of recycling and high value of used aluminium products
http://recycling.world-aluminium.org http://greenbuilding.world-aluminium.org http://transport.world-aluminium.org http://packaging.world-aluminium.org