ci university auxiliary services, inc ... - uas.csuci.edu · 1 independent auditors’ report to...
TRANSCRIPT

CI UNIVERSITY AUXILIARY SERVICES, INC.
Financial Statements and Supplementary
Information for the Year Ended June 30, 2018
and Independent Auditors’ Report

CI UNIVERSITY AUXILIARY SERVICES, INC. TABLE OF CONTENTS
Page
FINANCIAL STATEMENTS
Independent Auditors’ Report 1
Management’s Discussion and Analysis (Unaudited) 3
Statement of Net Position 7
Statement of Revenues, Expenses, and Changes in Net Position 8
Statement of Cash Flows 9 Notes to Financial Statements 10
SUPPLEMENTARY INFORMATION
GASB Schedule of Net Position 20
GASB Schedule of Revenues, Expenses and Changes in Net Position 21
Other Information 22

1
INDEPENDENT AUDITORS’ REPORT
To the Board of Directors of
CI University Auxiliary Services, Inc.
Camarillo, California
We have audited the accompanying financial statements of CI University Auxiliary Services, Inc. as of and for the
year ended June 30, 2018, and the related notes to the financial statements, which collectively comprise the
organization’s basic financial statements as listed in the table of contents.
Management’s Responsibility for the Financial Statements
Management is responsible for the preparation and fair presentation of these financial statements in accordance
with accounting principles generally accepted in the United States of America; this includes the design,
implementation, and maintenance of internal control relevant to the preparation and fair presentation of financial
statements that are free from material misstatement, whether due to fraud or error.
Auditors’ Responsibility
Our responsibility is to express an opinion on these financial statements based on our audit. We conducted our
audit in accordance with auditing standards generally accepted in the United States of America. Those standards
require that we plan and perform the audit to obtain reasonable assurance about whether the financial statements
are free from material misstatement.
An audit involves performing procedures to obtain audit evidence about the amounts and disclosures in the
financial statements. The procedures selected depend on the auditors’ judgment, including the assessment of the
risks of material misstatement of the financial statements, whether due to fraud or error. In making those risk
assessments, the auditor considers internal control relevant to the entity’s preparation and fair presentation of the
financial statements in order to design audit procedures that are appropriate in the circumstances, but not for the
purpose of expressing an opinion on the effectiveness of the entity’s internal control. Accordingly, we express no
such opinion. An audit also includes evaluating the appropriateness of accounting policies used and the
reasonableness of significant accounting estimates made by management, as well as evaluating the overall
presentation of the financial statements.
We believe that the audit evidence we have obtained is sufficient and appropriate to provide a basis for our audit
opinion.
Opinion
In our opinion, the financial statements referred to above present fairly, in all material respects, the respective
financial position of CI University Auxiliary Services, Inc. as of June 30, 2018, and the respective changes in
financial position, and its cash flows for the year then ended in accordance with accounting principles generally
accepted in the United States of America.

2
INDEPENDENT AUDITORS’ REPORT - Continued
Report on Summarized Comparative Information We previously audited CI University Auxiliary Services, Inc.’s 2017 financial statements, and we expressed an
unmodified audit opinion on those audited financial statements in our report dated September 14, 2017. In our
opinion, the summarized comparative information presented herein as of and for the year ended June 30, 2017, is
consistent, in all material respects, with the audited financial statements from which it has been derived.
The summary financial statements do not contain all the disclosures required by accounting principles generally
accepted in the United States of America. Reading the summary financial statements, therefore, is not a substitute
for reading the audited financial statements of CI University Auxiliary Services, Inc.
Other Matters
Required Supplementary Information
Accounting principles generally accepted in the United States of America require that the management’s
discussion and analysis information on pages 3 through 6 be presented to supplement the basic financial
statements. Such information, although not a part of the basic financial statements, is required by the
Governmental Accounting Standards Board, who considers it to be an essential part of financial reporting for
placing the basic financial statements in an appropriate operational, economic, or historical context. We have
applied certain limited procedures to the required supplementary information in accordance with auditing
standards generally accepted in the United States of America, which consisted of inquiries of management about
the methods of preparing the information and comparing the information for consistency with management’s
responses to our inquiries, the basic financial statements, and other knowledge we obtained during our audit of the
basic financial statements. We do not express an opinion or provide any assurance on the information because the
limited procedures do not provide us with sufficient evidence to express an opinion or provide any assurance.
Other Information
Our audit was conducted for the purpose of forming an opinion on the financial statements as a whole. The GASB
Schedule of Net Position, GASB Schedule of Revenues, Expenses and Changes in Net Position, and Other
Information are presented for purposes of additional analysis and are not a required part of the basic financial
statements. The GASB Schedule of Net Position, GASB Schedule of Revenues, Expenses and Changes in Net
Position, and Other Information are the responsibility of management and were derived from and relate directly to
the underlying accounting and other records used to prepare the financial statements. Such information has been
subjected to the auditing procedures applied in the audit of the financial statements and certain additional
procedures, including comparing and reconciling such information directly to the underlying accounting and other
records used to prepare the financial statements or to the financial statements themselves, and other additional
procedures in accordance with auditing standards generally accepted in the United States of America. In our
opinion, the GASB Schedule of Net Position, GASB Schedule of Revenues, Expenses and Changes in Net
Position, and Other Information are fairly stated, in all material respects, in relation to the basic financial
statements as a whole.
Calabasas, California September 13, 2018

CI UNIVERSITY AUXILIARY SERVICES, INC.
MANAGEMENT’S DISCUSSION AND ANALYSIS (UNAUDITED)
FOR THE YEAR ENDED JUNE 30, 2018
3
This section of CI University Auxiliary Services, Inc.’s annual financial report presents our discussion and
analysis of the financial performance of CI University Auxiliary Services, Inc. for the fiscal year ended June 30,
2018. This discussion has been prepared by management and should be read in conjunction with the financial
statements and notes.
Introduction to the Financial Statements
This annual report consists of a series of financial statements prepared in accordance with the Governmental
Accounting Standards Board (GASB) Statements No. 34, Basic Financial Statements – and Management’s
Discussion and Analysis – for State and Local Governments, No. 35, Basic Financial Statements – and
Management’s Discussion and Analysis – for Public Colleges and Universities, No. 37, Basic Financial
Statements – and Management’s Discussion and Analysis – for State and Local Governments: Omnibus, and No.
38, Certain Financial Statement Note Disclosures. For reporting purposes, the University is considered a
special-purpose government engaged only in business-type activities, which best represent, the activities of CI
University Auxiliary Services, Inc.
The financial statements include the statement of net position; the statement of revenues, expenses, and changes
in net position; and the statement of cash flows. These statements are supported by the notes to the financial
statements and this section. All sections must be considered together to obtain a complete understanding of the
financial picture of CI University Auxiliary Services, Inc.
Statement of Net Position – The statement of net position includes all assets and liabilities. Assets and liabilities
are reported at their book value, on an accrual basis, as of the statement date. It also identifies major categories of
restrictions on the net position of CI University Auxiliary Services, Inc.
Statement of Revenues, Expenses, and Changes in Net Position – The statement of revenues, expenses, and
changes in net position presents the revenues earned and expenses incurred during the year on an accrual basis.
Statement of Cash Flows – The statement of cash flows presents the inflows and outflows of cash for the year
and is summarized by operating, noncapital financing, capital and related financing, and investing activities. The
statement is prepared using the direct method of cash flows and, therefore, presents gross rather than net amounts
for the year’s activities.
Analytical Overview
Summary
The following discussion highlights management’s understanding of the key financial aspects of CI University
Auxiliary Services, Inc.’s financial activities. Included are an analysis of current year activities and balances, and
a summary of operations.

CI UNIVERSITY AUXILIARY SERVICES, INC.
MANAGEMENT’S DISCUSSION AND ANALYSIS (UNAUDITED)
FOR THE YEAR ENDED JUNE 30, 2018
4
CI University Auxiliary Services, Inc.’s summary of net position as of June 30, 2018 and 2017 are as follows:
Condensed Summary of Net Position
2018 2017 $ Change % Change
Assets:
Current assets 1,056,240$ 1,192,487$ (136,247)$ -11.4%
Other noncurrent assets 262,418 246,291 16,127 6.5%
Total assets 1,318,658 1,438,778 (120,120) 8.3%
Liabilities:
Current liabilities 909,187 685,684 223,503 32.6%
Other noncurrent liabilities 307,555 410,342 (102,787) - 25.0%
Total liabilities 1,216,742 1,096,026 120,716 11.0%
Net position:
Unrestricted 101,916 342,752 (240,836) -70.3%
Total net position 101,916$ 342,752$ (240,836)$ -70.3%
Year ended June 30,
Assets
Total assets decreased by $120K compared to prior year. This change is attributable to a decrease in cash of
$321K and an increase in related party receivables of $171K. Variance in cash is directly attributable to debt
service contribution to the Campus for the Islands dining expansion.
Liabilities
Total liabilities increased by $121K compared to the prior year. This change is due to an increase in accounts
payable of $79K due to timing of payments to vendors as well as an increase in related party payables of $166K,
which is a result of a debt service payment to campus, and a decrease in other noncurrent liabilities of $103K due
to employee payouts in compensated absences.
Net Position
CI University Auxiliary Services, Inc. total net position decreased by $240K compared to the prior year. Stable
and profitable commercial operations increased by $174K. The decrease is due to an increase in debt service
payment of $414K. With student head count to increase and overall Campus growth, commercial operations in
Food Services profitability is expected to increase. As a result, there is not a significant risk of CI University
Auxiliary’s ability to continue as a going concern.

CI UNIVERSITY AUXILIARY SERVICES, INC.
MANAGEMENT’S DISCUSSION AND ANALYSIS (UNAUDITED)
FOR THE YEAR ENDED JUNE 30, 2018
5
CI University Auxiliary Services, Inc.’s condensed summary of revenues, expenses, and changes in net position
for the years ended June 30, 2018 and 2017 is as follows:
Condensed Summary of Revenues, Expenses, and Changes in Net Position
2018 2017 $ Change % Change
Operating Revenues:
Management Fees 342,178$ 521,642$ (179,464)$ -34.4%
Food Service Sales, Net 5,159,321 4,923,120 236,201 4.8%
Misc. Income 138,539 14,596 123,943 849.2%
Total Operating Revenues 5,640,038 5,459,358 180,680 3.3%
Operating Expenses:
Salaries 4,650,262 4,721,136 (70,874) 1.5%
Other Operating Expenses 2,322,958 2,076,187 246,771 11.9%
Depreciation Expense 20,087 19,714 373 1.9%
Total Operating Expenses 6,993,307 6,817,037 176,270 2.6%
Operating Income (loss) (1,353,269) (1,357,679) 4,410 0.3%
Nonoperating Revenues (expenses):
Investment Income (loss) 2,301 1,282 1,019 79.5%
Payroll Services 1,361,121 1,495,484 (134,363) -9.0%
Interest Expense (250,989) (251,394) 405 164.7%
Net Nonoperating Revenues
(Expenses)1,112,433 1,245,372 (132,939) -44.0%
Increase (Decrease) in Net Position (240,836) (112,307) (128,529) -114.4%
Beginning Net Position 342,752 455,059 (112,307) -24.7%
Ending Net Position 101,916$ 342,752$ (240,836)$ -70.3%
Year ended June 30,
Operating Revenues and Expenses
Operating revenues and expenses come from sources that are connected directly to CI University Auxiliary
Services, Inc.’s business function. Revenues come from the management fees agreement with Site Authority and
dining services units, food service sales, and miscellaneous income.

CI UNIVERSITY AUXILIARY SERVICES, INC. MANAGEMENT’S DISCUSSION AND ANALYSIS (UNAUDITED)
FOR THE YEAR ENDED JUNE 30, 2018
6
Operating Revenues
Total revenues increased by $181K compared to prior year. The increase is a net of decreases and increases.
Management fees decreased $179K due to the termination of the Site Authority rental program. Food sales
increased $236K due to an increase in student head count, meal plans purchased increased $412K while catering
sales decreased $176K. Miscellaneous income increased $124K due to the transfer of the Bookstore and vending
operation from the Site Authority.
Operating Expenses
Total operating expenses increased by $176K compared to prior year. The increase is a net result, which includes
increases in debt service payment of $168K, fringe benefits of $230K, and transfer of book store operations of
$111K; and decreases of $88K in supplies and services and kitchen and linens, and $245K in lease payments to
the Campus. A square footage calculation was applied to the lease cost on the existing dining facility prior to
expansion. The following chart presents the distribution of resources in support of CI University Auxiliary
Services, Inc.’s mission for fiscal years 2018 and 2017:
$4,650,262
$2,322,958
$4,721,136
$2,095,901
$-
$500,000
$1,000,000
$1,500,000
$2,000,000
$2,500,000
$3,000,000
$3,500,000
$4,000,000
$4,500,000
$5,000,000
Salaries and Benefits Other Operating Expenses
Comparative Distribution of Resources for Fiscal Years Ended 2018 and 2017
(By Expense Category)
2018
2017
Expenses include categories such as salaries, and supplies and other services. In this discussion and analysis,
expenses are reported by functional program such as instruction, research, public service, academic support,
student services, institutional support, operation and maintenance of plant, student grants, and scholarships.
Nonoperating Revenues (Expenses)
Nonoperating revenues (expenses) come from sources that are not part of CI University Auxiliary Services, Inc.’s
primary business functions. Included in this classification are categories such as investment income, payroll
services, and transfers to Site Authority.
Payroll Service income decreased by $134K compared to prior year. The decrease is the result of a decrease in
Site Authority of California State University Channel Islands, Inc. employees.

CI UNIVERSITY AUXILIARY SERVICES, INC.
STATEMENT OF NET POSITION
JUNE 30, 2018
(WITH COMPARATIVE TOTALS FOR 2017)
See accompanying auditors’ report and notes to financial statements.
7
2018 2017
ASSETS
Current assets
Cash and cash equivalents 237,865$ 559,008$
Accounts receivable 4,718 1,249
Related party receivables 644,862 474,260
Prepaid expenses 66,557 45,299
Inventory 102,238 112,671
Total current assets 1,056,240 1,192,487
Noncurrent assets
Capital assets, net 262,418 246,291
Total noncurrent assets 262,418 246,291
Total assets 1,318,658 1,438,778
LIABILITIES
Current liabilities
Accounts payable and accrued liabilities 123,487 44,391
Accrued salaries and benefits 108,699 123,548
Accrued compensated absences 10,812 19,915
Deferred revenue 8,968 6,883
Related party payables 644,495 478,473
Loan payable, current portion 12,726 12,474
Total current liabilities 909,187 685,684
Noncurrent liabilities
Accrued compensated absences 106,966 197,026
Loan payable 200,589 213,316
Total noncurrent liabilities 307,555 410,342
Total liabilities 1,216,742 1,096,026
NET POSITION
Net investment in capital assets 49,103 20,501
Unrestricted 52,813 322,251
Total net position 101,916$ 342,752$
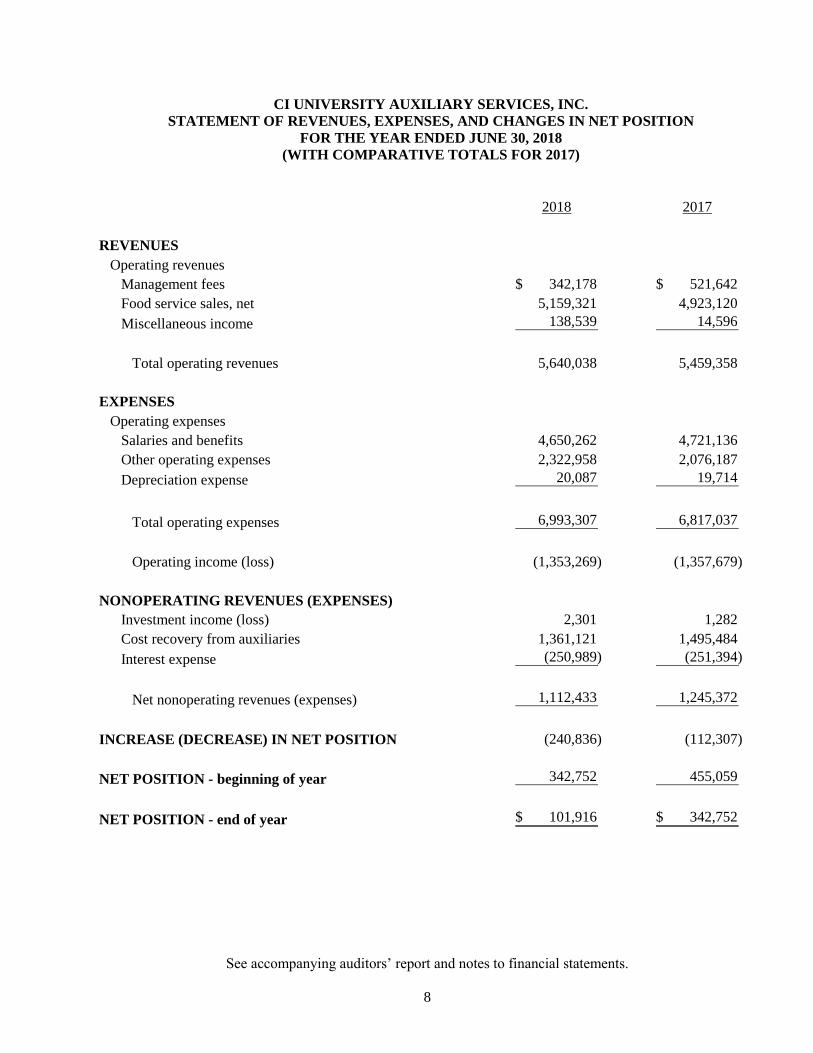
CI UNIVERSITY AUXILIARY SERVICES, INC.
STATEMENT OF REVENUES, EXPENSES, AND CHANGES IN NET POSITION
FOR THE YEAR ENDED JUNE 30, 2018
(WITH COMPARATIVE TOTALS FOR 2017)
See accompanying auditors’ report and notes to financial statements.
8
2018 2017
REVENUES
Operating revenues
Management fees 342,178$ 521,642$
Food service sales, net 5,159,321 4,923,120
Miscellaneous income 138,539 14,596
Total operating revenues 5,640,038 5,459,358
EXPENSES
Operating expenses
Salaries and benefits 4,650,262 4,721,136
Other operating expenses 2,322,958 2,076,187
Depreciation expense 20,087 19,714
Total operating expenses 6,993,307 6,817,037
Operating income (loss) (1,353,269) (1,357,679)
NONOPERATING REVENUES (EXPENSES)
Investment income (loss) 2,301 1,282
Cost recovery from auxiliaries 1,361,121 1,495,484
Interest expense (250,989) (251,394)
Net nonoperating revenues (expenses) 1,112,433 1,245,372
INCREASE (DECREASE) IN NET POSITION (240,836) (112,307)
NET POSITION - beginning of year 342,752 455,059
NET POSITION - end of year 101,916$ 342,752$

CI UNIVERSITY AUXILIARY SERVICES, INC.
STATEMENT OF CASH FLOWS
FOR THE YEAR ENDED JUNE 30, 2018
(WITH COMPARATIVE TOTALS FOR 2017)
See accompanying auditors’ report and notes to financial statements.
9
2018 2017
Cash flows from operating activities:
Management fees 342,178$ 521,642$
Commercial services 5,159,321 4,923,120
Payments to suppliers (2,252,117) (1,727,181)
Payments to employees (4,764,274) (4,707,544)
Other receipts (payments) 130,005 3,200
Net Cash Provided (Used) by Operating Activities (1,384,887) (986,763)
Cash flows from noncapital financing activities:
Reimbursements from related parties 1,361,121 1,495,484
Other receipts (payments) 2,301 13,511
Net Cash Provided (Used) by noncapital financing activities 1,363,422 1,508,995
Cash flows from capital and related financing activities:
Acquisition of capital assets (36,214) -
Principal paid on loan payable (12,475) (12,229)
Interest paid (250,989) (251,394)
Net Cash Provided (Used) by capital and related
financing activities (299,678) (263,623)
Net increase (decrease) in cash and cash equivalents (321,143) 258,609
Cash and cash equivalents at beginning of year 559,008 300,399
Cash and cash equivalents at end of year 237,865$ 559,008$
Reconciliation of net operating income (loss) to net cash
provided by (used by) operating activities
Operating income (loss) (1,353,269) (1,357,679)
Adjustments to reconcile net operating income (loss) to net cash
provided by (used by) operating activities:
Depreciation 20,087 19,714
(Increase) decrease in:
Accounts receivable (3,469) 833
Related party receivables (170,602) 120,428
Prepaid expenses (21,258) (45,299)
Inventory 10,433 10,193
Increase (decrease) in:
Accounts payable and accrued liabilities 79,096 (72,871)
Accrued salaries and benefits (14,849) (23,083)
Accrued compensated absences (99,163) 36,675
Deferred revenue 2,085 2,434
Loans payable - (12,229)
Related party payables 166,022 334,121
Net Cash Provided (Used) by Operating Activities (1,384,887)$ (986,763)$

CI UNIVERSITY AUXILIARY SERVICES, INC.
NOTES TO FINANCIAL STATEMENTS
FOR THE YEAR ENDED JUNE 30, 2018
10
1. SUMMARY OF OPERATIONS AND SIGNIFICANT ACCOUNTING POLICIES
Nature of Organization
University Auxiliary Services, Inc. was created on March 18, 2002, pursuant to the General Nonprofit
Corporation Law of the State of California and was organized to promote and assist education, administration
and related services of the California State University Channel Islands. CI University Auxiliary Services, Inc.
operates as an auxiliary organization of the California State University, Channel Islands (University) under an
operating agreement with the Trustees of the California State University (the Trustees), which extended
through June 30, 2017 and includes two automatic five-year extensions. On July 1, 2016 the corporation’s
change of name to CI University Auxiliary Services, Inc. was accepted by the California Secretary of State.
2. SUMMARY OF OPERATIONS AND SIGNIFICANT ACCOUNTING POLICIES
Basis of Accounting and Presentation
The accompanying financial statements have been prepared using the economic resources measurement focus
and the accrual basis of accounting in accordance with U.S. generally accepted accounting principles, as
prescribed by the Governmental Accounting Standards Board (GASB). Revenues are recorded when earned
and expenses are recorded when a liability is incurred, regardless of the timing of related cash flows.
Financial Reporting Entity
The financial statements include the accounts of CI University Auxiliary Services, Inc. CI University
Auxiliary Services, Inc. is a government organization under accounting principles generally accepted in the
United States of America and is also a component unit of the University, a public university under the
California State University system. CI University Auxiliary Services, Inc. has chosen to use the reporting
model for special-purpose governments engaged only in business type activities.
Net Position
CI University Auxiliary Services, Inc.’s net position is classified into the following net asset categories:
Net investment in capital assets – Capital assets, net of accumulated depreciation. CI University Auxiliary
Services, Inc. does not have any outstanding principal balances of debt attributable to the acquisition
construction, or improvement of those assets.
Unrestricted – All other categories of net position. In addition, unrestricted net position may be designated
for use by management of CI University Auxiliary Services, Inc. or have legislative or bond indenture
requirements associated with their use. These requirements limit the area of operations for which expenditures
of net position may be made and require that unrestricted net position be designated to support future
operations in these areas. CI University Auxiliary Services, Inc. has adopted a policy of utilizing temporarily
restricted funds, when available, prior to unrestricted funds.
Restricted – expendable – Net position subject to externally imposed conditions that can be fulfilled by the
actions of CI University Auxiliary Services, Inc. or by the passage of time.
CI UNIVERSITY AUXILIARY SERVICES, INC.
NOTES TO FINANCIAL STATEMENTS
FOR THE YEAR ENDED JUNE 30, 2018
11
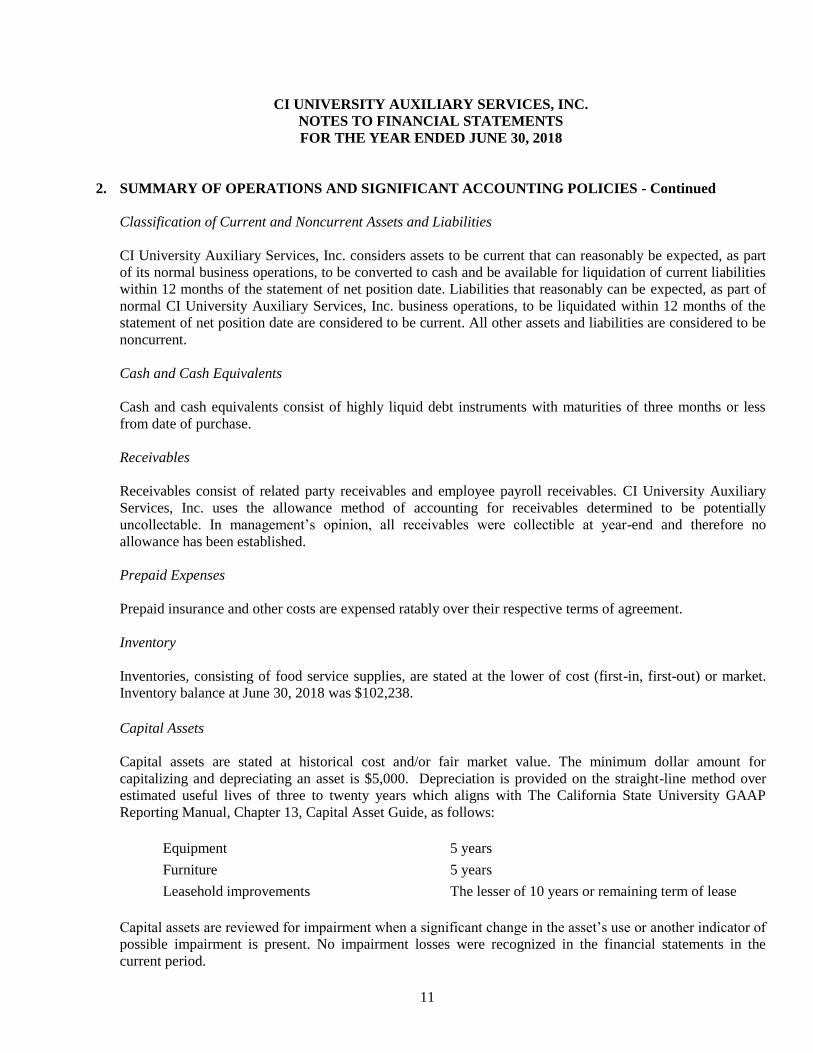
2. SUMMARY OF OPERATIONS AND SIGNIFICANT ACCOUNTING POLICIES - Continued
Classification of Current and Noncurrent Assets and Liabilities
CI University Auxiliary Services, Inc. considers assets to be current that can reasonably be expected, as part
of its normal business operations, to be converted to cash and be available for liquidation of current liabilities
within 12 months of the statement of net position date. Liabilities that reasonably can be expected, as part of
normal CI University Auxiliary Services, Inc. business operations, to be liquidated within 12 months of the
statement of net position date are considered to be current. All other assets and liabilities are considered to be
noncurrent.
Cash and Cash Equivalents
Cash and cash equivalents consist of highly liquid debt instruments with maturities of three months or less
from date of purchase.
Receivables
Receivables consist of related party receivables and employee payroll receivables. CI University Auxiliary
Services, Inc. uses the allowance method of accounting for receivables determined to be potentially
uncollectable. In management’s opinion, all receivables were collectible at year-end and therefore no
allowance has been established.
Prepaid Expenses
Prepaid insurance and other costs are expensed ratably over their respective terms of agreement.
Inventory
Inventories, consisting of food service supplies, are stated at the lower of cost (first-in, first-out) or market.
Inventory balance at June 30, 2018 was $102,238.
Capital Assets
Capital assets are stated at historical cost and/or fair market value. The minimum dollar amount for
capitalizing and depreciating an asset is $5,000. Depreciation is provided on the straight-line method over
estimated useful lives of three to twenty years which aligns with The California State University GAAP
Reporting Manual, Chapter 13, Capital Asset Guide, as follows:
Equipment 5 years
Furniture 5 years
Leasehold improvements The lesser of 10 years or remaining term of lease
Capital assets are reviewed for impairment when a significant change in the asset’s use or another indicator of
possible impairment is present. No impairment losses were recognized in the financial statements in the
current period.

CI UNIVERSITY AUXILIARY SERVICES, INC.
NOTES TO FINANCIAL STATEMENTS
FOR THE YEAR ENDED JUNE 30, 2018
12
2. SUMMARY OF OPERATIONS AND SIGNIFICANT ACCOUNTING POLICIES - Continued
Deferred Revenue
Deferred revenue represents revenues collected but not earned as of June 30, 2018. This is primarily
composed of revenue for meal plans accrued in advance of the semester. If a program is conducted over a
fiscal year end, deferred revenue is recorded for all revenue related to programs predominately conducted in
the next fiscal year.
Allocation of Costs
The costs of providing the various programs and other activities have been summarized on a functional basis
in the statement of revenues, expenses and changes in net position. Accordingly, certain costs have been
allocated among the programs and supporting services benefited.
Income Taxes
CI University Auxiliary Services, Inc. is exempt from Federal income taxes under Section 501(c)(3) of the
Internal Revenue Code and California income taxes under section 23701(d) of the California Revenue and
Taxation Code. The IRS classified the organization as one that is not a private foundation within the meaning
of section 509(a) of the Code because it is an organization described in section(s) 509(a)(1) and
170(b)(1)(A)(vi).
CI University Auxiliary Services, Inc. has evaluated its tax positions and the certainty as to whether those tax
positions will be sustained in the event of an audit by taxing authorities at the federal and state levels. The
primary tax positions evaluated are related to CI University Auxiliary Services, Inc.’s continued qualification
as a tax-exempt organization and whether there is unrelated business income activities conducted that would
be taxable. Management has determined that all income tax positions will more likely than not be sustained
upon potential audit or examination; therefore, no disclosures of uncertain income tax positions are required.
CI University Auxiliary Services, Inc.’s Forms 990, Return of Organization Exempt from Income Tax, for
each of the tax years ended June 30, 2017, 2016, 2015, are subject to examination by the IRS, generally for 3
years after they were filed.
Estimates
The preparation of these financial statements requires management to make estimates and assumptions.
Those estimates and assumptions affect the reported amounts of assets, liabilities, revenues and expenses, as
well as the disclosure of contingent assets and liabilities. Actual results could differ from those estimates.
Management also determines the accounting principles to be used in the preparation of the financial
statements.
CI UNIVERSITY AUXILIARY SERVICES, INC.
NOTES TO FINANCIAL STATEMENTS
FOR THE YEAR ENDED JUNE 30, 2018
13
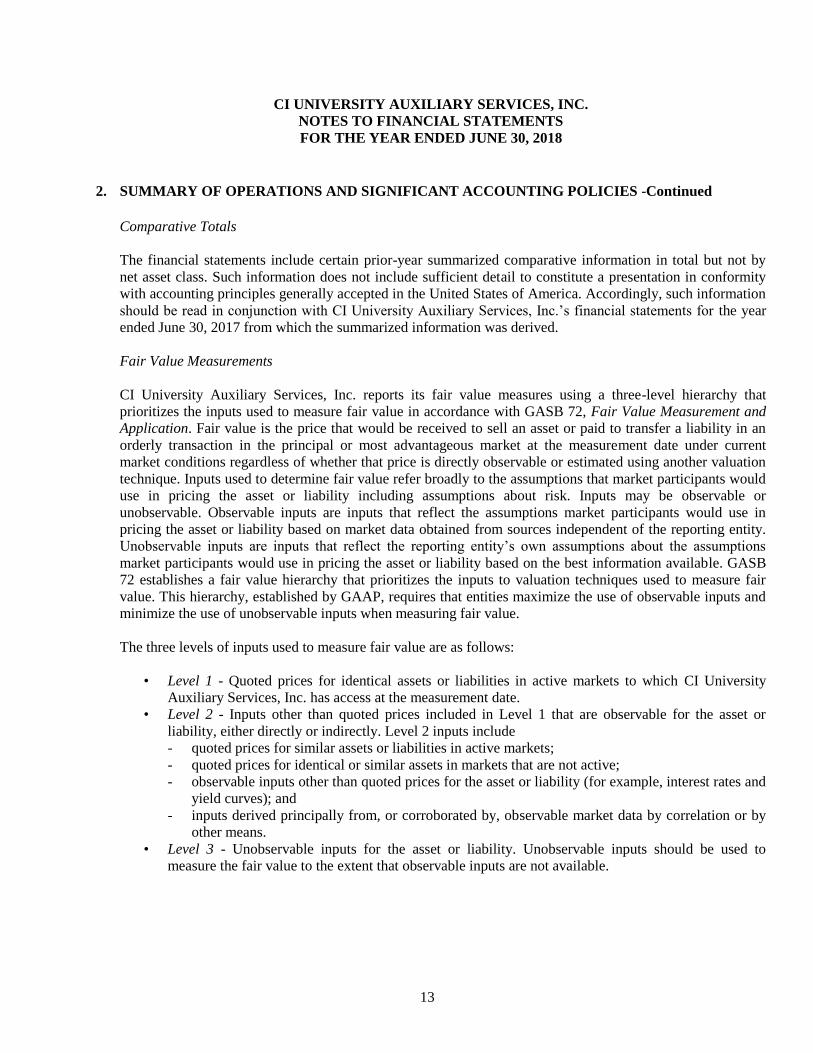
2. SUMMARY OF OPERATIONS AND SIGNIFICANT ACCOUNTING POLICIES -Continued
Comparative Totals
The financial statements include certain prior-year summarized comparative information in total but not by
net asset class. Such information does not include sufficient detail to constitute a presentation in conformity
with accounting principles generally accepted in the United States of America. Accordingly, such information
should be read in conjunction with CI University Auxiliary Services, Inc.’s financial statements for the year
ended June 30, 2017 from which the summarized information was derived.
Fair Value Measurements
CI University Auxiliary Services, Inc. reports its fair value measures using a three-level hierarchy that
prioritizes the inputs used to measure fair value in accordance with GASB 72, Fair Value Measurement and
Application. Fair value is the price that would be received to sell an asset or paid to transfer a liability in an
orderly transaction in the principal or most advantageous market at the measurement date under current
market conditions regardless of whether that price is directly observable or estimated using another valuation
technique. Inputs used to determine fair value refer broadly to the assumptions that market participants would
use in pricing the asset or liability including assumptions about risk. Inputs may be observable or
unobservable. Observable inputs are inputs that reflect the assumptions market participants would use in
pricing the asset or liability based on market data obtained from sources independent of the reporting entity.
Unobservable inputs are inputs that reflect the reporting entity’s own assumptions about the assumptions
market participants would use in pricing the asset or liability based on the best information available. GASB
72 establishes a fair value hierarchy that prioritizes the inputs to valuation techniques used to measure fair
value. This hierarchy, established by GAAP, requires that entities maximize the use of observable inputs and
minimize the use of unobservable inputs when measuring fair value.
The three levels of inputs used to measure fair value are as follows:
• Level 1 - Quoted prices for identical assets or liabilities in active markets to which CI University
Auxiliary Services, Inc. has access at the measurement date.
• Level 2 - Inputs other than quoted prices included in Level 1 that are observable for the asset or
liability, either directly or indirectly. Level 2 inputs include
- quoted prices for similar assets or liabilities in active markets;
- quoted prices for identical or similar assets in markets that are not active;
- observable inputs other than quoted prices for the asset or liability (for example, interest rates and
yield curves); and
- inputs derived principally from, or corroborated by, observable market data by correlation or by
other means.
• Level 3 - Unobservable inputs for the asset or liability. Unobservable inputs should be used to
measure the fair value to the extent that observable inputs are not available.

CI UNIVERSITY AUXILIARY SERVICES, INC.
NOTES TO FINANCIAL STATEMENTS
FOR THE YEAR ENDED JUNE 30, 2018
14
2. SUMMARY OF OPERATIONS AND SIGNIFICANT ACCOUNTING POLICIES -Continued
The carrying amounts of cash and cash equivalents, and accounts receivable approximate fair value because
of the terms and relatively short maturity of these financial instruments.
The carrying amounts of liabilities, approximate fair value because of the relatively short maturity of these
financial instruments.
When available, CI University Auxiliary Services, Inc. measures fair value using Level 1 inputs because they
generally provide the most reliable evidence of fair value.
3. CASH AND CASH EQUIVALENTS
CI University Auxiliary Services, Inc.’s cash and cash equivalents as of June 30, 2018 are classified in the
accompanying statement of net position as follows:
Total
Cash and cash equivalents $ 237,865
Restricted cash and cash equivalents -
Total cash and cash equivalents $ 237,865
(a) Cash and Cash Equivalents
At June 30, 2018, cash and cash equivalents consisted of demand deposits maintained at the bank. Total
cash and cash equivalents of $237,865 had a corresponding carrying value balance with the bank
$351,945 at June 30, 2018. The difference is related to outstanding checks and deposits in transit.
Custodial Credit Risk for Deposits
Custodial credit risk for deposits is the risk that CI University Auxiliary Services, Inc. will not be able to
recover deposits or will not be able to recover collateral securities that are in possession of an outside party.
The California Government Code and Education Code do not contain legal or policy requirements that would
limit the exposure to custodial credit risk for deposits, other than the provision that a financial institution must
secure deposits made by state or local governmental units by pledging securities in an undivided collateral
pool held by a depository regulated under state law. This risk is mitigated in that CI University Auxiliary
Services, Inc.’s deposits are maintained at financial institutions that are fully insured or collateralized as
required by state law.

CI UNIVERSITY AUXILIARY SERVICES, INC.
NOTES TO FINANCIAL STATEMENTS
FOR THE YEAR ENDED JUNE 30, 2018
15
(CONTINUED)
4. RELATED PARTY TRANSACTIONS
CI University Auxiliary Services, Inc. has entered into certain transactions with the Campus and recognized
auxiliary organizations of the Campus relating to commercial food services and payroll services
reimbursement. The accompanying financial statements include all such transactions for the year ended June
30, 2018:
Related party receivables consist of the following:
Related party payables consist of the following:
June 30, 2018
Associated Students of CSU Channel Islands, Inc. $ 2,441
CSU Channel Islands 636,592
CSU Channel Islands Site Authority 5,462
Total $ 644,495
As part of the revenue bonds issued to the California State University, Channel Islands (CSUCI) on
September 9, 2015 for construction of Student Housing phase III and the dining commons expansion, CI
University Auxiliary Services, amended their operating agreement with CSUCI to reflect an increase in
annual lease payments. This increase includes the original lease payment to use the campus building and the
additional payment to cover the portion of the revenue bonds issued to CSUCI that are attributed to the dining
expansion. The total amount of the bond is $10,405,000 and reimbursement will be reflected for the term of
the operating lease.
The operating agreement extends through June 30, 2022. Below are the annual minimum reimbursement
payments required:
Year Ended June 30, Amount
2019 $ 659,875
2020 662,725
2021 661,200
2022 659,175
Total $ 2,642,975
June 30, 2018
Associated Students of CSU Channel Islands, Inc. $ 161,223
CSU Channel Islands
CSU Channel Islands Foundation
CSU Channel Islands Site Authority
301,551
3,431
178,657
Total $ 644,862

CI UNIVERSITY AUXILIARY SERVICES, INC.
NOTES TO FINANCIAL STATEMENTS
FOR THE YEAR ENDED JUNE 30, 2018
16
(CONTINUED)
5. CAPITAL ASSETS
Capital assets for the year ended June 30, 2018 consists of the following:
Beginning of End of Year
Year 7/1/17 Additions Deletions 6/30/18
Equipment $ 62,424 $ 6,032 $ - $ 68,456
Accumulated depreciation (41,924) (6,104) - (48,028)
20,500 (72) - 20,428
Leasehold improvements 278,000 30,182 - 308,182
Accumulated depreciation (52,209) (13,983) - (66,192)
225,791 16,199 - 241,990
Net Capital Assets $ 246,291 $ 16,127 $ - $ 262,418
Total depreciation expense for the year ended June 30, 2018 was $20,087.
6. LONG-TERM LIABILITIES
Long term liability activities for the year ended at June 30, 2018 consisted of the following:
Beginning Ending
Balance as of Balance as of Current
July 1, 2017 Additions Reductions June 30, 2018 Portion
Long-term liabilities: Accrued compensated
absences
$ 216,941 $ 24,856 $ (124,019) $ 117,778 $ 10,812
Long-term debt obligations:
Leasehold improvement
loan
225,790 - (12,475) 213,315 12,726
Total long-term liabilities $ 442,731 $ 24,856 $ (136,494) $ 331,093 $ 23,538

CI UNIVERSITY AUXILIARY SERVICES, INC.
NOTES TO FINANCIAL STATEMENTS
FOR THE YEAR ENDED JUNE 30, 2018
17
6. LONG-TERM LIABILITIES – Continued
In March 2013 CI University Auxiliary Services, Inc. entered into a promissory note with Associated
Students, Inc. for approximately half of the construction of Pizza 3.14 in the Town Center. The loan amount
of $278,000 bears interest at 2% with full payment to be completed by January 2033. The loan calls for
monthly payments of $1,406. The loan payable balance owed at June 30, 2018 was $213,315. The related
party loan payable is stated at fair value for purposes of the report.
Maturity for the leasehold improvements loan payable is as follows:
Year Ended June 30, Amount
2019 $ 12,726
2020 12,983
2021 13,245
2022 13,512
2023 13,785
Thereafter 147,064
$ 213,315
Total interest expense paid on loan payable during the year ended June 30, 2018 was $4,402.
7. RETIREMENT PLAN
CI University Auxiliary Services, Inc. sponsors a 403(b) salary deferral plan whereby employees may
contribute up to an amount as allowed under Internal Revenue Service regulations. The Plan covers all
salaried, full-time, and benefitted employees beginning on the date of hire. CI University Auxiliary Services,
Inc. provides 10% of an employee’s eligible compensation to the 403(b) plan. Total contribution expense for
the year ended June 30, 2018 was $123,801.

CI UNIVERSITY AUXILIARY SERVICES, INC.
NOTES TO FINANCIAL STATEMENTS
FOR THE YEAR ENDED JUNE 30, 2018
18
(CONTINUED)
8. TRANSACTIONS WITH RELATED PARTIES
As discussed in Note 1, CI University Auxiliary Services, Inc. operates under an agreement with the Trustees
as an auxiliary organization of the University. Accordingly, essentially all revenues, and realization of certain
assets, are dependent upon the continuation of this agreement.
The accompanying financial statements also include the following transactions with the Associated Students,
Inc., Foundation, and Site Authority as of and for the year ended June 30, 2018:
Payments to University for salaries of University personnel working on
contracts, grants, and other programs
$ -
Payments to Associated Students, Inc. for other than salaries of Associated
Students, Inc. personnel
45,528
Payments to University for other than salaries of University personnel 1,188,685
Payments to Foundation for other than salaries of Foundation personnel -
Payments to Site Authority for other than salaries of Site Authority personnel 428,481
Payments received from Associated Students, Inc. for services, space,
and program
995,322
Payments received from University for services, space, and program 845,586
Payments received from Foundation for services, space, and program 51,887
Payments received from Site Authority for services, space, and program 726,750
Accounts receivable from Associated Students, Inc. 161,223
Accounts receivable from University
Accounts receivable from Foundation
301,551
3,431
Accounts receivable from Site Authority 178,657
Accounts payable to Associated Students, Inc. 2,441
Accounts payable to University 636,592
Accounts payable to Site Authority 5,462

CI UNIVERSITY AUXILIARY SERVICES, INC.
NOTES TO FINANCIAL STATEMENTS
FOR THE YEAR ENDED JUNE 30, 2018
19
(CONTINUED)
9. CLASSIFICATION OF OPERATING EXPENSES
CI University Auxiliary Services, Inc. has elected not to report operating expenses by functional classification
in the statements of revenues, expenses, and changes in net position, but to provide the natural classification
of those expenses as an additional disclosure. For the year ended June 30, 2018, operating expenses by natural
classification consisted of the following:
Salaries Benefits Fellowships Supplies & Services Depreciation Total
Functional Classification:
Instruction $ - $ - $ - $ - $ - $ -
Public service 2,215,817 787,731 - 2,058,639 - 5,062,187
Academic support - - - - - -
Student services - - - - - -
Institutional support 1,193,971 452,743 - 177,463 - 1,824,177
Operation and maintenance of plant
- - - 86,856
-
86,856
Student grants and
scholarships
-
-
-
-
-
- Depreciation and
amortization - - - -
20,087
20,087
Total $ 3,409,788 $ 1,240,474 $ - $ 2,322,958 $ 20,087 $ 6,993,307
10. SUBSEQUENT EVENTS
CI University Auxiliary Services, Inc. has evaluated events subsequent to June 30, 2018, to assess the need
for potential recognition or disclosure in the financial statements. Such events were evaluated through
September 13, 2018, the date the financial statements were available to be issued. Events occurring after that
date have not been evaluated to determine whether a change in the financial statements would be required.
Based upon this evaluation, it was determined that no subsequent events occurred that require recognition or
additional disclosure in the financial statements.

SUPPLEMENTARY INFORMATION

CI UNIVERSITY AUXILIARY SERVICES, INC. GASB SCHEDULE OF NET POSITION
JUNE 30, 2018
20
Assets:
Current assets:Cash and cash equivalents $ 237,865 Short-term investments — Accounts receivable, net 649,580 Capital lease receivable, current portion — Notes receivable, current portion — Pledges receivable, net — Prepaid expenses and other current assets 168,795
Total current assets 1,056,240
Noncurrent assets:Restricted cash and cash equivalents — Accounts receivable, net — Capital lease receivable, net of current portion — Notes receivable, net of current portion — Student loans receivable, net — Pledges receivable, net — Endowment investments — Other long-term investments — Capital assets, net 262,418 Other assets —
Total noncurrent assets 262,418
Total assets 1,318,658
Deferred outflows of resources:Unamortized loss on debt refunding — Net pension liability — Net OPEB liability — Others —
Total deferred outflows of resources —
Liabilities:
Current liabilities:Accounts payable 123,487 Accrued salaries and benefits 108,699 Accrued compensated absences, current portion 10,812 Unearned revenues 8,968 Capital lease obligations, current portion — Long-term debt obligations, current portion 12,726 Claims liability for losses and loss adjustment expenses, current portion — Depository accounts — Other liabilities 644,495
Total current liabilities 909,187
Noncurrent liabilities:Accrued compensated absences, net of current portion 106,966 Unearned revenues — Grants refundable — Capital lease obligations, net of current portion — Long-term debt obligations, net of current portion 200,589 Claims liability for losses and loss adjustment expenses, net of current portion — Depository accounts — Net other postemployment benefits liabilityNet pension liability — Other liabilities —
Total noncurrent liabilities 307,555
Total liabilities 1,216,742
Deferred inflows of resources:Service concession arrangements — Net pension liability — Net OPEB liability — Unamortized gain on debt refunding — Nonexchange transactions — Others —
Total deferred inflows of resources —
Net Position:Net investment in capital assets 49,103 Restricted for: —
Nonexpendable – endowments — Expendable: —
Scholarships and fellowships — Research — Loans — Capital projects — Debt service — Others —
Unrestricted 52,813
Total net position $ 101,916

CI UNIVERSITY AUXILIARY SERVICES, INC. GASB SCHEDULE OF REVENUES, EXPENSES AND CHANGES IN NET POSITION
FOR THE YEAR ENDED JUNE 30, 2018
21
Revenues:
Operating revenues:Student tuition and fees, gross $ —
Scholarship allowances (enter as negative) — Grants and contracts, noncapital:
Federal — State — Local — Nongovernmental —
Sales and services of educational activities — Sales and services of auxiliary enterprises, gross —
Scholarship allowances (enter as negative) — Other operating revenues 5,640,038
Total operating revenues 5,640,038
Expenses:
Operating expenses:Instruction — Research — Public service 5,062,187 Academic support — Student services — Institutional support 1,824,177 Operation and maintenance of plant 86,856 Student grants and scholarships — Auxiliary enterprise expenses — Depreciation and amortization 20,087
Total operating expenses 6,993,307
Operating income (loss) (1,353,269)
Nonoperating revenues (expenses):State appropriations, noncapital — Federal financial aid grants, noncapital — State financial aid grants, noncapital — Local financial aid grants, noncapital — Nongovernmental and other financial aid grants, noncapital — Other federal nonoperating grants, noncapital — Gifts, noncapital — Investment income (loss), net 2,301 Endowment income (loss), net — Interest expense (250,989) Other nonoperating revenues (expenses) - excl. interagency transfers 1,361,121 Other nonoperating revenues (expenses) - interagency transfers —
Net nonoperating revenues (expenses) 1,112,433
Income (loss) before other revenues (expenses) (240,836)
State appropriations, capital — Grants and gifts, capital — Additions (reductions) to permanent endowments —
Increase (decrease) in net position (240,836)
Net position:Net position at beginning of year, as previously reported 342,752 Restatements
Net position at beginning of year, as restated 342,752
Net position at end of year $ 101,916

CI UNIVERSITY AUXILIARY SERVICES, INC.
OTHER INFORMATION
FOR THE YEAR ENDED JUNE 30, 2018
22
1 Restricted cash and cash equivalents at June 30, 2018:
Portion of restricted cash and cash equivalents related to endowments $ — All other restricted cash and cash equivalents —
Total restricted cash and cash equivalents $ —

CI UNIVERSITY AUXILIARY SERVICES, INC.
OTHER INFORMATION
FOR THE YEAR ENDED JUNE 30, 2018
23
(CONTINUED) 2.1 Composition of investments at June 30, 2018:
Current
Unrestricted Current Restricted Total Current
Noncurrent
Unrestricted
Noncurrent
Restricted Total Noncurrent Total
State of California Surplus Money Investment Fund (SMIF) $ — — — — — — — State of California Local Agency Investment Fund (LAIF) — — — — — — — Corporate bonds — — — — — — — Certificates of deposit — — — — — — — Mutual funds — — — — — — — Money Market funds — — — — — — — Repurchase agreements — — — — — — — Commercial paper — — — — — — — Asset backed securities — — — — — — — Mortgage backed securities — — — — — — — Municipal bonds — — — — — — — U.S. agency securities — — — — — — — U.S. treasury securities — — — — — — — Equity securities — — — — — — — Exchange traded funds (ETFs) — — — — — — — Alternative investments:
Private equity (including limited partnerships) — — — — — — — Hedge funds — — — — — — — Managed futures — — — — — — — Real estate investments (including REITs) — — — — — — — Commodities — — — — — — — Derivatives — — — — — — — Other alternative investment types — — — — — — —
Other external investment pools (excluding SWIFT) Add description — — — — — — — Add description — — — — — — — Add description — — — — — — — Add description — — — — — — — Add description — — — — — — — Add description — — — — — — — Other major investments: Add description — — — — — — — Add description — — — — — — — Add description — — — — — — — Add description — — — — — — — Add description — — — — — — — Add description — — — — — — —
Total investments — — — — — — —
Less endowment investments (enter as negative number) — — — —
Total investments — — — — — — —

CI UNIVERSITY AUXILIARY SERVICES, INC.
OTHER INFORMATION
FOR THE YEAR ENDED JUNE 30, 2018
(CONTINUED)
24
2.2 Investments held by the University under contractual agreements at June 30, 2018:
Portion of investments in note 2.1 held by the University under contractualagreements at June 30, 2018 : — — — — — — —
2.3 Restricted current investments at June 30, 2018 related to: Amount Add description $ — Add description — Add description — Add description — Add description — Add description — Add description —
Total restricted current investments at June 30, 2018 $ —
2.4 Restricted noncurrent investments at June 30, 2018 related to: AmountEndowment investment $ — Scholarships — Inflation reserves — University projects — Add description — Add description — Add description — Add description —
Total restricted noncurrent investments at June 30, 2018 $ —

CI UNIVERSITY AUXILIARY SERVICES, INC.
OTHER INFORMATION
FOR THE YEAR ENDED JUNE 30, 2018
(CONTINUED)
25
2.5 Fair value hierarchy in investments at June 30, 2018:
Total
Quoted Prices in
Active Markets for
Identical Assets
(Level 1)
Significant Other
Observable
Inputs (Level 2)
Significant
Unobservable
Inputs
(Level 3)
Net Asset Value
(NAV)
State of California Surplus Money Investment Fund (SMIF) $ — — — — — State of California Local Agency Investment Fund (LAIF) — — — — — Corporate bonds — — — — — Certificates of deposit — — — — — Mutual funds — — — — — Money Market funds — — — — — Repurchase agreements — — — — — Commercial paper — — — — — Asset backed securities — — — — — Mortgage backed securities — — — — — Municipal bonds — — — — — U.S. agency securities — — — — — U.S. treasury securities — — — — — Equity securities — — — — — Exchange traded funds (ETFs) — — — — — Alternative investments:
Private equity (including limited partnerships) — — — — — Hedge funds — — — — — Managed futures — — — — — Real estate investments (including REITs) — — — — — Commodities — — — — — Derivatives — — — — — Other alternative investment types — — — — —
Other external investment pools (excluding SWIFT) Add description — — — — — Add description — — — — — Add description — — — — — Add description — — — — — Add description — — — — — Add description — — — — — Other major investments: Add description — — — — — Add description — — — — — Add description — — — — — Add description — — — — — Add description — — — — — Add description — — — — —
Total investments — — — — —
Fair Value Measurements Using

CI UNIVERSITY AUXILIARY SERVICES, INC.
OTHER INFORMATION
FOR THE YEAR ENDED JUNE 30, 2018
(CONTINUED)
26
3.1 Composition of capital assets at June 30, 2018: Balance Transfers of
Balance Prior period June 30, 2017 Completed BalanceJune 30, 2017 Adjustments Reclassifications (restated) Additions Reductions CWIP June 30, 2018
Nondepreciable/nonamortizable capital assets:Land and land improvements $ — — — — — — — — Works of art and historical treasures — — — — — — — — Construction work in progress (CWIP) — — — — — — — — Intangible assets:
Rights and easements — — — — — — — — Patents, copyrights and trademarks — — — — — — — — Internally generated intangible assets in progress — — — — — — — — Licenses and permits — — — — — — — — Other intangible assets:
— — — — — — — — — — — — — — — — — — — — — — — — — — — — — — — — — — — — — — — —
Total intangible assets — — — — — — — —
Total nondepreciable/nonamortizable capital assets — — — — — — — —
Depreciable/amortizable capital assets:Buildings and building improvements — — — — — — — — Improvements, other than buildings — — — — — — — — Infrastructure — — — — — — — — Leasehold improvements 278,000 — — 278,000 30,182 — — 308,182 Personal property:
Equipment 62,424 — — 62,424 6,032 — — 68,456 Library books and materials — — — — — — — —
Intangible assets:Software and websites — — — — — — — — Rights and easements — — — — — — — — Patents, copyright and trademarks — — — — — — — — Licenses and permits — — — — — — — — Other intangible assets:
— — — — — — — — — — — — — — — — — — — — — — — — — — — — — — — — — — — — — — — —
Total intangible assets — — — — — — — —
Total depreciable/amortizable capital assets 340,424 — — 340,424 36,214 — — 376,638
Total capital assets 340,424 — — 340,424 36,214 — — 376,638
Less accumulated depreciation/amortization:Buildings and building improvements — — — — — — — — Improvements, other than buildings — — — — — — — — Infrastructure — — — — — — — — Leasehold improvements (52,209) — — (52,209) (13,983) — — (66,192) Personal property:
Equipment (41,924) — — (41,924) (6,104) — — (48,028) Library books and materials — — — — — — — —
Intangible assets:Software and websites — — — — — — — — Rights and easements — — — — — — — — Patents, copyright and trademarks — — — — — — — — Licenses and permits — — — — — — — — Other intangible assets:
— — — — — — — — — — — — — — — — — — — — — — — — — — — — — — — — — — — — — — — —
Total intangible assets — — — — — — — —
Total accumulated depreciation/amortization (94,133) — — (94,133) (20,087) — — (114,220)
Total capital assets, net $ 246,291 — — 246,291 16,127 — — 262,418
3.2 Detail of depreciation and amortization expense for the year ended June 30, 2018:
Depreciation and amortization expense related to capital assets $ 20,087 Amortization expense related to other assets —
Total depreciation and amortization $ 20,087
Add descriptionAdd description
Add description
Add descriptionAdd descriptionAdd description
Add description
Add description
Add descriptionAdd description
Add description
Add description
Add descriptionAdd description
Add description

CI UNIVERSITY AUXILIARY SERVICES, INC.
OTHER INFORMATION
FOR THE YEAR ENDED JUNE 30, 2018
(CONTINUED)
27
4 Long-term liabilities activity schedule:
BalanceBalance Prior period June 30, 2017 Balance Current Long-term
June 30, 2017 adjustments Reclassifications (restated) Additions Reductions June 30, 2018 portion portion
$ 216,941 — — 216,941 24,856 (124,019) 117,778 10,812 106,966
— — — — — — — — —
Capital lease obligations:Gross balance — — — — — — — — — Unamortized premium / (discount) on capital lease obligations — — — — — — — — —
Total capitalized lease obligations — — — — — — — — —
Long-term debt obligations:Auxiliary revenue bonds — — — — — — — — — Commercial paper — — — — — — — — — Notes payable related to SRB — — — — — — — — — Others: (list by type)Loan payable to ASI for leasehold improvements 225,790 — — 225,790 — (12,475) 213,315 12,726 200,589 Add description — — — — — — — — — Add description — — — — — — — — — Add description — — — — — — — — — Add description — — — — — — — — — Add description — — — — — — — — —
Total long-term debt obligations 225,790 — — 225,790 — (12,475) 213,315 12,726 200,589
Unamortized bond premium / (discount) — — — — — — — — —
Total long-term debt obligations, net 225,790 — — 225,790 — (12,475) 213,315 12,726 200,589
Total long-term liabilities $ 442,731 — — 442,731 24,856 (136,494) 331,093 23,538 307,555
Accrued compensated absences
Claims liability for losses and loss adjustment expenses

CI UNIVERSITY AUXILIARY SERVICES, INC.
OTHER INFORMATION
FOR THE YEAR ENDED JUNE 30, 2018
(CONTINUED)
28
5 Future minimum lease payments - Capital lease obligations:
Principal and Principal and Principal andPrincipal Only Interest Only Interest Principal Only Interest Only Interest Principal Only Interest Only Interest
Year ending June 30:2019 — — — — — — — — — 2020 — — — — — — — — — 2021 — — — — — — — — — 2022 — — — — — — — — — 2023 — — — — — — — — — 2024 - 2028 — — — — — — — — — 2029 - 2033 — — — — — — — — — 2034 - 2038 — — — — — — — — — 2039 - 2043 — — — — — — — — — 2044 - 2048 — — — — — — — — — 2049 - 2053 — — — — — — — — — 2054 - 2058 — — — — — — — — — 2059 - 2063 — — — — — — — — — 2064 - thereafter — — — — — — — — —
Total minimum lease payments — — — — — — — — —
Less amounts representing interest —
Present value of future minimum lease payments —
Unamortized net premium (discount) —
Total capital lease obligations —
Less: current portion —
Capital lease obligation, net of current portion $ —
All other capital lease obligations Total capital lease obligationsCapital lease obligations related to SRB

CI UNIVERSITY AUXILIARY SERVICES, INC.
OTHER INFORMATION
FOR THE YEAR ENDED JUNE 30, 2018
(CONTINUED)
29
6
Principal and Principal and Principal and
Principal Only Interest Only Interest Principal Only Interest Only Interest Principal Only Interest Only Interest
2019 $ — — — 12,726 4,150 16,876 12,726 4,150 16,876 2020 — — — 12,983 3,893 16,876 12,983 3,893 16,876 2021 — — — 13,245 3,631 16,876 13,245 3,631 16,876 2022 — — — 13,512 3,364 16,876 13,512 3,364 16,876 2023 — — — 13,785 3,091 16,876 13,785 3,091 16,876 2024 - 2028 — — — 147,064 14,666 161,730 147,064 14,666 161,730 2029 - 2033 — — — — — — — — — 2034 - 2038 — — — — — — — — — 2039 - 2043 — — — — — — — — — 2044 - 2048 — — — — — — — — — 2049 - 2053 — — — — — — — — — 2054 - 2058 — — — — — — — — — 2059 - 2063 — — — — — — — — — 2064 - thereafter — — — — — — — — —
Total minimum payments — — — 213,315 32,795 246,110 213,315 32,795 246,110
Less amounts representing interest (32,795)
Present value of future minimum payments 213,315
Unamortized net premium (discount) —
Total long-term debt obligations 213,315
Less: current portion (12,726)
Long-term debt obligations, net of current portion $ 200,589
Year ending June 30:
All other long-term
debt obligations Total long-term debt obligations
Long-term debt obligations schedule
Auxiliary revenue bonds

CI UNIVERSITY AUXILIARY SERVICES, INC.
OTHER INFORMATION
FOR THE YEAR ENDED JUNE 30, 2018
(CONTINUED)
30
7 Calculation of net position
7.1 Calculation of net position - Net investment in capital assets
Capital assets, net of accumulated depreciation $ 262,418 Capital lease obligations, current portion — Capital lease obligations, net of current portion — Long-term debt obligations, current portion (12,726) Long-term debt obligations, net of current portion (200,589) Portion of outstanding debt that is unspent at year-end (enter as positive number) — Other adjustments: (please list) Add description — Add description — Add description — Add description — Add description —
Net position - Net investment in capital assets $ 49,103
7.2 Calculation of net position - Restricted for nonexpendable - endowments
Portion of restricted cash and cash equivalents related to endowments $ —
Endowment investments —
Other adjustments: (please list)
Add descriptionRestricted expendable endowments —
Add description —
Add description —
Add description —
Add description —
Add description —
Add description —
Add description —
Add description —
Add description —
Net position - Restricted for nonexpendable - endowments $ —

CI UNIVERSITY AUXILIARY SERVICES, INC.
OTHER INFORMATION
FOR THE YEAR ENDED JUNE 30, 2018
(CONTINUED)
31
8 Transactions with related entitiesAmount
Payments to University for salaries of University personnel working on contracts, grants, and other programs $ — Payments to University for other than salaries of University personnel 1,188,685 Payments received from University for services, space, and programs 845,586 Gifts-in-kind to the University from discretely presented component units — Gifts (cash or assets) to the University from discretely presented component units — Accounts (payable to) University (enter as negative number) (636,592) Other amounts (payable to) University (enter as negative number) — Accounts receivable from University (enter as positive number) 301,551 Other amounts receivable from University —

CI UNIVERSITY AUXILIARY SERVICES, INC.
OTHER INFORMATION
FOR THE YEAR ENDED JUNE 30, 2018
(CONTINUED)
32
9 Other postemployment benefits (OPEB) liability
Intentionally left blank - not required/applicable eff FY 17/18

CI UNIVERSITY AUXILIARY SERVICES, INC.
OTHER INFORMATION
FOR THE YEAR ENDED JUNE 30, 2018
(CONTINUED)
33
10 Pollution remediation liabilities under GASB Statement No. 49:
Description Amount Add description $ — Add description — Add description — Add description — Add description — Add description — Add description — Add description — Add description — Add description —
Total pollution remediation liabilities $ —
Less: current portion —
Pollution remedition liabilities, net of current portion —

CI UNIVERSITY AUXILIARY SERVICES, INC.
OTHER INFORMATION
FOR THE YEAR ENDED JUNE 30, 2018
(CONTINUED)
34
11 The nature and amount of the prior period adjustment(s) recorded to beginning net position
Net Position Class Amount
Dr. (Cr.)
Net position as of June 30, 2017, as previously reported $ 342,752 Prior period adjustments:
1 (list description of each adjustment) — 2 (list description of each adjustment) — 3 (list description of each adjustment) — 4 (list description of each adjustment) — 5 (list description of each adjustment) — 6 (list description of each adjustment) — 7 (list description of each adjustment) — 8 (list description of each adjustment) — 9 (list description of each adjustment) —
10 (list description of each adjustment) —
Net position as of June 30, 2017, as restated $ 342,752
Provide a detailed breakdown of the journal entries (at the financial statement line item level) booked to record each prior period adjustment:
Debit Credit
Net position class:______________________1 (breakdown of adjusting journal entry)
$ — —
Net position class:______________________2 (breakdown of adjusting journal entry)
— —
Net position class:______________________3 (breakdown of adjusting journal entry)
— —
Net position class:______________________4 (breakdown of adjusting journal entry)
— —
Net position class:______________________5 (breakdown of adjusting journal entry)
— —
Net position class:______________________6 (breakdown of adjusting journal entry)
— —
Net position class:______________________7 (breakdown of adjusting journal entry)
— —
Net position class:______________________8 (breakdown of adjusting journal entry)
— —
Net position class:______________________9 (breakdown of adjusting journal entry)
— —
Net position class:______________________10 (breakdown of adjusting journal entry)
— —

CI UNIVERSITY AUXILIARY SERVICES, INC.
OTHER INFORMATION
FOR THE YEAR ENDED JUNE 30, 2018
(CONTINUED)
35
12 Natural Classifications of Operating Expenses
Salaries Benefits
Scholarships and
fellowships
Supplies and other
services
Depreciation and
amortization
Total operating
expenses
Instruction — — — — — — Research — — — — — — Public service 2,215,817 787,731 — 2,058,639 — 5,062,187
Academic support — — — — — —
Student services — — — — — —
Institutional support 1,193,971 452,743 — 177,463 — 1,824,177
Operation and maintenance of plant — — — 86,856 — 86,856
Student grants and scholarships — — — — — —
Auxiliary enterprise expenses — — — — — —
Depreciation and amortization — — — — 20,087 20,087
Total 3,409,788 1,240,474 — 2,322,958 20,087 6,993,307