cibc royalties conference - coeur mining · 2019-01-09 · cibc royalties conference mark d....
TRANSCRIPT
CIBC Royalties Conference
Mark D. Kucher, Managing Director, Coeur Capital
Toronto, Ontario
June 23, 2014

2 NYSE: CDE
Cautionary Statements
This presentation contains forward-looking statements within the meaning of securities legislation in the United States and Canada, including statements regarding anticipated production, costs, expenses, capital and exploration expenditures, amortization, and exploration and development efforts, expectations regarding recovery rates, grade, throughput, margins, cash flow, growth, returns, competition, financing opportunities, mine plans, cost improvements, efficiency gains, capital deployment, acquisition pipeline, minimizing and mitigating risks, and the La Preciosa project. Such forward-looking statements involve known and unknown risks, uncertainties and other factors which may cause Coeur's actual results, performance or achievements to be materially different from any future results, performance or achievements expressed or implied by the forward-looking statements. Such factors include, among others, the risks and hazards inherent in the mining business (including risks inherent in developing large-scale mining projects, environmental hazards, industrial accidents, weather or geologically related conditions), changes in the market prices of gold and silver and a sustained lower price environment, the uncertainties inherent in Coeur's production, exploratory and developmental activities, including risks relating to permitting and regulatory delays, ground conditions, grade variability, any future labor disputes or work stoppages, the uncertainties inherent in the estimation of gold and silver ore reserves, changes that could result from Coeur's future acquisition of new mining properties or businesses, reliance on third parties to operate certain mines where Coeur owns silver production and reserves and the absence of control over mining operations in which Coeur or its subsidiaries hold royalty or streaming interests and risks related to these mining operations including results of mining and exploration activities, environmental, economic and political risks of the jurisdiction in which the mining operations are located, the loss of any third-party smelter to which Coeur markets silver and gold, the effects of environmental and other governmental regulations, the risks inherent in the ownership or operation of or investment in mining properties or businesses in foreign countries, Coeur's ability to raise additional financing necessary to conduct its business, make payments or refinance its debt, as well as other uncertainties and risk factors set out in filings made from time to time with the United States Securities and Exchange Commission, and the Canadian securities regulators, including, without limitation, Coeur's most recent reports on Form 10-K and Form 10-Q. Actual results, developments and timetables could vary significantly from the estimates presented. Readers are cautioned not to put undue reliance on forward-looking statements. Coeur disclaims any intent or obligation to update publicly such forward-looking statements, whether as a result of new information, future events or otherwise. Additionally, Coeur undertakes no obligation to comment on analyses, expectations or statements made by third parties in respect of Coeur, its financial or operating results or its securities.
W. David Tyler, Coeur's Vice President, Technical Services and a qualified person under Canadian National Instrument 43-101, supervised the preparation of the scientific and technical information concerning Coeur's mineral projects in this news release. For a description of the key assumptions, parameters and methods used to estimate mineral reserves and resources, as well as data verification procedures and a general discussion of the extent to which the estimates may be affected by any known environmental, permitting, legal, title, taxation, socio-political, marketing or other relevant factors, please see the Technical Reports for each of Coeur's properties as filed on SEDAR at www.sedar.com.
The La Preciosa PEA referenced in this presentation is preliminary in nature and includes inferred mineral resources that are considered too speculative geologically to have the economic considerations applied to them that would enable them to be characterized as mineral reserves. There is no certainty that the results reflected in the PEA will be realized. Mineral resources that are not mineral reserves do not have demonstrated economic viability. Mineral resource estimates do not account for minability, selectivity, mining loss and dilution. There is no certainty that the inferred mineral resources will be converted to the measured and indicated categories or that the measured and indicated mineral resources will be converted to the proven and probable mineral reserve categories. There are no mineral reserves at La Preciosa. The Canadian National Instrument 43-101-compliant Technical Report, disclosing results of the PEA, is available on www.sedar.com.
Cautionary Note to U.S. Investors - The United States Securities and Exchange Commission permits U.S. mining companies, in their filings with the SEC, to disclose only those mineral deposits that a company can economically and legally extract or produce. We may use certain terms in public disclosures, such as "measured," "indicated," "inferred” and “resources," that are recognized by Canadian regulations, but that SEC guidelines generally prohibit U.S. registered companies from including in their filings with the SEC. U.S. investors are urged to consider closely the disclosure in our Form 10-K which may be secured from us, or from the SEC's website at http://www.sec.gov.
Non-U.S. GAAP Measures - We supplement the reporting of our financial information determined under United States generally accepted accounting principles (U.S. GAAP) with certain non-U.S. GAAP financial measures, including EBITDA and cost applicable to sales per silver equivalent ounce. We believe that these adjusted measures provide meaningful information to assist management, investors and analysts in understanding our financial results and assessing our prospects for future performance. We believe these adjusted financial measures are important indicators of our recurring operations because they exclude items that may not be indicative of, or are unrelated to our core operating results, and provide a better baseline for analyzing trends in our underlying businesses. We believe EBITDA and costs applicable to sales per silver equivalent ounce are important measures in assessing the Company's overall financial performance.

NYSE: CDE 3
Key Investment Considerations for Coeur Mining
Largest U.S.-based
Silver Producer; Significant Gold
Production
Strong Platform of Assets Provides
Diversified Production Base
Focused on Reducing Costs while Managing and Mitigating Risks
Growing Pipeline of Value-Creating Assets
Disciplined Capital Deployment Strategy
Well-Capitalized with Strong Liquidity
NYSE: CDE 4
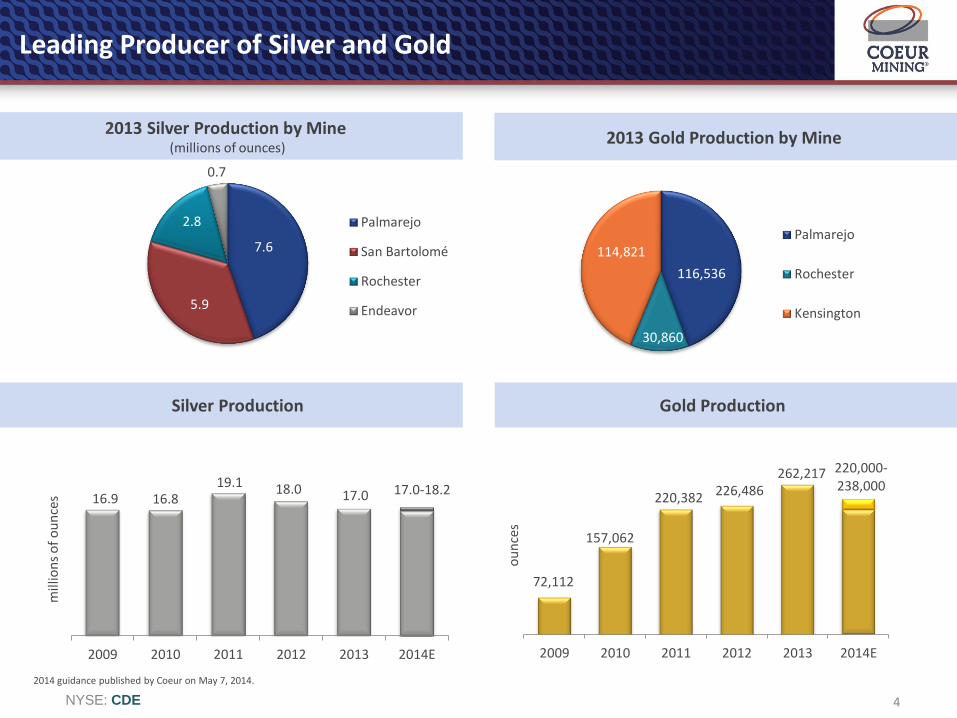
72,112
157,062
220,382 226,486 262,217 220,000-
238,000
2009 2010 2011 2012 2013 2014E
ou
nce
s
Leading Producer of Silver and Gold
7.6
5.9
2.8
0.7
Palmarejo
San Bartolomé
Rochester
Endeavor
Silver Production
2013 Silver Production by Mine (millions of ounces)
16.9 16.8 19.1 18.0 17.0 17.0-18.2
2009 2010 2011 2012 2013 2014E
mill
ion
s o
f o
un
ces
2013 Gold Production by Mine
Gold Production
2014 guidance published by Coeur on May 7, 2014.
116,536
30,860
114,821 Palmarejo
Rochester
Kensington
NYSE: CDE 5
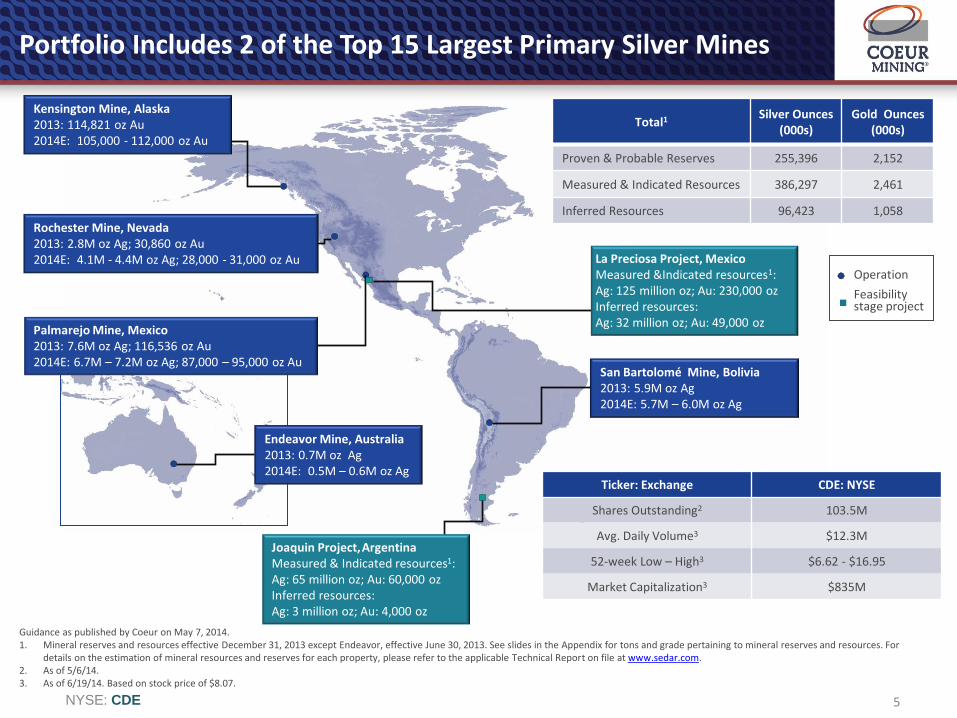
Portfolio Includes 2 of the Top 15 Largest Primary Silver Mines
Endeavor Mine, Australia 2013: 0.7M oz Ag 2014E: 0.5M – 0.6M oz Ag
Rochester Mine, Nevada 2013: 2.8M oz Ag; 30,860 oz Au 2014E: 4.1M - 4.4M oz Ag; 28,000 - 31,000 oz Au
Operation
Feasibility stage project
San Bartolomé Mine, Bolivia 2013: 5.9M oz Ag 2014E: 5.7M – 6.0M oz Ag
Palmarejo Mine, Mexico 2013: 7.6M oz Ag; 116,536 oz Au 2014E: 6.7M – 7.2M oz Ag; 87,000 – 95,000 oz Au
Kensington Mine, Alaska 2013: 114,821 oz Au 2014E: 105,000 - 112,000 oz Au
Joaquin Project, Argentina Measured & Indicated resources1: Ag: 65 million oz; Au: 60,000 oz Inferred resources: Ag: 3 million oz; Au: 4,000 oz
La Preciosa Project, Mexico
Measured &Indicated resources1: Ag: 125 million oz; Au: 230,000 oz Inferred resources: Ag: 32 million oz; Au: 49,000 oz
Guidance as published by Coeur on May 7, 2014. 1. Mineral reserves and resources effective December 31, 2013 except Endeavor, effective June 30, 2013. See slides in the Appendix for tons and grade pertaining to mineral reserves and resources. For
details on the estimation of mineral resources and reserves for each property, please refer to the applicable Technical Report on file at www.sedar.com. 2. As of 5/6/14. 3. As of 6/19/14. Based on stock price of $8.07.
Total1 Silver Ounces (000s)
Gold Ounces (000s)
Proven & Probable Reserves 255,396 2,152
Measured & Indicated Resources 386,297 2,461
Inferred Resources 96,423 1,058
Ticker: Exchange CDE: NYSE
Shares Outstanding2 103.5M
Avg. Daily Volume3 $12.3M
52-week Low – High3 $6.62 - $16.95
Market Capitalization3 $835M

NYSE: CDE 6
Diverse Base of Cash-Flowing and Development Assets Complemented by Coeur Capital
Operating Mines
Robust Exploration
Program
Long Mine Life
Early-Stage Projects
Support Enables Facilitates

NYSE: CDE 7
Growing Asset Pipeline with Balanced Production Cycle
Operating Assets
All four mines operating consistently
Rochester continues to ramp up with significant production increase expected in 2014
Production outlook roughly stable for remainder of the portfolio
Development Projects
La Preciosa silver-gold project in Durango state, Mexico: feasibility study to be completed mid-year
Joaquin silver-gold project in Santa Cruz province, Argentina: feasibility study on hold until political climate improves
Strategic Investments
(% ownership)
Apogee Silver- 7.6%
Caracara Silver- 3.2%
Commonwealth Silver & Gold- 6.5%
Huldra Silver- 6.8%
Idaho North Resources- 14.0%
International Northair Mines- 19.4%
Orex Minerals- 1.0%
Pershing Gold- 4.0%
Silver Bull Resources-10.9%
Soltoro- 7.5%
Royalty/Streaming Assets
Four cash-flowing streams/royalties
Expect to add to the portfolio during 2014
Acquiring additional streams and royalties is a top priority
Recently purchased royalty on International Northair Mines’s La Cigarra silver project
Coeur Mining Coeur Capital
Long mine lives within operating asset base balanced by feasibility-stage projects, newly-formed Coeur Capital and recent emphasis on early stage exploration projects
NYSE: CDE 8
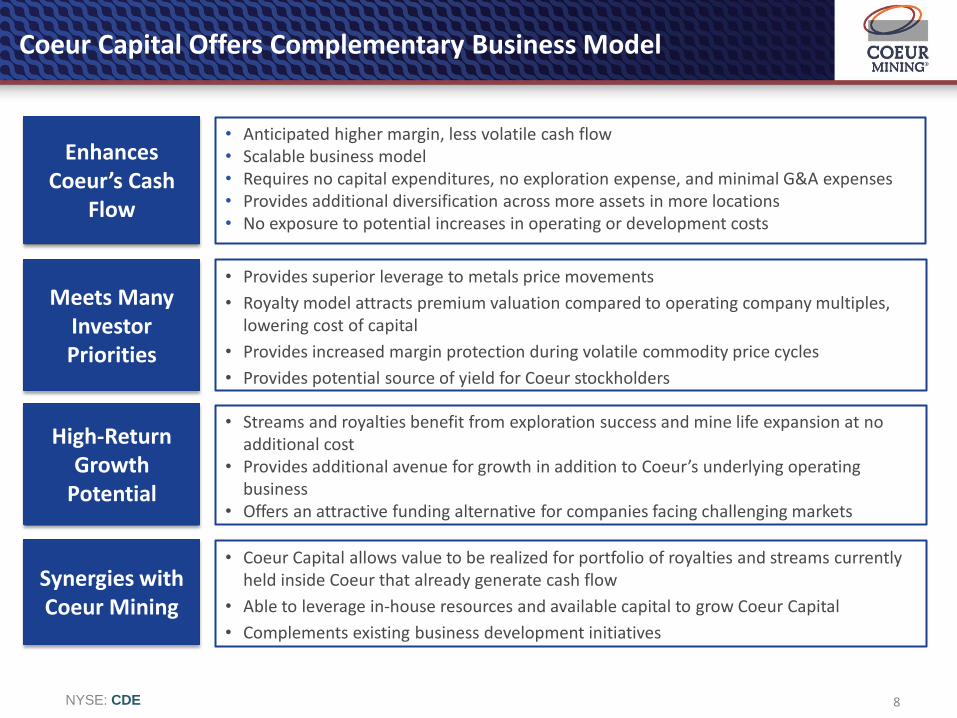
Coeur Capital Offers Complementary Business Model
Enhances Coeur’s Cash
Flow
• Anticipated higher margin, less volatile cash flow • Scalable business model • Requires no capital expenditures, no exploration expense, and minimal G&A expenses • Provides additional diversification across more assets in more locations • No exposure to potential increases in operating or development costs
Meets Many Investor Priorities
High-Return Growth
Potential
• Provides superior leverage to metals price movements
• Royalty model attracts premium valuation compared to operating company multiples, lowering cost of capital
• Provides increased margin protection during volatile commodity price cycles
• Provides potential source of yield for Coeur stockholders
• Streams and royalties benefit from exploration success and mine life expansion at no
additional cost • Provides additional avenue for growth in addition to Coeur’s underlying operating
business • Offers an attractive funding alternative for companies facing challenging markets
Synergies with Coeur Mining
• Coeur Capital allows value to be realized for portfolio of royalties and streams currently held inside Coeur that already generate cash flow
• Able to leverage in-house resources and available capital to grow Coeur Capital
• Complements existing business development initiatives
NYSE: CDE 9
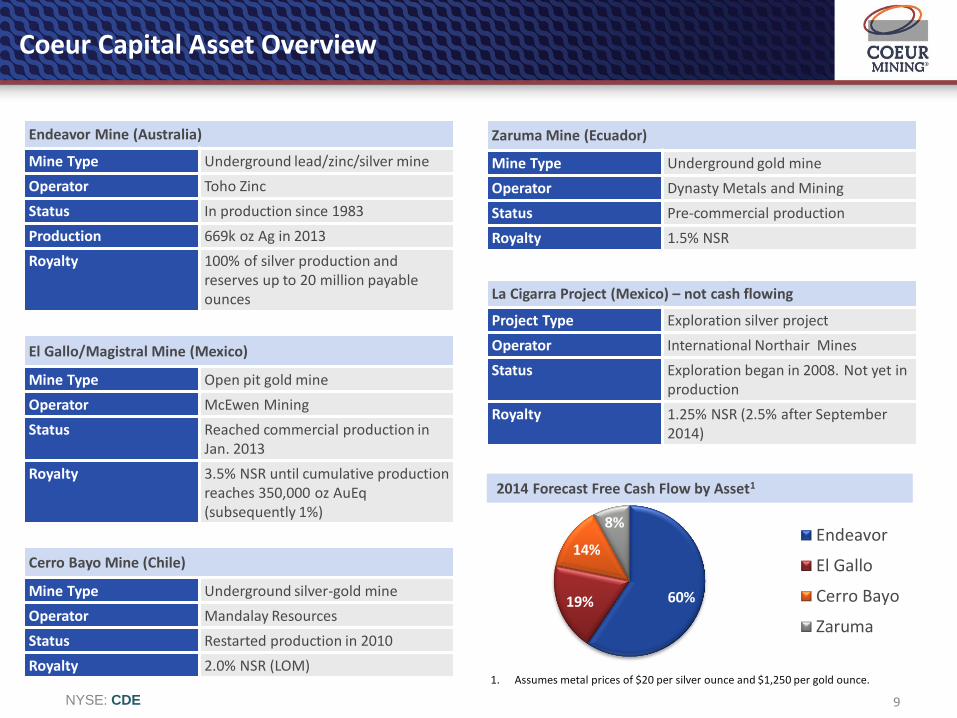
Coeur Capital Asset Overview
Endeavor Mine (Australia)
Mine Type Underground lead/zinc/silver mine
Operator Toho Zinc
Status In production since 1983
Production 669k oz Ag in 2013
Royalty 100% of silver production and reserves up to 20 million payable ounces
Cerro Bayo Mine (Chile)
Mine Type Underground silver-gold mine
Operator Mandalay Resources
Status Restarted production in 2010
Royalty 2.0% NSR (LOM)
El Gallo/Magistral Mine (Mexico)
Mine Type Open pit gold mine
Operator McEwen Mining
Status Reached commercial production in Jan. 2013
Royalty 3.5% NSR until cumulative production reaches 350,000 oz AuEq (subsequently 1%)
Zaruma Mine (Ecuador)
Mine Type Underground gold mine
Operator Dynasty Metals and Mining
Status Pre-commercial production
Royalty 1.5% NSR
60% 19%
14%
8% Endeavor
El Gallo
Cerro Bayo
Zaruma
2014 Forecast Free Cash Flow by Asset1
1. Assumes metal prices of $20 per silver ounce and $1,250 per gold ounce.
La Cigarra Project (Mexico) – not cash flowing
Project Type Exploration silver project
Operator International Northair Mines
Status Exploration began in 2008. Not yet in production
Royalty 1.25% NSR (2.5% after September 2014)
NYSE: CDE 10
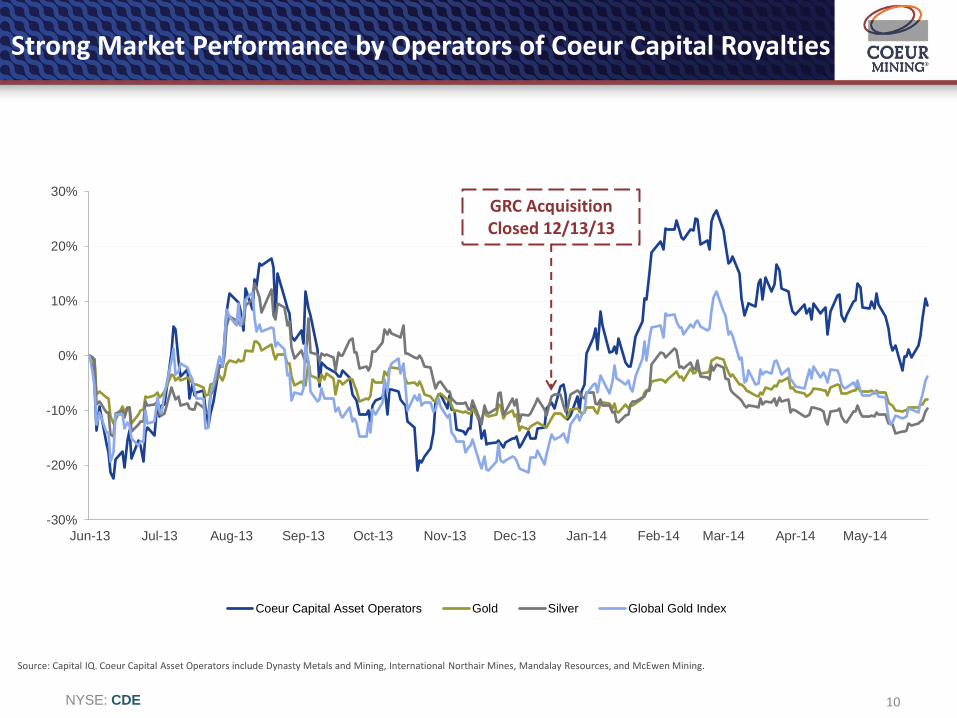
Strong Market Performance by Operators of Coeur Capital Royalties
Source: Capital IQ. Coeur Capital Asset Operators include Dynasty Metals and Mining, International Northair Mines, Mandalay Resources, and McEwen Mining.
-30%
-20%
-10%
0%
10%
20%
30%
Jun-13 Jul-13 Aug-13 Sep-13 Oct-13 Nov-13 Dec-13 Jan-14 Feb-14 Mar-14 Apr-14 May-14
Coeur Capital Asset Operators Gold Silver Global Gold Index
GRC Acquisition Closed 12/13/13
NYSE: CDE 11
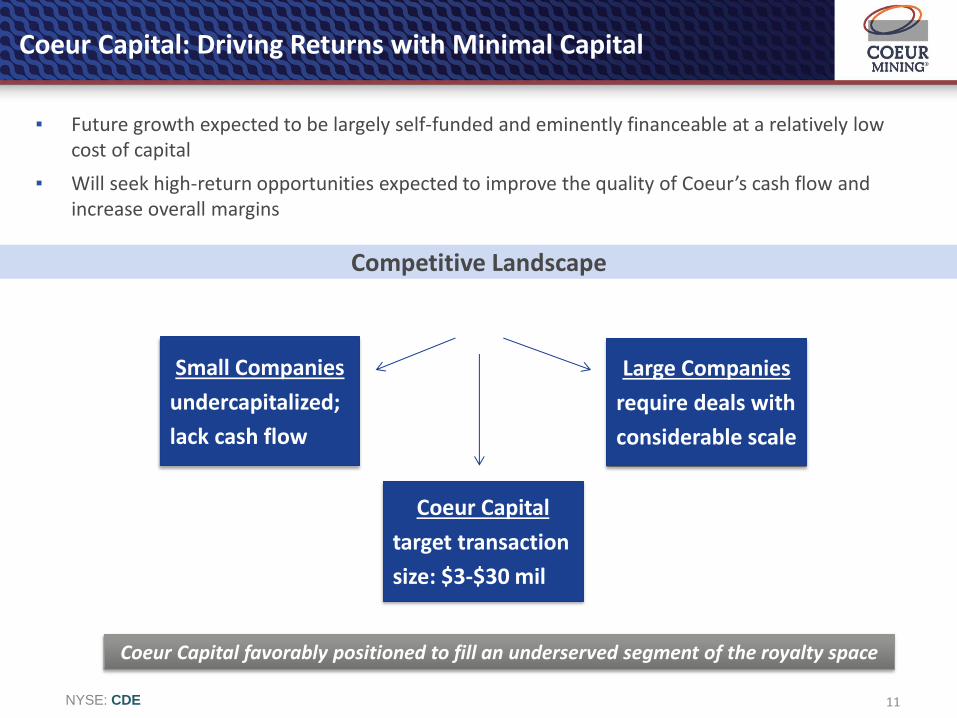
Coeur Capital: Driving Returns with Minimal Capital
▪ Future growth expected to be largely self-funded and eminently financeable at a relatively low cost of capital
▪ Will seek high-return opportunities expected to improve the quality of Coeur’s cash flow and increase overall margins
Small Companies
undercapitalized;
lack cash flow
Large Companies
require deals with
considerable scale
Coeur Capital
target transaction
size: $3-$30 mil
Competitive Landscape
Coeur Capital favorably positioned to fill an underserved segment of the royalty space
NYSE: CDE 12
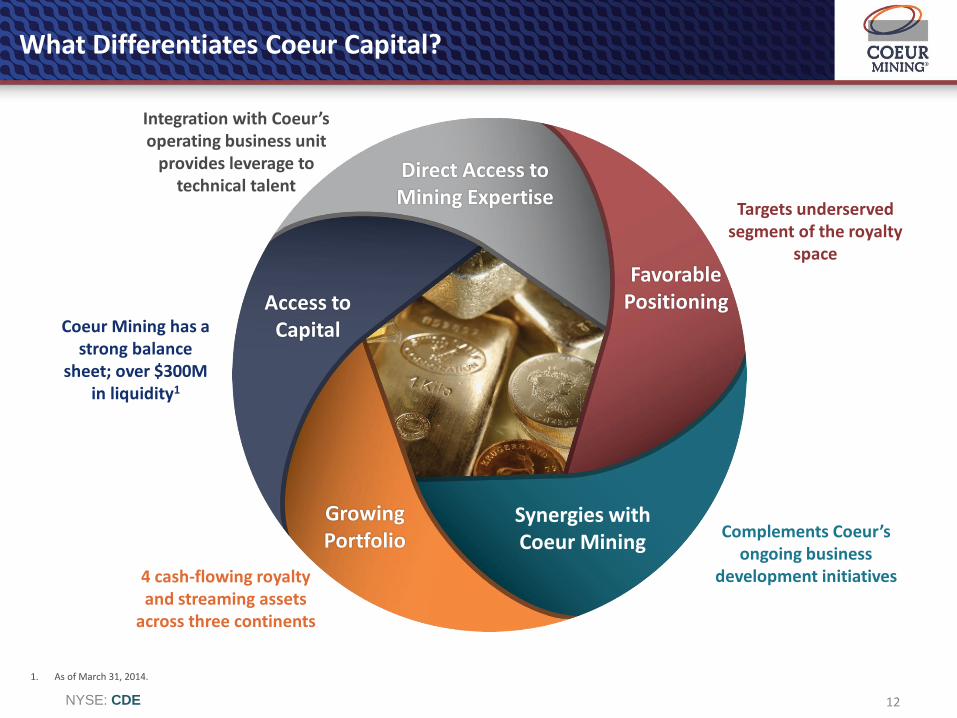
What Differentiates Coeur Capital?
Growing Portfolio
Access to Capital
Direct Access to Mining Expertise
Favorable Positioning
4 cash-flowing royalty and streaming assets
across three continents
Coeur Mining has a strong balance
sheet; over $300M in liquidity1
Integration with Coeur’s operating business unit
provides leverage to technical talent
Targets underserved segment of the royalty
space
Synergies with Coeur Mining
Complements Coeur’s ongoing business
development initiatives
1. As of March 31, 2014.

Appendix
NYSE: CDE 14
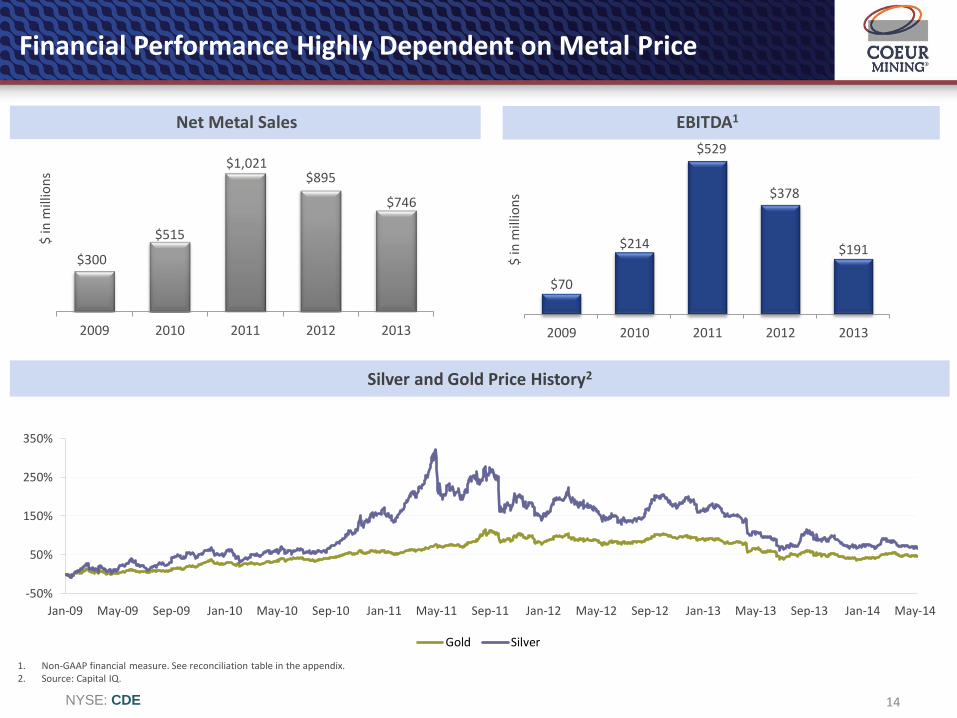
$300
$515
$1,021 $895
$746
2009 2010 2011 2012 2013
$ in
mill
ion
s Financial Performance Highly Dependent on Metal Price
$70
$214
$529
$378
$191
2009 2010 2011 2012 2013
$ in
mill
ion
s
Silver and Gold Price History2
Net Metal Sales EBITDA1
1. Non-GAAP financial measure. See reconciliation table in the appendix. 2. Source: Capital IQ.
-50%
50%
150%
250%
350%
Jan-09 May-09 Sep-09 Jan-10 May-10 Sep-10 Jan-11 May-11 Sep-11 Jan-12 May-12 Sep-12 Jan-13 May-13 Sep-13 Jan-14 May-14
Gold Silver

NYSE: CDE 15
7,603
5,941
2,799
669
6,950 5,850
4,250
550
Palmarejo San Bartolomé Rochester Endeavor
Ou
nce
s in
th
ou
san
ds
2013 Actual 2014 Guidance Midpoint
2014 Guidance
Guidance published by Coeur on May 7, 2014.
114,821 116,536
30,860
108,500 91,000
29,500
Kensington Palmarejo Rochester
Ou
nce
s
2013 Actual 2014 Guidance Midpoint
Silver Production Gold Production
in millions 2013 Actual 2014 Guidance
Capital expenditures $101 $65-$80
Production costs applicable to sales $464 $500-$530
Exploration (expensed and capitalized) $34 $23-$28
General and administrative $55 $43-$48
Amortization $233 $190
NYSE: CDE 16
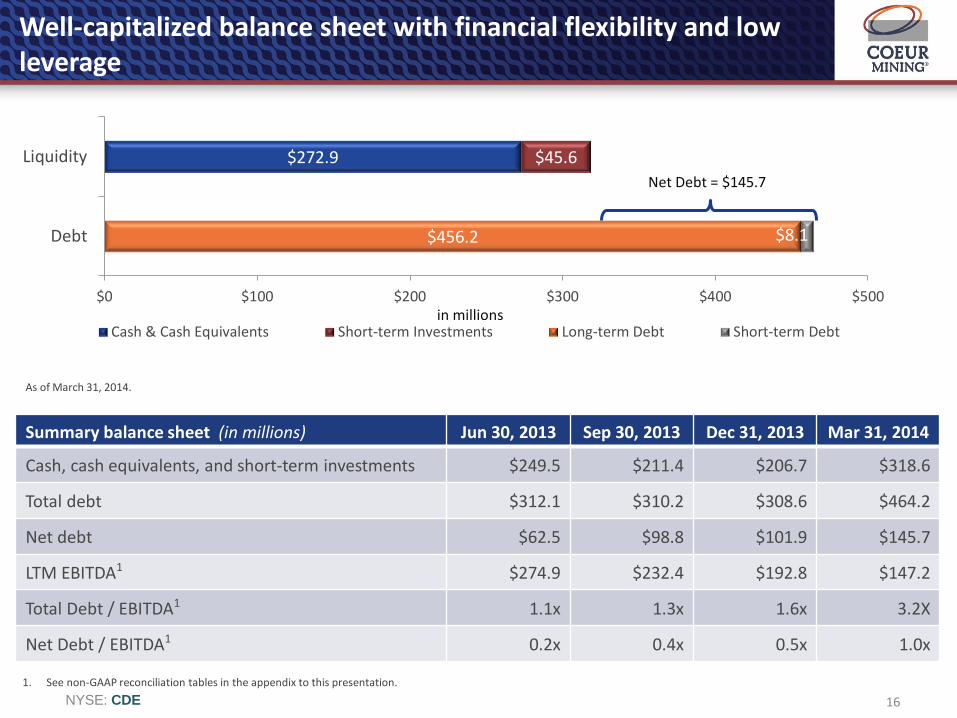
Well-capitalized balance sheet with financial flexibility and low leverage
$272.9 $45.6
$456.2 $8.1
$0 $100 $200 $300 $400 $500
Debt
Liquidity
in millions Cash & Cash Equivalents Short-term Investments Long-term Debt Short-term Debt
Net Debt = $145.7
As of March 31, 2014.
Summary balance sheet (in millions) Jun 30, 2013 Sep 30, 2013 Dec 31, 2013 Mar 31, 2014
Cash, cash equivalents, and short-term investments $249.5 $211.4 $206.7 $318.6
Total debt $312.1 $310.2 $308.6 $464.2
Net debt $62.5 $98.8 $101.9 $145.7
LTM EBITDA1 $274.9 $232.4 $192.8 $147.2
Total Debt / EBITDA1 1.1x 1.3x 1.6x 3.2X
Net Debt / EBITDA1 0.2x 0.4x 0.5x 1.0x
1. See non-GAAP reconciliation tables in the appendix to this presentation.

NYSE: CDE 17
Returns-Driven Approach to Capital Deployment and Portfolio Optimization
Coeur’s Strategy
Expected IRR > cost of capital
Jurisdictions with low political risk
Diversify asset base
Maintain low financial leverage; strong liquidity
Prefer assets that are immediately accretive to earnings / provide near-term cash flow
Balance pipeline of assets
Opportunities
Acquisition of operating asset ‾ Adds near-term cash flow ‾ Less execution risk; lower capital needs ‾ Potential to lower Coeur’s overall cost
profile La Preciosa development project
‾ Potential to defer until market conditions improve
‾ Represents a “call option” on higher metal prices
Early-stage and brownfield exploration Royalties / streams through Coeur Capital
‾ Source of higher-margin, more stable cash flow
Ultimate goal: every asset to generate return in excess of cost of capital
NYSE: CDE 18
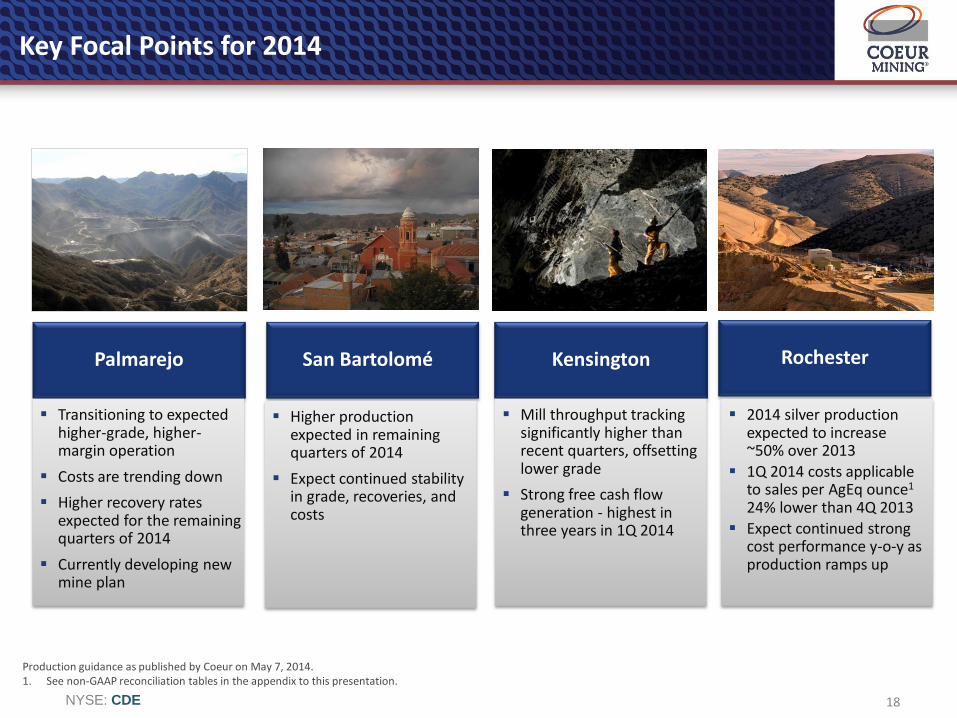
Key Focal Points for 2014
Production guidance as published by Coeur on May 7, 2014. 1. See non-GAAP reconciliation tables in the appendix to this presentation.
Palmarejo San Bartolomé Kensington Rochester
Transitioning to expected higher-grade, higher-margin operation
Costs are trending down
Higher recovery rates expected for the remaining quarters of 2014
Currently developing new mine plan
Higher production expected in remaining quarters of 2014
Expect continued stability in grade, recoveries, and costs
Mill throughput tracking significantly higher than recent quarters, offsetting lower grade
Strong free cash flow generation - highest in three years in 1Q 2014
2014 silver production expected to increase ~50% over 2013
1Q 2014 costs applicable to sales per AgEq ounce1 24% lower than 4Q 2013
Expect continued strong cost performance y-o-y as production ramps up
NYSE: CDE 19
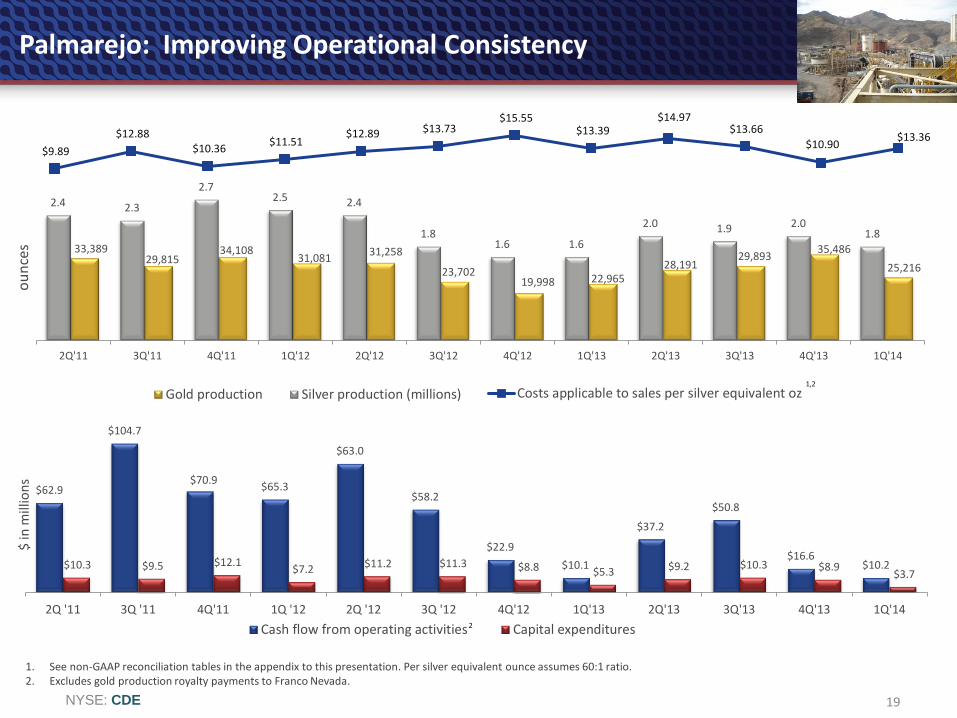
33,389 29,815
34,108 31,081
31,258
23,702 19,998 22,965
28,191 29,893
35,486
25,216
2.4 2.3
2.7 2.5 2.4
1.8 1.6 1.6
2.0 1.9 2.0 1.8
2Q'11 3Q'11 4Q'11 1Q'12 2Q'12 3Q'12 4Q'12 1Q'13 2Q'13 3Q'13 4Q'13 1Q'14
Gold production Silver production (millions)
$9.89
$12.88 $10.36
$11.51 $12.89 $13.73
$15.55 $13.39
$14.97 $13.66
$10.90 $13.36
ou
nce
s
Costs applicable to sales per silver equivalent oz
$62.9
$104.7
$70.9 $65.3
$63.0
$58.2
$22.9
$10.1
$37.2
$50.8
$16.6 $10.2 $10.3 $9.5 $12.1
$7.2 $11.2 $11.3 $8.8 $5.3 $9.2 $10.3 $8.9 $3.7
2Q '11 3Q '11 4Q'11 1Q '12 2Q '12 3Q '12 4Q'12 1Q'13 2Q'13 3Q'13 4Q'13 1Q'14
$ in
mill
ion
s
Cash flow from operating activities Capital expenditures
1. See non-GAAP reconciliation tables in the appendix to this presentation. Per silver equivalent ounce assumes 60:1 ratio. 2. Excludes gold production royalty payments to Franco Nevada.
Palmarejo: Improving Operational Consistency
1,2
2
NYSE: CDE 20
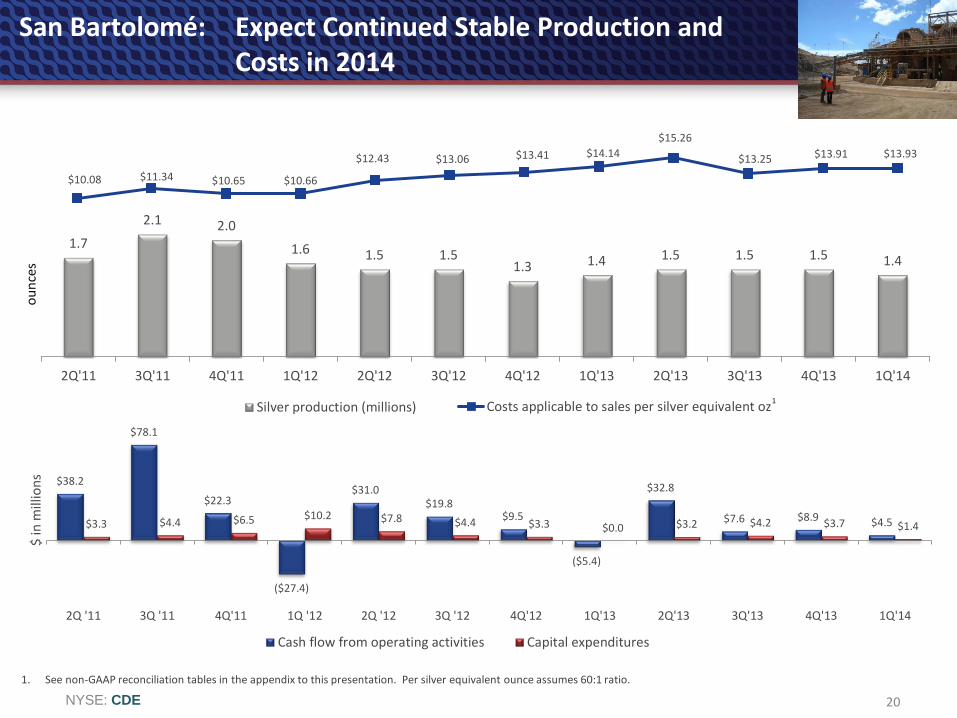
$10.08 $11.34 $10.65 $10.66
$12.43 $13.06 $13.41 $14.14
$15.26
$13.25 $13.91 $13.93
Costs applicable to sales per silver equivalent oz
1.7
2.1 2.0
1.6 1.5 1.5 1.3 1.4 1.5 1.5 1.5 1.4
2Q'11 3Q'11 4Q'11 1Q'12 2Q'12 3Q'12 4Q'12 1Q'13 2Q'13 3Q'13 4Q'13 1Q'14
ou
nce
s
Silver production (millions)
San Bartolomé: Expect Continued Stable Production and Costs in 2014
1. See non-GAAP reconciliation tables in the appendix to this presentation. Per silver equivalent ounce assumes 60:1 ratio.
$38.2
$78.1
$22.3
($27.4)
$31.0 $19.8
$9.5
($5.4)
$32.8
$7.6 $8.9 $4.5 $3.3 $4.4 $6.5 $10.2 $7.8 $4.4 $3.3 $0.0 $3.2 $4.2 $3.7 $1.4
2Q '11 3Q '11 4Q'11 1Q '12 2Q '12 3Q '12 4Q'12 1Q'13 2Q'13 3Q'13 4Q'13 1Q'14
$ in
mill
ion
s
Cash flow from operating activities Capital expenditures
1

NYSE: CDE 21
$676 $856
$1,469
$2,587
$1,129 $1,126
$1,002 $890 $1,234
$871 $667
$1,005
Costs applicable to sales per gold oz
25,758 25,687
13,299
7,444
21,572 24,391
28,717 25,206
23,162
29,049
37,404
25,428
2Q'11 3Q'11 4Q'11 1Q'12 2Q'12 3Q'12 4Q'12 1Q'13 2Q'13 3Q'13 4Q'13 1Q'14
ou
nce
s
Gold production
$7.6 $8.6 $9.3
$1.1
($12.5)
$5.0
$16.5
$11.7
$7.6
$1.9
$11.3 $13.9
$7.4 $9.2
$12.0 $10.9 $9.3 $9.0 $7.8
$3.3
$7.4 $4.9 $5.7 $4.7
2Q '11 3Q '11 4Q'11 1Q '12 2Q '12 3Q '12 4Q'12 1Q'13 2Q'13 3Q'13 4Q'13 1Q'14
$ in
mill
ion
s
Cash flow from operating activities Capital expenditures
Kensington: Higher Throughput Expected to Offset Lower Grade in 2014
1
1. See non-GAAP reconciliation tables in the appendix to this presentation.
NYSE: CDE 22
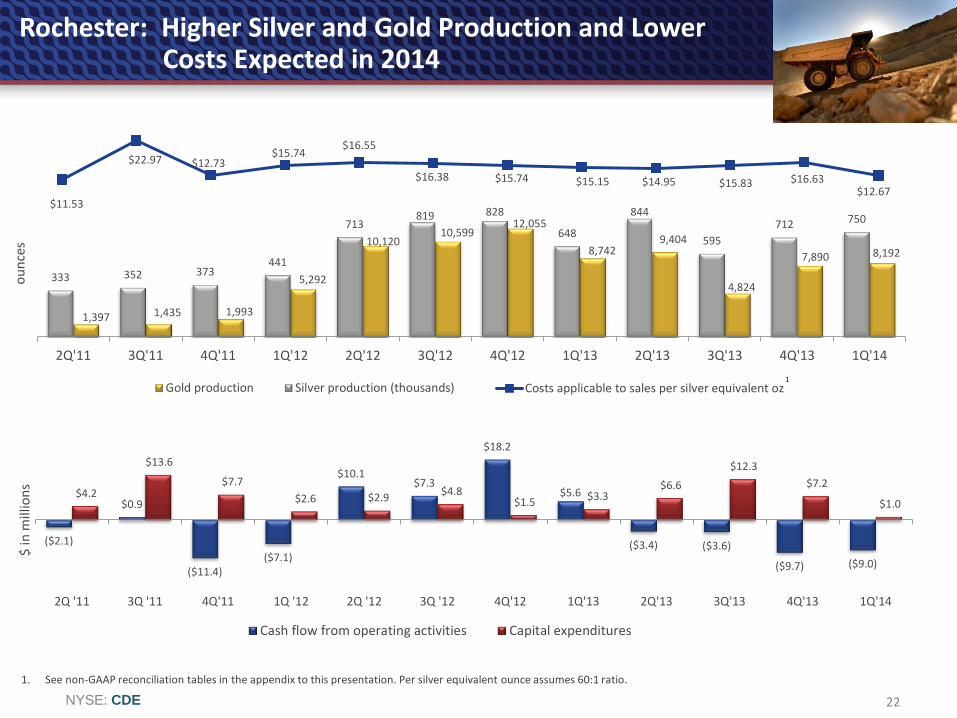
$11.53
$22.97 $12.73 $15.74
$16.55
$16.38 $15.74 $15.15 $14.95 $15.83 $16.63 $12.67
Costs applicable to sales per silver equivalent oz
1,397 1,435 1,993
5,292
10,120 10,599
12,055
8,742 9,404
4,824
7,890 8,192
333 352 373 441
713 819 828
648
844
595
712 750
2Q'11 3Q'11 4Q'11 1Q'12 2Q'12 3Q'12 4Q'12 1Q'13 2Q'13 3Q'13 4Q'13 1Q'14
ou
nce
s
Gold production Silver production (thousands)
($2.1)
$0.9
($11.4) ($7.1)
$10.1 $7.3
$18.2
$5.6
($3.4) ($3.6)
($9.7) ($9.0)
$4.2
$13.6
$7.7
$2.6 $2.9 $4.8
$1.5 $3.3 $6.6
$12.3
$7.2
$1.0
2Q '11 3Q '11 4Q'11 1Q '12 2Q '12 3Q '12 4Q'12 1Q'13 2Q'13 3Q'13 4Q'13 1Q'14
$ in
mill
ion
s
Cash flow from operating activities Capital expenditures
Rochester: Higher Silver and Gold Production and Lower Costs Expected in 2014
1
1. See non-GAAP reconciliation tables in the appendix to this presentation. Per silver equivalent ounce assumes 60:1 ratio.
23 NYSE: CDE
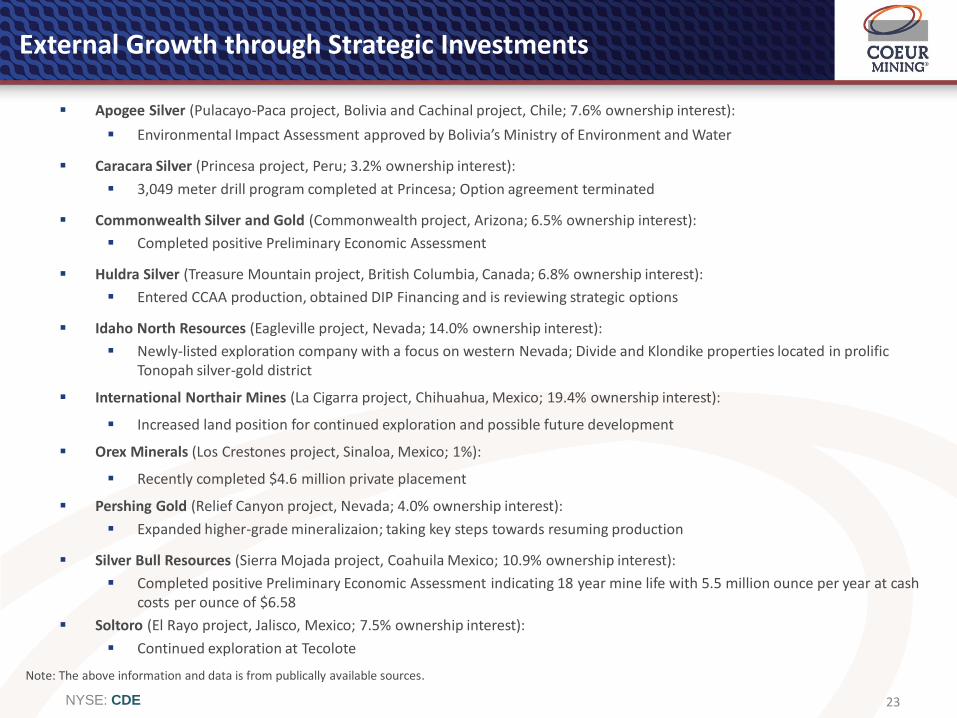
External Growth through Strategic Investments
Apogee Silver (Pulacayo-Paca project, Bolivia and Cachinal project, Chile; 7.6% ownership interest):
Environmental Impact Assessment approved by Bolivia’s Ministry of Environment and Water
Caracara Silver (Princesa project, Peru; 3.2% ownership interest):
3,049 meter drill program completed at Princesa; Option agreement terminated
Commonwealth Silver and Gold (Commonwealth project, Arizona; 6.5% ownership interest):
Completed positive Preliminary Economic Assessment
Huldra Silver (Treasure Mountain project, British Columbia, Canada; 6.8% ownership interest):
Entered CCAA production, obtained DIP Financing and is reviewing strategic options
Idaho North Resources (Eagleville project, Nevada; 14.0% ownership interest):
Newly-listed exploration company with a focus on western Nevada; Divide and Klondike properties located in prolific Tonopah silver-gold district
International Northair Mines (La Cigarra project, Chihuahua, Mexico; 19.4% ownership interest):
Increased land position for continued exploration and possible future development
Orex Minerals (Los Crestones project, Sinaloa, Mexico; 1%):
Recently completed $4.6 million private placement
Pershing Gold (Relief Canyon project, Nevada; 4.0% ownership interest):
Expanded higher-grade mineralizaion; taking key steps towards resuming production
Silver Bull Resources (Sierra Mojada project, Coahuila Mexico; 10.9% ownership interest):
Completed positive Preliminary Economic Assessment indicating 18 year mine life with 5.5 million ounce per year at cash costs per ounce of $6.58
Soltoro (El Rayo project, Jalisco, Mexico; 7.5% ownership interest):
Continued exploration at Tecolote
Note: The above information and data is from publically available sources.
NYSE: CDE 24
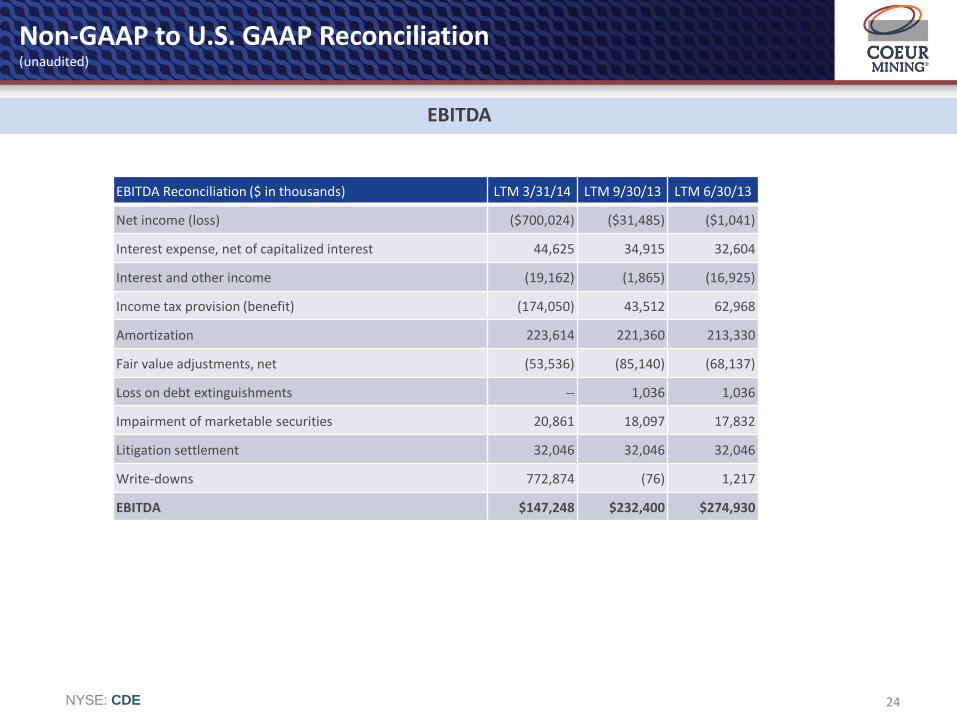
Non-GAAP to U.S. GAAP Reconciliation (unaudited)
EBITDA
EBITDA Reconciliation ($ in thousands) LTM 3/31/14 LTM 9/30/13 LTM 6/30/13
Net income (loss) ($700,024) ($31,485) ($1,041)
Interest expense, net of capitalized interest 44,625 34,915 32,604
Interest and other income (19,162) (1,865) (16,925)
Income tax provision (benefit) (174,050) 43,512 62,968
Amortization 223,614 221,360 213,330
Fair value adjustments, net (53,536) (85,140) (68,137)
Loss on debt extinguishments -- 1,036 1,036
Impairment of marketable securities 20,861 18,097 17,832
Litigation settlement 32,046 32,046 32,046
Write-downs 772,874 (76) 1,217
EBITDA $147,248 $232,400 $274,930
NYSE: CDE 25
Non-GAAP to U.S. GAAP Reconciliation (unaudited)
EBITDA
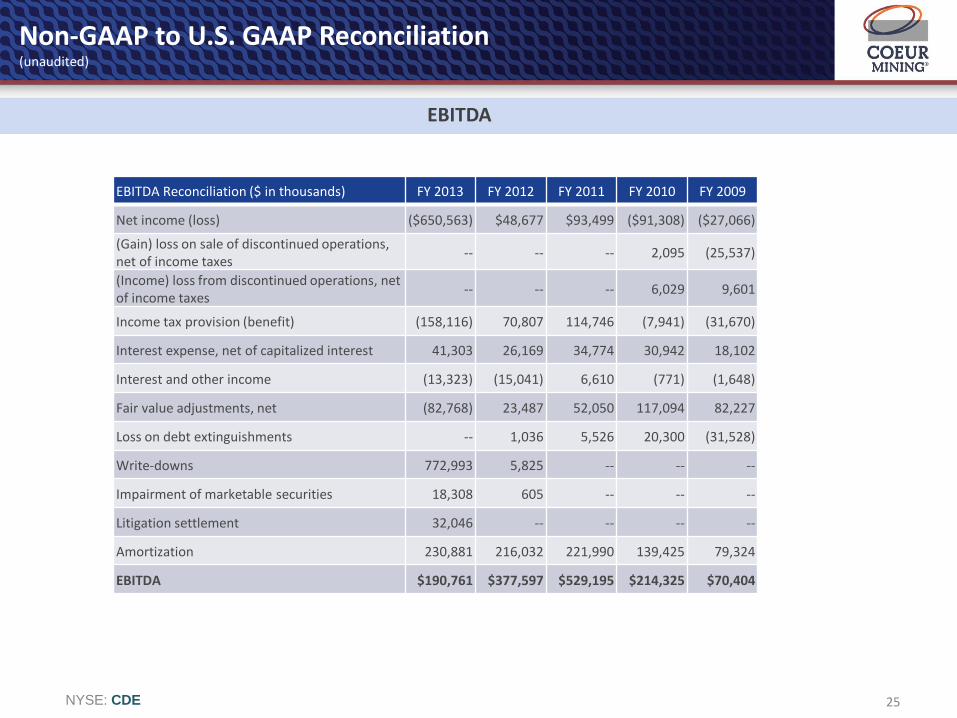
EBITDA Reconciliation ($ in thousands) FY 2013 FY 2012 FY 2011 FY 2010 FY 2009
Net income (loss) ($650,563) $48,677 $93,499 ($91,308) ($27,066)
(Gain) loss on sale of discontinued operations, net of income taxes
-- -- -- 2,095 (25,537)
(Income) loss from discontinued operations, net of income taxes
-- -- -- 6,029 9,601
Income tax provision (benefit) (158,116) 70,807 114,746 (7,941) (31,670)
Interest expense, net of capitalized interest 41,303 26,169 34,774 30,942 18,102
Interest and other income (13,323) (15,041) 6,610 (771) (1,648)
Fair value adjustments, net (82,768) 23,487 52,050 117,094 82,227
Loss on debt extinguishments -- 1,036 5,526 20,300 (31,528)
Write-downs 772,993 5,825 -- -- --
Impairment of marketable securities 18,308 605 -- -- --
Litigation settlement 32,046 -- -- -- --
Amortization 230,881 216,032 221,990 139,425 79,324
EBITDA $190,761 $377,597 $529,195 $214,325 $70,404
NYSE: CDE 26
Non-GAAP to U.S. GAAP Reconciliation (unaudited)
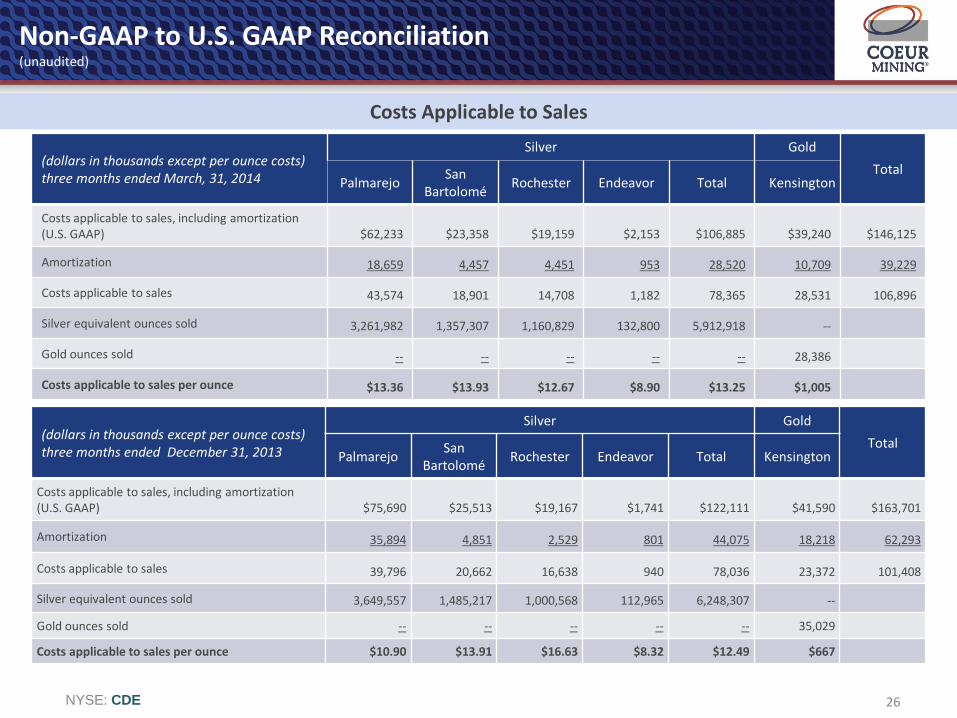
(dollars in thousands except per ounce costs) three months ended March, 31, 2014
Silver Gold
Total Palmarejo
San Bartolomé
Rochester Endeavor Total Kensington
Costs applicable to sales, including amortization (U.S. GAAP) $62,233 $23,358 $19,159 $2,153 $106,885 $39,240 $146,125
Amortization 18,659 4,457 4,451 953 28,520 10,709 39,229
Costs applicable to sales 43,574 18,901 14,708 1,182 78,365 28,531 106,896
Silver equivalent ounces sold 3,261,982 1,357,307 1,160,829 132,800 5,912,918 --
Gold ounces sold -- -- -- -- -- 28,386
Costs applicable to sales per ounce $13.36 $13.93 $12.67 $8.90 $13.25 $1,005
Costs Applicable to Sales
(dollars in thousands except per ounce costs) three months ended December 31, 2013
Silver Gold
Total Palmarejo
San Bartolomé
Rochester Endeavor Total Kensington
Costs applicable to sales, including amortization (U.S. GAAP) $75,690 $25,513 $19,167 $1,741 $122,111 $41,590 $163,701
Amortization 35,894 4,851 2,529 801 44,075 18,218 62,293
Costs applicable to sales 39,796 20,662 16,638 940 78,036 23,372 101,408
Silver equivalent ounces sold 3,649,557 1,485,217 1,000,568 112,965 6,248,307 --
Gold ounces sold -- -- -- -- -- 35,029
Costs applicable to sales per ounce $10.90 $13.91 $16.63 $8.32 $12.49 $667

NYSE: CDE 27
Non-GAAP to U.S. GAAP Reconciliation (unaudited)
(thousands except per ounce costs) Three months ended September 30, 2013
Silver Gold
Total Palmarejo
San Bartolomé
Rochester Endeavor Total Kensington
Costs applicable to sales, including amortization (U.S. GAAP)
$100,314 $22,460 $20,458 $2,765 $145,997 $45,571 $191,568
Amortization 33,475 4,788 2,519 894 41,676 18,086 59,762
Costs applicable to sales 66,839 17,672 17,939 1,871 104,321 27,485 131,806
Silver equivalent ounces sold 4,894,600 1,334,066 1,133,525 185,505 7,547,696 --
Gold ounces sold -- -- -- -- -- 31,542
Costs applicable to sales per ounce $13.66 $13.25 $15.83 $10.09 $13.82 $871
Costs Applicable to Sales
(thousands except per ounce costs) Three months ended June 30, 2013
Silver Gold
Total Palmarejo
San Bartolomé
Rochester Endeavor Total Kensington
Costs applicable to sales, including amortization (U.S. GAAP)
$90,603 $37,639 $24,506 $2,903 $155,651 $43,313 $198,964
Amortization 35,384 4,825 1,990 1,220 43,419 13,159 56,578
Costs applicable to sales 55,219 32,814 22,516 1,682 112,232 30,154 142,386
Silver equivalent ounces sold 3,688,500 2,151,000 1,506,508 198,419 7,544,427 --
Gold ounces sold -- -- -- -- -- 24,439
Costs applicable to sales per ounce $14.97 $15.26 $14.95 $8.48 $14.88 $1,234
NYSE: CDE 28
Non-GAAP to U.S. GAAP Reconciliation (unaudited)
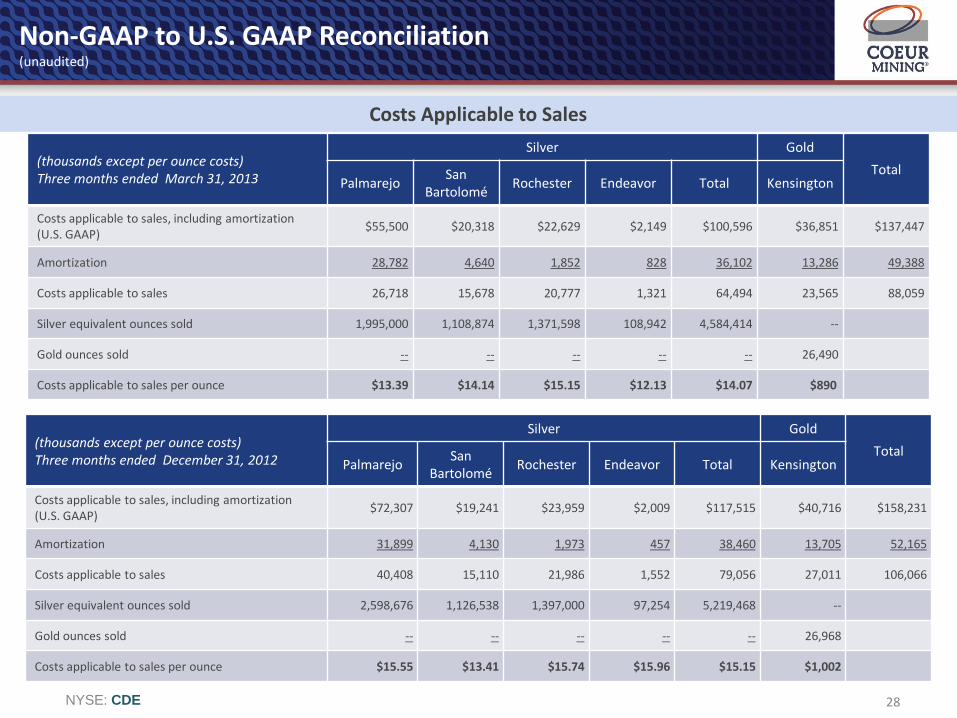
(thousands except per ounce costs) Three months ended March 31, 2013
Silver Gold
Total Palmarejo
San Bartolomé
Rochester Endeavor Total Kensington
Costs applicable to sales, including amortization (U.S. GAAP)
$55,500 $20,318 $22,629 $2,149 $100,596 $36,851 $137,447
Amortization 28,782 4,640 1,852 828 36,102 13,286 49,388
Costs applicable to sales 26,718 15,678 20,777 1,321 64,494 23,565 88,059
Silver equivalent ounces sold 1,995,000 1,108,874 1,371,598 108,942 4,584,414 --
Gold ounces sold -- -- -- -- -- 26,490
Costs applicable to sales per ounce $13.39 $14.14 $15.15 $12.13 $14.07 $890
Costs Applicable to Sales
(thousands except per ounce costs) Three months ended December 31, 2012
Silver Gold
Total Palmarejo
San Bartolomé
Rochester Endeavor Total Kensington
Costs applicable to sales, including amortization (U.S. GAAP)
$72,307 $19,241 $23,959 $2,009 $117,515 $40,716 $158,231
Amortization 31,899 4,130 1,973 457 38,460 13,705 52,165
Costs applicable to sales 40,408 15,110 21,986 1,552 79,056 27,011 106,066
Silver equivalent ounces sold 2,598,676 1,126,538 1,397,000 97,254 5,219,468 --
Gold ounces sold -- -- -- -- -- 26,968
Costs applicable to sales per ounce $15.55 $13.41 $15.74 $15.96 $15.15 $1,002

NYSE: CDE 29
Non-GAAP to U.S. GAAP Reconciliation (unaudited)
(thousands except per ounce costs) Three months ended September 30, 2012
Silver Gold
Total Palmarejo
San Bartolomé
Rochester Endeavor Total Kensington
Costs applicable to sales, including amortization (U.S. GAAP)
$82,515 $23,976 $22,150 $2,879 $131,519 $38,292 $169,811
Amortization 33,842 4,039 1,738 898 40,517 11,410 51,927
Costs applicable to sales 48,672 19,937 20,413 1,981 91,003 26,882 117,884
Silver equivalent ounces sold 3,544,520 1,526,081 1,246,027 146,385 6,463,014 --
Gold ounces sold -- -- -- -- -- 23,866
Costs applicable to sales per ounce $13.73 $13.06 $16.38 $13.53 $14.08 $1,126
Costs Applicable to Sales
(thousands except per ounce costs) Three months ended June 30, 2012
Silver Gold
Total Palmarejo
San Bartolomé
Rochester Endeavor Total Kensington
Costs applicable to sales, including amortization (U.S. GAAP)
$105,127 $26,721 $21,853 $4,145 $157,846 $25,725 $183,572
Amortization 42,589 3,949 1,743 1,592 49,872 9,619 59,491
Costs applicable to sales 62,538 22,773 20,110 2,552 107,974 16,106 124,080
Silver equivalent ounces sold 4,852,265 1,831,907 1,215,000 208,500 8,107,671 --
Gold ounces sold -- -- -- -- -- 14,268
Costs applicable to sales per ounce $12.89 $12.43 $16.55 $12.24 $13.32 $1,129
NYSE: CDE 30
Non-GAAP to U.S. GAAP Reconciliation (unaudited)
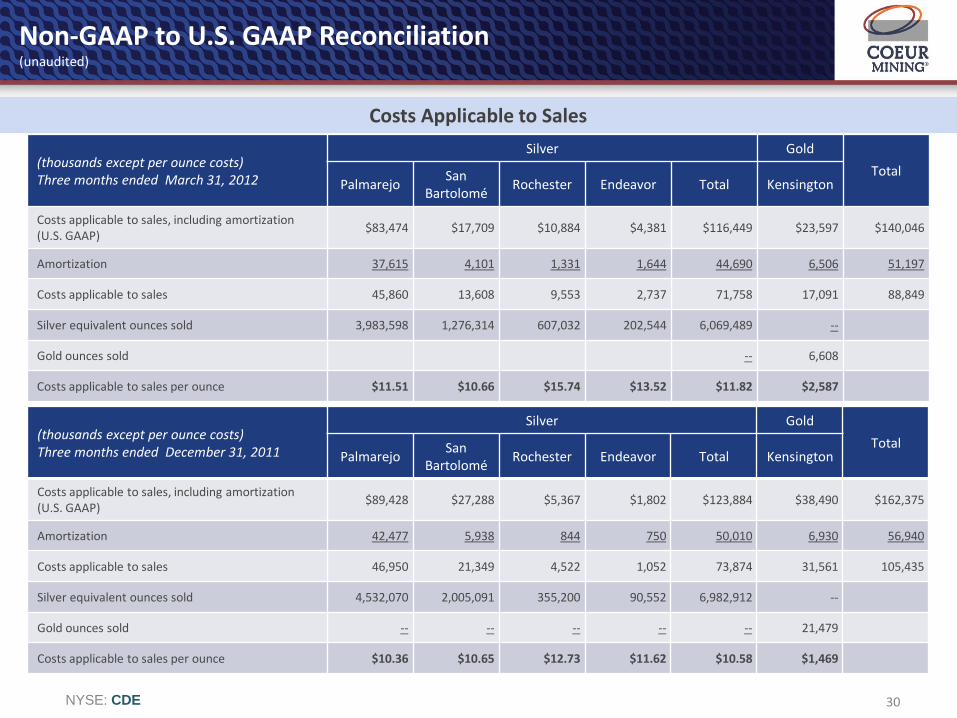
(thousands except per ounce costs) Three months ended March 31, 2012
Silver Gold
Total Palmarejo
San Bartolomé
Rochester Endeavor Total Kensington
Costs applicable to sales, including amortization (U.S. GAAP)
$83,474 $17,709 $10,884 $4,381 $116,449 $23,597 $140,046
Amortization 37,615 4,101 1,331 1,644 44,690 6,506 51,197
Costs applicable to sales 45,860 13,608 9,553 2,737 71,758 17,091 88,849
Silver equivalent ounces sold 3,983,598 1,276,314 607,032 202,544 6,069,489 --
Gold ounces sold -- 6,608
Costs applicable to sales per ounce $11.51 $10.66 $15.74 $13.52 $11.82 $2,587
Costs Applicable to Sales
(thousands except per ounce costs) Three months ended December 31, 2011
Silver Gold
Total Palmarejo
San Bartolomé
Rochester Endeavor Total Kensington
Costs applicable to sales, including amortization (U.S. GAAP)
$89,428 $27,288 $5,367 $1,802 $123,884 $38,490 $162,375
Amortization 42,477 5,938 844 750 50,010 6,930 56,940
Costs applicable to sales 46,950 21,349 4,522 1,052 73,874 31,561 105,435
Silver equivalent ounces sold 4,532,070 2,005,091 355,200 90,552 6,982,912 --
Gold ounces sold -- -- -- -- -- 21,479
Costs applicable to sales per ounce $10.36 $10.65 $12.73 $11.62 $10.58 $1,469

NYSE: CDE 31
Non-GAAP to U.S. GAAP Reconciliation (unaudited)
(thousands except per ounce costs) Three months ended September 30, 2011
Silver Gold
Total Palmarejo
San Bartolomé
Rochester Endeavor Total Kensington
Costs applicable to sales, including amortization (U.S. GAAP)
$105,125 $36,073 $11,367 $4,123 $156,688 $33,830 $190,518
Amortization 41,012 5,988 271 914 48,185 9,483 57,668
Costs applicable to sales 64,112 30,085 11,096 3,209 108,503 24,347 132,850
Silver equivalent ounces sold 4,975,976 2,652,642 483,141 149,566 8,261,325 --
Gold ounces sold -- -- -- -- -- 28,435
Costs applicable to sales per ounce $ 12.88 $11.34 $22.97 $21.46 $13.13 $856
Costs Applicable to Sales
(thousands except per ounce costs) Three months ended June 30, 2011
Silver Gold
Total Palmarejo
San Bartolomé
Rochester Endeavor Total Kensington
Costs applicable to sales, including amortization (U.S. GAAP)
$79,360 $19,232 $4,128 $4,138 $106,858 $22,651 $129,509
Amortization 41,591 5,106 287 865 47,849 9,806 57,655
Costs applicable to sales 37,769 14,126 3,841 3,273 59,009 12,845 71,854
Silver equivalent ounces sold 3,820,163 1,401,744 333,063 186,237 5,741,208 --
Gold ounces sold -- -- -- -- -- 19,000
Costs applicable to sales per ounce $9.89 $10.08 $11.53 $17.57 $10.28 $676

NYSE: CDE 32
Year-end 2013 Location Short tons Grade (oz/ton) Ounces (contained)
Silver Gold Silver Gold
Proven Reserves
Rochester Nevada, USA 132,188,000 0.53 0.004 69,915,000 551,000
Martha Argentina - - - - -
San Bartolomé Bolivia 1,206,000 2.87 - 3,456,000 -
Kensington Alaska, USA 309,000 - 0.269 - 83,000
Endeavor Australia 2,646,000 2.58 - 6,820,000 -
Palmarejo Mexico 5,100,000 3.68 0.050 18,762,000 256,000
Total Proven Reserves 141,449,000 98,953,000 893,000
Probable Reserves
Rochester Nevada, USA 55,046,000 0.57 0.002 31,454,000 130,000
Martha Argentina - - - - -
San Bartolomé Bolivia 39,700,000 2.52 - 100,072,000 -
Kensington Alaska, USA 5,707,000 - 0.144 - 819,000
Endeavor Australia 1,433,000 1.41 - 2,026,000 -
Palmarejo Mexico 6,135,000 3.73 0.051 22,891,000 313,000
Total Probable Reserves 108,021,000 156,443,000 1,262,000
Proven and Probable Reserves
Rochester Nevada, USA 187,234,000 0.54 0.004 101,369,000 681,000
Martha Argentina - - - - -
San Bartolomé Bolivia 40,906,000 2.53 - 103,528,000 -
Kensington Alaska, USA 6,016,000 - 0.150 - 902,000
Endeavor Australia 4,079,000 2.17 - 8,846,000 -
Palmarejo Mexico 11,235,000 3.71 0.051 41,653,000 569,000
Total Proven and Probable 249,470,000 255,396,000 2,152,000
Coeur’s Mineral Reserves 2013

NYSE: CDE 33
Year-end 2013
Location
Short tons
Grade (oz/ton) Ounces (contained)
Silver Gold Silver Gold
Measured Resources
Rochester Nevada, USA 66,190,000 0.45 0.003 29,860,000 186,000 Martha Argentina — — — — — San Bartolomé Bolivia — — — — — Kensington Alaska, USA 387,000 — 0.238 — 92,000 Endeavor Australia 6,724,000 2.33 — 15,690,000 — Palmarejo Mexico 4,507,000 6.27 0.095 28,238,000 429,000 Joaquin Argentina 5,865,000 4.62 0.003 27,106,000 19,000 La Preciosa Mexico 11,119,000 2.78 0.005 30,856,000 58,000
Total Measured Resources 94,792,000 131,750,000 784,000
Indicated Resources
Rochester Nevada, USA 75,532,000 0.42 0.004 31,893,000 268,000 Martha Argentina 57,000 13.60 0.018 775,000 1,000 San Bartolomé Bolivia 17,015,000 2.17 — 36,869,000 — Kensington Alaska, USA 2,299,000 — 0.206 — 474,000 Endeavor Australia 8,267,000 2.51 — 20,737,000 — Palmarejo Mexico 21,795,000 1.33 0.033 28,950,000 711,000 Joaquin Argentina 11,098,000 3.39 0.004 37,670,000 41,000 Lejano Argentina 1,233,000 2.42 0.008 2,983,000 10,000 La Preciosa Mexico 38,231,000 2.48 0.004 94,670,000 172,000
Total Indicated Resources 175,527,000 254,547,000 1,677,000
Measured and Indicated Resources
Rochester Nevada, USA 141,722,000 0.44 0.003 61,753,000 454,000 Martha Argentina 57,000 13.60 0.018 775,000 1,000 San Bartolomé Bolivia 17,015,000 2.17 — 36,869,000 — Kensington Alaska, USA 2,686,000 — 0.211 — 566,000 Endeavor Australia 14,991,000 2.43 — 36,427,000 — Palmarejo Mexico 26,302,000 2.17 0.043 57,188,000 1,140,000 Joaquin Argentina 16,963,000 3.82 0.004 64,776,000 60,000 Lejano Argentina 1,233,000 2.42 0.008 2,983,000 10,000 La Preciosa Mexico 49,350,000 2.54 0.005 125,526,000 230,000
Total Measured and Indicated 270,319,000 386,297,000 2,461,000
Coeur’s Measured and Indicated Mineral Resources 2013 (Excluding Reserves)
NYSE: CDE 34
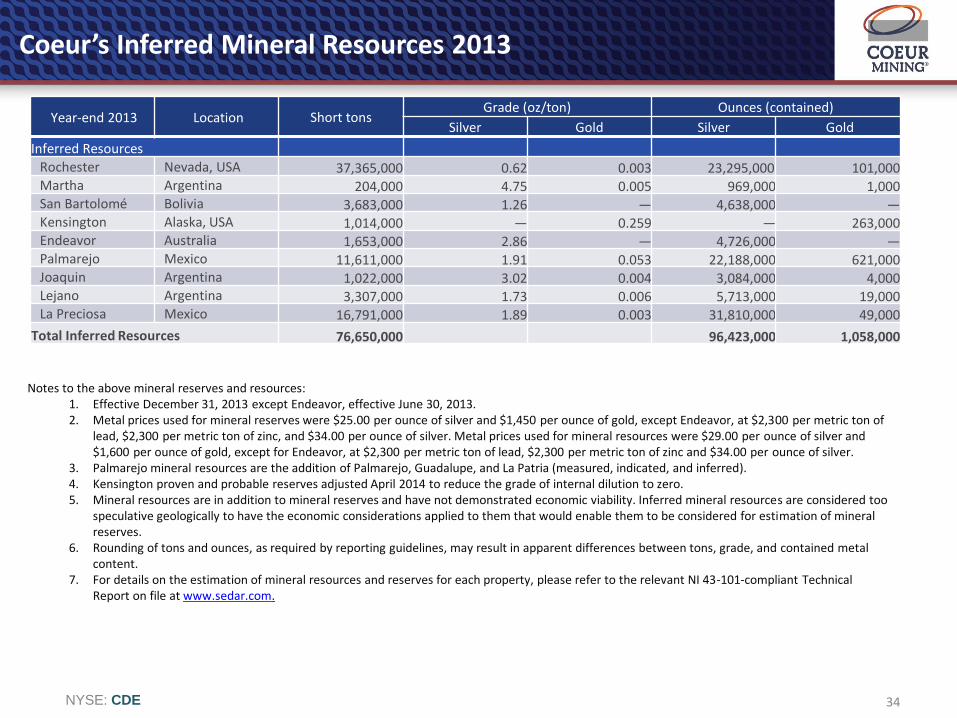
Year-end 2013 Location Short tons Grade (oz/ton) Ounces (contained)
Silver Gold Silver Gold
Inferred Resources
Rochester Nevada, USA 37,365,000 0.62 0.003 23,295,000 101,000 Martha Argentina 204,000 4.75 0.005 969,000 1,000 San Bartolomé Bolivia 3,683,000 1.26 — 4,638,000 — Kensington Alaska, USA 1,014,000 — 0.259 — 263,000 Endeavor Australia 1,653,000 2.86 — 4,726,000 — Palmarejo Mexico 11,611,000 1.91 0.053 22,188,000 621,000 Joaquin Argentina 1,022,000 3.02 0.004 3,084,000 4,000 Lejano Argentina 3,307,000 1.73 0.006 5,713,000 19,000 La Preciosa Mexico 16,791,000 1.89 0.003 31,810,000 49,000
Total Inferred Resources 76,650,000 96,423,000 1,058,000
Notes to the above mineral reserves and resources: 1. Effective December 31, 2013 except Endeavor, effective June 30, 2013. 2. Metal prices used for mineral reserves were $25.00 per ounce of silver and $1,450 per ounce of gold, except Endeavor, at $2,300 per metric ton of
lead, $2,300 per metric ton of zinc, and $34.00 per ounce of silver. Metal prices used for mineral resources were $29.00 per ounce of silver and $1,600 per ounce of gold, except for Endeavor, at $2,300 per metric ton of lead, $2,300 per metric ton of zinc and $34.00 per ounce of silver.
3. Palmarejo mineral resources are the addition of Palmarejo, Guadalupe, and La Patria (measured, indicated, and inferred). 4. Kensington proven and probable reserves adjusted April 2014 to reduce the grade of internal dilution to zero. 5. Mineral resources are in addition to mineral reserves and have not demonstrated economic viability. Inferred mineral resources are considered too
speculative geologically to have the economic considerations applied to them that would enable them to be considered for estimation of mineral reserves.
6. Rounding of tons and ounces, as required by reporting guidelines, may result in apparent differences between tons, grade, and contained metal content.
7. For details on the estimation of mineral resources and reserves for each property, please refer to the relevant NI 43-101-compliant Technical Report on file at www.sedar.com.
Coeur’s Inferred Mineral Resources 2013
35 NYSE: CDE
Leadership
Mitchell J. Krebs – President and Chief Executive Officer. Mr. Krebs joined Coeur in 1995 after spending several years in the investment banking industry in New York. Mr. Krebs has held various positions in the corporate development department, including Senior Vice President of Corporate Development. In March, 2008, Mr. Krebs was named Chief Financial Officer, a position he held until being appointed President and CEO in July 2011.
Peter C. Mitchell – Senior Vice President and Chief Financial Officer. Mr. Mitchell came to Coeur from Taseko Mines Limited where he served as Chief Financial Officer, leading Taseko's financial operations, including sourcing strategic capital to fund the company's strategic growth plan. Previously, Mr. Mitchell was involved in leading and managing growth in private equity portfolio companies through acquisitions, integrations and greenfield initiatives.
Frank L. Hanagarne, Jr. – Senior Vice President and Chief Operating Officer. Mr. Hanagarne was most recently Chief Operating Officer of Valcambi, SA, a precious metal refiner in Switzerland. Prior to his appointment as operations head of Valcambi in early 2011, Mr. Hanagarne was a Director of Corporate Development for Newmont Mining Corporation. Mr. Hanagarne's 17 years of service at Newmont has included positions of increasing responsibility within key areas of Newmont's operations and business functions as well as environmental, health and safety.
Joe Phillips – Senior Vice President and Chief Development Officer. Mr. Phillips has extensive experience in mine development and operations and has a proven record of leadership and team building resulting in successfully building mines on time and on budget. Mr. Phillips comes to Coeur from Silver Standard Resources where he served as Senior Vice President of Operations and Development and acting Chief Operating Officer. Prior to that, Mr. Phillips served as Senior Vice President of Project Development at Pan American Silver.
Humberto Rada – President, Coeur South America and of Coeur’s Bolivian subsidiary Empresa Minera Manquiri, S.A. Prior to joining Coeur in July 2008, Mr. Rada served as General Manager for Newmont Mining Corporation’s Bolivian company Inti Raymi. Mr. Rada is currently President of Bolivia’s National Mining Association and has over 23 years of experience in South American mining and finance.
Mike Harrison – Vice President, Business Development. Prior to joining Coeur, Mr. Harrison was Director of Investment Banking for the Mining Group at Cormark Securities in Toronto, Canada. In addition to seven years of investment banking experience, Mr. Harrison spent eight years in BHP Billiton's Global Exploration Group.
Keagan J. Kerr – Vice President, Human Resources and Communication. Mr. Kerr leads the organization in all aspects of human resource and corporate communication programs across Coeur’s operating regions-including employee and public relations, executive compensation, talent attraction, leadership development and strengthening of organization capability. He has a track record of accomplishment in large scale mining operations on multiple continents through various leadership roles with Barrick Gold Corporation.
Casey M. Nault – Vice President, General Counsel and Secretary. Mr. Nault has extensive experience as a corporate and securities lawyer, including prior in-house positions with Starbucks and Washington Mutual and law firm experience with Graham & Dunn in Seattle and Gibson, Dunn & Crutcher in Los Angeles. His experience includes securities compliance and SEC reporting, corporate governance, mergers and acquisitions, public and private securities offerings and other strategic transactions.
Hans Rasmussen – Vice President, Exploration. Mr. Rasmussen has 30 years of experience in the mining business, 16 years of which were with senior producers Newmont Mining and Kennecott/Rio Tinto; as well as serving as a consultant for senior producers such as BHP, Teck-Cominco and Quadra Mining. Since 2004, he has been an officer or served on the Board of Directors of several junior public exploration companies with gold and silver projects in Quebec, Nevada, Argentina, Chile, Colombia, Peru, and Bolivia.
Mark D. Kutcher – Managing Director, Coeur Capital, Inc. Mr. Kucher joined Coeur from the Global Royalty Corp. where he served as CEO, President and Director. Prior to that he was Executive Chairman, CEO, and President and Secretary of Battle Mountain Gold Exploration Corp, a company he founded in 2005. Mr. Kucher has years of experience in resource finance in investment banking, mergers and acquisitions, and merchant banking. He holds an MBA from University of Western Ontario.

36 NYSE: CDE
Robert E. Mellor – Former Chairman, Chief Executive Officer and President of Building Materials Holding Corporation (distribution, manufacturing and sales of building materials and component products) from 1997 to January 2010, director from 1991 to January 2010; member of the board of directors of The Ryland Group (national residential home builder) since 1999; member of the board of directors of Monro Muffler Brake, Inc. (auto service provider) since August 2010 and lead independent director since April 2011; and member of the board of directors of Stock Building Supply Holdings, Inc. (lumber and building materials distributor) since March 2010.
Mitchell J. Krebs – President and Chief Executive Officer. (See prior slide)
Linda L. Adamany – Member of the board of directors of Leucadia National Corporation, a diversified holding company engaged in a variety of businesses, since March 2014; member of the board of directors of AMEC, plc, an engineering, project management and consultancy company, since October 2012; member of the board of directors of National Grid plc, an electricity and gas generation, transmission and distribution company, from November 2006 to November 2012. Served at BP plc in several capacities from July 1980 until her retirement in August 2007, most recently from April 2005 to August 2007 as a member of the five-person Refining & Marketing Executive Committee responsible for overseeing the day-to-day operations and human resource management of BP plc's Refining & Marketing segment, a $45 billion business at the time.
Kevin S. Crutchfield –Chairman and Chief Executive Officer of Alpha Natural Resources, Inc. (NYSE:ANR). He has been with Alpha Natural Resources since its formation in 2003, serving as Executive Vice-President, President, Director, Chief Executive Officer and most recently the additional responsibility of Chairman. Mr. Crutchfield is a 25-year coal industry veteran with technical, operating and executive management experience and is currently the Vice Chairman of the National Mining Association and the American Coalition for Clean Coal Electricity.
Sebastian Edwards – Henry Ford II Professor of International Business Economics at the Anderson Graduate School of Management at the University of California, Los Angeles (UCLA) from 1996 to present; Chairman of the Inter American Seminar on Economics from 1987 to present; member of the Scientific Advisory Council of the Kiel Institute of World Economics in Germany from 2002 to present; and research associate at the National Bureau of Economic Research from 1981 to present.
Randolph E. Gress – Chairman, Chief Executive Officer, and Director of Innophos Holdings, Inc., a leading international producer of performance-critical and nutritional specialty ingredients for the food, beverage, dietary supplements, pharmaceutical and industrial end markets. Mr. Gress has been with Innophos since its formation in 2004 when Bain Capital purchased Rhodia SA's North American specialty phosphate business. Prior to his time at Innophos, Mr. Gress was with Rhodia since 1997 and held various positions including Global President of Specialty Phosphates (with two years based in the U.K.) and Vice-President and General Manager of the NA Sulfuric Acid and Regeneration businesses. From 1982 to 1997, Mr. Gress served in various roles at FMC Corporation including Corporate Strategy and various manufacturing, marketing, and supply chain positions.
John H. Robinson – Chairman of Hamilton Ventures LLC (consulting and investment) since founding the firm in 2006. Vice Chairman of Olsson Associates (engineering consultants) from 2004 to 2005. Chairman of EPCglobal Ltd. (professional engineering staffing) and Executive Director of MetiLinx Ltd. (software) from 2003 to 2004. Executive Director of Amey plc (business process outsourcing and construction) from 2000 to 2002.
J. Kenneth Thompson – President and Chief Executive Officer of Pacific Star Energy LLC (private energy investment firm in Alaska) from September 2000 to present, with a principal holding in Alaska Venture Capital Group LLC (private oil and gas exploration company) from December 2004 to present; Executive Vice President of ARCO’s Asia Pacific oil and gas operating companies in Alaska, California, Indonesia, China and Singapore from 1998 to 2000.
Board of Directors
37 NYSE: CDE
Head Office: Coeur Mining, Inc.
104 S. Michigan Ave, Suite 900 Chicago, Illinois 60603
Main Tel: (312) 489-5800
Stock Ticker: CDE: NYSE
Warrant Tickers: CDE.WS: NYSE; CDM.WT: TSX
Website: www.coeur.com
Bridget Freas Director, Investor Relations [email protected]
Contact Information
Donna Mirandola Director, Corporate Communications [email protected]