cigarette smoke promotes oral leukoplakia via regulating
TRANSCRIPT
ARTICLE OPEN
Cigarette smoke promotes oral leukoplakia via regulatingglutamine metabolism and M2 polarization of macrophageYanan Zhu1, Shuo Zhang1,2, Jiahui Sun 1,2, Tingting Wang3, Qin Liu1, Guanxi Wu1,2, Yajie Qian1,2, Weidong Yang1, Yong Wang1,2✉ andWenmei Wang1✉
Oral immunosuppression caused by smoking creates a microenvironment to promote the occurrence and development of oralmucosa precancerous lesions. This study aimed to investigate the role of metabolism and macrophage polarization in cigarette-promoting oral leukoplakia. The effects of cigarette smoke extract (CSE) on macrophage polarization and metabolism were studiedin vivo and in vitro. The polarity of macrophages was detected by flow cytometric analysis and qPCR. Liquid chromatography-massspectrometry (LC-MS) was used to perform a metabolomic analysis of Raw cells stimulated with CSE. Immunofluorescence and flowcytometry were used to detect the polarity of macrophages in the condition of glutamine abundance and deficiency. Cell CountingKit-8 (CCK-8), wound-healing assay, and Annexin V-FITC (fluorescein isothiocyanate)/PI (propidium iodide) double-staining flowcytometry were applied to detect the growth and transferability and apoptosis of Leuk-1 cells in the supernatant of Raw cells whichwere stimulated with CSE, glutamine abundance and deficiency. Hyperkeratosis and dysplasia of the epithelium were evident insmoking mice. M2 macrophages increased under CSE stimulation in vivo and in vitro. In total, 162 types of metabolites weredetected in the CSE group. The metabolites of nicotine, glutamate, arachidic acid, and arginine changed significantly. Thesignificant enrichment pathways were also selected, including nicotine addiction, glutamine and glutamate metabolism, andarginine biosynthesis. The results also showed that the supernatant of Raw cells stimulated by CSE could induce excessiveproliferation of Leuk-1 and inhibit apoptosis. Glutamine abundance can facilitate this process. Cigarette smoke promotes oralleukoplakia via regulating glutamine metabolism and macrophage M2 polarization.
International Journal of Oral Science (2021) 13:25 ; https://doi.org/10.1038/s41368-021-00128-2
INTRODUCTIONSmoking is a key risk factor for cancer, chronic obstructivepulmonary disease, and cardiovascular disease. Cigarette smokeproduced by smoking contains about 4 000 compounds, most ofwhich are harmful to humans, including carcinogens, mutagenicsubstances, and immunotoxin substances, which have detrimentaleffects on systemic and local immunity.1 Oral mucosa and gingivalepithelium are the first human tissues exposed to cigarette smokeand are directly affected by smoking. Smoking can promote thedevelopment of various oral diseases, such as oral leukoplakia(OLK), oral cancer, and periodontitis.2,3
Smoking is one of the essential epidemiological risk factorsrecognized by oral leukoplakia, and 80%–90% of OLK patientssmoke.4 Smoking increases the risk of oral leukoplakia and promotescancer formation, causing the occurrence of oral squamous cellcarcinoma.5 The prevalence of OLK is related to the number andduration of smoking, and there is a dose–effect relationship.6 Thesmoking period, the number of cigarettes smoked per day, and thesmoking manner all have an impact on the risk of OLK.7
However, the mechanism by which smoking promotes OLKpathogenesis is unclear. Biochemically and pathologically, there isstrong evidence for airway sensitization, hyperresponsiveness, andinflammation as a consequence of exposure to smoke particulate.8
Smoking is recognized to promote oral and respiratory infectionscaused by biological pathogens. The influence of smoking onimmunity is well recognized.9,10 Smoking impacts both innate andadaptive immunity and plays dual roles in regulating immunity byeither exacerbation of pathogenic immune responses or attenua-tion of defensive immunity.11 Pappas examined studies some ofwhich implied activation of innate response in animals withexposure to smoke, and some of which implied suppression ofinnate response.8 It was noted that innate response was indeedactivated with low initial exposures to either cigarette smoke ordiesel exhaust particulate, but that at high doses, the innateresponse was suppressed. Macrophages perform a variety offunctions like inflammatory and antimicrobial activity in hostdefense, resolution of inflammation and wound healing, andmaintenance of various homeostatic processes.12 It is suggestedthat the effects of smoking on innate immunity are related to thedose and duration of action. It incorporates the activation of M1innate response at a low dose but suppresses the M1 innateresponse at high-dose particle exposures.Abundant studies have shown that macrophage polarization
depends on the environment of human blood monocytes andmouse macrophages in vitro.13,14 Smoke stimulation affectsthe immune environment by affecting the polarization and
Received: 3 December 2020 Revised: 13 May 2021 Accepted: 30 May 2021
1Nanjing Stomatological Hospital, Medical School of Nanjing University, Nanjing, China; 2State Key Laboratory of Analytical Chemistry for Life Science & Jiangsu Key Laboratory ofMolecular Medicine, Medical School, Nanjing University, Nanjing, China and 3The State Key Laboratory of Pharmaceutical Biotechnology, Division of Immunology & Jiangsu KeyLaboratory of Molecular Medicine, Medical School, Nanjing University, Nanjing, ChinaCorrespondence: Yong Wang ([email protected]) or Wenmei Wang ([email protected])
www.nature.com/ijosInternational Journal of Oral Science
1234567890();,:

phagocytosis of macrophages. Research on the effects of smokingon macrophages has been ongoing. Two main macrophageactivation programs are called M1 and M2 polarization.15 Dataindicate that smoking does change the steady-state polarizationprogram in human alveolar macrophages. There is an overall anti-inflammatory gene expression pattern in the macrophage ofhealthy smokers. The inactivation of the M1 polarization pattern isaccompanied by the induction of abnormal phenotypes, char-acterized by the upregulation of genes associated with differentM2 polarization programs. Long-term smoking reprograms thesteady-state macrophage polarization to M1 inactivated, andpartially M2-activated macrophages, which enhances the ability oftissue remodeling but reduces the gene expression related toinflammation and immunity.16,17 Recently, many studies havefocused on the metabolic changes of immune cells, and externalstimuli are believed to reprogram the metabolism of immunecells, thereby affecting their immune function and differentiation,and subsequently producing many effects.18 Research showedthat different metabolic pathways are used to regulate macro-phage phenotypes. Its functional plasticity and macrophagepolarization are related to metabolism.19
Metabolic processes and their products play a critical regulatoryrole in the polarization of mature macrophages, and this localmicroenvironment and cells are often considered as interaction.Activation or polarization of macrophages by microenvironmentalcues can trigger distinct changes in their metabolic program. Thecross-talk between the intracellular signal cascades, metabolicpathways, and their metabolites in turn affect the transcriptionand epigenetic events, resulting in distinct functional states.20 Themanipulation of such metabolic pathways in these cells candramatically alter their specific immune functions, rather thansimply affecting energy generation or general biosynthesis.Different intracellular metabolic pathways regulate the polariza-tion and function of activated macrophages.Activation of macrophages to an M1 state by inflammatory
stimuli, like lipopolysaccharide (LPS) and interferon-γ (IFNγ), wasassociated with enhanced glycolysis and impaired tricarboxylic acid(TCA) cycle and mitochondrial oxidative phosphorylation (OXPHOS).Several recent studies demonstrate an integral role of glutamine
metabolism in M2 macrophages, rather than M1 macrophages. Jhaet al.21 showed glutamine metabolism as a characteristic feature ofM2 macrophages.In recent years, macrophage metabolic reprogramming has
attracted attention.22 However, how macrophage metabolism isregulated by the local microenvironment stimulated by cigarettesespecially for oral mucosa disease is still minimal which is worthyof further study.In this study, the effect of smoking on macrophage polarization
was verified in vitro and in vivo studies. The liquidchromatography-mass spectrometry (LC-MS) non-targeted meta-bolome analysis was used to screen the significantly differentmetabolites and enriched metabolic pathways of macrophage byCSE stimulation. We want to verify and explain that if cigarettesmoke induced glutamine metabolism and macrophage M2polarization to affect epithelial hyperplasia and influence theoccurrence and development of oral leukoplakia.
RESULTSSmoking promotes oral leukoplakia (OLK) of miceThe mice were given smoking and/or 4NQO (4-nitroquinolineN-oxide), respectively. It was found that after 16 weeks of oralsmoking, white streaks or plaques appeared on the tongue of themice, and tumors were developed in some mice. Most mice inthe 4NQO-drinking group showed obvious markings or evenmasses in the tongue tissues of which pathological examinationshowed epithelial hyperkeratosis and partial epithelial dysplasia.Meanwhile, the combination of smoke and 4NQO led to a higher
proportion of abnormal tongue tissues, compared with a singletreatment. Tongue tissues were further analyzed using hematox-ylin and eosin (H&E) staining (Fig. 1a). Compared with the controlgroup, leukoplakia and epithelial keratosis were significantlyincreased in the smoke group. The epithelium hyperplasia of theoral mucosal epithelium was severe in the 4NQO+ smoke group,compared with the single-treatment group. While nicotine andcotinine contents assessed by high-performance liquid chromato-graphy (HPLC) are shown in Fig. 1e. The nicotine and cotininelevels of the smoking mice increased significantly.
Smoking affects macrophage M2 polarizationIn the above animal model, the proportion of M2 macrophages(F4/80+CD206+ cells) was significantly higher in the smokinggroup than that in the non-smoking group (Fig. 1b). mRNAexpressions of genes associated with M2 macrophage function(Arg-1, IL-10) were also increased in the smoking group comparedwith the control group. Meanwhile, mRNA expressions of genesassociated with M2 macrophage function (iNOS and TNF-α) weresignificantly decreased in the smoking group (Fig. 1d). Immuno-histochemical analysis of Arg-1 in the oral mucosa epithelial tissueof the mice is shown in Fig. 1c.Raw cells were stimulated with CSE in vitro. Compared with the
control group, the proportion of M2 macrophages (F4/80+CD206+
cells) in the smoking group was significantly increased, while theproportion of M1 macrophages (F4/80+MHC-II+ cells) wasdecreased (Fig. 2a). Similarly, the mRNA levels of Arg-1 and IL-10were increased, while the mRNA levels of iNOS and TNF-a weredecreased in CSE-treated Raw cells (Fig. 2b).
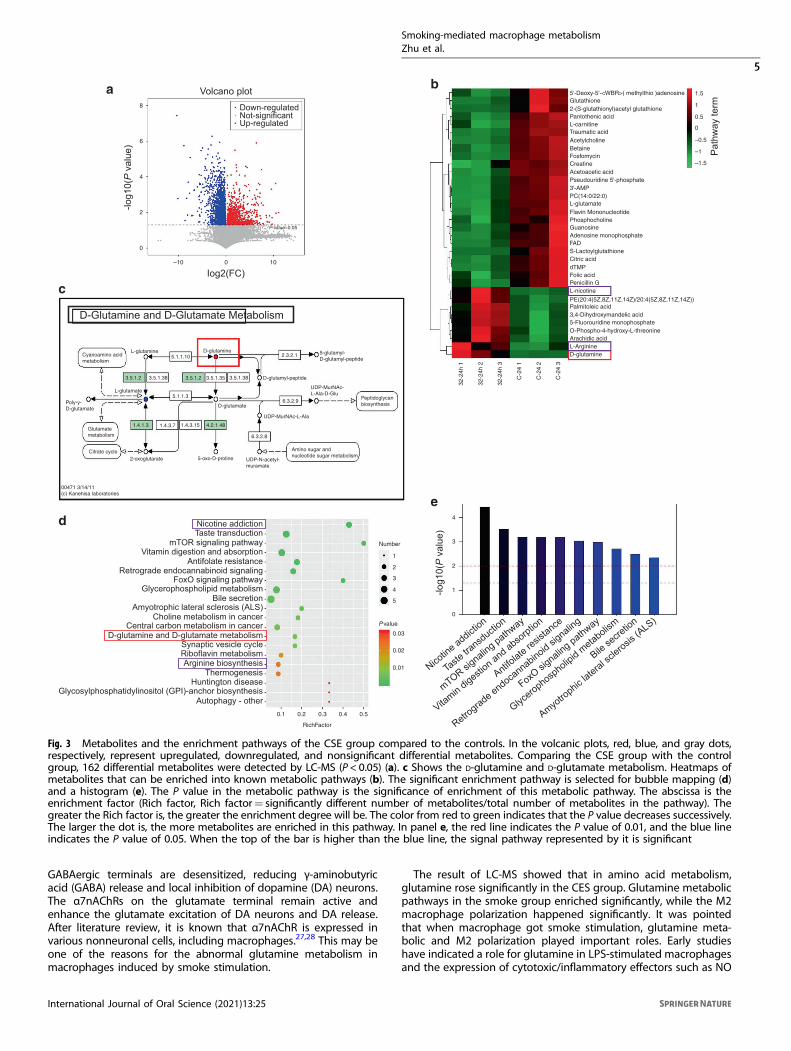
Smoking promotes glutamine metabolism of macrophagesThe results of non-targeted ultra-high-performance liquidchromatography-mass spectrometry (UPLC-MS), including differ-ential metabolites and enriched pathway terms are shown inFig. 3. The cells were cultured with 32% CSE for 24 h or Dulbecco’smodified eagle medium (DMEM) (the control group).Comparing the CSE group with the control group, 162
differential metabolites were detected by UPLC-MS (P < 0.05)(Fig. 3a). In the volcanic plots, red, blue, and gray dots,respectively, represent upregulated, downregulated, and non-significant differential metabolites.Heatmaps of metabolites that can be enriched into known
metabolic pathways (Fig. 3b). In the CSE group, we foundmetabolic increased in some organic heterocyclic compounds,such as L-nicotine, D-glutamate, arachidic acid, and L-arginine.According to the Kyoto Encyclopedia of Genes and Genomes
(KEGG) and UPLC-MS data, the significant enrichment pathway isselected for bubble mapping and a histogram (Fig. 3c-e). TheP value in the metabolic pathway is the significance of enrichmentof this metabolic pathway. The abscissa is the enrichment factor(Rich factor, Rich factor= significantly different number ofmetabolites/total number of metabolites in the pathway). Thegreater the Rich factor is, the greater the enrichment degree willbe. The color from red to green indicates that the P valuedecreases successively. The larger the dot is, the more metabolitesare enriched in this pathway. The enrichment analysis of differentmetabolites is helpful to understand the mechanism of metabolicpathways in different samples.In the CSE group, the pathways of nicotine addiction,
mammalian target of rapamycin (mTOR) signaling pathway,antifolate resistance, glycerophospholipid metabolism, cholinemetabolism in cancer, central carbon metabolism in cancer,D-glutamine and D-glutamate metabolism, synaptic vesicle cycle,and arginine biosynthesis significantly enriched (Fig. 3d, e).We further verified that in the animal model, the relative
expression of Slc1a5, Slc7a5, and Ogdh in the oral mucosa tissueof the smoking group was significantly increased (Fig. 4a). Similarresults of the relative expression of Slc1a5, Slc7a5, and Ogdh were
Smoking-mediated macrophage metabolismZhu et al.
2
International Journal of Oral Science (2021) 13:25

found in Raw cells stimulated with CSE (Fig. 4b). The glutamine,glutamate, and α-ketoglutarate (α-KG) contents inside macro-phages stimulated by CSE were increased (Fig. 4c).
Glutamine metabolism affects macrophage M2 polarizationTo investigate the role of glutamine metabolism in smoking-promoting macrophage polarization, we added glutamate in theDMEM for the glutamate abundance environment and used theDMEM culture without glutamate for the deprivation environment.Figure 5a, b shows the expression of F4/80+CD206+ cells byimmunofluorescence. Figure 5c, d shows the proportions of F4/80+
CD206+ cells by flow cytometry. The results showed that F4/80+CD206+ cells were significantly increased after CSE stimulationand glutamate abundance.
Glutamine metabolism promotes epithelial cell proliferationIn order to explore the role of glutamine metabolism in promotingmacrophage M2 polarization and inducing epithelial cell pro-liferation by cigarette smoking, we performed a wound-healing
assay to examine the migration ability of Leuk-1 cells under thesupernatant of Raw cells cultured with or without glutamate. Itwas found that cells with the Raw cell supernatant stimulated withCSE and glutamate were more active, while the supernatant ofRaw cells using glutamine-free medium was significantly lesseffective (Fig. 6b and S1). CCK-8 results are shown in Fig. 6a andthe apoptosis ratios are shown in Fig. 6c, d which were detectedby flow cytometry with Annexin V-FITC/PI double staining. Theabundance of glutamine significantly induced Leuk-1 cell viabilityand inhibited apoptosis rate in Leuk-1 cells compared withtreatment with CSE alone.
DISCUSSIONSmoking, as an important risk factor of OLK, has long been one ofthe concerns in the research field of the oral mucosa. There aremany studies on the direct effects of smoke stimulation onepithelial cells. However, few studies are on the effects of smokestimulation on the differentiation and function of oral local
100 Normal
Severe
Mild-moderatedysplasia
Epitheliumhyperplasia
80604020
0
Rat
io/%
Contro
l
Smoke
4NQO
4NQO+s
moke
Contro
l
Smoke
4NQO
4NQO+s
moke
Contro
l
Smoke
4NQO
4NQO+s
moke
Contro
l
Smoke
4NQO
4NQO+S
MOKE
Contro
l
Smoke
4NQO
4NQO+S
MOKE
Contro
l
Smoke
4NQO
4NQO+s
moke
Contro
l
Smoke
4NQO
4NQO+s
moke
Contro
l
Smoke4N
QO
4NQO+s
moke
Contro
l
Smoke4N
QO
4NQO+s
moke
4
3
2
1
0Pro
porti
on/%
IHC
sco
re o
f Arg
–1
0
5
10
15
M2 macrophages
1.5
1.0
0.5
0.0Nic
otin
e/(μ
g·g-1
)
1.5
1.0
0.5
0.0
1.5
1.0
0.5
0.0
1.5
2.0
1.0
0.5
0.0 Cot
inin
e/(μ
g·g-1
)
Rel
ativ
e m
RN
A le
vel
Rel
ativ
e m
RN
A le
vel
Rel
ativ
e m
RN
A le
vel
Rel
ativ
e m
RN
A le
vel
4 *
**
*** **
**
**
**
***
***
*** *
*****
**
Arg-1 IL-10 iNOSTNF-α
3
2
1
0
4
3
2
1
0
CD
206
FITC
F4/80 APC
100
100
101
101
102
F4-80 APC, CD206FITC subset 1.90
F4-80 APC, CD206FITC subset 3.08
F4-80 APC, CD206FITC subset 1.59
F4-80 APC, CD206FITC subset 4.52
102
103
103
104
100
101
102
103
104
100
101
102
103
104
100
101
102
103
104
104100 101 102 103 104 100 101 102 103 104100 101 102 103 104
a
b
c
de
Control Smoke 4NQO 4NQO+smoke
Fig. 1 The cigarette smoke promotes OLK development in the C57BL/6 J mice. The mice were fed water with 4NQO and got cigarette smoketwice a day. All Mice were sacrificed at week 16. a shows histological analysis of oral mucosa epithelial in four groups with hematoxylin andeosin staining. b shows a representative image of the frequency of M2 macrophages (F4/80+CD206+ cells) from tongue tissue. c showsimmunohistochemical analysis of Arg-1 in the oral mucosa epithelial tissue of the mice from the four groups. d Shows the relative mRNA levelof Arg-1, IL-10, iNOS, and TNF-α in the tongue tissue of the mice. e shows nicotine and cotinine contents in mice hair of the four groups. Errorbars, SEM. *P < 0.05, **P < 0.01, ***P < 0.001
Smoking-mediated macrophage metabolismZhu et al.
3
International Journal of Oral Science (2021) 13:25

immune cells. In this study, the results of animal models and cellexperiments in vitro showed that smoke promoted the differ-entiation and M2 polarization of macrophages in oral mucosa toaffect the dysplasia of epithelial cells indirectly.Macrophages, the mature form of the monocytes, play a
significant role in tissue homeostasis and immunity. Macrophagesare an important cell type that play a wide variety of roles invarious organ sites. Cigarette smoking is a major pathogenic factorin lung cancer. Macrophages play an important role in hostdefense and adaptive immunity. These cells display diversephenotypes for performing different functions. Exposure toparticulate induces both M1 and M2 polarization. The results ofthis research show M2 polarization is increased with exposure tosmoke, while the dose is the important consideration asmentioned in Pappa’s review.8 As M1 macrophages undergo M2polarization, fewer M1 macrophages are available. As fewer M1macrophages produce M1 proinflammatory cytokines, fewermonocytes are recruited from bone marrow to replace them, sopolarization is shifted to M2. It is not mean that M2 polarizationsuppresses M1 immune response nor the M1 tumor-suppressingactivity. M2 polarization is still an immune response in which theT2 activity of T cells promotes antibody production. Smokers oftenhave higher circulating IgE than nonsmokers and light smokers,indicating that sensitization is active, but often the atopic responseassociated with high IgE levels is suppressed as well. While at highparticle dose exposures, M2 immune response is also suppressed.Therefore, it is reasonable to expect that cigarette smoke promotesa M2-like phenotype with dose dependence.23
These effects are mediated through a few major pathwaysincluding the nuclear factor kappa-B (NF-κB), mitogen-activatedprotein kinase (MAPK), and Janus kinase and signal transducer andactivator of transcription (JAK/STAT) signaling pathways.5,24 It isshowed that in our study, the metabolism of macrophageschanges significantly when it gets the smoke stimulation. Thissuggests that metabolic reprogramming may be one of themechanisms for smoking to promote OLK.In this experiment, we performed two sample groups for the
metabolite detection by LC-MS, and metabolic effects of CSEstimulation on Raw cells were studied. Liquid chromatography-massspectrometry (LC-MS) has distinct advantages over other metabolicgrouping techniques.25 Ultra-high-pressure liquid chromatographyor ultra-high-performance liquid chromatography (UPLC) achievesbetter separation. In MS scanning, the tandem mass spectrometercan achieve rapid switching of high- and low-collision energy.Combined with mass spectrometry information analyzed byProgenesis QI v2.3, abundant metabolites can be detected.26
After CES stimulation, Raw cells had nicotine, cocaine, andmorphine substance dependence, and multiple metaboliteschanged in nicotine, cocaine, and morphine addiction, which wererelated to metabolite changes such as acetylcholine and glutamate.In the ventral tegmental area (VTA), alpha6-nicotinic acetylcholinereceptors and alpha4beta2-nicotinic acetylcholine receptors(α6nAChRs and α4β2nAChRs) inhibit DAergic neurons, whilealpha7-nicotinic acetylcholine receptors (α7nAChRs) enhance glu-tamate release and increases the excitability of DAergic neurons.After short-term nicotine exposure, α6nAChRs and α4β2nAChRs on
20
25
15
10
5
0
Pro
porti
on/%
20
M1
M2
15
10
5
0
Pro
porti
on/%
Contro
l
Control
** **
****
****
***
******
**
*
Control
4%CSE
32%CSE
IL-4
Contro
l
4%CSE
4%CSE
4%CSE
32%CSE
32%CSE
32%CSE
Control
4%CSE
32%CSE
Control
4%CSE
32%CSE
Control4%CSE
32%CSE
LPS
LPS
Control 4%CSE 32%CSE IL-4R
elat
ive
mR
NA
leve
l
4
6
2
03 h 24 h 3 h 24 h 3 h 24 h 3 h 24 hR
elat
ive
mR
NA
leve
l
4
6
8
10
2
0
1.5
2.0
1.0
0.5
0.0
1.5
2.0
2.5
1.0
0.5
0.0Rel
ativ
e m
RN
A le
vel
Rel
ativ
e ex
pres
sion
/%
100
100
2.54 13.5 24.7 20.0
17.65.463.552.15
101
101
102
102
103
103
104
100
101
102
103
104
100
101
102
103
104
100
101
102
103
104
100
101
102
103
104
100
101
102
103
104
100
101
102
103
104
100
101
102
103
104
104
100 101 102 103 104
100 101 102 103 104
100 101 102 103 104
100 101 102 103 104
100 101 102 103 104
100 101 102 103 104
100 101 102 103 104
CD
206
AP
CM
HC
-ll A
PC
F4-80 PE
F4-80 PE
Arg1 IL-10 iNOS TNF-α
a
b
Fig. 2 Raw cells stimulated by CSE showed significant M2 polarization. a shows a representative image of the frequency of M1 macrophages(F4/80+MHC-II+ cells) and M2 macrophages (F4/80+CD206+ cells). b shows cytokine expression levels in macrophages were assayed usingqPCR. Data represent one of two independent experiments. Error bars, SEM. *P < 0.05, **P < 0.01, ***P < 0.001
Smoking-mediated macrophage metabolismZhu et al.
4
International Journal of Oral Science (2021) 13:25
GABAergic terminals are desensitized, reducing γ-aminobutyricacid (GABA) release and local inhibition of dopamine (DA) neurons.The α7nAChRs on the glutamate terminal remain active andenhance the glutamate excitation of DA neurons and DA release.After literature review, it is known that α7nAChR is expressed invarious nonneuronal cells, including macrophages.27,28 This may beone of the reasons for the abnormal glutamine metabolism inmacrophages induced by smoke stimulation.
The result of LC-MS showed that in amino acid metabolism,glutamine rose significantly in the CES group. Glutamine metabolicpathways in the smoke group enriched significantly, while the M2macrophage polarization happened significantly. It was pointedthat when macrophage got smoke stimulation, glutamine meta-bolic and M2 polarization played important roles. Early studieshave indicated a role for glutamine in LPS-stimulated macrophagesand the expression of cytotoxic/inflammatory effectors such as NO
Down-regulated
Volcano plota b
de
c
8
6
4
-log1
0(P
val
ue)
P-value=0.05
-log1
0(P
val
ue)
2
0
–10 10
4
0.1 0.2 0.3
0.03
1.5
–1.5
0.5
–0.5
0
1
–1
1
Number
2
3
4
5
P value
0.02
0.01
0.4 0.5
RichFactor
3
2
1
0
Nicotin
e addiction
Taste
transd
uction
mTOR signaling pathway
FoxO sig
naling pathway
Glycerophosp
holipid metabolism
Bile secre
tion
Amyotro
phic lateral sc
lerosis (A
LS)
Retrograde endoca
nnabinoid signaling
Vitamin digestio
n and absorptio
n
Antifolate re
sistance
Nicotine addictionTaste transduction
mTOR signaling pathway
Pat
hway
term
FoxO signaling pathwayGlycerophospholipid metabolism
Glycosylphosphatidylinositol (GPI)-anchor biosynthesisAutophagy - other
Bile secretion
Choline metabolism in cancer
Synaptic vesicle cycle
Central carbon metabolism in cancerD-glutamine and D-glutamate metabolism
Riboflavin metabolismArginine biosynthesis
ThermogenesisHuntington disease
Amyotrophic lateral sclerosis (ALS)
Retrograde endocannabinoid signaling
Vitamin digestion and absorptionAntifolate resistance
0
Iog2(FC)
Up-regulatedNot-significant
5'-Deoxy-5'-<WBR>( methylthio )adenosineGlutathione2-(S-glutathionyl)acetyl glutathionePantothenic acidL-carnitineTraumatic acidAcetylcholineBetaineFosfomycinCreatineAcetoacetic acidPseudouridine 5'-phosphate3'-AMPPC(14:0/22:0)L-glutamateFlavin MononucleotidePhosphocholineGuanosineAdenosine monophosphateFADS-LactoylglutathioneCitric aciddTMPFolic acidPenicillin GL-nicotine
L-ArginineD-glutamine
C-2
4 3
C-2
4 2
C-2
4 1
32-2
4h 3
32-2
4h 2
32-2
4h 1
Arachidic acid
PE(20:4(5Z,8Z,11Z,14Z)/20:4(5Z,8Z,11Z,14Z))Palmitoleic acid3,4-Dihydroxymandelic acid5-Fluorouridine monophosphateO-Phospho-4-hydroxy-L-threonine
2.3.2.1
6.3.2.9
6.3.2.8
Amino sugar andnucleotide sugar metabolism
Peptidoglycanbiosynthesis
UDP-MurNAc-L-Ala-D-Glu
UDP-MurNAc-L-Ala
UDP-N-acetyl-muramate
L-glutamine 5-glutamyl-D-glutamyl-peptide
D-glutamyl-peptide
L-glutamate
D-glutamate
D-glutamine5.1.1.10
5.1.1.3Poly-y-D-glutamate
Glutamatemetabolism
Citrate cycle2-oxoglutarate
00471 3/14/11(c) Kanehisa laboratories
5-oxo-D-proline
3.5.1.2
1.4.1.3 1.4.3.7 1.4.3.15 4.2.1.48
3.5.1.38 3.5.1.2 3.5.1.35 3.5.1.38
Cyanoamino acidmetabolism
D-Glutamine and D-Glutamate Metabolism
Fig. 3 Metabolites and the enrichment pathways of the CSE group compared to the controls. In the volcanic plots, red, blue, and gray dots,respectively, represent upregulated, downregulated, and nonsignificant differential metabolites. Comparing the CSE group with the controlgroup, 162 differential metabolites were detected by LC-MS (P < 0.05) (a). c Shows the D-glutamine and D-glutamate metabolism. Heatmaps ofmetabolites that can be enriched into known metabolic pathways (b). The significant enrichment pathway is selected for bubble mapping (d)and a histogram (e). The P value in the metabolic pathway is the significance of enrichment of this metabolic pathway. The abscissa is theenrichment factor (Rich factor, Rich factor= significantly different number of metabolites/total number of metabolites in the pathway). Thegreater the Rich factor is, the greater the enrichment degree will be. The color from red to green indicates that the P value decreases successively.The larger the dot is, the more metabolites are enriched in this pathway. In panel e, the red line indicates the P value of 0.01, and the blue lineindicates the P value of 0.05. When the top of the bar is higher than the blue line, the signal pathway represented by it is significant
Smoking-mediated macrophage metabolismZhu et al.
5
International Journal of Oral Science (2021) 13:25

and IL-1β. In LPS-activated M1 macrophages, glutamine metabo-lism contributes to the increased generation of succinate viaanaplerosis (proceeding through α-ketoglutarate α-KG) andγ-aminobutyric acid (GABA) shunt.29 However, several recentstudies demonstrated an integral role of glutamine metabolismin M2 macrophages, rather than M1 macrophages.30,31 Glutaminemetabolism acted as a characteristic feature of M2 macrophages.They showed that almost a third of the carbons in the TCA cyclewere derived from glutamine.21 Functionally, deprivation ofglutamine or inhibition N-glycosylation decreased the expressionof several M2 markers like Il4i1 and CD206.Jha et al. characterized systemic changes during murine macro-
phage M1 and M2 polarization. Glutamine deprivation affects M2polarization but not M1 polarization.21 Glutamine deprivation showsa significant (50%) defect in M2 commitment in glutamine-deprivedmedia based on CD301-CD206. M2 polarization was found to activateglutamine catabolism and UDP-GlcNAc-associated modules. Corre-spondingly, glutamine deprivation or inhibition of N-glycosylationdecreased M2 polarization.At the same time, significant increases in arginine content were
found in both arginine and proline metabolism and argininebiosynthesis pathways. L-Arg in macrophages was regulated byiNOS and Arg-1, and iNOS can catalyze L-Arg to produce NO and L-citrulline. NO had a bactericidal effect of meeting the M1macrophage needs for anti-inflammatory and pathogen invasionresistance, and L-citrulline was used in the urea cycle.32 Inversely,Arg-1 catalyzed L-Arg to produce ornithine and urea ammoniaacid, promoting cell proliferation and collagen synthesis andworking for tissue repair and remodeling. High expression of Arg-1was detected in M2 macrophages.33 The qPCR and flow cytometryresults showed that M2 macrophages significantly increasedespecially under CSE stimulation, suggesting that amino acid
metabolism and product changes are involved in the smoke-stimulation mechanism.We found common changes in glutamate, arginine, and citric
acid in the arginine-proline synthesis pathway. metabolic changesin three glutamate derivatives were found in the glutaminemetabolic pathway. L-glutamate decreased and D-glutamineincreased in the D-glutamine and D-glutamic acid metabolism.The expression of glutamic acid and arginine changed under 32%-24 h CSE stimulation. The significant increase in argininemetabolism in the stimulation suggested tissue repairment.The mechanism of glutamine metabolism in the process of
macrophage M2 polarization induced by smoking is worthexploring. Glutamine metabolism is recognized to be associatedwith tumors. However, the role of glutamine metabolism insmoking promoting the precancerous lesions of oral mucosa isstill unknown.In this study, the result showed the expression of Slc1a5 and
Slc7a5 genes increased significantly in the CSE group. The uptakeof glutamine through the cytomembrane mainly relies ontranslocators, such as ASCT2 (system ASC amino acid array 2)and LAT1(L-type amino acid array 1).34,35
Slc1a5 and Slc7a5 are transcription genes of ASCT2 and LAT1.Microarray Data raised to elevated expression of ASCT2 (Slc1a5)and LAT1 (Slc7a5) in many cases, and this has been confirmed inmany studies and cell lines.36,37 ASCT2 high expression generallypredicts a poor prognosis in cancer patients.38–40
According to this study, smoke activates the glutaminetranslocators in macrophages, promotes the intracellular transportof glutamine, leads to the active metabolism of glutamine,changes the local immune metabolism microenvironment of theoral mucosa, and promotes abnormal cell proliferation andreduces cell apoptosis. The effects of glutamine abundance and
1.5
800
***
** * * *
*
*
*
***
***
***
***
***
600
400
200
0
50
25
20
15
10
5
0
100
0
150
Tongue of mice
Raw cells with CSE
Control
Control
Contro
l
32%CSE
32%CSE
4%CSE
Contro
l
32%CSE
4%CSE
Contro
l
32%CSE
4%CSE
Smoke
1.0
0.5
0.0
4
3
2
1
0
Slc1a5 Slc7a5 Gk Got2 Gpt Glud Ogdh
Slc1a5 Slc7a5 Gk Got2 Gpt Glud Ogdh
Rel
ativ
e ex
pres
sion
/%
Glu
tam
ine
leve
l/(μ
mol
·L-1
)G
luta
mat
e le
vel/
(μm
ol·L
-1)
α-K
G le
vel/
(μm
ol·L
-1)
Rel
ativ
e ex
pres
sion
/%
a
b
c
Fig. 4 The expression of glutamine after stimulating of cigarette smoke. Glutamine-related gene expression in tongue tissues and RAW cellsafter CSE stimulation are shown in panels a and b. In the CSE stimulation group, the relative expressions of genes Slc1a5, Slc7a5, and Ogdhwere significantly increased. c shows that the expression of glutamine, glutamate, and α-KG in the Raw cells under CSE stimulation weresignificantly increased. Error bars, SEM. *P < 0.05, **P < 0.01, ***P < 0.001
Smoking-mediated macrophage metabolismZhu et al.
6
International Journal of Oral Science (2021) 13:25

deficiency on macrophages and epithelial cells in this studyfurther confirm this inference.Therefore, it is concluded that in the process of smoke
cigarettes promoting OLK, glutamine metabolism and M2polarization of macrophage play important roles for regulatingoral mucosa immune microenvironment and epithelial dysplasiaand keratosis. Still, the specific mechanism involved may needmore experimental data to be fully depicted.
MATERIALS AND METHODSAnimal studiesAll animal studies were approved by the Animal Ethical and WelfareCommittee of Nanjing University (IACUC-2003136). Seven-week-oldC57BL/6J male mice purchased from Qinglongshan, Inc., Nanjing,China, received regular food and water before the experiment.4NQO powder was dissolved in ultra-pure water, the concentration
is 50 μg·mL−1. All mice were divided into two groups. An OLK modelgroup drunk 4NQO-dissolved water as daily drinking water for16 weeks and a negative control group drunk water. Half of themreceived air exposure and others exposed to cigarette smoke. Therewere four groups: (I) the control group; (II) the smoke group; (III) the4NQO group; and (IV) the 4NQO and smoke group (n= 10).Smoke was prepared, as previously described.41 Mice in the
smoke group smoked two cigarettes every day. All the micewere sacrificed after 16 weeks to get oral tissues. Some sampleswere stored at −80 °C for qPCR and flow cytometry, and otherswere embedded in paraffin for histological analysis by H&E stain.Histological scores were assessed by a pathologist. Nicotine andcotinine contents in mouse hair were detected by HPLC.
Cell lines and cell culturesRaw cells were obtained from the Shanghai Institute of CellBiology (Shanghai, China) and cultured with DMEM basic (1×)
F4/80
CD
206
FITC
F4/80 PE
CD206 DAPI Merge
Control
CSE
Gln+
Gln–
500
400
300
Cel
l num
bers
Pro
porti
on/%
200
100
0
Contro
lCSE
Gln+ Gln–
******
*****
**
104
104
103
103
102
102
101
101100
104
103
102
101
100
104
103
102
101
100
104
103
102
101
100
100
104103102101100
104103102101100
104103102101100
4.89
15.1
12.1
0.73
a
b d
c
Contro
lCSE
Gln+ Gln–
20
15
10
5
0
Fig. 5 F4/80+CD206+ Raw cells were significantly increased after CSE stimulation and Glnglutamate abundance. a, b show theimmunofluorescence of F4/80+CD206+ cells after CES stimulation or under glutamate abundance(Gln+) and deprivation(Gln−) environment.c, d show the representative image of frequency of F4/80+CD206+. Error bars, SEM. **P < 0.01, ***P < 0.001
Smoking-mediated macrophage metabolismZhu et al.
7
International Journal of Oral Science (2021) 13:25

(Gibco, Thermo Fisher Scientific) at 37 °C in 5% CO2 andhumidified air incubators.Leuk-1 cells, an immortalized human oral mucosal epithelial cell
line, were a generous gift from Professor Li Mao in the Departmentof Oncology and Diagnostic Sciences, University of MarylandDental School, Baltimore, MD, USA. Leuk-1 cells were cultured andpassaged in a defined keratinocyte serum-free medium (K-SFM)(Gibco, Invitrogen, Carlsbad, CA, USA).
CSE preparation3R4F Kentucky reference cigarettes were purchased from theTobacco Research Institute at the University of Kentucky (Lexington,KY, USA). CSE was prepared by a peristaltic pump where one 3R4Freference cigarette smoke was bubbled through 10mL ofkeratinocyte serum-free medium. Then the solution was filtered,diluted, and administered to cell cultures within 30min.
Metabolomic analysisSample preparation. Raw cells were supplemented with CSE (4%/32%). Samples were collected 3 h and 24 h later. We discarded themedium, added internal standard (2-chlor-1-phenylalanine,0.3mg·mL−1) and 1mL methanol: water (V:V= 4:1), and transformedsamples to a 4-mL glass vial where 200 μL trichloroethane wereadded. Sample extracts were centrifuged at 13 000 r·min−1, 4 °C for10min. In total, 400 μL methanol: water was added. Samplescentrifuged, the supernatants (150 μL) were collected, filtered, andtransferred to LC vials stored at −80 °C until metabolomic analysis.
UPLC-MS analysis. The metabolomics analysis was conductedusing UPLC-MS in ACQUITY I-Class system and VION Ion MobilitySpectrum Quadrupole Time-of-Flight mass spectrometer in bothpositive and negative modes (Waters Corporation, Milford, MA).Water and acetonitrile/methanol (V:V= 2:3) both containing 0.1%formic acid were used as mobile phases A and B. Linear gradient:0min, 1% B; 1min, 30% B; 2.5min, 60% B; 6.5min, 90% B; 8.5min,100% B; 10.7min, 100% B; 10.8min, 1% B and 13min, 1% B. Theflow rate was 0.4mL·min−1, and the column temperature was 45 °C.
We alternatively acquired data with full scan mode (m/z rangesfrom 50 to 1 000), which is combined with a mode including twoindependent scans with different collision energies (CE). A low-energy scan (CE 4 eV), and a high-energy scan (CE ranp 20–45 eV)were the parameters of mass spectrometry.Argon (99.999%) was used as collision-induced dissociation gas;
scan rate: 0.2 s/scan; capillary voltage, 1 kV (negative mode)/2 kV(positive mode); reference capillary voltage, 2.5 kV; cone voltage,40 V; source offset, 60 V; source temperature, 115 °C; desolvation gastemperature, 450 °C; desolvation gas flow, 900 L·h−1, and cone gasflow, 50 L·h−1 nitrogen (>99.5%) was employed as desolvation andcone gas. For lock mass correction, a 250 ng·mL−1 standard solutionof leucine-enkephalin in acetonitrile/water/formic acid (50: 49.9: 0.1,v/v/v) was continuously infused (5 μL·min−1) through the referenceprobe and scanned every 30 s.
Data preprocessing and statistical analysis. The raw data acquiredfrom LC-MS were analyzed by the progenesis QI software (WatersCorporation, Milford, USA). Supervised orthogonal partial leastsquares discriminant analysis (OPLS-DA) was performed tovisualize the alterations of metabolites between the groups.Metabolites were identified by the progenesis QI software
(Waters Corporation, Milford, USA) based on the HumanMetabolome Database (HMDB, http://www.hmdb.ca/), LIPIDMAPS database (http://www.lipidmaps.org/) and the self-builtdatabase of Shanghai Lu-Ming Biotech Co., Ltd (Shanghai, China).The differential metabolites were screened by the combinationof multidimensional analysis and unidimensional analysis. Thethresholds were set to variable important for the projection (VIP)obtained from the OPLS-DA > 1 and P value from a two-tailedStudent’s test <0.05.In order to identify the effect of disturbed metabolites on
metabolic pathways, pathway enrichment analysis for differentialmetabolites was performed using MBRole 2.0 (http://csbg.cnb.csic.es/mbrole2/) based on Kyoto Encyclopedia of Genes and Genomes(KEGG, http://www.genome.jp/KEGG/pathway.html). The pathwaywith P value <0.05 was identified as the significant pathway.
Q16.70
Q29.43
Q334.4
Q449.4
FL1-H :: annexin v FITC
100
100
FL1-H :: annexin v FITC FL1-H :: annexin v FITC FL1-H :: annexin v FITC
101
101
102
102
103
103
FL2-
H ::
PI P
E
FL2-
H ::
PI P
E
FL2-
H ::
PI P
E
FL2-
H ::
PI P
E
Q15.16
Q212.1
Q329.9
Q452.9
Q13.37
Q28.11
Q326.5
Q462.1
Q19.74
Q215.0
Q327.8
Q447.5
200
a
d
b c
******
******
***
***
**
****
Leuk-1 cells
150
100
100
80
60
40
20
0
20
15
10
5
0
Control
Control
CSE
CSE
Gln+
Gln+
Gln–
Gln–
Control
Control
CSE
CSE
Gln+
Gln+
Gln–
Gln–
Rat
io/%
Wou
nded
clo
sure
/%
Apo
ptos
is/%
50
03 h 12 h 24 h 3 h0 h 12 h 24 h
104
104 100 101 102 103 104 100 101 102 103 104 100 101 102 103 104100
101
102
103
104
100
101
102
103
104
100
101
102
103
104
Fig. 6 Raw cells were stimulated with or without CSE for 24 h. The supernatant of Raw cells taking four kinds of stimulations (control, CSE,glutamine abundance, and deprivation) was collected. The Leuk-1 cells were cultured in the supernatant of Raw. CCK-8 results are shown ina. Migration ability of Leuk-1 cells were analyzed using a wound-healing assay in the presence of Raw cells supernatant (b, Fig. S1). Theapoptosis ratios are shown in panels c and d which were detected by flow cytometry with Annexin V- FITC/PI double staining. Error bars, SEM.*P < 0.05, **P < 0.01, ***P < 0.001
Smoking-mediated macrophage metabolismZhu et al.
8
International Journal of Oral Science (2021) 13:25

RT-qPCRTotal RNAs of cells and tissues were extracted with Trizol Reagent(Invitrogen, Carlsbad, CA) and were reverse-transcribed into cDNAusing oligo (dT) primer. Step One Plus or an ABI Vii 7 detectionsystem (Applied Biosystems, Thermo Fisher Scientific, US) withSYBR Green PCR master mix solution was used for qPCR. Theprimers used are listed in Supplemental Table 1.
Flow cytometryRaw cells were washed and stained with fluorescent-conjugatedantibodies. Anti-mouse antibodies (Biolegend, San Diego, CA, US)were used: anti-F4/80 PE (#123110), anti-MHC-II APC (#107613),and anti-CD206 APC (#141708). FACS Calibur flow cytometer(Becton Dickinson, Franklin Lakes, NJ) detected cells. FlowJosoftware (Treestar, Inc., San Carlos, CA) analyzed the data.
ImmunofluorescenceCell samples in six-well plates were fixed with acetone for 15 minafter different treatments. Then, the samples were permeabilizedwith 0.3% Triton X-100 for 20 min, washed with PBS, and blockedwith PBS containing 3% bovine albumin (BSA) at 37 °C for 30 min.Subsequently, primary antibodies against CD206 and MHC II(diluted 1:1 000 in 3% BSA) were added and incubated at 4 °Covernight, and goat anti-rabbit FITC 488 (1:1 000; CST) and CY3554 (1:1 000; CST) were placed onto the coverslips and incubatedat 37 °C for 30 min. After washing in PBS, the cellular nuclei of eachsample were counterstained with diamidino phenylindole (DAPI).After staining, the samples were observed using a confocalfluorescence microscope (FV1000, Olympus, Tokyo, Japan).
Measurement of cell viabilityCell viability was measured by the Cell Counting Kit-8 (CCK-8)(Dojindo Laboratories, Kumamoto, Japan) assay. Leuk-1 cells at adensity of 3 000 cells per well were cultured in 96-well plates at37 °C and 5% CO2. Each well was treated with supernatant fromRaw cells under different stimulations (DMEM, DMEM+ CSE,DMEM+ 4 mmol·L−1 Gln, DMEM without Gln), for differentlengths of time (3 h, 12 h, 24 h) after cell adhesion. Then, thesupernatants were discarded, and 10 μL of CCK-8 solution wasadded to each well. After 2 h of incubation, the absorbance at awavelength of 450 nm was determined by using a multiplatereader (BioTek, CA, USA).
Wound-healing assayThe Raw cell supernatants stimulated by CSE (32%, 24 h) werecollected. The initial wound size of Leuk-1 cells was determinedimmediately after washing the cells. The supernatants of Raw cellswere added to the medium of Leuk-1 cells, including four groups(Control, CSE, Gln+ , Gln-). After 3, 12, and 24 h, the wound closurewas calculated as the percentage of the remaining wound area.
Glutamine colorimetric assayTo prepare the samples for the glutamine colorimetric assay kit(Abcam), tissue samples were washed in 1× PBS and re-suspendedin hydrolysis buffer on ice. Then, tissues were homogenized using ahomogenizer with about 15 passes, then centrifuged at 10 000 × g,4 °C for 10min. Deproteinization was performed on the super-natant, with the addition of ice-cold 4mol·L−1 PCA to a finalconcentration of 1 mol·L−1. Samples were vortexed briefly andincubated on ice for 5min, then centrifuged at 13 000 × g, 4 °C for2min. An equal volume of 2mol·L−1 KOH was added to thesupernatant and vortexed to adjust the pH to 6.5-8. Samples werecentrifuged at 13 000 × g, 4 °C for 5min. The supernatant fromsamples was transferred to newly, labeled tubes for glutamineassay. Briefly, 40mL of glutamine standard and diluted sampleswere added to a 96-well plate. In all, 2 mL of hydrolysis mix wasadded to glutamine standards and sample wells and incubated for30min at 37 °C 50ml of glutamine reaction mix was added to wells
and incubated for 60min at 37 °C. Absorbance was measured atOD-450 nm on a microplate reader (Synergy HT, BioTek).
Statistical analysisAll the experiment data of biochemical index were presented asmeans ± standard error of the mean (SEM). Statistical analysis ofthe experimental data was performed by Prism 8 (GraphPadSoftware). A two-tailed Student’s t test and paired t test were used.The significance threshold and extremely significance thresholdwere set at P value < 0.05 (*), P value < 0.01 (**), and P value< 0.001 (***), respectively.
DATA AVAILABILITYThe data that support the findings of this study are available from the correspondingauthor upon reasonable request.
ACKNOWLEDGEMENTSThis study was funded by the Natural Science Foundation of Jiangsu Province(BK20190134), Nanjing Medical Science and Technique Development Foundation(ZKX17033 & YKK18127), and the National Natural Scientific Foundation of China(81870767, 81971346, and 81771539).
AUTHOR CONTRIBUTIONSY.N.Z. and S.Z.: methodology, data curation, and writing-original draft; J.H.S. andQ.L.: writing-review & editing; G.X.W.: formal analysis, software; Y.J.Q. and W.D.Y.:revising the manuscript; T.T.W., Y.W. and W.M.W.: conceptualization, investigation,validation, methodology, and editing.
ADDITIONAL INFORMATIONSupplementary information The online version contains supplementary materialavailable at https://doi.org/10.1038/s41368-021-00128-2.
Competing interests: The authors declare no competing interests.
REFERENCES1. Feldman, C. & Anderson, R. Cigarette smoking and mechanisms of susceptibility
to infections of the respiratory tract and other organ systems. J. Infect. 67,169–184 (2013).
2. Chatzopoulos, G. Smoking, smokeless tobacco, and alcohol consumption ascontributing factors to periodontal disease. Northwest Dent. 95, 37–41 (2016).
3. Wyganowska-Swiatkowska, M. & Nohawica, M. M. Effect of tobacco smoking onhuman gingival and periodontal fibroblasts. A systematic review of literature.Przegl Lek. 72, 158–160 (2015).
4. Gumus, Z. H. et al. Effects of tobacco smoke on gene expression and cellularpathways in a cellular model of oral leukoplakia. Cancer Prev. Res. 1, 100–111(2008).
5. Sarkar, R., Das, A., Paul, R. R. & Barui, A. Cigarette smoking promotes cancer-related transformation of oral epithelial cells through activation of Wnt and MAPKpathway. Future Oncol. https://doi.org/10.2217/fon-2019-0338 (2019).
6. Souto, G. R., Matias, M. D. P., Nunes, L. F. M., Ferreira, R. C. & Mesquita, R. A. Maturedendritic cell density is affected by smoking habit, lesion size, and epithelialdysplasia in oral leukoplakia samples. Arch. Oral. Biol. 95, 51–57 (2018).
7. Netea, M. G. & Marodi, L. Innate immune mechanisms for recognition and uptakeof Candida species. Trends Immunol. 31, 346–353 (2010).
8. Pappas, R. S. Toxic elements in tobacco and in cigarette smoke: inflammation andsensitization. Metallomics 3, 1181–1198 (2011).
9. Qiu, F. et al. Impacts of cigarette smoking on immune responsiveness: up anddown or upside down? Oncotarget. 8, 268–284 (2017).
10. Lee, J., Taneja, V. & Vassallo, R. Cigarette smoking and inflammation: cellular andmolecular mechanisms. J. Dent. Res. 91, 142–149 (2012).
11. Arnson, Y., Shoenfeld, Y. & Amital, H. Effects of tobacco smoke on immunity,inflammation and autoimmunity. J. Autoimmun. 34, J258–J265 (2010).
12. O’Beirne, S. L. et al. Alveolar macrophage immunometabolism and lung functionimpairment in smoking and chronic obstructive pulmonary disease. Am. J. Respir.Crit. Care Med. 201, 735–739 (2020).
13. Huang, S. M. et al. High glucose environment induces M1 macrophage polarizationthat impairs keratinocyte migration via TNF-alpha: an important mechanism todelay the diabetic wound healing. J. Dermatol. Sci. 96, 159–167 (2019).
Smoking-mediated macrophage metabolismZhu et al.
9
International Journal of Oral Science (2021) 13:25

14. Zhu, X. et al. Micro-environment and intracellular metabolism modulation ofadipose tissue macrophage polarization in relation to chronic inflammatorydiseases. Diabetes Metab. Res. Rev. 34, e2993 (2018).
15. Yuan, F. et al. Induction of murine macrophage M2 polarization by cigarettesmoke extract via the JAK2/STAT3 pathway. PLoS ONE 9, e107063 (2014).
16. He, S., Xie, L., Lu, J. & Sun, S. Characteristics and potential role of M2 macrophagesin COPD. Int. J. Chron. Obstruct. Pulmon. Dis. 12, 3029–3039 (2017).
17. Leus, N. G. et al. HDAC1-3 inhibitor MS-275 enhances IL10 expression in Raw264.7macrophages and reduces cigarette smoke-induced airway inflammation in mice.Sci. Rep. 7, 45047 (2017).
18. Yang, D. C. & Chen, C. H. Cigarette smoking-mediated macrophage reprogram-ming: mechanistic insights and therapeutic implications. J. Nat. Sci. 4, e539 (2018).
19. Saha, S., Shalova, I. N. & Biswas, S. K. Metabolic regulation of macrophage phe-notype and function. Immunol. Rev. 280, 102–111 (2017).
20. O’Neill, L. A. & Pearce, E. J. Immunometabolism governs dendritic cell andmacrophage function. J. Exp. Med. 213, 15–23 (2016).
21. Jha, A. K. et al. Network integration of parallel metabolic and transcriptional datareveals metabolic modules that regulate macrophage polarization. Immunity 42,419–430 (2015).
22. Ouimet, M. et al. MicroRNA-33-dependent regulation of macrophage metabolismdirects immune cell polarization in atherosclerosis. J. Clin. Investig. 125,4334–4348 (2015).
23. da Silva, C. O. et al. Alteration of immunophenotype of human macrophages andmonocytes after exposure to cigarette smoke. Sci. Rep. 10, 12796 (2020).
24. Chen, Y. et al. Three Tiaobu Feishen therapies protect human alveolar epithelialcells against cigarette smoking and tumor necrosis factor–induced inflammationby nuclear factor-kappa B pathway. J. Tradit. Chin. Med. 39, 45–49 (2019).
25. King, A. M. et al. Development of a rapid profiling method for the analysis of polaranalytes in urine using HILIC-MS and ion mobility enabled HILIC-MS. Metabo-lomics 15, 17 (2019).
26. Nemet, I. et al. A cardiovascular disease-linked gut microbial metabolite acts viaadrenergic receptors. Cell 180, 862–877. e822 (2020).
27. Chen, W. Y. et al. Alpha 7-nicotinic acetylcholine receptor mediates the sensitivityof gastric cancer cells to 5-fluorouracil. Tumour Biol. 36, 9537–9544 (2015).
28. Truong, L. D., Trostel, J. & Garcia, G. E. Absence of nicotinic acetylcholine receptoralpha7 subunit amplifies inflammation and accelerates onset of fibrosis: aninflammatory kidney model. FASEB J. 29, 3558–3570 (2015).
29. Kelly, B. & O’Neill, L. A. Metabolic reprogramming in macrophages and dendriticcells in innate immunity. Cell Res. 25, 771–784 (2015).
30. Liu, M. et al. Dectin-1 activation by a natural product beta-glucan convertsimmunosuppressive macrophages into an M1-like phenotype. J. Immunol. 195,5055–5065 (2015).
31. Palmieri, E. M. et al. Pharmacologic or genetic targeting of glutamine synthetaseskews macrophages toward an M1-like phenotype and inhibits tumor metastasis.Cell Rep. 20, 1654–1666 (2017).
32. Sun, C. et al. The phenotype and functional alterations of macrophages inmice with hyperglycemia for long term. J. Cell. Physiol. 227, 1670–1679(2012).
33. Kimura, T. et al. Erratum: polarization of M2 macrophages requires Lamtor1 thatintegrates cytokine and amino-acid signals. Nat. Commun. 8, 14711 (2017).
34. Bhutia, Y. D., Babu, E., Ramachandran, S. & Ganapathy, V. Amino acid trans-porters in cancer and their relevance to “glutamine addiction”: novel targetsfor the design of a new class of anticancer drugs. Cancer Res. 75, 1782–1788(2015).
35. Fuchs, B. C. & Bode, B. P. Amino acid transporters ASCT2 and LAT1 in cancer:partners in crime? Semin Cancer Biol. 15, 254–266 (2005).
36. Scalise, M., Galluccio, M., Console, L., Pochini, L. & Indiveri, C. The human SLC7A5(LAT1): the intriguing histidine/large neutral amino acid transporter and itsrelevance to human health. Front. Chem. 6, 243 (2018).
37. Wang, Q. & Holst, J. L-type amino acid transport and cancer: targeting themTORC1 pathway to inhibit neoplasia. Am. J. Cancer Res. 5, 1281–1294(2015).
38. Hassanein, M. et al. Preclinical evaluation of 4-[18F]fluoroglutamine PET to assessASCT2 expression in lung cancer. Mol. Imaging Biol. 18, 18–23 (2016).
39. Honjo, H. et al. Clinicopathological significance of LAT1 and ASCT2 in patientswith surgically resected esophageal squamous cell carcinoma. J. Surg. Oncol. 113,381–389 (2016).
40. Suzuki, M., Toki, H., Furuya, A. & Ando, H. Establishment of monoclonal antibodiesagainst cell surface domains of ASCT2/SLC1A5 and their inhibition of glutamine-dependent tumor cell growth. Biochem Biophys. Res. Commun. 482, 651–657(2017).
41. Ye, P. et al. Long-term cigarette smoking suppresses NLRP3 inflammasomeactivation in oral mucosal epithelium and attenuates host defense against Can-dida albicans in a rat model. Biomed. Pharmacother. 113, 108597 (2019).
Open Access This article is licensed under a Creative CommonsAttribution 4.0 International License, which permits use, sharing,
adaptation, distribution and reproduction in anymedium or format, as long as you giveappropriate credit to the original author(s) and the source, provide a link to the CreativeCommons license, and indicate if changes were made. The images or other third partymaterial in this article are included in the article’s Creative Commons license, unlessindicated otherwise in a credit line to the material. If material is not included in thearticle’s Creative Commons license and your intended use is not permitted by statutoryregulation or exceeds the permitted use, you will need to obtain permission directlyfrom the copyright holder. To view a copy of this license, visit http://creativecommons.org/licenses/by/4.0/.
© The Author(s) 2021
Smoking-mediated macrophage metabolismZhu et al.
10
International Journal of Oral Science (2021) 13:25