circularity of the genetic map of bacteriophage t4… · circularity of the genetic map of...
TRANSCRIPT

CIRCULARITY OF THE GENETIC MAP OF BACTERIOPHAGE T4’,2
HENRIETTE M. FOSS AND FRANKLIN W. STAHL
Department of Biology and Instilute of Molecular Biology, Uniuersity of Oregon, Eugene, Oregon
Received July 2, 1963
ENETIC recombination in bacteriophage is usually studied by means of the “standard cross.” In such a cross a bacterial culture is infected with phage
of complementary genotype, say ab and a f b f , where a and b represent any two markers. The average number of phage absorbed per cell is greater than one, and equal for the two types. After a period of incubation the bacteria lyse, releasing four kinds of phage; most particles (the parental types) are of the same genotype as the parents, but some (the recombinants) carry the genetic markers in a new combination and have the genotype a+ b or ab+. The frequency of recombinants is a characteristic of the particular marker pair.
By determining the percentage of recombinants in the lysates from many different crosses, it is possible to arrange the markers on a linear genetic map, where the map distance between any pair of markers is a function of the fre- quency of recombinants which they produce.
Ideas concerning the mode of the interactions among phage chromosomes which lead to the production of recombinants fall into two classes. One class of ideas supposes that the “pool” of DNA from which mature particles are con- structed is composed of fragments which undergo repetitive rejoinings and frag- mentations at new places. Complete chromosomes, when (if?) they arise, can be condensed and matured. This notion may be correct, but as a framework for thought, it has not yet been formulated in a fashion which has proven useful.
The other class of ideas, initially formulated by VISCONTI and DELBRUCK (1 953) specifically hypothesizes that fragments of phage chromosomes do not have an independent existence during the recombination and duplication proc- esses within the host cell. In particular, their formulation assumed that intact chromosomes “synapse” (mate) pairwise and at random with respect to the markers carried. Exchange then occurs at one or more places along the synapsed chromosomes.
Unfortunately, in a phage cross it is impossible to study the result of a single mating between two phages. In a cell infected with phages of different genotypes, even many of the first particles to mature have already mated several times with different phages (VISCONTI and DELBRUCK 1953). A phage cross then differs in two important respects from a cross in higher organisms-( 1) in a phage cross
From a thesis submitted by H. M. Foss in partial fulfillment of Ph.D. requirements. 2 Supported in part by a research grant to FWS from the National Science Foundation and
by a Public Health Service Training Grant to the Institute of Molecular Biology.
Genetics 48: 1659-1672 December 1963.

1660 H. M. FOSS A N D F. W. STAHL
the particles have undergone repeated interactions, and (2) not all particles have undergone the same number of interactions. Let us consider how each of these points affects the frequency of recombinants in the population. If we assume that matings between phages are random with respect to genotype, the percent- age of phages recombinant for a given pair of markers changes as a function of the number of matings that have taken place. The recombinant frequency in- creases from zero, when the average number of matings per chromosome is zero, to a maximum equilibrium value of no higher than 50 percent. The important consequence of repeated interactions then is that, no matter how closely two markers stay linked in an elementary mating act, they can be essentially ran- domized in the population by repeated interactions. Note also that, no matter how far two markers are apart, the percentage of recombinants can never exceed 50 percent. In fact, the equilibrium recombinant frequency for “unlinked” mark- ers must be less than 50 percent since not all particles happen to mate with phages of opposite genotype. The number of such particles is enhanced by two sources of heterogeneity in mating experience. (1) Because the infecting phages are randomly distributed among the bacteria, many cells are infected with more phages of one genotype than of the other. In such cells the average number of in- teractions between phages of opposite genotype is necessarily lower than in cells infected with equal numbers of each genotype. I t can be calculated (LENNOX, LEVINTHAL, and SMITH 1953) that recombinant frequencies are consequently depressed about 10 percent when the total multiplicity of infection is 14 particles per cell. (2) Among particles that mature early, the average number of matings per particles appears to be small. Thus a number of these phages have undergone no matings with particles of opposite genotype and must necessarily contribute to the fraction of parental phage in the lysate. The maximum equilibrium value for the percentage of recombinants is depressed a few percent more by this “spread in maturation.’’
It is clear then that only markers yielding substantially less than 40 percent recombinants in a standard cross can be conveniently mapped with respect to each other. In 1953, DOERMANN and HILL found three linkage groups of markers. Within each linkage group the markers are clearly linked to each other, but crosses between markers of different linkage groups yield more than 35 percent recombinants. These data suggest that either the groups are not linked to each other or they are distantly linked.
In order to distinguish between these possibilities STREISINGER and BRUCE (1960) performed a series of three-factor crosses of the type abc by a+b+c+, where a and b are known to be linked and the linkage and position of c is to be determined. The crosses were done in pairs. Cross I had a greater input of the abc parent; in Cross I1 the input ratio was reversed and the a+b+c+ parent was in the majority. Within the recombinant class ab+, they examined the frequency of occurrence of the c allele contributed by the minority parent. If c were not linked to a and b this frequency should be the same in both crosses. If, however, c is linked to the right of a and b the frequency of the c allele from the minority parent in the recombinant class ab+ would initially be greater in Cross I than in

THE GENETIC MAP OF T4 1661
Cross 11. If c were linked to the left of a and b, the frequencies would be reversed. After many matings, the frequencies of the c allele from the minority parent in the ab+ class tend toward the same equilibrium values in both crosses, but by lysing the cells prematurely STREISINGER and BRUCE could observe a difference between the two crosses. Their results indicated that the genetic map of T4 is continuous, consisting of the three linkage groups arranged end to end.
Using the same technique, STREISINGER, EDGAR, and HARRAR (in press) showed distant markers to be linked to each other both to the right and to the left, thus indicating that the map is circular. These results are in agreement with the find- ings of R. EPSTEIN (in press) and EDGAR (in press) that many amber mutants and temperature mutants have positions on the map between two of the three original linkage groups.
The map of T4 is a graphical representation of pooled data from many experi- ments performed in several laboratories, and mutant derivatives used in the crosses have been propagated separately for various periods of time. M. DEL- BRUCK has suggested (personal communication) that the circularity of the map may reflect relationships among the strains rather than being an intrinsic prop- erty of any single phage cross. In particular, a genetic inversion or translocation may have arisen in one of the ancestral stocks and been disseminated throughout some of the other strains. If a genealogy of all the T4 strains employed were available, it might suffice to dispel this concern. However, such a genealogy would be laborious to construct and furthermore might prove inadequate when com- pleted. The experiments to be described here were undertaken in the hope that circularity could be demonstrated by a single four-factor cross. Such a result would diminish the likelihood of a trivial explanation for the circular map of T4.
Through a completely independent approach, experiments with phage inacti- vated by decay of incorporated P32 or by X-irradiation have suggested the circu- larity of the T4 map (STAHL 1956). By performing cross reactivation experi- ments, STAHL studied the pattern in which markers from inactivated phage are “knocked out.’’ It will be useful here to briefly review these experiments.
Bacteria are infected with two kinds of phage: Inactivated standard phage at an average multiplicity of 0.2 per cell, and live phage of the genotype abc at a multiplicity of 2 to 3 per cell. (The markers a, b, and c are “unlinked” in the sense that they yield 35 percent or more recombinants in a standard cross). Before lysis, the infected cells are diluted and distributed over a large number of tubes, such that approximately two out of every ten tubes receive an infected cell which produces phage carrying one or more markers from the inactivated parent. After lysis, the contents of each tube are plated and those plates which show at least one marker from the radioactive parent are further examined. It should be recalled that inactivated phage particles, though unable to produce mature offspring in a single infection, can contribute markers to the progeny when they grow in the presence of rescuing phage that supply the functions necessary for phage development (STENT 1953; STAHL 1956). The number of markers contributed by an inactivated phage particle decreases with dose (num- ber of lethal P3*-decays per particle).
1662 H. M. FOSS AND F. W. STAHL
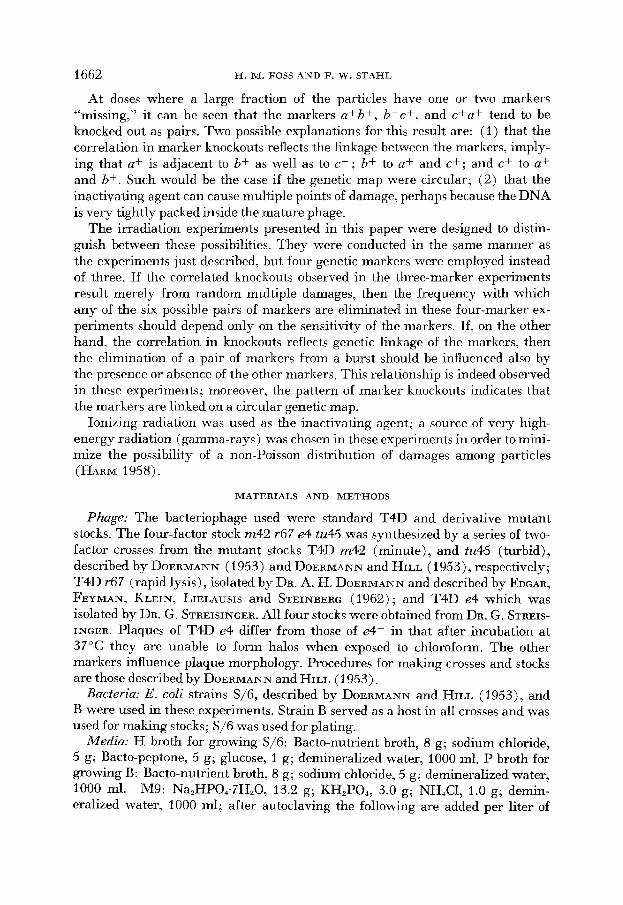
At doses where a large fraction of the particles have one or two markers "missing," it can be seen that the markers a+b+, b+c+, and c+a+ tend to be knocked out as pairs. Two possible explanations for this result are: (1) that the correlation in marker knockouts reflects the linkage between the markers, imply- ing that a+ is adjacent to b+ as well as to c+ ; b+ to a+ and c+; and c+ to a+ and b+. Such would be the case if the genetic map were circular; (2) that the inactivating agent can cause multiple points of damage, perhaps because the DNA is very tightly packed inside the mature phage.
The irradiation experiments presented in this paper were designed to distin- guish between these possibilities. They were conducted in the same manner as the experiments just described, but four genetic markers were employed instead of three. If the correlated knockouts observed in the three-marker experiments result merely from random multiple damages, then the frequency with which any of the six possible pairs of markers are eliminated in these four-marker ex- periments should depend only on the sensitivity of the markers. If, on the other hand, the correlation in knockouts reflects genetic linkage of the markers, then the elimination of a pair of markers from a burst should be influenced also by the presence or absence of the other markers. This relationship is indeed observed in these experiments; moreover, the pattern of marker knockouts indicates that the markers are linked on a circular genetic map.
Ionizing radiation was used as the inactivating agent; a source of very high- energy radiation (gamma-rays) was chosen in these experiments in order to mini- mize the possibility of a non-Poisson distribution of damages among particles (HARM 1958).
MATERIALS A N D METHODS
Phage: The bacteriophage used were standard T4D and derivative mutant stocks. The four-factor stock m42 r67 e4 tu45 was synthesized by a series of two- factor crosses from the mutant stocks T4D m42 (minute), and tu45 (turbid), described by DOERMANN (1953) and DOERMANN and HILL (1953), respectively; T4D r67 (rapid lysis), isolated by DR. A. H. DOERMANN and described by EDGAR, FEYMAN, KLEIN, LIELAUSIS and STEINBERG (1962); and T4D e4 which was isolated by DR. G. STREISINGER. All four stocks were obtained from DR. G. STREIS- INGER. Plaques of T4D e4 differ from those of e4+ in that after incubation at 37°C they are unable to form halos when exposed to chloroform. The other markers influence plaque morphology. Procedures for making crosses and stocks are those described by DOERMANN and HILL (1953).
Bacteria: E. coli strains S/6, described by DOERMANN and HILL (1953), and B were used in these experiments. Strain B served as a host in all crosses and was used for making stocks; SJ6 was used for plating.
Media: H broth for growing S/6: Bacto-nutrient broth, 8 g; sodium chloride, 5 g; Bacto-peptone, 5 g; glucose, 1 g; demineralized water, 1000 ml. P broth for growing B: Bacto-nutrient broth, 8 g; sodium chloride, 5 g; demineralized water, 1000 ml. M9: Na2HP0,.7H,0, 13.2 g; KH,PO,, 3.0 g; NH,Cl, 1.0 g; demin- eralized water, 1000 ml; after autoclaving the following are added per liter of

THE GENETIC M A P OF T4 1663
M9: 1 M magnesium sulfate, 1.0 ml; 25 percent sodium chloride, 2.0 ml; 10 per- cent glucose, 10.0 ml; 0.5 M calcium chloride, 0.2 ml; 0.01 M ferric chloride, 0.3 ml; if the solution is used as a medium for making phage stocks, the follow- ing are also added (per liter of M9) just prior to adding phage: 0.2 percent trypto- phan, 10.0 ml; 0.1 percent gelatin, 10.0 ml. Bottom agar: glucose, 1.3 g; sodium citrate, 0.4 g; sodium chloride, 8 g; Bacto-tryptone, 13 g; Bacto-agar, 14 g; de- mineralized water, 1000 ml; the plates contain at least 40 ml per 10 cm dish, and are allowed to stand overnight at room temperature before being used. Top agar: glucose, 3 g; sodium citrate, 2 g; sodium chloride, 8 g; Bacto-tryptone, 10 g; Bacto-agar, 6 g; demineralized water, 1000 ml.
Scoring genotypes from the lysate of the four-factor cross: Plating bacteria were prepared by growing S/6 in H broth to a concentration of 1-2 x IO8 cells/ ml. The cells were then centrifuged and concentrated to 2 x 10g/ml. by resus- pension in iced H broth. One-tenth ml of this suspension was used per plate.
The phage were allowed to adsorb to plating bacteria for 5 to 15 minutes at 37°C before being plated. After a 20 to 24 hour incubation period at 30"C, the plates were further incubated at 37" for 2 hours, long enough to destroy the de- fective lysozyme made by e-mutant phage. A photograph was then made of each plate providing a record for each plaque of its position and genotype with respect to the morphology markers. In order to score the lysozyme characteristic, 1 ml of chloroform was poured into the lid of each plate, and the plate was inverted and vented with a strip of aluminum foil ( STREISINGER, MUKAI, DREYER, MILLER and HORIUCHI 1961). After 2 to 6 hours at room temperature, large turbid halos would form around the e+ plaques, while the e plaques would have either no halos or small, clearer ones.
Zrradiation of phage: A standard phage stock, grown in M9 and chosen for a low frequency of mutants, was centrifuged at 35,000 g for 1 hr at 4°C. The pellet was slowly resuspended in chilled, salt-free, 10 X concentrated P broth to make a final concentration of about 1 0l2 particles/ml. This suspension was placed in a Co60 gamma-ray source and 0.5 ml samples were removed every ten minutes. Each sample was diluted into 4.5 ml P broth. Figure 1 shows the survival of phage as a function of dose. The dose is expressed in time of irradiation as well as phage-lethal hits, where one hit is the dose required to reduce the fraction of phage capable of surviving in single infection to e-l.
Procedure for cross reactiuation is that described by STAHL (1956).
EXPERIMENTS
Experiments with unirradiated phage: It was hoped that the circularity of the genetic map might be detected with a four-factor cross using unirradiated phage. Since the percentage of recombination between the markers used is large, linkage was tested by a sensitive three-factor method, similar to that of STREISINGER and BRUCE ( 1960).
Cross I: A culture of E. coZi B was infected, in the presence of potassium cya- nide, with phage of the genotype m42 r67 tu45 e4 at a multiplicity of infection of

1664 H. M. FOSS A N D F. W. STAHL
FIGURE 1.-Survival of T4 as a function of dose of gamma-radiation.
13 per cell and with standard phage at a multiplicity of 15 per cell. After 5 min- utes, more than 99 percent of the particles had adsorbed, and the infected cells were diluted into fresh broth. At intervals, samples of the culture were diluted into broth saturated with chloroform to release any mature phage particles from the infected cells (S~CHAUD and KELLENBERGER 1956). The first sample which showed an increase in mature phage above the background of unadsorbed par- ticles was plated out, and the number of phage in each of the 16 progeny classes was scored. The average number of mature phage per infected cell in this sample was 0.3.
Cross ZZ: It was desirable to preserve the linkage between markers better by examining the progeny phage even earlier. This could be accomplished by reduc- ing the background of unadsorbed phage particles. Cross I1 was performed in essentially the same manner as Cross I except that, after 99 percent of the par- ticles had adsorbed, the infected cells were spun down and resuspended in fresh broth. This procedure reduced the background of unadsorbed phage by a factor of ten, so that the earliest sample that could be scored had an average of only 0.03 mature phage per infected cell. The multiplicity of infection for each of the two parents was 3.5 per bacterium.
The data, given in Table 1, show clear linkage between the markers e and tu; among the nonparental types they occur much more frequently in parental than in recombinant combination. The linkage with respect to e and tu of each of the other markers can now be tested. Among the recombinants for e and tu the num- ber of phage with m and with m+ are scored. If n were not linked to e and tu it should occur in parental combination with e as frequently as with tu. If m were linked and located to the left of e, then it should occur in parental combination with e more often than with tu; conversely, if m were linked and to the right of tu it should occur more frequently in parental combination with tu than with e.
In Tables 2a through 2d the linkage of each marker with respect to pairs of adjacent markers is tested and partial maps, deduced from each set of data, are
THE GENETIC MAP OF T4
TABLE 1
Frequencies with which the progeny from the cross m42r67tu45e4 by m+r+tu+e' fall into each of the possible classes of genotypes
1665
~
Number of progeny from the cross m42e4r67tu45 by standard type
Genotype Cross I Cross I1 Total
m e r t u m+e+r+tu+ m e r tu m e m r m tu r tu e tu r e m r tu m e r r e tu m e tu
2034 1811 113 45
101 18 22
118 1 1 35
113 20 38 50
134 104
3159 5877
116 35
110 36 27
118 7
34 110
7 36 28
152 75
5193 7688 229
80 21 1
54 49
236 18 69
223 27 74 78
286 179
Cross I was lysed when 0.3 mature phage were present per infected cell; Cross I1 was lysed at 0.03 mature phage per infected cell.
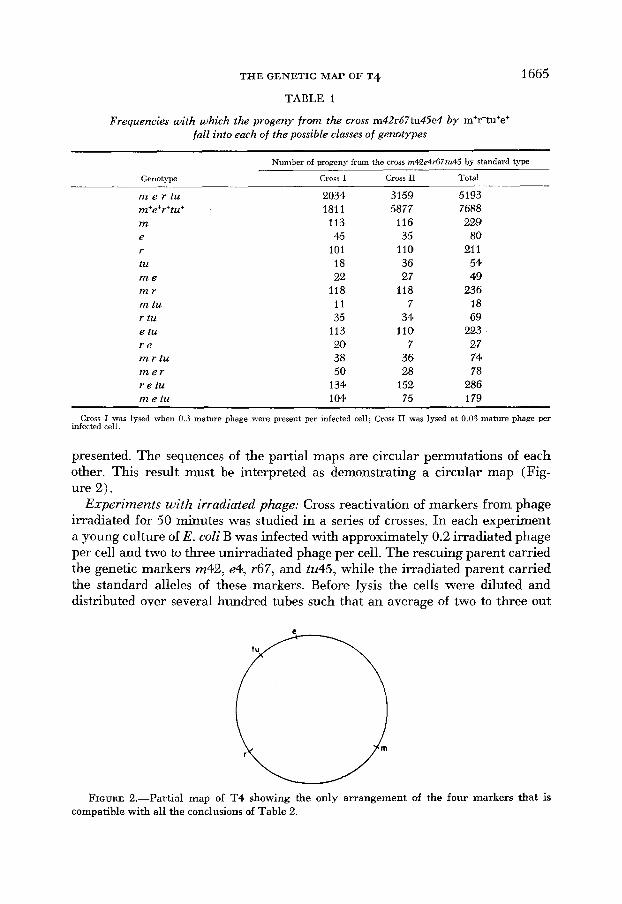
presented. The sequences of the partial maps are circular permutations of each other. This result must be interpreted as demonstrating a circular map (Fig- ure 2).
Experiments with irradiated phage: Cross reactivation of markers from phage irradiated for 50 minutes was studied in a series of crosses. In each experiment a young culture of E. coli B was infected with approximately 0.2 irradiated phage per cell and two to three unirradiated phage per cell. The rescuing parent carried the genetic markers m42, e4, r67, and tu45, while the irradiated parent carried the standard alleles of these markers. Before lysis the cells were diluted and distributed over several hundred tubes such that an average of two to three out
FIGURE 2.-Partial map of T4 showing the only arrangement of the four markers that is compatible with all the conclusions of Table 2.

1666 H. M. FOSS A N D F. W. STAHL
TABLE 2
a. Method for mapping the markers m and r with respect to e and tu
Number of phage, recombimnt for e and tu, that are Parental Parental Parental Parentai
for for for for m a n d e m a n d tu P' r a n d e r a n d tu P'
Cross I 125 114 0.50 (0.64) 99 140 <O.Ol (<O.Ol) (0.56) (0.80) t
(0.19) (<0.01) Cross I1 1 s 85 <O.Ol (0.01) 78 132 <0.01 (0.01)
Crosses I and I1 combined 250 199 0.02 (0.04.) 177 272 <0.01(<0.01)
(0.19) (0.13) Conclusions: m is to the left of e; r is to the right of tu;
the markers are linked in the order m e tu r.
b. Method for mapping the markers m and e with respect to tu and r
Number of phage, recombinant for tu and r , that are Parental Parental Parental Parental
for for for for m and tu m and r p: r and tu e and r p:
Cross I 236 299 <O.Ol(<O.Ol) 436 99 < O . O l ( < O . O l ) (0.31) (<0.01)
(<0.01) ( < O . O l )
(<0.01) ( <O.Ol)
cross I1 199 232 <0.01 (0.08) 413 78 <O.Ol ( < O . O l )
Crosses I and I1 combined 435 591 <O.Ol(<O.O1) 849 177 <0.01(<0.01)
Conclusions: m is to the right of r ; e is to the left of tu; the markers are linked in the order e tu r m.
c. Method for mapping the markers e and tu with respect to r and m
Number of phage, recombinant for rand m, that are Parental Parental Parental Parental
for for for for e and r e arid m 1"J tu and r fu and m P'J
Cross I 278 262 0.50 (0.97) 1 1 304 236 <0.01 (0.20) (0.29) (<O.OI)
Cross I1 282 246 0.12 (0.15) 329 199 <0.01(<0.01) (0.41) (<0.01)
combined 560 508 0.12 (0.40) 633 435 <O.Ol(<O.O1) (0.18) (<0.01)
Crosses I and I1
Conclusions: e is probably to the left of r, but not closely linked; tu is to the left of r; the markers are linked in the order e tu r m.
d. Method for r,iapping the markers r and tu with respect to m and e
Number of phage, recombinant for m and e , that are Parental P.jrenta1 Parentai Parental
for for for for r a n d m r a n d e P** tu and m tu and e p**
Cross I 314 278 0.15 (0.83) 114 478 <O.Ol(<O.Ol)
Cross I1 299 282 0.50 (0.46)t-f 85 496 < O . O l ( < O . O l ) (0.19) (<O.Ol)
(0.07) (<0.01)

THE GENETIC MAP O F T 4 1667
Crosses I and I1 combined 613 560 0.13 (0.69)++ 199 974 <O.Ol (<O.Ol)
( 1 (<O.Ol) r is probably to the left of m; tu is to the right of e; Conclusions:
the markers are linked in the order r m e tu.
Method for mapping each marker with respect to two adjacent markers. Among the progeny of the cross m e r iu by standard type, the phage that are recombinant for two adjacent markers are classified according to the presence of one or the other allele of a third marker. If the third marker is not linked to either of the two adjacent markers, it will o:cur in parental combination with one as frequently as with the other. If the third marker is linked to the leff of the pair of adjacent markers, i t will occur in parental combination with the left marker more often than with the rlght marker of the pair. If the third marker is linked to the right of the two adjacent markers these frequencles are reversed.
* P is the probability that the inequality of the numbers is due to chance. The numbers in parentheses are the P values for the individual recombinant classes e+tu and e tu+. + In this case the inequality was reversed.
1 P is the probability that the inequality of the numbers is due to chance. The numbers in parentheses are the I' values
1 P is the probability that the inequality of the numbers is due to chance. The numbers in parentheses are the P values
/ I In this case the inequality was reversed. * * P is the probability that the inequality of the numbers is due to chance. The numbers in parentheses are the P values
it In this case the inequality was reversed
for the individual recombinant classes fu+r and r tu+ respectively.
for the individual recombinant classes r+m and rm+ respectively.
for the individual recombinant classes m+e and me+ respectively.
of each ten tubes received a burst with at least one standard marker. The contents of each tube were plated and the plates were examined for the presence of mark- ers from the irradiated parent. The number of plates with markers from the irra- diated phage is a good approximation to the number of irradiated phage contribut- ing standard markers. It is an approximation because some of the plates may have received more than one burst with standard markers, and similarly, some of the cells may have been infected by more than one contributing irradiated phage.
Table 3 shows the number of plates with at least one standard marker, classified into 15 groups. The class of plates from which all standard markers were elimi-
TABLE 3 Results from the cross reactiuation experiment: standard phage, irradiated to 6.25 hits,
by Ziue m e tu r
Number of plates in experiments
Markers Experi- Expen- Experi- Experi- Experi- Experi- contributed ment 1 ment 2 ment 3 ment 4 ment 5 ment 6 Total
None 272 234 136 178 339 130 1289 m, e, r, tu, only 239 167 139 321 163 284 1313 m, e, r, tu, plus:
m+ 12 8 15 18 15 21 89 e+ 5 5 3 2 5 7 27 r+ 4 3 2 9 3 12 33 tu+ 2 5 10 5 14 8 4 4 e*, tu+ 4 5 15 8 8 17 57 r+, e+ 0 1 1 0 1 0 3
m+, tu+ 1 2 1 4 5 6 1 9 m+, r+ 4 8 12 5 7 8 44 r+, e+, tu+ 6 9 8 6 4 12 45 m+, r+, tu+ 6 8 3 0 2 16 35 m+, e+, r+ 4 3 3 3 4 3 20
Totalnumberof plates 585 500 WO 600 600 600 3285
m+, e+ 3 4 0 2 6 1 16 r+, tu+ 2 2 5 4 3 7 23
m+, e+, tu+ 4 14 12 13 10 15 68 m+, e+, r+, tu+ 17 22 34 22 11 53 159

1668
A
H. M. FOSS A N D F. W. STAHL
B
c
C
a b C d
FIGURE 3.-Three possible arrangements of four markers on a genetic map: (a) The four markers are symmetrically situated on a circular map; (b) The markers are asymmetrically situated on a circular map; (c) The markers are situated on a linear map.
nated by gamma-ray damage could not be scored since it is indistinguishable from the class that received no bacterium infected by an irradiated particle. The data will be used for testing certain predictions of each of the following three models: (1) gamma-ray damages are single, and multiple marker knockouts reflect link- age of the markers on a circular map; (2) gamma-ray damages are single and multiple marker knockouts reflect linkage on a linear map; ( 3 ) multiple marker knockouts result from random multiple gamma-ray damages.
Let us consider the first model in a hypothetical case where four markers a, b, c, and d are equally sensitive to gamma-rays and are symmetrically arranged on the map as shown in Figure 3a. Ignoring one of the markers, say a, we can ex- amine the class of data where b is knocked out together with one other marker (i.e., either c or d ) . In this class c should be missing together with b more often than should d, since c is more closely linked to b. Similarly, in the class of data where d is knocked out together with one other marker, c should be missing more often than b. As the map was assumed to be completely symmetrical, related predictions could be presented for the cases where b, c, or d are ignored.
A slightly modified set of predictions can be made for the more realistic case where the four markers are asymmetrically arranged as shown, for instance, in Figure 3b. For the arrangement of markers shown, d should be missing together with b more often than should c, if the fourth marker, a, is ignored. However, if we insist upon the presence of a, then the reverse should be true. The prediction

THE GENETIC MAP OF T 4 1669
of reuersal does not hold true when one of the other three markers is ignored in- stead of a; it does not apply, for example, when the knockout frequencies of c and d are compared with those of c and a when b is ignored and when b is re- tained. Nor would the prediction necessarily hold true in any case if the markers had different sensitivities. If, for example, b and d were more sensitive than c, they might be missing together, as a result of two separate hits, more often than b and c even if a is present. However, under any conditions of map position or marker sensitivity, the ratio (nonadjacent markers knocked out together) : (ad- jacent markers knocked out together) when a fourth marker is not scored should be greater than the same ratio when the fourth marker is scored as present. For a circular map, this prediction applies whether a, b, c, or d is the “fourth” marker.
The second model (Figure 3c) leads to the same predictions only half of the time, namely when either b or c are scored as the “fourth” marker. In this model the presence or absence of either of the terminal markers, a or d, should have no influence on the relative frequency with which pairs of other markers are knocked out.
If, as stated in the third model, multiple knockouts are the result of random multiple damages, no systematic change is expected in any of the ratios.
Table 4 shows the ratio (nonadjacent marlcers KO’d) : (adjacent markers KO’d) when a fourth marker is ignored and when a fourth marker is scored as present. The ratios are evaluated for the data of the irradiation experiments de- scribed earlier in this section. (The experiments with unirradiated phage demon- strated that the two pairs of nonadjacent markers are m-tu and r -e) . The smaller ratio is always observed when the fourth marker is retained, whether m, e, r, or tu is the fourth marker. This result rules out models 2 and 3 and leads to the conclusions that correlated knockout of markers reflects linkage relationships and that these relationships are circular.
DISCUSSION
The experiments presented here support the conclusion of other workers ( STREISINGER, EDGAR, HARRAR, in press; EPSTEIN, in press; EDGAR, in press) that the genetic map of T4 is circular. Since the DNA of T4 is a single rod- shaped molecule (CAIRNS 1961), any model for the structure of the chromosome would have to be compatible with both a circular “genetic” linkage group and a linear “physical” linkage group. Some features of two such models will be briefly men- tioned here.
The open circle model assumes that the sequences of loci on the chromosomes of a population of mature phage are circular permutations of each other, as though each chromosome were derived from a circle by one random break. This model presents a physical basis for the circularity of the map, since all markers that are closely linked genetically are also closely linked structurally, at least in most of the populations.
According to the uniform rod model all chromosomes in a population of mature phage are identical rods, each beginning and ending with the same markers. .4

1670 H. M. FOSS AND F. W. STAHL
TABLE 4
Results from the cross reactivation experiment (gamma-irradiated standard phage crossed by live m e r tu phage) tabulated so as to test for circularity of the map, as described in the text
~~ ~~ ~~
Nuniber of plates with nonadjacent marhers missing ds a pair
lruliiber of plates w i t h adlaLen1 nrarkel-s nussmg a5 a pair
Nonadjacent nlarkcrs Fourth marLer Fourth marker Adjacent markers ' Fourth marker not scvred rotained
m+ tu+
r+ tu+
m+ tu+ m+ r+
r+ e+
r+ mi
r+ e+
m+ e+
r+ e+
r+ tu+
r+ e+
tu+ e+
m+ tu+
___
m+ e+
m+ tut e+ tu+
e+
e+
tu+
tu+
m+
m+
r+
++
36 - = 0,343 105
36 101
108 - = 1.29 84
108 - = 1.93 56
63 - = 1.46 43
63 - = 0.819 77
30 - = 0.448 67
3 0, - = 0.226 133
-- - - 0.356
3 - = 0.187 16
3 - = 0.053 57
19 - = 0.334 57
19 - = 0.827 23
19 - = 1.19 16
19 - = 0.432 44.
3 - = 0.130 23
3 - = 0.068 44
The frequency with which nonadjacent and adjacent makers are knocked out as a pair is measured under two con- ditions: ( 1 ) when a fourth marker is not scored and ( 2 ) when the fourth marker is contributed.
circular map could be generated in this model if recombinations occurred through pairs of crossovers. Thus, the rules of recombination, rather than the structure of the chromosome, provide the basis for the circularity of the map, and markers that are closely linked genetically may structurally be far apart in every particle.
Furthermore, it is possible, as was pointed out by NI. DELBRUCK (personal com- munication), that the genetic map is not circular at all, but that the apparent circularity is an artifact resulting from a chromosomal aberration in one of the parental strains. If, for example, one of the parents used in these crosses had an inversion with respect to the other parent, the crosses described in this paper could have been of the type a b c d x a+ d+ c+ b+, and a would appear to be adjacent to both b and d, d would map between a and c, c between d and b, and b between a and c, exactly as on a circular map.
The experiments with unirradiated phage are compatible with all these ideas, but the irradiation experiments off er some promise of distinguishing among them. Both incorporated P32 and ionizing radiation probably cause breaks in the DNA
THE GENETIC M A P O F T4 1671
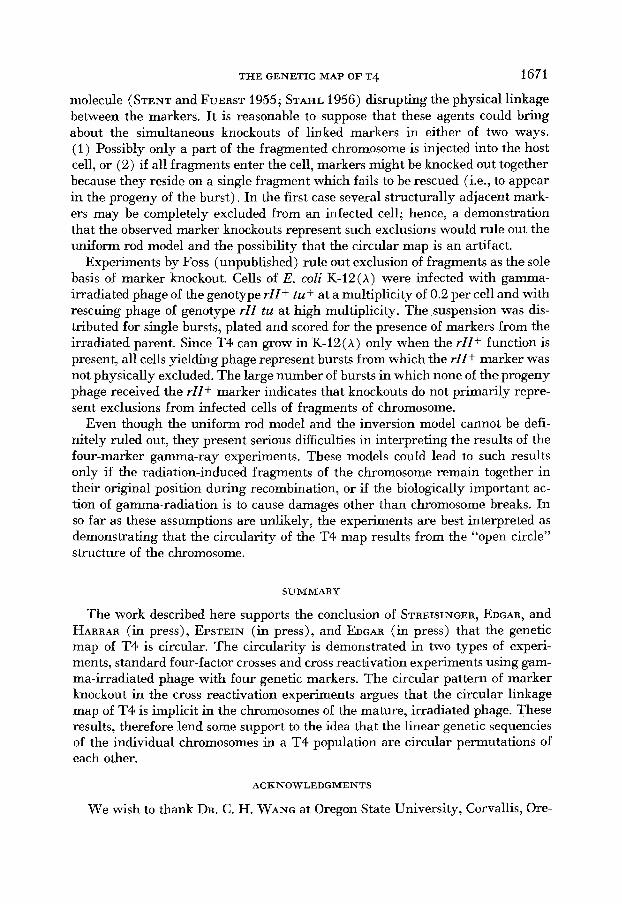
molecule (STENT and FUERST 1955; STAHL 1956) disrupting the physical linkage between the markers. It is reasonable to suppose that these agents could bring about the simultaneous knockouts of linked markers in either of two ways. (1) Possibly only a part of the fragmented chromosome is injected into the host cell, or (2) if all fragments enter the cell, markers might be knocked out together because they reside on a single fragment which fails to be rescued (i.e., to appear in the progeny of the burst). In the first case several structurally adjacent mark- ers may be completely excluded from an infected cell; hence, a demonstration that the observed marker knockouts represent such exclusions would rule out the uniform rod model and the possibility that the circular map is an artifact.
Experiments by Foss (unpublished) rule out exclusion of fragments as the sole basis of marker knockout. Cells of E. coli K-12(X) were infected with gamma- irradiated phage of the genotype rZZ+ tu+ at a multiplicity of 0.2 per cell and with rescuing phage of genotype rZZ tu at high multiplicity. The suspension was dis- tributed for single bursts, plated and scored for the presence of markers from the irradiated parent. Since T4 can grow in K-I2(h) only when the rZZ+ function is present, all cells yielding phage represent bursts from which the rZZ+ marker was not physically excluded. The large number of bursts in which none of the progeny phage received the rZZ+ marker indicates that knockouts do not primarily repre- sent exclusions from infected cells of fragments of chromosome.
Even though the uniform rod model and the inversion model cannot be defi- nitely ruled out, they present serious difficulties in interpreting the results of the four-marker gamma-ray experiments. These models could lead to such results only if the radiation-induced fragments of the chromosome remain together in their original position during recombination, or if the biologically important ac- tion of gamma-radiation is to cause damages other than chromosome breaks. In so far as these assumptions are unlikely, the experiments are best interpreted as demonstrating that the circularity of the T4 map results from the “open circle” structure of the chromosome.
SUMMARY
The work described here supports the conclusion of STREISINGER, EDGAR, and HARRAR (in press), EPSTEIN (in press), and EDGAR (in press) that the genetic map of T4 is circular. The circularity is demonstrated in two types of experi- ments, standard four-factor crosses and cross reactivation experiments using gam- ma-irradiated phage with four genetic markers. The circular pattern of marker knockout in the cross reactivation experiments argues that the circular linkage map of T4 is implicit in the chromosomes of the mature, irradiated phage. These results, therefore lend some support to the idea that the linear genetic sequencies of the individual chromosomes in a T4 population are circular permutations of each other.
ACKNOWLEDGMENTS
We wish to thank DR. C. H. WANG at Oregon State University, Corvallis, Ore-

1672 H. M. FOSS A N D F. W. STAHL
gon, fo r the use of the Co60 source, and MR. JOHN PRINCE for effecting the irra- diation. A major portion of this work was conducted at Iowa State University, Ames, Iowa. We are most grateful to DR. JOHN Foss and The Department of Bio- chemistry and Biophysics, who made research facilities available. Were it not for the prior researches of DR. G. STREISINGER, this project would not have existed; were it not for his many valuable suggestions it could not have been completed.
LITERATURE CITED
CAIRNS, J., 1961
DOERMANN, A. H., 1953
An estimate of the length of the DNA molecule of T2 bacteriophage by auto-
The vegetative state in the life cycle of bacteriophage : evidence for its occurrence and its genetic characterization. Cold Spring Harbor Symp. Quant. Biol. 18:
Genetic structure of bacteriophage T4 as described by
radiography. J. Mol. Biol. 3 : 756-761.
3-1 1. DOERMANN, A. H., and M. B. HILL, 1953
EDGAR, R. S., 1963 EDGAR, R. S., R. P. FEYNMAN, S. KLEIN, I . LIELAUSIS, and C. M. STEINBERG, 1962
EPSTEIN, R. H., 1963 HARM, W., 1958
T4 following X-ray inactivation. Virology 5: 337-361. LENNOX, E. S., C. LEVINTHAL, and F. SMITH, 1953
combinant frequency. Genetics 38: 508-51 1. S~CHAUD, J., and E. KELLENBERGER, 1956
bactkries infectkes par du bactkriophage. Ann. Inst. Pasteur 90: 102-106. STAHL, F. W., 1956
genome of bacteriophage T4. Virology 2: 206-234. STENT, G. S., 1953
porated radioactive phosphorus. Proc. Natl. Acad. Sci. U.S. 39: 1234-1241. STENT, G. S., and C. R. FUERST, 1955
radioactive phosphorus. J. Gen. Physiol. 38: 44-458. STREISINGER, G., and V. BRUCE, 1960
45: 1289-1296. STREISINGER, G., F. MUKAI, W. J. DREYER, B. MILLER and S. HORIUCHI, 1961
STREISINGER, G., R. S. EDGAR, and G. HARRAR, 1963 VISCONTI, N., and M. DELBRUCK, 1953
recombination studies of factors influencing plaque morphology. Genetics 38: 79-90. (in press).
Mapping experiments with r mutants of bacteriophage T4D. Genetics 47: 179-186.
(in press). Multiplicity reactivation, marker rescue, and genetic recombination in phage
The effect of finite input in reducing re-
Lyse prkcoce, provoquke par le chloroforme, chez les
The effects of the decay of incorporated radioactive phosphorus on the
Cross reactivation of genetic loci of T2 bacteriophage after decay of incor-
Inactivation of bacteriophages by decay of incorporated
Linkage of genetic markers in phages T2 and T4. Genetics
Mutations affect- ing the lysozyme of phage T4. Cold Spring Harbor Symp. Quant. Biol. 26: 25-30.
(in press). The mechanism of genetic recombination in phage.
Genetics 38 : 5-33.