cisc3222 10 scheduling - firefly labs2016)/n/w3/me292-projsch... · cisc 322 software architecture...
TRANSCRIPT

CISC 322Software Architecture
Project Scheduling (PERT/CPM)
Ahmed E. Hassan(Edited For Course Presentation, 2016)
Project
■ A project is– a temporary endeavour undertaken to create a
"unique" product or service
■ A project is composed of – a number of related activities that are directed to the – a number of related activities that are directed to the
accomplishment of a desired objective
■ A project starts when – at least one of its activities is ready to start
■ A project is completed when – all of its activities have been completed
Activity
■ An activity
– Must have a clear start and a clear stop
– Must have a duration that can be forecasted
– May require the completion of other activities – May require the completion of other activities
before it begins
– should have some ‘deliverables’ for ease of
monitoring

Project plan
■ A project plan is a schedule of activities
indicating
– The start and stop for each activity. The start and stop
of each activity should be visible and easy to measure
– When a resource is required
– Amount of required project resources
Project Planning
■Managers should consider:
– Resource availability
– Resource allocation
– Staff responsibility– Staff responsibility
– Cash flow forecasting
■Mangers need to monitor and re-plan as the project progresses towards its pre-defined goal

Work Breakdown Structure (WBS)
■ Contains a list of activities for a project derived from– Previous experience
– Expert brainstorming
■ WBS helps in ■ WBS helps in – identifying the main activities
– break each main activity down into sub-activities which can further be broken down into lower level sub-activities
■ WBS problems:– Too many levels
– Too few levels

Project Scheduling
■ Steps
– Define activities
– Sequence activities
– Estimate time
■ Techniques
– Gantt chart
– CPM
– PERT– Estimate time
– Develop schedule
– PERT
– Microsoft Project
Gantt Chart
■ Developed in 1918 by H.L. Gantt
■ Graph or bar chart with a bar for each
project activity that shows passage of time
■ Provides visual display of project schedule■ Provides visual display of project schedule
■ Limitations
– Does not clearly indicate details regarding the
progress of activities
– Does not give a clear indication of interrelation
between the activities

| | | | |
Activity
Design house and obtain financing
Lay foundation
Order and receive materials
00 22 44 66 88 1010MonthMonth
Example of Gantt Chart
receivematerials
Build house
Select paint
Select carpet
Finish work
MonthMonth11 33 55 77 99

Activity Description An Activity Description Table is used when describing a project, for the
purposes of doing project management analysis. The Activity Description Table
for the House Building example is below.
Task Number
Task Description Duration of Task
Predecessor Task
1 Design house & obtain financing 3 - 2 Lay foundation 2 Task 1 3 Order & receive materials 1 Task 1 4 Build house 3 Task 2 5 Select paint 1 Task 2 6 Select carpet 1 Task 5 7 Finish work 1 Task 4
PERT/CPM
■ PERT (Program Evaluation and ReviewTechnique)
– Developed by U.S. Navy for Polaris missile project
– Developed for R&D projects where activity times are
generally uncertain
■ CPM (Critical Path Method)
– Developed by DuPont & Remington Rand
– Developed for industrial projects where activity times
are generally known
PERT/CPM
■ CPM and PERT have been used to plan,schedule, and control a wide variety ofprojects:
– R&D of new products and processes– R&D of new products and processes
– Construction of buildings and highways
– Maintenance of large and complex equipment
– Design and installation of new systems
Program Evaluation and Review
Technique (PERT)
■ Primary objectives:
– Shortest possible time
– Coping with uncertain activity completion times, e.g.:
• For a particular activity
• The most likely completion time is 4 weeks but• The most likely completion time is 4 weeks but
• It could be anywhere between 3 weeks and 8 weeks
■ Developed by the US Navy for the planning and
control of the Polaris missile program
Critical Path Method (CPM)
■ Primary objectives:
– Plan for the fastest completion of the project
– Identify activities whose delays is likely to affect the
completion date for the whole project
– Very useful for repetitive activities with well known
completion time
■ Developed by Du Pont Chemical Company and
published in 1958
– Can we decrease the completion time by spending
more money

CPM Calculation
■ The forward pass
– calculate the earliest start dates of the
activities
• to calculate the project completion date• to calculate the project completion date
■ The backward pass
– calculate the latest start dates for activities
• to identify the critical path from the graph
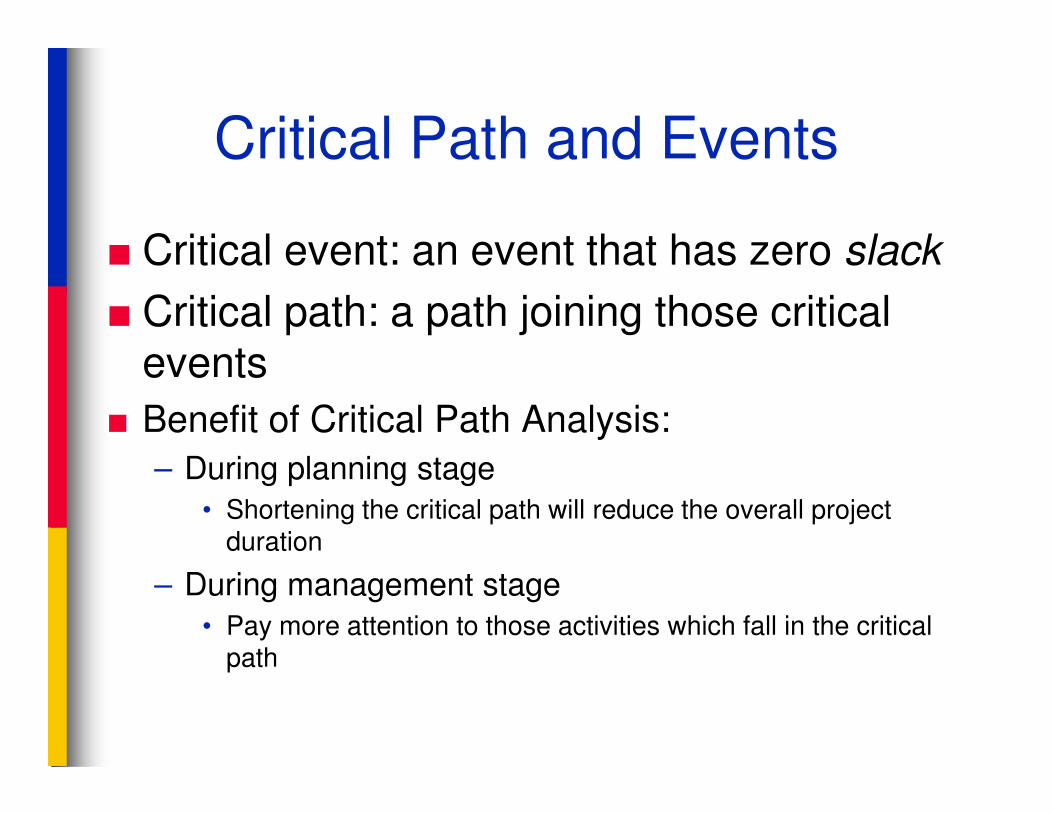
Critical Path and Events
■ Critical event: an event that has zero slack
■ Critical path: a path joining those critical events
■ Benefit of Critical Path Analysis:■ Benefit of Critical Path Analysis:
– During planning stage
• Shortening the critical path will reduce the overall project duration
– During management stage
• Pay more attention to those activities which fall in the critical path
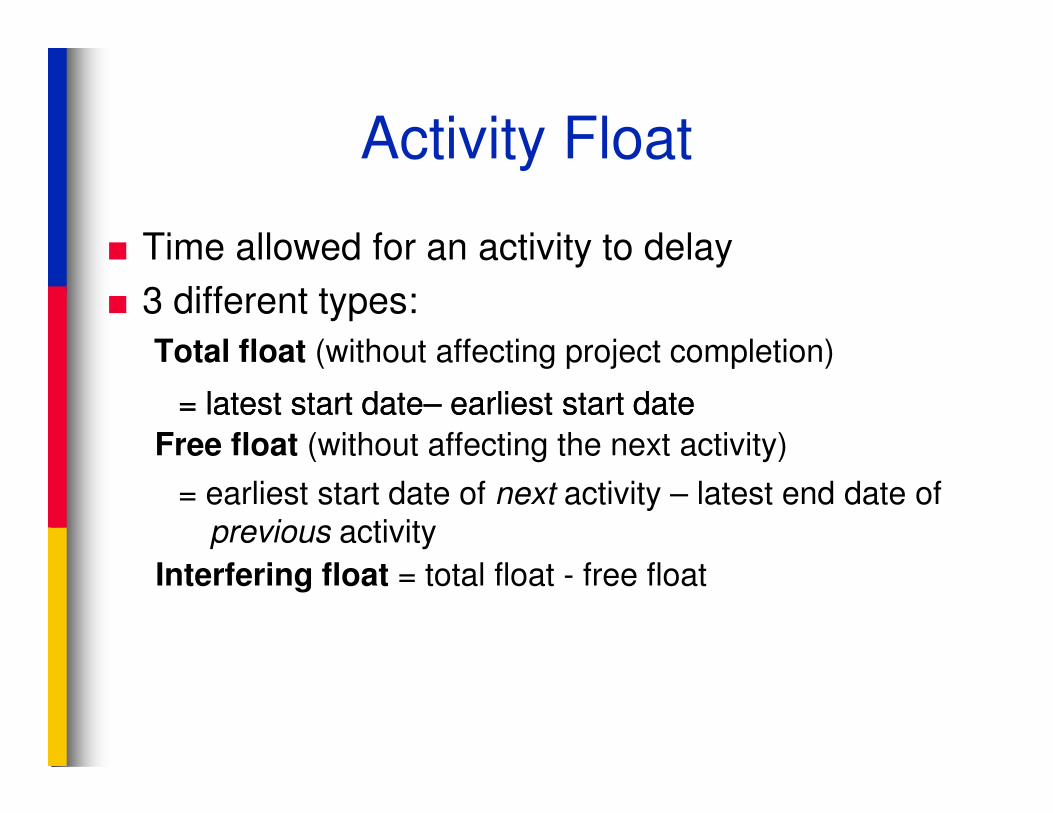
Activity Float
■ Time allowed for an activity to delay
■ 3 different types:
Total float (without affecting project completion)
== llaatteestst ststaarrtt ddaattee –– eeaarrlliieestst ststaarrtt ddaattee
Free float (without affecting the next activity)
= earliest start date of next activity – latest end date of
previous activity
Interfering float = total float - free float

Activity Description An Activity Description Table is used when describing a project, for the
purposes of doing project management analysis. The Activity Description Table
for the House Building example is below.
Task Number
Task Description Duration of Task
Predecessor Task
1 Design house & obtain financing 3 - 2 Lay foundation 2 Task 1 3 Order & receive materials 1 Task 1 4 Build house 3 Task 2 5 Select paint 1 Task 2 6 Select carpet 1 Task 5 7 Finish work 1 Task 4
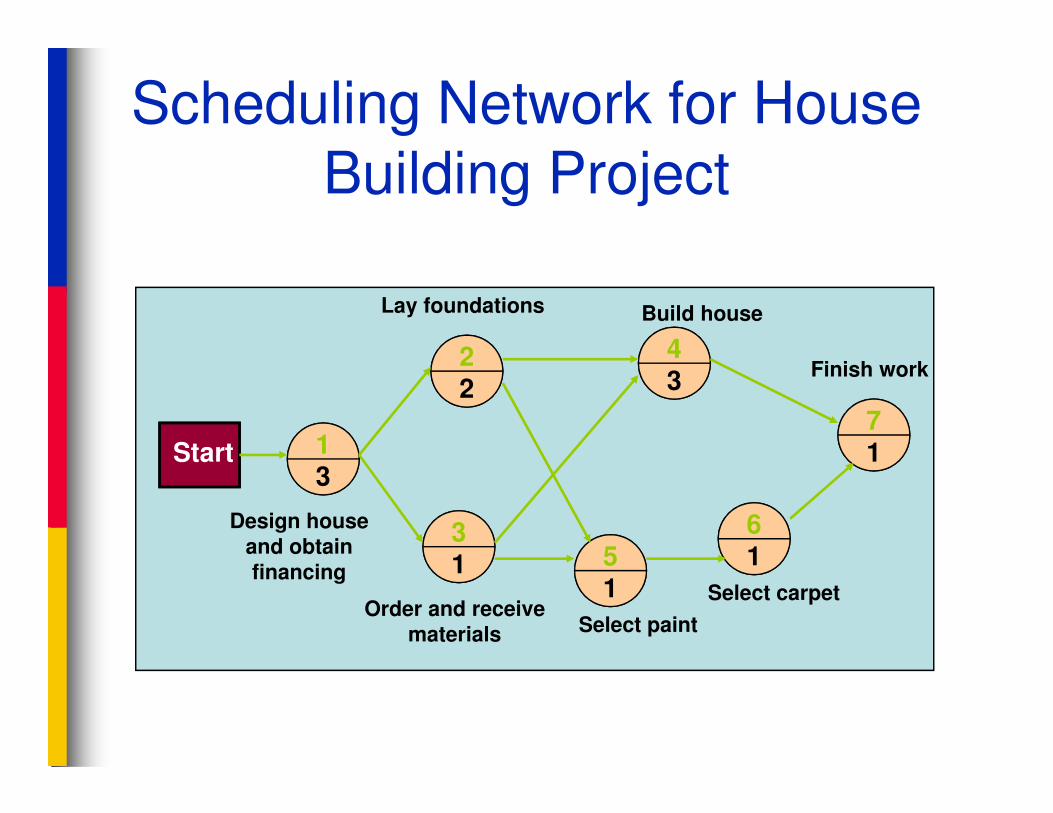
Scheduling Network for House
Building Project
22
43
7
Lay foundations Build house
Finish work
13
31 5
1
61
71Start
Design house and obtain financing
Order and receive materials Select paint
Select carpet
13
22
43
3 6
71Start
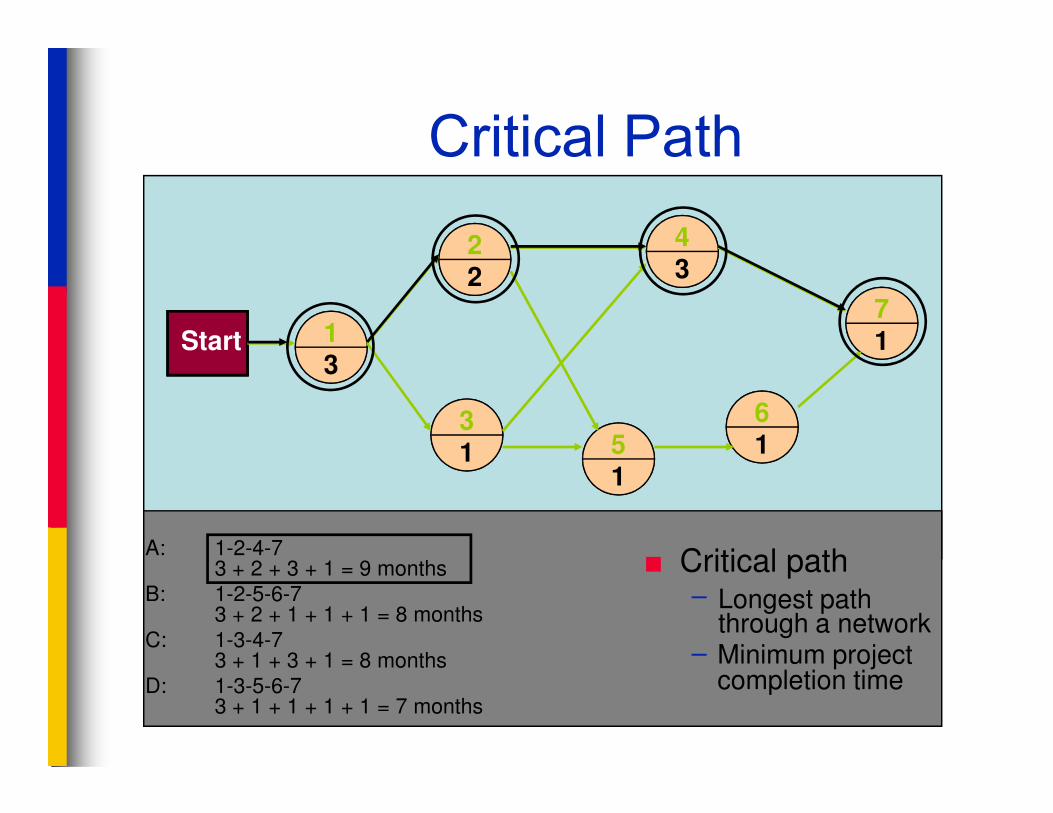
Critical Path
31 5
1
61
■ Critical path– Longest path
through a network– Minimum project
completion time
A: 1-2-4-73 + 2 + 3 + 1 = 9 months
B: 1-2-5-6-73 + 2 + 1 + 1 + 1 = 8 months
C: 1-3-4-73 + 1 + 3 + 1 = 8 months
D: 1-3-5-6-73 + 1 + 1 + 1 + 1 = 7 months

Activity Start Times
22
43
7
Start at 5 months
Finish at 9 months
13
31 5
1
61
71Start
Start at 3 monthsStart at 6 months
Finish

Mode Configuration
Activity number Earliest start
Earliest finish
1 0 3
3 0 3
Activity duration Latest start
Latest finish

Forward Pass
■ Start at the beginning of CPM/PERT network todetermine the earliest activity times
■ Earliest Start Time (ES)– earliest time an activity can start
– ES = maximum EF of immediate predecessors
■ Earliest finish time (EF)– earliest time an activity can finish
– earliest start time plus activity time
EF= ES + t
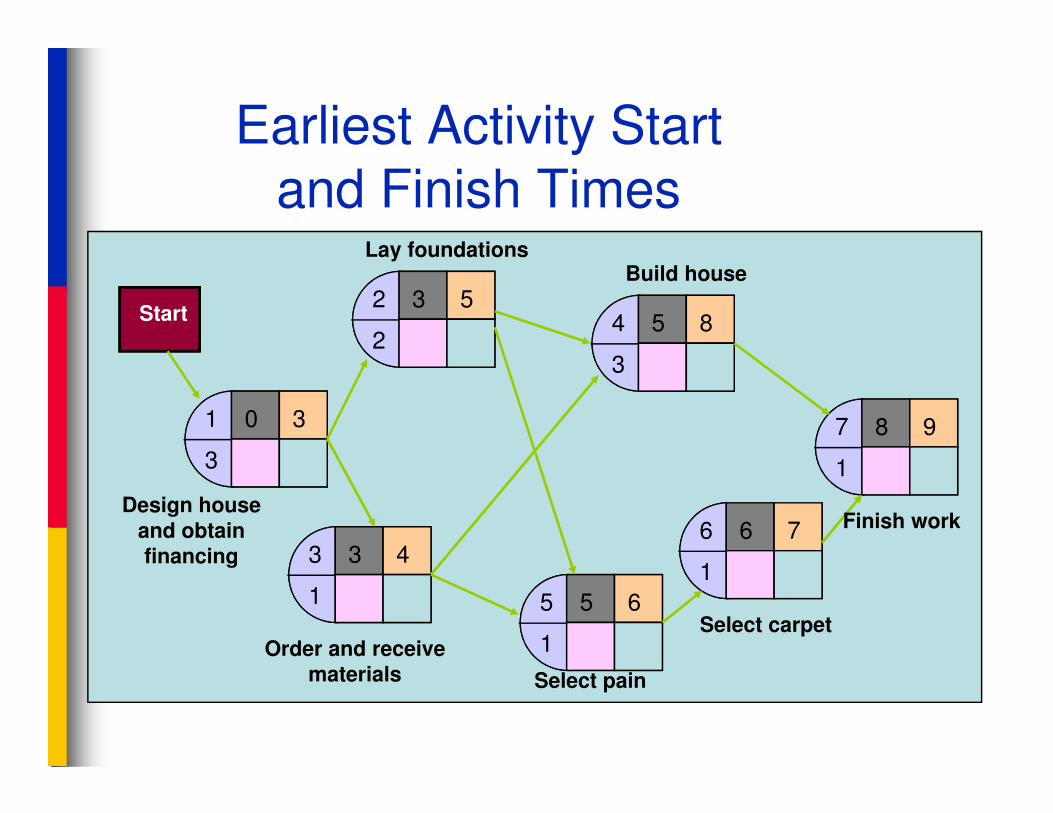
Earliest Activity Start
and Finish Times
1 0 3
2 3 5
24 5 8
3
Start
Lay foundationsBuild house
1 0 3
3
3 3 4
1 5 5 6
1
6 6 7
1
7 8 9
1
Design house and obtain financing
Select pain
Select carpet
Finish work
Order and receive materials
Backward Pass
■ Determines latest activity times by starting at the end of CPM/PERT network and working backward
■ Latest Start Time (LS)– Latest time an activity can start without delaying critical
path time
LS= LF - tLS= LF - t■ Latest finish time (LF)
– latest time an activity can be completed withoutdelaying critical path time
– LF = minimum LS of immediate predecessors
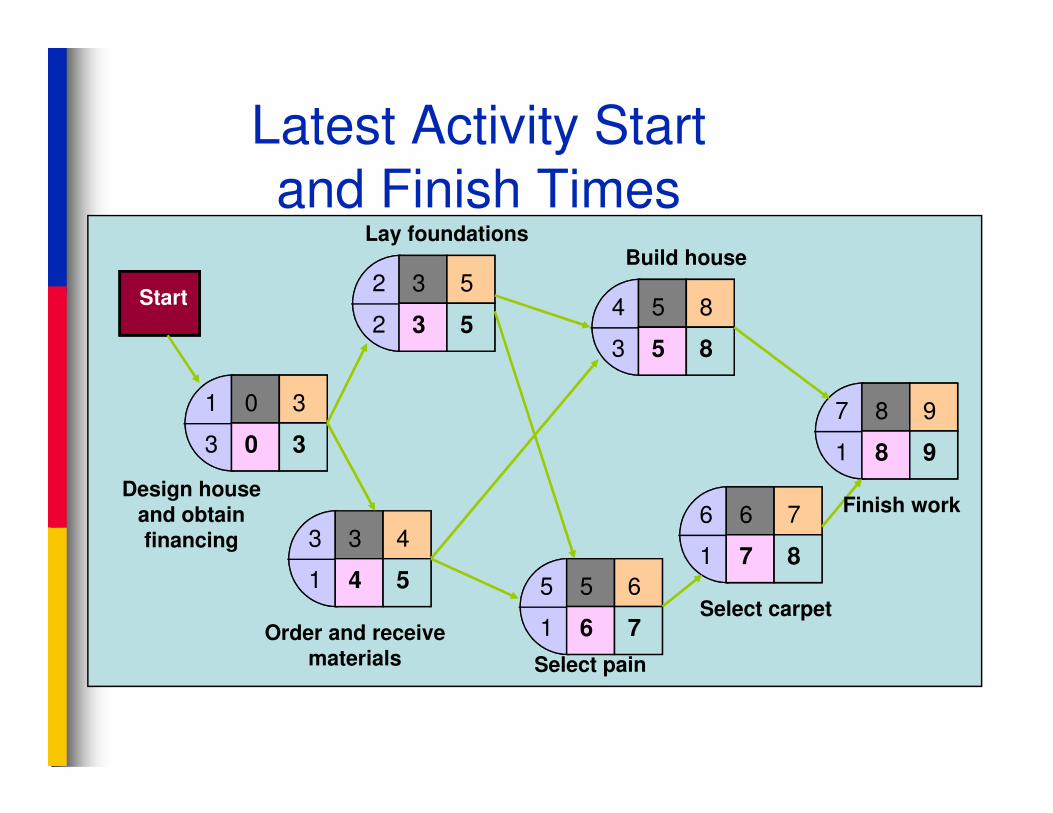
Latest Activity Start
and Finish Times
1 0 3
2 3 5
2 3 54 5 8
3 5 8
7 8 9
Start
Lay foundationsBuild house
1 0 3
3 0 3
3 3 4
1 4 5 5 5 6
1 6 7
6 6 7
1 7 8
7 8 9
1 8 9
Design house and obtain financing
Select pain
Select carpet
Finish work
Order and receive materials
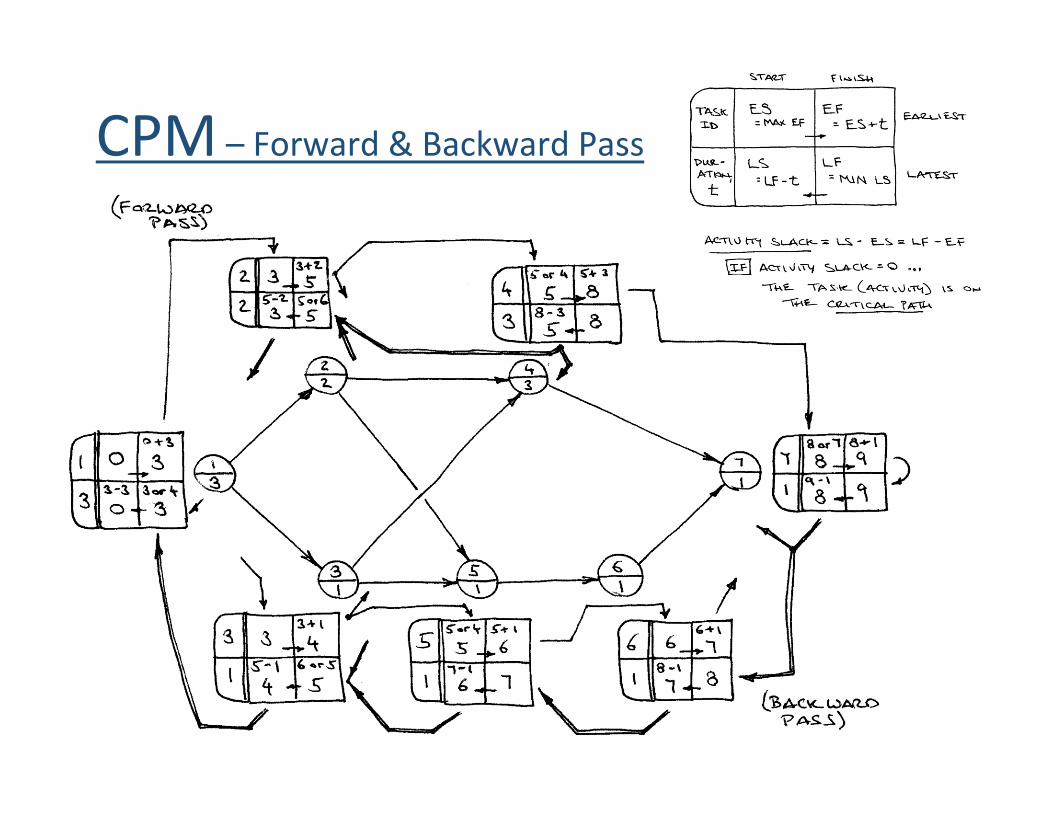
CPM – Forward & Backward Pass
00008888888855555555*4*4*4*4
111144445555333344443333
00005555555533333333*2*2*2*2
00003333333300000000*1*1*1*1
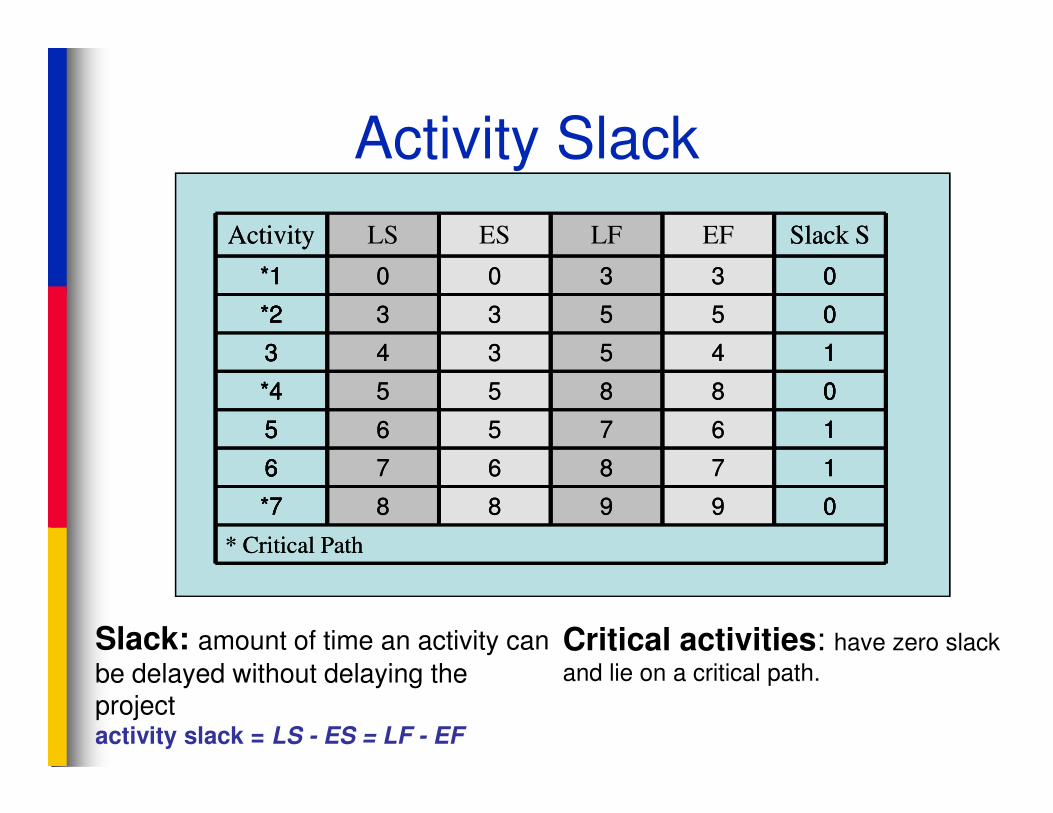
Slack SSlack SEFEFLFLFESESLSLSActivityActivity
Activity Slack
* Critical Path* Critical Path
00009999999988888888*7*7*7*7
111177778888666677776666
111166667777555566665555
Slack: amount of time an activity can
be delayed without delaying the project activity slack = LS - ES = LF - EF
Critical activities: have zero slack
and lie on a critical path.

Limitations of PERT/CPM
■ Assumes clearly defined, independentactivities
■ Specified precedence relationships
■ Activity times (PERT) follow beta■ Activity times (PERT) follow betadistribution
■ Subjective time estimates
■ Over-emphasis on critical path
– Monte Carlo Simulations

Project Crashing
■ Crashing– reducing project time by expending additional
resources
■ Crash time– an amount of time an activity is reduced– an amount of time an activity is reduced
■ Crash cost– cost of reducing activity time
■ Goal– reduce project duration at minimum cost

28
412
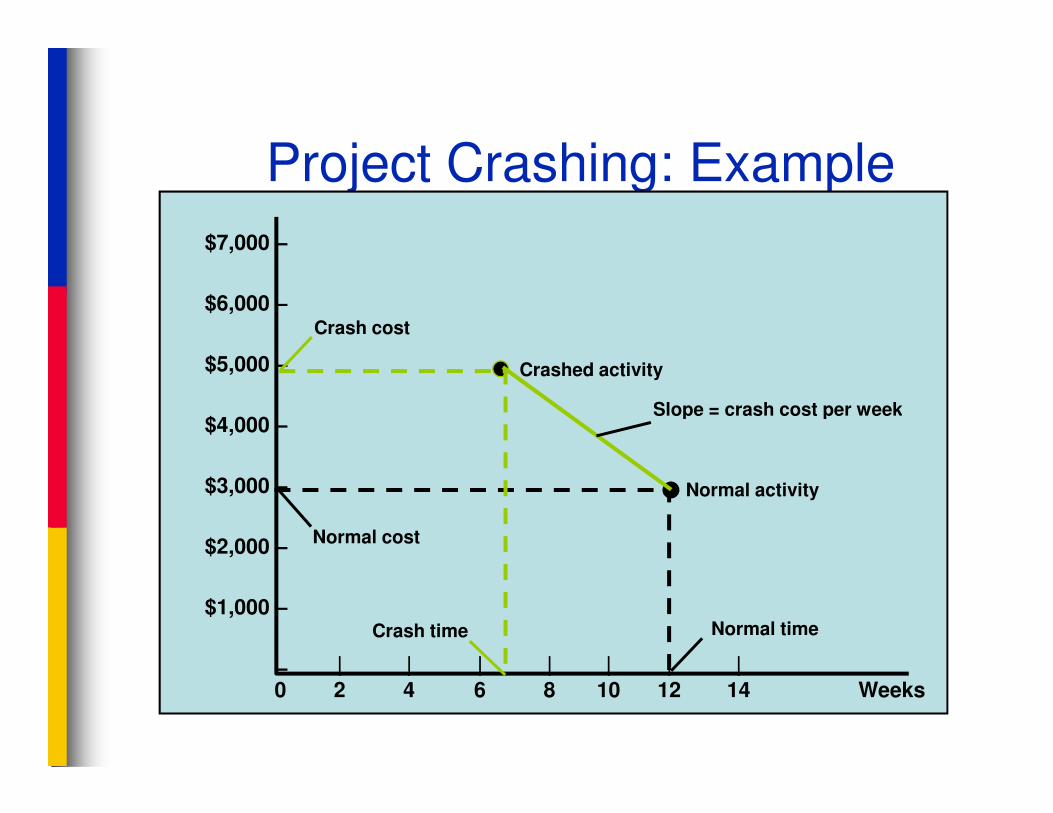
Project Crashing: Example
112
8
34 5
4
64
74
Project Crashing: Example
$7,000 –
$6,000 –
$5,000 – Crashed activity
Crash cost
Slope = crash cost per week$4,000 –
$3,000 –
$2,000 –
$1,000 –
– | | | | | | |0 2 4 6 8 10 12 14 Weeks
Normal activity
Normal time
Normal cost
Crash time
Slope = crash cost per week
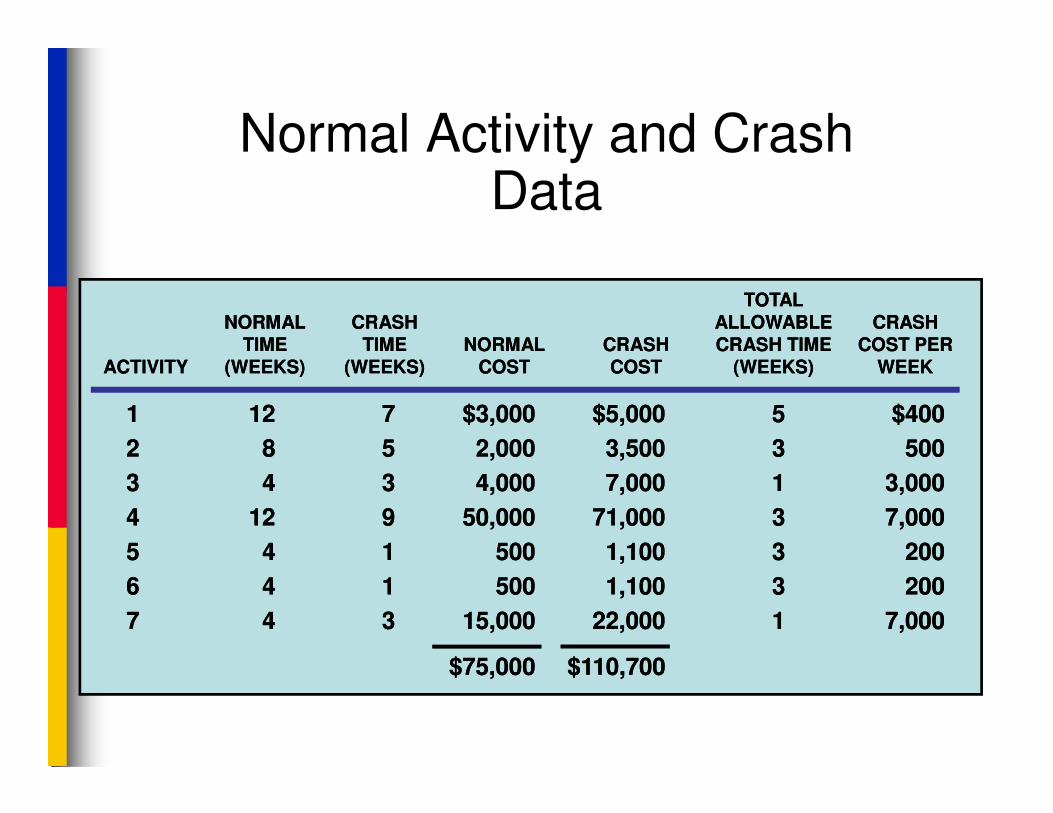
Normal Activity and Crash Data
TOTALTOTALNORMALNORMAL CRASHCRASH ALLOWABLEALLOWABLE CRASHCRASH
TIMETIME TIMETIME NORMALNORMAL CRASHCRASH CRASH TIMECRASH TIME COST PERCOST PERACTIVITYACTIVITY (WEEKS)(WEEKS) (WEEKS)(WEEKS) COSTCOST COSTCOST (WEEKS)(WEEKS) WEEKWEEK
11 1212 77 $3,000$3,000 $5,000$5,000 55 $400$40011 1212 77 $3,000$3,000 $5,000$5,000 55 $400$400
22 88 55 2,0002,000 3,5003,500 33 500500
33 44 33 4,0004,000 7,0007,000 11 3,0003,000
44 1212 99 50,00050,000 71,00071,000 33 7,0007,000
55 44 11 500500 1,1001,100 33 200200
66 44 11 500500 1,1001,100 33 200200
77 44 33 15,00015,000 22,00022,000 11 7,0007,000
$75,000$75,000 $110,700$110,700

1
12
2
8
3
4 5
4
6
4
7
4
$3000
$2000
$4000
$50000
$500
$500
$1500012
4Project Duration:
36 weeks$75,000
FROM …
1
7
2
5
3
3 5
1
6
1
7
3
$5000
$3500
$7000
$71000
$1100$1100
$2200094
Project Duration: 31 weeks$110,700
Additional Cost:$35,700
TO…

Time-Cost Relationship
■ Crashing costs increase as project duration decreases
■ Indirect costs increase as project duration increasesincreases
■ Reduce project length as long as crashing costs are less than indirect costs

Direct vs Indirect Costs
Direct cost is a cost that can be attributed directly to a cost unit or cost
centre. The cost of raw materials (e.g., cost of planks used in the manufacture
of tables and chairs) is an example of a direct cost. This is because the cost of
planks is traceable to the tables and chairs (cost unit) produced.
Indirect cost is the cost that cannot be attributed to a cost unit or cost centre.
In the manufacture of tables and chairs, a supervisor may be employed to
ensure that all tables and chairs produced meet a required standard before
delivery to the customer. The supervisor's salary is not traceable to a particular
cost unit but absorbed by all the tables and chairs produced. This is different
from the salary that is paid to the carpenter who drives the nail into the wood
to make it come out as a table or chair. In this illustration, while the salary of
the supervisor is an indirect cost, the salary of the carpenter is a direct cost.
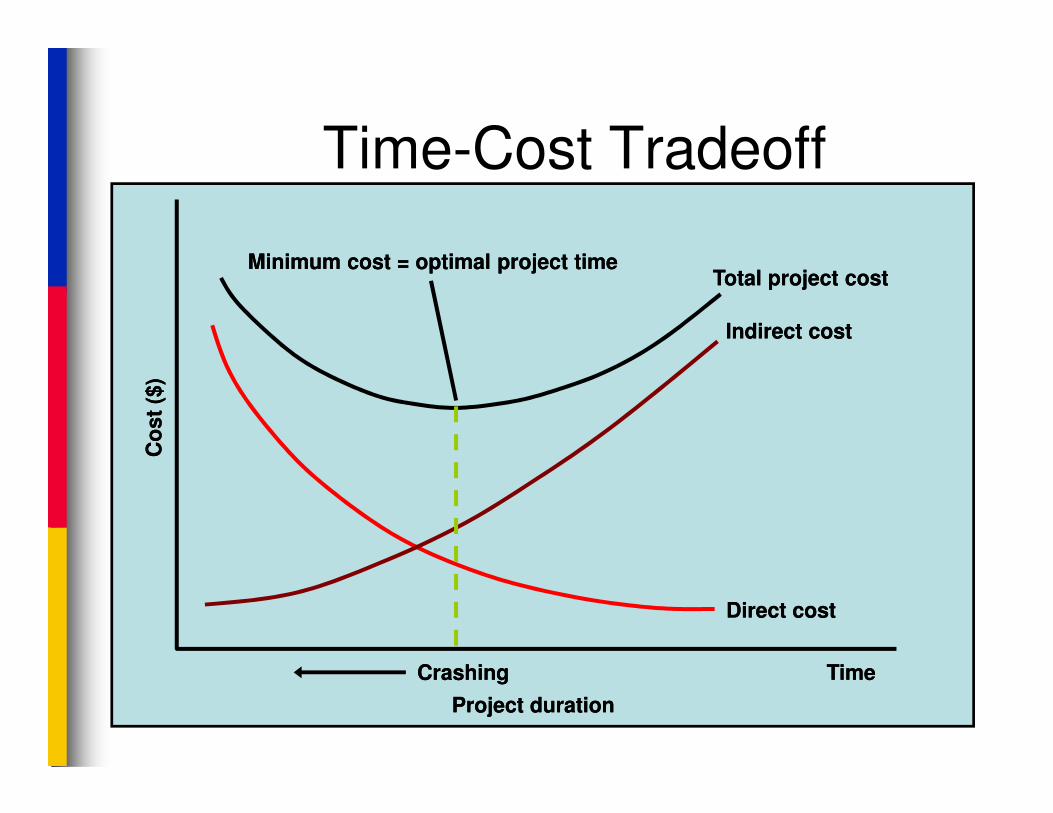
Time-Cost TradeoffC
os
t ($
)C
os
t ($
)
Minimum cost = optimal project timeMinimum cost = optimal project timeTotal project costTotal project cost
Indirect costIndirect cost
Co
st
($)
Co
st
($)
Project durationProject duration
CrashingCrashing TimeTime
Direct costDirect cost