city delivery office efficiency- houston district · city delivery office operations cover all...
TRANSCRIPT

Cover
City Delivery Office Efficiency-Houston District
Report Number DR-AR-16-005June 9, 2016
Audit Report

Highlights
The Houston District has
opportunities to enhance
efficiency in city delivery
office operations.
City Delivery Office Efficiency – Houston District Report Number DR-AR-16-005 1
BackgroundCity delivery office operations cover all duties a U.S. Postal Service letter carrier performs in the office. These duties include casing mail (placing mail in delivery order), preparing parcels for delivery, and retrieving accountable items. City carriers are delivering more packages and fewer letters to more addresses each year. The Postal Service seeks to accommodate these changes while maintaining efficiency.
In fiscal year (FY) 2015, Houston District city carriers delivered over 2.1 billion mailpieces on 3,181 routes to more than 2.1 million delivery points. To do so, they used over 1.8 million city delivery office workhours.
Our objective was to assess the efficiency of city delivery office operations in the Houston District.
What The OIG FoundThe Houston District has opportunities to enhance efficiency in city delivery office operations. For FY 2015, the district’s percent to standard – a measurement used to assess office efficiency – was 117.21 percent. This is 9.19 percentage points above the national average of 108.02 percent. A percent to standard score greater than 100 indicates performance is less than the desired standard.
During FY 2015, 50 of the district’s 114 delivery units (44 percent) used 174,912 more office workhours than necessary. This averages about 17 more minutes of office time per day, or 440 more minutes per month, on each city carrier route. These additional workhours cost the district more than $11.1 million for the 2-year period of FYs 2014 and 2015.
Excess workhours were used because mail sometimes arrived late and the mail mix was sometimes incorrect, or carriers engaged in time-wasting practices. In addition, mail arrival profiles (used to establish staffing levels and mail arrival times by type and quantity) were non-existent, unsigned, or outdated. Finally, managers did not enforce policies and procedures. Eliminating the extra workhours would increase overall efficiency at delivery units and allow a future cost avoidance of about $8.4 million annually.
We also identified inadequate safeguards over cash, money orders, and stamp stock at seven delivery units. Management immediately initiated corrective action on these matters; therefore, we are not making a recommendation on this issue.
What The OIG RecommendedWe recommended the district manager, Houston District, eliminate 174,912 workhours at delivery units by eliminating inefficient office practices, preparing up-to-date mail arrival profiles, and ensuring policies and procedures are followed.

Transmittal Letter
June 9, 2016
MEMORANDUM FOR: KIM E. QUAYLEDISTRICT MANAGER, HOUSTON DISTRICT
forFROM: Janet M. Sorensen
Deputy Assistant Inspector General for Retail, Delivery, and Marketing
SUBJECT: Audit Report – City Delivery Office Efficiency – Houston District (Report Number DR-AR-16-005)
This report presents the results of our audit of City Delivery Office Efficiency – Houston District (Project Number 16XG009DR000).
We appreciate the cooperation and courtesies provided by your staff. If you have any questions or need additional information, please contact Rita Oliver, director, Delivery Operations, or me at 703-248-2100.
Attachment
cc: Corporate Audit and Response Management
E-Signed by Michael ThompsonVERIFY authenticity with eSign Desktop
City Delivery Office Efficiency – Houston District Report Number DR-AR-16-005 2

Table of Contents
CoverHighlights ......................................................................................................1
Background ................................................................................................1What The OIG Found ................................................................................. 1What The OIG Recommended ..................................................................1
Transmittal Letter ..........................................................................................2Findings ........................................................................................................4
Introduction ................................................................................................4Summary ....................................................................................................4Office Efficiency .........................................................................................5
Mail Arrival .............................................................................................6Inefficient Office Practices .....................................................................7Mail Arrival Profiles ................................................................................7Enforcing Policies and Procedures ........................................................7
Assets at Risk ............................................................................................8Recommendations........................................................................................9
Management’s Comments .........................................................................9Evaluation of Management’s Comments .................................................10
Appendices .................................................................................................11Appendix A: Additional Information ..........................................................12 Background ..........................................................................................12 Objectives, Scope, and Methodology ..................................................12 Prior Audit Coverage ............................................................................13Appendix B: Units Randomly Selected for Onsite Observations .............15Appendix C: Management’s Comments ..................................................16
Contact Information ....................................................................................19
City Delivery Office Efficiency – Houston District Report Number DR-AR-16-005 3

Findings IntroductionThis report presents the results of our self-initiated audit of city delivery office efficiency in the Houston District (Project Number 16XG009DR000). Our objective was to assess the office efficiency of city delivery operations in the Houston District. See Appendix A for additional information about this audit.
City delivery office operations are all duties a U.S. Postal Service letter carrier performs in the office. These duties include casing1 mail, preparing parcels for delivery, and retrieving accountable items. City carriers are delivering more packages and fewer letters to more addresses each year. To accommodate these changes, the Postal Service must deliver increased package volumes while maintaining efficiency.
SummaryThe Houston District has opportunities to enhance efficiency in city delivery office operations. For fiscal year (FY) 2015, the district’s percent to standard2 – a measurement used to assess office efficiency – was 117.21 percent, which was 9.19 percentage points above the national average of 108.02 percent. A percent to standard score greater than 100 percent indicates performance is less than the desired standard. For FY 2015, 503 of the district’s 114 delivery units (44 percent) used 174,912 more office workhours than necessary. This averages about 174 more minutes of office time per day, or 4405 more minutes per month, on each city carrier route. The Houston District’s usage of additional workhours resulted in over $11.1 million in questioned costs for the 2-year period of FYs 20146 and 2015.
Excess workhours were used because mail sometimes arrived late and the mail mix was sometimes incorrect, or carriers engaged in time-wasting practices. Also, mail arrival profiles (MAP),7 which are used to establish staffing levels and mail arrival times by type and quantity, were non-existent, unsigned,8 or outdated. Finally, managers did not enforce policies and procedures. Eliminating the 174,912 workhours would increase overall efficiency at the delivery units and allow a future cost avoidance of almost $8.4 million in the next year.
We also identified inadequate safeguards over cash, money orders, and stamp stock at seven delivery units. Management immediately initiated corrective action on these matters; therefore, we are not making a recommendation on this issue.
1 Placing mail in proper separations (wickets) in a letter or flat case.2 We did not include street efficiency in our review.3 From the 114 delivery units in the Houston District, we identified 50 delivery units with 15 or more routes with a percent to standard higher than the national average. We
selected 30 of the 50 units to observe.4 Computation was based on 10,494,720 minutes (174,912 hours above the national average percent to standard multiplied by 60 minutes per hour) divided by 2,011 city
routes divided by 302 annual delivery days, which equals about 17 minutes per route per day.5 Computation was based on 10,494,720 minutes per day multiplied by 25.17 average delivery days per month divided by 2,011 routes divided by 302 annual delivery days,
which equals about 440 minutes per route per month.6 We also calculated the office workhours savings for FY 2014 based on our universe of 29 of 114 delivery units with more than 15 routes with a percent to standard higher
than the national average. Questioned costs for FY 2014 was $2,855,087.7 The MAP documents the specific requirements of the integrated operating plan (IOP) between the plant and delivery units. The plan includes track arrival times, as well as
what mail, by type and quantity, will arrive on each trip in order for the unit to be successful.8 The IOP coordinator is responsible for ensuring that a signed agreement exists between plant operations and delivery unit related to the mail arrival profile for each unit.
For FY 2015, 50 of the
Houston District’s 114
delivery units
(44 percent) used 174,912
more office workhours than
necessary (at a cost of $8.3
million), about 17 more
minutes per day or 440 more
minutes per month of office
time per city carrier route.
City Delivery Office Efficiency – Houston District Report Number DR-AR-16-005 4

Office EfficiencyFor FY 2015, Houston District city carriers delivered over 2.1 billion mailpieces on 3,181 routes to more than 2.1 million delivery points. City delivery office workhours totaled 1,830,307 for this period. During FY 2015, the Houston District’s percent to standard was 117.21 percent, 9.19 percentage points above the national average of 108.02. In addition, from FYs 2013 to 2015, the percent to standard for delivery units in the Houston District increased significantly and trended negatively compared to the national average (see Table 1).
Table 1. Comparison of National Percent to Standard to Houston District FYs 2013 to 2015
Source: Postal Service e-Flash Data System.
120
115
110
105100
95
90
Perc
ent t
o St
anda
rd
City Delivery Office Efficiency – Houston District Report Number DR-AR-16-005 5

The Houston District could increase office efficiency and eliminate 174,912 workhours annually – about 17 more minutes per day, or 440 minutes per month, of office time per city carrier route. We visited 30 randomly selected city delivery units (see Appendix B) and identified instances of:
■ Late mail arrival or incorrect mail mix or mail condition at all 30 units.
■ Time-wasting practices by carriers at all 30 units.
■ MAPs that were not used, outdated, or not approved at all 30 units.
■ Managers not enforcing policies and procedures for supervising carriers at 21 units.
Mail Arrival
We observed late mail arrival or incorrect mail mix or mail condition at all 30 units. At 28 of 30 delivery units (93 percent) we visited, mail did not always arrive from the processing and distribution centers on time, and at all 30 delivery units mail did not always arrive in the correct mail mix, as outlined in the MAP. We observed carriers in several units sorting through incorrectly sequenced delivery point sequence9 (DPS) mail from the plant. This practice extended carriers’ time in the office (see Figures 1 and 2).
Figures 1 and 2. Carriers Sorting Through DPS Mail at Delivery Units
Source: U.S. Postal Service Office of Inspector General (OIG) Source: OIG photograph taken February 23, 2016. Photograph taken February 4, 2016.
9 A process for sorting barcoded letter mail at the processing facilities and delivery units into the carrier’s line of travel. Carriers can take mail directly to the street, with no casing time in the office.
City Delivery Office Efficiency – Houston District Report Number DR-AR-16-005 6

Inefficient Office Practices
We observed time-wasting practices by carriers at all 30 units. Specifically, we observed city carriers at 18 of the 30 delivery units (60 percent) loading mail into vehicles on office time rather than clocking10 to street time and carriers at 25 of the 30 delivery units (83 percent) sorting through DPS mail instead of taking this mail directly to the street for delivery. We also observed carriers at 16 of the 30 units (53 percent) making multiple trips to withdraw or return mail at distribution cases.
These inefficient practices resulted in unnecessary office time at the units. Postal Service policy11 states carriers should proceed directly to their vehicles and load the mail in an orderly fashion after clocking onto street time. Postal Service policy12 also states that DPS mail is not to be distributed to carriers but staged near the exit for transport to vehicles. According to Postal Service policy,13 carriers may be authorized to make up to two withdrawals from distribution cases prior to leaving the office, plus a final cleanup sweep to include DPS mail as they leave the office.
Also, carriers at 21 of the 30 delivery units (70 percent) were not efficient during afternoon office time because supervisors were not adequately monitoring them. We observed some carriers spending more than the allotted time in the office after returning from their routes. Further, our review of the Route/Carrier Daily Performance/Analysis Reports for the 30 delivery units we visited showed 418 routes with zero minutes for p.m. office time. This indicates carriers were not clocking back to office time when returning to the unit in the afternoon, resulting in office operations being recorded as street time. This practice can artificially lower a unit’s percent to standard score.
Mail Arrival Profiles
We observed MAPs that were not used, outdated, or not approved at all 30 units. In 23 of the 30 delivery units we visited, MAPs (used to establish staffing levels and mail arrival times by type and quantity) were outdated. Also, at 7 of the 30 units management could not provide a MAP and at one unit the MAP was unsigned. The delivery unit manager or designee is responsible for maintaining a current copy of the MAP to ensure carriers are not delayed.
Enforcing Policies and Procedures
We observed that managers did not enforce policies and procedures for supervising carriers at 21 units. Specifically, management did not always set daily expectations for carrier route performance at 17 of the 30 delivery units (57 percent) we visited. Additionally, supervisors at 19 of the 30 delivery units (63 percent) did not review previous day performance with carriers during morning office operations. Some supervisors had the required reports14 available but did not always discuss them with the carriers.
Supervisors are required to discuss expectations with each carrier every day. Also, if a carrier is not meeting performance standards a supervisor must investigate and discuss deficiencies with that carrier. All delivery service managers should develop and maintain delivery units at a high degree of efficiency and assure Postal Service standards are preserved.15
10 References to clock rings include time entries that are recorded electronically, mechanically (using a time clock), or manually (written in). All bargaining unit and casual employees are required to use time clocks (if available) to record clock rings on their time cards.
11 Handbook M-39, Management of Delivery Services, Section 125.1, March 1998 – Updated March 2004.12 Field Operations Standardization Development, Morning (AM) Standard Operating Procedures (AMSOP) II Guidebook, Section 5-5, 2007.13 Handbook M-39, Management of Delivery Services, Section 125.1, March 1998 – Updated March 2004.14 Field Operations Standardization Development, Morning (AM) Standard Operating Procedures (AMSOP) II Guidebook, Section 5-5, 200715 Handbook M-39, Management of Delivery Services, Section 111.1, March 1998 – Updated March 2004.
City Delivery Office Efficiency – Houston District Report Number DR-AR-16-005 7

For FY 2015, the Houston District used 174,912 more workhours than necessary, resulting in over $11.1 million in questioned costs for FYs 2014 and 2015. Increasing overall efficiency at these delivery units would allow a cost avoidance of almost $44 million over the next 5 years.
Assets at RiskEmployees did not always properly secure and lock stamp stock inventory at seven of the 30 locations we visited. This inventory included cash, money orders, and stamp stock worth $199,046 (see Figures 3, 4, and 5). Physical access controls reduce the security risk to Postal Service employees and safeguarding controls reduces the potential for loss or misappropriation of assets. We brought these issues to the attention of the station managers, who took immediate corrective action. Therefore, we are not making a recommendation on this issue.
Figures 3, 4, and 5. Assets at Risk
Source: OIG photograph taken February 23, 2016. Source: OIG photograph taken February 26, 2016 Source: OIG photograph taken February 2, 2016
City Delivery Office Efficiency – Houston District Report Number DR-AR-16-005 8

Recommendations We recommend the district manager, Houston District:
1. Eliminate 174,912 workhours at delivery units.
2. Eliminate inefficient office practices such as loading vehicles on office time.
3. Increase mail arrival efficiency by preparing up-to-date mail arrival profiles with facility processing managers.
4. Ensure city delivery unit supervisors follow policies and procedures.
Management’s CommentsManagement agreed with the findings, recommendations, and that office workhour savings reductions are necessary, but disagreed with the monetary impact.
Management stated they did not agree with the methodology used to calculate the additional work hours cost of $8,259,588 based on 174,912 workhours. Management indicated that this amount is based on data from FY 2015, which included a major impact from the Area Mail Processing (AMP) consolidation. Management stated there were disconnects associated with the AMP consolidation and mail arrived at the delivery units as late as noon which adversely affected carrier office times but was being reported accurately. Additionally, in the year analyzed by the OIG (FY 2015), the Houston District achieved a 117.21 percent to standard compared with the national target for a major metropolitan district of 108.02 percent. Management also stated that the district has achieved a percent to standard of 107.47 for the past 4 weeks and the units visited are showing improvements.
In response to recommendation 1, management agreed that reducing office workhours is necessary. Management stated that to improve office performance, they changed carrier start times to align with the updated MAPs in the delivery units visited by the OIG. Management stated that a daily percent to standard performance report is sent to Managers of Post Office Operations and Customer Service Operations Managers to review and take appropriate action and correct performance. Management stated they will also monitor office performance daily and also weekly to ensure positive trends in workhour reductions. In subsequent correspondence, management stated this would be completed by January 31, 2017.
In response to recommendation 2, management agreed with the need to eliminate inefficient office practices such as loading vehicles on office time. The district sends out a daily report from operations that generates load time variances. The district will also review carrier flow charts to ensure they are in place in each unit. Also, the Managers of Post Office Operations and Customer Service Operations Managers will make site visits to the delivery units with 15 or more routes with a percent to standard higher than the national average to review opportunity. Management completed as of May 31, 2016.
In response to recommendation 3, management agreed that updated mail arrival profiles will improve mail arrival efficiency. Management stated that the North Houston Plant has scheduled meetings with the Customer Service sites they service to prepare updated MAPs to ensure the proper mail mix; management stated they have completed over 45 percent of the district. Management will also review Postal Service Form 1994, Employee’s Work Schedule, to ensure clerks are scheduled in line with the MAPs. Also, at the district’s daily production control meeting they are discussing the mail arrival impacts, DPS racks and late trips. In addition, a web-based survey was implemented to report irregularities associated with DPS staging and DPS racks to ensure compliance. Management stated this would be completed by May 27, 2016.
We recommend management
eliminate 174,912 workhours
at delivery units by eliminating
inefficient office practices,
preparing up-to-date mail arrival
profiles, and ensuring policies
and procedures are followed.
City Delivery Office Efficiency – Houston District Report Number DR-AR-16-005 9

In response to recommendation 4, management agreed with adherence to Postal Service policies and procedures for supervising city delivery. Management stated additional training will be provided on managing office performance beginning with the 30 delivery units the OIG visited in the district. Management indicated the expected completion date for this recommendation is June 30, 2016.
See Appendix C for management’s comments in their entirety.
Evaluation of Management’s CommentsThe OIG considers management’s comments responsive to the recommendations in the report.
Regarding the impact of the consolidation, preparation for the North Houston Processing and Distribution Center (P&DC) consolidation started September 30, 2010, with the completion of an Area Mail Processing (AMP) study. The North Houston P&DC began processing mail from the Beaumont, TX, and Houston, TX, P&DCs in October 2011 and May 2013, respectively. Additionally, the North Houston P&DC began processing mail from the Houston P&DC in April 2015.16 Overall, these consolidations have resulted in a 51 percent increase in the North Houston P&DC’s mail volume.
Postal Service policy states that AMPs centralize mail processing operations to better use resources, including space, staffing, processing equipment, and transportation; take advantage of state-of-the art technologies available at the gaining facility so mail can be processed more efficiently; support network rationalization and reduce redundancies. AMPs should have minimal impact to customer services, including delivery services.17 According to the policy, a successful transition period should be 6 months or less for an AMP consolidation.18 OIG observations at delivery units occurred in January and February 2016, after the AMP consolidation and transition periods.
In regard to the workhour savings and monetary impact, the OIG based workhour savings calculations on the national average percent to standard for city delivery office efficiency. The OIG calculated the national average using the percent to standard for each of the 67 districts. The OIG’s use of the percent to standard national average is more conservative than comparing districts to the Postal Service’s percent to standard, which is 100 percent. The national percent to standard average the OIG used is representative of all city carrier operations throughout the country regardless of geographical location.
All recommendations require OIG concurrence before closure. Consequently, the OIG requests written confirmation when corrective actions are completed. All recommendations should not be closed in the Postal Service’s follow-up tracking system until the OIG provides written confirmation that the recommendations can be closed.
16 The Postal Service has not yet determined the date for the consolidation of some of its mail from the Beaumont P&DC into the North Houston P&DC.17 Handbook PO-408 Area Mail Processing Guidelines, Section 1.2, March 2008.18 Handbook PO-408 Area Mail Processing Guidelines, Section 6.3, March 2008.
City Delivery Office Efficiency – Houston District Report Number DR-AR-16-005 10

Appendices
Click on the appendix title
to the right to navigate
to the section content.
Appendix A: Additional Information ..........................................................12Background ..........................................................................................12Objectives, Scope, and Methodology ..................................................12Prior Audit Coverage ............................................................................13
Appendix B: Units Randomly Selected for Onsite Observations .............15Appendix C: Management’s Comments ..................................................16
City Delivery Office Efficiency – Houston District Report Number DR-AR-16-005 11

Appendix A: Additional Information
BackgroundCity delivery office operations cover all duties a Postal Service letter carrier performs in the office. These duties include casing mail (placing mail in delivery order), preparing parcels for delivery, and retrieving accountable items. City carriers are delivering more packages and fewer letters to more addresses each year. Accommodating this new growth requires the Postal Service to deliver the increased package volume while maintaining efficiency.
Objectives, Scope, and MethodologyOur objective was to assess the office efficiency of city delivery operations in the Houston District. To accomplish our objective, we
■ Ranked each of the seven areas from highest to lowest in terms of percent to standard for FY 2015. We used the eFlash19 national percent to standard measurement of 108.02 percent as a baseline guide.
■ Selected the Southern Area and, within that area, selected the Houston District for review because it had the 12th highest percent to standard in the nation based on data from eFlash.20 The Houston District’s percent to standard was at 117.21, compared with the national average of 108.02 percent. Additionally, according to the OIG’s quarterly Performance and Results Information System (PARIS) City Delivery Efficiency Risk Model for FY 2015, the Houston District was one of the most at risk districts for city delivery overtime, delayed mail, and carriers returning to the office after 5 p.m.21
■ Analyzed the percent to standard for 114 delivery units in the Houston District and identified a universe of 50 delivery units with 15 or more routes with a percent to standard higher than the national average of 108.02 percent. We randomly selected the 30 units from this universe of 50 to conduct onsite observations of city delivery office operations.
■ Obtained, reviewed, and analyzed city delivery unit data from eFlash and the Enterprise Data Warehouse22 (EDW) for all city carrier routes.
■ Conducted interviews on-site and obtained information on city carrier office operations, unit operations, processes, and procedures.
■ Reviewed documentation and applicable policies and procedures for city delivery and Postal Service handbooks M-3923 and M-41.24
We conducted this performance audit from January 2016 through June 2016, in accordance with generally accepted government auditing standards and included such tests of internal controls as we considered necessary under the circumstances. Those standards require that we plan and perform the audit to obtain sufficient, appropriate evidence to provide a reasonable basis for
19 A weekly operating reporting management system that combines data from Delivery, Mail Processing, Employee Relations, Labor Relations, and Finance. The information is extracted from various host systems and loaded into eFlash.
20 We selected the Houston District over other districts in the Southern Area because we have not conducted city office district efficiency audits since we completed the City Delivery Efficiency-South Florida District audit (project DR-AR-14-004) on March 4, 2013. Additionally, we have conducted city office efficiency audits at several of the other districts in the remaining Postal Service areas since FY 2013
21 Houston District rankings obtained from PARIS City Delivery Efficiency Risk Model reports for FY 2015 Quarter (Q) 1, Q2, Q3, and Q4.22 The repository intended for all data and the central source for information on retail, financial, and operational performance. Mission-critical information is uploaded to the
EDW from transactions that occur across the mail delivery system, points of sale, and other sources.23 Handbook M-39, Management of Delivery Services, March 1998 – updated March 2004.24 Handbook M-41, City Delivery Carriers Duties and Responsibilities, March 1998 – updated April 2001.
City Delivery Office Efficiency – Houston District Report Number DR-AR-16-005 12

our findings and conclusions based on our audit objective. We believe that the evidence obtained provides a reasonable basis for our findings and conclusions based on our audit objective. We discussed our observations and conclusions with management on May 4, 2016, and included their comments where appropriate.
We relied on data primarily from eFlash. We obtained data for all of FY 2015. We did not directly audit the system, but performed a limited data integrity review to support our data reliance. We assessed the reliability of systems’ data by reviewing existing information about the data and the systems that produce them and interviewing agency officials knowledgeable about the data. We determined that the data were sufficiently reliable for the purposes of this report.
Prior Audit Coverage
Report Title Report Number Final Report DateMonetary Impact
(in millions)City Delivery Efficiency – Colorado/Wyoming District DR-AR-16-002 1/20/2016 $46,262,152
Report Results: The Colorado/Wyoming District has opportunities to enhance efficiency in city delivery office operations. From July 1, 2014, through June 30, 2015, 55 of the Colorado/Wyoming District’s 136 delivery units (40 percent) used 179,619 more office workhours, or about 17 more minutes of office time per day per city carrier route, than necessary. These additional workhours cost $8.6 million during this time period. These conditions occurred because mail sometimes arrived late, the mail mix was incorrect, or carriers engaged in time-wasting practices; and IOPs were outdated or non-existent. Finally, managers did not enforce policies and procedures. Eliminating extra workhours would increase overall efficiency at delivery units and allow a one-time cost avoidance of about $8.8 million the following year. We also identified inadequate safeguards over stamp stock and money orders valued at $210,871 at 12 delivery units. Management agreed with our findings and recommendations and conditionally agreed with the workhour savings in the report.
City Delivery Efficiency – San Francisco District DR-AR-15-011 9/15/2015 $14,200,854
Report Results: The San Francisco District has opportunities to enhance efficiency in city delivery office operations. In 2014, 32 of the San Francisco District’s 52 delivery units (62 percent) used 158,847 more office workhours, or about 19 more minutes of office time per day per city carrier route, than necessary. These additional workhours cost $7 million in 2014. These conditions occurred because mail sometimes arrived late, the mail mix was incorrect, or carriers engaged in time-wasting practices; and IOPs were outdated or non-existent. Finally, managers did not enforce policies and procedures. Eliminating extra workhours would increase overall efficiency at delivery units and allow a one-time cost avoidance of about $7.2 million the following year. We also identified inadequate safeguards over stamp stock and money orders valued at $37,542 at four delivery units. Management agreed with our findings and recommendations and conditionally agreed with the workhour savings in the report.
City Delivery Office Efficiency – Houston District Report Number DR-AR-16-005 13
Report Title Report Number Final Report DateMonetary Impact
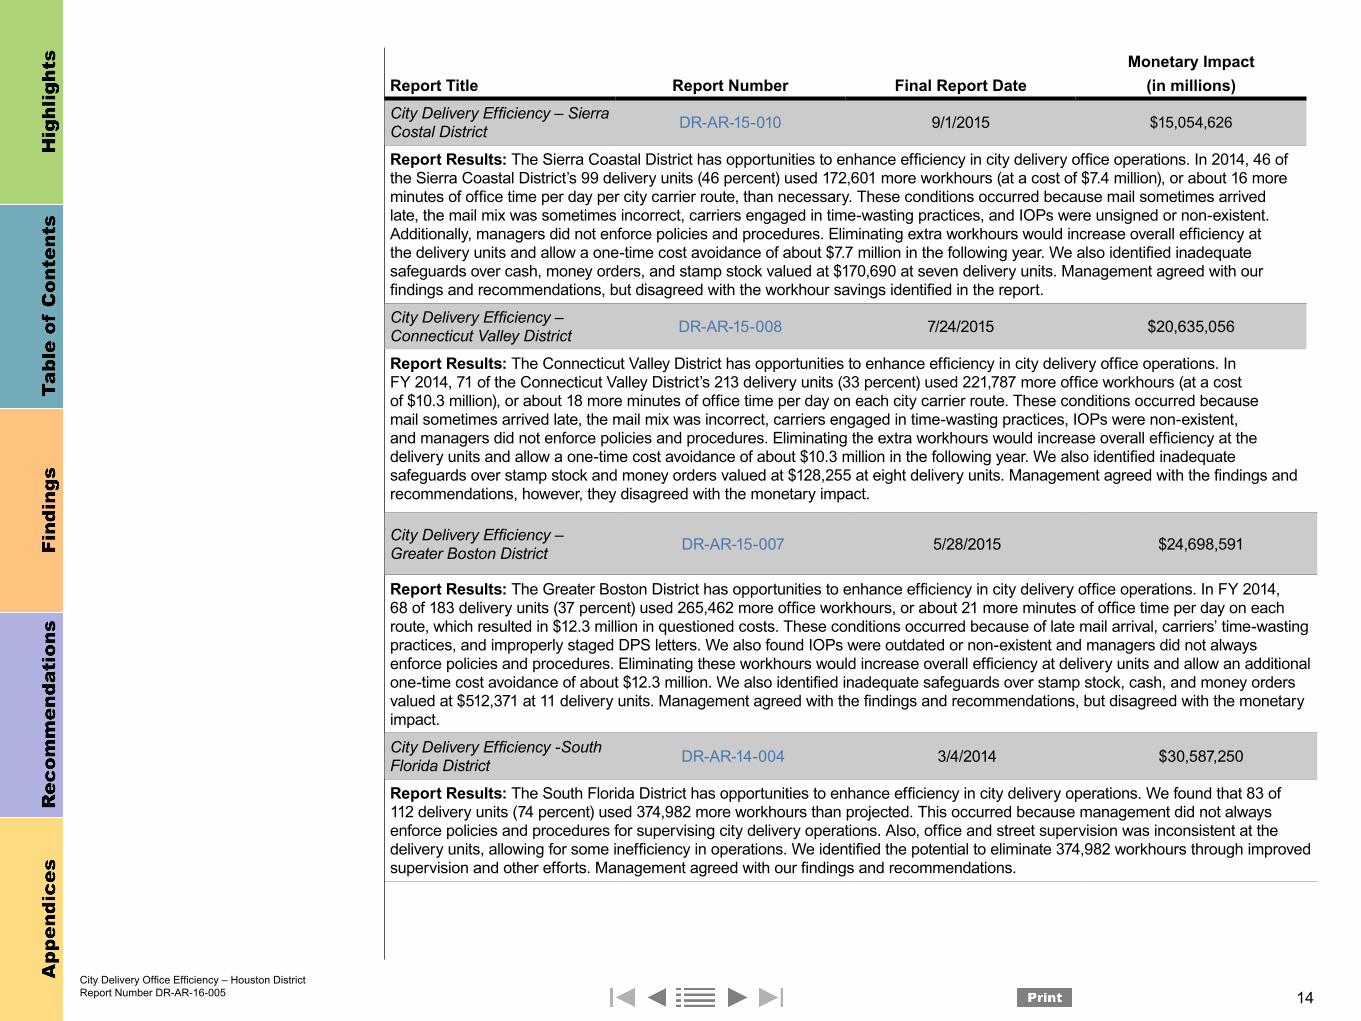
(in millions)City Delivery Efficiency – Sierra Costal District DR-AR-15-010 9/1/2015 $15,054,626
Report Results: The Sierra Coastal District has opportunities to enhance efficiency in city delivery office operations. In 2014, 46 of the Sierra Coastal District’s 99 delivery units (46 percent) used 172,601 more workhours (at a cost of $7.4 million), or about 16 more minutes of office time per day per city carrier route, than necessary. These conditions occurred because mail sometimes arrived late, the mail mix was sometimes incorrect, carriers engaged in time-wasting practices, and IOPs were unsigned or non-existent. Additionally, managers did not enforce policies and procedures. Eliminating extra workhours would increase overall efficiency at the delivery units and allow a one-time cost avoidance of about $7.7 million in the following year. We also identified inadequate safeguards over cash, money orders, and stamp stock valued at $170,690 at seven delivery units. Management agreed with our findings and recommendations, but disagreed with the workhour savings identified in the report.
City Delivery Efficiency – Connecticut Valley District DR-AR-15-008 7/24/2015 $20,635,056
Report Results: The Connecticut Valley District has opportunities to enhance efficiency in city delivery office operations. In FY 2014, 71 of the Connecticut Valley District’s 213 delivery units (33 percent) used 221,787 more office workhours (at a cost of $10.3 million), or about 18 more minutes of office time per day on each city carrier route. These conditions occurred because mail sometimes arrived late, the mail mix was incorrect, carriers engaged in time-wasting practices, IOPs were non-existent, and managers did not enforce policies and procedures. Eliminating the extra workhours would increase overall efficiency at the delivery units and allow a one-time cost avoidance of about $10.3 million in the following year. We also identified inadequate safeguards over stamp stock and money orders valued at $128,255 at eight delivery units. Management agreed with the findings and recommendations, however, they disagreed with the monetary impact.
City Delivery Efficiency – Greater Boston District DR-AR-15-007 5/28/2015 $24,698,591
Report Results: The Greater Boston District has opportunities to enhance efficiency in city delivery office operations. In FY 2014, 68 of 183 delivery units (37 percent) used 265,462 more office workhours, or about 21 more minutes of office time per day on each route, which resulted in $12.3 million in questioned costs. These conditions occurred because of late mail arrival, carriers’ time-wasting practices, and improperly staged DPS letters. We also found IOPs were outdated or non-existent and managers did not always enforce policies and procedures. Eliminating these workhours would increase overall efficiency at delivery units and allow an additional one-time cost avoidance of about $12.3 million. We also identified inadequate safeguards over stamp stock, cash, and money orders valued at $512,371 at 11 delivery units. Management agreed with the findings and recommendations, but disagreed with the monetary impact.
City Delivery Efficiency -South Florida District DR-AR-14-004 3/4/2014 $30,587,250
Report Results: The South Florida District has opportunities to enhance efficiency in city delivery operations. We found that 83 of 112 delivery units (74 percent) used 374,982 more workhours than projected. This occurred because management did not always enforce policies and procedures for supervising city delivery operations. Also, office and street supervision was inconsistent at the delivery units, allowing for some inefficiency in operations. We identified the potential to eliminate 374,982 workhours through improved supervision and other efforts. Management agreed with our findings and recommendations.
City Delivery Office Efficiency – Houston District Report Number DR-AR-16-005 14

Appendix B: Units Randomly Selected for Onsite Observations
City Delivery Office Efficiency – Houston District Report Number DR-AR-16-005 15
Delivery UnitsFY 2015
Percent to StandardNumber of City
Routes1 Spring-Woodlands Metro Branch 201.51% 47
2 Richmond Post Office 171.87% 18
3 Rosenberg Post Office 166.34% 16
4 Sugar Land-First Colony Station 164.05% 18
5 Spring-Panther Creek Branch 160.84% 50
6 Houston-Memorial Park Station 150.08% 53
7 Houston-Oak Forest Station 146.29% 69
8 Houston-James Griffith Station 137.20% 50
9 Spring-Klein Branch 132.95% 61
10 Pasadena-D L Atkinson Station 131.70% 42
11 Sugar Land Post Office 131.54% 40
12 Lake Jackson Post Office 128.88% 30
13 Stafford Post Office 126.93% 19
14 Orange Post Office 126.93% 18
15 Houston-North Shepherd Station 123.44% 98
16 Houston-Windmill Station 123.11% 65
17 Houston-Jensen Drive Station 122.78% 18
18 Houston-De Moss Station 120.03% 73
19 Houston-Ashford West Station 119.56% 64
20 Humble Post Office 115.87% 25
21 Houston-Cornerstone Station 115.44% 36
22 Houston-Granville Elder Station 115.00% 62
23 Houston-Rich Hill Station 114.80% 70
24 Houston-University Station 113.34% 23
25 Houston-Westfield Station 112.87% 33
26 Houston-Denver Harbor Station 112.72% 18
27 League City Post Office 112.38% 43
28 Houston-Medical Center Station 111.79% 35
29 Beaumont-Tobe Hahn Station 111.57% 47
30 Houston-Eastwood Station 108.20% 44
Source: Postal Service e-Flash Data System for FY 2015.

Appendix C: Management’s Comments
City Delivery Office Efficiency – Houston District Report Number DR-AR-16-005 16

City Delivery Office Efficiency – Houston District Report Number DR-AR-16-005 17

City Delivery Office Efficiency – Houston District Report Number DR-AR-16-005 18
Contact Information
City Delivery Office Efficiency – Houston District Report Number DR-AR-16-005 19
Contact us via our Hotline and FOIA forms. Follow us on social networks.
Stay informed.
1735 North Lynn Street Arlington, VA 22209-2020
(703) 248-2100