city of fort wayne utilities - in. · pdf filecity of fort wayne utilities table of contents...
TRANSCRIPT

City of Fort Wayne Utilities
A Division of the City of Fort Wayne, Indiana
Financial Statements
December 31, 2012 & 2011

CITY OF FORT WAYNE UTILITIES Table of Contents
Page INDEPENDENT AUDITORS’ REPORT 1-2 MANAGEMENT’S DISCUSSION AND ANALYSIS 3-9 FINANCIAL STATEMENTS: Statement of Net Position 2012…………………………………………………… 10 Statement of Net Position 2011…………………………………………………… 11 Statement of Revenues, Expenses, and Changes in Net Position 2012…….. 12 Statement of Revenues, Expenses, and Changes in Net Position 2011…….. 13 Statement of Cash Flows 2012………………………………………………….. 14 Statement of Cash Flows 2011………………………………………………….. 15 Notes to Financial Statements 16-41

STATE OF INDIANA
AN EQUAL OPPORTUNITY EMPLOYER STATE BOARD OF ACCOUNTS 302 WEST WASHINGTON STREET ROOM E418 INDIANAPOLIS, INDIANA 46204-2769
Telephone: (317) 232-2513
Fax: (317) 232-4711 Web Site: www.in.gov/sboa
INDEPENDENT AUDITOR'S REPORT
TO: THE OFFICIALS OF THE CITY OF FORT WAYNE UTILITIES, ALLEN COUNTY, INDIANA Report on the Financial Statements We have audited the accompanying financial statements of each major enterprise fund of the City of Fort Wayne Utilities (City Utilities), as of and for the years ended December 31, 2012, and 2011, and the related notes to the financial statements, which collectively comprise the City Utilities’ basic financial statements as listed in the Table of Contents. Management’s Responsibility for the Financial Statements Management is responsible for the preparation and fair presentation of these financial statements in accordance with accounting principles generally accepted in the United States of America; this includes the design, implementation, and maintenance of internal control relevant to the preparation and fair presentation of financial statements that are free from material misstatement, whether due to fraud or error. Auditor’s Responsibility Our responsibility is to express opinions on these financial statements based on our audit. We conducted our audit in accordance with auditing standards generally accepted in the United States of America. Those standards require that we plan and perform the audit to obtain reasonable assurance about whether the financial statements are free of material misstatement. An audit involves performing procedures to obtain audit evidence about the amounts and disclosures in the financial statements. The procedures selected depend on the auditor’s judgment, including the assessment of the risks of material misstatement of the financial statements, whether due to fraud or error. In making those risk assessments, the auditor considers internal control relevant to the entity’s preparation and fair presentation of the financial statements in order to design audit procedures that are appropriate in the circumstances, but not for the purpose of expressing an opinion on the effectiveness of the City Utilities’ internal control. Accordingly, we express no such opinion. An audit includes evaluating the appropriateness of accounting policies used and the reasonableness of significant accounting estimates made by management, as well as evaluating the overall presentation of the financial statement. We believe that the audit evidence obtained is sufficient and appropriate to provide a basis for our audit opinions.

INDEPENDENT AUDITOR'S REPORT (Continued)
Opinions In our opinion, the financial statements referred to above present fairly, in all material respects, the respective financial position of each major fund of the City Utilities as of December 31, 2012, and 2011, and the respective changes in financial position and cash flows, thereof and for the years then ended, in accordance with accounting principles generally accepted in the United States of America. Other Matters
Required Supplementary Information Accounting principles generally accepted in the United States of America require that Management’s Discussion and Analysis, as listed in the table of contents, be presented to supplement the basic financial statements. Such information, although not part of the basic financial statements, is required by the Governmental Accounting Standards Board who considers it to be an essential part of financial reporting for placing the financial statements in an appropriate operational, economic, or historical context. We have applied certain limited procedures to the required supplementary information in accordance with auditing standards generally accepted in the United States of America, which consisted of inquiries of management about the methods of preparing the information and comparing the information for consistency with management’s responses to our inquiries, the basic financial statements and other knowledge we obtained during our audit of the basic financial statements. We do not express an opinion or provide any assurance on the information because the limited procedures do not provide us with sufficient evidence to express an opinion or provide any assurance.
Bruce Hartman - State Examiner State Board of Accounts June 27, 2013
3
Management’s Discussion and Analysis
Introduction As management of the City of Fort Wayne Utilities (Utilities), we offer readers of the Utilities’ financial statements, this narrative overview and analysis of the financial activities of the Utilities for the fiscal years ended December 31, 2012 and 2011. We encourage readers to consider the information presented here in conjunction with additional information that we have furnished in the basic financial statements and the notes to the basic financial statements. Financial Highlights
• In August 2011, the Indiana Utility Regulatory Commission ratified an agreement to transfer (sell) all Electric Utility operating assets in exchange for a multi-year compensation package in excess of $39 million over 15 years. The Utilities recognized a gain of $24.6 million from the transfer. With the exception of a few non-operating capital assets, the Electric Utility transferred its net position valued at $61.4 million to the City’s Community Legacy Fund.
• The assets of the Utilities exceeded its liabilities (net position) as of December 31, 2012, 2011 and 2010 by $481.6 million, $525.3 million and $481.6 million, respectively. The reduction in net position in 2012 reflects the transfer of $61.4 million to the City.
• The Utilities’ net position increased (decreased) for the years ended
December 31, 2012, 2011 and 2010 by ($43.7) million, $43.7 million and $16.2 million, respectively. Excluding the transfer of $61.4 million to the City, the Utilities’ net position increased in 2012 by $17.7 million.
• The Utilities’ added new bonded debt and long-term notes payable for
years ended December 31, 2012, 2011 and 2010 of $100.0 million, $69.4 million and $44.2 million, respectively. The 2012 increase in debt consists of one new Water Revenue Bond, one new Wastewater Revenue Bond, one new Wastewater SRF loan and additional withdrawals against existing SRF loans. The Utilities were able to take advantage of the recent low interest rate financial markets and acquire new long term debt in 2012 at rates ranging from 1.78% to 3.0%. Additionally, refunding bonds issued in late 2012 and early 2013 at rates ranging from 1% to 3% were issued to retire bonds with interest rates ranging from 4% to 5.5%.
• The Utilities’ net investment in capital assets for the years ended
December 31, 2012, 2011 and 2010 increased approximately $57.7

4
million, $27.2 million and $40.3 million, respectively. Significantly, the Utilities continue to meet all 2009-2012 capital investment milestones required by the 2008 Federal Consent Decree.
Overview of the Financial Statements This discussion and analysis is an introduction to the Utilities’ basic financial statements. The Utilities are governmental entities classified as enterprise funds, subsets of proprietary funds. When an entity charges a fee to cover the entire cost of its operation, these services are classified as a proprietary fund. And more specifically, when an entity is self-supported completely by providing services to outside customers, it is an enterprise fund. An enterprise fund’s financial statements are comprised of three statements and the accompanying notes to these statements. The three statements are: 1) statement of net position, 2) statement of revenues, expenses and changes in net position and 3) statement of cash flows. The notes provide additional information that is essential to a full understanding of the data provided in the Utilities’ financial statements. The notes can be found on pages 16-41 of this report. The Utilities provide water, wastewater, stormwater, and yard waste services. The Utilities’ financial statements have been prepared to reflect the activity of each of these services. The Electric Utility’s generation and distribution systems (operating system) were leased to a private firm in 1975 and the entire operating system was purchased by that private firm in 2011. Since 1975 portions of the lease payments were accumulated in a Community Trust Fund and that Trust Fund coupled with the assets generated from the sale of the Electric Utility’s operating assets were transferred to the City Community Legacy Fund in 2012.
2012 2011 2010 $millions % $millions %
Net capital assets 701.0$ 643.3$ 616.1$ 57.7$ 9.0% 27.2$ 4.4%
Other assets 150.7 215.1 132.2 (64.4) -29.9% 82.9 62.7% Total assets 851.7$ 858.4$ 748.3$ (6.7)$ -0.8% 110.1$ 14.7%
Current liabilities 40.9 55.0 53.7 (14.1) -25.6% 1.3 2.4%
Long term liabilities 329.2 278.1 213.0 51.1 18.4% 65.1 30.6%
Total liabilities 370.1 333.1 266.7 37.0 11.1% 66.4 24.9% Total net assets 481.6$ 525.3$ 481.6$ (43.7)$ -8.3% 43.7$ 9.1%
Net invested in capital assets 424.2$ 412.6$ 408.2$ 11.6 2.8% 4.4 1.1%
Restricted 35.7 68.5 56.2 (32.8) -47.9% 12.3 21.9%
Unrestricted 21.7 44.2 17.2 (22.5) -50.9% 27.0 157.0% Total net position 481.6$ 525.3$ 481.6$ (43.7)$ -8.3% 43.7$ 9.1%
December 31 2011-2012 2010-2011
City of Fort Wayne UtilitiesCondensed Statement of Net Position
($millions) Variance Variance
5
2012 2011 2010 $millions % $millions %
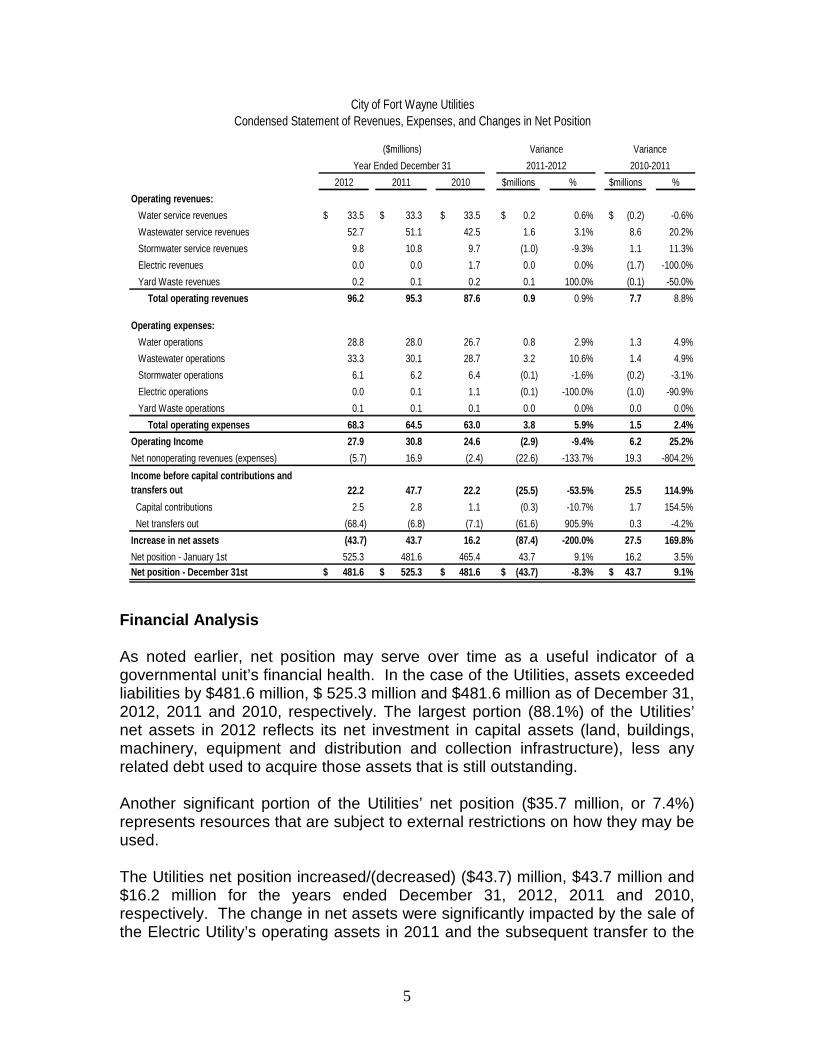
Operating revenues:
Water service revenues 33.5$ 33.3$ 33.5$ 0.2$ 0.6% (0.2)$ -0.6%
Wastewater service revenues 52.7 51.1 42.5 1.6 3.1% 8.6 20.2%
Stormwater service revenues 9.8 10.8 9.7 (1.0) -9.3% 1.1 11.3%
Electric revenues 0.0 0.0 1.7 0.0 0.0% (1.7) -100.0%
Yard Waste revenues 0.2 0.1 0.2 0.1 100.0% (0.1) -50.0%
Total operating revenues 96.2 95.3 87.6 0.9 0.9% 7.7 8.8%
Operating expenses:
Water operations 28.8 28.0 26.7 0.8 2.9% 1.3 4.9%
Wastewater operations 33.3 30.1 28.7 3.2 10.6% 1.4 4.9%
Stormwater operations 6.1 6.2 6.4 (0.1) -1.6% (0.2) -3.1%
Electric operations 0.0 0.1 1.1 (0.1) -100.0% (1.0) -90.9%
Yard Waste operations 0.1 0.1 0.1 0.0 0.0% 0.0 0.0%
Total operating expenses 68.3 64.5 63.0 3.8 5.9% 1 .5 2.4%
Operating Income 27.9 30.8 24.6 (2.9) -9.4% 6.2 25.2%
Net nonoperating revenues (expenses) (5.7) 16.9 (2.4) (22.6) -133.7% 19.3 -804.2%
Income before capital contributions and transfers out 22.2 47.7 22.2 (25.5) -53.5% 25.5 114.9%
Capital contributions 2.5 2.8 1.1 (0.3) -10.7% 1.7 154.5%
Net transfers out (68.4) (6.8) (7.1) (61.6) 905.9% 0.3 -4.2%
Increase in net assets (43.7) 43.7 16.2 (87.4) -200.0% 27 .5 169.8%
Net position - January 1st 525.3 481.6 465.4 43.7 9.1% 16.2 3.5%Net position - December 31st 481.6$ 525.3$ 481.6$ (43.7)$ -8.3% 43.7$ 9.1%
City of Fort Wayne UtilitiesCondensed Statement of Revenues, Expenses, and Changes in Net Position
2010-2011Year Ended December 31 2011-2012
($millions) Variance Variance
Financial Analysis As noted earlier, net position may serve over time as a useful indicator of a governmental unit’s financial health. In the case of the Utilities, assets exceeded liabilities by $481.6 million, $ 525.3 million and $481.6 million as of December 31, 2012, 2011 and 2010, respectively. The largest portion (88.1%) of the Utilities’ net assets in 2012 reflects its net investment in capital assets (land, buildings, machinery, equipment and distribution and collection infrastructure), less any related debt used to acquire those assets that is still outstanding. Another significant portion of the Utilities’ net position ($35.7 million, or 7.4%) represents resources that are subject to external restrictions on how they may be used. The Utilities net position increased/(decreased) ($43.7) million, $43.7 million and $16.2 million for the years ended December 31, 2012, 2011 and 2010, respectively. The change in net assets were significantly impacted by the sale of the Electric Utility’s operating assets in 2011 and the subsequent transfer to the

6
City of the assets generated from the sale coupled with the Community Trust Fund assets.
• In 2011, the Electric Utility sold its operating assets in exchange for a multi-year compensation package in excess of $39 million over 15 years. The Utilities recognized a gain of $24.6 million from the sale. In 2012 and with the exception of a few non-operating capital assets, the Electric Utility transferred its net assets valued at $61.4 million to the City’s Community Legacy Fund. Excluding the impact of the sale of the Electric Utility’s operating assets and the ultimate transfer of assets generated from the sale coupled with the Community Trust Fund assets, net position from continuing operations increased $17.7 million, $19.1 million and $16.2 million for the years ended December 31, 2012, 2011 and 2010, respectively.
Capital Assets and Capital Improvement Program The Utilities total capital assets in service are $893.9 million with an accumulated depreciation of $282.6 million for a net book value of $611.3 million. The statement of net assets also includes $89.7 million in construction in progress reflecting capital projects in various stages of completion. During 2012, approximately $77.3 million was invested in capital projects. Debt At December 31, 2012, the Utilities had approximately $343.8 million in bonds and loans payable, an increase of $62.8 million over last year. The Utilities closed on three new long-term bond/loan issues in 2012. Other than $17.8 million to permanently finance the Water BAN (see Note 9), the bonds’ proceeds were used to fund significant capital expenditures. The new bond/loan issues in 2012 were:
- An open market water revenue bond for $40.0 million payable over 20 years at 3.4%.
- A traditional SRF wastewater loan for up to $10.4 million @ 1.78% payable over 20 years.
- An open market wastewater revenue bond for $15.5 million over 15 years at 2.50%.
In December 2012, the Utilities issued $19.7 million in refunding revenue bonds payable over 10 years at 1.45% to advance refund $20.8 million in 2002A and 2002B Wastewater bonds and loans. In doing this, the Utility in effect lowered its aggregate debt service payment by $4.4 million and realized an economic gain of $2.4 million (see Note 10).

7
In February 2012, the Utilities issued a Bond Anticipation Note (BAN5) of $17.8 million payable within a year with interest at 0.48%. The proceeds were used to retire a Bond Anticipation Note previously issued February 2011. Subsequently, BAN5 was permanently financed with proceeds from 2012 Water revenue bond. The Utilities paid principal (including the refunding transaction) of $55.1 million and $31.9 million in 2012 and 2011, respectively. Economic Factors and Next Year’s Budget and Rates • On December 28, 2007, the Utilities agreed to a Long-Term Control Plan
(LTCP), in the form of a federal Consent Decree, which will ultimately bring the Utilities’ combined storm and sanitary sewer system into compliance with the federal Clean Water Act. The Consent Decree became effective April 1, 2008. The Utilities committed to combined sewer overflow reductions that require an approximate investment of $240.0 million (denominated in 2005 dollars) in infrastructure solutions over the next 18 years. The Utilities also agreed to:
o Eliminate three sanitary sewer overflows at an estimated cost of $31.0
million. o Maintain the entire storm and sewer systems to performance
standards prescribed in the LTCP. o Mitigate assessed penalties with local investments in septic tank
elimination subsidies and rain garden stipends. The Consent Decree further provides for stipulated penalties for failure to achieve specified construction milestones, reporting deadlines or maintenance objectives. The Utilities are in full compliance with terms and conditions of the Consent Decree.
Consistent with the long term nature of the Consent Decree, Fort Wayne City Council (Council) approved a five year rate proposal that generally increased wastewater unit rates by approximately 25% effective July 1, 2009 and again on July 1, 2010-2013 of each year by 15%, 11%, 9% and 9%, respectively.
At that same time, Council authorized the issuance of up to $265 million in debt to fund a six year capital plan that will accomplish a significant portion of the infrastructure investment required to fulfill the requirements of the Consent Decree. As of December 31, 2012, the Utilities have issued $172.8 million debt associated with the $265 million Council authorization. Subsequently, the Utilities issued $75.2 million on March 13, 2013 bringing the total draw against the $265 million authorization to $248 million.
The Utilities are in full compliance with the terms and conditions of the Consent Decree. Significantly, the Utilities completed: the upgrade to the wastewater plant primaries, completed the pilot testing for the capture and
8
disposal of floatables and completed eight combined sewer separation projects. The Utilities also constructed a backflow process that fully treats nearly 1 billion gallons of wastewater per year that previously entered the Maumee River only partially treated. Untreated wastewater storage capacity was increased by nearly 100 million gallons through several CSO pond enhancement projects. The wastewater treatment plant upgrade ultimately will treat up to 85 million gallons per day (mgd), up from 60 mgd. In early 2012, the plant achieved its interim milestone and operates at 70 mdg. Lining wastewater pipelines significantly extends the life of the pipeline, improves overall system flow and reduces reactive maintenance. Since 2008, the Utilities have invested $17.2 million to line approximately 76 miles of pipe. The replacement rate over the previous five years is right at our annual goal of 1% per year.
• In June 2002, the Utilities initiated a condemnation action of Aqua Indiana’s North Assets. On February 12, 2008, the Utilities paid Aqua Indiana $16.9 million, the appraised value, and took possession of those assets. The North Assets were quickly integrated with the Utilities’ water and sewer system and began generating revenues at existing rates from 8,600 new retail water customers and 1,600 new retail sewer customers. Aqua Indiana asserts that the purchase price is inadequate and has sued for unspecified damages.
• The Water Utility successfully acquired SRF funding in 2011 for a ultra-violet
disinfection system (UV system) valued at nearly $20 million. The UV system was selected as the optimal incremental disinfection methodology to comply with an EPA mandate; the Long Term 2 Enhanced Surface Water Treatment Rule. This UV solution is on schedule for completion before the enforcement date of April 2014.
• In 2012, the Indiana Utility Regulatory Commission and Fort Wayne City
Council approved a three year water rate plan increasing water revenues by 33.9%. The water rate increase will be implemented in three annual increments starting in January 2013. The increased revenues will provide funding for many repair and replacement projects but, significantly, up to 9 miles of water main replacement each year. As our infrastructure has aged, funding for our water main replacement program has not kept pace with the increase in our water main breaks. The new revenues will allow us to approach our goal to replace 1%, or ten miles, of our water main pipelines per year
Request for Information This financial report is designed to provide our citizens, taxpayers, customers, and creditors with a general overview of the Utilities’ finances and to show

9
accountability for the money they receive. Questions concerning any of the information provided in this report or requests for additional financial information should be addressed to the Deputy Director of Business Services - City Utilities, City of Fort Wayne Utilities, 200 E Berry Street, Suite 270, Fort Wayne, IN 46802.
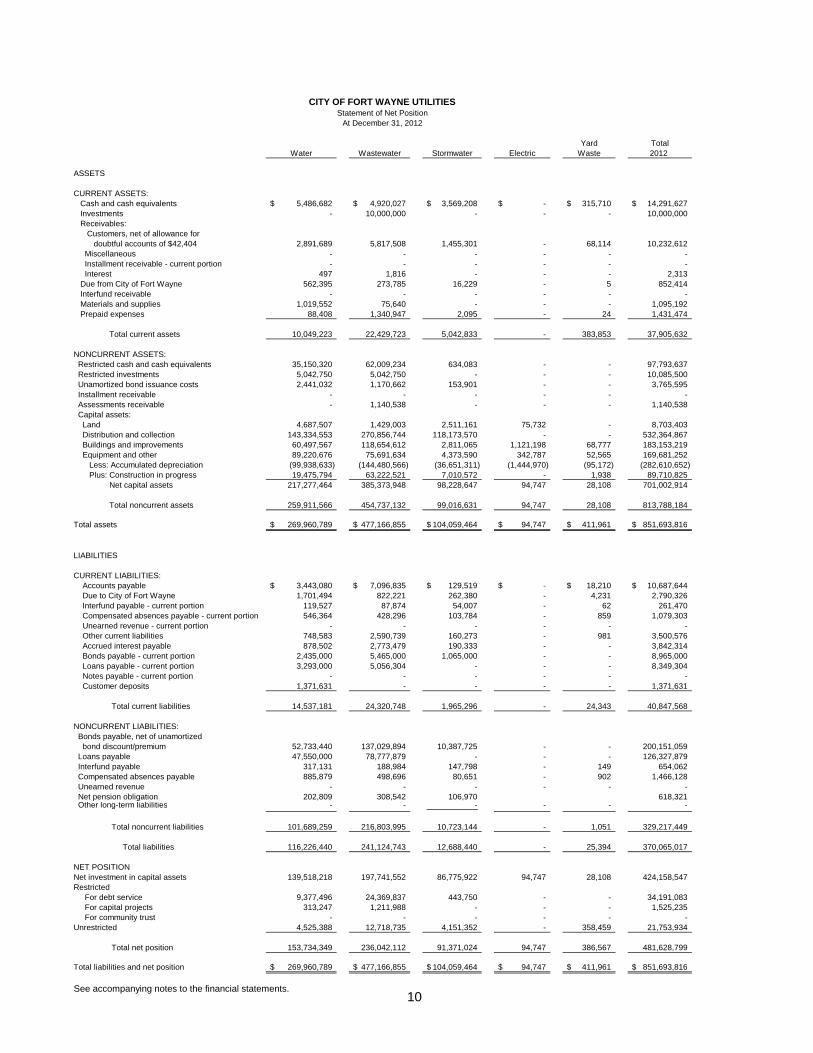
Statement of Net PositionAt December 31, 2012
Yard Total Water Wastewater Stormwater Electric Waste 2012
ASSETS
CURRENT ASSETS: Cash and cash equivalents 5,486,682$ 4,920,027$ 3,569,208$ -$ 315,710$ 14,291,627$ Investments - 10,000,000 - - - 10,000,000 Receivables: Customers, net of allowance for doubtful accounts of $42,404 2,891,689 5,817,508 1,455,301 - 68,114 10,232,612 Miscellaneous - - - - - - Installment receivable - current portion - - - - - - Interest 497 1,816 - - - 2,313 Due from City of Fort Wayne 562,395 273,785 16,229 - 5 852,414 Interfund receivable - - - - - - Materials and supplies 1,019,552 75,640 - - - 1,095,192 Prepaid expenses 88,408 1,340,947 2,095 - 24 1,431,474
Total current assets 10,049,223 22,429,723 5,042,833 - 383,853 37,905,632
NONCURRENT ASSETS: Restricted cash and cash equivalents 35,150,320 62,009,234 634,083 - - 97,793,637 Restricted investments 5,042,750 5,042,750 - - - 10,085,500 Unamortized bond issuance costs 2,441,032 1,170,662 153,901 - - 3,765,595 Installment receivable - - - - - - Assessments receivable - 1,140,538 - - - 1,140,538 Capital assets: Land 4,687,507 1,429,003 2,511,161 75,732 - 8,703,403 Distribution and collection 143,334,553 270,856,744 118,173,570 - - 532,364,867 Buildings and improvements 60,497,567 118,654,612 2,811,065 1,121,198 68,777 183,153,219 Equipment and other 89,220,676 75,691,634 4,373,590 342,787 52,565 169,681,252 Less: Accumulated depreciation (99,938,633) (144,480,566) (36,651,311) (1,444,970) (95,172) (282,610,652) Plus: Construction in progress 19,475,794 63,222,521 7,010,572 - 1,938 89,710,825 Net capital assets 217,277,464 385,373,948 98,228,647 94,747 28,108 701,002,914
Total noncurrent assets 259,911,566 454,737,132 99,016,631 94,747 28,108 813,788,184
Total assets 269,960,789$ 477,166,855$ 104,059,464$ 94,747$ 411,961$ 851,693,816$
LIABILITIES
CURRENT LIABILITIES: Accounts payable 3,443,080$ 7,096,835$ 129,519$ -$ 18,210$ 10,687,644$ Due to City of Fort Wayne 1,701,494 822,221 262,380 - 4,231 2,790,326 Interfund payable - current portion 119,527 87,874 54,007 - 62 261,470 Compensated absences payable - current portion 546,364 428,296 103,784 - 859 1,079,303 Unearned revenue - current portion - - - - - - Other current liabilities 748,583 2,590,739 160,273 - 981 3,500,576 Accrued interest payable 878,502 2,773,479 190,333 - - 3,842,314 Bonds payable - current portion 2,435,000 5,465,000 1,065,000 - - 8,965,000 Loans payable - current portion 3,293,000 5,056,304 - - - 8,349,304 Notes payable - current portion - - - - - - Customer deposits 1,371,631 - - - - 1,371,631
Total current liabilities 14,537,181 24,320,748 1,965,296 - 24,343 40,847,568
NONCURRENT LIABILITIES: Bonds payable, net of unamortized bond discount/premium 52,733,440 137,029,894 10,387,725 - - 200,151,059 Loans payable 47,550,000 78,777,879 - - - 126,327,879 Interfund payable 317,131 188,984 147,798 - 149 654,062 Compensated absences payable 885,879 498,696 80,651 - 902 1,466,128 Unearned revenue - - - - - - Net pension obligation 202,809 308,542 106,970 618,321 Other long-term liabilities - - - - - -
Total noncurrent liabilities 101,689,259 216,803,995 10,723,144 - 1,051 329,217,449
Total liabilities 116,226,440 241,124,743 12,688,440 - 25,394 370,065,017
NET POSITIONNet investment in capital assets 139,518,218 197,741,552 86,775,922 94,747 28,108 424,158,547 Restricted For debt service 9,377,496 24,369,837 443,750 - - 34,191,083 For capital projects 313,247 1,211,988 - - - 1,525,235 For community trust - - - - - - Unrestricted 4,525,388 12,718,735 4,151,352 - 358,459 21,753,934
Total net position 153,734,349 236,042,112 91,371,024 94,747 386,567 481,628,799
Total liabilities and net position 269,960,789$ 477,166,855$ 104,059,464$ 94,747$ 411,961$ 851,693,816$
See accompanying notes to the financial statements.
CITY OF FORT WAYNE UTILITIES
10
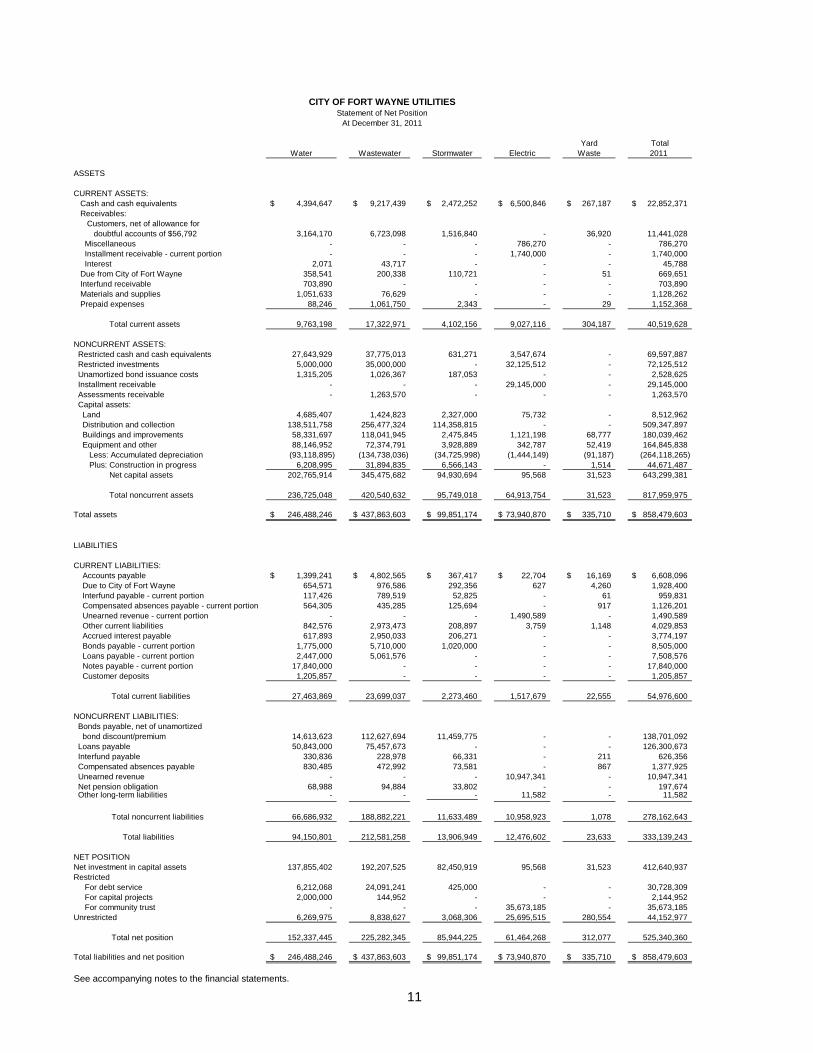
Yard TotalWater Wastewater Stormwater Electric Waste 2011
ASSETS
CURRENT ASSETS: Cash and cash equivalents 4,394,647$ 9,217,439$ 2,472,252$ 6,500,846$ 267,187$ 22,852,371$ Receivables: Customers, net of allowance for doubtful accounts of $56,792 3,164,170 6,723,098 1,516,840 - 36,920 11,441,028 Miscellaneous - - - 786,270 - 786,270 Installment receivable - current portion - - - 1,740,000 - 1,740,000 Interest 2,071 43,717 - - - 45,788 Due from City of Fort Wayne 358,541 200,338 110,721 - 51 669,651 Interfund receivable 703,890 - - - - 703,890 Materials and supplies 1,051,633 76,629 - - - 1,128,262 Prepaid expenses 88,246 1,061,750 2,343 - 29 1,152,368
Total current assets 9,763,198 17,322,971 4,102,156 9,027,116 304,187 40,519,628
NONCURRENT ASSETS: Restricted cash and cash equivalents 27,643,929 37,775,013 631,271 3,547,674 - 69,597,887 Restricted investments 5,000,000 35,000,000 - 32,125,512 - 72,125,512 Unamortized bond issuance costs 1,315,205 1,026,367 187,053 - - 2,528,625 Installment receivable - - - 29,145,000 - 29,145,000 Assessments receivable - 1,263,570 - - - 1,263,570 Capital assets: Land 4,685,407 1,424,823 2,327,000 75,732 - 8,512,962 Distribution and collection 138,511,758 256,477,324 114,358,815 - - 509,347,897 Buildings and improvements 58,331,697 118,041,945 2,475,845 1,121,198 68,777 180,039,462 Equipment and other 88,146,952 72,374,791 3,928,889 342,787 52,419 164,845,838 Less: Accumulated depreciation (93,118,895) (134,738,036) (34,725,998) (1,444,149) (91,187) (264,118,265) Plus: Construction in progress 6,208,995 31,894,835 6,566,143 - 1,514 44,671,487 Net capital assets 202,765,914 345,475,682 94,930,694 95,568 31,523 643,299,381
Total noncurrent assets 236,725,048 420,540,632 95,749,018 64,913,754 31,523 817,959,975
Total assets 246,488,246$ 437,863,603$ 99,851,174$ 73,940,870$ 335,710$ 858,479,603$
LIABILITIES
CURRENT LIABILITIES: Accounts payable 1,399,241$ 4,802,565$ 367,417$ 22,704$ 16,169$ 6,608,096$ Due to City of Fort Wayne 654,571 976,586 292,356 627 4,260 1,928,400 Interfund payable - current portion 117,426 789,519 52,825 - 61 959,831 Compensated absences payable - current portion 564,305 435,285 125,694 - 917 1,126,201 Unearned revenue - current portion - - - 1,490,589 - 1,490,589 Other current liabilities 842,576 2,973,473 208,897 3,759 1,148 4,029,853 Accrued interest payable 617,893 2,950,033 206,271 - - 3,774,197 Bonds payable - current portion 1,775,000 5,710,000 1,020,000 - - 8,505,000 Loans payable - current portion 2,447,000 5,061,576 - - - 7,508,576 Notes payable - current portion 17,840,000 - - - - 17,840,000 Customer deposits 1,205,857 - - - - 1,205,857
Total current liabilities 27,463,869 23,699,037 2,273,460 1,517,679 22,555 54,976,600
NONCURRENT LIABILITIES: Bonds payable, net of unamortized bond discount/premium 14,613,623 112,627,694 11,459,775 - - 138,701,092 Loans payable 50,843,000 75,457,673 - - - 126,300,673 Interfund payable 330,836 228,978 66,331 - 211 626,356 Compensated absences payable 830,485 472,992 73,581 - 867 1,377,925 Unearned revenue - - - 10,947,341 - 10,947,341 Net pension obligation 68,988 94,884 33,802 - - 197,674 Other long-term liabilities - - - 11,582 - 11,582
Total noncurrent liabilities 66,686,932 188,882,221 11,633,489 10,958,923 1,078 278,162,643
Total liabilities 94,150,801 212,581,258 13,906,949 12,476,602 23,633 333,139,243
NET POSITIONNet investment in capital assets 137,855,402 192,207,525 82,450,919 95,568 31,523 412,640,937 Restricted For debt service 6,212,068 24,091,241 425,000 - - 30,728,309 For capital projects 2,000,000 144,952 - - - 2,144,952 For community trust - - - 35,673,185 - 35,673,185 Unrestricted 6,269,975 8,838,627 3,068,306 25,695,515 280,554 44,152,977
Total net position 152,337,445 225,282,345 85,944,225 61,464,268 312,077 525,340,360
Total liabilities and net position 246,488,246$ 437,863,603$ 99,851,174$ 73,940,870$ 335,710$ 858,479,603$
See accompanying notes to the financial statements.
CITY OF FORT WAYNE UTILITIESStatement of Net Position
At December 31, 2011
11
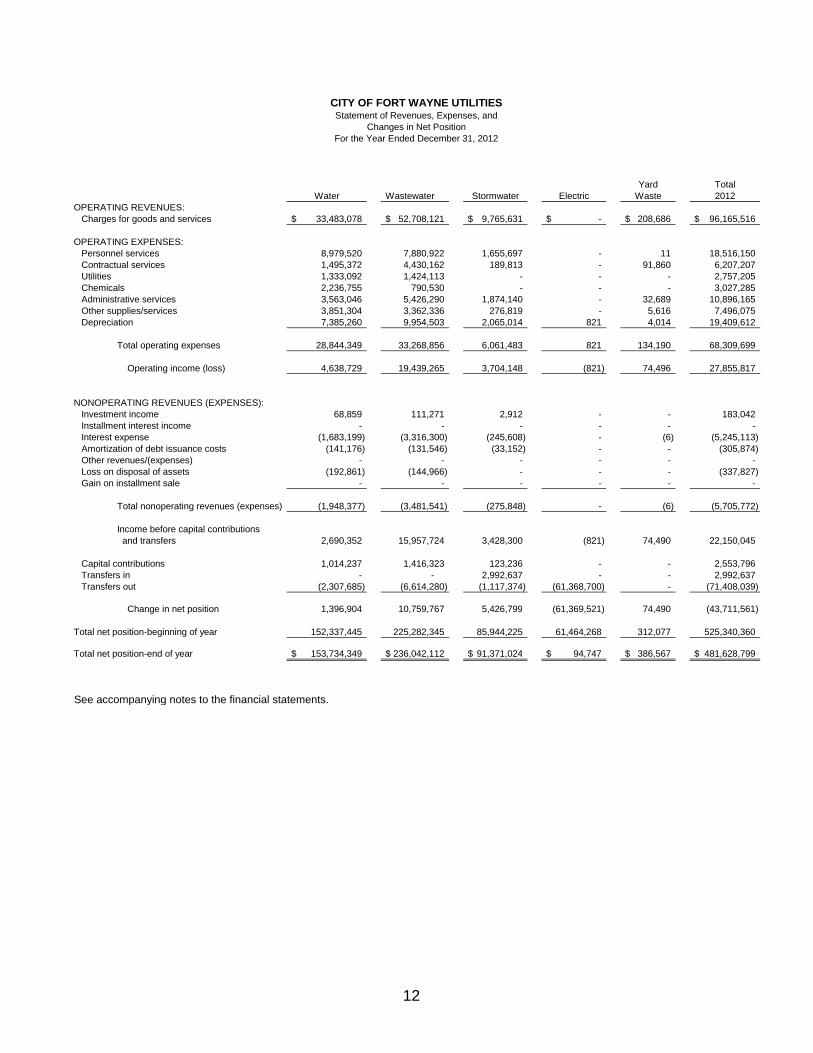
Yard TotalWater Wastewater Stormwater Electric Waste 2012
OPERATING REVENUES: Charges for goods and services 33,483,078$ 52,708,121$ 9,765,631$ -$ 208,686$ 96,165,516$
OPERATING EXPENSES: Personnel services 8,979,520 7,880,922 1,655,697 - 11 18,516,150 Contractual services 1,495,372 4,430,162 189,813 - 91,860 6,207,207 Utilities 1,333,092 1,424,113 - - - 2,757,205 Chemicals 2,236,755 790,530 - - - 3,027,285 Administrative services 3,563,046 5,426,290 1,874,140 - 32,689 10,896,165 Other supplies/services 3,851,304 3,362,336 276,819 - 5,616 7,496,075 Depreciation 7,385,260 9,954,503 2,065,014 821 4,014 19,409,612
Total operating expenses Total operating expenses28,844,349 Total operating expenses33,268,856 Total operating expenses6,061,483 Total operating expenses821 Total operating expenses134,190 Total operating expenses68,309,699
Operating income (loss) 4,638,729 19,439,265 3,704,148 (821) 74,496 27,855,817
NONOPERATING REVENUES (EXPENSES): Investment income 68,859 111,271 2,912 - - 183,042 Installment interest income - - - - - - Interest expense (1,683,199) (3,316,300) (245,608) - (6) (5,245,113) Amortization of debt issuance costs (141,176) (131,546) (33,152) - - (305,874) Other revenues/(expenses) - - - - - - Loss on disposal of assets (192,861) (144,966) - - - (337,827) Gain on installment sale - - - - - -
Total nonoperating revenues (expenses) (1,948,377) (3,481,541) (275,848) - (6) (5,705,772)
Income before capital contributions and transfers 2,690,352 15,957,724 3,428,300 (821) 74,490 22,150,045
Capital contributions 1,014,237 1,416,323 123,236 - - 2,553,796 Transfers in - - 2,992,637 - - 2,992,637 Transfers out (2,307,685) (6,614,280) (1,117,374) (61,368,700) - (71,408,039)
Change in net position 1,396,904 10,759,767 5,426,799 (61,369,521) 74,490 (43,711,561)
Total net position-beginning of year 152,337,445 225,282,345 85,944,225 61,464,268 312,077 525,340,360
Total net position-end of year 153,734,349$ 236,042,112$ 91,371,024$ 94,747$ 386,567$ 481,628,799$
See accompanying notes to the financial statements.
CITY OF FORT WAYNE UTILITIESStatement of Revenues, Expenses, and
Changes in Net PositionFor the Year Ended December 31, 2012
12

Yard TotalWater Wastewater Stormwater Electric Waste 2011
OPERATING REVENUES: Charges for goods and services 33,299,143$ 51,105,546$ 10,866,155$ -$ 153,582$ 95,424,426$
OPERATING EXPENSES: Personnel services 8,425,363 7,736,693 1,754,531 - 11 17,916,598 Contractual services 1,157,242 2,284,012 234,182 - 90,360 3,765,796 Utilities 1,356,920 1,482,828 - - - 2,839,748 Chemicals 2,462,612 618,977 - - - 3,081,589 Administrative services 3,613,178 4,973,312 1,765,058 2,952 31,148 10,385,648 Other supplies/services 3,717,369 3,442,245 479,848 68,616 4,407 7,712,485 Depreciation 7,275,176 9,593,765 2,012,134 857 4,361 18,886,293
Total operating expenses Total operating expenses28,007,860 Total operating expenses30,131,832 Total operating expenses6,245,753 Total operating expenses72,425 130,287 Total operating expenses64,588,157
Operating income (loss) 5,291,283 20,973,714 4,620,402 (72,425) 23,295 30,836,269
NONOPERATING REVENUES (EXPENSES): Investment income 11,002 89,205 1,555 (1,329,996) - (1,228,234) Installment interest income - - - 1,511,890 - 1,511,890 Interest expense (1,652,894) (3,631,447) (344,428) - (3) (5,628,772) Amortization of debt issuance costs (93,791) (132,087) (35,746) - - (261,624) Other revenues/(expenses) - - - (84,136) - (84,136) Loss on disposal of assets (418,116) (1,546,844) (18,819) (78,535) (242) (2,062,556) Gain on installment sale - - - 24,629,200 - 24,629,200
Total nonoperating revenues (expenses) (2,153,799) (5,221,173) (397,438) 24,648,423 (245) 16,875,768
Income before capital contributions and transfers 3,137,484 15,752,541 4,222,964 24,575,998 23,050 47,712,037
Capital contributions 1,367,342 1,255,371 170,783 - - 2,793,496 Transfers in - - 3,925,240 - - 3,925,240 Transfers out (2,386,426) (7,325,903) (998,557) - - (10,710,886)
Change in net position 2,118,400 9,682,009 7,320,430 24,575,998 23,050 43,719,887
Total net position-beginning of year 150,219,045 215,600,336 78,623,795 36,888,270 289,027 481,620,473
Total net position-end of year 152,337,445$ 225,282,345$ 85,944,225$ 61,464,268$ 312,077$ 525,340,360$
See accompanying notes to the financial statements.
CITY OF FORT WAYNE UTILITIESStatement of Revenues, Expenses, and
Changes in Net PositionFor the Year Ended December 31, 2011
13
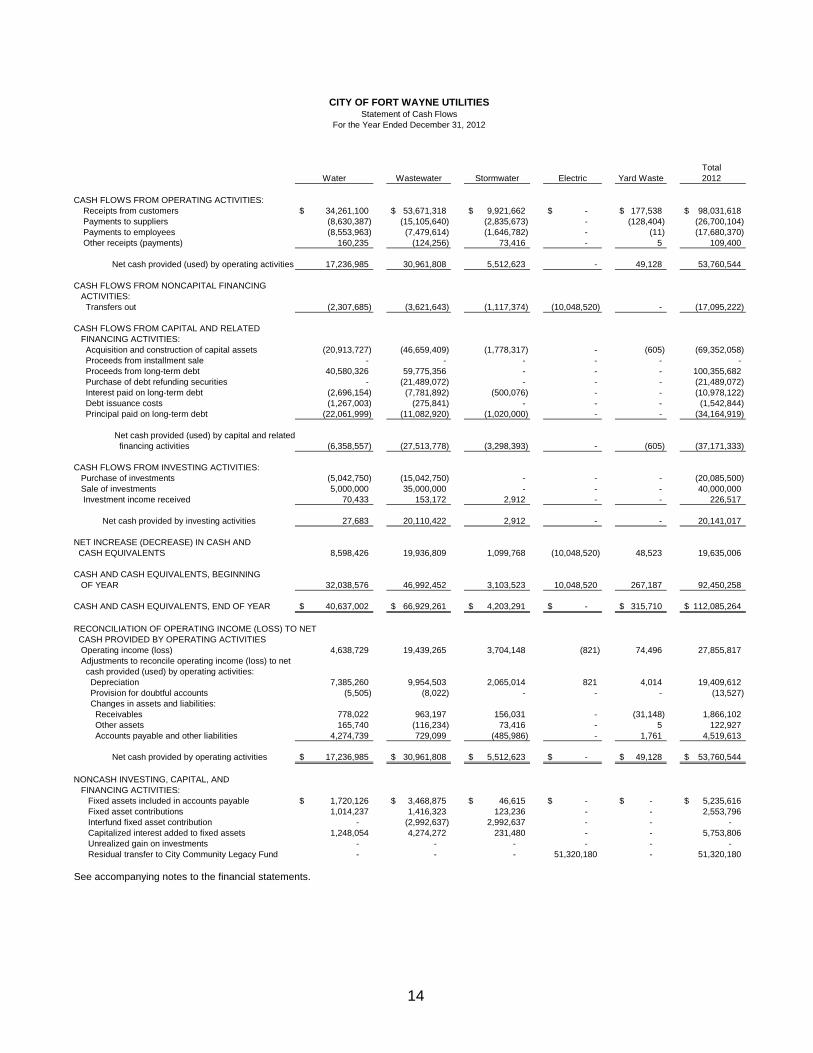
Total Water Wastewater Stormwater Electric Yard Waste 2012
CASH FLOWS FROM OPERATING ACTIVITIES: Receipts from customers 34,261,100$ 53,671,318$ 9,921,662$ -$ 177,538$ 98,031,618$ Payments to suppliers (8,630,387) (15,105,640) (2,835,673) - (128,404) (26,700,104) Payments to employees (8,553,963) (7,479,614) (1,646,782) - (11) (17,680,370) Other receipts (payments) 160,235 (124,256) 73,416 - 5 109,400
Net cash provided (used) by operating activities 17,236,985 30,961,808 5,512,623 - 49,128 53,760,544
CASH FLOWS FROM NONCAPITAL FINANCING ACTIVITIES: Transfers out (2,307,685) (3,621,643) (1,117,374) (10,048,520) - (17,095,222)
CASH FLOWS FROM CAPITAL AND RELATED FINANCING ACTIVITIES: Acquisition and construction of capital assets (20,913,727) (46,659,409) (1,778,317) - (605) (69,352,058) Proceeds from installment sale - - - - - - Proceeds from long-term debt 40,580,326 59,775,356 - - - 100,355,682 Purchase of debt refunding securities - (21,489,072) - - - (21,489,072) Interest paid on long-term debt (2,696,154) (7,781,892) (500,076) - - (10,978,122) Debt issuance costs (1,267,003) (275,841) - - - (1,542,844) Principal paid on long-term debt (22,061,999) (11,082,920) (1,020,000) - - (34,164,919)
Net cash provided (used) by capital and related financing activities (6,358,557) (27,513,778) (3,298,393) - (605) (37,171,333)
CASH FLOWS FROM INVESTING ACTIVITIES: Purchase of investments (5,042,750) (15,042,750) - - - (20,085,500) Sale of investments 5,000,000 35,000,000 - - - 40,000,000 Investment income received 70,433 153,172 2,912 - - 226,517
Net cash provided by investing activities 27,683 20,110,422 2,912 - - 20,141,017
NET INCREASE (DECREASE) IN CASH AND CASH EQUIVALENTS 8,598,426 19,936,809 1,099,768 (10,048,520) 48,523 19,635,006
CASH AND CASH EQUIVALENTS, BEGINNING OF YEAR 32,038,576 46,992,452 3,103,523 10,048,520 267,187 92,450,258
CASH AND CASH EQUIVALENTS, END OF YEAR 40,637,002$ 66,929,261$ 4,203,291$ -$ 315,710$ 112,085,264$
RECONCILIATION OF OPERATING INCOME (LOSS) TO NET CASH PROVIDED BY OPERATING ACTIVITIES Operating income (loss) 4,638,729 19,439,265 3,704,148 (821) 74,496 27,855,817 Adjustments to reconcile operating income (loss) to net cash provided (used) by operating activities: Depreciation 7,385,260 9,954,503 2,065,014 821 4,014 19,409,612 Provision for doubtful accounts (5,505) (8,022) - - - (13,527) Changes in assets and liabilities: Receivables 778,022 963,197 156,031 - (31,148) 1,866,102 Other assets 165,740 (116,234) 73,416 - 5 122,927 Accounts payable and other liabilities 4,274,739 729,099 (485,986) - 1,761 4,519,613
Net cash provided by operating activities 17,236,985$ 30,961,808$ 5,512,623$ -$ 49,128$ 53,760,544$
NONCASH INVESTING, CAPITAL, AND FINANCING ACTIVITIES: Fixed assets included in accounts payable 1,720,126$ 3,468,875$ 46,615$ -$ -$ 5,235,616$ Fixed asset contributions 1,014,237 1,416,323 123,236 - - 2,553,796 Interfund fixed asset contribution - (2,992,637) 2,992,637 - - - Capitalized interest added to fixed assets 1,248,054 4,274,272 231,480 - - 5,753,806 Unrealized gain on investments - - - - - - Residual transfer to City Community Legacy Fund - - - 51,320,180 - 51,320,180
See accompanying notes to the financial statements.
CITY OF FORT WAYNE UTILITIESStatement of Cash Flows
For the Year Ended December 31, 2012
14
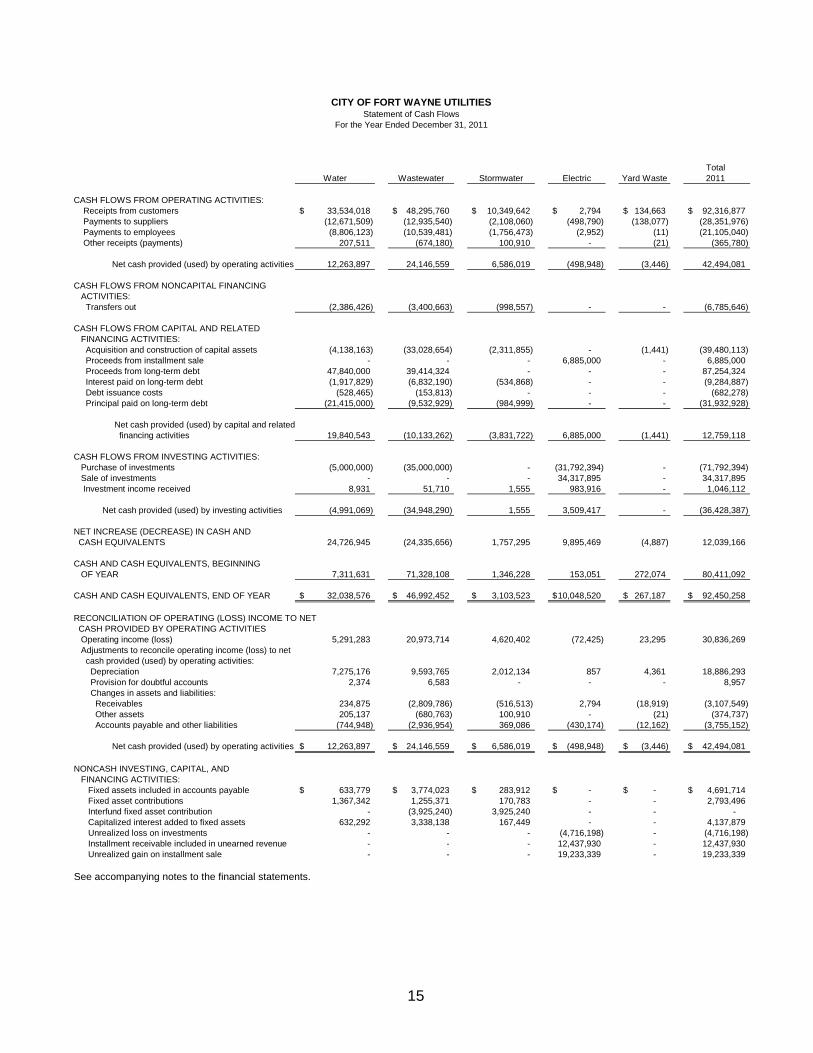
Total Water Wastewater Stormwater Electric Yard Waste 2011
CASH FLOWS FROM OPERATING ACTIVITIES: Receipts from customers 33,534,018$ 48,295,760$ 10,349,642$ 2,794$ 134,663$ 92,316,877$ Payments to suppliers (12,671,509) (12,935,540) (2,108,060) (498,790) (138,077) (28,351,976) Payments to employees (8,806,123) (10,539,481) (1,756,473) (2,952) (11) (21,105,040) Other receipts (payments) 207,511 (674,180) 100,910 - (21) (365,780)
Net cash provided (used) by operating activities 12,263,897 24,146,559 6,586,019 (498,948) (3,446) 42,494,081
CASH FLOWS FROM NONCAPITAL FINANCING ACTIVITIES: Transfers out (2,386,426) (3,400,663) (998,557) - - (6,785,646)
CASH FLOWS FROM CAPITAL AND RELATED FINANCING ACTIVITIES: Acquisition and construction of capital assets (4,138,163) (33,028,654) (2,311,855) - (1,441) (39,480,113) Proceeds from installment sale - - - 6,885,000 - 6,885,000 Proceeds from long-term debt 47,840,000 39,414,324 - - - 87,254,324 Interest paid on long-term debt (1,917,829) (6,832,190) (534,868) - - (9,284,887) Debt issuance costs (528,465) (153,813) - - - (682,278) Principal paid on long-term debt (21,415,000) (9,532,929) (984,999) - - (31,932,928)
Net cash provided (used) by capital and related financing activities 19,840,543 (10,133,262) (3,831,722) 6,885,000 (1,441) 12,759,118
CASH FLOWS FROM INVESTING ACTIVITIES: Purchase of investments (5,000,000) (35,000,000) - (31,792,394) - (71,792,394) Sale of investments - - - 34,317,895 - 34,317,895 Investment income received 8,931 51,710 1,555 983,916 - 1,046,112
Net cash provided (used) by investing activities (4,991,069) (34,948,290) 1,555 3,509,417 - (36,428,387)
NET INCREASE (DECREASE) IN CASH AND CASH EQUIVALENTS 24,726,945 (24,335,656) 1,757,295 9,895,469 (4,887) 12,039,166
CASH AND CASH EQUIVALENTS, BEGINNING OF YEAR 7,311,631 71,328,108 1,346,228 153,051 272,074 80,411,092
CASH AND CASH EQUIVALENTS, END OF YEAR 32,038,576$ 46,992,452$ 3,103,523$ 10,048,520$ 267,187$ 92,450,258$
RECONCILIATION OF OPERATING (LOSS) INCOME TO NET CASH PROVIDED BY OPERATING ACTIVITIES Operating income (loss) 5,291,283 20,973,714 4,620,402 (72,425) 23,295 30,836,269 Adjustments to reconcile operating income (loss) to net cash provided (used) by operating activities: Depreciation 7,275,176 9,593,765 2,012,134 857 4,361 18,886,293 Provision for doubtful accounts 2,374 6,583 - - - 8,957 Changes in assets and liabilities: Receivables 234,875 (2,809,786) (516,513) 2,794 (18,919) (3,107,549) Other assets 205,137 (680,763) 100,910 - (21) (374,737) Accounts payable and other liabilities (744,948) (2,936,954) 369,086 (430,174) (12,162) (3,755,152)
Net cash provided (used) by operating activities 12,263,897$ 24,146,559$ 6,586,019$ (498,948)$ (3,446)$ 42,494,081$
NONCASH INVESTING, CAPITAL, AND FINANCING ACTIVITIES: Fixed assets included in accounts payable 633,779$ 3,774,023$ 283,912$ -$ -$ 4,691,714$ Fixed asset contributions 1,367,342 1,255,371 170,783 - - 2,793,496 Interfund fixed asset contribution - (3,925,240) 3,925,240 - - - Capitalized interest added to fixed assets 632,292 3,338,138 167,449 - - 4,137,879 Unrealized loss on investments - - - (4,716,198) - (4,716,198) Installment receivable included in unearned revenue - - - 12,437,930 - 12,437,930 Unrealized gain on installment sale - - - 19,233,339 - 19,233,339
See accompanying notes to the financial statements.
CITY OF FORT WAYNE UTILITIESStatement of Cash Flows
For the Year Ended December 31, 2011
15

CITY OF FORT WAYNE UTILITIES Notes to Financial Statements December 31, 2012 and 2011
16
(1) Nature of Operations and Significant Accounting Policies Financial Reporting Entity The City of Fort Wayne Utilities (the Utilities) are collectively, a division of the City of Fort Wayne, Indiana. The Utilities consist of Water, Wastewater, Stormwater, and Electric utilities in addition to the Yard Waste facility. All five areas are considered proprietary in nature. The electric utility generation and distribution systems were sold to a private firm in 2010 (see Note 6). Basis of Accounting and Financial Reporting The Utilities prepare their financial statements on the accrual basis of accounting in conformity with accounting principles generally accepted in the United States of America as applied to governmental units. The preparation of financial statements in conformity with accounting principles generally accepted in the United States of America requires management to make estimates and assumptions that affect the reported amounts of assets and liabilities and disclosure of contingent assets and liabilities at the date of the financial statements and the reported amounts of revenues, expenses and other changes in net assets during the reporting period. Actual results could differ from those estimates. Cash Equivalents For purposes of the combined statement of cash flows, the Utilities consider all highly liquid investments (including restricted assets) with maturity of three months or less when purchased to be cash equivalents. Investments Investments are stated at fair value, except for short-term (less than one year), highly liquid investments (i.e. Certificates of Deposit, U.S. Treasury Securities, etc.), which are reported at cost or amortized cost. Restricted Assets/Net Position All restricted assets/net position, as presented in the accompanying financial statements, are restricted due to enabling legislation.
CITY OF FORT WAYNE UTILITIES Notes to Financial Statements December 31, 2012 and 2011
17
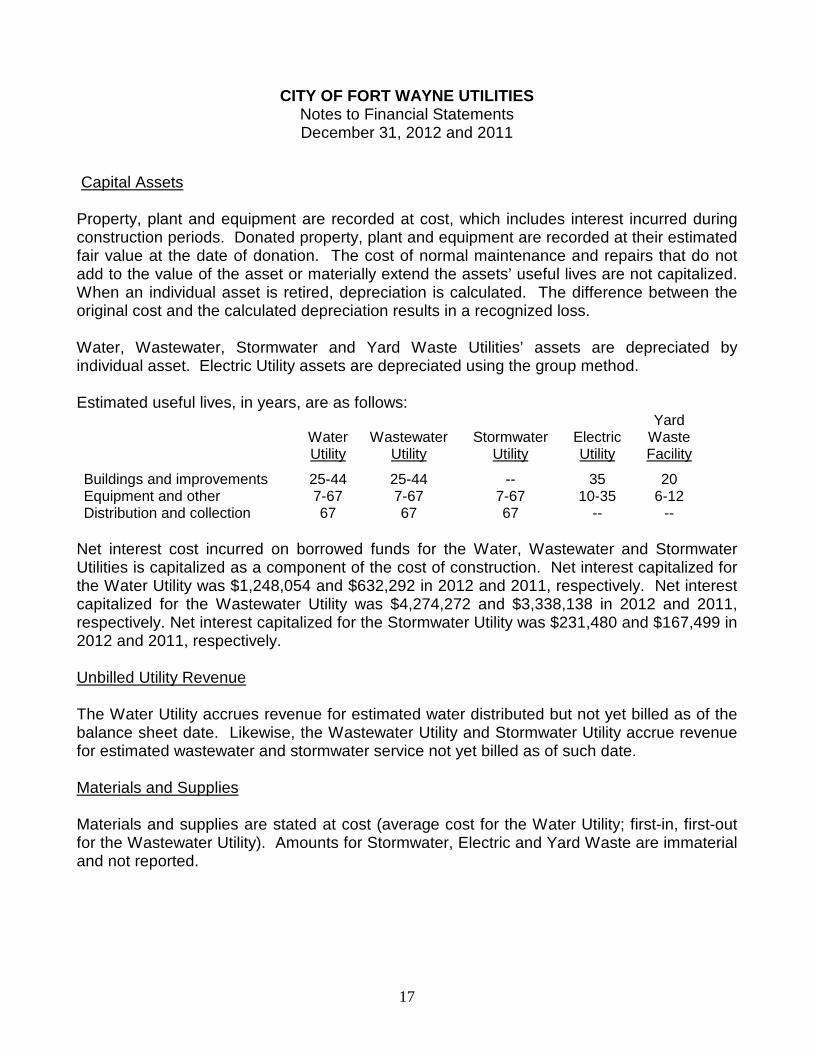
Capital Assets Property, plant and equipment are recorded at cost, which includes interest incurred during construction periods. Donated property, plant and equipment are recorded at their estimated fair value at the date of donation. The cost of normal maintenance and repairs that do not add to the value of the asset or materially extend the assets’ useful lives are not capitalized. When an individual asset is retired, depreciation is calculated. The difference between the original cost and the calculated depreciation results in a recognized loss. Water, Wastewater, Stormwater and Yard Waste Utilities’ assets are depreciated by individual asset. Electric Utility assets are depreciated using the group method. Estimated useful lives, in years, are as follows:
Water
Wastewater
Stormwater
Electric
Yard Waste
Utility Utility Utility Utility Facility
Buildings and improvements 25-44 25-44 -- 35 20 Equipment and other 7-67 7-67 7-67 10-35 6-12 Distribution and collection 67 67 67 -- --
Net interest cost incurred on borrowed funds for the Water, Wastewater and Stormwater Utilities is capitalized as a component of the cost of construction. Net interest capitalized for the Water Utility was $1,248,054 and $632,292 in 2012 and 2011, respectively. Net interest capitalized for the Wastewater Utility was $4,274,272 and $3,338,138 in 2012 and 2011, respectively. Net interest capitalized for the Stormwater Utility was $231,480 and $167,499 in 2012 and 2011, respectively. Unbilled Utility Revenue The Water Utility accrues revenue for estimated water distributed but not yet billed as of the balance sheet date. Likewise, the Wastewater Utility and Stormwater Utility accrue revenue for estimated wastewater and stormwater service not yet billed as of such date. Materials and Supplies Materials and supplies are stated at cost (average cost for the Water Utility; first-in, first-out for the Wastewater Utility). Amounts for Stormwater, Electric and Yard Waste are immaterial and not reported.
CITY OF FORT WAYNE UTILITIES Notes to Financial Statements December 31, 2012 and 2011
18
Bond Issuance Costs, Discounts and Premiums Bond issuance costs, discounts and premiums are amortized over the lives of the respective bond issues using the interest method. Compensated Absences Employees earn vacation at rates from ten days to twenty-five days per year, based on the number of years of service. One year of unused vacation leave may be carried over to the next. Unpaid vacation pay is recorded as a liability as the benefits accrue to the employee. Accrued compensated absences for Utilities’ personnel are charged as an operating expense, using the vesting method, based on earned but unused vacation and sick leave days including the Utilities’ share of social security and medicare taxes. Unused sick leave may be carried over from year to year. City employees must have completed ten years of service to receive payment for unused sick leave. Unused sick leave payoffs are calculated as follows: (1) $1.00 for each hour up to 520 hours, plus (2) 50% of the employee’s normal straight time hourly rate times each sick leave hour over 520. In lieu of item “2” above, the employee may receive credit at the rate of 100% of the employee’s normal straight time hourly rate for each sick leave hour over 520 if used to purchase group health insurance; with any remaining hours paid to the employee at the rate of 50% of employee’s normal straight time hourly rate. There is a $25,000 limit on the amount paid for sick time accrual. Council approved exceptions to this limit in 2000. The liability recorded for unused sick leave is an estimate based on prior experience of the actual payoff method chosen. Classification of Revenue The Utilities have classified their revenue as either operating or nonoperating according to the following criteria: - Operating revenues include activities that have the characteristics of exchange
transactions, such as customer charges and lease payments. - Nonoperating revenues include activities that have the characteristics of nonexchange
transactions, such as contributions and other revenue sources that are defined as nonoperating revenues by GASB Statement 9, Reporting Cash Flows of Proprietary and Nonexpendable Trust Funds and Government Entities That Use Proprietary Fund Accounting, and GASB Statement 34, such as investment income.

CITY OF FORT WAYNE UTILITIES Notes to Financial Statements December 31, 2012 and 2011
19
Reclassifications Certain reclassifications have been made to the 2011 financial statements to conform to the 2012 presentation. The reclassifications had no effect on the results of the operations. Restatement City Utilities is restating it’s Statement of Net Position and Change in Net Position for the Electric Utility for the period ending December 31, 2011. The restatement relates to understatement of gain on installment sale of $18,614,820, understatement of nonoperating expense of $22,750 and overstatement of unearned revenue by $18,592,070. This restatement increased the change in net position for 2011 by $18,592,070. (2) Deposits and Investments Deposits Custodial credit risk is the risk that in the event of a bank failure, the government’s deposits may not be returned to it. Indiana Code 5-13-8-1 allows a political subdivision of the State of Indiana to deposit public funds in a financial institution only if the financial institution is a depository eligible to receive state funds; and has a principal office or branch that qualifies to receive public funds of the political subdivision. The bank balances were insured by the Federal Deposit Insurance Corporation or the Public Deposit Insurance Fund, which covers all public funds held in approved depositories. The Utilities do not have a formal policy for custodial credit risk. Investments Authorization for investment activity is stated in Indiana Code IC 5-13. The Utilities had the following investments at December 31, 2012 and 2011. December 31, 2012 Investment Maturities
(in years) Fair Value Less than one
Certificates of Deposit $20,085,500 $20,085,500 December 31, 2011 Investment Maturities
(in years) Fair Value Less than one
Certificates of Deposit $40,000,000 $40,000,000
Mutual Funds $32,125,512 $32,125,512
Total $72,125,512 $72,125,512
CITY OF FORT WAYNE UTILITIES Notes to Financial Statements December 31, 2012 and 2011
20
Investment Policies Indiana Code 5-13-9 authorizes the Utilities to invest in securities backed by the full faith and credit of the United States Treasury or fully guaranteed by the United States and issued by the United States Treasury, a federal agency, a federal instrumentality, or a federal government sponsored enterprise. Indiana Code also authorizes the Utilities to invest in securities fully guaranteed and issued by a federal agency, a federal instrumentality or a federal government sponsored enterprise. These investments are required by statute to have a stated final maturity of not more than two years. Indiana Code also provides for investment in money market mutual funds that are in the form of securities of or interest in an open-end, no-load, management-type investment company or investment trust registered under the provision of the Federal Investment Company act of 1940, as amended. Investments in money market mutual funds may not exceed fifty percent (50%) of the funds held by the Utilities and available for investment. The portfolio of an investment company or investment trust used must be limited to direct obligations of the United States, obligations issued by a federal agency, a federal instrumentality, a federal government sponsored enterprise; or repurchase agreements fully collateralized by direct obligations of the United States or obligations issued by a federal agency, a federal instrumentality, or a federal government sponsored enterprise. The form of securities of or interest in an investment company or investment trust must be rated as AAA, or its equivalent by Standard and Poor’s Corporation or its successor or Aaa, or its equivalent, by Moody’s Investors Service, Inc. or its successor. The form of securities in an investment company or investment trust should have a stated final maturity of one (1) day. The Community Trust, which invests in a variety of securities and mutual funds, is not subject to the requirements of Indiana Statutes governing authorized investments. Interest Rate Risk Interest rate risk is the risk that changes in interest rates will adversely affect the fair value of an investment. The Utilities do not have a formal investment policy that limits investment maturities as a means of managing their exposure to fair value losses arising from increasing interest rates. Credit Risk Credit risk is the risk that an issuer or other counterparty to an investment will not fulfill its obligations. The Utilities do not have a formal investment policy for credit risk. The distribution of securities with credit ratings is summarized on following page.

CITY OF FORT WAYNE UTILITIES Notes to Financial Statements December 31, 2012 and 2011
21
Custodial Credit Risk For an investment, custodial credit risk is the risk that, in the event of the failure of the counterparty, the Utilities will not be able to recover the value of their investment or collateral securities that are in the possession of an outside party. The Utilities do not have a policy in regard to custodial credit risk. For investments that are uninsured and 1) uncollateralized, 2) collateralized with securities held by the pledging financial institution, or 3) collateralized with securities held by the pledging financial institution’s trust department or agent but not in the government’s name. Foreign Currency Risk This risk relates to adverse affects on the fair value of an investment from changes in exchange rates. The Utilities’ exposure to foreign currency risk derives from their investment at December 31, 2011 in foreign mutual funds with a fair value of $5,638,939. The Utilities do not have a policy in regard to foreign currency risk. Other Under the City’s cash management program, the Utilities participate in pooled cash account arrangements for some of their cash and investment activities. Interfund borrowing is shown as interfund receivables/payables in the accompanying financial statements. Interest income is allocated to accounts with positive balances. For the year ending December 31, 2011, the Community Trust had net investment loss of $1,334,143. The Trust incurred realized gains of $2,332,535, unrealized losses of $4,716,198 and cash net income of $1,049,521.
Investment Type Morningstar Rating 2012 2011
Certificates of Deposit Not Rated $20,085,500 $40,000,000 Mutual Funds Below Average -- 6,679,179 Average -- 23,927,909 Above Average -- -- High -- 1,518,424 Not Rated -- -- Total $20,085,500 $72,125,512

CITY OF FORT WAYNE UTILITIES Notes to Financial Statements December 31, 2012 and 2011
22
(3) Restricted Assets Restricted assets consisted of the following at December 31, 2012:
Restricted assets consisted of the following at December 31, 2011: Water Wastewater Stormwater Electric
Utility Utility Utility Utility Total
Cash and cash equivalents:
Sinking fund $ 664,993 $ 7,319,931 $ 631,271 $ -- $ 8,616,195 Debt service reserve 1,164,968 14,721,343 -- -- 15,886,311 Construction 22,608,111 15,588,786 -- -- 38,196,897 Airport expressway 2,000,000 -- -- -- 2,000,000 Customer deposits 1,205,857 -- -- -- 1,205,857 Connection fees -- 143,360 -- -- 143,360 Septic elimination program -- 1,593 -- -- 1,593 Community trust -- -- -- 3,547,674 3,547,674
Total $ 27,643,929 $ 37,775,013 $ 631,271 $3,547,674 $ 69,597,887 Investments:
Construction fund $ 5,000,000 $ 35,000,000 $ -- $ -- $ 40,000,000 Community trust -- -- -- 32,125,512 32,125,512
Total $ 5,000,000 $ 35,000,000 $ -- $ 32,125,512 $ 72,125,512
Sinking Fund Monthly deposits into sinking fund account for the Sewage Works Utility’s net revenues is required to be in an amount equal to at least 1/6 of the next semi-annual interest payment and 1/12 of the next annual principal payment. Other related debt service requirements are held in the debt service account.
Water Wastewater Stormwater Electric
Utility Utility Utility Utility Total
Cash and cash equivalents:
Sinking fund $ 748,415 $ 6,693,100 $ 634,083 $ -- $ 8,075,598 Debt service reserve 4,464,834 15,407,465 -- -- 19,872,299 Construction 28,252,193 38,696,681 -- -- 66,948,874 Airport expressway 313,247 -- -- -- 313,247 Customer deposits 1,371,631 -- -- -- 1,371,631 Connection fees -- 115,270 -- -- 115,270 Septic elimination program -- 1,096,718 -- -- 1,096,718
Total $35,150,320 $ 62,009,234 $ 634,083 $ -- $ 97,793,637 Investments:
Debt service reserve $ 5,042,750 $ 5,042,750 $ -- $ -- $ 10,085,500
CITY OF FORT WAYNE UTILITIES Notes to Financial Statements December 31, 2012 and 2011
23
Monthly deposits into sinking fund accounts of both the Water and Stormwater Utilities’ net revenues are required to be in an amount equal to at least 1/6 of the next semi-annual interest payments and 1/12 of the next annual principal payments. Upon meeting certain minimum balance requirements, transfers may be made to unrestricted cash accounts. Surety bonds purchased by the Utilities cover the Waterworks and Stormwater Reserve Accounts requirements. Debt Service Reserve In addition to the sinking fund accounts, revenue bonds require debt service “reserve accounts” which require funding at: the lesser of 10% of bond proceeds, the maximum annual principal and interest required thereon, or 125% of the average annual principal and interest requirements thereon. The Utilities calculate its debt service reserve accounts on a consolidated basis and may fund the debt service reserve by holding cash or through the purchase of surety bond insurance. Among other requirements, the surety bond insurer must maintain a AAA or Aaa rating with Standards and Poor’s or Moody’s respectively. Prior to 2009, all Utility revenue bonds’ debt service reserves were funded through surety bond insurance except the Sewage Works Junior Revenue Bonds of 1998 A and 1998 B which were cash funded. As a result of the financial crisis that occurred in late 2008 – early 2009 and up to and including 2010, the surety bond insurers failed to maintain their AAA/Aaa rating. While still insured, this failure to maintain AAA/Aaa ratings required the Utilities to cash fund the debt service reserve accounts for the affected revenue bonds. As of December 31, 2012, all surety bond insurance for Waterworks and Sewage Works Revenue Bonds have been replaced with cash funded debt service reserves as required by bond ordinance. The surety bond insurer for the Stormwater Management District Revenue Bonds of 2006 has failed to maintain the required AAA/Aaa rating. The appropriate disclosures have been made to the bondholders and no other action has been taken. Construction Unspent bond issue proceeds to be used in the construction of designated capital assets are included in this account. Airport Expressway In 2010, Water Utility entered into a tri-lateral agreement with the Redevelopment Commission and a Developer to construct a water main extension along the airport expressway. The Redevelopment Commission agreed to advance TIF funds to the Water Utility at such times so as to pay the Developer according to the contractual payment schedule. Monies received by the Water Utility prior to the Developer’s payment due date will be held in a restricted account.
CITY OF FORT WAYNE UTILITIES Notes to Financial Statements December 31, 2012 and 2011
24
Customer Deposits Customer deposits are refundable amounts received from Water Utility customers to insure against nonpayment of billings or water main damages. Connection Fees Certain area connection fees are designated for repayment of certain development costs as well as for reinvestment in specific areas. The unspent connection fees are reported in this restricted category. Septic Elimination Program In 2009, the Fort Wayne Board of Public Works authorized the creation of a City Utilities Revolving Fund as an alternative funding source for septic tank elimination in Allen County. This fund provides the funding necessary to construct wastewater mains allowing homeowners to discontinue use of failing septic tanks and connect to public infrastructure. The program also provides financial incentives to encourage septic tank elimination. Any unexpended funds are restricted for future septic tank elimination projects. (4) Assessments Receivable Assessments receivable represent assessments due from customers for sewer connections. The individual assessments range from $2,000 to $24,000 and are due in 60, 120 or 180 monthly principal installments plus interest on the unpaid portion at ranges from 0% to 7% per year. (5) Community Trust The City Council established the Community Trust in 1975 to account for a portion of the proceeds received from a private utility leasing the assets of the Electric Utility (see Note 6). On February 28, 2010, the Electric Utility’s lease expired. The Community Trust received its final $270,000 annual deposit in May of 2009 and is no longer entitled to future lease revenues or sales proceeds under the 1975 authorizing ordinance, also now expired. On January 1, 2012 the Community Trust was transferred from the Electric Utility to the Community Legacy Fund, a special revenue fund on the City’s financial statements. (6) Lease and Subsequent Installment Sale of Electric Utility Assets The Electric Utility had leased its entire utility system, including power plant, substations, and transmissions and distribution system, to a private electric utility serving the surrounding area. The lease term commenced March 1, 1975, and expired on February 28, 2010. Lease payments of $290,000, including the last lease payment under this lease, were received for the year ended December 31, 2010.
CITY OF FORT WAYNE UTILITIES Notes to Financial Statements December 31, 2012 and 2011
25
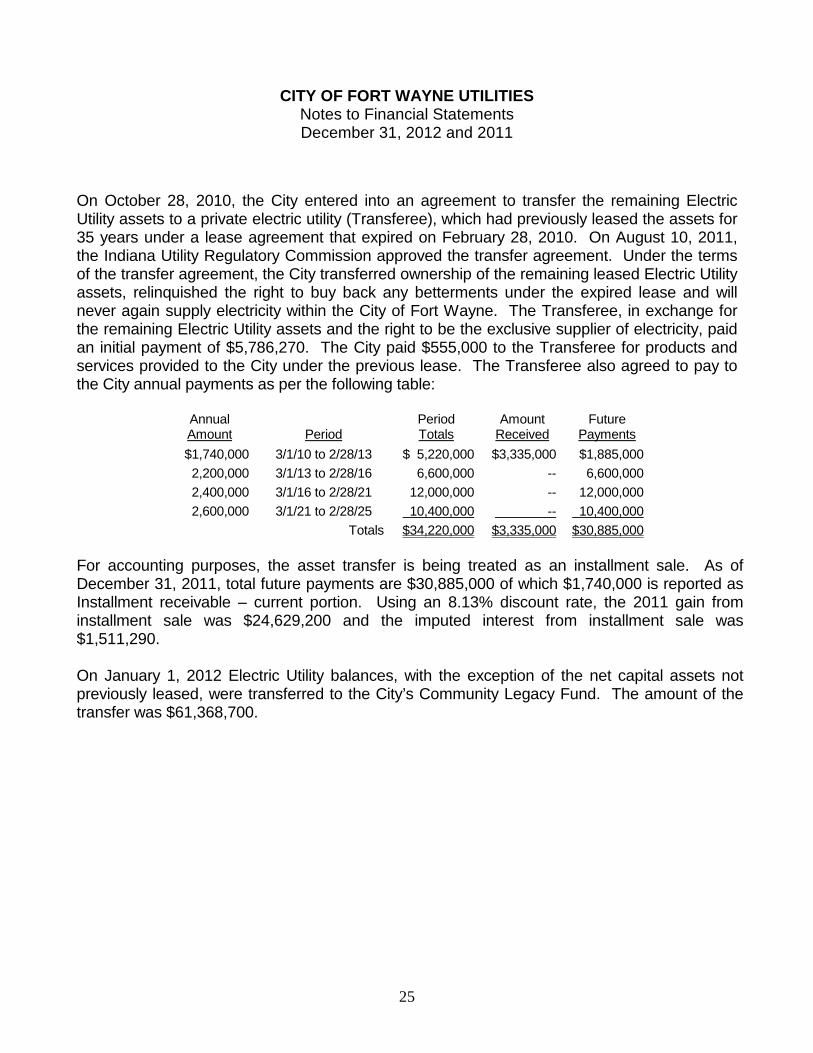
On October 28, 2010, the City entered into an agreement to transfer the remaining Electric Utility assets to a private electric utility (Transferee), which had previously leased the assets for 35 years under a lease agreement that expired on February 28, 2010. On August 10, 2011, the Indiana Utility Regulatory Commission approved the transfer agreement. Under the terms of the transfer agreement, the City transferred ownership of the remaining leased Electric Utility assets, relinquished the right to buy back any betterments under the expired lease and will never again supply electricity within the City of Fort Wayne. The Transferee, in exchange for the remaining Electric Utility assets and the right to be the exclusive supplier of electricity, paid an initial payment of $5,786,270. The City paid $555,000 to the Transferee for products and services provided to the City under the previous lease. The Transferee also agreed to pay to the City annual payments as per the following table:
Annual Amount Period
Period Totals
Amount Received
Future Payments
$1,740,000 3/1/10 to 2/28/13 $ 5,220,000 $3,335,000 $1,885,000 2,200,000 3/1/13 to 2/28/16 6,600,000 -- 6,600,000 2,400,000 3/1/16 to 2/28/21 12,000,000 -- 12,000,000 2,600,000 3/1/21 to 2/28/25 10,400,000 -- 10,400,000
Totals $34,220,000 $3,335,000 $30,885,000 For accounting purposes, the asset transfer is being treated as an installment sale. As of December 31, 2011, total future payments are $30,885,000 of which $1,740,000 is reported as Installment receivable – current portion. Using an 8.13% discount rate, the 2011 gain from installment sale was $24,629,200 and the imputed interest from installment sale was $1,511,290. On January 1, 2012 Electric Utility balances, with the exception of the net capital assets not previously leased, were transferred to the City’s Community Legacy Fund. The amount of the transfer was $61,368,700.

CITY OF FORT WAYNE UTILITIES Notes to Financial Statements December 31, 2012 and 2011
26
(7) Capital Assets The following changes occurred in capital assets during the years ended December 31:
2012 Balance Adjustments/ Balance Jan. 1, 2012 Additions Disposals Transfers Dec. 31, 2012
Land $ 8,512,962 $ -- $ -- $ 190,441 $ 8,703,403 Distribution and collection 509,347,897 -- 460,998 23,477,968 532,364,867 Buildings and improvement 180,039,462 -- 37,120 3,150,877 183,153,219 Equipment and other 164,845,838 2,297,102 747,179 3,285,491 169,681,252 Construction in progress 44,671,487 74,954,166 -- (29,914,828) 89,710,825 907,417,646 77,251,268 1,245,297 189,949 983,613,566 Less accumulated depreciation: Distribution and collection 125,673,891 7,751,097 417,972 -- 133,077,016 Buildings and 3,995,572 16,255 63,318,260 improvement 59,338,943 -- Equipment and other 79,105,431 7,662,943 482,998 -- 86,285,376 264,118,265 19,409,612 917,225 -- 282,610,652 Net Capital Assets $643,299,381 $ 57,841,656 $ 328,072 $ 189,949 $701,002,914
2011 Balance Adjustments/ Balance Jan. 1, 2011 Additions Disposals Transfers Dec. 31, 2011
Land $ 8,428,945 $ -- $ 34,971 $ 118,988 $ 8,512,962 Distribution and collection 481,427,642 -- 6,628,793 34,549,048 509,347,897 Buildings and 1,353,580 180,039,462 improvement 182,054,592 -- 3,368,710 Equipment and other 177,562,761 1,699,924 16,798,019 2,381,172 164,845,838 Construction in progress 37,511,193 45,990,216 -- (38,829,922) 44,671,487 886,985,133 47,690,140 26,830,493 (427,134) 907,417,646 Less accumulated depreciation: Distribution and collection 124,564,806 7,283,791 6,746,859 572,153 125,673,891 Buildings and improvement 57,493,095 4,030,911 2,176,699 (8,364) 59,338,943 Equipment and other 88,862,462 7,571,591 25,680,030 (572,150) 79,105,431 270,920,363 18,886,293 25,680,030 (8,361) 264,118,265 Net Capital Assets $616,064,770 $ 28,803,847 $ 1,150,463 $ (418,773) $643,299,381

CITY OF FORT WAYNE UTILITIES Notes to Financial Statements December 31, 2012 and 2011
27
(8) Developer Notes Payable Certain future revenues in newly developed areas are pledged as payment to retire developer debt associated with infrastructure installed to enable the new developments. Capital surcharges applicable only to designated new development regions and area connection fees generated from the designated new development regions will be applied to the developer debt until paid in full. Only revenue generated and collected from the new developments is available to retire the debt. Pledged revenues were $290,157 and $301,455 in 2012 and 2011, respectively. Developer notes payable were $2,013,303 and $2,201,994 for 2012 and 2011, respectively. The debt accrues interest at prime, which as of the end of 2012 was at 3.25%, plus 1%. Developer notes payable are included in current liabilities. (9) Bond Anticipation Note In 2008, the Water Utility financed the acquisition of Aqua Indiana asset with Waterworks Utility Revenue Bond Anticipation Notes, Series 2008 (BAN1) issued February 5, 2008 for $17,840,000. BAN1 was retired from the proceeds of the Waterworks Utility Revenue Bond Anticipation Notes, Series 2009 (BAN2 ) issued on February 11, 2009 in the amount of $17,840,000. BAN2 had an interest rate of 4.25% and was payable on February 11, 2010. BAN2 was retired from the proceeds of the Waterworks Utility Revenue Bond Anticipation Notes, Series 2010 (BAN3). BAN3 was issued on February 11, 2010 in the amount of $17,840,000. BAN3 had an interest rate of 0.60% and was payable on or before February 10, 2011. BAN3 was retired by the proceeds of the Waterworks Utility Revenue Bond Anticipation Notes, Series 2011 (BAN4). BAN4 was issued on February 9, 2011 in the amount of $17,840,000 with an interest rate of 0.65% and is payable on February 8, 2012. BAN4 was retired by the proceeds of the Waterworks Utility Revenue Bond Anticipation Notes, Series 2012 (BAN5). BAN5 was issued on February 7, 2012 in the amount of $17,840,000 with an interest rate of 0.48% and is payable on February 5, 2013. On December 27, 2012 proceeds from the Waterworks Utility Revenue Bond Series A were deposited into an irrevocable trust with an escrow agent to provide for all future debt service payments for BAN5. As a result, the BAN5 liability has been removed from the Statement of Net Position. (10) Long-Term Debt Bonds Payable: Details of all Utilities’ bonds payable at December 31, 2012 are as follows: Water Works Revenue Bonds of 2003 – original issue of $5,800,000 –
interest rates range from 2.00% to 4.250% and mature serially in amounts ranging from $425,000 in 2013 to $505,000 in 2017, redeemable prior to maturity for bonds maturing on or after 2014, plus unamortized bond premium of $5,781. $ 2,315,781

CITY OF FORT WAYNE UTILITIES Notes to Financial Statements December 31, 2012 and 2011
28
Water Works Revenue Bonds of 2005 – original issue of $16,700,000 – interest rates range from 2.70% to 4.40% and mature serially in amounts ranging from $1,420,000 in 2013 to $2,345,000 in 2019, redeemable prior to maturity for bonds maturing on or after 2015, plus unamortized bond premium of $28,015. 12,288,015 Water Works Revenue Bonds of 2012 – original issue of $40,000,000 – interest rates range from 2.00% to 3.00% and mature serially in amounts ranging from $590,000 in 2013 to $2,975,000 in 2032, redeemable prior to maturity for bonds maturing on or after 2023, plus unamortized bond premium of $564,644. 40,564,644
Sewage Works Junior Revenue Bonds of 2002, Series C – original issue
of $5,750,000 – interest rates range from 1.30% to 4.55% and mature serially in amounts from $420,000 in 2013 to $500,000 in 2017, redeemable at 100% beginning in 2014. 2,295,000
Sewage Works Junior Revenue Bonds of 2003 – original issue of
$12,350,000 – interest rates range from 2.00% to 3.80% and mature serially in amounts from $860,000 in 2013 to $1,045,000 in 2018, plus unamortized bond premium of $9,585. 5,699,585
Sewage Works Revenue Bonds of 2007 – original issue of $24,155,000 – interest rates range from 4.25% to 4.75% and mature serially in amounts from $970,000 in 2013 to $1,775,000 in 2027, redeemable at 100% beginning in 2017, less unamortized bond discount of $18,522. 19,911,478
Sewage Works Revenue Bonds of 2010 – original issue of $41,045,000 –
interest rates range from 4.25% to 4.50% and mature serially in amounts from $1,715,000 in 2013 to $3,135,000 in 2030, redeemable at 100% beginning in 2020, less unamortized bond discount of $214,790. 40,830,210
Sewage Works Revenue Bonds of 2011, Series A – original issue of
$38,100,000 – interest rate is 2.80% annually and mature serially in amounts from $2,580,000 in 2014 to $3,490,000 in 2026, redeemable at 100% beginning in 2022. 38,100,000
Sewage Works Revenue Bonds of 2012, Series B – original issue of
$15,530,000 – interest rates range from 2.00% to 3.00% and mature serially in amounts from $1,000,000 in 2014 to $1,295,000 in 2027, redeemable at 100% beginning in 2023, plus unamortized debt premium of $671,528. 16,201,528
Sewage Works Refunding Revenue Bonds of 2012 – original issue of
$19,675,000 – interest rate is 1.45% annually and mature serially in amounts from $1,500,000 in 2013 to $2,140,000 in 2022, redeemable at 100% beginning in 2021, plus unamortized debt premium of $65,629, less unamortized loss on refunding of $283,536. 19,457,093
Stormwater Management District Revenue Bonds of 2006 – original

CITY OF FORT WAYNE UTILITIES Notes to Financial Statements December 31, 2012 and 2011
29
issue of $17,000,000 – interest rates range from 3.75% to 4.00% and mature serially in amounts from $1,065,000 in 2013 to $1,500,000 in 2021, redeemable at 100% beginning in 2016, plus unamortized
bond premium of $32,725. 11,452,725 Total 209,116,059
Less: Current portion (8,965,000) Noncurrent Bonds payable, net $200,151,059
Total bond debt service requirements to maturity as of December 31, 2012 are as follows:
Year Due Principal Interest Total 2013 $ 8,965,000 $ 6,579,101 $ 15,544,101 2014 13,520,000 6,574,276 20,094,276 2015 14,050,000 6,149,530 20,199,530 2016 14,410,000 5,704,440 20,114,440 2017 14,800,000 5,244,079 20,044,079
2018 to 2022 67,215,000 19,427,484 86,642,484 2023 to 2027 52,265,000 9,684,597 61,949,597 2028 to 2032 23,030,000 2,109,678 25,139,678
Total $208,255,000 $61,473,183 $269,728,183 On December 4, 2012 the Wastewater Utility issued $19,675,000 in refunding revenue bonds with an average interest rate of 1.45% to advance refund $15,107,351 of outstanding 2002A series SRF Loans with an interest rate of 4.00% annually and $5,720,000 2002B series bonds with a interest rate range from 3.50% to 5.50%. The net proceeds of $19,742,284 and local contribution of $1,746,788 were used to purchase U.S. government securities. Those securities were deposited in an irrevocable trust with an escrow agent to provide for all future debt service payments on the 2002A loans and 2002B series bonds. As a result, these loans and bonds are considered to be defeased and the liabilities for those loans and bonds have been removed from the Statement of Net Position. The 2002A series SRF loans were called and paid in full in December 2012. The 2002B series bonds were called and repaid in February 2013. The refunding results in the accounting loss of $283,536, which has been recognized on the Statement of Net Position as a net reduction of noncurrent bonds payable. This amount will be amortized using the straight line method and charged to interest expense over the next 10 years. The Wastewater Utility in effect lowered its aggregate debt service payment by $4,410,628 over the next 11 years and realized an economic gain (difference between the present values of the old and new debt service payments) of $2,411,890.

CITY OF FORT WAYNE UTILITIES Notes to Financial Statements December 31, 2012 and 2011
30
Loans Payable: Indiana State Revolving Fund Loan Program (SRF) is a program that provides wastewater and drinking water loans, often at reduced interest rates and reduced issuance costs, to Indiana cities and towns. SRF “draw-down” loans are awarded as a “not-to-exceed” loan amount and the amount is later fixed at the amount actually borrowed to complete the pre-established wastewater or drinking water projects. The interest rate is fixed at the time of the award and the duration is established shortly thereafter. For shared pool loans, SRF coordinates the financing activities for several Indiana communities and issues bonds on the open market to provide the funding for each community’s projects. The loan amount, interest rate and duration are fixed at the time of the consolidated loan’s issuance. Occasionally, SRF will make traditional loans with fixed rate, amount and duration. With the exception of the SRF Revenue Bonds of 2008, SRF loans payable are issued on a parity basis with revenue bonds and are collateralized identically by the net revenues of the issuing Utility. Details of all Utilities’ State Revolving Fund (SRF) loans payable at December 31, 2012 are as follows: SRF Draw-down loans:
Sewage Works SRF Revenue Bonds of 2005 – Final Draw - $40,000,000 –
the interest rate is 3.10% and mature serially in amounts ranging from $1,825,000 in 2013 to $2,635,000 in 2025, redeemable prior to maturity for bonds maturing after 2017. $28,675,000
Sewage Works SRF Revenue Bonds of 2009, Series A – Final Draw -
$5,000,000 – the interest rate is 0.16% and mature serially in amounts ranging from $241,883 in 2013 to $248,547 in 2030, redeemable prior to maturity for bonds maturing after 2020. . 4,413,616
Sewage Works SRF Revenue Bonds of 2011, Series B – Draw up to $33,576,000 – as of December 31, 2012, total draw is $19,909,835 – the interest rate is 2.29% and matures serially in amounts ranging from $1,379,000 in 2013 to $2,073,000 in 2031, redeemable prior to maturity for bonds maturing after 2023. 18,709,835
Sewage Works SRF Revenue Bonds of 2012, Series A – Draw up to $10,415,000 – as of December 31, 2012, total draw is $4,435,333 – the interest rate is 1.78% and matures serially in amounts ranging from $453,000 in 2013 to $612,000 in 2032, redeemable prior to maturity for bonds maturing after 2024. 4,435,333

CITY OF FORT WAYNE UTILITIES Notes to Financial Statements December 31, 2012 and 2011
31
SRF Shared Pool loans: Waterworks SRF Revenue Bonds of 2006 – final pool share - $31,900,000 – the interest rate is 3.95% and mature serially in amounts ranging from
$2,020,000 in 2013 to $2,755,000 in 2021, redeemable prior to maturity for bonds maturing after 2017. 21,345,000
Waterworks SRF Revenue Bonds of 2011, Series B – original pool share issue $26,906,000 – the interest rate is 2.967% and matures serially in amounts ranging from $1,000 in 2013 to $2,073,000 in 2031, redeemable
prior to maturity for bonds maturing after 2021. 26,906,000
Sewage Works SRF Revenue Bonds of 2009, Series B – final pool share - $29,091,005 – the interest rate is 4.16% and mature serially in amounts ranging from $1,042,421in 2013 to $2,084,297 in 2030, redeemable prior to maturity for bonds maturing after 2020. 27,129,399
SRF Traditional loan:
Sewage Works SRF Revenue Bonds of 2008 - original issue of $906,000 – the interest rates is 2.0% and mature serially in amounts from $115,000 in 2013 to $120,000 in 2016, redeemable prior to maturity for all outstanding bonds. 471,000
Waterworks SRF Revenue Bonds of 2011, Series A (taxable) – original issue $3,094,000 – the interest rate is 3.746% and matures serially in amounts ranging from $1,272,000 in 2013 to $1,320,000 in 2014. 2,592,000 Total SRF Loans Payable 134,677,183 Less: Current Portion _ _(8,349,304) Noncurrent SRF Loans Payable, net $ 126,327,879 The total anticipated loan debt service requirements to maturity, after all remaining loan principal has been drawn down, as of December 31, 2012 are as follows:
Year Due Principal Interest Total 2013 8,349,304 $ 4,398,826 $ 12,748,130 2014 8,602,057 4,429,574 13,031,631 2015 8,685,612 4,150,738 12,836,350 2016 8,962,048 3,878,593 12,840,641 2017 9,127,442 3,597,109 12,724,551
2018 to 2022 47,454,531 13,446,092 60,900,623 2023 to 2027 37,551,087 6,722,251 44,273,338 2028 to 2032 25,590,934 1,726,745 27,317,679
Total $ 154,323,015 $ 42,349,928 $ 196,672,943

CITY OF FORT WAYNE UTILITIES Notes to Financial Statements December 31, 2012 and 2011
32
Changes in Long-Term Liabilities The following is a summary of long-term obligations for the Utilities for the year ended December 31, 2012:
The following is a summary of long-term obligations for the Utilities for the year ended December 31, 2011: Balance
Jan. 1, 2011
Additions
Deductions Balance
Dec. 31, 2011 Current Portion
Bonds and loans Revenue bonds payable, net $117,293,257 $38,100,000 $ 8,187,165 $147,206,092 $8,505,000 Loans payable 108,427,854 31,314,324 5,932,929 133,809,249 7,508,576 Total bonds and loans 225,721,111 69,414,324 14,120,094 281,015,341 16,013,576 Other noncurrent liabilities Accrued compensated absences 2,508,418 1,079,819 1,084,111 2,504,126 1,126,201 Interfund payable 1,552,231 882,297 848,341 1,586,187 959,831 Net pension obligation -- 2,236,730 2,039,056 197,674 -- Other long-term liabilities 16,148 -- 807 15,341 3,759 Total other noncurrent liabilities 4,076,797 4,198,846 3,972,315 4,303,328 2,089,791 $229,797,908 $73,613,170 $18,092,409 $285,318,669 $18,103,367
Balance Jan. 1, 2012
Additions
Deductions
Balance Dec. 31, 2012
Current Portion
Bonds and loans Revenue bonds payable, net $ 147,206,092 $ 76,180,637 $ 14,270,670 $ 209,116,059 $ 8,965,000 Loans payable 133,809,249 23,822,570 22,954,636 134,677,183 8,349,304 Total bonds and loans 281,015,341 100,003,207 37,225,306 343,793,242 17,314,304 Other noncurrent liabilities Accrued compensated absences 2,504,126 2,061,504 2,020,199 2,545,431 1,079,303 Interfund payable 1,586,187 289,176 959,831 915,532 261,470 Net pension obligation 197,674 2,589,947 2,169,300 618,321 -- Other long-term liabilities
15,341 --
15,341 -- -- Total other noncurrent liabilities 4,303,328 4,940,627 5,164,671 4,079,284 1,340,733 $ 285,318,669 $104,943,834 $ 42,389,977 $ 347,872,526 $ 18,655,077

CITY OF FORT WAYNE UTILITIES Notes to Financial Statements December 31, 2012 and 2011
33
(11) Related Party Transactions During the course of operations, numerous transactions occurred between the Utilities and City for goods and services rendered. The Water Utility received hydrant rental revenue from the City of $2,947,526 and $2,935,910 in 2012 and 2011, respectively. The Utilities also received $743,346 and $665,224 in 2012 and 2011, respectively from the City for other water, sewer and stormwater services. The City received the following from the Utilities in 2012:
Water Wastewater Stormwater Yard Electric Utility Utility Utility Utility Utility Totals Self insurance $2,360,364 $ 2,339,113 $ 585,326 $ 4,117 $ -- $5,288,920 Garage services 668,473 595,607 225,791 180 -- 1,490,051 Overhead charges 457,911 697,369 240,858 4,201 -- 1,400,339 Office and technical services 32,606 292,038 64,493 142 -- 389,279 Transfers out in lieu of taxes 1,153,843 3,621,643 1,117,554 -- -- 5,893,040 Totals $4,673,197 $ 7,545,770 $ 2,234,022 $ 8,640 $ -- $14,461,629
The City received the following from the Utilities in 2011: Water Wastewater Stormwater Yard Electric Utility Utility Utility Utility Utility Totals Self insurance $2,172,171 $ 2,131,072 $ 518,232 $ 3,775 $ -- $4,825,250 Garage services 616,009 621,271 202,770 149 -- 1,440,199 Overhead charges 487,318 670,763 238,058 4,201 -- 1,400,340 Office and technical services 41,559 144,444 37,308 203 3,759 227,273 Transfers out in lieu of taxes 2,386,426 3,400,663 998,557 -- -- 6,785,646 Totals $5,703,483 $ 6,968,213 $ 1,994,925 $ 8,007 $ 3,759 $14,678,708

CITY OF FORT WAYNE UTILITIES Notes to Financial Statements December 31, 2012 and 2011
34
(12) Interfund Assets and Liabilities
As of December 31, 2012 and 2011, amounts due from/to other funds of the City resulting from various interfund transactions were as follows: Due from City: Receivable Fund Payable Fund 2012 2011 Water General $ 261,553 $ 7,261 Benefits -- 87 Garage 509 3,949 Lease 299,825 347,244 Solid Waste 508 --
Total Water 562,395 358,541
Wastewater General 2,045 8,025 Barrett Law 102,704 -- Benefits -- 120 CC Urban 165,000 -- Garage 409 2,213 Lease -- 189,980 Legacy 2,854 -- Solid Waste 773 --
Total Wastewater 273,785 200,338
Stormwater General 7,420 3,628 Benefits 1,089 1,131 Garage 72 913 Lease 7,381 105,049 Solid Waste 267 --
Total Stormwater 16,229 110,721
Yard Waste General -- 50 Benefits -- 1 Solid Waste 5 --
Total Yard Waste 5 51
Total Due from City $ 852,414 $ 669,651

CITY OF FORT WAYNE UTILITIES Notes to Financial Statements December 31, 2012 and 2011
35
Due to City: Receivable Fund Payable Fund 2012 2011 General Water $ 1,201,860 $ 58,089 Benefits 7,469 - CSQ Parking 711 1,264 Cumulative Capital 8,994 - Garage 58,753 57,338 Lease - 64,295 MVH - 12,613 Park 598 389 Solid Waste 423,109 460,583
Total Water 1,701,494 654,571 General Wastewater 98,730 93,153 Benefits 8,286 - Barrett Law 1,170 CSQ Parking 1,298 1,861 Cumulative Capital 18,423 - Fed Revolving - 107,740 Garage 49,947 73,469 Lease - 46,886 MVH - 19,513 Solid Waste 644,367 633,964
Total Wastewater 822,221 976,586 General Stormwater 14,253 18,139 Benefits 1,579 - CEDIT 3,046 - CSQ Parking 456 665 Cumulative Capital 4,016 - Garage 15,977 19,631 General Trust 500 - Lease - 28,923 Solid Waste 222,553 224,998
Total Stormwater 262,380 292,356
General Electric - 627 General Yard Waste 250 234 Benefits 11 - CSQ Parking 6 10 Cumulative Capital 70 - Garage 12 12 Lease - 33 Solid Waste 3,882 3,971
Total Yard Waste 4,231 4,260
Total Due to City $ 2,790,326 $ 1,928,400
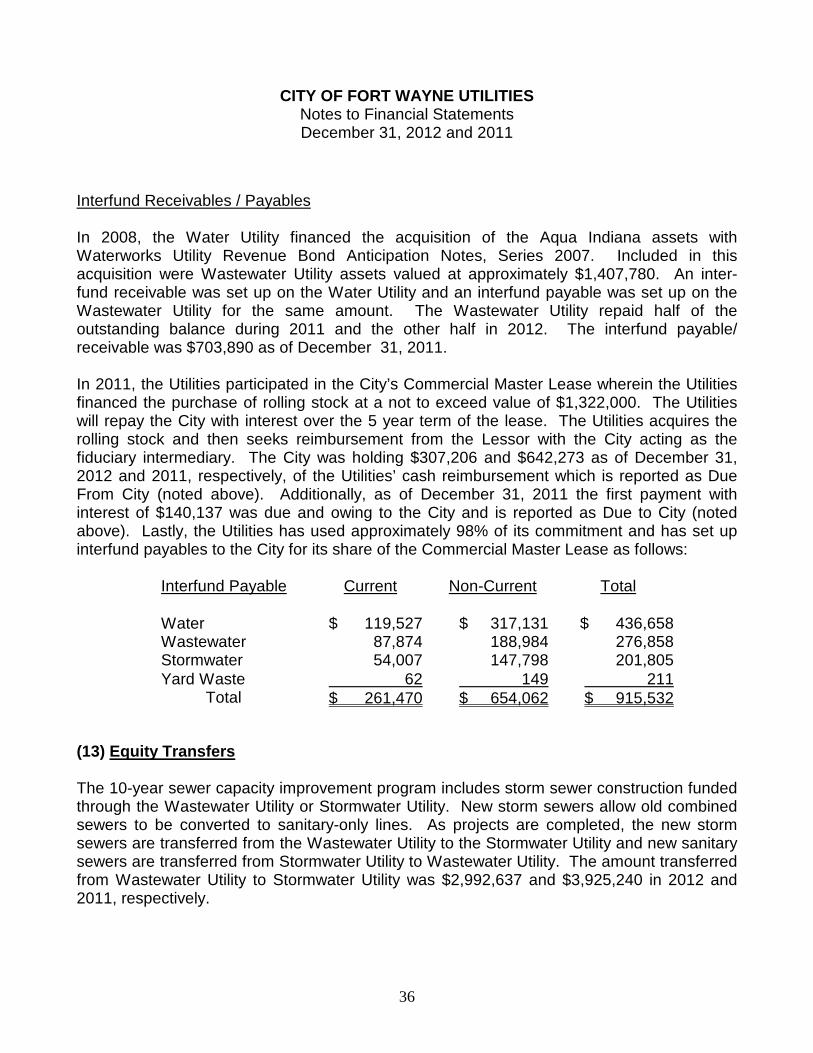
CITY OF FORT WAYNE UTILITIES Notes to Financial Statements December 31, 2012 and 2011
36
Interfund Receivables / Payables In 2008, the Water Utility financed the acquisition of the Aqua Indiana assets with Waterworks Utility Revenue Bond Anticipation Notes, Series 2007. Included in this acquisition were Wastewater Utility assets valued at approximately $1,407,780. An inter-fund receivable was set up on the Water Utility and an interfund payable was set up on the Wastewater Utility for the same amount. The Wastewater Utility repaid half of the outstanding balance during 2011 and the other half in 2012. The interfund payable/ receivable was $703,890 as of December 31, 2011. In 2011, the Utilities participated in the City’s Commercial Master Lease wherein the Utilities financed the purchase of rolling stock at a not to exceed value of $1,322,000. The Utilities will repay the City with interest over the 5 year term of the lease. The Utilities acquires the rolling stock and then seeks reimbursement from the Lessor with the City acting as the fiduciary intermediary. The City was holding $307,206 and $642,273 as of December 31, 2012 and 2011, respectively, of the Utilities’ cash reimbursement which is reported as Due From City (noted above). Additionally, as of December 31, 2011 the first payment with interest of $140,137 was due and owing to the City and is reported as Due to City (noted above). Lastly, the Utilities has used approximately 98% of its commitment and has set up interfund payables to the City for its share of the Commercial Master Lease as follows:
Interfund Payable Current Non-Current Total Water $ 119,527 $ 317,131 $ 436,658 Wastewater 87,874 188,984 276,858 Stormwater 54,007 147,798 201,805 Yard Waste 62 149 211 Total $ 261,470 $ 654,062 $ 915,532
(13) Equity Transfers The 10-year sewer capacity improvement program includes storm sewer construction funded through the Wastewater Utility or Stormwater Utility. New storm sewers allow old combined sewers to be converted to sanitary-only lines. As projects are completed, the new storm sewers are transferred from the Wastewater Utility to the Stormwater Utility and new sanitary sewers are transferred from Stormwater Utility to Wastewater Utility. The amount transferred from Wastewater Utility to Stormwater Utility was $2,992,637 and $3,925,240 in 2012 and 2011, respectively.

CITY OF FORT WAYNE UTILITIES Notes to Financial Statements December 31, 2012 and 2011
37
(14) Risk Management The City, including the Utilities, retains the risk of loss for claims related to employee health, on-the-job injury, auto, and general liabilities, while continuing to buy premium insurance for a number of other risks. The City has established internal service funds to finance these risks. Interfund premiums are billed monthly on a cost allocation basis most appropriate to the type of risk involved. An excess policy covers individual health insurance claims in excess of $250,000 per year and the insurance company assumes the risk when total monthly claims exceed an amount based upon an aggregate monthly factor. An excess policy for workers compensation covers individual claims in excess of $150,000 per employee per injury. The general and auto liability is limited by Indiana government tort liability limits of $700,000 per person and incident. Liabilities are the responsibility of the City’s internal service funds. (15) Pension Plans Public Employees’ Retirement Fund Plan Description The Utilities contribute to the Public Employees’ Retirement Fund (PERF), a defined-benefit pension plan. PERF is an agent multiple-employer public employee retirement system, which provides retirement benefits to plan members and beneficiaries. All full-time employees are eligible to participate in the defined-benefit plan. State statutes (IC 5-10.2 and 5-10.3) govern most requirements of the system and give the Utilities authority to contribute to the plan. PERF retirement benefits consist of employer provided contributions plus an annuity provided by the member’s annuity savings account. The annuity savings account consists of member’s contributions, set by statute at three percent of compensation, plus the interest credited to the member’s account. The employer may elect to make the contributions on behalf of the member. PERF issues a publicly available financial report that includes financial statements and required supplementary information for the plan as a whole and for its participants. That report may be obtained by writing the Indiana Public Retirement System (INPRS), One North Capitol Street, Suite 001, Indianapolis, IN 46204 or by calling (888) 526-1687. Retirement benefits vest after 10 years of service. Normal retirement is defined as the earliest of: (1) age 65 with 10 years of creditable service; (2) age 60 with 15 years of creditable service; or (3) the sum of age and creditable service equal to 85, but not earlier than age 55. A reduced benefit will be received if an employee takes early retirement between the ages of 50 and 65 and has had 15 or more years of creditable service. Employees may elect to either receive a lump-sum distribution of their annuity savings account balance upon retirement or receive an annuity amount as a monthly supplement to the retirement benefits described above. PERF
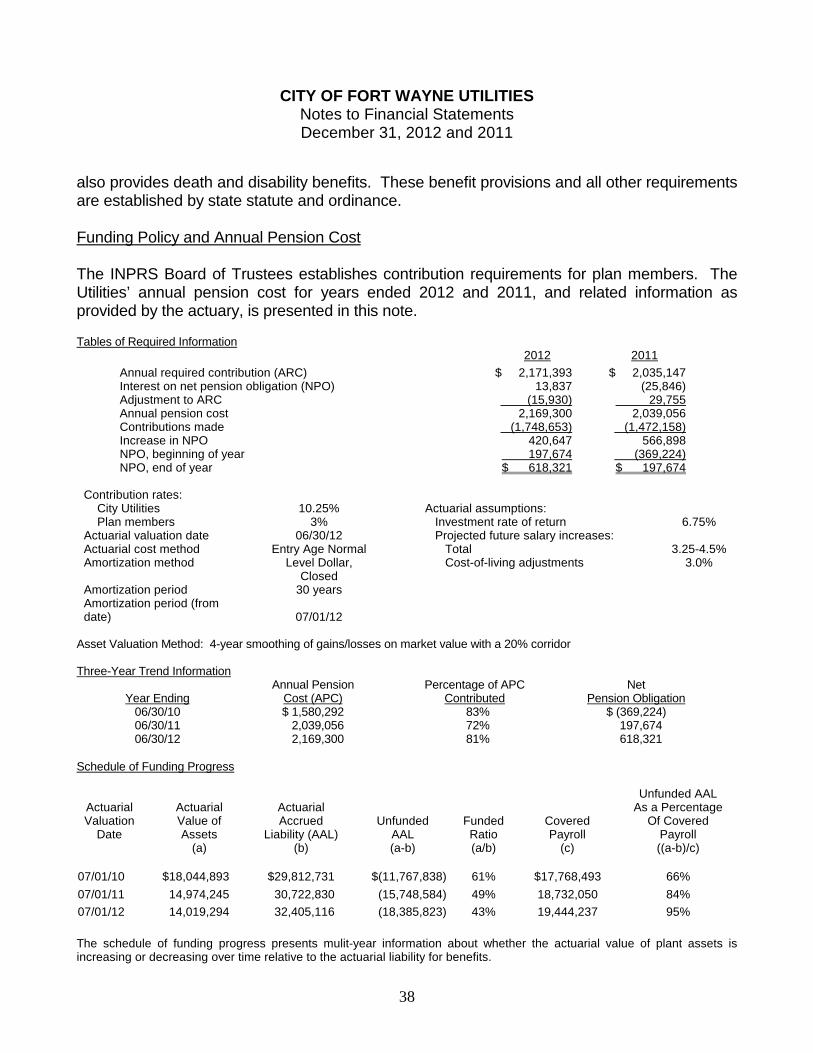
CITY OF FORT WAYNE UTILITIES Notes to Financial Statements December 31, 2012 and 2011
38
also provides death and disability benefits. These benefit provisions and all other requirements are established by state statute and ordinance. Funding Policy and Annual Pension Cost The INPRS Board of Trustees establishes contribution requirements for plan members. The Utilities’ annual pension cost for years ended 2012 and 2011, and related information as provided by the actuary, is presented in this note. Tables of Required Information
2012 2011
Annual required contribution (ARC) $ 2,171,393 $ 2,035,147 Interest on net pension obligation (NPO) 13,837 (25,846) Adjustment to ARC (15,930) 29,755 Annual pension cost 2,169,300 2,039,056 Contributions made (1,748,653) (1,472,158) Increase in NPO 420,647 566,898 NPO, beginning of year 197,674 (369,224) NPO, end of year $ 618,321 $ 197,674
Contribution rates:
City Utilities 10.25% Actuarial assumptions: Plan members 3% Investment rate of return 6.75% Actuarial valuation date 06/30/12 Projected future salary increases: Actuarial cost method Entry Age Normal Total 3.25-4.5% Amortization method Level Dollar, Cost-of-living adjustments 3.0% Closed Amortization period 30 years Amortization period (from date) 07/01/12
Asset Valuation Method: 4-year smoothing of gains/losses on market value with a 20% corridor Three-Year Trend Information
Year Ending
Annual Pension Cost (APC)
Percentage of APC Contributed
Net Pension Obligation
06/30/10 $ 1,580,292 83% $ (369,224) 06/30/11 2,039,056 72% 197,674 06/30/12 2,169,300 81% 618,321
Schedule of Funding Progress
Actuarial Valuation
Date
Actuarial Value of Assets
(a)
Actuarial Accrued
Liability (AAL) (b)
Unfunded AAL (a-b)
Funded Ratio (a/b)
Covered Payroll
(c)
Unfunded AAL
As a Percentage Of Covered
Payroll ((a-b)/c)
07/01/10 $18,044,893 $29,812,731 $(11,767,838) 61% $17,768,493 66%
07/01/11 14,974,245 30,722,830 (15,748,584) 49% 18,732,050 84%
07/01/12 14,019,294 32,405,116 (18,385,823) 43% 19,444,237 95%
The schedule of funding progress presents mulit-year information about whether the actuarial value of plant assets is increasing or decreasing over time relative to the actuarial liability for benefits.

CITY OF FORT WAYNE UTILITIES Notes to Financial Statements December 31, 2012 and 2011
39
(16) Commitments and Contingencies Consent Decree: The Utilities’ combined storm and sanitary sewer system does not comply with federal Clean Water regulations. After several years of negotiations with the Environmental Protection Agency (EPA) and Indiana Department of Environmental Management (IDEM), the EPA lodged a Consent Decree with the federal court on December 28, 2007. The Consent Decree became effective April 1, 2008. Under the terms and conditions of the Consent Decree, the Utilities committed to reduce the number of combined sewer overflow (CSO) days in a typical year to one day on the St. Joseph River and four days on the St. Mary’s and Maumee Rivers. The infrastructure cost to reduce the number of CSO events is approximately $240 million, to be spent over the next 18 years, concluding in 2025. The Utilities also agreed to eliminate three known sanitary sewer overflows at an estimated combined cost of $31 million by specific dates noted in the Consent Decree. Additionally, the Utilities committed to maintain the entire sewer system to performance standards prescribed in the Utilities’ Long-Term Control Plan incorporated by reference into the Consent Decree. The Consent Decree further provides for stipulated penalties for failure to achieve specified construction milestones, reporting deadlines or maintenance objectives. The Utilities are in full compliance with the Consent Decree’s terms and conditions. Condemnation of Aqua Indiana’s North Assets: In June, 2002, the Utilities initiated condemnation of Aqua Indiana’s North Assets. On February 12, 2008, the Utilities paid Aqua Indiana $16,910,500 and took possession of those condemned assets. The acquisition was financed by Waterworks Utility Revenue Bond Anticipation Notes, Series 2007 (BAN) issued February 5, 2008 for $17,840,000, including the purchase price and estimated issuance and integration costs. The BAN was subsequently refinanced four times (see Note 9). The North Assets are now fully integrated with the Utilities’ water and sewer systems and generating revenues for the respective Utilities at standard system-wide tariffs. The purchase price was established through condemnation proceedings by Fort Wayne Board of Public Works and is currently being contested by Aqua Indiana in Wells County Circuit Court. At this time, the Utilities are unable to form a conclusion as to whether the assertion of further action by Aqua Indiana is either probable or remote, nor as to the amount of damages if assessed, nor to the possible costs of the corrective action, if any.
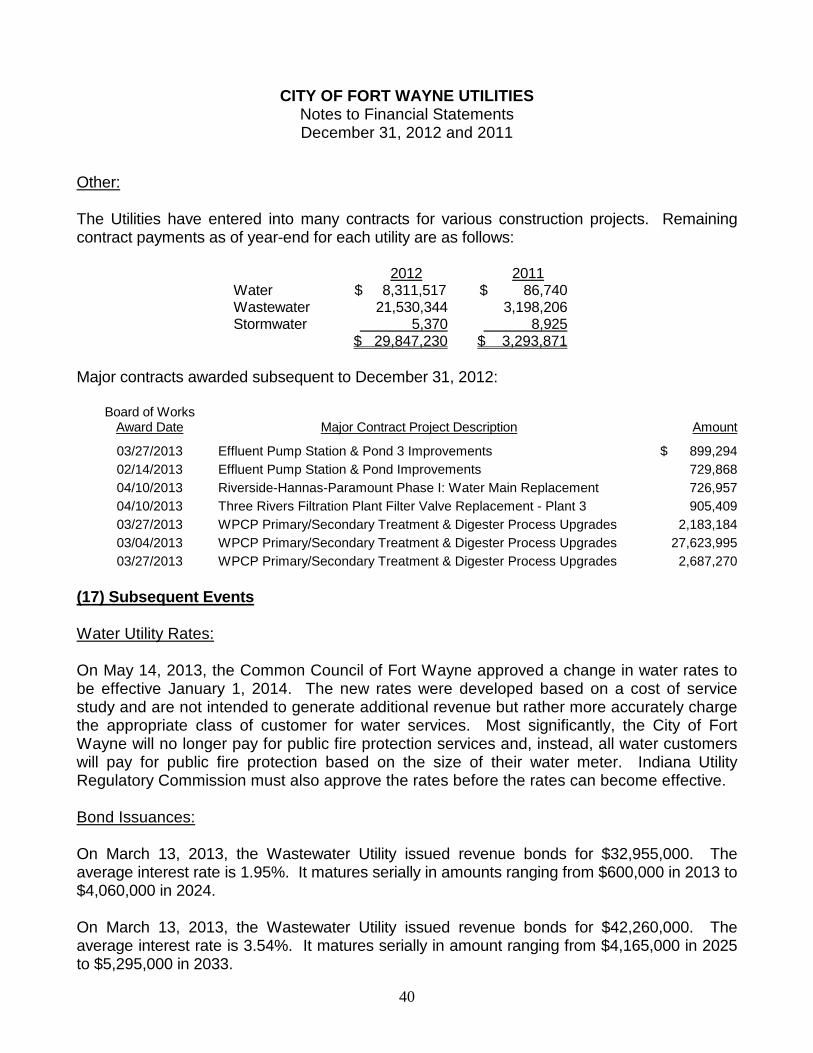
CITY OF FORT WAYNE UTILITIES Notes to Financial Statements December 31, 2012 and 2011
40
Other: The Utilities have entered into many contracts for various construction projects. Remaining contract payments as of year-end for each utility are as follows:
2012 2011 Water $ 8,311,517 $ 86,740 Wastewater 21,530,344 3,198,206 Stormwater 5,370 8,925 $ 29,847,230 $ 3,293,871
Major contracts awarded subsequent to December 31, 2012:
Board of Works Award Date Major Contract Project Description Amount
03/27/2013 Effluent Pump Station & Pond 3 Improvements $ 899,294 02/14/2013 Effluent Pump Station & Pond Improvements 729,868 04/10/2013 Riverside-Hannas-Paramount Phase I: Water Main Replacement 726,957 04/10/2013 Three Rivers Filtration Plant Filter Valve Replacement - Plant 3 905,409 03/27/2013 WPCP Primary/Secondary Treatment & Digester Process Upgrades 2,183,184 03/04/2013 WPCP Primary/Secondary Treatment & Digester Process Upgrades 27,623,995 03/27/2013 WPCP Primary/Secondary Treatment & Digester Process Upgrades 2,687,270
(17) Subsequent Events Water Utility Rates: On May 14, 2013, the Common Council of Fort Wayne approved a change in water rates to be effective January 1, 2014. The new rates were developed based on a cost of service study and are not intended to generate additional revenue but rather more accurately charge the appropriate class of customer for water services. Most significantly, the City of Fort Wayne will no longer pay for public fire protection services and, instead, all water customers will pay for public fire protection based on the size of their water meter. Indiana Utility Regulatory Commission must also approve the rates before the rates can become effective. Bond Issuances: On March 13, 2013, the Wastewater Utility issued revenue bonds for $32,955,000. The average interest rate is 1.95%. It matures serially in amounts ranging from $600,000 in 2013 to $4,060,000 in 2024. On March 13, 2013, the Wastewater Utility issued revenue bonds for $42,260,000. The average interest rate is 3.54%. It matures serially in amount ranging from $4,165,000 in 2025 to $5,295,000 in 2033.
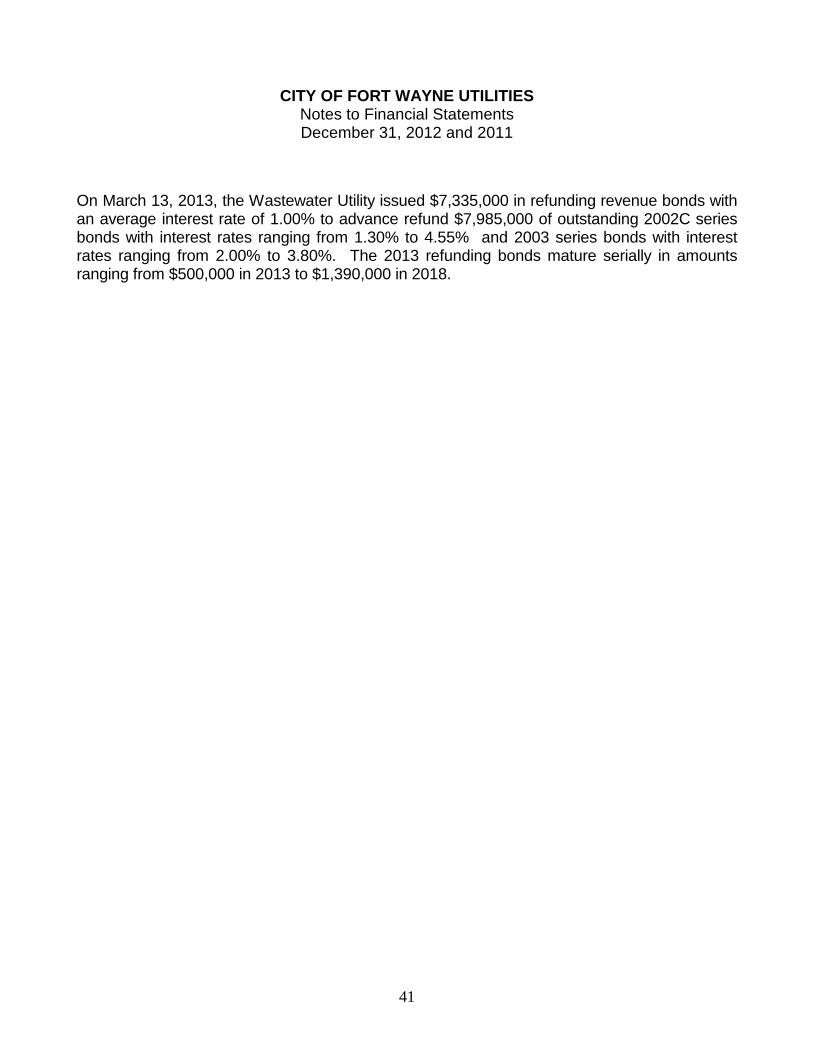
CITY OF FORT WAYNE UTILITIES Notes to Financial Statements December 31, 2012 and 2011
41
On March 13, 2013, the Wastewater Utility issued $7,335,000 in refunding revenue bonds with an average interest rate of 1.00% to advance refund $7,985,000 of outstanding 2002C series bonds with interest rates ranging from 1.30% to 4.55% and 2003 series bonds with interest rates ranging from 2.00% to 3.80%. The 2013 refunding bonds mature serially in amounts ranging from $500,000 in 2013 to $1,390,000 in 2018.