city of laredo, texas comprehensive annual financial
TRANSCRIPT
CITY OF LAREDO, TEXAS
COMPREHENSIVE ANNUAL FINANCIAL REPORT
FOR THE FISCAL YEAR ENDED
SEPTEMBER 30, 2019
PREPARED BY:
CITY OF LAREDO FINANCIAL SERVICES DEPARTMENT
ACCOUNTING DIVISION

INTRODUCTION SECTION
CITY OF LAREDO, TEXAS COMPREHENSIVE ANNUAL FINANCIAL REPORT
For Fiscal Year Ended September 30, 2019
TABLE OF CONTENTS (To view a particular section, click on the text below)
Page INTRODUCTION SECTION Letter of Transmittal …..…………………………………………………………………..... I
Organizational Chart…………………………………………………………………………. XII List of Elected and Appointed Officials……………………………………………………... XIII
FINANCIAL SECTION Independent Auditor’s Report…………………………………………..……………...... 1
Management’s Discussion and Analysis………………………………………………… 4
Basic Financial Statements: Government-wide Financial Statements:
Statement of Net Position ....………………………………………………..…......... 19 Statement of Activities………………………………………………………..…....... 21
Fund Financial Statements: Balance Sheet – Governmental Funds ………………………………………………. 22 Statement of Revenues, Expenditures, and Changes in
Fund Balances – Governmental Funds…………………………………………….. 23 Reconciliation of the Statement of Revenues, Expenditures and Changes
In Fund Balances of Governmental Funds to the Statements of Activities 24 Statement of Revenues, Expenditures and Changes in
Fund Balances – Budget and Actual – General Fund ……………………………. 26 Statement of Net Position – Proprietary Funds………………………………………. 28 Statement of Revenues, Expenses, and Changes in
Fund Net Position – Proprietary Funds…………………………………………… 32 Statement of Cash Flows – Proprietary Funds ………………………………............ 36 Statement of Fiduciary Net Position – Fiduciary Funds……………………………… 40 Statement of Changes in Fiduciary Net Position – Fiduciary Funds…………………. 41
Notes to the Basic Financial Statements ..………………………………………………... 42 Required Supplementary Information …………………………………………… 112
Debt Service Schedule of Revenues, Expenditures, and Changes in 117 Fund Balances – Debt Service Funds ………………………………………………..
Combining and Individual Fund Statements: Combining Balance Sheet – Nonmajor Governmental Funds: ……………………………. 124
Changes in Fund Balances – Nonmajor Governmental Funds …………………………… 132
Schedules of Revenues, Expenditures, and Changes in Fund Balances – Budget and Actual: CDBG Special Revenue Fund….………………………………………………………… 140 Housing Rehabilitation…………………………………………………………………… 141 Home Investment Fund ...……………………………………………………………….. . 142 Emergency Shelter Fund ……………………………………………………………….... 143 Home Investment Affordable Housing.............................................................................. 144 Auto Theft Task Force……………………………………………………………………. 145 Financial Task Force.......................................................................................................... 146 Special Police Program …………………………………………………………………… 147 911 Emergency Communications Fund ……………………………………………........... 148 Health Fund……………………………………………………………….……………...... 149
International Airport …………………………………………………………………….... 151 Hotel Motel Occupancy Tax……………………………………………………………… 153 Public Access Channel.......……………………………………………………………….. 154 Laredo Convention and Visitors Bureau ………………………………………………...... 155 Recreation Fund................................................................................................................. 156 Parking Meters……………………………………………………………………………. 157 Environmental Services …………………………………………………………………… 158 Keep Laredo Beautiful, Inc. Fund……………………………………………………….... 160 Noise Abatement Lease Program.……………………………………………………........ 161 Sport and Community Venue.............................................................................................. 162 Sames Auto Arena …........................................................................................................... 163 Laredo Public Facility Corporation .................................................................................... 164 Max Mandel Golf Course…………………………………………………………………. 165 Parkland Acquisition/Park Improvements ………………………………………………… 166 Special Fire Grants ……………………………………………………………………….. 167 Downtown Tirz No. 1 …………………………………………………………………….. 168 Police Trust Fund…………………………………………………………………………... 169 Parks Capital Grants..…………………………………………………………………….... 170 Capital Grants.................................................................................................................... 171 Contractual Obligations………………………………………………………………….... 172
Certificate of Obligation 2009 Issue…………………………………………………......... 173 Certificate of Obligation 2012 Issue …………………………………………………….... 174
Certificate of Obligation 2014 Issue …………………………………………………….... 175 Certificate of Obligation 2015 Issue …………………………………………………….... 176 Certificate of Obligation 2016 Issue …………………………………………………….... 177 Certificate of Obligation 2017 Issue ……........................................................................ 178 Certificate of Obligation 2018 Issue ……........................................................................ 179
Airport Construction Fund ………………………………………………………………... 180 Capital Improvements .………………………………………………………………....... 181 Canseco Endowment Fund…...………………………………………………………….... 183
Combining Statement of Net Position – Internal Service Funds ................................................ 186 Combining Statement of Revenues, Expenses and Changes in Fund Net Position - Internal Service Funds………………………………......... 187 Combining Statement of Cash Flows – Internal Service Funds ………………………............ 188
Risk Management…………………………………………….………………………….... 190 Health And Benefits………………………………………….………………………….... 192 Fleet Management…………………………………………….…………………………... 194 Information Technology ………………………………………………………………….. 196
Capital Assets Used in the Operation of Governmental Funds: Comparative Schedules by Source. ……………………………………………………...... 199 Schedule of Changes by Function and Activity………………………………………..,..... 200 Schedule by Function and Activity………………………………………........................... 202
Supplementary Financial Statements-for Enterprise Funds: Combining Statement of Net Position ………………………………………….…………...... 206 Combining Statement of Revenues, Expenses, and Changes in Net Position............................ 208 Combining Statement of Cash Flows………………………………………………………...... 209 Municipal Transit System……………………………………………………………..... 211 Bridge System…………………………………………………………………………... 216 Municipal Housing Corporation……………………………………………………….... 220 Waterworks System……………………………………………….…………………...... 223 Sewer System………………………………………………………………………….... 227 Solid Waste Management……………………………………………………………..... 231
Supplementary Financial Statements-for Fiduciary Funds: Statement of Net Position-Agency Funds ..………………………………………….... 236 Combining Statement of Changes
in Assets and Liabilities-Agency Funds ....….................................................... 237 Combining Statement in Fiduciary Net Position-
Pension Trust Funds …………………......….................................................... 239
This part of the City of Laredo’s comprehensive annual financial report presents detailed information as a context for understanding what the information in the financial statements, note disclosures, and required supplementary information says about the City of Laredo’s overall financial health.
Table Name of Table Financial Trends
These schedules contain trend information to help the reader understand how the government’s financial performance and well-being have changed over time.
1 Net Position By Component ...........………………………………………………..... 242 2 Changes in Net Position....………………………………………………………....... 244 3 Changes in Fund Balance, Governmental Funds ………………………………........... 246 4 Fund Balance, Governmental Funds …………………………………………….......... 247 5 General Governmental Tax Revenues by Source ……………………………….......... 248 Revenue Capacity
These schedules contain trend information to help the reader assess the government’s most significant local revenue source, the property tax.
6 Property Tax Levies and Collections ..……………………………………………....... 249 7 Assessed and Estimated Actual Value of Taxable Property .………………................ 250 8 Property Tax Rates – Direct and Overlapping Governments…….……………............ 251 9 Special Assessments Billing and Collections .………………………………............... 252 10 Principal Taxpayers ……………………………...………………………………........ 253
Debt Capacity These schedules contain trend information to help the reader assess the affordability of the government’s current levels of outstanding debt and the government’s ability to issue additional debt in the future .
11 Computation of Legal Debt Margin and Authorized and Unissued Bonds....……..... 254 12 Ratio of Net General Bonded Debt to Assessed Value and Net Bonded
Debt per Capita .………….………………………………………………………....... 255 13 Ratio of Annual Debt Service Expenditures for General Bonded Debt to
Total General Government Expenditures ….…….…………………………….......... 256 14 Computation of Direct and Overlapping Debt ...……………………………….......... 257 15 Schedule of Revenue Bond Coverage – Bridge, Water, Sewer System, and Sports
Venue ……………………………...………………………………………………..... 258 16 Ratios of Outstanding Debt by Type ……………………………………………........ 260
Demographic and Economic Information These schedules offer demographic and economic indicators to help the reader
understand the environment within which the government’s financial activities take place.
17 Demographics Statistics …………..…...…………………………………….……..... 261 18 Property Value, Construction and Bank Deposits ……………………………........... 265 19 Principal Employers ……………………….….…….……………………………...... 266 20 Principal Water Consumers …………………....………………………………......... 267
Operating Information These schedules contain service and infrastructure data to help the reader understand how the information in the government’s financial report.
21 Miscellaneous Statistics ………..…...…………………………………….……........ 268 22 Insurance in Force ……….………………………………………………………....... 280 23 Full-Time Equivalent City Government Employees by Function ……………........... 281 24 Operating Indicators by Function ……………...………………………………......... 282 25 Capital Assets Statistics by Function………………………………………………… 284
CONTINUING DISCLOSURE INFORMATION …………………………………….......... 287
SINGLE AUDIT. ……………………………………………………………………………. 331

This page intentionally left blank
I
March 13, 2020 To the Honorable Mayor, Members of the Governing Council, and Citizens of the City of Laredo. We are pleased to submit the Comprehensive Annual Financial Report of the City of Laredo, Texas for the fiscal year ending September 30, 2019. Responsibility for both the accuracy of the data and the completeness and fairness of the presentation, including all disclosures, rests with the City. To the best of our knowledge and belief, the enclosed data is accurate in all material aspects and is reported in a manner designed to present fairly the financial position and results of operations of the various funds of the City. All disclosures necessary to enable the reader to gain an understanding of the City's financial activities have been included. This report consists of management’s representations concerning the finances of the City of Laredo. Consequently, management assumes full responsibility for the completeness and reliability of all of the information presented in this report. To provide a reasonable basis for making these representations, management has established a comprehensive internal control framework that is design both to protect the government’s assets from loss, theft, or misuse and to compile sufficient reliable information for the preparation of the City of Laredo’s financial statements in conformity with GAAP (Generally Accepted Accounting Principles). Because the cost of internal controls should not outweigh the benefits, the City of Laredo’s comprehensive framework of internal controls has been design to provide reasonable rather than absolute assurance that the financial statements will be free from material misstatement. As management, we assert that, to the best of our knowledge and belief, this financial report is complete and reliable in all material respects. Canales, Garza, & Baum Co., P.L.L.C., a firm of licensed certified public accountants, have audited the City of Laredo’s financial statements. The goal of the independent audit was to provide reasonable assurance that the financial statements of the City of Laredo for the fiscal year ended September 30, 2019, are
II
free of material misstatement. The independent audit involved examining, on a test basis, evidence supporting the amounts and disclosures in the financial statements, assessing the accounting principles used and significant estimates made by management; and evaluating the overall financial statement presentation. The independent auditors concluded, based upon the audit, that there was a reasonable basis for rendering an unmodified opinion that the City of Laredo’s financial statements for the fiscal year ended September 30, 2019 are presented in conformity with GAAP. The independent auditor’s report is presented as the first component of the financial section of this report. In addition, the City has an Internal Audit Division. The division is under the City Manager but reports directly to the Mayor and City Council. Its primary responsibility is to measure and evaluate the City’s accounting and operational controls. This division was directly establish to ensure that the City’s assets are safeguarded and to provide reasonable assurance of proper accounting and operational activities to our public. The independent audit of the financial statements of the City of Laredo was part of a broader, federally mandated “Single Audit” designed to meet the special needs of federal and state granting agencies. The standards governing Single Audit engagements require the independent auditor to report not only on the fair presentation of the financial statements, but also on the audited government’s internal controls and compliance with legal requirements, with special emphasis on internal controls and legal requirements involving the administration of federal awards. These reports are available in the Single Audit Section of this report. GAAP requires that management provide a narrative introduction, overview, and analysis to accompany the basic financial statements in the form of Management’s Discussion and Analysis (MD&A). This letter of transmittal is designed to complement the MD&A and should be read in conjunction with it. The City of Laredo’s MD&A can be found immediately following the report of the independent auditors. Profile of the Government
The City of Laredo incorporated in 1755. It is located on the north bank of the historical Rio Grande River. Laredo is unique because it is the only City to operate international bridges between two Mexican states. The City owns, maintains and operates four-border crossing, three with Nuevo Laredo, Mexico and one with Colombia, Mexico. Laredo is at the center of the primary trade route. It is the only border city strategically positioned at the convergence of all land transportation systems between Canada, the United States and Mexico. The City of Laredo is the largest city in the County of Webb with an estimated population of 257,156 in 2017, according to the U.S. Census estimates.
III
The City of Laredo is empowered to levy a property tax on both real and personal properties located within its boundaries. It also is empowered by state statue to extend its corporate limits by annexation, which occurs periodically when deemed appropriate by the City Council. The City of Laredo operates under the council-manager form of government. The policy-making and legislative authority are vested to the City Council consisting of the Mayor and eight Council members. The governing council is responsible, among other things for passing ordinances, adopting budgets, appointing committees, and the hiring of the City Manager. The City Manager is responsible for carrying out the policies and ordinances of the City Council, for overseeing the day-to-day operations of the government, and for appointing the directors of the various departments. The council is elected on a non-partisan basis. Council members may serve up to two (2) four (4) year terms. The mayor is elected to serve a four-year term with a limit of two (2) terms. All council members are elected by district. The mayor is elected at large. The City of Laredo provides a full range of municipal services including police and fire protection, parks, recreational and cultural activities, libraries, recycling services, public health and social services, municipal housing, animal care facility, public improvements, public bus transportation, water and wastewater services, sanitation services, four international bridges, an international airport, planning and zoning, and general administrative services. As such, these activities are reflected in the financial statements along with the capital project funds, debt service fund, internal service funds, and fiduciary funds. These financial statements were prepared in accordance with GAAP for local governments as prescribed by the Government Accounting Standards Board (GASB). The financial statements include component units of the City of Laredo. Component units are units that are legally separate organizations. The City and our elected officials are financially accountable for these component units. The City’s component unit entities include:
Laredo Transit Management, Inc. Laredo Convention and Visitor’s Bureau Laredo Fire Fighters’ Retirement System Laredo Public Facilities Corporation - La Terraza, LLC Sames Auto Arena Max Mandel Municipal Golf Course Tax Increment Reinvestment Zone Number One
IV
All these entities are explained in more detail on note #1 of the Notes to the Basic Financial Statements portion of the CAFR. The annual budget serves as the foundation for the City of Laredo’s financial planning and control. The City Manager presents a proposed balanced budget to the City Council for review though council workshops. The council is required to hold public hearings on the proposed budget and to adopt a final budget by no later than September 30, the close of the City of Laredo’s fiscal year. The appropriated budget is prepared by fund, function (e.g., public safety), and department (e.g. police). Department Directors may make transfers of appropriations within a department through an insufficient appropriation notice that is review by the Budget, Finance and City Manager’s Office depending on the dollar value. Transfers of appropriations between funds require the special approval of the City Council. Budget-to-actual comparisons are provided in these reports for each individual governmental fund for which an appropriated annual budget has been adopted. For the General Fund, this comparison is presented as part of the basic financial statements for the governmental funds. For governmental funds, other than the General Fund, with appropriated annual budgets, this comparison is presented in the non-major governmental fund subsection of this report. Also included in the governmental fund subsection are project-length budget-to-actual comparisons for each governmental fund for which a project-length budget has been adopted (i.e., the special revenue and enterprise funds). Factors Affecting Financial Condition The information presented in the financial statements is perhaps best understood when it is considered from the broader perspective of the specific environment within which the City of Laredo operates. Local economy: Laredo is strategically positioned with a large transportation and warehousing industry. Trade between the United States and México is a vital part of our economy and continues to prosper. The Port of Laredo is the #1 inland port in the United States and the #2 port in the nation just behind Port of Los Angeles California. We have four (4) international bridges; two of which are commercial crossings and have over 2.33 million trucks crossing annually. The Laredo Customs District trades over $326.87 billion imports and exports annually. Based on trade statistics by World City Magazine, Laredo set trade records for ninth consecutive year. Laredo’s trade increased 7.75% for 2018. Laredo remains the third largest U.S. Customs District in the country and the number one inland port. Only Los Angeles and New York, (both water ports) are above the Laredo Customs District. We continue to host producers of goods from Mexico, Central and South America in order to bring additional commerce to our City and establish a stronger economic growth. We have established strong business alliances with the Mexican Ports of
V
Lazaro Cardenas and Manzanillo. The ports are using Laredo as the main port to import products into the United States. During the workweek, more than 8,937 trucks cross daily into Laredo. On rail, more than 1,100 rail cars pass though Laredo daily, making it one of the top railroad interchanges in the U.S. and the busiest on the Southern Border. Mexico, China, Malaysia, Thailand and France are Laredo’s top importers / exporters. Top imports totaled $192.84 billion that crossed through Laredo were:
Motor vehicle parts Motor vehicles for transporting people Commercial vehicles Cell phones and related equipment Tractors Computers Insulated wire and cable Seats, excluding barber and dental Motor Vehicle Engines Refrigerators and freezers
Top exports totaled $134.03 billion that crossed through Laredo were:
Motor vehicle parts Gasoline, other fuels Diesel engines Petroleum gases and other hydrocarbons Cell phones and related equipment Computer chips Electrical supplies and apparatus Engine parts Plastics Taps and valves for pipes and tanks.
In addition, the City’s economic growth in international trade has been enhanced by other projects such as the Cold Storage Facilities build in our international commercial bridges and Federal Inspection Station (FIS) at the Laredo International Airport. The cold storage facilities have expedited the import of fruit and vegetables as well as the flowers from Central and South America. The FIS at the Laredo International Airport allows Mexican Customs to pre-clear American goods imported into Mexico. This is the only international inspection in the United States. The purpose is to reduce delivery times and cost into a Mexican bonded facility. Various Mexican airports located throughout Mexico are approved to participate in this program as well as major automotive companies such as General Motors, Chrysler and Honda de Mexico.
VI
In addition to the FIS at the airport, the Laredo International Airport is rank 6th among all cargo airports in Texas and 41st in the nation. In 2019, the airport facility handled approximately 531.44 million pounds of cargo in landed weight.
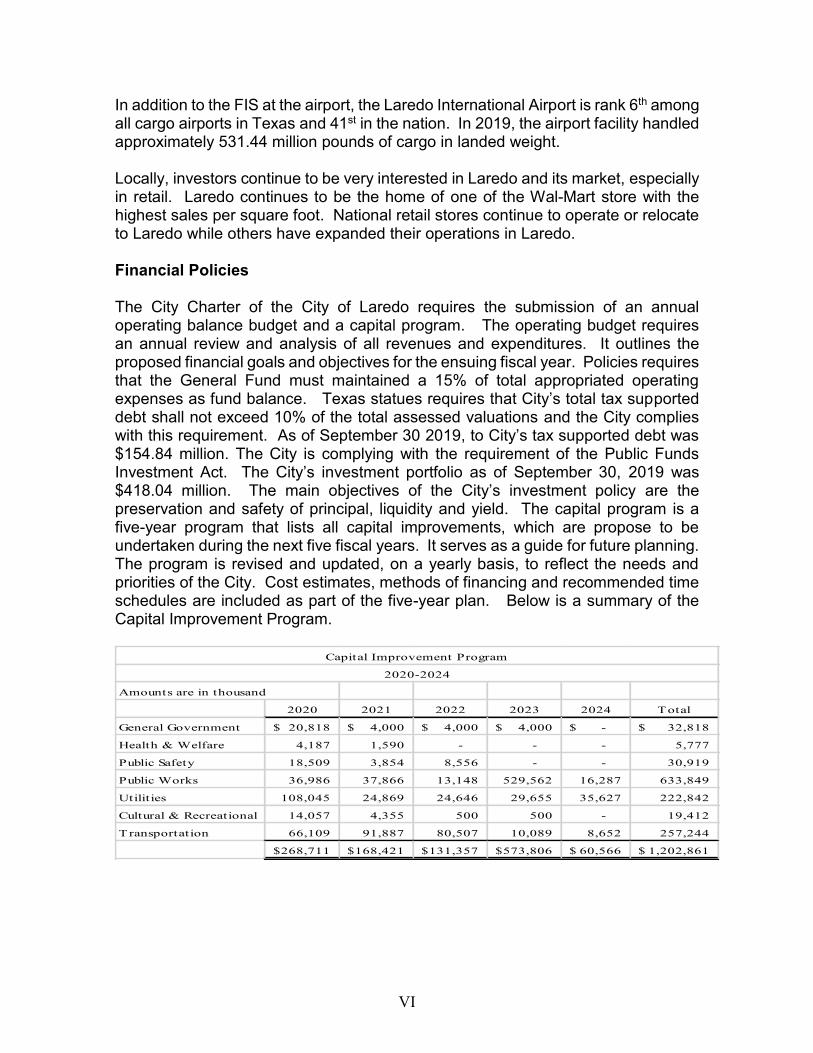
Locally, investors continue to be very interested in Laredo and its market, especially in retail. Laredo continues to be the home of one of the Wal-Mart store with the highest sales per square foot. National retail stores continue to operate or relocate to Laredo while others have expanded their operations in Laredo. Financial Policies The City Charter of the City of Laredo requires the submission of an annual operating balance budget and a capital program. The operating budget requires an annual review and analysis of all revenues and expenditures. It outlines the proposed financial goals and objectives for the ensuing fiscal year. Policies requires that the General Fund must maintained a 15% of total appropriated operating expenses as fund balance. Texas statues requires that City’s total tax supported debt shall not exceed 10% of the total assessed valuations and the City complies with this requirement. As of September 30 2019, to City’s tax supported debt was $154.84 million. The City is complying with the requirement of the Public Funds Investment Act. The City’s investment portfolio as of September 30, 2019 was $418.04 million. The main objectives of the City’s investment policy are the preservation and safety of principal, liquidity and yield. The capital program is a five-year program that lists all capital improvements, which are propose to be undertaken during the next five fiscal years. It serves as a guide for future planning. The program is revised and updated, on a yearly basis, to reflect the needs and priorities of the City. Cost estimates, methods of financing and recommended time schedules are included as part of the five-year plan. Below is a summary of the Capital Improvement Program.
Amounts are in thousand
2020 2021 2022 2023 2024 Total
General Government 20,818$ 4,000$ 4,000$ 4,000$ -$ 32,818$
Health & Welfare 4,187 1,590 - - - 5,777
Public Safety 18,509 3,854 8,556 - - 30,919
Public Works 36,986 37,866 13,148 529,562 16,287 633,849
Utilities 108,045 24,869 24,646 29,655 35,627 222,842
Cultural & Recreational 14,057 4,355 500 500 - 19,412
T ransportation 66,109 91,887 80,507 10,089 8,652 257,244
268,711$ 168,421$ 131,357$ 573,806$ 60,566$ 1,202,861$
Capital Improvement Program
2020-2024
VII
MAJOR INITIATIVES For the Year 2018-2019 The City staff, following the directives of the City Council and the City Manager, have addressed and completed a large number of projects during the year. The projects adopted by City Council annually through a five-year Capital Improvement Plan. These projects reflect the City’s commitment to building a better Laredo and provide its citizens with a better quality of life, economic prosperity and safety.
Completion of improvements to streets, including curb and gutter and other
improvements at a cost of $13.17 million during this fiscal year.
Drainage improvements projects completed during the current year totaled $3.3 million
Infrastructure projects at a cost of $15.53 million were completed during the fiscal
year 2019. Among the completed projects includes downtown parking lots, sidewalks, airport runway, taxiways and apron improvements. Other projects included are parks improvements, traffic signal improvements and street lighting improvements in the downtown area.
Building improvement for $2.35 million were completed during the year. The expansion of the Utilities System Administration Building at a cost of $1.55 million.
Improvements to the utilities system water and sewer lines at a cost of $6.95 million.
Acquisition of machinery and equipment including vehicles and equipment for all City departments total $18.44 million.
Land at a cost of $3.15 million was acquired during the fiscal year for City’s noise
abetment project as well as for other proprietary funds.
Future Major Initiatives Projects that have been initiated or will be undertaken during the next fiscal year include: The Utilities Department has various water and sewer capital improvement
projects planned for FY 2020 and consists of the following:
VIII
o The Manadas Creek Sewer Plant at an estimated cost of $52,000,000 funded by Texas Water Development Board thru a revenue bond at very favorable interest rates.
o Water rights acquisition of $1.2 million that will supplement our inventory of water rights.
o Street Resurfacing / Paving Program at an estimated cost of $4 million. o Other projects for the Waterworks System include infrastructure
improvements of $20 million for line replacement program, booster station improvements, water tank improvements and water plan expansion.
o Booster Station and Plant Pump Replacement project for the Waterworks
System at a projected cost of $10 million. o Sewer System infrastructure improvements projects at an estimated cost
of $20 will be funded with revenue bond. Improvements include sewer line replacement, Chacon Creek interceptor, Zacate Creek sewer gravity line, lift stations improvements and other projects.
Other City Wide Projects include:
o Building improvements at an estimated cost of $3.3 million.
o Equipment and machinery for various department for $9.6 million.
o Rehabilitation of streets project at an estimated cost of $4 million. o The construction / improvements of parks, streets, sidewalks, drainage,
traffic signals, street signalization and street lighting at an estimated cost of $14.35 million.
o Acquisition of land for a new landfill at an estimated cost of $ 24,000,000. o In order improve operational efficiencies of the World Trade Bridge, the
City along with Texas Department of Transportation (TXDOT) and donation of land from the federal government are relocating the Free and Secure Trade lanes. This will provide direct access from the bridge spam to the inspection facilities and onto the various trucking routes. The project is estimated at $10.3 million funded by Coordinated Border Infrastructure Grant of $8 million by TXDOT and $2.3 from the City of Laredo Bridge Fund.
IX
The City of Laredo continues to work and coordinate projects with the Laredo Metropolitan Planning Organization to alleviate transportation issues for the benefit of the citizens of Laredo. Projects include the following:
o An interchange at IH35 and U.S.59/I-69 West. The first phase of this project has been completed. Other phases of the project are expected to be let out next year. An INFRA Grant formerly Fastlane Grant application was resubmitted on behalf of the City, TXDOT, Webb County and the Regional Mobility Authority requesting $78 million in federal funds, $30 million from TXDOT and $22 million from local agencies including the City of Laredo.
o The construction of a $46 million road called Hachar-Reuthinger Road, which will connect FM 1472 and IH35 for the critical movement of trucks in West Laredo. Phase I is at a cost of $24.14 million and Phase II at an estimated cost of $22 million. TXDOT, Webb County and the City of Laredo will be providing funding for this project.
The Texas Department of Transportation and the City of Laredo are working jointly on projects along Loop 20, they include:
o The widening of the Loop 20 bridge over the Kansas City Southern (KCS)
rail tracks, a $9.1 million project was completed in 2019. Phase II of the project was also completed at an estimated cost of $15.4 million. The project included additional frontage road over the KCS Bridge and the adjoining overpass with an estimated project cost of $15.4 million.
Awards and Acknowledgements The City has received the Government Finance Officers Association of the United States and Canada (GFOA) award a Certificate of Achievement for Excellence in Financial Reporting for thirty years. In order to be awarded a Certificate of Achievement, the government must publish an easily readable and efficiently organized comprehensive annual financial report. This report satisfied both generally accepted accounting principles and applicable legal requirements. A Certificate of Achievement is valid for only a one-year period. We believe that our current comprehensive financial report continues to meet the Certificate of Achievement Program’s requirements and we are submitting it to the GFOA to determine its eligibility for a certificate. In addition, the government also received the GFOA’s Distinguished Budget Presentation Award for its twenty-fifth consecutive year. In order to qualify for the Distinguished Budget Presentation Award, the government’s budget document was
XI
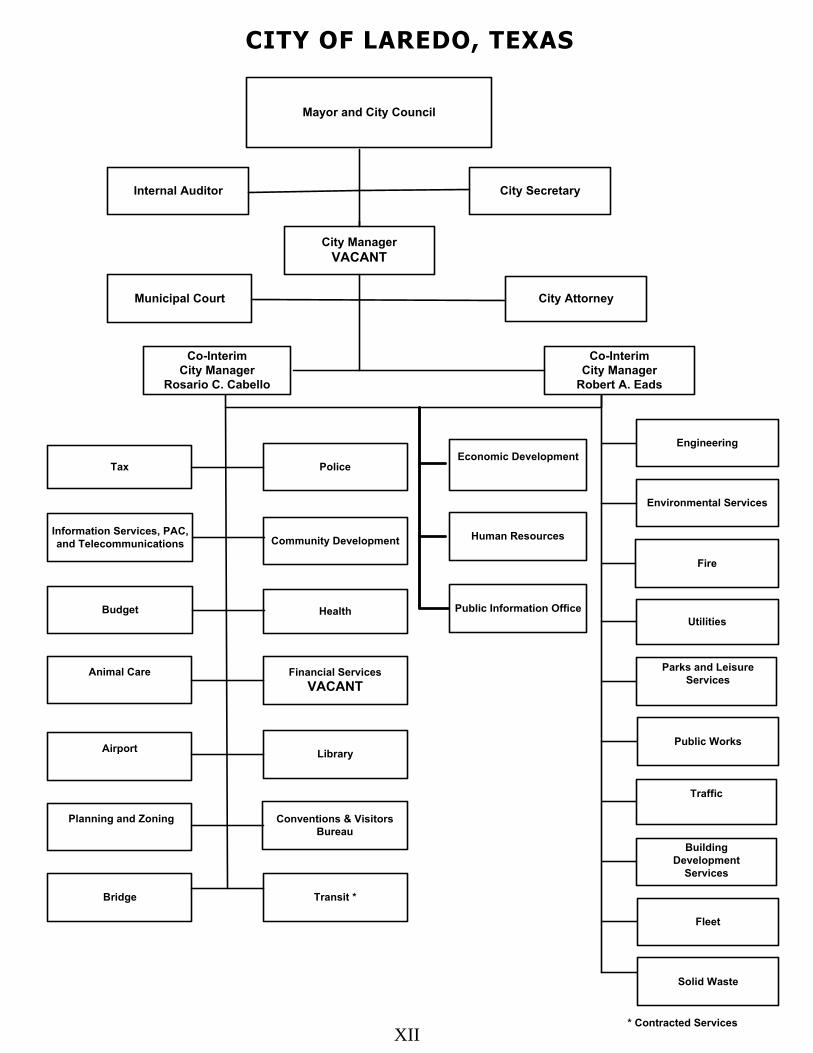
CITY OF LAREDO, TEXAS
Mayor and City Council
Municipal Court
Health
Community Development
PoliceTax
Information Services, PAC, and Telecommunications
Parks and Leisure Services
Planning and Zoning
Traffic
Budget
Fire
Fleet
City ManagerVACANT
City Secretary
City Attorney
Co-InterimCity Manager
Robert A. Eads
Co-Interim City Manager
Rosario C. Cabello
Human Resources
Environmental Services
Utilities
Economic Development
Library
Engineering
Public Works
Bridge
Building Development
Services
* Contracted Services
Financial ServicesVACANT
Animal Care
Airport
Transit *
Solid Waste
Conventions & Visitors Bureau
Public Information Office
Internal Auditor
XII
XIII
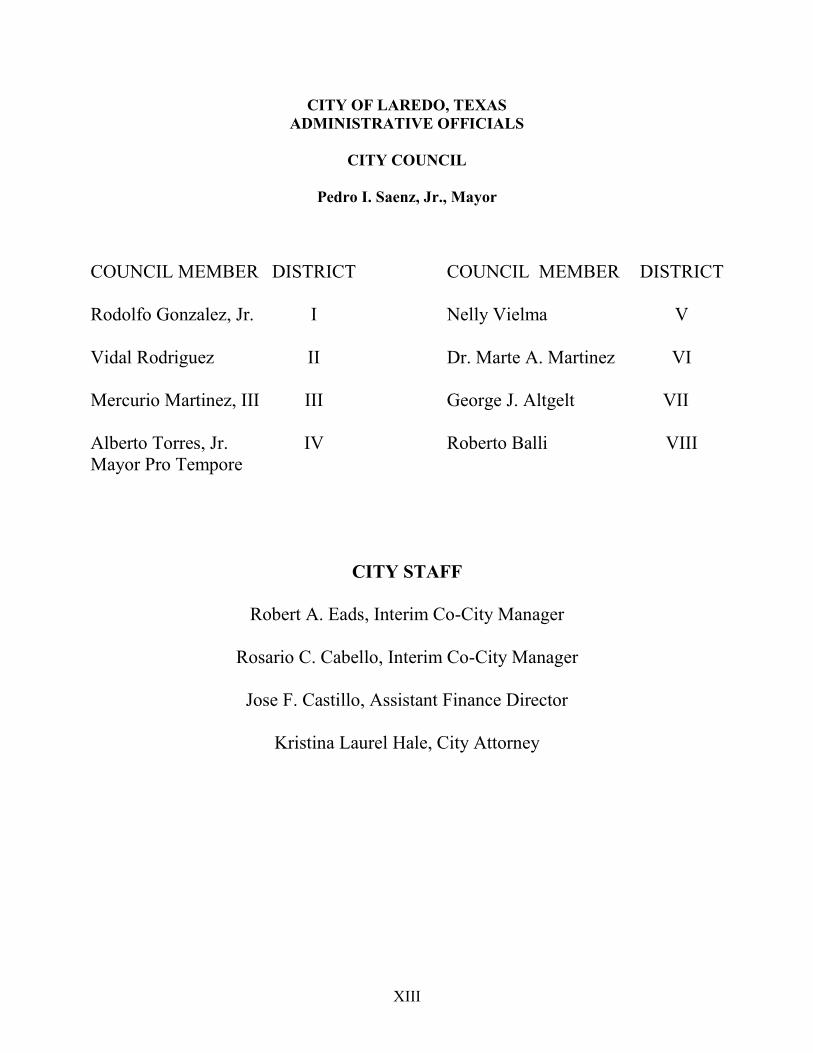
CITY OF LAREDO, TEXAS ADMINISTRATIVE OFFICIALS
CITY COUNCIL
Pedro I. Saenz, Jr., Mayor
COUNCIL MEMBER DISTRICT COUNCIL MEMBER DISTRICT
Rodolfo Gonzalez, Jr. I Nelly Vielma V
Vidal Rodriguez II Dr. Marte A. Martinez VI
Mercurio Martinez, III III George J. Altgelt VII
Alberto Torres, Jr. Mayor Pro Tempore
IV Roberto Balli VIII
CITY STAFF
Robert A. Eads, Interim Co-City Manager
Rosario C. Cabello, Interim Co-City Manager
Jose F. Castillo, Assistant Finance Director
Kristina Laurel Hale, City Attorney

FINANCIAL SECTION
1
2
3
MANAGEMENT’S DISCUSSION AND ANALYSIS (UNAUDITED)
The City of Laredo’s Management’s Discussion and Analysis is designed to (a) assist the reader in focusing on significant financial issues, (b) provide an overview of the City’s financial activity, (c) identify changes in the City’s financial position (its ability to address the next and subsequent years’ challenges), (d) identify any material deviations from the financial plan (the approved budget), and (e) identify individual fund issues or concerns.
This section of the City of Laredo’s annual financial report presents our discussion and analysis of the City’s financial performance during the fiscal year that ended September 30, 2019. We encourage readers to consider the information presented here in conjunction with additional information that we have furnished in our letter of transmittal.
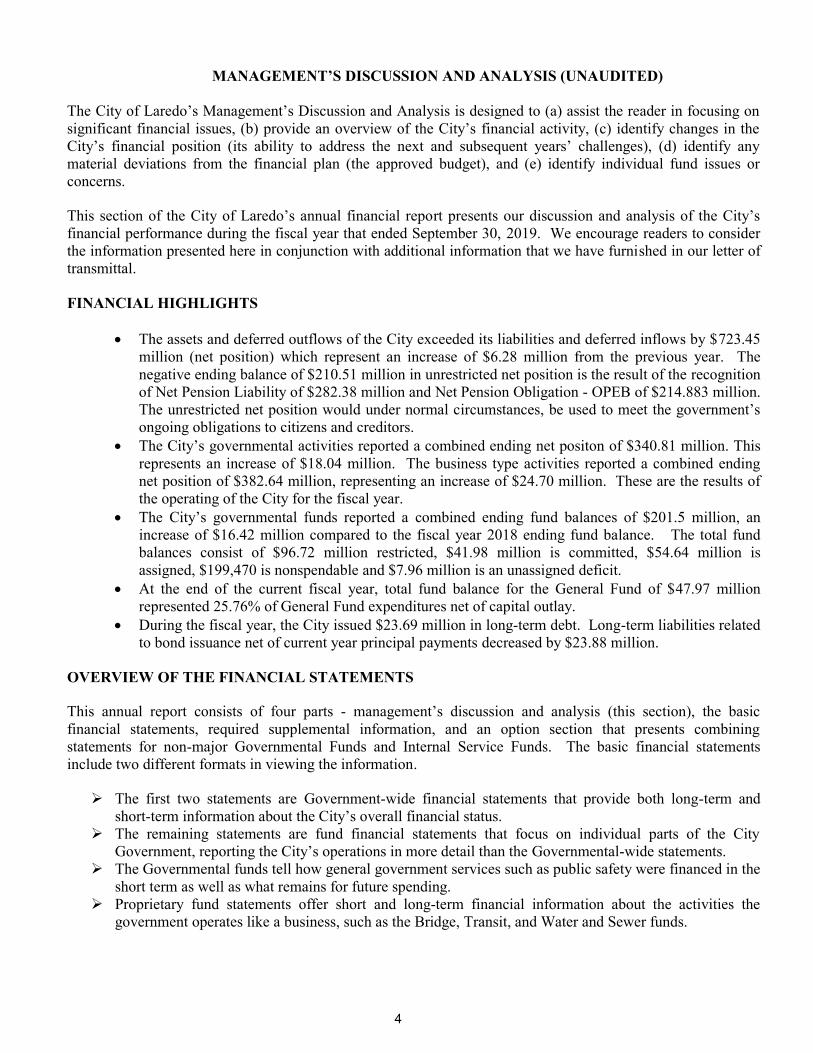
FINANCIAL HIGHLIGHTS
The assets and deferred outflows of the City exceeded its liabilities and deferred inflows by $723.45million (net position) which represent an increase of $6.28 million from the previous year. Thenegative ending balance of $210.51 million in unrestricted net position is the result of the recognitionof Net Pension Liability of $282.38 million and Net Pension Obligation - OPEB of $214.883 million.The unrestricted net position would under normal circumstances, be used to meet the government’songoing obligations to citizens and creditors.
The City’s governmental activities reported a combined ending net positon of $340.81 million. Thisrepresents an increase of $18.04 million. The business type activities reported a combined endingnet position of $382.64 million, representing an increase of $24.70 million. These are the results ofthe operating of the City for the fiscal year.
The City’s governmental funds reported a combined ending fund balances of $201.5 million, anincrease of $16.42 million compared to the fiscal year 2018 ending fund balance. The total fundbalances consist of $96.72 million restricted, $41.98 million is committed, $54.64 million isassigned, $199,470 is nonspendable and $7.96 million is an unassigned deficit.
At the end of the current fiscal year, total fund balance for the General Fund of $47.97 millionrepresented 25.76% of General Fund expenditures net of capital outlay.
During the fiscal year, the City issued $23.69 million in long-term debt. Long-term liabilities relatedto bond issuance net of current year principal payments decreased by $23.88 million.
OVERVIEW OF THE FINANCIAL STATEMENTS
This annual report consists of four parts - management’s discussion and analysis (this section), the basic financial statements, required supplemental information, and an option section that presents combining statements for non-major Governmental Funds and Internal Service Funds. The basic financial statements include two different formats in viewing the information.
The first two statements are Government-wide financial statements that provide both long-term andshort-term information about the City’s overall financial status.
The remaining statements are fund financial statements that focus on individual parts of the CityGovernment, reporting the City’s operations in more detail than the Governmental-wide statements.
The Governmental funds tell how general government services such as public safety were financed in theshort term as well as what remains for future spending.
Proprietary fund statements offer short and long-term financial information about the activities thegovernment operates like a business, such as the Bridge, Transit, and Water and Sewer funds.
4
Fiduciary fund statements provide information about the financial relationships as an example, theretirement plan for the City’s employees in which the City acts solely as a trustee or agent for the benefitof others, to whom the resources mentioned above, belong.
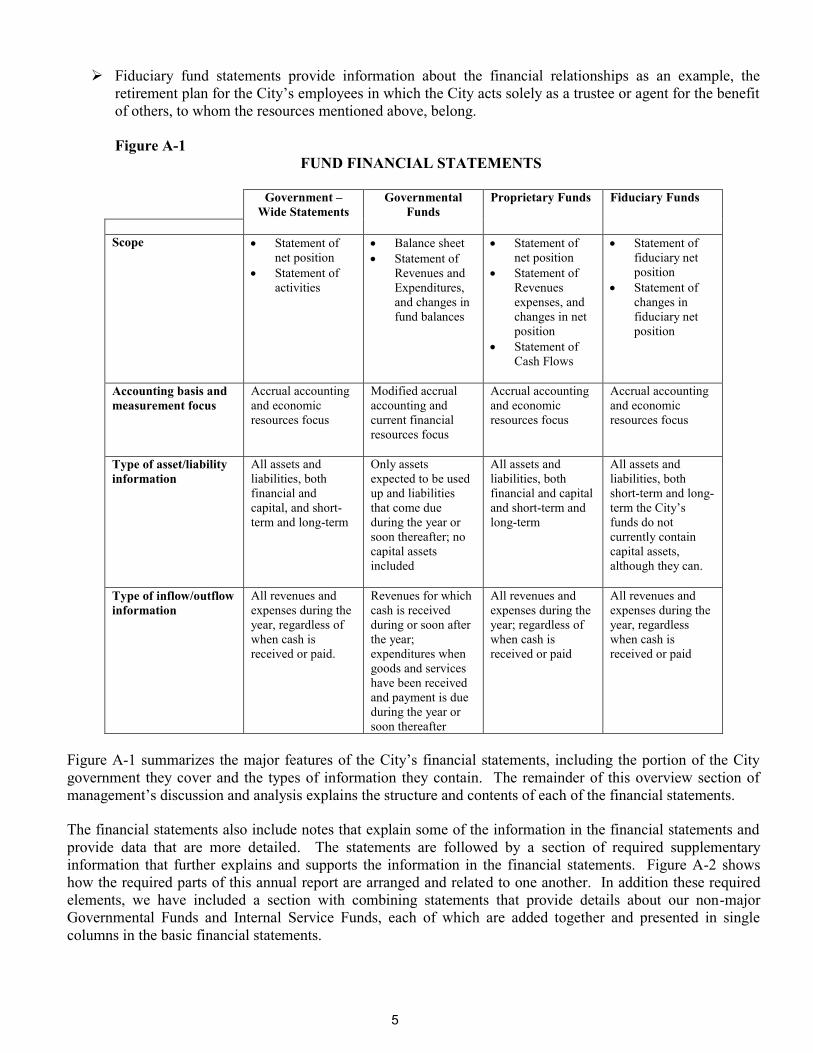
Figure A-1 FUND FINANCIAL STATEMENTS
Government –Wide Statements
Governmental Funds
Proprietary Funds Fiduciary Funds
Scope Statement ofnet position
Statement ofactivities
Balance sheet Statement of
Revenues andExpenditures,and changes infund balances
Statement ofnet position
Statement ofRevenuesexpenses, andchanges in netposition
Statement ofCash Flows
Statement offiduciary netposition
Statement ofchanges infiduciary netposition
Accounting basis and measurement focus
Accrual accounting and economic resources focus
Modified accrual accounting and current financial resources focus
Accrual accounting and economic resources focus
Accrual accounting and economic resources focus
Type of asset/liability information
All assets and liabilities, both financial and capital, and short-term and long-term
Only assets expected to be used up and liabilities that come due during the year or soon thereafter; no capital assets included
All assets and liabilities, both financial and capital and short-term and long-term
All assets and liabilities, both short-term and long-term the City’s funds do not currently contain capital assets, although they can.
Type of inflow/outflow information
All revenues and expenses during the year, regardless of when cash is received or paid.
Revenues for which cash is received during or soon after the year; expenditures when goods and services have been received and payment is due during the year or soon thereafter
All revenues and expenses during the year; regardless of when cash is received or paid
All revenues and expenses during the year, regardless when cash is received or paid
Figure A-1 summarizes the major features of the City’s financial statements, including the portion of the City government they cover and the types of information they contain. The remainder of this overview section of management’s discussion and analysis explains the structure and contents of each of the financial statements.
The financial statements also include notes that explain some of the information in the financial statements and provide data that are more detailed. The statements are followed by a section of required supplementary information that further explains and supports the information in the financial statements. Figure A-2 shows how the required parts of this annual report are arranged and related to one another. In addition these required elements, we have included a section with combining statements that provide details about our non-major Governmental Funds and Internal Service Funds, each of which are added together and presented in single columns in the basic financial statements.
5
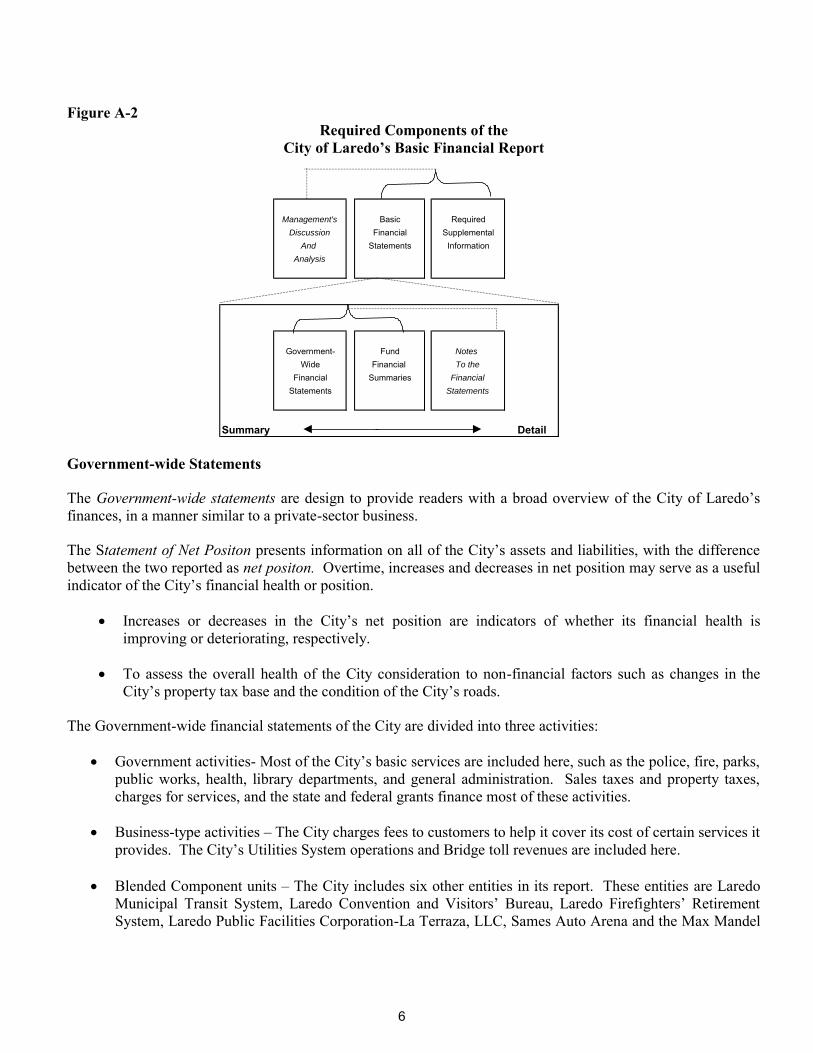
Figure A-2 Required Components of the
City of Laredo’s Basic Financial Report
Government-wide Statements
The Government-wide statements are design to provide readers with a broad overview of the City of Laredo’s finances, in a manner similar to a private-sector business.
The Statement of Net Positon presents information on all of the City’s assets and liabilities, with the difference between the two reported as net positon. Overtime, increases and decreases in net position may serve as a useful indicator of the City’s financial health or position.
Increases or decreases in the City’s net position are indicators of whether its financial health isimproving or deteriorating, respectively.
To assess the overall health of the City consideration to non-financial factors such as changes in theCity’s property tax base and the condition of the City’s roads.
The Government-wide financial statements of the City are divided into three activities:
Government activities- Most of the City’s basic services are included here, such as the police, fire, parks,public works, health, library departments, and general administration. Sales taxes and property taxes,charges for services, and the state and federal grants finance most of these activities.
Business-type activities – The City charges fees to customers to help it cover its cost of certain services itprovides. The City’s Utilities System operations and Bridge toll revenues are included here.
Blended Component units – The City includes six other entities in its report. These entities are LaredoMunicipal Transit System, Laredo Convention and Visitors’ Bureau, Laredo Firefighters’ RetirementSystem, Laredo Public Facilities Corporation-La Terraza, LLC, Sames Auto Arena and the Max Mandel
Management's Basic RequiredDiscussion Financial Supplemental
And Statements InformationAnalysis
Government- Fund Notes
Wide Financial To the
Financial Summaries Financial
Statements Statements
Summary Detail
6
Municipal Golf Course. Although legally separate, these “component units” are important because the City is financially accountable for them.
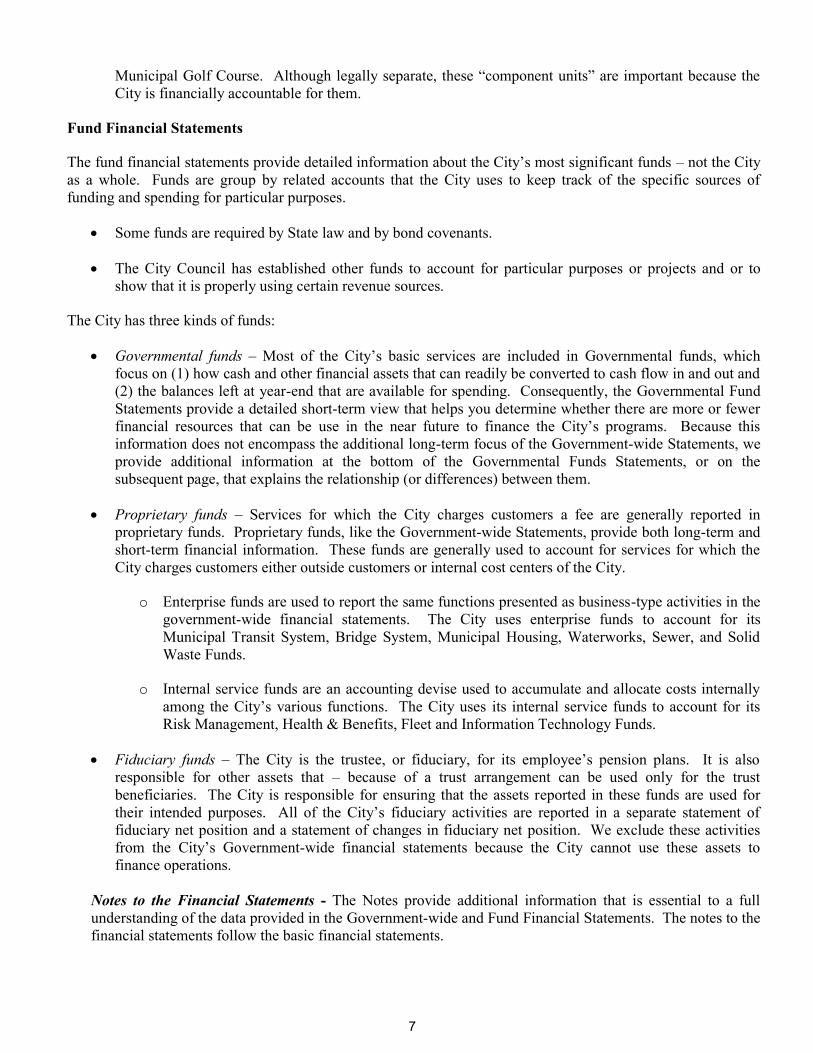
Fund Financial Statements
The fund financial statements provide detailed information about the City’s most significant funds – not the City as a whole. Funds are group by related accounts that the City uses to keep track of the specific sources of funding and spending for particular purposes.
Some funds are required by State law and by bond covenants.
The City Council has established other funds to account for particular purposes or projects and or toshow that it is properly using certain revenue sources.
The City has three kinds of funds:
Governmental funds – Most of the City’s basic services are included in Governmental funds, whichfocus on (1) how cash and other financial assets that can readily be converted to cash flow in and out and(2) the balances left at year-end that are available for spending. Consequently, the Governmental FundStatements provide a detailed short-term view that helps you determine whether there are more or fewerfinancial resources that can be use in the near future to finance the City’s programs. Because thisinformation does not encompass the additional long-term focus of the Government-wide Statements, weprovide additional information at the bottom of the Governmental Funds Statements, or on thesubsequent page, that explains the relationship (or differences) between them.
Proprietary funds – Services for which the City charges customers a fee are generally reported inproprietary funds. Proprietary funds, like the Government-wide Statements, provide both long-term andshort-term financial information. These funds are generally used to account for services for which theCity charges customers either outside customers or internal cost centers of the City.
o Enterprise funds are used to report the same functions presented as business-type activities in thegovernment-wide financial statements. The City uses enterprise funds to account for itsMunicipal Transit System, Bridge System, Municipal Housing, Waterworks, Sewer, and SolidWaste Funds.
o Internal service funds are an accounting devise used to accumulate and allocate costs internallyamong the City’s various functions. The City uses its internal service funds to account for itsRisk Management, Health & Benefits, Fleet and Information Technology Funds.
Fiduciary funds – The City is the trustee, or fiduciary, for its employee’s pension plans. It is alsoresponsible for other assets that – because of a trust arrangement can be used only for the trustbeneficiaries. The City is responsible for ensuring that the assets reported in these funds are used fortheir intended purposes. All of the City’s fiduciary activities are reported in a separate statement offiduciary net position and a statement of changes in fiduciary net position. We exclude these activitiesfrom the City’s Government-wide financial statements because the City cannot use these assets tofinance operations.
Notes to the Financial Statements - The Notes provide additional information that is essential to a full understanding of the data provided in the Government-wide and Fund Financial Statements. The notes to the financial statements follow the basic financial statements.
7
Required Supplemental Information – In addition to the basic financial statements and accompanying notes, the CAFR also presents certain required supplemental information. These schedules include a budgetary comparison and information concerning the City’s funding of its pension obligations and other postemployment benefits.
Other Information – Following the required supplemental information are additional schedules such as the combining statements referred to above in connection with non-major governmental funds, internal service funds and fiduciary funds and schedules of expenditures for capital projects.
GOVERNMENT-WIDE FINANCIAL ANALYSIS
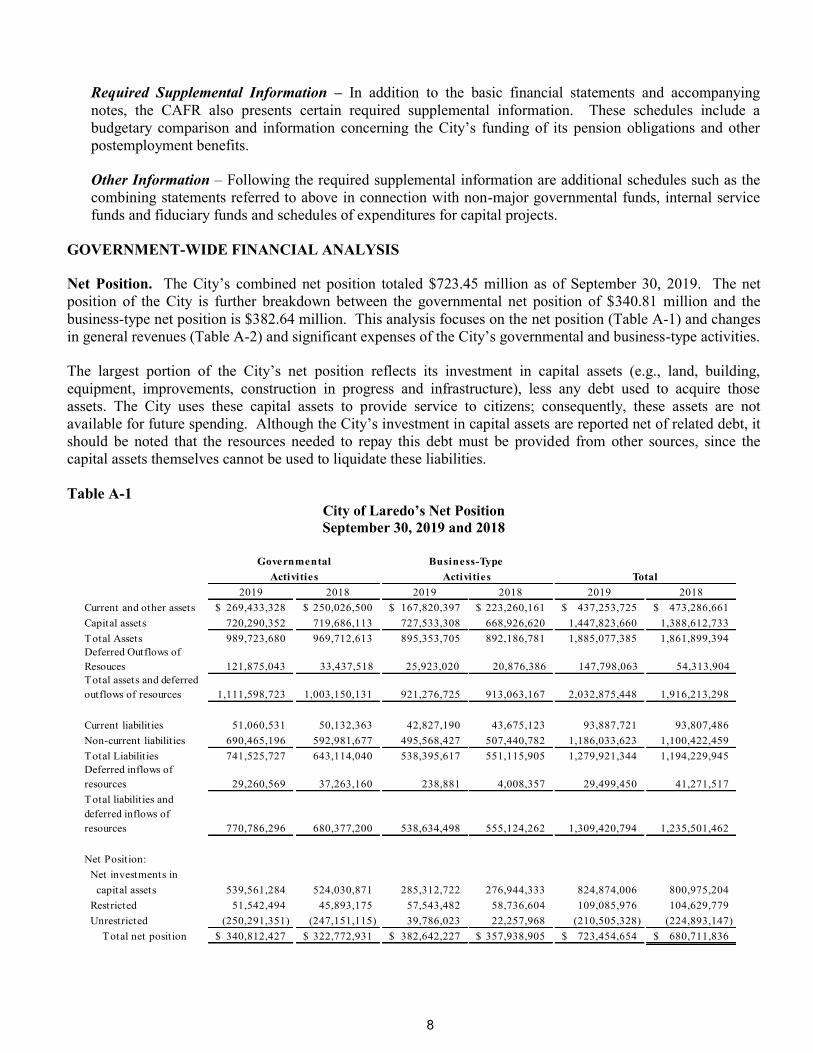
Net Position. The City’s combined net position totaled $723.45 million as of September 30, 2019. The net position of the City is further breakdown between the governmental net position of $340.81 million and the business-type net position is $382.64 million. This analysis focuses on the net position (Table A-1) and changes in general revenues (Table A-2) and significant expenses of the City’s governmental and business-type activities.
The largest portion of the City’s net position reflects its investment in capital assets (e.g., land, building, equipment, improvements, construction in progress and infrastructure), less any debt used to acquire those assets. The City uses these capital assets to provide service to citizens; consequently, these assets are not available for future spending. Although the City’s investment in capital assets are reported net of related debt, it should be noted that the resources needed to repay this debt must be provided from other sources, since the capital assets themselves cannot be used to liquidate these liabilities.
Table A-1City of Laredo’s Net Position September 30, 2019 and 2018
2019 2018 2019 2018 2019 2018Current and other assets 269,433,328$ 250,026,500$ 167,820,397$ 223,260,161$ 437,253,725$ 473,286,661$ Capital assets 720,290,352 719,686,113 727,533,308 668,926,620 1,447,823,660 1,388,612,733 Total Assets 989,723,680 969,712,613 895,353,705 892,186,781 1,885,077,385 1,861,899,394
121,875,043 33,437,518 25,923,020 20,876,386 147,798,063 54,313,904
1,111,598,723 1,003,150,131 921,276,725 913,063,167 2,032,875,448 1,916,213,298
Current liabilities 51,060,531 50,132,363 42,827,190 43,675,123 93,887,721 93,807,486 Non-current liabilities 690,465,196 592,981,677 495,568,427 507,440,782 1,186,033,623 1,100,422,459 Total Liabilities 741,525,727 643,114,040 538,395,617 551,115,905 1,279,921,344 1,194,229,945
29,260,569 37,263,160 238,881 4,008,357 29,499,450 41,271,517
770,786,296 680,377,200 538,634,498 555,124,262 1,309,420,794 1,235,501,462
Net Position: Net investments in capital assets 539,561,284 524,030,871 285,312,722 276,944,333 824,874,006 800,975,204 Restricted 51,542,494 45,893,175 57,543,482 58,736,604 109,085,976 104,629,779 Unrestricted (250,291,351) (247,151,115) 39,786,023 22,257,968 (210,505,328) (224,893,147)
Total net position 340,812,427$ 322,772,931$ 382,642,227$ 357,938,905$ 723,454,654$ 680,711,836$
Deferred inflows of resourcesTotal liabilities and deferred inflows of resources
Governmental Business-Type Total
Deferred Outflows of ResoucesTotal assets and deferred outflows of resources
Activities Activities
8
A portion of the City’s net position or $109.09 million represents resources that are subject to external restrictions on how they may be used. The City of Laredo has sufficient funds to meet requirements for cash outlays in the next fiscal year and has the financial capacity to meet its long-term obligations in the years to come. The City’s policy has been to make reasonable and continuous efforts to fund all long-term liabilities. The City’s restricted net position increased by 4.26% over the prior year.
Generally, the net position generated by governmental actives are either externally restricted or invested in capital assets. Unrestricted governmental activities net position increased by $3.14 million to a negative balance of $250.29 million for the year. The negative balance is due to the recognition of a liability of $448.13 million for the net pension liability and net pension obligation for OPEB.
Unrestricted net position in the business-type activities reflect an increase of $17.53 million to a positive balance of $39.79 million as of September 30, 2019.
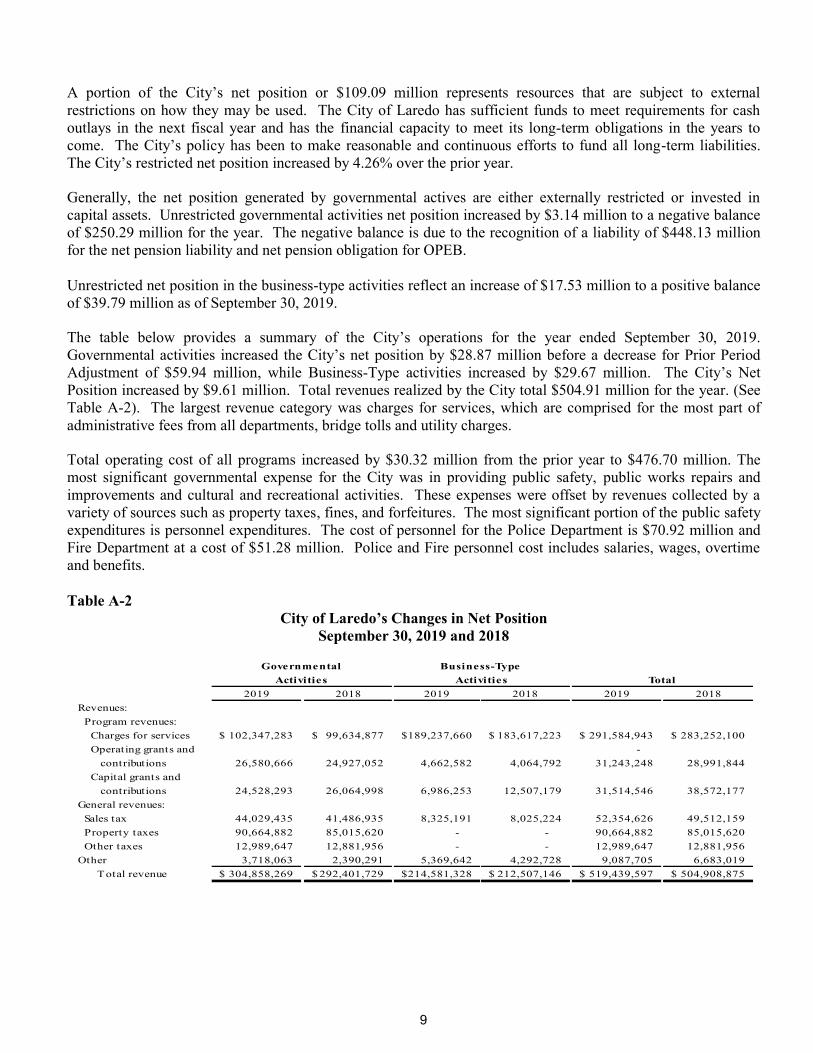
The table below provides a summary of the City’s operations for the year ended September 30, 2019. Governmental activities increased the City’s net position by $28.87 million before a decrease for Prior Period Adjustment of $59.94 million, while Business-Type activities increased by $29.67 million. The City’s Net Position increased by $9.61 million. Total revenues realized by the City total $504.91 million for the year. (See Table A-2). The largest revenue category was charges for services, which are comprised for the most part of administrative fees from all departments, bridge tolls and utility charges.
Total operating cost of all programs increased by $30.32 million from the prior year to $476.70 million. The most significant governmental expense for the City was in providing public safety, public works repairs and improvements and cultural and recreational activities. These expenses were offset by revenues collected by a variety of sources such as property taxes, fines, and forfeitures. The most significant portion of the public safety expenditures is personnel expenditures. The cost of personnel for the Police Department is $70.92 million and Fire Department at a cost of $51.28 million. Police and Fire personnel cost includes salaries, wages, overtime and benefits.
Table A-2 City of Laredo’s Changes in Net Position
September 30, 2019 and 2018
2019 2018 2019 2018 2019 2018Revenues: Program revenues:
Charges for services 102,347,283$ 99,634,877$ 189,237,660$ 183,617,223$ 291,584,943$ 283,252,100$ Operating grants and -
contributions 26,580,666 24,927,052 4,662,582 4,064,792 31,243,248 28,991,844 Capital grants and
contributions 24,528,293 26,064,998 6,986,253 12,507,179 31,514,546 38,572,177 General revenues: Sales tax 44,029,435 41,486,935 8,325,191 8,025,224 52,354,626 49,512,159 Property taxes 90,664,882 85,015,620 - - 90,664,882 85,015,620 Other taxes 12,989,647 12,881,956 - - 12,989,647 12,881,956
Other 3,718,063 2,390,291 5,369,642 4,292,728 9,087,705 6,683,019 Total revenue 304,858,269$ 292,401,729$ 214,581,328$ 212,507,146$ 519,439,597$ 504,908,875$
Governmental Business-Type TotalActivities Activities
9
2019 2018 2019 2018 2019 2018Expenses: General Government 25,667,856$ 14,669,141$ -$ -$ 25,667,856$ 14,669,141$ Public Safety 151,438,541 144,679,796 - - 151,438,541 144,679,796 Public Works 36,761,439 36,856,653 - - 36,761,439 36,856,653 Health & Welfare 30,536,437 28,247,621 - - 30,536,437 28,247,621 Culture & Recreation 31,467,862 30,060,439 - - 31,467,862 30,060,439 Air Transportation 13,047,872 12,447,560 - - 13,047,872 12,447,560 Interest & Other long - term debt 8,172,026 8,654,373 - - 8,172,026 8,654,373 Transit System - - 18,725,118 18,223,323 18,725,118 18,223,323 Bridge System - - 55,390,372 52,412,200 55,390,372 52,412,200 Solid Waste - - 22,619,900 20,165,585 22,619,900 20,165,585 Water System - - 48,166,777 46,668,068 48,166,777 46,668,068 Sewer System - - 33,202,551 31,729,952 33,202,551 31,729,952
Municipal Housing - - 1,500,028 1,560,349 1,500,028 1,560,349 Other Business -Types - - - - - -
Total expenses 297,092,033 275,615,583 179,604,746 170,759,477 476,696,779 446,375,060 Inc (dec) in net position before transfers 7,766,236 16,786,146 34,976,582 41,747,669 42,742,818 58,533,815 Transfers 10,273,260 12,081,986 (10,273,260) (12,081,986) - - Change in Net Position 18,039,496 28,868,132 24,703,322 29,665,683 42,742,818 58,533,815 Net position, beginning 322,772,931 353,841,348 357,938,905 328,273,222 680,711,836 682,114,570 Prior Period Adj. - (59,936,549) - - - (59,936,549) Net position, ending 340,812,427$ 322,772,931$ 382,642,227$ 357,938,905$ 723,454,654$ 680,711,836$
Governmental Business-Type Activities Activities Total
Graph 1
$-
$20,000,000
$40,000,000
$60,000,000
$80,000,000
$100,000,000
$120,000,000
$140,000,000
$160,000,000
General Govt. Public Safety Public Works Health andWelfare
Culture &Recreation
AirTransportation
Interest on debt
Revenues
Expenses
Expenses and Program Revenues - Governmental Activities
10
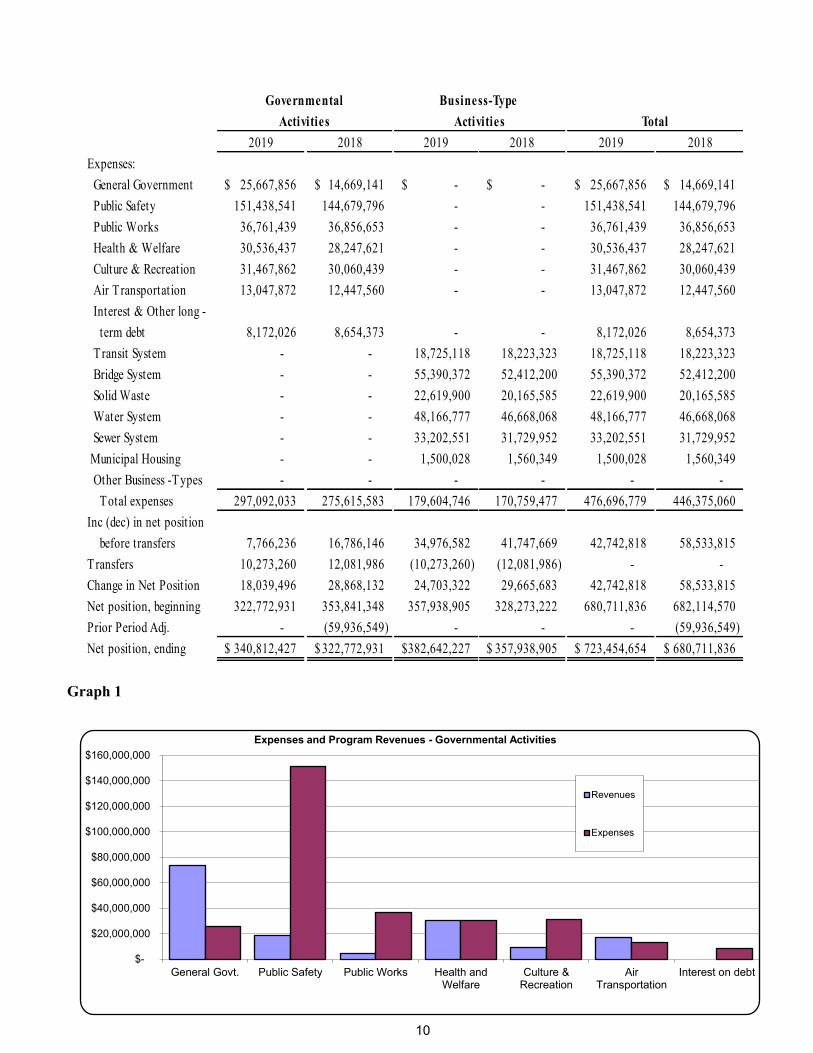
Graph 1 represents the cost of each of the City’s seven largest programs as well as each of the programs revenue. The net cost is the financial burden that was placed on the City’s taxpayers by each of these functions.
The cost of all Governmental activities this year was $297.09 million. The amount that our citizens paid for these activities through City taxes and revenues such as interest
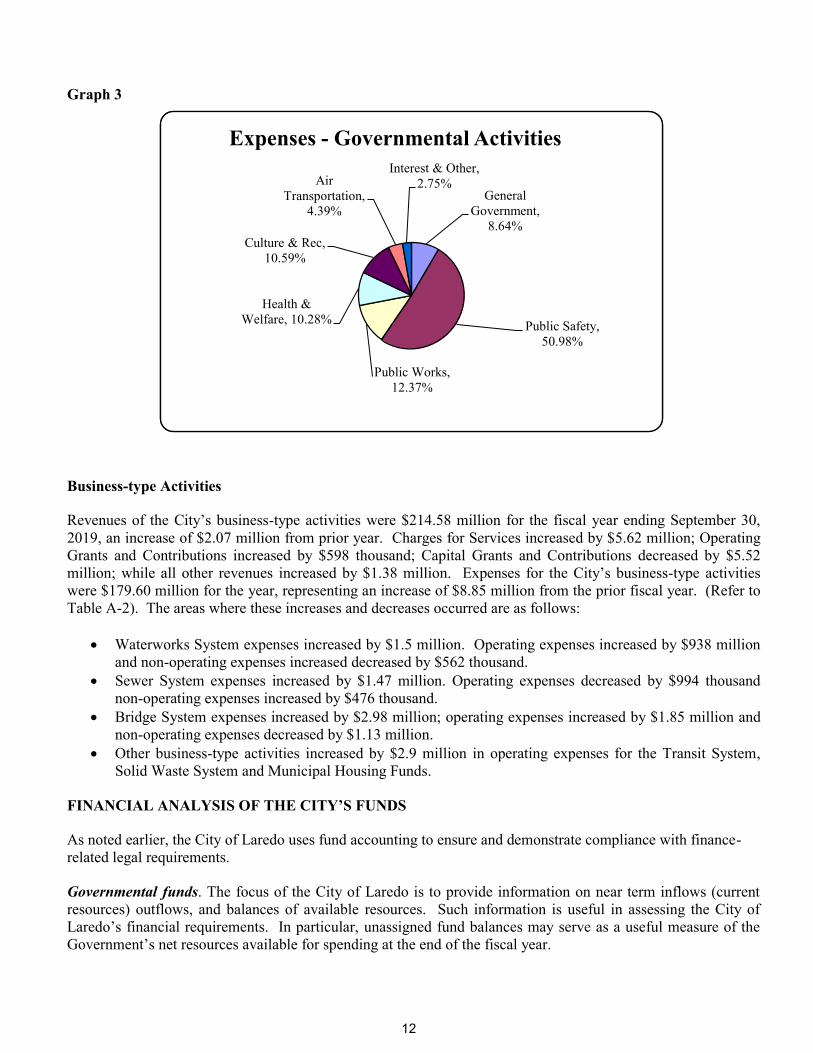
earnings, franchise fees, and unrestricted grants was $304.86 million. General Government expenses (support services) comprised approximately 8.64% of the total expenses
in Fiscal Year 2019; this represents an increase of 74.98% or $11 million from prior year. Expenses for Public Safety represent 50.97% of total expenditures with an increase of 4.67% or $6.76
million as compared to the prior year. Public Works expenses represent 12.37% of total expenditures and a decrease of $95,214 thousand or a
decrease of 0.26% as compared to the prior year. Health and Welfare expenses represent 10.28% of total expenditures with an increase of $2.29 million or
10.28% as compared to the prior year. Cultural & Recreational expenses represent 10.59% of the total expenditures with an increase of $1.41
million or 4.68% as compared to prior year. Air Transportation and Other expenditures represent 7.14% of total expenditures with an increase of
$117,965 thousand or 0.56% from prior year. Business-Type Activities transferred to Governmental Activities a total of $10.27 million; a decrease of
$1.81 million from prior year. Overall, there was an increase in the net position of $42.74 million. There was an increase of $18.04
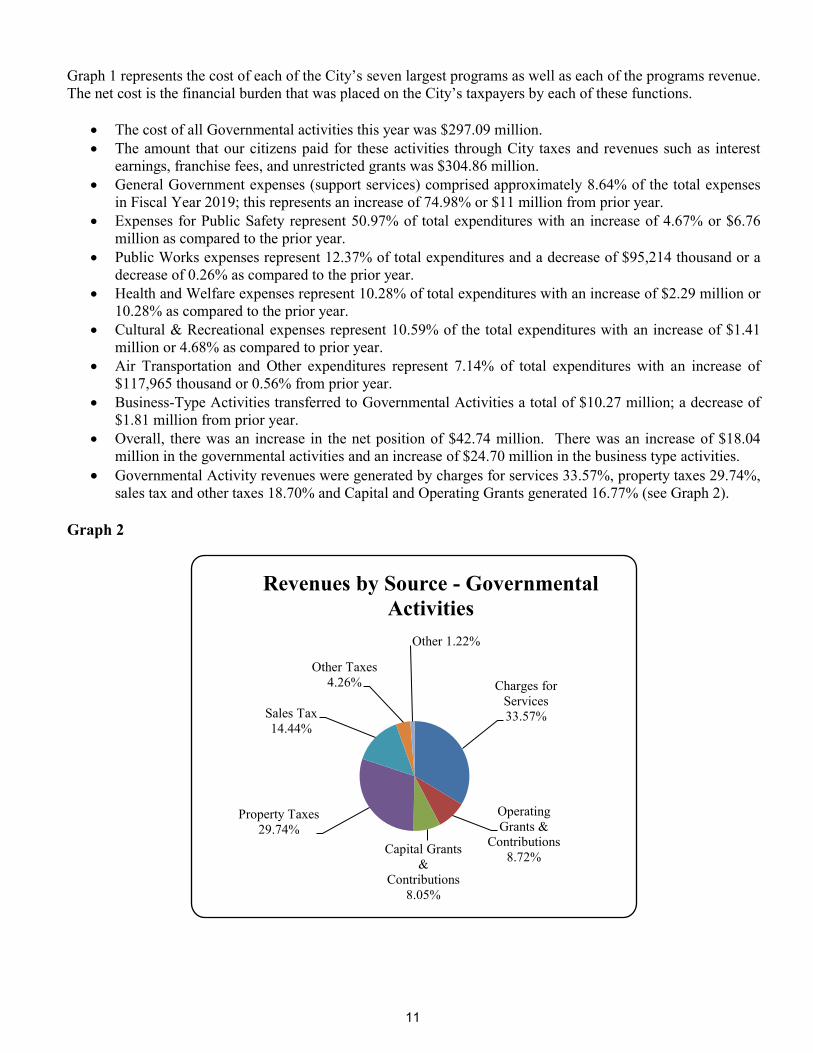
million in the governmental activities and an increase of $24.70 million in the business type activities. Governmental Activity revenues were generated by charges for services 33.57%, property taxes 29.74%,
sales tax and other taxes 18.70% and Capital and Operating Grants generated 16.77% (see Graph 2).
Graph 2
Charges for Services 33.57%
Operating Grants &
Contributions 8.72%Capital Grants
& Contributions
8.05%
Property Taxes 29.74%
Sales Tax 14.44%
Other Taxes 4.26%
Other 1.22%
Revenues by Source - Governmental Activities
11
Graph 3
Business-type Activities
Revenues of the City’s business-type activities were $214.58 million for the fiscal year ending September 30, 2019, an increase of $2.07 million from prior year. Charges for Services increased by $5.62 million; Operating Grants and Contributions increased by $598 thousand; Capital Grants and Contributions decreased by $5.52 million; while all other revenues increased by $1.38 million. Expenses for the City’s business-type activities were $179.60 million for the year, representing an increase of $8.85 million from the prior fiscal year. (Refer to Table A-2). The areas where these increases and decreases occurred are as follows:
Waterworks System expenses increased by $1.5 million. Operating expenses increased by $938 millionand non-operating expenses increased decreased by $562 thousand.
Sewer System expenses increased by $1.47 million. Operating expenses decreased by $994 thousandnon-operating expenses increased by $476 thousand.
Bridge System expenses increased by $2.98 million; operating expenses increased by $1.85 million andnon-operating expenses decreased by $1.13 million.
Other business-type activities increased by $2.9 million in operating expenses for the Transit System,Solid Waste System and Municipal Housing Funds.
FINANCIAL ANALYSIS OF THE CITY’S FUNDS
As noted earlier, the City of Laredo uses fund accounting to ensure and demonstrate compliance with finance-related legal requirements.
Governmental funds. The focus of the City of Laredo is to provide information on near term inflows (current resources) outflows, and balances of available resources. Such information is useful in assessing the City of Laredo’s financial requirements. In particular, unassigned fund balances may serve as a useful measure of the Government’s net resources available for spending at the end of the fiscal year.
Expenses - Governmental Activities
General Government,
8.64%
Public Safety, 50.98%
Public Works, 12.37%
Health & Welfare, 10.28%
Culture & Rec, 10.59%
Air Transportation,
4.39%
Interest & Other, 2.75%
Expenses - Governmental Activities
12
As the City completed the year, its governmental funds reported a combined fund balance of $201.5 million. The fund balance is categorized as follows: $199 thousand for non-spendable funds which are used for inventory items and an endowment fund; $96.72 million which are restricted for debt and grants; $41.98 million are committed for specific purposes as it relates to reserves, public safety, etc.; $54.64 million are assigned for a specific use for Governmental Funds other than General Fund and $7.96 million in unassigned.
The General Fund is the chief operating fund of the City of Laredo. At the end of the current fiscal year, fund balance of the General Fund was $47.97 million of which $33.4 million is committed, and $13.54 million is unassigned, $1.01 million is restricted and $16 thousand is non-spendable. As a measure of the General Fund’s liquidity, it may be useful to compare both unreserved fund balance and total fund balance to total fund expenses. The ratio of total fund balance to operating expenses (total expenses less capital outlay) is 25.76%. The unassigned fund balance in General Fund represents 28.23% of the total fund balance category.
During the current fiscal year, the City’s General Fund balance increased by $1.12 million as compared to prior year. The City was able to match its revenues to its expenditures while using a conservative spending approach. Some of the key factors are as follows:
As compared to prior year, property tax revenues increased by $3.70 million. Assessed valuationsincreased by $826.57 million from prior year. The City’s tax rate decrease to $0.634 from $0.637 per$100-dollar valuation.
Other tax revenues reflect an increase of $1.52 million. Sales tax increased $1.43 million as compared toprior years.
Charges for Services increased by $1.08 million as compared to prior year due to administrative feecharges to various funds but mainly the Bridge System which increased by $1.3 million.
General Fund expenses increased by $3.67 million from prior year. While most of the departmentsremained stable, growth (increases) occurred in categories such as Public Safety by $3.7; GeneralGovernment by $1.6 million; Health and Welfare by $273 thousand; and Cultural and Recreational by$862 thousand. Capital Outlay decreased by $3.06 million. The major increase for public safety was inpersonnel expenses by $3.85 million. This was due to contractual obligations with public safetypersonnel such as Fire and Police.
The Debt Service Fund has a total fund balance of $6.3 million, all of which is reserved for the payment of debt. The fund balance increased by $852 thousand.
Proprietary funds. The City of Laredo’s proprietary funds provide the same type of information found in the Government-wide Financial Statements, but in more detail.
Net position of the Business – Type Activities at the end of the year totaled $382.64 million. The total net position increased by $24.7 million as compared to prior year. The largest area of change was in the Waterworks System, with an increase of $8.59 million, the Bridge System with an increase of $5.47 million, the Sewer System increased by $6.28 million and other enterprise funds increased by $4.36 million.
General Fund Budgetary Highlights
Overall, the City has not only maintained at least a 15% fund balance as required by City Charter, but has also been able to maintain a rate to 25.16% of operating expenditures (excluding capital outlay) in FY 2019. Fund balance for General Fund increased by $1.12 million while expenditures increased by $3.67 million. General Fund experienced an overall increase of 2.07% in revenues. Property Tax revenues increased by $3.7 million or 5.60% and Charges for Services increased by $1.08 million or 2.04%. The City has been able to sustain its strong economic condition.
13
Original Budget vs. Final Amended Budget: Revenues and Other Financing Sources:
The General Fund revenue and other financing sources increase by $314 thousand for additionalrevenues appropriated during the year for reimbursement received.
Expenditures and Other Financing Uses: General Fund expenditures and other financing uses budget was amended by a net increase of $314
thousand. The operating budget for various departments were increased.
Amended Budget as compared to Actual Revenues and other Sources: Revenues and Other Financing Sources:
The actual revenues reflect an overall favorable variance of $6.19 million as compared to the amendedbudget. This variance had various attributes:
o Revenues exceeded projections in the following areas: Property taxes by $590 thousand; Salesand Use Tax $511,861 thousand; Charges for Services by $905 thousand; Fines $182 thousand:Interest, and other revenues by $898 thousand. Revenues that experience a shortfall of estimatedrevenues include; License and Permits $1.79 million and Intergovernmental Revenues of $831thousand.
o Contribution and Donations exceeded projection by $12.6 million. The variance was due torecognizing the value of donations related to infrastructure assets by developers.
o Transfers In or other financing sources of $6.75 million did not materialize during the year.
Expenditures and Other Financing Uses: Expenditures and Other Financing Uses reflect a negative variance of $6.59 million when comparing the
amended budget to the actual expenditures. A large portion of this unfavorable variance was due tocapital outlay of $12.90 million.
o General Government realized savings of $1.31 million from various areas including MunicipalCourt, Building Inspections, City Attorney’s Office, Planning Zoning and Drafting & Surveying.
o Public Safety exceeded the budget by 84,634 thousand. The Fire Department exceeded budgetby $726 thousand while the Police Department had savings of $45,448 thousand. The TrafficDepartment realized savings of 596 thousand.
o Cultural and Recreation realized savings of $424 thousand from various divisions from the Parksand Recreation divisions and the Public Library.
o All other departments of General Fund played a proactive role in limiting and restrictingexpenses and ensuring that the City’s fund balance remained strong and healthy.
CAPITAL ASSET AND DEBT ADMINISTRATION
Capital Assets
The City of Laredo’s investment in capital assets for its Governmental and Business-Type activities as of September 30, 2019 was $1.45 billion (net of accumulated depreciation). The City’s net investment in capital assets increased by $63.69 million for the current fiscal year. Additions, to capital assets such as land, infrastructure, buildings, equipment and construction in progress for the year totaled $36.86 million for governmental activities and $26.83 million for business type activities. Deletions or disposition of capital assets were immaterial for the year. (Table A-3) Additional information about the City’s Capital Assets is presented in Note 8 to the financial statements.
14
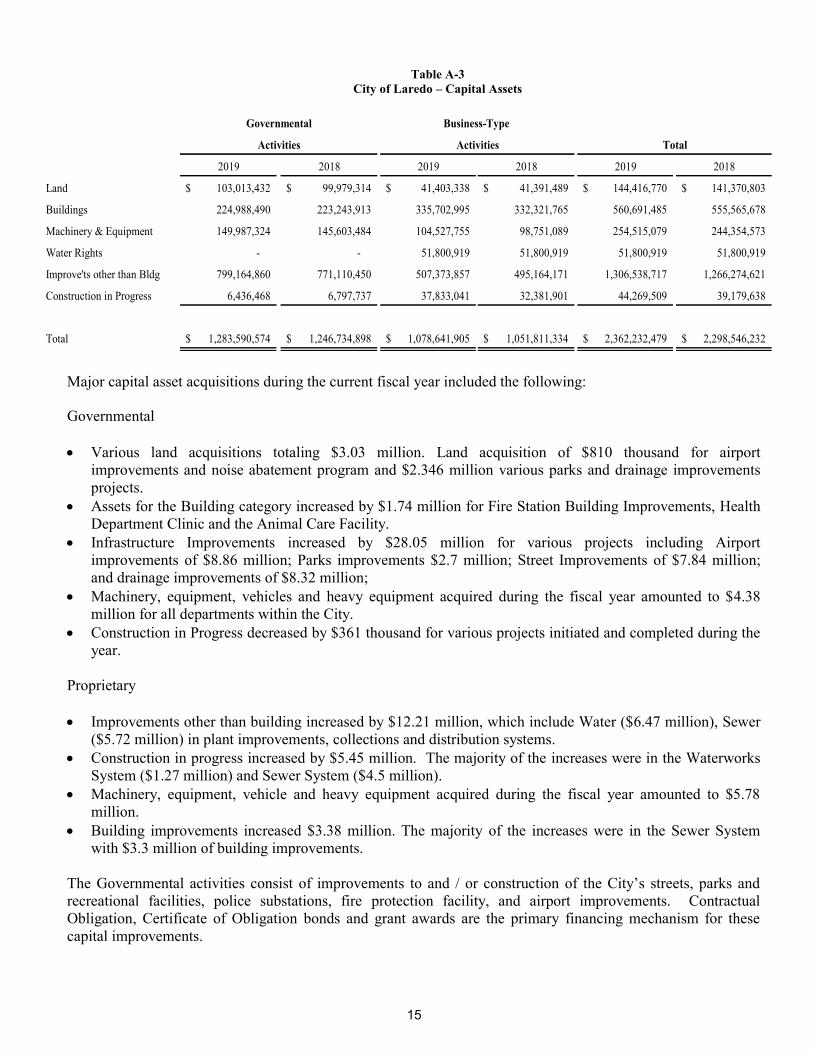
Table A-3 City of Laredo – Capital Assets
2019 2018 2019 2018 2019 2018
Land 103,013,432$ 99,979,314$ 41,403,338$ 41,391,489$ 144,416,770$ 141,370,803$
Buildings 224,988,490 223,243,913 335,702,995 332,321,765 560,691,485 555,565,678
Machinery & Equipment 149,987,324 145,603,484 104,527,755 98,751,089 254,515,079 244,354,573
Water Rights - - 51,800,919 51,800,919 51,800,919 51,800,919
Improve'ts other than Bldg 799,164,860 771,110,450 507,373,857 495,164,171 1,306,538,717 1,266,274,621
Construction in Progress 6,436,468 6,797,737 37,833,041 32,381,901 44,269,509 39,179,638
Total 1,283,590,574$ 1,246,734,898$ 1,078,641,905$ 1,051,811,334$ 2,362,232,479$ 2,298,546,232$
Governmental Business-Type
Activities Activities Total
Major capital asset acquisitions during the current fiscal year included the following:
Governmental
Various land acquisitions totaling $3.03 million. Land acquisition of $810 thousand for airportimprovements and noise abatement program and $2.346 million various parks and drainage improvementsprojects.
Assets for the Building category increased by $1.74 million for Fire Station Building Improvements, HealthDepartment Clinic and the Animal Care Facility.
Infrastructure Improvements increased by $28.05 million for various projects including Airportimprovements of $8.86 million; Parks improvements $2.7 million; Street Improvements of $7.84 million;and drainage improvements of $8.32 million;
Machinery, equipment, vehicles and heavy equipment acquired during the fiscal year amounted to $4.38million for all departments within the City.
Construction in Progress decreased by $361 thousand for various projects initiated and completed during theyear.
Proprietary
Improvements other than building increased by $12.21 million, which include Water ($6.47 million), Sewer($5.72 million) in plant improvements, collections and distribution systems.
Construction in progress increased by $5.45 million. The majority of the increases were in the WaterworksSystem ($1.27 million) and Sewer System ($4.5 million).
Machinery, equipment, vehicle and heavy equipment acquired during the fiscal year amounted to $5.78million.
Building improvements increased $3.38 million. The majority of the increases were in the Sewer Systemwith $3.3 million of building improvements.
The Governmental activities consist of improvements to and / or construction of the City’s streets, parks and recreational facilities, police substations, fire protection facility, and airport improvements. Contractual Obligation, Certificate of Obligation bonds and grant awards are the primary financing mechanism for these capital improvements.
15
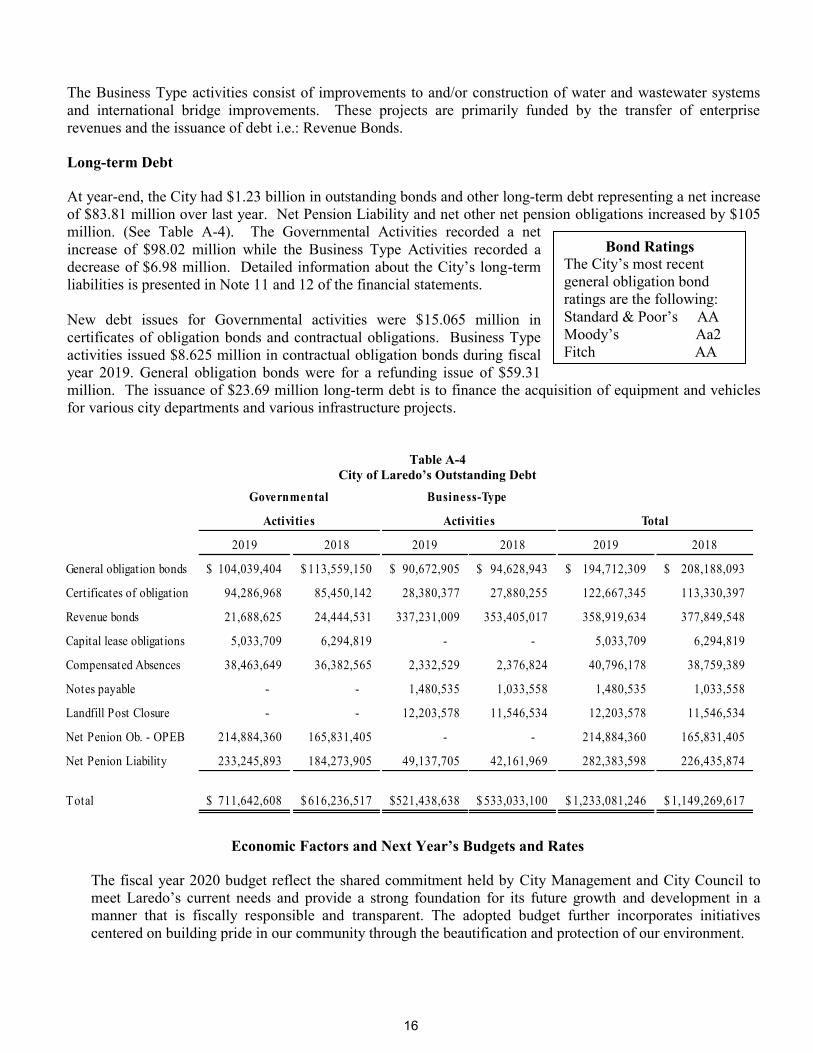
Bond Ratings The City’s most recent general obligation bond ratings are the following: Standard & Poor’s AA Moody’s Aa2 Fitch AA
The Business Type activities consist of improvements to and/or construction of water and wastewater systems and international bridge improvements. These projects are primarily funded by the transfer of enterprise revenues and the issuance of debt i.e.: Revenue Bonds.
Long-term Debt
At year-end, the City had $1.23 billion in outstanding bonds and other long-term debt representing a net increase of $83.81 million over last year. Net Pension Liability and net other net pension obligations increased by $105 million. (See Table A-4). The Governmental Activities recorded a net increase of $98.02 million while the Business Type Activities recorded a decrease of $6.98 million. Detailed information about the City’s long-term liabilities is presented in Note 11 and 12 of the financial statements.
New debt issues for Governmental activities were $15.065 million in certificates of obligation bonds and contractual obligations. Business Type activities issued $8.625 million in contractual obligation bonds during fiscal year 2019. General obligation bonds were for a refunding issue of $59.31 million. The issuance of $23.69 million long-term debt is to finance the acquisition of equipment and vehicles for various city departments and various infrastructure projects.
Table A-4 City of Laredo’s Outstanding Debt
2019 2018 2019 2018 2019 2018
General obligation bonds 104,039,404$ 113,559,150$ 90,672,905$ 94,628,943$ 194,712,309$ 208,188,093$
Certificates of obligation 94,286,968 85,450,142 28,380,377 27,880,255 122,667,345 113,330,397
Revenue bonds 21,688,625 24,444,531 337,231,009 353,405,017 358,919,634 377,849,548
Capital lease obligations 5,033,709 6,294,819 - - 5,033,709 6,294,819
Compensated Absences 38,463,649 36,382,565 2,332,529 2,376,824 40,796,178 38,759,389
Notes payable - - 1,480,535 1,033,558 1,480,535 1,033,558
Landfill Post Closure - - 12,203,578 11,546,534 12,203,578 11,546,534
Net Penion Ob. - OPEB 214,884,360 165,831,405 - - 214,884,360 165,831,405
Net Penion Liability 233,245,893 184,273,905 49,137,705 42,161,969 282,383,598 226,435,874
Total 711,642,608$ 616,236,517$ 521,438,638$ 533,033,100$ 1,233,081,246$ 1,149,269,617$
Governmental Business-Type
Activities Activities Total
Economic Factors and Next Year’s Budgets and Rates
The fiscal year 2020 budget reflect the shared commitment held by City Management and City Council to meet Laredo’s current needs and provide a strong foundation for its future growth and development in a manner that is fiscally responsible and transparent. The adopted budget further incorporates initiatives centered on building pride in our community through the beautification and protection of our environment.
16
General Fund revenues and expenditures for FY 2020 are estimated to be $206.71 million an increase of $6.68 million or 3.34% over the prior year’s original budget for each revenues and expenditures. The City’s unemployment rate decreased from 3.6% to 3.4% as of September 30, 2019. This average, places it below the State of Texas average of 3.5%. Building permit revenues, sales tax revenues, property taxes and bridge toll revenues are areas, which we use to measure the local economy. These areas are showing slight growth of $8.53 million or 4.12% and are good indicators of the local state of the economy.
The FY 2020 consolidated budget for revenue reflects an appropriation of $713.91 million. This represents an increase of $35.68 million or 5.26% over the FY 2019 Original Budget. The property tax rate for FY 2020 is 0.6340 per $100 valuation. Assessed valuations for FY 2020 are $14.69 billion, which represents an increase of 3.84% over prior year with an estimated levy of $93.13 million. Of the 0.6340 tax rate, 77.13% or 0.489 cents are utilized for General Fund activities, the remaining 22.87% or 0.145 cents are designated for Debt Service. The General Fund’s portion of property tax revenue for FY 2020 is projected to be $68.647 million. Sales tax revenues for the General Fund for FY 2019 are budgeted to be $35.02 million, an increase of $892.8 thousand or 2.620% as compared to prior year’s budgeted amounts.
City Council approved a cost of living increases of 2.5% for all civilian personnel beginning October 1, 2019 at an estimated cost of $4.74 million The merit increase program was suspended for fiscal year 2020. The budget includes a 2.5% salary increase for the police officers at an estimated cost of $2.43 million. The FY 2020 budget includes 3,045 full time equivalent positions with an estimated cost of $232.97 million.
Additionally, in order to increase moral, achieve competitive pay and to invest in City employees, City Council approved an increase to the minimum wage from $100.00 to $12.00 an hour for all current and new employees. The financial impact on the budget is estimated to be $1,473,473.
Requests for Information
This financial report is design to provide our citizens, taxpayers, customers, investors, and creditors with a general overview of the City’s finances and to demonstrate the City’s accountability for the money it receives. Questions concerning any of the information provided in this report or request for additional financial information should be addressed to the Office of the Finance Director, 1110 Houston Street, Laredo, Texas, 78040.
17

This page intentionally left blank
18

BASIC FINANCIAL STATEMENTS
CITY OF LAREDO, TEXAS
STATEMENT OF NET POSITION
September 30, 2019
Governmental Business-type
Activities Activities Total
ASSETS
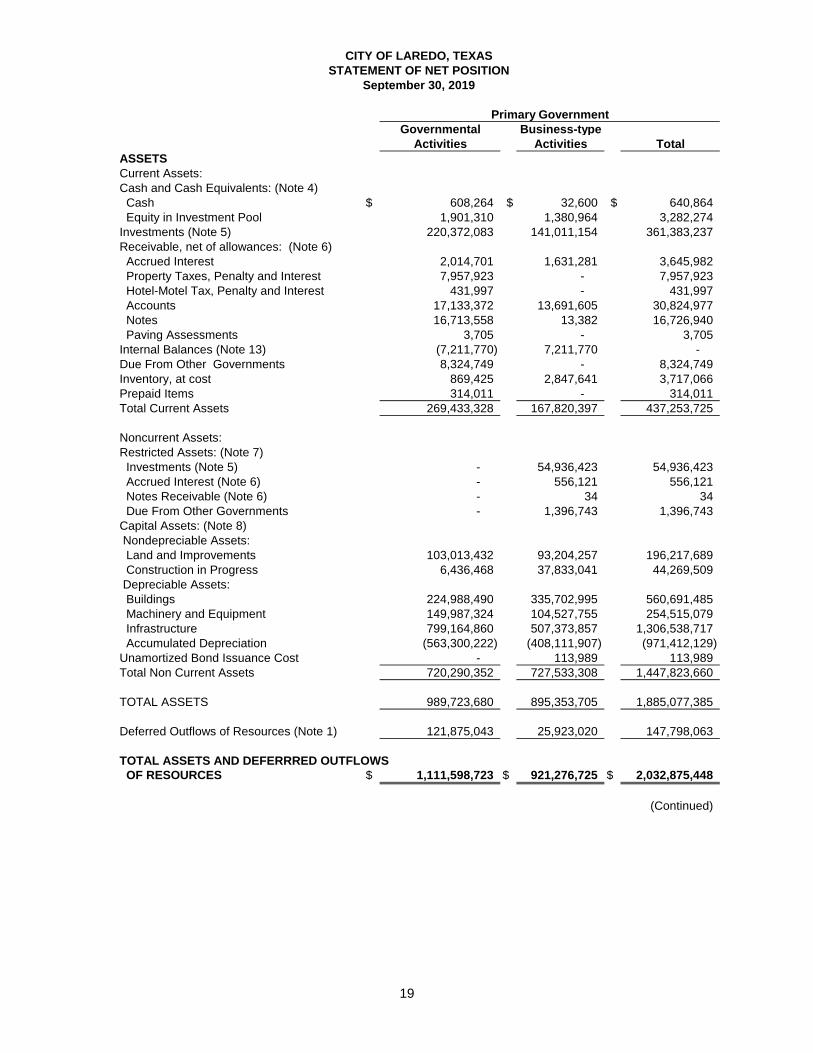
Current Assets:Cash and Cash Equivalents: (Note 4) Cash $ 608,264 $ 32,600 $ 640,864 Equity in Investment Pool 1,901,310 1,380,964 3,282,274 Investments (Note 5) 220,372,083 141,011,154 361,383,237 Receivable, net of allowances: (Note 6) Accrued Interest 2,014,701 1,631,281 3,645,982 Property Taxes, Penalty and Interest 7,957,923 - 7,957,923 Hotel-Motel Tax, Penalty and Interest 431,997 - 431,997 Accounts 17,133,372 13,691,605 30,824,977 Notes 16,713,558 13,382 16,726,940 Paving Assessments 3,705 - 3,705 Internal Balances (Note 13) (7,211,770) 7,211,770 - Due From Other Governments 8,324,749 - 8,324,749 Inventory, at cost 869,425 2,847,641 3,717,066 Prepaid Items 314,011 - 314,011 Total Current Assets 269,433,328 167,820,397 437,253,725
Noncurrent Assets:Restricted Assets: (Note 7) Investments (Note 5) - 54,936,423 54,936,423 Accrued Interest (Note 6) - 556,121 556,121 Notes Receivable (Note 6) - 34 34 Due From Other Governments - 1,396,743 1,396,743 Capital Assets: (Note 8) Nondepreciable Assets: Land and Improvements 103,013,432 93,204,257 196,217,689 Construction in Progress 6,436,468 37,833,041 44,269,509 Depreciable Assets: Buildings 224,988,490 335,702,995 560,691,485 Machinery and Equipment 149,987,324 104,527,755 254,515,079 Infrastructure 799,164,860 507,373,857 1,306,538,717 Accumulated Depreciation (563,300,222) (408,111,907) (971,412,129) Unamortized Bond Issuance Cost - 113,989 113,989 Total Non Current Assets 720,290,352 727,533,308 1,447,823,660
TOTAL ASSETS 989,723,680 895,353,705 1,885,077,385
Deferred Outflows of Resources (Note 1) 121,875,043 25,923,020 147,798,063
TOTAL ASSETS AND DEFERRRED OUTFLOWS
OF RESOURCES $ 1,111,598,723 $ 921,276,725 $ 2,032,875,448
(Continued)
Primary Government
19
CITY OF LAREDO, TEXAS
STATEMENT OF NET POSITION
September 30, 2019
(Continued)
Governmental Business-type
Activities Activities Total
LIABILITIES
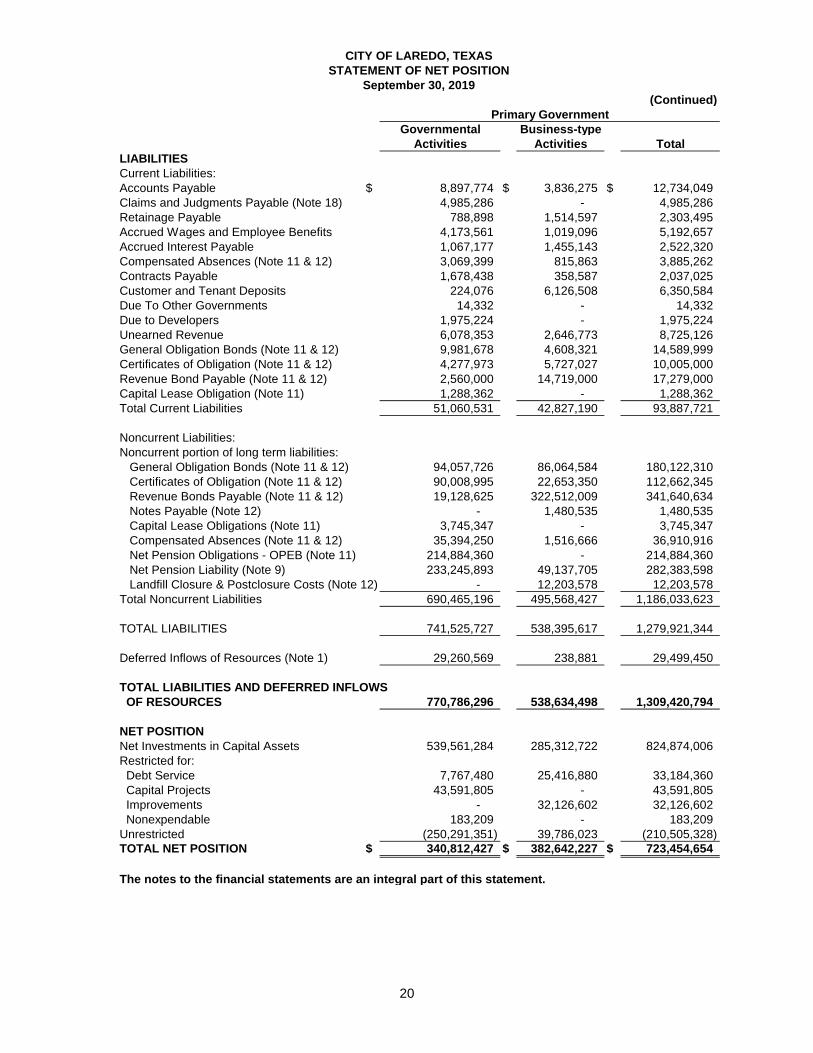
Current Liabilities:Accounts Payable $ 8,897,774 $ 3,836,275 $ 12,734,049 Claims and Judgments Payable (Note 18) 4,985,286 - 4,985,286 Retainage Payable 788,898 1,514,597 2,303,495 Accrued Wages and Employee Benefits 4,173,561 1,019,096 5,192,657 Accrued Interest Payable 1,067,177 1,455,143 2,522,320 Compensated Absences (Note 11 & 12) 3,069,399 815,863 3,885,262 Contracts Payable 1,678,438 358,587 2,037,025 Customer and Tenant Deposits 224,076 6,126,508 6,350,584 Due To Other Governments 14,332 - 14,332 Due to Developers 1,975,224 - 1,975,224 Unearned Revenue 6,078,353 2,646,773 8,725,126 General Obligation Bonds (Note 11 & 12) 9,981,678 4,608,321 14,589,999 Certificates of Obligation (Note 11 & 12) 4,277,973 5,727,027 10,005,000 Revenue Bond Payable (Note 11 & 12) 2,560,000 14,719,000 17,279,000 Capital Lease Obligation (Note 11) 1,288,362 - 1,288,362 Total Current Liabilities 51,060,531 42,827,190 93,887,721
Noncurrent Liabilities:Noncurrent portion of long term liabilities: General Obligation Bonds (Note 11 & 12) 94,057,726 86,064,584 180,122,310 Certificates of Obligation (Note 11 & 12) 90,008,995 22,653,350 112,662,345 Revenue Bonds Payable (Note 11 & 12) 19,128,625 322,512,009 341,640,634 Notes Payable (Note 12) - 1,480,535 1,480,535 Capital Lease Obligations (Note 11) 3,745,347 - 3,745,347 Compensated Absences (Note 11 & 12) 35,394,250 1,516,666 36,910,916 Net Pension Obligations - OPEB (Note 11) 214,884,360 - 214,884,360 Net Pension Liability (Note 9) 233,245,893 49,137,705 282,383,598 Landfill Closure & Postclosure Costs (Note 12) - 12,203,578 12,203,578 Total Noncurrent Liabilities 690,465,196 495,568,427 1,186,033,623
TOTAL LIABILITIES 741,525,727 538,395,617 1,279,921,344
Deferred Inflows of Resources (Note 1) 29,260,569 238,881 29,499,450
TOTAL LIABILITIES AND DEFERRED INFLOWS
OF RESOURCES 770,786,296 538,634,498 1,309,420,794
NET POSITION
Net Investments in Capital Assets 539,561,284 285,312,722 824,874,006 Restricted for: Debt Service 7,767,480 25,416,880 33,184,360 Capital Projects 43,591,805 - 43,591,805 Improvements - 32,126,602 32,126,602 Nonexpendable 183,209 - 183,209 Unrestricted (250,291,351) 39,786,023 (210,505,328) TOTAL NET POSITION $ 340,812,427 $ 382,642,227 $ 723,454,654
The notes to the financial statements are an integral part of this statement.
Primary Government
20
Net (Expense) Revenue and Changes in Net Assets
Program Revenues Primary Government
Operating Capital
Charges for Grants and Grants and Governmental Business-Type
Expenses Services Contributions Contributions Activities Activities Total
Functions/Programs
Primary Government:
Governmental Activities:
General Government $ 25,667,856 59,445,108 960,583 12,832,039 47,569,874 - 47,569,874 Public Safety 151,438,541 9,328,993 9,505,520 - (132,604,028) - (132,604,028) Public Works 36,761,439 2,609,379 5,303 1,827,334 (32,319,423) - (32,319,423) Health and Welfare 30,536,437 14,987,044 14,918,997 456,993 (173,403) - (173,403) Culture and Recreation 31,467,862 7,999,264 191,725 1,084,655 (22,192,218) - (22,192,218) Air Transportation 13,047,872 7,977,495 998,538 8,327,272 4,255,433 - 4,255,433 Interest and Other on Long-Term Debt 8,172,026 - - - (8,172,026) - (8,172,026)
Total Governmental Activities 297,092,033 102,347,283 26,580,666 24,528,293 (143,635,791) - (143,635,791)
Business-Type Activities:
Transit System 18,725,118 4,506,637 4,662,582 375,114 - (9,180,785) (9,180,785) Bridge System 55,390,372 71,088,270 - - - 15,697,898 15,697,898 Waterworks System 48,166,777 51,743,367 - 3,279,282 - 6,855,872 6,855,872 Sewer System 33,202,551 34,431,352 - 3,331,857 - 4,560,658 4,560,658 Solid Waste Management System 22,619,900 25,861,286 - - - 3,241,386 3,241,386 Municipal Housing 1,500,028 1,606,748 - - - 106,720 106,720
Total Business-Type Activities 179,604,746 189,237,660 4,662,582 6,986,253 - 21,281,749 21,281,749
Total Primary Government $ 476,696,779 291,584,943 31,243,248 31,514,546 (143,635,791) 21,281,749 (122,354,042)
General Revenues: Property Taxes 90,664,882 - 90,664,882 Sales Tax 44,029,435 8,325,191 52,354,626 Franchise Fees 8,181,895 - 8,181,895 Hotel Motel Tax 4,207,723 - 4,207,723 Alcoholic Beverage Tax 600,029 - 600,029 Unrestricted investment earnings 3,539,327 5,248,416 8,787,743 Gain on sale of capital assets 178,736 121,226 299,962 Transfers (Note 14) 10,273,260 (10,273,260) -
Total general revenues and transfers 161,675,287 3,421,573 165,096,860
Change in net position 18,039,496 24,703,322 42,742,818 Net position-beginning 322,772,931 357,938,905 680,711,836
Net position-ending $ 340,812,427 382,642,227 723,454,654
The notes to the financial statements are an integral part of this statement.
For the Year Ended September 30, 2019
STATEMENT OF ACTIVITIES
CITY OF LAREDO, TEXAS
21
21
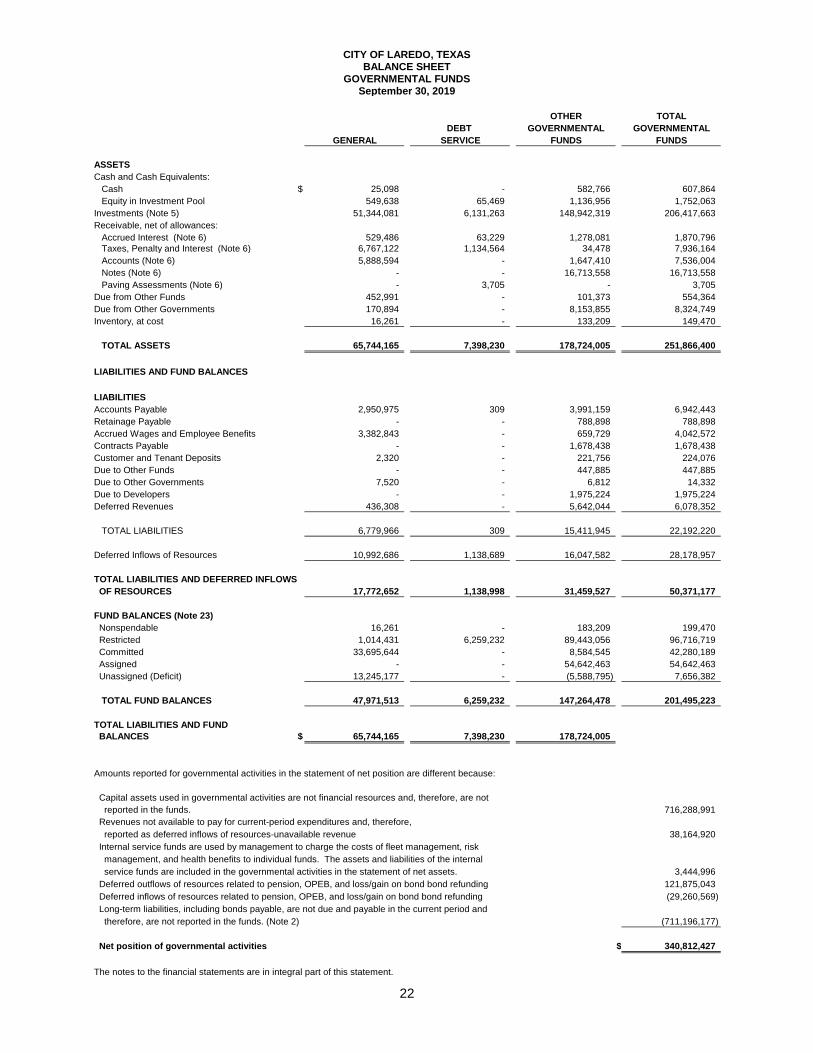
CITY OF LAREDO, TEXASBALANCE SHEET
GOVERNMENTAL FUNDSSeptember 30, 2019
OTHER TOTAL
DEBT GOVERNMENTAL GOVERNMENTAL
GENERAL SERVICE FUNDS FUNDS
ASSETS
Cash and Cash Equivalents: Cash $ 25,098 - 582,766 607,864 Equity in Investment Pool 549,638 65,469 1,136,956 1,752,063 Investments (Note 5) 51,344,081 6,131,263 148,942,319 206,417,663 Receivable, net of allowances: Accrued Interest (Note 6) 529,486 63,229 1,278,081 1,870,796 Taxes, Penalty and Interest (Note 6) 6,767,122 1,134,564 34,478 7,936,164 Accounts (Note 6) 5,888,594 - 1,647,410 7,536,004 Notes (Note 6) - - 16,713,558 16,713,558 Paving Assessments (Note 6) - 3,705 - 3,705 Due from Other Funds 452,991 - 101,373 554,364 Due from Other Governments 170,894 - 8,153,855 8,324,749 Inventory, at cost 16,261 - 133,209 149,470
TOTAL ASSETS 65,744,165 7,398,230 178,724,005 251,866,400
LIABILITIES AND FUND BALANCES
LIABILITIES
Accounts Payable 2,950,975 309 3,991,159 6,942,443 Retainage Payable - - 788,898 788,898 Accrued Wages and Employee Benefits 3,382,843 - 659,729 4,042,572 Contracts Payable - - 1,678,438 1,678,438 Customer and Tenant Deposits 2,320 - 221,756 224,076 Due to Other Funds - - 447,885 447,885 Due to Other Governments 7,520 - 6,812 14,332 Due to Developers - - 1,975,224 1,975,224 Deferred Revenues 436,308 - 5,642,044 6,078,352
TOTAL LIABILITIES 6,779,966 309 15,411,945 22,192,220
Deferred Inflows of Resources 10,992,686 1,138,689 16,047,582 28,178,957
TOTAL LIABILITIES AND DEFERRED INFLOWS
OF RESOURCES 17,772,652 1,138,998 31,459,527 50,371,177
FUND BALANCES (Note 23)
Nonspendable 16,261 - 183,209 199,470 Restricted 1,014,431 6,259,232 89,443,056 96,716,719 Committed 33,695,644 - 8,584,545 42,280,189 Assigned - - 54,642,463 54,642,463 Unassigned (Deficit) 13,245,177 - (5,588,795) 7,656,382
TOTAL FUND BALANCES 47,971,513 6,259,232 147,264,478 201,495,223
TOTAL LIABILITIES AND FUND
BALANCES $ 65,744,165 7,398,230 178,724,005
Amounts reported for governmental activities in the statement of net position are different because:
Capital assets used in governmental activities are not financial resources and, therefore, are not reported in the funds. 716,288,991 Revenues not available to pay for current-period expenditures and, therefore, reported as deferred inflows of resources-unavailable revenue 38,164,920 Internal service funds are used by management to charge the costs of fleet management, risk
management, and health benefits to individual funds. The assets and liabilities of the internal service funds are included in the governmental activities in the statement of net assets. 3,444,996 Deferred outflows of resources related to pension, OPEB, and loss/gain on bond bond refunding 121,875,043 Deferred inflows of resources related to pension, OPEB, and loss/gain on bond bond refunding (29,260,569) Long-term liabilities, including bonds payable, are not due and payable in the current period and
therefore, are not reported in the funds. (Note 2) (711,196,177)
Net position of governmental activities $ 340,812,427
The notes to the financial statements are in integral part of this statement.
22
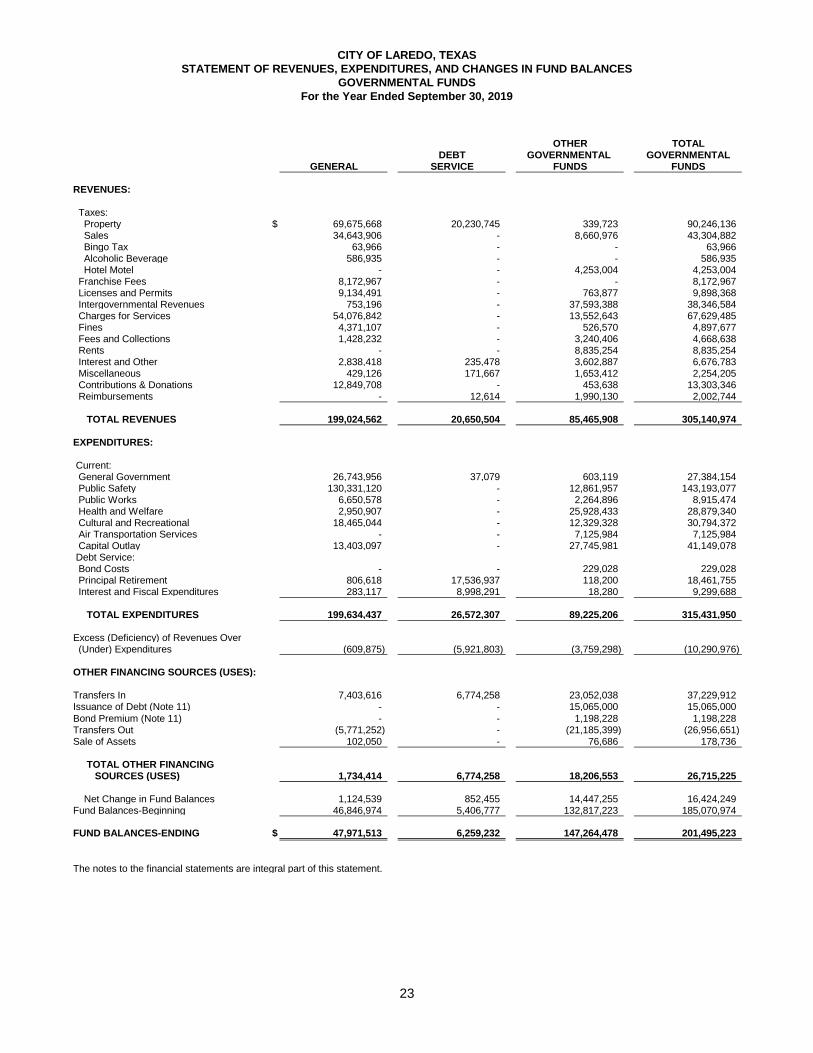
CITY OF LAREDO, TEXAS
STATEMENT OF REVENUES, EXPENDITURES, AND CHANGES IN FUND BALANCES
GOVERNMENTAL FUNDS
For the Year Ended September 30, 2019
OTHER TOTALDEBT GOVERNMENTAL GOVERNMENTAL
GENERAL SERVICE FUNDS FUNDS
REVENUES:
Taxes: Property $ 69,675,668 20,230,745 339,723 90,246,136 Sales 34,643,906 - 8,660,976 43,304,882 Bingo Tax 63,966 - - 63,966 Alcoholic Beverage 586,935 - - 586,935 Hotel Motel - - 4,253,004 4,253,004
Franchise Fees 8,172,967 - - 8,172,967 Licenses and Permits 9,134,491 - 763,877 9,898,368 Intergovernmental Revenues 753,196 - 37,593,388 38,346,584 Charges for Services 54,076,842 - 13,552,643 67,629,485 Fines 4,371,107 - 526,570 4,897,677 Fees and Collections 1,428,232 - 3,240,406 4,668,638 Rents - - 8,835,254 8,835,254 Interest and Other 2,838,418 235,478 3,602,887 6,676,783 Miscellaneous 429,126 171,667 1,653,412 2,254,205 Contributions & Donations 12,849,708 - 453,638 13,303,346 Reimbursements - 12,614 1,990,130 2,002,744
TOTAL REVENUES 199,024,562 20,650,504 85,465,908 305,140,974
EXPENDITURES:
Current: General Government 26,743,956 37,079 603,119 27,384,154 Public Safety 130,331,120 - 12,861,957 143,193,077 Public Works 6,650,578 - 2,264,896 8,915,474 Health and Welfare 2,950,907 - 25,928,433 28,879,340 Cultural and Recreational 18,465,044 - 12,329,328 30,794,372 Air Transportation Services - - 7,125,984 7,125,984 Capital Outlay 13,403,097 - 27,745,981 41,149,078 Debt Service: Bond Costs - - 229,028 229,028 Principal Retirement 806,618 17,536,937 118,200 18,461,755 Interest and Fiscal Expenditures 283,117 8,998,291 18,280 9,299,688
TOTAL EXPENDITURES 199,634,437 26,572,307 89,225,206 315,431,950
Excess (Deficiency) of Revenues Over (Under) Expenditures (609,875) (5,921,803) (3,759,298) (10,290,976)
OTHER FINANCING SOURCES (USES):
Transfers In 7,403,616 6,774,258 23,052,038 37,229,912 Issuance of Debt (Note 11) - - 15,065,000 15,065,000 Bond Premium (Note 11) - - 1,198,228 1,198,228 Transfers Out (5,771,252) - (21,185,399) (26,956,651) Sale of Assets 102,050 - 76,686 178,736
TOTAL OTHER FINANCING SOURCES (USES) 1,734,414 6,774,258 18,206,553 26,715,225
Net Change in Fund Balances 1,124,539 852,455 14,447,255 16,424,249 Fund Balances-Beginning 46,846,974 5,406,777 132,817,223 185,070,974
FUND BALANCES-ENDING $ 47,971,513 6,259,232 147,264,478 201,495,223
The notes to the financial statements are integral part of this statement.
23
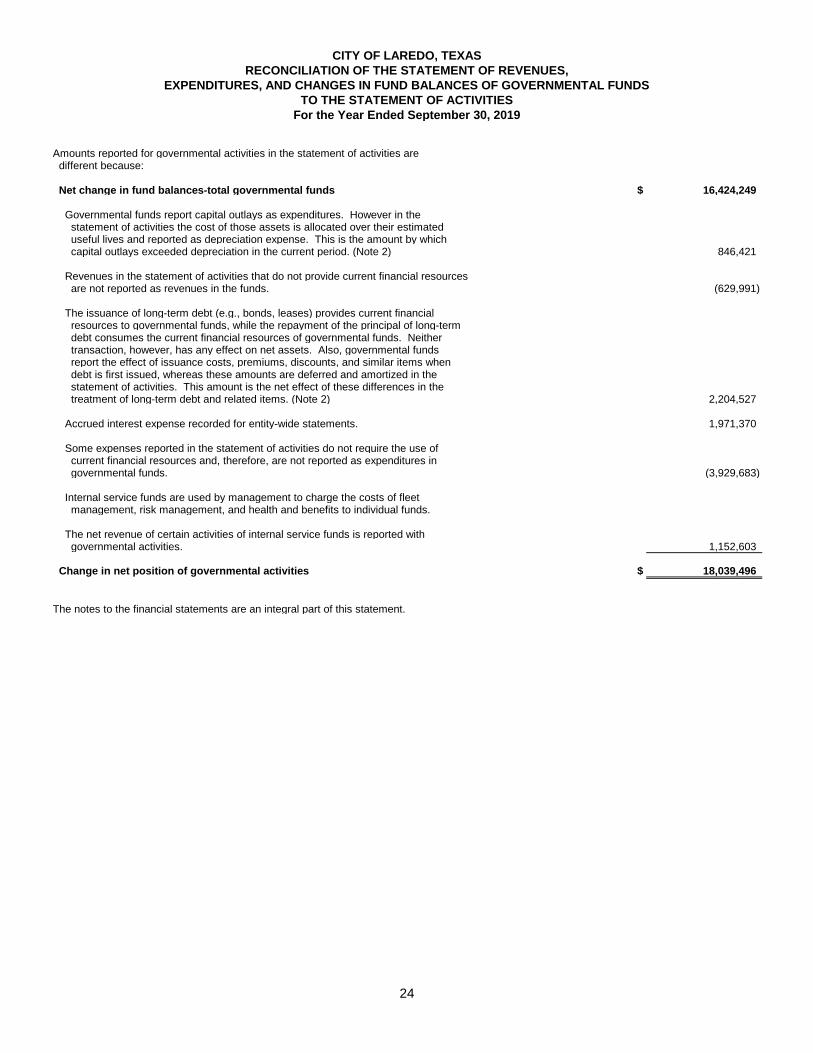
CITY OF LAREDO, TEXAS
RECONCILIATION OF THE STATEMENT OF REVENUES,
EXPENDITURES, AND CHANGES IN FUND BALANCES OF GOVERNMENTAL FUNDS
TO THE STATEMENT OF ACTIVITIES
For the Year Ended September 30, 2019
Amounts reported for governmental activities in the statement of activities are different because:
Net change in fund balances-total governmental funds $ 16,424,249
Governmental funds report capital outlays as expenditures. However in the statement of activities the cost of those assets is allocated over their estimated useful lives and reported as depreciation expense. This is the amount by which capital outlays exceeded depreciation in the current period. (Note 2) 846,421
Revenues in the statement of activities that do not provide current financial resources are not reported as revenues in the funds. (629,991)
The issuance of long-term debt (e.g., bonds, leases) provides current financial resources to governmental funds, while the repayment of the principal of long-term debt consumes the current financial resources of governmental funds. Neither
transaction, however, has any effect on net assets. Also, governmental funds report the effect of issuance costs, premiums, discounts, and similar items when debt is first issued, whereas these amounts are deferred and amortized in the statement of activities. This amount is the net effect of these differences in the
treatment of long-term debt and related items. (Note 2) 2,204,527
Accrued interest expense recorded for entity-wide statements. 1,971,370
Some expenses reported in the statement of activities do not require the use of current financial resources and, therefore, are not reported as expenditures in governmental funds. (3,929,683)
Internal service funds are used by management to charge the costs of fleet management, risk management, and health and benefits to individual funds.
The net revenue of certain activities of internal service funds is reported with governmental activities. 1,152,603
Change in net position of governmental activities $ 18,039,496
The notes to the financial statements are an integral part of this statement.
24

This page intentionally left blank
25
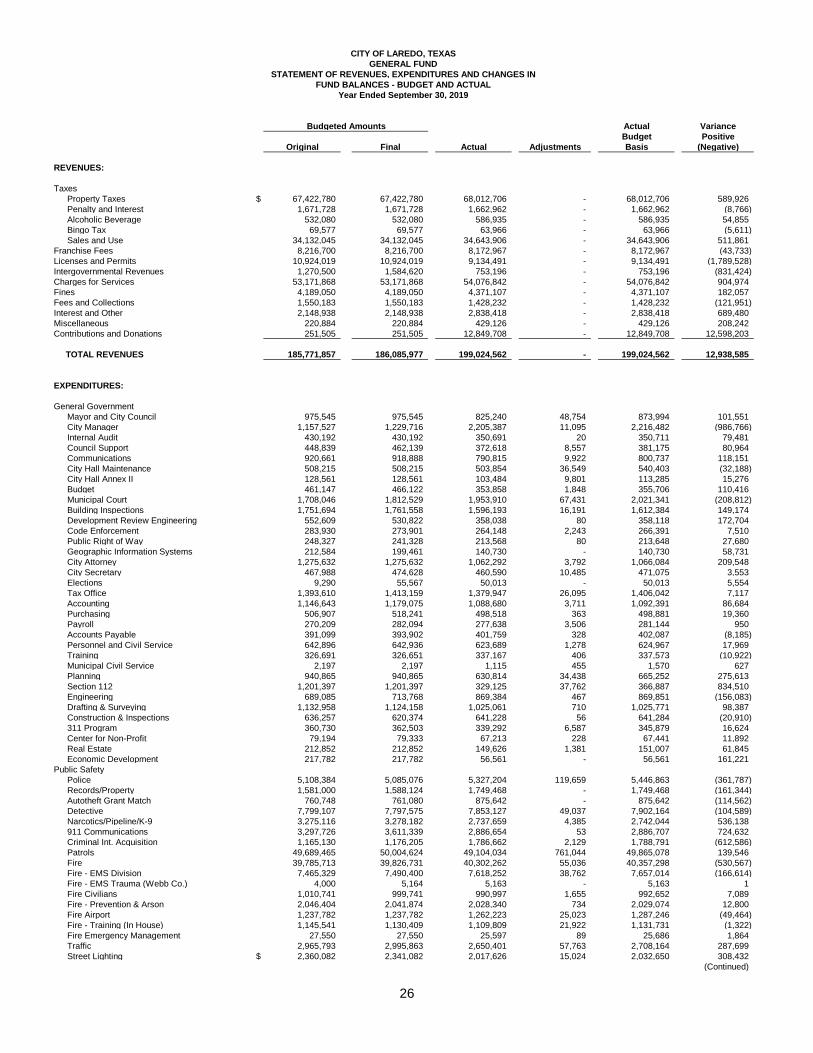
CITY OF LAREDO, TEXAS
GENERAL FUND
STATEMENT OF REVENUES, EXPENDITURES AND CHANGES IN
FUND BALANCES - BUDGET AND ACTUAL
Year Ended September 30, 2019
Budgeted Amounts Actual Variance
Budget Positive
Original Final Actual Adjustments Basis (Negative)
REVENUES:
TaxesProperty Taxes $ 67,422,780 67,422,780 68,012,706 - 68,012,706 589,926 Penalty and Interest 1,671,728 1,671,728 1,662,962 - 1,662,962 (8,766) Alcoholic Beverage 532,080 532,080 586,935 - 586,935 54,855 Bingo Tax 69,577 69,577 63,966 - 63,966 (5,611) Sales and Use 34,132,045 34,132,045 34,643,906 - 34,643,906 511,861
Franchise Fees 8,216,700 8,216,700 8,172,967 - 8,172,967 (43,733) Licenses and Permits 10,924,019 10,924,019 9,134,491 - 9,134,491 (1,789,528) Intergovernmental Revenues 1,270,500 1,584,620 753,196 - 753,196 (831,424) Charges for Services 53,171,868 53,171,868 54,076,842 - 54,076,842 904,974 Fines 4,189,050 4,189,050 4,371,107 - 4,371,107 182,057 Fees and Collections 1,550,183 1,550,183 1,428,232 - 1,428,232 (121,951) Interest and Other 2,148,938 2,148,938 2,838,418 - 2,838,418 689,480 Miscellaneous 220,884 220,884 429,126 - 429,126 208,242 Contributions and Donations 251,505 251,505 12,849,708 - 12,849,708 12,598,203
TOTAL REVENUES 185,771,857 186,085,977 199,024,562 - 199,024,562 12,938,585
EXPENDITURES:
General GovernmentMayor and City Council 975,545 975,545 825,240 48,754 873,994 101,551 City Manager 1,157,527 1,229,716 2,205,387 11,095 2,216,482 (986,766) Internal Audit 430,192 430,192 350,691 20 350,711 79,481 Council Support 448,839 462,139 372,618 8,557 381,175 80,964 Communications 920,661 918,888 790,815 9,922 800,737 118,151 City Hall Maintenance 508,215 508,215 503,854 36,549 540,403 (32,188) City Hall Annex II 128,561 128,561 103,484 9,801 113,285 15,276 Budget 461,147 466,122 353,858 1,848 355,706 110,416 Municipal Court 1,708,046 1,812,529 1,953,910 67,431 2,021,341 (208,812) Building Inspections 1,751,694 1,761,558 1,596,193 16,191 1,612,384 149,174 Development Review Engineering 552,609 530,822 358,038 80 358,118 172,704 Code Enforcement 283,930 273,901 264,148 2,243 266,391 7,510 Public Right of Way 248,327 241,328 213,568 80 213,648 27,680 Geographic Information Systems 212,584 199,461 140,730 - 140,730 58,731 City Attorney 1,275,632 1,275,632 1,062,292 3,792 1,066,084 209,548 City Secretary 467,988 474,628 460,590 10,485 471,075 3,553 Elections 9,290 55,567 50,013 - 50,013 5,554 Tax Office 1,393,610 1,413,159 1,379,947 26,095 1,406,042 7,117 Accounting 1,146,643 1,179,075 1,088,680 3,711 1,092,391 86,684 Purchasing 506,907 518,241 498,518 363 498,881 19,360 Payroll 270,209 282,094 277,638 3,506 281,144 950 Accounts Payable 391,099 393,902 401,759 328 402,087 (8,185) Personnel and Civil Service 642,896 642,936 623,689 1,278 624,967 17,969 Training 326,691 326,651 337,167 406 337,573 (10,922) Municipal Civil Service 2,197 2,197 1,115 455 1,570 627 Planning 940,865 940,865 630,814 34,438 665,252 275,613 Section 112 1,201,397 1,201,397 329,125 37,762 366,887 834,510 Engineering 689,085 713,768 869,384 467 869,851 (156,083) Drafting & Surveying 1,132,958 1,124,158 1,025,061 710 1,025,771 98,387 Construction & Inspections 636,257 620,374 641,228 56 641,284 (20,910) 311 Program 360,730 362,503 339,292 6,587 345,879 16,624 Center for Non-Profit 79,194 79,333 67,213 228 67,441 11,892 Real Estate 212,852 212,852 149,626 1,381 151,007 61,845 Economic Development 217,782 217,782 56,561 - 56,561 161,221
Public SafetyPolice 5,108,384 5,085,076 5,327,204 119,659 5,446,863 (361,787) Records/Property 1,581,000 1,588,124 1,749,468 - 1,749,468 (161,344) Autotheft Grant Match 760,748 761,080 875,642 - 875,642 (114,562) Detective 7,799,107 7,797,575 7,853,127 49,037 7,902,164 (104,589) Narcotics/Pipeline/K-9 3,275,116 3,278,182 2,737,659 4,385 2,742,044 536,138 911 Communications 3,297,726 3,611,339 2,886,654 53 2,886,707 724,632 Criminal Int. Acquisition 1,165,130 1,176,205 1,786,662 2,129 1,788,791 (612,586) Patrols 49,689,465 50,004,624 49,104,034 761,044 49,865,078 139,546 Fire 39,785,713 39,826,731 40,302,262 55,036 40,357,298 (530,567) Fire - EMS Division 7,465,329 7,490,400 7,618,252 38,762 7,657,014 (166,614) Fire - EMS Trauma (Webb Co.) 4,000 5,164 5,163 - 5,163 1 Fire Civilians 1,010,741 999,741 990,997 1,655 992,652 7,089 Fire - Prevention & Arson 2,046,404 2,041,874 2,028,340 734 2,029,074 12,800 Fire Airport 1,237,782 1,237,782 1,262,223 25,023 1,287,246 (49,464) Fire - Training (In House) 1,145,541 1,130,409 1,109,809 21,922 1,131,731 (1,322) Fire Emergency Management 27,550 27,550 25,597 89 25,686 1,864 Traffic 2,965,793 2,995,863 2,650,401 57,763 2,708,164 287,699 Street Lighting $ 2,360,082 2,341,082 2,017,626 15,024 2,032,650 308,432
(Continued)
26
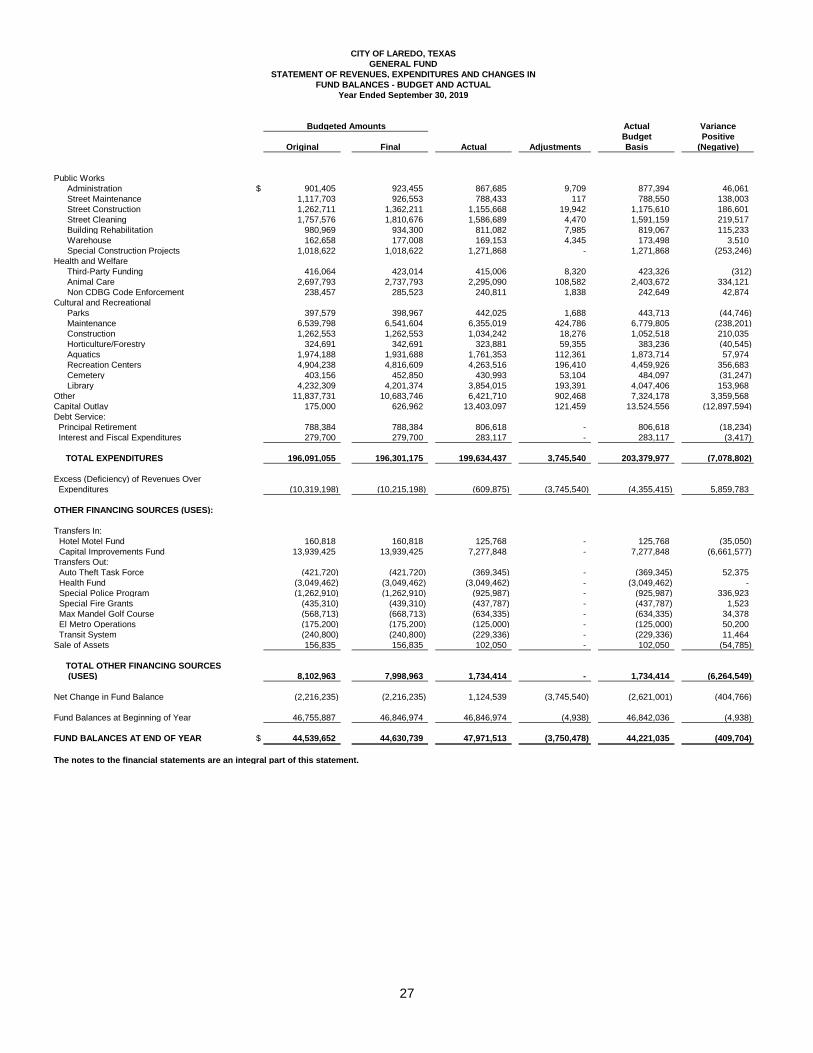
CITY OF LAREDO, TEXAS
GENERAL FUND
STATEMENT OF REVENUES, EXPENDITURES AND CHANGES IN
FUND BALANCES - BUDGET AND ACTUAL
Year Ended September 30, 2019
Budgeted Amounts Actual Variance
Budget Positive
Original Final Actual Adjustments Basis (Negative)
Public WorksAdministration $ 901,405 923,455 867,685 9,709 877,394 46,061 Street Maintenance 1,117,703 926,553 788,433 117 788,550 138,003 Street Construction 1,262,711 1,362,211 1,155,668 19,942 1,175,610 186,601 Street Cleaning 1,757,576 1,810,676 1,586,689 4,470 1,591,159 219,517 Building Rehabilitation 980,969 934,300 811,082 7,985 819,067 115,233 Warehouse 162,658 177,008 169,153 4,345 173,498 3,510 Special Construction Projects 1,018,622 1,018,622 1,271,868 - 1,271,868 (253,246)
Health and WelfareThird-Party Funding 416,064 423,014 415,006 8,320 423,326 (312) Animal Care 2,697,793 2,737,793 2,295,090 108,582 2,403,672 334,121 Non CDBG Code Enforcement 238,457 285,523 240,811 1,838 242,649 42,874
Cultural and RecreationalParks 397,579 398,967 442,025 1,688 443,713 (44,746) Maintenance 6,539,798 6,541,604 6,355,019 424,786 6,779,805 (238,201) Construction 1,262,553 1,262,553 1,034,242 18,276 1,052,518 210,035 Horticulture/Forestry 324,691 342,691 323,881 59,355 383,236 (40,545) Aquatics 1,974,188 1,931,688 1,761,353 112,361 1,873,714 57,974 Recreation Centers 4,904,238 4,816,609 4,263,516 196,410 4,459,926 356,683 Cemetery 403,156 452,850 430,993 53,104 484,097 (31,247) Library 4,232,309 4,201,374 3,854,015 193,391 4,047,406 153,968
Other 11,837,731 10,683,746 6,421,710 902,468 7,324,178 3,359,568 Capital Outlay 175,000 626,962 13,403,097 121,459 13,524,556 (12,897,594) Debt Service: Principal Retirement 788,384 788,384 806,618 - 806,618 (18,234) Interest and Fiscal Expenditures 279,700 279,700 283,117 - 283,117 (3,417)
TOTAL EXPENDITURES 196,091,055 196,301,175 199,634,437 3,745,540 203,379,977 (7,078,802)
Excess (Deficiency) of Revenues Over Expenditures (10,319,198) (10,215,198) (609,875) (3,745,540) (4,355,415) 5,859,783
OTHER FINANCING SOURCES (USES):
Transfers In: Hotel Motel Fund 160,818 160,818 125,768 - 125,768 (35,050) Capital Improvements Fund 13,939,425 13,939,425 7,277,848 - 7,277,848 (6,661,577)
Transfers Out: Auto Theft Task Force (421,720) (421,720) (369,345) - (369,345) 52,375 Health Fund (3,049,462) (3,049,462) (3,049,462) - (3,049,462) - Special Police Program (1,262,910) (1,262,910) (925,987) - (925,987) 336,923 Special Fire Grants (435,310) (439,310) (437,787) - (437,787) 1,523 Max Mandel Golf Course (568,713) (668,713) (634,335) - (634,335) 34,378 El Metro Operations (175,200) (175,200) (125,000) - (125,000) 50,200 Transit System (240,800) (240,800) (229,336) - (229,336) 11,464
Sale of Assets 156,835 156,835 102,050 - 102,050 (54,785)
TOTAL OTHER FINANCING SOURCES
(USES) 8,102,963 7,998,963 1,734,414 - 1,734,414 (6,264,549)
Net Change in Fund Balance (2,216,235) (2,216,235) 1,124,539 (3,745,540) (2,621,001) (404,766)
Fund Balances at Beginning of Year 46,755,887 46,846,974 46,846,974 (4,938) 46,842,036 (4,938)
FUND BALANCES AT END OF YEAR $ 44,539,652 44,630,739 47,971,513 (3,750,478) 44,221,035 (409,704)
The notes to the financial statements are an integral part of this statement.
27
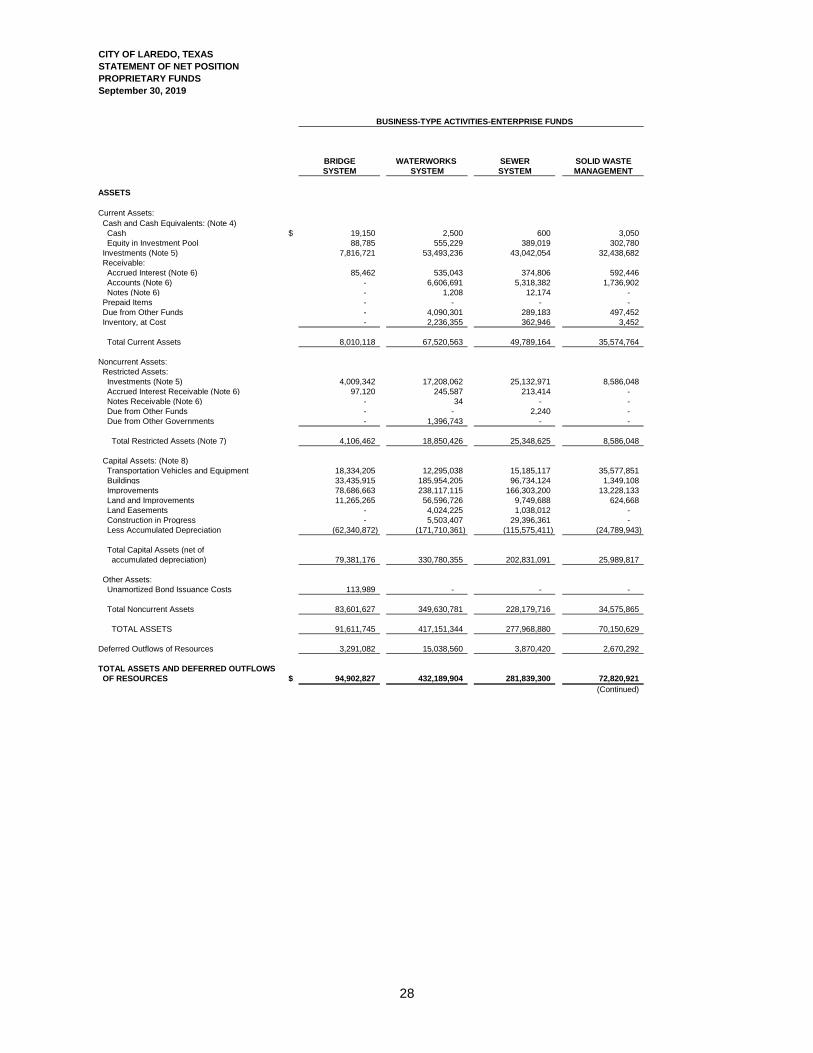
CITY OF LAREDO, TEXAS
STATEMENT OF NET POSITION
PROPRIETARY FUNDS
September 30, 2019
BUSINESS-TYPE ACTIVITIES-ENTERPRISE FUNDS BUSINESS-TYPE ACTIVITIES-ENTERPRISE FUNDS
BRIDGE WATERWORKS SEWER SOLID WASTE
SYSTEM SYSTEM SYSTEM MANAGEMENT
ASSETS
Current Assets: Cash and Cash Equivalents: (Note 4) Cash $ 19,150 2,500 600 3,050
Equity in Investment Pool 88,785 555,229 389,019 302,780 Investments (Note 5) 7,816,721 53,493,236 43,042,054 32,438,682 Receivable: Accrued Interest (Note 6) 85,462 535,043 374,806 592,446 Accounts (Note 6) - 6,606,691 5,318,382 1,736,902 Notes (Note 6) - 1,208 12,174 -
Prepaid Items - - - - Due from Other Funds - 4,090,301 289,183 497,452 Inventory, at Cost - 2,236,355 362,946 3,452
Total Current Assets 8,010,118 67,520,563 49,789,164 35,574,764
Noncurrent Assets: Restricted Assets: Investments (Note 5) 4,009,342 17,208,062 25,132,971 8,586,048 Accrued Interest Receivable (Note 6) 97,120 245,587 213,414 - Notes Receivable (Note 6) - 34 - - Due from Other Funds - - 2,240 - Due from Other Governments - 1,396,743 - -
Total Restricted Assets (Note 7) 4,106,462 18,850,426 25,348,625 8,586,048
Capital Assets: (Note 8) Transportation Vehicles and Equipment 18,334,205 12,295,038 15,185,117 35,577,851 Buildings 33,435,915 185,954,205 96,734,124 1,349,108 Improvements 78,686,663 238,117,115 166,303,200 13,228,133 Land and Improvements 11,265,265 56,596,726 9,749,688 624,668 Land Easements - 4,024,225 1,038,012 - Construction in Progress - 5,503,407 29,396,361 - Less Accumulated Depreciation (62,340,872) (171,710,361) (115,575,411) (24,789,943)
Total Capital Assets (net of accumulated depreciation) 79,381,176 330,780,355 202,831,091 25,989,817
Other Assets: Unamortized Bond Issuance Costs 113,989 - - -
Total Noncurrent Assets 83,601,627 349,630,781 228,179,716 34,575,865
TOTAL ASSETS 91,611,745 417,151,344 277,968,880 70,150,629
Deferred Outflows of Resources 3,291,082 15,038,560 3,870,420 2,670,292
TOTAL ASSETS AND DEFERRED OUTFLOWS
OF RESOURCES $ 94,902,827 432,189,904 281,839,300 72,820,921
(Continued)
28
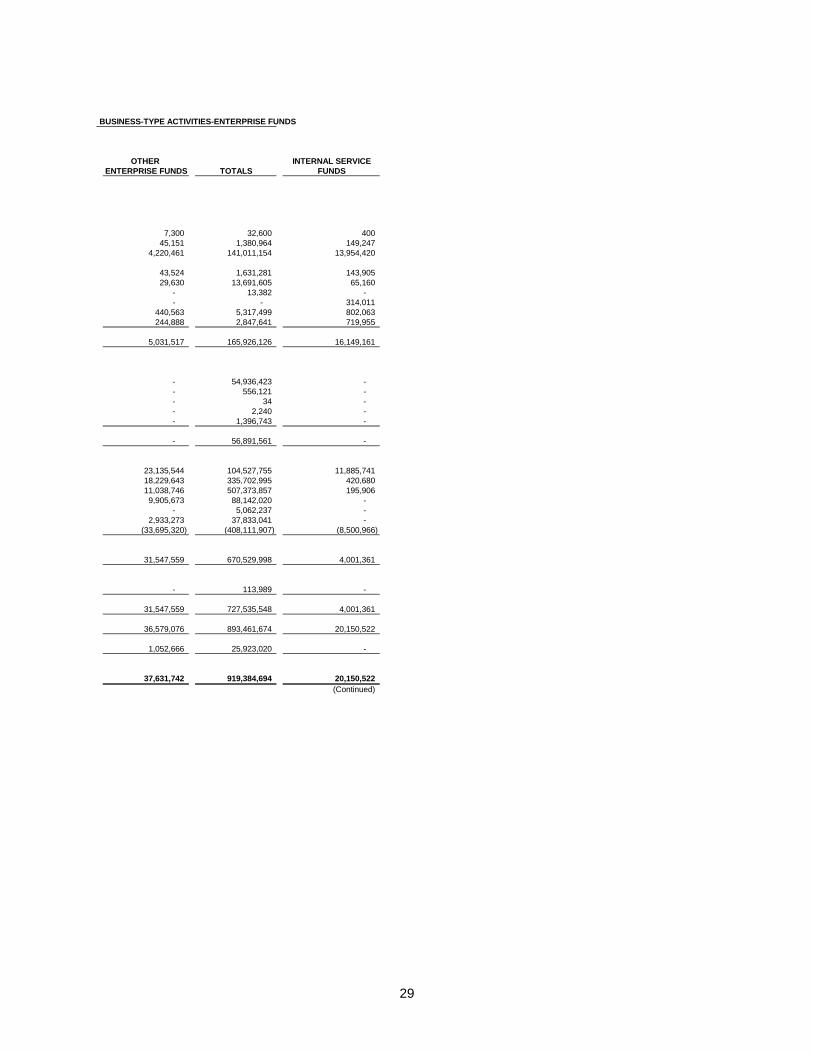
BUSINESS-TYPE ACTIVITIES-ENTERPRISE FUNDS BUSINESS-TYPE ACTIVITIES-ENTERPRISE FUNDS
OTHER INTERNAL SERVICE
ENTERPRISE FUNDS TOTALS FUNDS
7,300 32,600 400 45,151 1,380,964 149,247
4,220,461 141,011,154 13,954,420
43,524 1,631,281 143,905 29,630 13,691,605 65,160
- 13,382 - - - 314,011
440,563 5,317,499 802,063 244,888 2,847,641 719,955
5,031,517 165,926,126 16,149,161
- 54,936,423 - - 556,121 - - 34 - - 2,240 - - 1,396,743 -
- 56,891,561 -
23,135,544 104,527,755 11,885,741 18,229,643 335,702,995 420,680 11,038,746 507,373,857 195,906 9,905,673 88,142,020 -
- 5,062,237 - 2,933,273 37,833,041 -
(33,695,320) (408,111,907) (8,500,966)
31,547,559 670,529,998 4,001,361
- 113,989 -
31,547,559 727,535,548 4,001,361
36,579,076 893,461,674 20,150,522
1,052,666 25,923,020 -
37,631,742 919,384,694 20,150,522
(Continued)
29
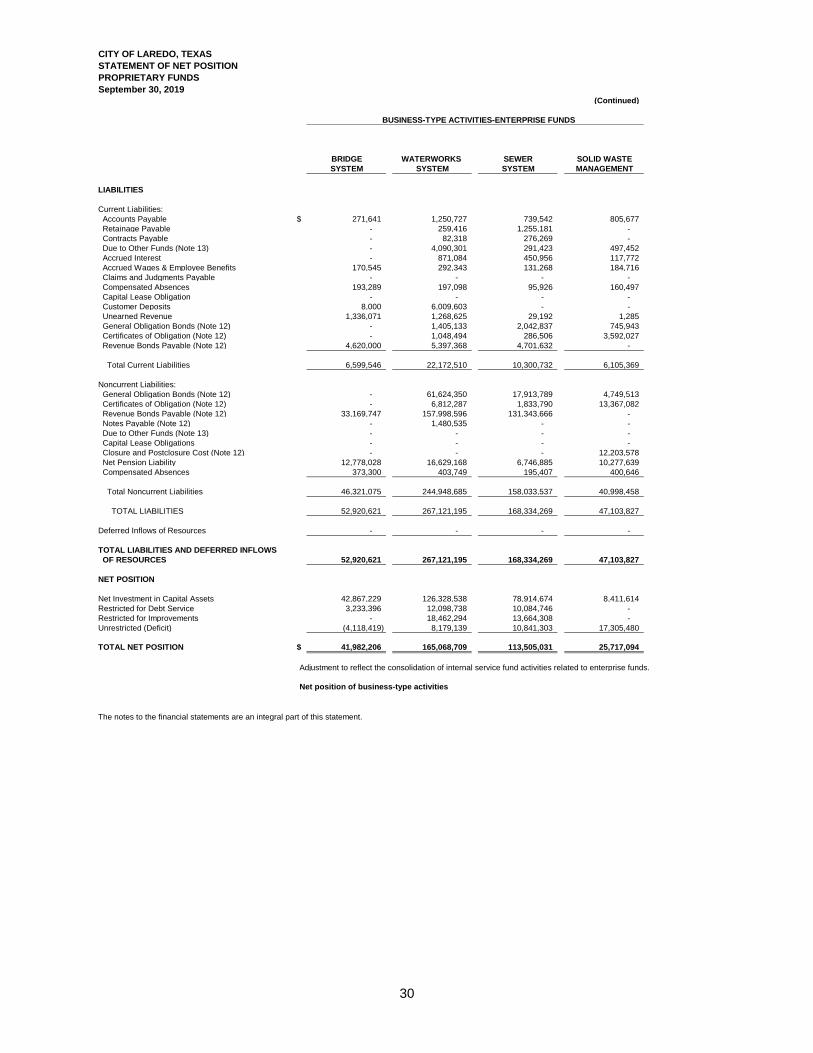
CITY OF LAREDO, TEXAS
STATEMENT OF NET POSITION
PROPRIETARY FUNDS
September 30, 2019(Continued)
BUSINESS-TYPE ACTIVITIES-ENTERPRISE FUNDS
BRIDGE WATERWORKS SEWER SOLID WASTE
SYSTEM SYSTEM SYSTEM MANAGEMENT ENTERPRISE FUNDS
LIABILITIES
Current Liabilities: Accounts Payable $ 271,641 1,250,727 739,542 805,677 Retainage Payable - 259,416 1,255,181 - Contracts Payable - 82,318 276,269 - Due to Other Funds (Note 13) - 4,090,301 291,423 497,452 Accrued Interest - 871,084 450,956 117,772 Accrued Wages & Employee Benefits 170,545 292,343 131,268 184,716 Claims and Judgments Payable - - - - Compensated Absences 193,289 197,098 95,926 160,497 Capital Lease Obligation - - - - Customer Deposits 8,000 6,009,603 - - Unearned Revenue 1,336,071 1,268,625 29,192 1,285 General Obligation Bonds (Note 12) - 1,405,133 2,042,837 745,943 Certificates of Obligation (Note 12) - 1,048,494 286,506 3,592,027 Revenue Bonds Payable (Note 12) 4,620,000 5,397,368 4,701,632 -
Total Current Liabilities 6,599,546 22,172,510 10,300,732 6,105,369
Noncurrent Liabilities: General Obligation Bonds (Note 12) - 61,624,350 17,913,789 4,749,513 Certificates of Obligation (Note 12) - 6,812,287 1,833,790 13,367,082 Revenue Bonds Payable (Note 12) 33,169,747 157,998,596 131,343,666 - Notes Payable (Note 12) - 1,480,535 - - Due to Other Funds (Note 13) - - - - Capital Lease Obligations - - - - Closure and Postclosure Cost (Note 12) - - - 12,203,578 Net Pension Liability 12,778,028 16,629,168 6,746,885 10,277,639 Compensated Absences 373,300 403,749 195,407 400,646
Total Noncurrent Liabilities 46,321,075 244,948,685 158,033,537 40,998,458
TOTAL LIABILITIES 52,920,621 267,121,195 168,334,269 47,103,827
Deferred Inflows of Resources - - - -
TOTAL LIABILITIES AND DEFERRED INFLOWS
OF RESOURCES 52,920,621 267,121,195 168,334,269 47,103,827
NET POSITION
Net Investment in Capital Assets 42,867,229 126,328,538 78,914,674 8,411,614 Restricted for Debt Service 3,233,396 12,098,738 10,084,746 - Restricted for Improvements - 18,462,294 13,664,308 - Unrestricted (Deficit) (4,118,419) 8,179,139 10,841,303 17,305,480
TOTAL NET POSITION $ 41,982,206 165,068,709 113,505,031 25,717,094
Adjustment to reflect the consolidation of internal service fund activities related to enterprise funds.
Net position of business-type activities
The notes to the financial statements are an integral part of this statement.
30
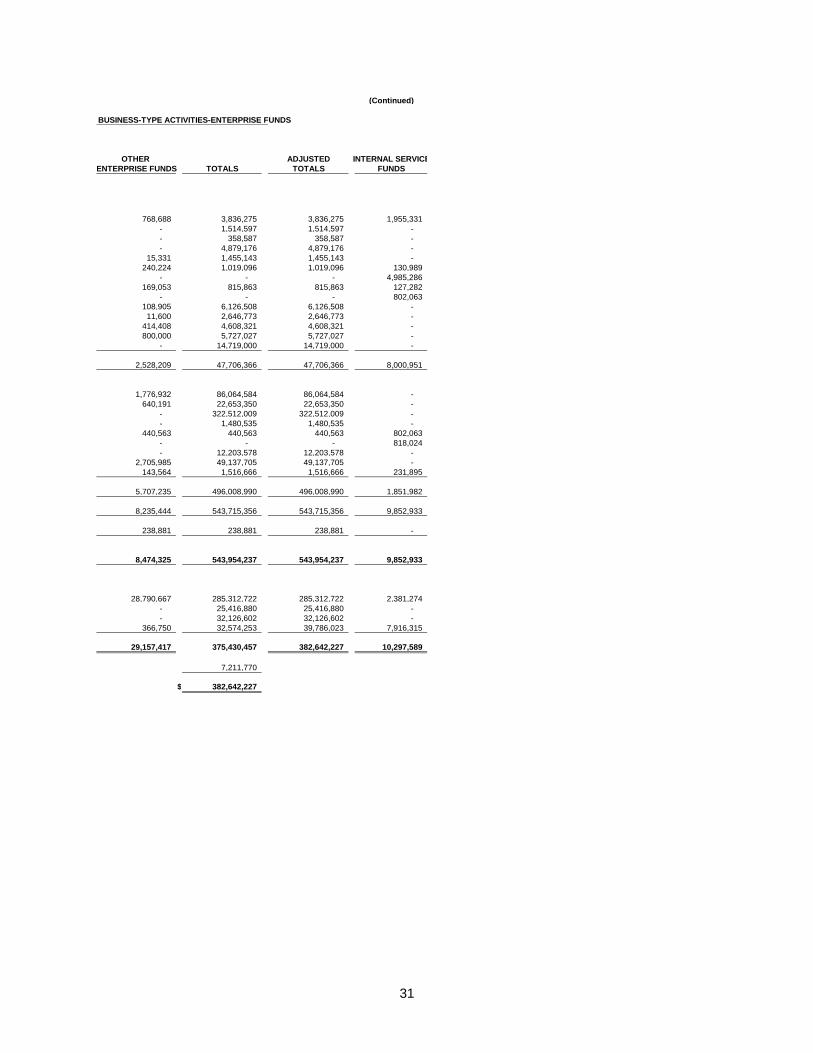
(Continued)
BUSINESS-TYPE ACTIVITIES-ENTERPRISE FUNDS
OTHER ADJUSTED INTERNAL SERVICE
ENTERPRISE FUNDS TOTALS TOTALS FUNDS
768,688 3,836,275 3,836,275 1,955,331 - 1,514,597 1,514,597 - - 358,587 358,587 - - 4,879,176 4,879,176 -
15,331 1,455,143 1,455,143 - 240,224 1,019,096 1,019,096 130,989
- - - 4,985,286 169,053 815,863 815,863 127,282
- - - 802,063 108,905 6,126,508 6,126,508 -
11,600 2,646,773 2,646,773 - 414,408 4,608,321 4,608,321 - 800,000 5,727,027 5,727,027 -
- 14,719,000 14,719,000 -
2,528,209 47,706,366 47,706,366 8,000,951
1,776,932 86,064,584 86,064,584 - 640,191 22,653,350 22,653,350 -
- 322,512,009 322,512,009 - - 1,480,535 1,480,535 -
440,563 440,563 440,563 802,063 - - - 818,024 - 12,203,578 12,203,578 -
2,705,985 49,137,705 49,137,705 - 143,564 1,516,666 1,516,666 231,895
5,707,235 496,008,990 496,008,990 1,851,982
8,235,444 543,715,356 543,715,356 9,852,933
238,881 238,881 238,881 -
8,474,325 543,954,237 543,954,237 9,852,933
28,790,667 285,312,722 285,312,722 2,381,274 - 25,416,880 25,416,880 - - 32,126,602 32,126,602 -
366,750 32,574,253 39,786,023 7,916,315
29,157,417 375,430,457 382,642,227 10,297,589
Adjustment to reflect the consolidation of internal service fund activities related to enterprise funds. 7,211,770
$ 382,642,227
31
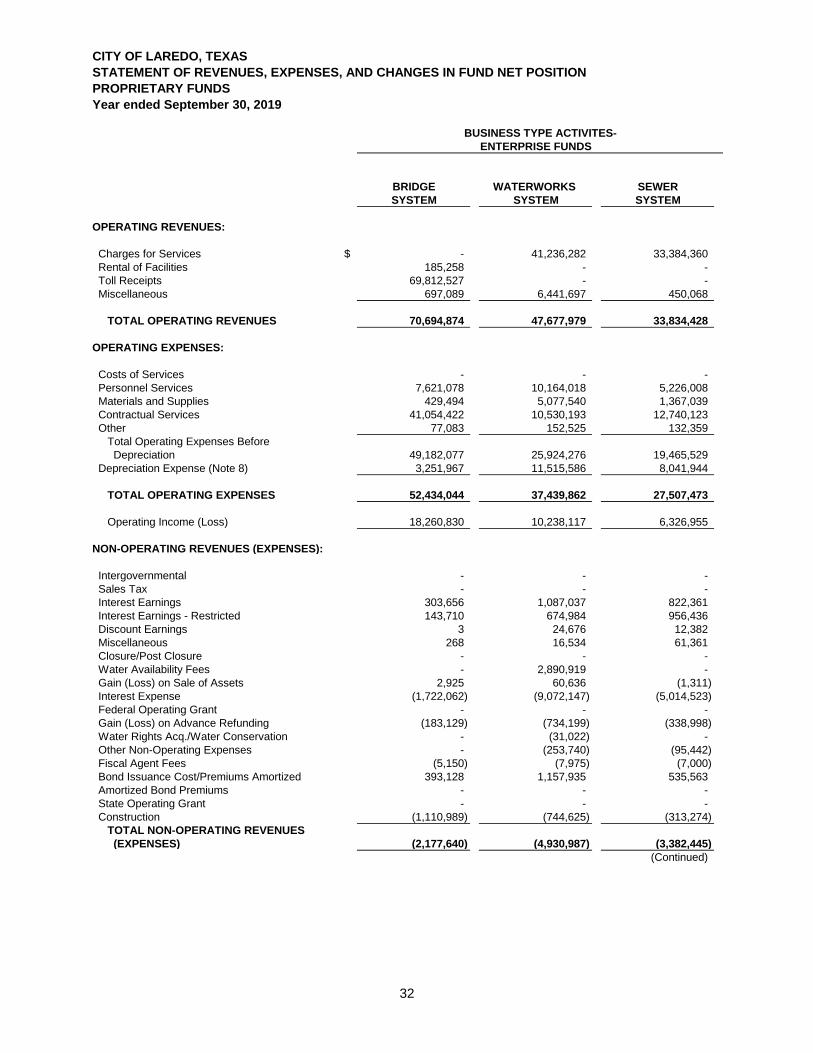
CITY OF LAREDO, TEXAS
STATEMENT OF REVENUES, EXPENSES, AND CHANGES IN FUND NET POSITION
PROPRIETARY FUNDS
Year ended September 30, 2019
BUSINESS TYPE ACTIVITES-
ENTERPRISE FUNDS ENTERPRISE FUNDS
BRIDGE WATERWORKS SEWER
SYSTEM SYSTEM SYSTEM
OPERATING REVENUES:
Charges for Services $ - 41,236,282 33,384,360 Rental of Facilities 185,258 - - Toll Receipts 69,812,527 - - Miscellaneous 697,089 6,441,697 450,068
TOTAL OPERATING REVENUES 70,694,874 47,677,979 33,834,428
OPERATING EXPENSES:
Costs of Services - - - Personnel Services 7,621,078 10,164,018 5,226,008 Materials and Supplies 429,494 5,077,540 1,367,039 Contractual Services 41,054,422 10,530,193 12,740,123 Other 77,083 152,525 132,359
Total Operating Expenses Before Depreciation 49,182,077 25,924,276 19,465,529 Depreciation Expense (Note 8) 3,251,967 11,515,586 8,041,944
TOTAL OPERATING EXPENSES 52,434,044 37,439,862 27,507,473
Operating Income (Loss) 18,260,830 10,238,117 6,326,955
NON-OPERATING REVENUES (EXPENSES):
Intergovernmental - - - Sales Tax - - - Interest Earnings 303,656 1,087,037 822,361 Interest Earnings - Restricted 143,710 674,984 956,436 Discount Earnings 3 24,676 12,382 Miscellaneous 268 16,534 61,361 Closure/Post Closure - - - Water Availability Fees - 2,890,919 - Gain (Loss) on Sale of Assets 2,925 60,636 (1,311) Interest Expense (1,722,062) (9,072,147) (5,014,523) Federal Operating Grant - - - Gain (Loss) on Advance Refunding (183,129) (734,199) (338,998) Water Rights Acq./Water Conservation - (31,022) - Other Non-Operating Expenses - (253,740) (95,442) Fiscal Agent Fees (5,150) (7,975) (7,000) Bond Issuance Cost/Premiums Amortized 393,128 1,157,935 535,563 Amortized Bond Premiums - - - State Operating Grant - - - Construction (1,110,989) (744,625) (313,274)
TOTAL NON-OPERATING REVENUES
(EXPENSES) (2,177,640) (4,930,987) (3,382,445)
(Continued)
32
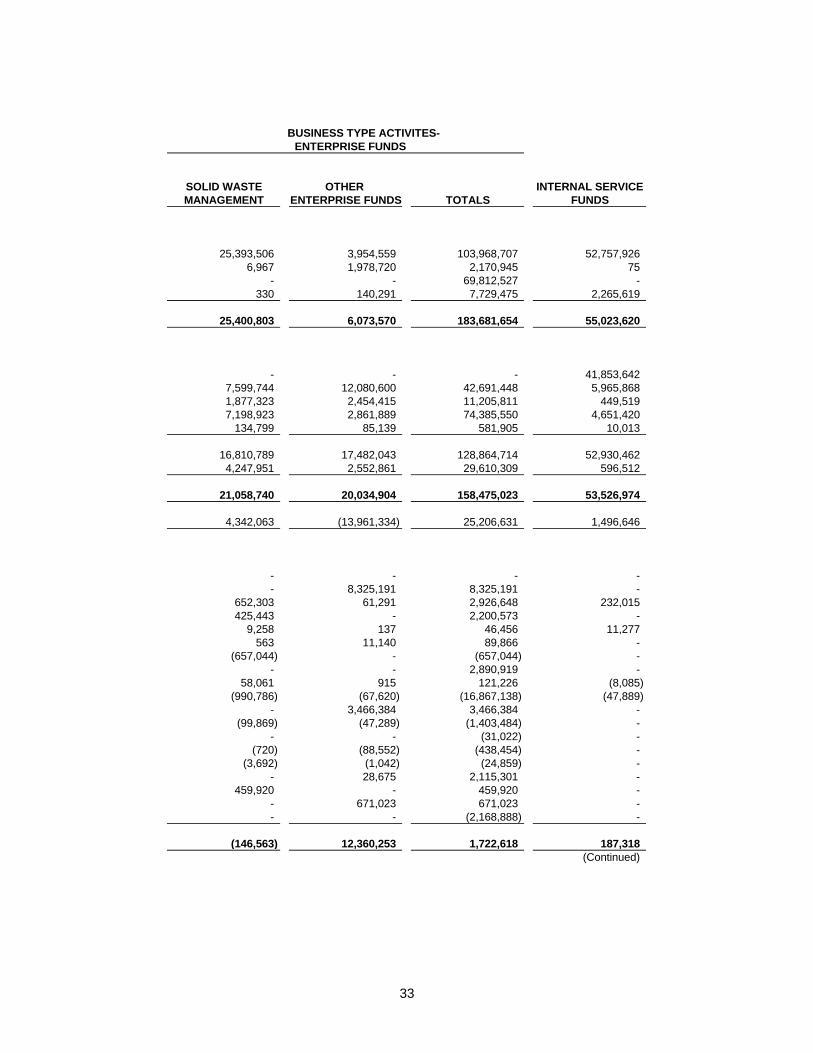
BUSINESS TYPE ACTIVITES-
ENTERPRISE FUNDS
SOLID WASTE OTHER INTERNAL SERVICE
MANAGEMENT ENTERPRISE FUNDS TOTALS FUNDS
25,393,506 3,954,559 103,968,707 52,757,926 6,967 1,978,720 2,170,945 75
- - 69,812,527 - 330 140,291 7,729,475 2,265,619
25,400,803 6,073,570 183,681,654 55,023,620
- - - 41,853,642 7,599,744 12,080,600 42,691,448 5,965,868 1,877,323 2,454,415 11,205,811 449,519 7,198,923 2,861,889 74,385,550 4,651,420
134,799 85,139 581,905 10,013
16,810,789 17,482,043 128,864,714 52,930,462 4,247,951 2,552,861 29,610,309 596,512
21,058,740 20,034,904 158,475,023 53,526,974
4,342,063 (13,961,334) 25,206,631 1,496,646
- - - - - 8,325,191 8,325,191 -
652,303 61,291 2,926,648 232,015 425,443 - 2,200,573 -
9,258 137 46,456 11,277 563 11,140 89,866 -
(657,044) - (657,044) - - - 2,890,919 -
58,061 915 121,226 (8,085) (990,786) (67,620) (16,867,138) (47,889)
- 3,466,384 3,466,384 - (99,869) (47,289) (1,403,484) -
- - (31,022) - (720) (88,552) (438,454) -
(3,692) (1,042) (24,859) - - 28,675 2,115,301 -
459,920 - 459,920 - - 671,023 671,023 - - - (2,168,888) -
(146,563) 12,360,253 1,722,618 187,318
(Continued)
33
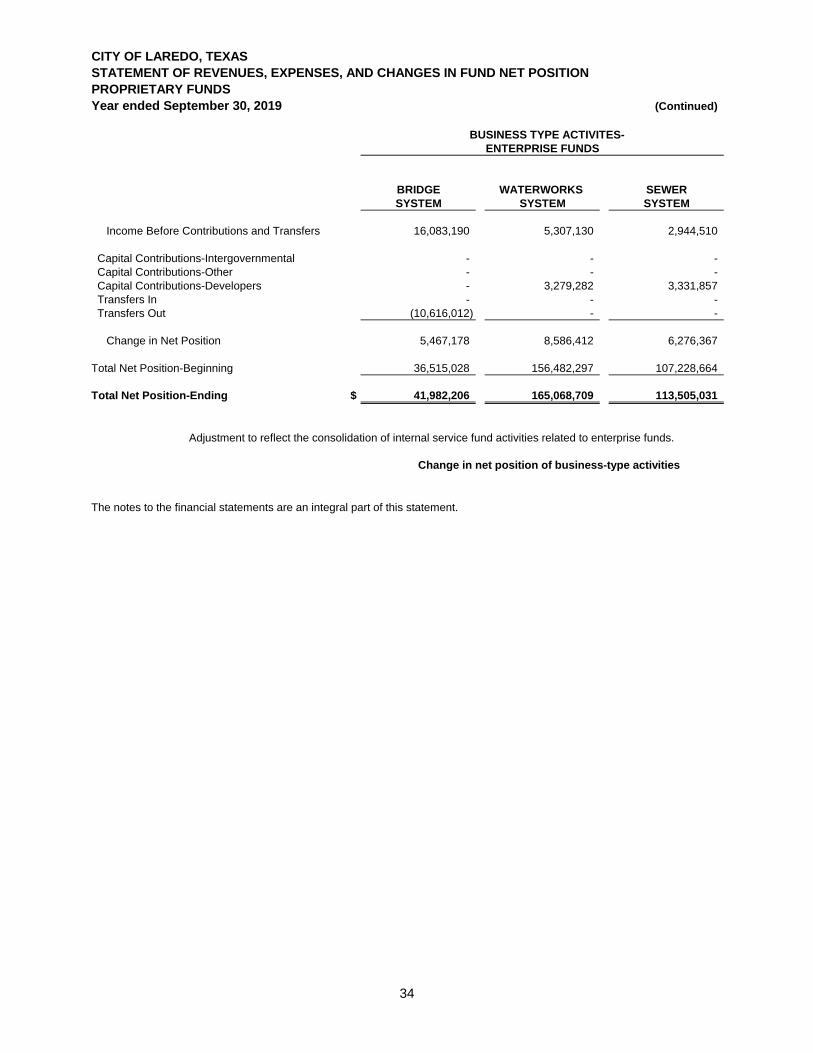
CITY OF LAREDO, TEXAS
STATEMENT OF REVENUES, EXPENSES, AND CHANGES IN FUND NET POSITION
PROPRIETARY FUNDS
Year ended September 30, 2019 (Continued)
BUSINESS TYPE ACTIVITES-
ENTERPRISE FUNDS ENTERPRISE FUNDS
BRIDGE WATERWORKS SEWER
SYSTEM SYSTEM SYSTEM
Income Before Contributions and Transfers 16,083,190 5,307,130 2,944,510
Capital Contributions-Intergovernmental - - - Capital Contributions-Other - - - Capital Contributions-Developers - 3,279,282 3,331,857 Transfers In - - - Transfers Out (10,616,012) - -
Change in Net Position 5,467,178 8,586,412 6,276,367
Total Net Position-Beginning 36,515,028 156,482,297 107,228,664
Total Net Position-Ending $ 41,982,206 165,068,709 113,505,031
Adjustment to reflect the consolidation of internal service fund activities related to enterprise funds.
Change in net position of business-type activities
The notes to the financial statements are an integral part of this statement.
34
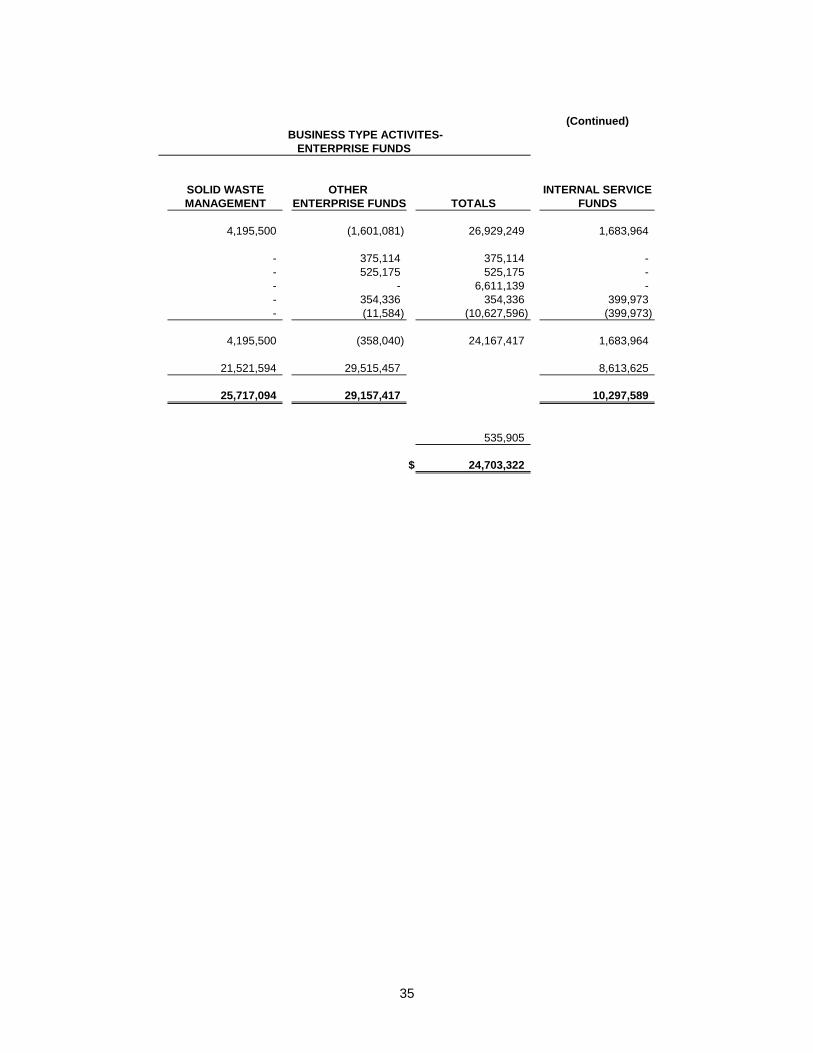
(Continued)
BUSINESS TYPE ACTIVITES- BUSINESS TYPE ACTIVITES-
ENTERPRISE FUNDS
SOLID WASTE OTHER INTERNAL SERVICE
MANAGEMENT ENTERPRISE FUNDS TOTALS FUNDS
4,195,500 (1,601,081) 26,929,249 1,683,964
- 375,114 375,114 - - 525,175 525,175 - - - 6,611,139 - - 354,336 354,336 399,973 - (11,584) (10,627,596) (399,973)
4,195,500 (358,040) 24,167,417 1,683,964
21,521,594 29,515,457 8,613,625
25,717,094 29,157,417 10,297,589
535,905
$ 24,703,322
35
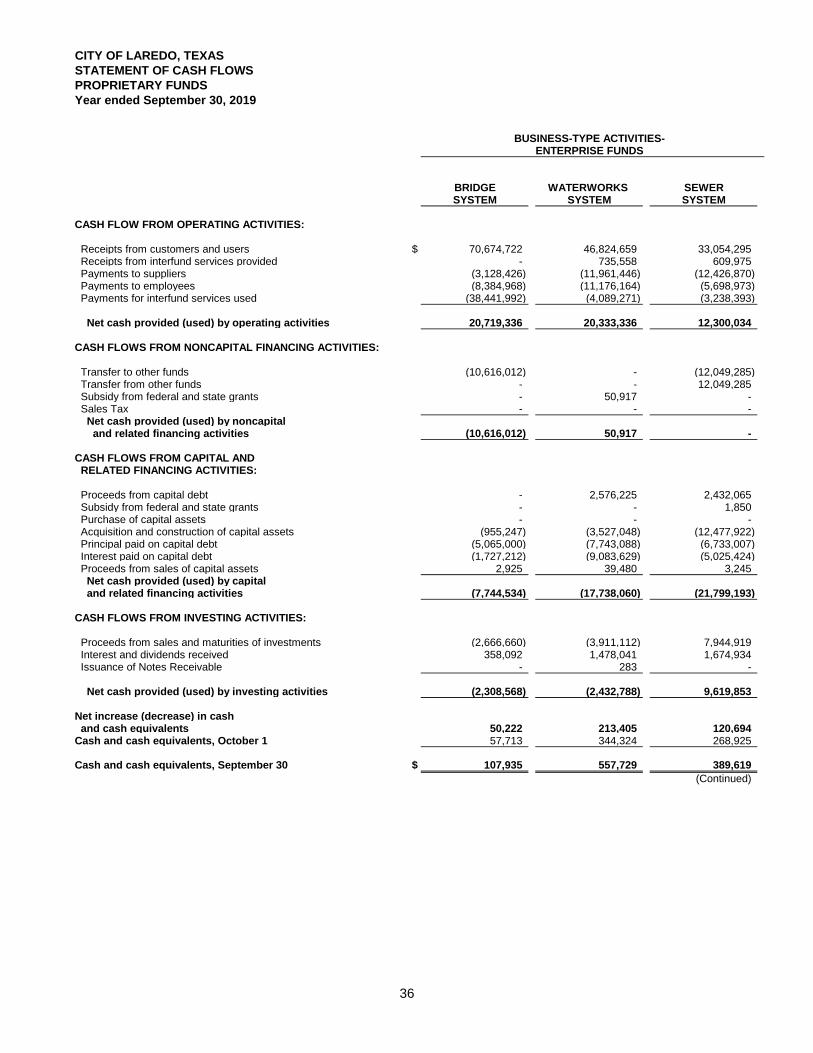
CITY OF LAREDO, TEXAS
STATEMENT OF CASH FLOWS
PROPRIETARY FUNDS
Year ended September 30, 2019
BUSINESS-TYPE ACTIVITIES- BUSINESS-TYPE ACTIVITIES-ENTERPRISE FUNDS ENTERPRISE FUNDS
BRIDGE WATERWORKS SEWERSYSTEM SYSTEM SYSTEM
CASH FLOW FROM OPERATING ACTIVITIES:
Receipts from customers and users $ 70,674,722 46,824,659 33,054,295 Receipts from interfund services provided - 735,558 609,975 Payments to suppliers (3,128,426) (11,961,446) (12,426,870) Payments to employees (8,384,968) (11,176,164) (5,698,973) Payments for interfund services used (38,441,992) (4,089,271) (3,238,393)
Net cash provided (used) by operating activities 20,719,336 20,333,336 12,300,034
CASH FLOWS FROM NONCAPITAL FINANCING ACTIVITIES:
Transfer to other funds (10,616,012) - (12,049,285) Transfer from other funds - - 12,049,285 Subsidy from federal and state grants - 50,917 - Sales Tax - - -
Net cash provided (used) by noncapital and related financing activities (10,616,012) 50,917 -
CASH FLOWS FROM CAPITAL AND RELATED FINANCING ACTIVITIES:
Proceeds from capital debt - 2,576,225 2,432,065 Subsidy from federal and state grants - - 1,850 Purchase of capital assets - - - Acquisition and construction of capital assets (955,247) (3,527,048) (12,477,922) Principal paid on capital debt (5,065,000) (7,743,088) (6,733,007) Interest paid on capital debt (1,727,212) (9,083,629) (5,025,424) Proceeds from sales of capital assets 2,925 39,480 3,245
Net cash provided (used) by capital and related financing activities (7,744,534) (17,738,060) (21,799,193)
CASH FLOWS FROM INVESTING ACTIVITIES:
Proceeds from sales and maturities of investments (2,666,660) (3,911,112) 7,944,919 Interest and dividends received 358,092 1,478,041 1,674,934 Issuance of Notes Receivable - 283 -
Net cash provided (used) by investing activities (2,308,568) (2,432,788) 9,619,853
Net increase (decrease) in cash and cash equivalents 50,222 213,405 120,694 Cash and cash equivalents, October 1 57,713 344,324 268,925
Cash and cash equivalents, September 30 $ 107,935 557,729 389,619
(Continued)
36
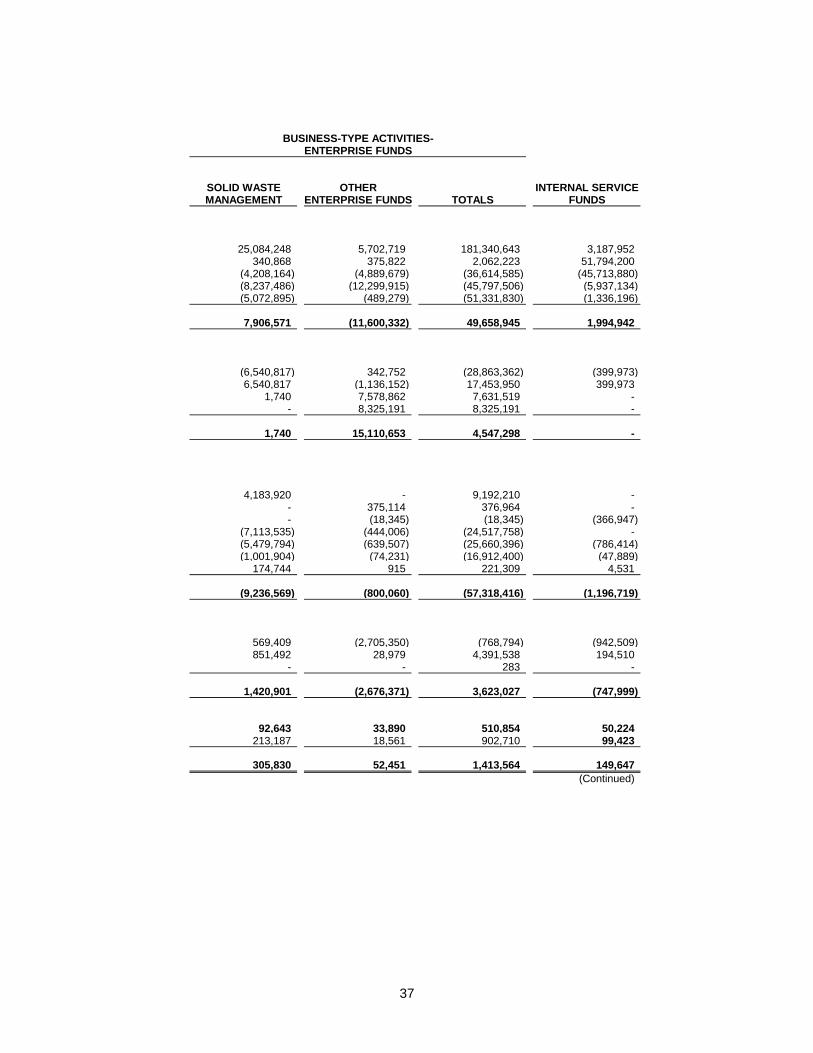
BUSINESS-TYPE ACTIVITIES-ENTERPRISE FUNDS
SOLID WASTE OTHER INTERNAL SERVICEMANAGEMENT ENTERPRISE FUNDS TOTALS FUNDS
25,084,248 5,702,719 181,340,643 3,187,952 340,868 375,822 2,062,223 51,794,200
(4,208,164) (4,889,679) (36,614,585) (45,713,880) (8,237,486) (12,299,915) (45,797,506) (5,937,134) (5,072,895) (489,279) (51,331,830) (1,336,196)
7,906,571 (11,600,332) 49,658,945 1,994,942
(6,540,817) 342,752 (28,863,362) (399,973) 6,540,817 (1,136,152) 17,453,950 399,973
1,740 7,578,862 7,631,519 - - 8,325,191 8,325,191 -
1,740 15,110,653 4,547,298 -
4,183,920 - 9,192,210 - - 375,114 376,964 - - (18,345) (18,345) (366,947)
(7,113,535) (444,006) (24,517,758) - (5,479,794) (639,507) (25,660,396) (786,414) (1,001,904) (74,231) (16,912,400) (47,889)
174,744 915 221,309 4,531
(9,236,569) (800,060) (57,318,416) (1,196,719)
569,409 (2,705,350) (768,794) (942,509) 851,492 28,979 4,391,538 194,510
- - 283 -
1,420,901 (2,676,371) 3,623,027 (747,999)
92,643 33,890 510,854 50,224 213,187 18,561 902,710 99,423
305,830 52,451 1,413,564 149,647
(Continued)
37
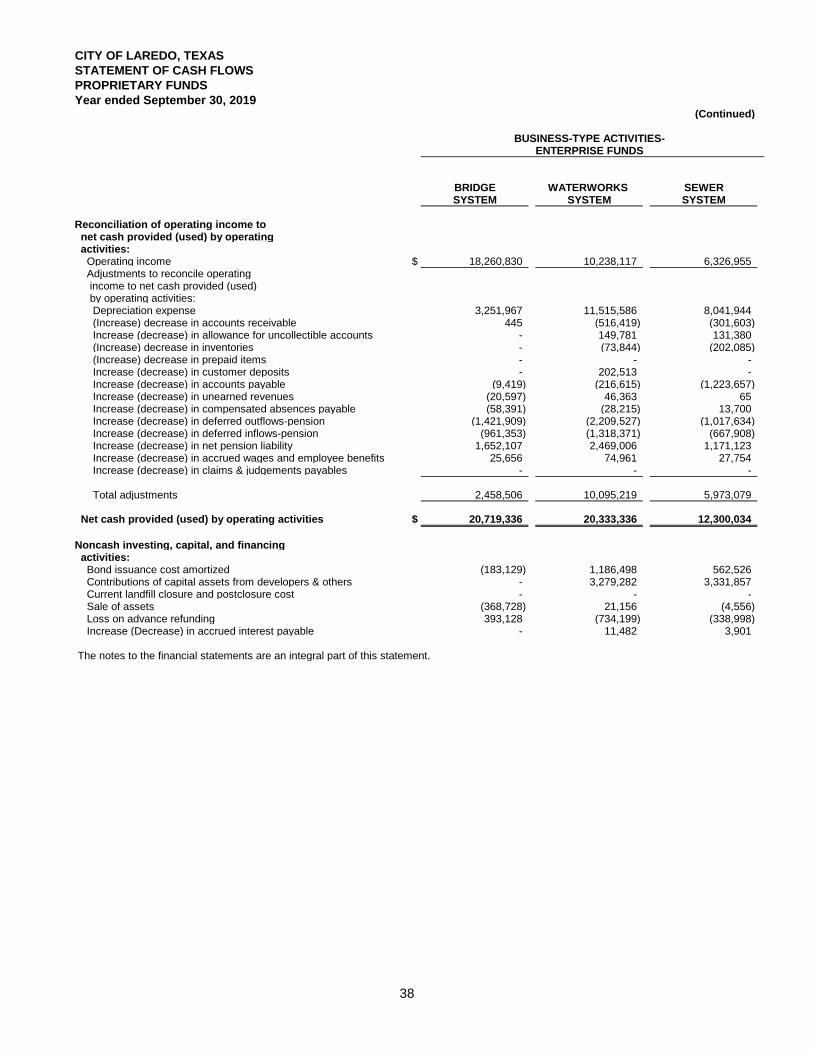
CITY OF LAREDO, TEXAS
STATEMENT OF CASH FLOWS
PROPRIETARY FUNDS
Year ended September 30, 2019(Continued)
BUSINESS-TYPE ACTIVITIES- BUSINESS-TYPE ACTIVITIES-ENTERPRISE FUNDS ENTERPRISE FUNDS
BRIDGE WATERWORKS SEWERSYSTEM SYSTEM SYSTEM
Reconciliation of operating income to net cash provided (used) by operating activities:
Operating income $ 18,260,830 10,238,117 6,326,955 Adjustments to reconcile operating income to net cash provided (used) by operating activities: Depreciation expense 3,251,967 11,515,586 8,041,944 (Increase) decrease in accounts receivable 445 (516,419) (301,603)
Increase (decrease) in allowance for uncollectible accounts - 149,781 131,380 (Increase) decrease in inventories - (73,844) (202,085) (Increase) decrease in prepaid items - - -
Increase (decrease) in customer deposits - 202,513 - Increase (decrease) in accounts payable (9,419) (216,615) (1,223,657) Increase (decrease) in unearned revenues (20,597) 46,363 65 Increase (decrease) in compensated absences payable (58,391) (28,215) 13,700 Increase (decrease) in deferred outflows-pension (1,421,909) (2,209,527) (1,017,634) Increase (decrease) in deferred inflows-pension (961,353) (1,318,371) (667,908) Increase (decrease) in net pension liability 1,652,107 2,469,006 1,171,123 Increase (decrease) in accrued wages and employee benefits 25,656 74,961 27,754 Increase (decrease) in claims & judgements payables - - -
Total adjustments 2,458,506 10,095,219 5,973,079
Net cash provided (used) by operating activities $ 20,719,336 20,333,336 12,300,034
Noncash investing, capital, and financing activities:
Bond issuance cost amortized (183,129) 1,186,498 562,526 Contributions of capital assets from developers & others - 3,279,282 3,331,857 Current landfill closure and postclosure cost - - - Sale of assets (368,728) 21,156 (4,556) Loss on advance refunding 393,128 (734,199) (338,998) Increase (Decrease) in accrued interest payable - 11,482 3,901
The notes to the financial statements are an integral part of this statement.
38
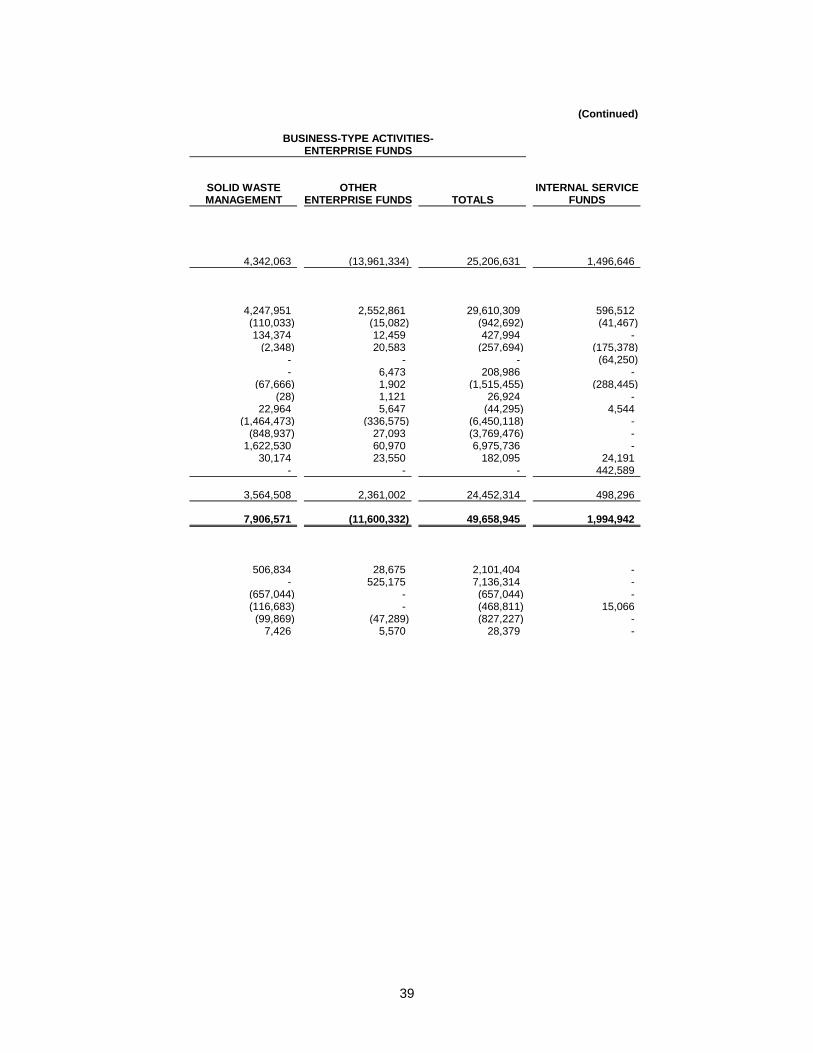
(Continued)
BUSINESS-TYPE ACTIVITIES-ENTERPRISE FUNDS
SOLID WASTE OTHER INTERNAL SERVICEMANAGEMENT ENTERPRISE FUNDS TOTALS FUNDS
4,342,063 (13,961,334) 25,206,631 1,496,646
4,247,951 2,552,861 29,610,309 596,512 (110,033) (15,082) (942,692) (41,467) 134,374 12,459 427,994 -
(2,348) 20,583 (257,694) (175,378) - - - (64,250) - 6,473 208,986 -
(67,666) 1,902 (1,515,455) (288,445) (28) 1,121 26,924 -
22,964 5,647 (44,295) 4,544 (1,464,473) (336,575) (6,450,118) -
(848,937) 27,093 (3,769,476) - 1,622,530 60,970 6,975,736 -
30,174 23,550 182,095 24,191 - - - 442,589
3,564,508 2,361,002 24,452,314 498,296
7,906,571 (11,600,332) 49,658,945 1,994,942
506,834 28,675 2,101,404 - - 525,175 7,136,314 -
(657,044) - (657,044) - (116,683) - (468,811) 15,066 (99,869) (47,289) (827,227) -
7,426 5,570 28,379 -
39
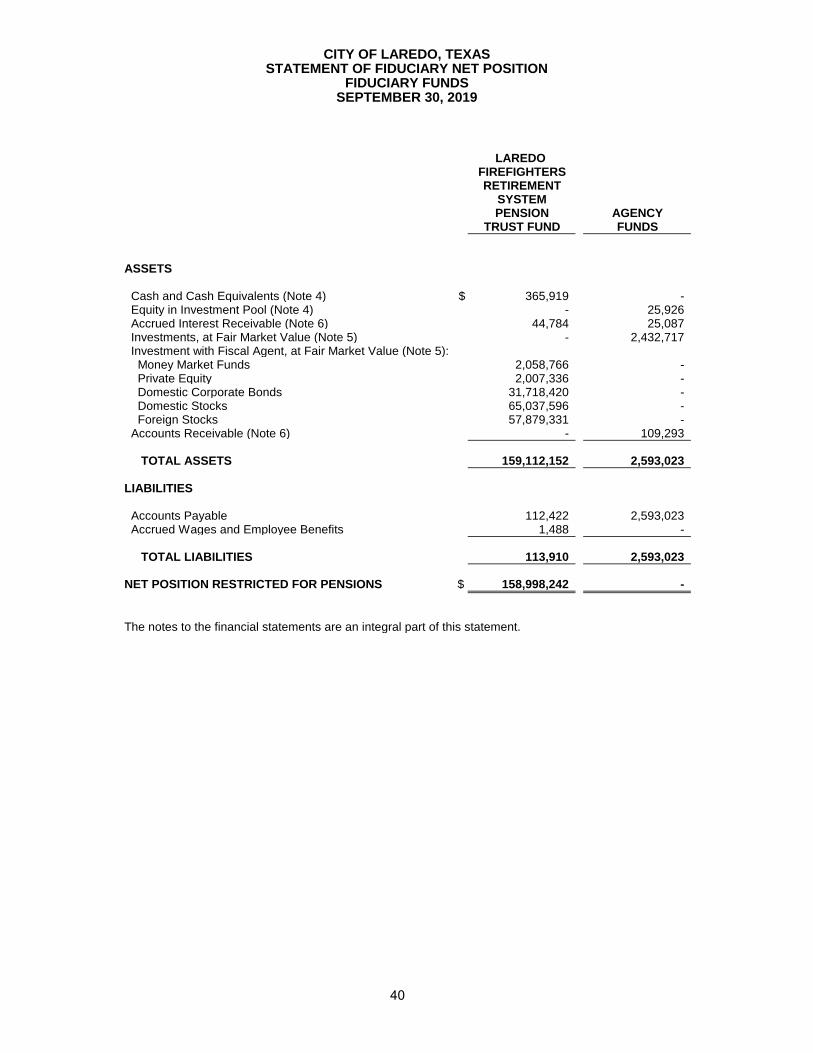
CITY OF LAREDO, TEXASSTATEMENT OF FIDUCIARY NET POSITION
FIDUCIARY FUNDSSEPTEMBER 30, 2019
LAREDO FIREFIGHTERSRETIREMENT
SYSTEMPENSION AGENCY
TRUST FUND FUNDS
ASSETS
Cash and Cash Equivalents (Note 4) $ 365,919 - Equity in Investment Pool (Note 4) - 25,926 Accrued Interest Receivable (Note 6) 44,784 25,087 Investments, at Fair Market Value (Note 5) - 2,432,717 Investment with Fiscal Agent, at Fair Market Value (Note 5):
Money Market Funds 2,058,766 - Private Equity 2,007,336 - Domestic Corporate Bonds 31,718,420 - Domestic Stocks 65,037,596 - Foreign Stocks 57,879,331 -
Accounts Receivable (Note 6) - 109,293
TOTAL ASSETS 159,112,152 2,593,023
LIABILITIES
Accounts Payable 112,422 2,593,023 Accrued Wages and Employee Benefits 1,488 -
TOTAL LIABILITIES 113,910 2,593,023
NET POSITION RESTRICTED FOR PENSIONS $ 158,998,242 -
The notes to the financial statements are an integral part of this statement.
40
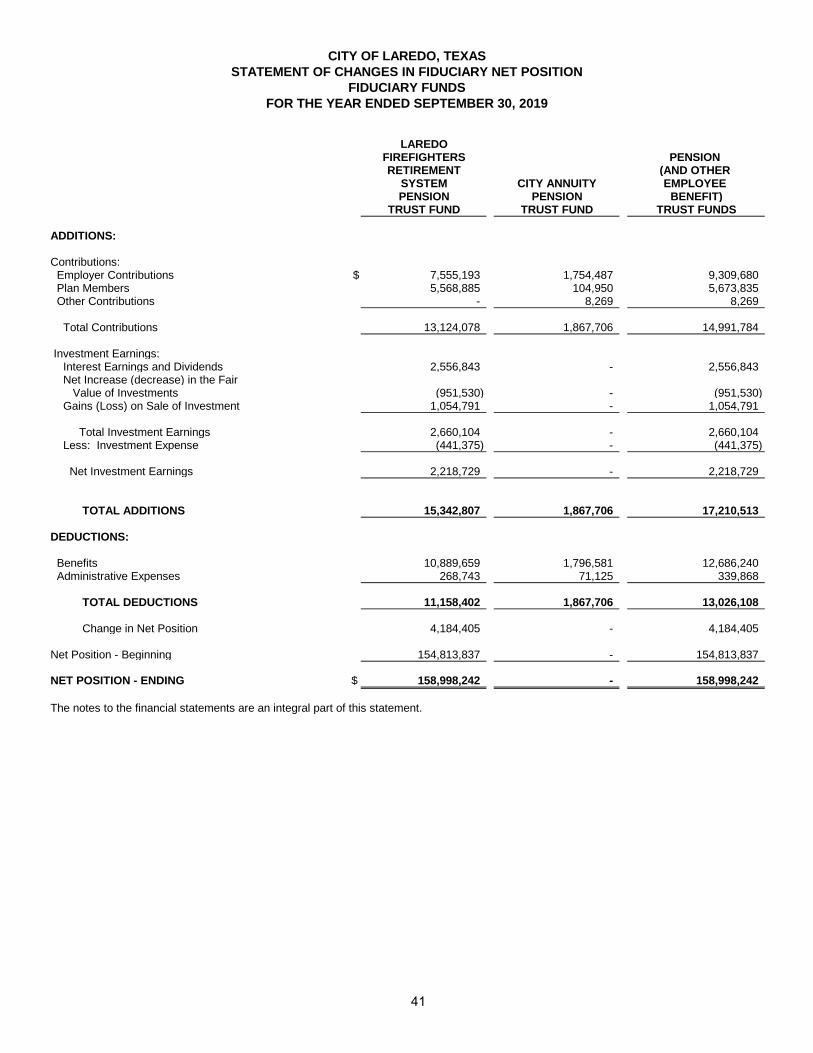
CITY OF LAREDO, TEXAS
STATEMENT OF CHANGES IN FIDUCIARY NET POSITION
FIDUCIARY FUNDS
FOR THE YEAR ENDED SEPTEMBER 30, 2019
LAREDOFIREFIGHTERS PENSION RETIREMENT (AND OTHER
SYSTEM CITY ANNUITY EMPLOYEE PENSION PENSION BENEFIT)
TRUST FUND TRUST FUND TRUST FUNDS
ADDITIONS:
Contributions: Employer Contributions $ 7,555,193 1,754,487 9,309,680 Plan Members 5,568,885 104,950 5,673,835 Other Contributions - 8,269 8,269
Total Contributions 13,124,078 1,867,706 14,991,784
Investment Earnings: Interest Earnings and Dividends 2,556,843 - 2,556,843 Net Increase (decrease) in the Fair
Value of Investments (951,530) - (951,530) Gains (Loss) on Sale of Investment 1,054,791 - 1,054,791
Total Investment Earnings 2,660,104 - 2,660,104 Less: Investment Expense (441,375) - (441,375)
Net Investment Earnings 2,218,729 - 2,218,729
TOTAL ADDITIONS 15,342,807 1,867,706 17,210,513
DEDUCTIONS:
Benefits 10,889,659 1,796,581 12,686,240 Administrative Expenses 268,743 71,125 339,868
TOTAL DEDUCTIONS 11,158,402 1,867,706 13,026,108
Change in Net Position 4,184,405 - 4,184,405
Net Position - Beginning 154,813,837 - 154,813,837
NET POSITION - ENDING $ 158,998,242 - 158,998,242
The notes to the financial statements are an integral part of this statement.
41
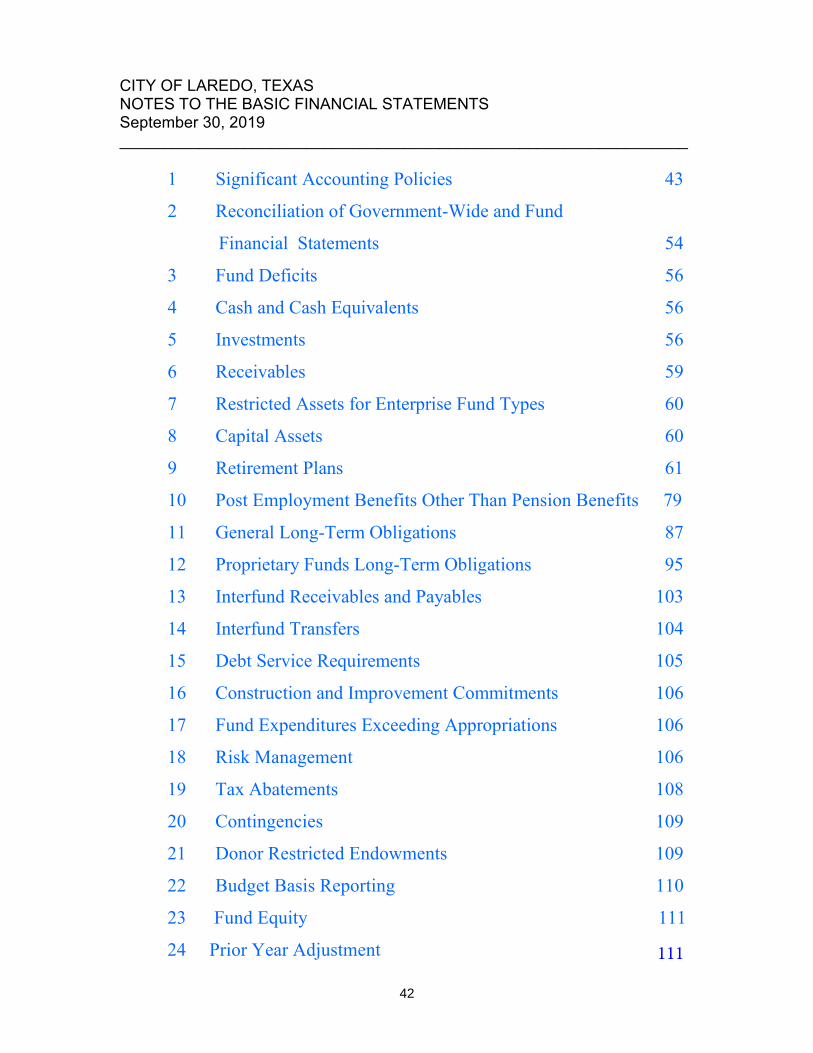
CITY OF LAREDO, TEXAS NOTES TO THE BASIC FINANCIAL STATEMENTS September 30, 2019 ________________________________________________________________
1 Significant Accounting Policies 43
2 Reconciliation of Government-Wide and Fund
Financial Statements 54
3 Fund Deficits 56
4 Cash and Cash Equivalents 56
5 Investments 56
6 Receivables 59
7 Restricted Assets for Enterprise Fund Types 60
8 Capital Assets 60
9 Retirement Plans 61
10 Post Employment Benefits Other Than Pension Benefits 79
11 General Long-Term Obligations 87
95
103
104
105
106
106
106
108
109
109
110
12 Proprietary Funds Long-Term Obligations
13 Interfund Receivables and Payables
14 Interfund Transfers
15 Debt Service Requirements
16 Construction and Improvement Commitments
17 Fund Expenditures Exceeding Appropriations
18 Risk Management
19 Tax Abatements
20 Contingencies
21 Donor Restricted Endowments
22 Budget Basis Reporting
23 Fund Equity
24 Prior Year Adjustment
111
111
42
CITY OF LAREDO, TEXAS NOTES TO THE BASIC FINANCIAL STATEMENTS
SEPTEMBER 30, 2019 The accounting methods and procedures adopted by the City of Laredo, Texas conform to general accepted accounting principles as applied to governmental entities. The following notes to the financial statements are an integral part of the City’s Basic Financial Statements. NOTE 1 – SIGNIFICANT ACCOUNTING POLICIES A. Reporting Entity The City of Laredo, Texas (the City) is a municipal corporation incorporated under Article XI, Section 5 of the Constitution of the State of Texas (Home Rule Amendment). The City operates under a Council-Manager form of government and provides a full range of municipal services as authorized by its charter. The services include public safety (police and fire), highways and streets, sanitation, health and social services, culture and recreation, public improvements, planning and zoning, and general administrative services. In addition, the City owns and operates certain major activities including an airport, a transit system, water and sewer utility system, a landfill, and a bridge system. The City has defined its reporting entity in accordance with GASB 14, "The Financial Reporting Entity". In conformity with generally accepted accounting principles, the financial statements of the component units have been included in the financial reporting entity as blended components. The basis for blending the component units is discussed below: For the Laredo Convention and Visitor’s Bureau, Laredo Transit Management, Inc., Sames Auto Arena, Max Mandel Golf Course, Keep Laredo Beautiful, and Laredo Public Facilities Corporation-La Terraza, L.L.C., the component unit’s governing body is substantively the same as the governing body of the primary government and there is either a financial benefit or burden relationship between the primary government and the component unit. In addition, the component unit’s total debt outstanding is expected to be repaid entirely or almost entirely with the resources of the primary government. The City Council is the governing board for these component units. These entities are bound by the City's legal requirements and the City Council approves the budget, major contracts, surplus dispositions, and any fees or charges. Additionally, the City is legally responsible for debt and public service rendered within the City's boundaries. For the Laredo Firefighter’s Retirement System, the component unit provides services entirely, or almost entirely, to the primary government or otherwise exclusively, or almost exclusively, benefits the primary government even though it does not provide services directly to it. The Laredo Firefighters' Retirement System administers the retirement system for the City of Laredo Firefighters employees. Laredo Transit Management, Inc. Under the authority of Revised Texas Civil Statues, Article 118(z) on September 8, 1987, created Laredo Municipal Transit System, The Laredo Municipal Transit System and “Mass Transit Board”. The Laredo Transit Management, Inc. reports to the Mass Transit Board. L.M.T.S. is commonly referred to as El Metro.
43
The primary function and purpose of Laredo Transit Management, Inc. is to operate, maintain, design, and construct a safe, reliable, cost effective and efficient public transportation system that will meet the changing needs of our community, while complying with applicable state and federal mandates, including the Texas Clean Air Act and the Americans with Disabilities Act. Laredo Transit Management, Inc. provides both a fixed-route and Paratransit (El Lift) services within the city boundaries of Laredo. Currently, the fixed-route service is comprised of 22 bus routes. The fixed route bus service has a total of 35 buses operating during a regular workday, 30 buses on a Saturday and 18 buses on Sunday. The Laredo Transit Management, Inc. bus fleet consists of 47 buses and 1 rubber-tire trolley. The El Lift program has a total fleet of 21 Paratransit vans that are equipped with ADA bus lifts. Laredo Transit Management, Inc. is reported as an enterprise fund. Laredo Convention and Visitors' Bureau The Laredo Convention and Visitors' Bureau was established in April 1993 to engage in visitor promotion and to solicit and service conventions and other related group businesses generating overnight stays in the City, thereby enhancing and developing the economy of the City. Laredo Convention and Visitors' Bureau operations are reported as special revenue funds. Keep Laredo Beautiful – Keep Laredo Beautiful’s mission is to empower the citizens of Laredo through education to take responsibility for enhancing their community and its environment through litter prevention, beautification, community improvement and minimization of the impact of solid waste. It is recognized by the Internal Revenue Service as a 501 (c)(3) charitable organization. Laredo Public Facilities Corporation - La Terraza, LLC. The Laredo Public Facilities Corporation (LPFC) - La Terraza, LLC was organized exclusively for the purpose of assisting the City in financing, refinancing or provide public facilities. The LPFC has the power to finance the acquisition of City obligations issued or incurred in accordance with existing law, to provide for the acquisition, construction, rehabilitation, renovation, repair, equipping furnishing and placement in service of public facilities including multifamily housing facilities. The LPFC is the sole General Partner of the La Terraza at Lomas del Sur, Ltd. Partnership, which operates the La Terraza apartments. The apartments consist of a gated community composed of 128 units in eight (8) Residential Buildings, a Community Center, a Maintenance Building, a Swimming Pool, a Mail Kiosk, a Children’s Playground, and some Picnic areas. Laredo Public Facilities Corporation is reported as a special revenue fund. Sames Auto Arena. The Sames Auto Arena was established in September 2002 to provide entertainment for the entire family, such as concerts, rodeos, and basketball events, to name a few. The 178,000 square foot multi-purpose state of the art facility has a maximum 10,000 seating capacity and is managed by SMG. Sames Auto Arena is reported as a special revenue fund. Max Mandel Golf Course. The Max Mandel Golf Course, a 270 acre signature golf course was built in 2012 to provide additional recreational activities for local and out of town golf enthusiasts. The 18 hole facility has a restaurant, club house, and pro shop. The course is open to the public 7 days a week and is managed by Landscapes Unlimited. Max Mandel is reported as a special revenue fund.
44
Laredo Firefighters' Retirement System The Laredo Firefighters' Retirement System was created under the authority of Article 6243e - Texas Local Firefighters' Retirement Act enacted by the Legislature of the State of Texas. The act established the membership, benefits, credits and administration of certain retirement systems for volunteer or paid firefighters. The Laredo Firefighters' Retirement System administers the retirement system for the City of Laredo Firefighters employees and is included in the financial statements of the City as a component unit. Complete financial statements of the component units can be obtained from the City of Laredo, Financial Services Department offices:
City of Laredo Financial Services Department
P. O. Box 579 Laredo, TX 78042-0579
B. Basis of Accounting The accounting and reporting policies of the City as reflected in the accompanying basic financial statements conform to generally accepted accounting principles (GAAP) for local governmental units as prescribed by the Governmental Accounting Standards Board and the American Institute of Certified Public Accountants. The following represent the more significant accounting policies and practices of the City. Government Wide and Fund Financial Statements The government-wide financial statements report information on all of the non-fiduciary activities of the primary government and its component units. The effect of inter-fund activity has been removed from these statements. Governmental activities, which normally are supported by taxes and intergovernmental revenues, are reported separately from business activities. Business-type activities rely to an extent on fees and charges for support. The primary government is reported separately for certain legally separate component units for which the primary government is financially accountable. Program Revenues and Direct Expenses - The Statement of Activities demonstrates the direct expenses of a given function or segments offset by program revenues. A direct expense is specifically associated with a service, program, or department and is clearly identifiable to a particular function. In the Statement of Activities, certain indirect expenses are reported in the program expenses. Program revenue derives directly from the program itself or from parties outside the reporting government’s taxpayers or citizenry. Program revenues include charges to customers or applicants who purchase, use, or directly benefit from goods, services, or privileges provided by a given City function or segment. Program revenues also include grants and contributions that are limited to meeting the operational or capital requirements of a particular program. Taxes and other items not included among program revenue are reported as general revenue. Fund Accounting The accounts of the City are organized on the basis of funds, each of which is considered to be a separate accounting entity. The operations of each fund are accounted for with a separate set of self-
45

balancing accounts that comprise its assets, liabilities, fund equity, revenues and expenditures or expenses, as appropriate. Government resources are allocated to and accounted for in individual funds based upon the purposes for which they are to be spent and the means by which spending activities are controlled. The City maintains the following fund types: Governmental Funds Governmental funds are those through which most governmental functions of the City are financed. The acquisition, use and balances of the City's expendable financial resources and the related current liabilities (except those, if any, which should be accounted for in proprietary funds) are accounted for through governmental funds. The measurement focus is upon determination of financial position and changes in financial position, rather than upon net income determination. The City maintains the following governmental fund types: General Fund - The General Fund is the general operating fund of the City. It is used to account for and report all financial resources not accounted for and reported in another fund. Special Revenue Funds - Special Revenue Funds are used to account for and report the proceeds of specific revenue sources that are restricted or committed to expenditures for specific purposes other than debt service or capital projects. Proceeds of specific revenue sources established that one or more specific restricted or committed revenues should be the foundation for a special revenue fund. The restricted or committed proceeds of specific revenue sources should be expected to continue to comprise a substantial portion of the inflows reported in the fund. Special revenue funds should not be used to account for resources held in trust for individuals, private organizations or other governments. Debt Service Fund - The Debt Service Funds are used to account for and report financial resources that are restricted, committed or assigned to expenditure for principal and interest. Capital Projects Funds - Capital Projects Funds are used to account for and report financial resources that are restricted, committed or assigned to expenditures for capital outlays, including the acquisition or construction of capital facilities and other capital assets. Capital projects funds exclude those types of capital-related outflows finance by proprietary funds or for assets that will be held in trust for individuals, private organizations or other governments. Permanent Funds – Permanent funds are only used to account for and report resources that are restricted to the extent that only earnings and not principal may be used for purposes that support the reporting government’s programs for the benefit of the government or its citizenry. Proprietary Funds Proprietary funds are used to account for the City's ongoing operations that are financed and operated in a manner similar to private business enterprises - where the determination of net income, financial position, and cash flows are necessary or useful for sound financial administration. Goods or services from such activities can be provided either to outside parties (enterprise funds) or to other departments or agencies primarily within the government (internal service funds).
46
Enterprise Funds - Enterprise Funds are used to account for operations that (1) are financed and operated in a manner similar to private business enterprises where the intent of the City Council is that the cost (expenses including depreciation) of providing goods or services to the general public on a continuing basis be financed or recovered primarily through user charges or (2) where the City Council has decided that periodic determination of revenues earned, expenses incurred, and net income is appropriate for capital maintenance, public policy, management control, accountability, or other purposes. Internal Service Funds - Internal Service Funds are used to account for the financing of goods or services provided by one City department or agency to other City departments or agencies or to other governmental units on a cost-reimbursement basis. Fiduciary Funds – These funds are used to account for assets held by the City in a trustee capacity or as an agent for individuals, private organizations, other governmental units, and other funds. Trust Funds - These funds are accounted for in the same manner as proprietary funds with the measurement focus on determination of net income and capital maintenance. The City is custodian to funds contributed into the fund; funds are used toward annuity payments. The City has two trust funds: Firefighters Retirement System, and City Annuity. Agency Fund - The Agency Fund is used to account for funds where the City’s role is purely custodial. All assets reported in an agency fund are offset by a liability to the party on whose behalf they are held and do not involve measurement of results of operations. Currently, the City has three Agency fund: Payroll Clearing, Police Retirees Dependent’s, and Fire Retirees Dependent’s Fund Measurement Focus, Basis of Accounting, and Financial Statement Presentation The government-wide financial statements are reported using the economic resources measurement focus and the accrual basis of accounting. Economic resources measurement focus reports all inflows, outflows, and balances affecting or reflecting an entity’s net position. Accrual basis accounting is the method that recognizes the financial effect of transactions, events, and inter-fund activities when they occur, regardless of the timing of related cash flows. Property taxes are recognized as revenues in the year for which they are levied while the organization recognizes grant revenue as soon as all eligibility requirements obligatory have been met. Governmental fund financial statements are reported using the current financial resources measurement focus and the modified accrual basis of accounting. Revenues are recognized when measurable and available. "Measurable" means that the amount of the transaction can be determined, and "available" means collectible within the current period or soon enough thereafter to be used to pay liabilities of the current period. The City considers property tax revenues to be available if they are collected within 60 days of the end of the current fiscal period. Expenditures are generally recognized under the modified accrual basis of accounting when the related fund liability is incurred. An exception to this general rule is principal and interest on general long-term obligations, compensated absences, and claims and judgments which are recognized when due. Property taxes, franchise taxes, licenses, and interest associated with the current fiscal period are all considered to be susceptible to accrual and are recognized as revenues of the current fiscal period.
47
Sales taxes collected and held by the state at year-end on behalf of the government are also recognized as revenue. All other revenue items are considered to be measurable and available when they are received. The City reports the following as major governmental funds: General Fund is the general operating fund of the City. It is used to account for and report all financial resources not accounted for and reported in another fund. Debt Service Fund is used to account for and report financial resources that are restricted, committed or assigned to expenditure for principal and interest. The City reports the following as major proprietary funds: Bridge System Fund is used to account for toll proceeds from four international bridges and the related operations, maintenance, and debt service. Water Works System Fund is used to account for the operations, maintenance, and debt service from three water treatment plants and seventeen booster stations and the related revenue received from 74,097 customers. Sewer System Fund is used to account for the operations, maintenance, and debt service of the City’s five sewage treatment plants and its related revenue received from 77,523 customers. Solid Waste Fund is used to account for the landfill and recycling center operations and revenues collected from garbage collections, landfill fees, and Federal and State Mandate fees. Additionally, government-wide reports for proprietary funds include the following fund type: Internal Service Funds are used to provide fleet services to other funds, provide services associated with the City’s partially self-funded health benefits program, provide services associated with the risk management for all city property including workman’s compensation, and provide telecommunication services to all funds on a cost-reimbursement basis. As a general rule, the effect of inter fund activity has been eliminated from the government-wide financial statements. Exceptions to this general rule are payments-in-lieu of taxes and other charges between the City’s water and sewer functions and various other functions of government. Proprietary funds distinguish operating revenues and expenses from non-operating items. Operating revenues and expenses result from providing services and producing and delivering goods in connection with a proprietary fund’s principal operations. The principal operating revenues of the enterprise funds and of the government’s internal service funds are charges to customers for sales and services. Operating expenses for enterprise funds and internal service funds include the cost of sales and services, administrative expenses, and depreciation on capital assets. All revenues and expenses not meeting this definition are reported as non-operating revenues and expenses. When both restricted and unrestricted resources are available for use, it is the government’s policy to use restricted resources first, and then unrestricted resources as they are needed.
48
C. Budgets and Budgetary Accounting The City adheres to the following procedures in establishing the operating budgets reflected in the basic financial statements: (1) Sixty (60) days prior to the beginning of each fiscal year, the City Manager submits to the City Council a proposed budget for the fiscal year beginning October 1st. This budget is required to include expenditures by office, department, and agency and the means of financing them. Proposed short and long range capital expenditures and bonded debt requirements must also be included. (2) Public hearings are conducted at which all interested parties may comment concerning the proposed budget. (3) Council adopts the budget on or before the last day of the month of the fiscal year currently ending through passage of an appropriation ordinance and tax levy ordinance. If the City Council fails to adopt the budget at that time, the budget of the previous year is deemed to be adopted. (4) Annual appropriated budgets are legally adopted for the General Fund, Special Revenue Funds, Capital Project Funds, Debt Service Fund, and Proprietary Funds. A comparison of budget to actual is presented in the Basic Financial Statements for the General Fund. (5) The City Charter identifies various allowable amendments to the budget after adoption. Supplemental Appropriations are allowed if the City Manager certifies that there are, available for appropriation, revenues in excess of those estimated in the budget and Council by ordinance and after a formal inquiry has established a need for the supplemental appropriation. Emergency Appropriations are allowed to meet a public emergency affecting life, health, property, or the public peace of the City through an emergency ordinance if there are available un-appropriated revenues. Decreases in the amount of appropriations are allowed if revenues available are insufficient to meet the amount appropriated. Transfer of Appropriations is allowed. Several supplementary appropriations were necessary during the year primarily to adjust the total budget for grants received from various federal and state agencies. (6) The City Council approval is required in order to transfer un-appropriated balances from one department, office, or agency to another. The City Manager has the authority, without City Council approval, to transfer appropriation balances from an expenditure account to another within a department, office, or agency of the City. The reported budgetary data has been revised for amendments authorized during the year. (7) Each appropriation, except those for capital expenditures, shall lapse at the close of the fiscal year to the extent it has not been expended or encumbered. Certain differences exist between the basis of accounting for budgetary purposes and that used for reporting in accordance with generally accepted accounting principles. D. Encumbrances Encumbrances represent commitments related to unperformed (executed) contracts for goods or services. Encumbrance accounting, under which purchase orders, contracts, and other commitments
49
for the expenditure of monies are recorded in order to reserve that portion of the applicable appropriation, is used in the governmental funds. Encumbrances outstanding at year-end are reported as part of the committed fund balances since the commitments will be honored during the subsequent year and, accordingly, do not constitute expenditures or liabilities. For budgetary purposes, appropriations lapse at year-end except for that portion related to encumbered amounts. For financial purposes, the original budget also includes actual appropriation amounts automatically carried over from prior years to cover prior-year encumbrances. Please see Note 16 for significant encumbrances. E. Equity in Investment Pool Cash balances of all City funds (except for the Laredo Firefighters' Retirement System) are pooled and invested. The Equity in Investment Pool consists of cash in bank accounts, which are pooled and allocated to all funds. Investments purchased with pooled cash consisting of Investment Pools, U.S. Government obligations, U.S. Agency obligations, and Mortgage Backed Securities are recorded at fair value in accordance with GASB Statement 31 - Accounting and Financial Reporting for Certain Investments and for External Investment Pools and are classified as “Investments” in the accompanying combined balance sheet. Interest earned on investments purchased with pooled cash is allocated monthly to each participating fund based upon the fund's average month equity balance. Funds that incur a negative balance in equity in pooled investments are reclassified as Due to Other Funds in the financial statements and are not allocated any interest earnings or charged interest expense. F. Investments The City can legally invest in certificates of deposit, repurchase agreements, obligations of the U.S. Government and its Agencies or instrumentality and State obligations all of which are recorded at fair value in accordance with GASB Statement 72 – Fair Value Measurement and Application. G. Inventories Inventories are valued at cost, which approximates market, using the first-in first-out method, and the average cost method as appropriate. The costs of governmental fund-type inventories are recorded as expenditures when consumed rather than when purchased. H. Restricted Assets The International Toll Bridge System, Water System, and Sewer System revenue bond indentures require that, during the period the bonds are outstanding, the City must maintain certain separate accounts and funds to account for the proceeds from the issuance of the revenue bonds and the debt service deposits made from revenues. These restricted assets can be used only in accordance with the revenue bond indenture to pay the debt service payments on such bonds.
50
I. Property, Plant, Equipment, and Infrastructure Property, plant, and equipment owned by the City are stated at historical cost. Maintenance and repairs are charged to operations as incurred, and improvements of $5,000 or more, which extend the useful life of a capital asset, are capitalized. Currently, the City’s policy has a threshold of $5,000 for equipment and $25,000 for infrastructure. The straight-line method is used to calculate the depreciation for all capital assets over the estimated useful life:
Utility Funds: Plant 50 years
25-50 years Other machinery and equipment 1 - 25 yearsAll Other Funds: Buildings and improvements 45 years Machinery and equipment 3 - 10 years Vehicles 6 years Streets 25 years Bridges 25 years Airport runways 25 years Boat ramps 25 years Storm Drainage 25 years Landfill 25 years
Transmission and distribution system
The City’s Infrastructure acquired prior to June 30, 1980, is included. When property, plant, and equipment are retired from service, or otherwise disposed of, a gain or loss on disposal of assets is recognized. In accordance with GASB Statement 72-Fair Value Measurement and Application, donated capital assets, donated works of arts, and capital assets received in a service concession agreement are reported at acquisition value. J. Net Position Net position represents the difference between assets and liabilities. Net investment in capital assets is the net of accumulated depreciation, reduced by the outstanding balances of any borrowing used for the acquisition, construction or improvements of those assets, and adding back unspent proceeds. Net position is reported as restricted when there are limitations forced on their use either through enabling legislations adopted by the City or through external restrictions imposed by creditors, grantors or regulations of other governments. K. Deferred Inflows/Outflows of Resources Deferred inflows of resources represent an acquisition of net position that applies to a future period(s) and so will not be recognized as an inflow or resources (revenue) until that time. Deferred outflows of resources represent a consumption of net position that applies to a future period(s) and so will not be recognized as an outflow of resources (expense/expenditure) until then.
51
The breakdowns of deferred inflows/outflows are as follows:
Governmental Business Type
Activities Activities Total
Deferred Outflows of Resources
Deferred outflows from pension activities
Difference in projected & actual earnings $ 34,867,837 $ 681,651 $ 35,549,488
Contributions after measurement date 23,568,451 8,988,734 32,557,185
Change in assumptions 16,503,226 - 16,503,226
Change in assumptions - OPEB 44,067,321 - 44,067,321
Unamortized advance refunding loss from bonds 2,868,208 16,252,635 19,120,843
Total Deferred Outflows of Resources $ 121,875,043 $ 25,923,020 $ 147,798,063
Deferred Inflows of Resources
Deferred inflows from pension activities
Difference in expected and actual experience $ 5,422,464 $ 238,881 $ 5,661,345
Difference in projected & actual earnings - OPEB 9,616,853 - 9,616,853
Change in assumptions-OPEB 12,435,823 - 12,435,823
Unamortized deferred gain on refunding bonds 1,785,429 - 1,785,429
Total Deferred Inflows of Resources $ 29,260,569 $ 238,881 $ 29,499,450
L. Long-Term Obligations The City has issued combination tax and special revenue (water, sewer, paving assessments, hotel-motel, airport revenues, mass transit, parking system, and public property finance contractual obligations) certificates of obligation, which it intends to repay from a combination of revenues and property taxes. The City identifies the debt service requirements for all general obligation bonds and all combination tax and special revenue certificates of obligation and reduces the property tax levy by surplus revenues (if any) from the above-mentioned sources. GASB Statement 34 eliminates the presentation of the General Long Term Debt Account Group, but provides that these records to be maintained and incorporates the information into the Governmental column in the government-wide Statement of Net Position. General obligation and all combination tax and special revenue certificate of obligation debt is recorded exclusively in the General Long Term Debt, and it is counted towards the legal debt limit of the City. Any proceeds from issuance of general obligation and combination certificates of obligation, which are used for construction of governmental and business type capital assets, are recorded as bond proceeds in the governmental funds and business type funds.
52
Revenue bonds, which have been issued to fund capital projects of business type and governmental type funds, are to be repaid from net revenues of the business type and governmental funds. Debt related to business type projects are recorded in the business type funds. M. Compensated Absences City employees are granted vacation and sick leave hours at varying rates based on the number of years employed. Employees are paid accumulated vacation hours up to a maximum of 480 hours upon termination or retirement. Sick leave hours are paid up to a maximum of 720 hours upon retirement. Amounts of vested or accumulated vacation leave that are not expected to be liquidated with available financial resources are accounted as a general long-term debt for internal purposes only. Accumulated vacation leave of enterprise funds are recorded as an expense and liability of those funds as the benefits accrue to employees. No liability is recorded for non-vesting accumulating rights to receive sick pay benefits except as noted above. N. Federal and State Grants and Entitlements Grants and entitlements may be accounted for within any of the three fund types. The purpose and requirements of each grant or entitlement are carefully analyzed to determine the proper fund type in which to record the related transactions. Grants and entitlements received for purposes normally financed through a particular fund type may be accounted for in that fund type provided that applicable legal restrictions can be appropriately satisfied. Capital grants restricted for capital acquisitions or construction projects are accounted for in the applicable Capital Project Funds. Revenues received for operating or for capital expenditure purposes of Enterprise Funds are recognized in the applicable Enterprise Fund. In prior years, capital contributions, including capital grants received for capital purchases, were recorded as a direct addition to the contributed capital equity account for Proprietary Funds. Beginning in fiscal year 2001, GASB 33 requires contributions of capital grants to be recorded as revenue in the Statement of Revenue, Expense, and Changes for Fund Net Position for Proprietary Funds. O. Interfund Transactions Transactions between funds that would be treated as revenues, expenditures, or expenses if they involved organizations external to the governmental unit are accounted for as revenues, expenditures, or expenses in the funds involved. Non-recurring or non-routine transfers of equity between funds are reported as additions to or deductions from the fund balance of governmental funds. All other legally authorized transfers are treated as transfers in the basic financial statements and are included in the results of operations of both governmental and proprietary funds. P. Unamortized Bond Issuance Costs Prepaid insurance related to the sale of revenue bonds are amortized over the life of the issue.
53
Q. Statement of Cash Flows For purposes of the statements of cash flows, cash and cash equivalents include cash on hand, equity in the investment pool, and cash with fiscal agent. Governmental entities under GASB 9, as amended by GASB 34, paragraph 105, must use the direct method for Cash Flow presentation. R. Fund Equity The City adopted GASB Statement No. 54 “Fund Balance Reporting and Governmental Fund Type Definitions effective October 1, 2010. Fund balances are classified as nonspendable, restricted, committed, assigned or unassigned in governmental funds. Nonspendable fund balance cannot be spent because of legal or contractual requirements. Restricted fund balances have restrictions for specific purposes which are either imposed externally or by enabling legislation. Committed fund balances can only be used for specific purposes pursuant to constraints imposed by City Council through ordinance. Committed funds cannot be used for other purpose unless it is removed or changed in the same manner by City Council. Assigned fund balances are amounts that are constrained by the City’s intent to be used for a specific purpose, but are neither restricted nor committed. This intent shall be expressed by the City Council. The Assigned fund balance also includes residual positive fund balances that are neither Restricted nor Committed in all governmental funds with the exception of General Fund. Unassigned fund balances include residual positive balance within General Fund or may also include negative balances for any governmental fund type. The City, as per City Charter of the City of Laredo, has set aside 15% of expenditures of the General Fund as a cash reserves or minimum fund balance. If at any time the reserves fall below this threshold, City management will develop a plan, approved by the City Council, to restore the fund balance reserves to 15% of expenditures. Generally, the City would first use committed, followed by assigned before unassigned balances when expenditures are incurred for purposes for which more than one of the classification of fund balance is available. Proprietary funds have three classifications of fund equity: 1) net investment in capital assets, net of related debt; 2) restricted net position; and 3) unrestricted net position. NOTE 2 - RECONCILIATION OF GOVERNMENT-WIDE AND FUND FINANCIAL STATEMENTS A. Explanation of certain differences between the governmental fund balance sheet and the government-wide statement of net position The governmental fund balance sheet includes reconciliation between fund balance-total governmental funds and net position-governmental activities as reported in the government-wide statement of net position. One element of that reconciliation explains that “long–term liabilities include bonds payable, which are not due and payable in the current period and therefore are not reported in the funds.”
54
The details of this $711,196,177 difference are as follows:
Bonds, notes payable, and capital leases $ 223,428,619Accrued interest 1,067,177Compensated absences 38,463,649Elimination of Interfund activity 106,479Net Pension Liability 233,245,893Net Pension Obligations-OPEB 214,884,360Net adjustment to reduce fund balance-total governmental funds to arrive at net position-governmental activities $ 711,196,177
B. Explanation of certain differences between governmental fund statement of revenues, expenditures, and changes in fund balances and the government-wide statements of activities An element of the reconciliation states that “the issuance of long-term debt provides current financial resources to governmental funds, while the repayment of the principal of long-term debt consumes the current financial resources of governmental funds. Neither transaction, however, has any effect on net position. Also, governmental funds report the effect of issuance costs, premiums, discounts, and similar items when debt is first issued, whereas these amounts are deferred and amortized in the statement of activities.” The details of this $2,204,527 difference are as follows:
Debt issued:Bond & Capital lease proceeds $ (15,065,000)Premiums (1,198,228) Repayments:Bond & Notes payments 17,995,221Capital lease 472,534
Net adjustment to decrease net changes in fundbalances-total governmental funds to arrive at changes in net position of governmental activities $ 2,204,527
An element of the reconciliation states that for governmental funds, capital outlay should be reported as expenditures. In the statement of activities, “the cost of these assets is allocated over their estimated useful lives and reported as depreciation expense.” The amount of capital outlays exceeding depreciation in this fiscal year were $846,421. The details of this are as follows:
Assets that were purchased and capitalized in the current year $ 41,149,078Assets that were disposed during the current fiscal year (271,477)Current year depreciation (40,031,180)Amount by which capital outlays exceed depreciation $ 846,421
55
NOTE 3 - FUND DEFICITS The following is a list of the unassigned deficit fund balances in the Non-Major Governmental Funds: Block Grants $1,771,987; Emergency Shelter $289,014; Financial Task Force $2,564; 911 Emergency Communications $1,239,391; Health Fund $1,639,288; Parks Capital Grants $115,472; and Capital Grants $442,420. Deficits are due to grant operations and will be recovered through grant reimbursements in the following year. The following is a list of the unassigned deficit fund balances in the Non-Major Governmental Funds not operating as grants: Sames Auto Arena $85,484 and Public Access $3,175. Deficits are a result of operations. The deficit balances will be covered by revenues received next fiscal year from events. NOTE 4 - CASH AND CASH EQUIVALENTS The monetary assets of the City are held in various forms and accounts. These assets are described and presented in the basic financial statements in three groups. One group is described as Cash. This group is characterized as having high liquidity with little market risk and includes cash in bank accounts, petty cash and change funds. Another group is disclosed as Equity in Investment Pool and consists of cash in bank accounts. The third group of monetary assets is presented in the basic financial statements as "Investments". Cash balances of all City funds (except for the Laredo Firefighters Retirement System) are pooled and invested. All securities are reported at fair value in order to comply with GASB Statement 31 - Accounting and Financial Reporting for External Investment Pools. Investments with a remaining maturity at the time of purchase of one year or less are reported at amortized cost. The net decrease in the fair value of the securities was $951,530 for the Laredo Firefighters Retirement System. As of September 30, 2019, cash and cash equivalents consisted of the following:
Petty Cash and Change Fund $ 108,960Cash with Fiscal Agent 897,823Cash in Pooled Funds 3,308,199
$ 4,314,982
Custodial credit risk - deposits. In the case of deposits, this is the risk that in the event of a bank failure, the City’s deposits may not be returned to it. The City’s deposit policy is in compliance with Texas Government Code Chapter 2257 – “Collateral for Public Funds”. All deposits were covered by federal depository insurance up to $250,000 and collateralized with eligible securities in amounts of at least 102% of the book value of deposits. As of September 30, 2019, the book value of all the City’s deposits was $4,314,982. Deposits were properly secured during the fiscal year. Deposits were fully collaterized within one business day. All collateral securities were held by a third party in the City’s name and were not exposed to custodial credit risk. NOTE 5 - INVESTMENTS The City, as per the “Public Funds Investment Act” of the State of Texas, is authorized to invest in obligations of the United States or its agencies and instrumentalities; direct obligations of the State
56
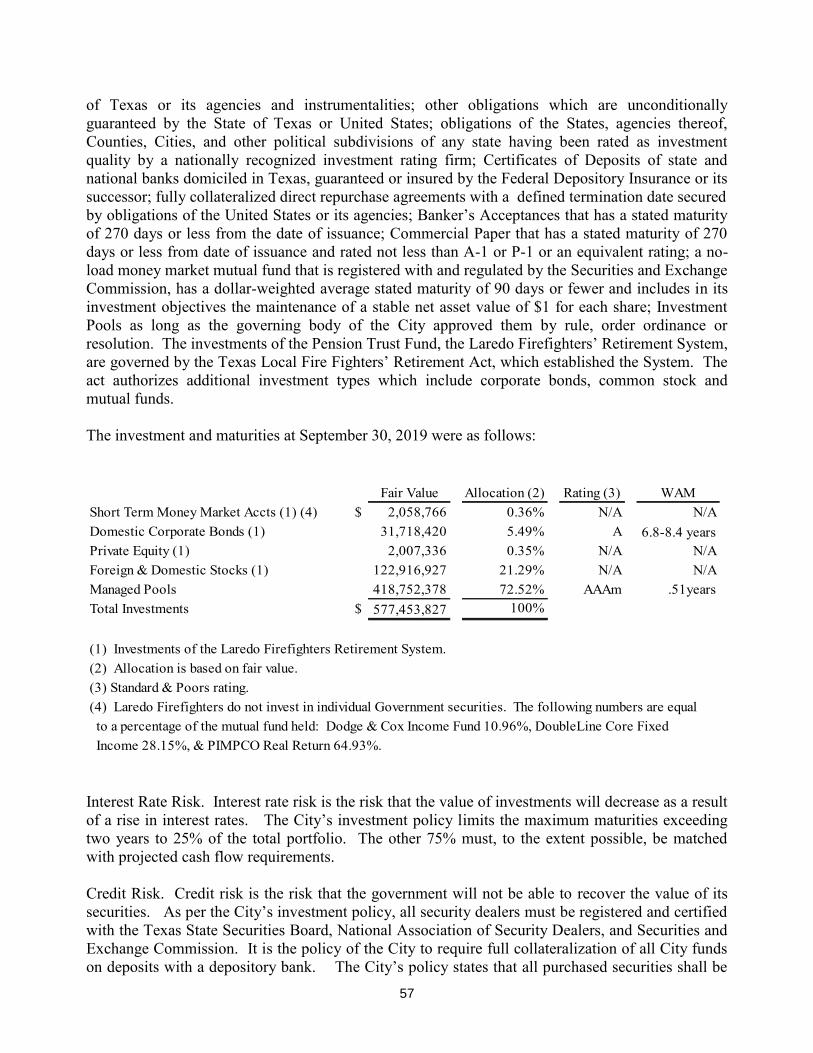
of Texas or its agencies and instrumentalities; other obligations which are unconditionally guaranteed by the State of Texas or United States; obligations of the States, agencies thereof, Counties, Cities, and other political subdivisions of any state having been rated as investment quality by a nationally recognized investment rating firm; Certificates of Deposits of state and national banks domiciled in Texas, guaranteed or insured by the Federal Depository Insurance or its successor; fully collateralized direct repurchase agreements with a defined termination date secured by obligations of the United States or its agencies; Banker’s Acceptances that has a stated maturity of 270 days or less from the date of issuance; Commercial Paper that has a stated maturity of 270 days or less from date of issuance and rated not less than A-1 or P-1 or an equivalent rating; a no-load money market mutual fund that is registered with and regulated by the Securities and Exchange Commission, has a dollar-weighted average stated maturity of 90 days or fewer and includes in its investment objectives the maintenance of a stable net asset value of $1 for each share; Investment Pools as long as the governing body of the City approved them by rule, order ordinance or resolution. The investments of the Pension Trust Fund, the Laredo Firefighters’ Retirement System, are governed by the Texas Local Fire Fighters’ Retirement Act, which established the System. The act authorizes additional investment types which include corporate bonds, common stock and mutual funds. The investment and maturities at September 30, 2019 were as follows:
Fair Value Allocation (2) Rating (3) WAMShort Term Money Market Accts (1) (4) $ 2,058,766 0.36% N/A N/ADomestic Corporate Bonds (1) 31,718,420 5.49% A 6.8-8.4 yearsPrivate Equity (1) 2,007,336 0.35% N/A N/AForeign & Domestic Stocks (1) 122,916,927 21.29% N/A N/AManaged Pools 418,752,378 72.52% AAAm .51yearsTotal Investments $ 577,453,827 100%
(1) Investments of the Laredo Firefighters Retirement System.(2) Allocation is based on fair value.(3) Standard & Poors rating.(4) Laredo Firefighters do not invest in individual Government securities. The following numbers are equal to a percentage of the mutual fund held: Dodge & Cox Income Fund 10.96%, DoubleLine Core Fixed Income 28.15%, & PIMPCO Real Return 64.93%.
Interest Rate Risk. Interest rate risk is the risk that the value of investments will decrease as a result of a rise in interest rates. The City’s investment policy limits the maximum maturities exceeding two years to 25% of the total portfolio. The other 75% must, to the extent possible, be matched with projected cash flow requirements. Credit Risk. Credit risk is the risk that the government will not be able to recover the value of its securities. As per the City’s investment policy, all security dealers must be registered and certified with the Texas State Securities Board, National Association of Security Dealers, and Securities and Exchange Commission. It is the policy of the City to require full collateralization of all City funds on deposits with a depository bank. The City’s policy states that all purchased securities shall be
57
held in safekeeping by either the City, the City’s account in a third-party financial institution, or the City’s safekeeping account at its designated depository bank. The Laredo Firefighters’ Retirement System, as per their investment policy, is allowed to invest in other types of investments such as mutual funds and common stock. As of September 30, 2019, the Laredo Firefighters Retirement System had the following Corporate Bonds subject to interest and credit risk: iShares U.S. Aggregate Bond Index Fund and PIMCO Real Return Fund. Concentration of Credit Risk. Concentration of credit risk is the risk of loss attributed to the magnitude of a government’s investment in a single issuer. As per the City’s investment policy, no more than 50% of the City’s total investment portfolio will be invested in a single security type, with the exception of U.S. Treasury securities. Of the City’s total investments, 100% were invested in Local Government Investment Pools and Bank Certificates of Deposit. Of the Firefighters’ Retirement System investments, 21% were invested in mutual funds and 79% in equities. Custodial Credit Risk. For an investment security, custodial credit risk is the risk that in the event of a failure of the counterparty the City will not be able to recover the value of its investments or collateral securities that are in the possession of an outside party. As of September 30, 2019, the City had no repurchase agreements. The City’s investment policy dictates that a third party financial institution, designated by the City, shall be the holder of the City’s investment securities. The Firefighters’ Retirement System investments are not exposed to custodial credit risk because all securities are held by the System’s custodial bank in the System’s name. GASB Statement No. 72 requires investments to be measured at fair value. Fair value is defined as price that would be received when an asset is sold or paid to transfer a liability in an orderly transaction between market participants at the measurement date. This Statement established a hierarchy of inputs to measure the fair value that prioritizes the inputs into the following three categories: Level 1 – Quoted prices for identical assets or liabilities in active markets that can be accessed at the measurement date. Level 2 – Inputs that are observable (other than the quoted prices included in Level 1) either directly or indirectly for the asset or liability. Level 3 – Unobservable inputs for the asset or liability.
58
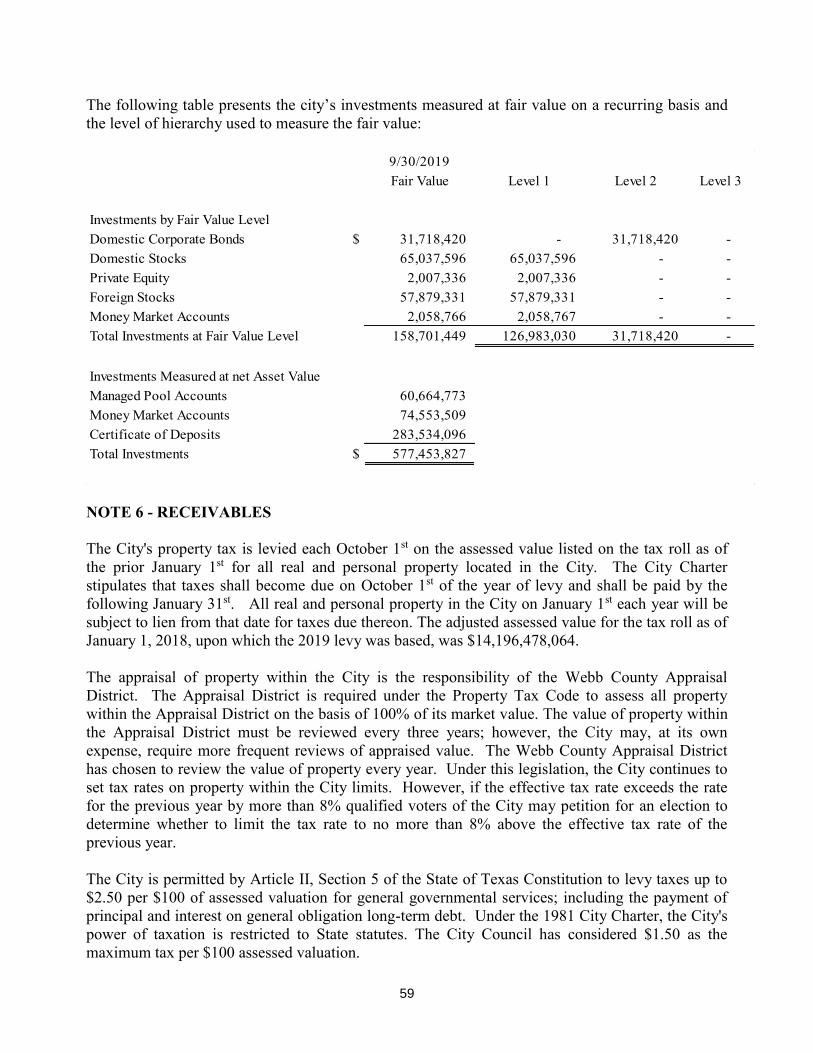
The following table presents the city’s investments measured at fair value on a recurring basis and the level of hierarchy used to measure the fair value:
9/30/2019Fair Value Level 1 Level 2 Level 3
Investments by Fair Value LevelDomestic Corporate Bonds $ 31,718,420 - 31,718,420 - Domestic Stocks 65,037,596 65,037,596 - - Private Equity 2,007,336 2,007,336 - - Foreign Stocks 57,879,331 57,879,331 - - Money Market Accounts 2,058,766 2,058,767 - - Total Investments at Fair Value Level 158,701,449 126,983,030 31,718,420 -
Investments Measured at net Asset ValueManaged Pool Accounts 60,664,773 Money Market Accounts 74,553,509 Certificate of Deposits 283,534,096 Total Investments $ 577,453,827
NOTE 6 - RECEIVABLES The City's property tax is levied each October 1st on the assessed value listed on the tax roll as of the prior January 1st for all real and personal property located in the City. The City Charter stipulates that taxes shall become due on October 1st of the year of levy and shall be paid by the following January 31st. All real and personal property in the City on January 1st each year will be subject to lien from that date for taxes due thereon. The adjusted assessed value for the tax roll as of January 1, 2018, upon which the 2019 levy was based, was $14,196,478,064. The appraisal of property within the City is the responsibility of the Webb County Appraisal District. The Appraisal District is required under the Property Tax Code to assess all property within the Appraisal District on the basis of 100% of its market value. The value of property within the Appraisal District must be reviewed every three years; however, the City may, at its own expense, require more frequent reviews of appraised value. The Webb County Appraisal District has chosen to review the value of property every year. Under this legislation, the City continues to set tax rates on property within the City limits. However, if the effective tax rate exceeds the rate for the previous year by more than 8% qualified voters of the City may petition for an election to determine whether to limit the tax rate to no more than 8% above the effective tax rate of the previous year. The City is permitted by Article II, Section 5 of the State of Texas Constitution to levy taxes up to $2.50 per $100 of assessed valuation for general governmental services; including the payment of principal and interest on general obligation long-term debt. Under the 1981 City Charter, the City's power of taxation is restricted to State statutes. The City Council has considered $1.50 as the maximum tax per $100 assessed valuation.
59
The tax rate to finance general governmental services including the payment and interest on long-term debt for the year ended September 30, 2019 was $.634000 per $100 of assessed valuation ($.488732 for general government and $.145268 for debt service). Thus, the City has a tax margin of approximately $.866000 per $100, and could levy approximately $122,941,500 in additional taxes per year from the present assessed valuation of $14,196,478,064 before the limit is reached. Because of limitations imposed by state law, cases in which accumulated taxes exceed property value, other problems in tax collection and because of the possible uncollectibility of certain other accounts receivable, allowances have been provided for uncollectible accounts resulting in only the net collectible amounts being reflected in the balance sheet. The net receivables and allowances for uncollectible accounts for taxes and other receivables as of September 30, 2019 are reflected in the following table:
Property Hotel/Motel Accured Paving Total Net
Accounts Taxes Taxes Notes Interest Assessment Receivables
Governmental Activities $ 17,133,372 7,957,923 431,997 16,713,558 2,014,701 3,705 44,255,256
Business-Type Funds
Bridge $ - - - - 182,582 - 182,582
Waterworks System 6,606,691 - - 1,242 780,630 - 7,388,563
Sewer System 5,318,382 - - 12,174 588,220 - 5,918,776
Solid Waste 1,736,902 - - - 592,446 - 2,329,348
Other Enterprise Funds 29,630 - - - 43,524 - 73,154
Total Business Type Funds $ 13,691,605 - - 13,416 2,187,402 - 15,892,423
Allowance for Uncollectible $ 63,261,258 62,135 11,970 1,378,888 - 143,225 64,857,476
NOTE 7 - RESTRICTED ASSETS FOR ENTERPRISE FUND TYPES Certain proceeds of enterprise fund revenue bonds, as well as certain resources set aside for their repayment, are classified as restricted assets on the balance sheet because their use is limited by applicable bond covenants. The "revenue bond retirement reserve" is used to report resources set aside to make up potential future deficiencies in the revenue bond current debt service account. The "revenue bond contingency" is used to report resources set aside to subsidize potential deficiencies from the enterprise fund's operation that could adversely affect debt service payments. The "construction account" is used to report those proceeds of bond issuance that are restricted for use in construction. The "water rights" account is used to report revenue received through water availability charges.
60
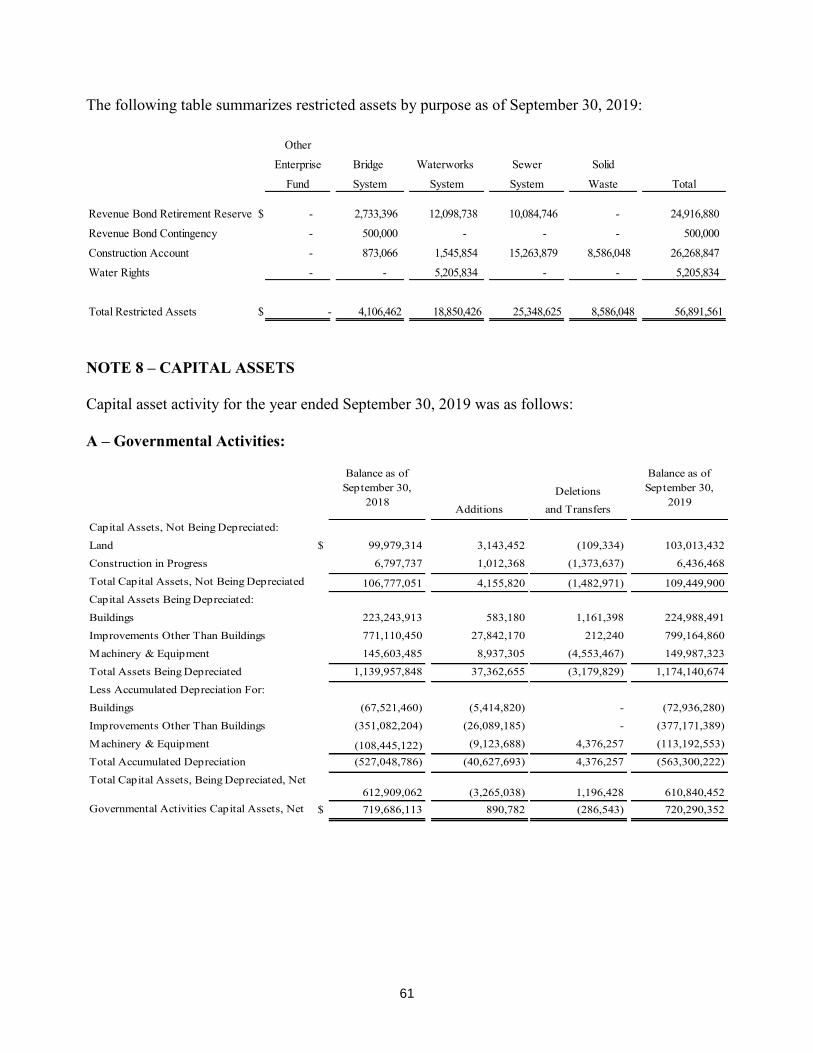
The following table summarizes restricted assets by purpose as of September 30, 2019:
Other
Enterprise Bridge Waterworks Sewer Solid
Fund System System System Waste Total
Revenue Bond Retirement Reserve $ - 2,733,396 12,098,738 10,084,746 - 24,916,880
Revenue Bond Contingency - 500,000 - - - 500,000
Construction Account - 873,066 1,545,854 15,263,879 8,586,048 26,268,847
Water Rights - - 5,205,834 - - 5,205,834
Total Restricted Assets $ - 4,106,462 18,850,426 25,348,625 8,586,048 56,891,561
NOTE 8 – CAPITAL ASSETS Capital asset activity for the year ended September 30, 2019 was as follows: A – Governmental Activities:
Deletions
Additions and Transfers
Capital Assets, Not Being Depreciated:
Land $ 99,979,314 3,143,452 (109,334) 103,013,432
Construction in Progress 6,797,737 1,012,368 (1,373,637) 6,436,468
Total Capital Assets, Not Being Depreciated 106,777,051 4,155,820 (1,482,971) 109,449,900 Capital Assets Being Depreciated:
Buildings 223,243,913 583,180 1,161,398 224,988,491
771,110,450 27,842,170 212,240 799,164,860
Machinery & Equipment 145,603,485 8,937,305 (4,553,467) 149,987,323
Total Assets Being Depreciated 1,139,957,848 37,362,655 (3,179,829) 1,174,140,674
Buildings (67,521,460) (5,414,820) - (72,936,280)
(351,082,204) (26,089,185) - (377,171,389)
Machinery & Equipment (108,445,122) (9,123,688) 4,376,257 (113,192,553)
Total Accumulated Depreciation (527,048,786) (40,627,693) 4,376,257 (563,300,222)
Total Capital Assets, Being Depreciated, Net 612,909,062 (3,265,038) 1,196,428 610,840,452
Governmental Activities Capital Assets, Net $ 719,686,113 890,782 (286,543) 720,290,352
Balance as of September 30,
2019
Improvements Other Than Buildings
Less Accumulated Depreciation For:
Improvements Other Than Buildings
Balance as of September 30,
2018
61
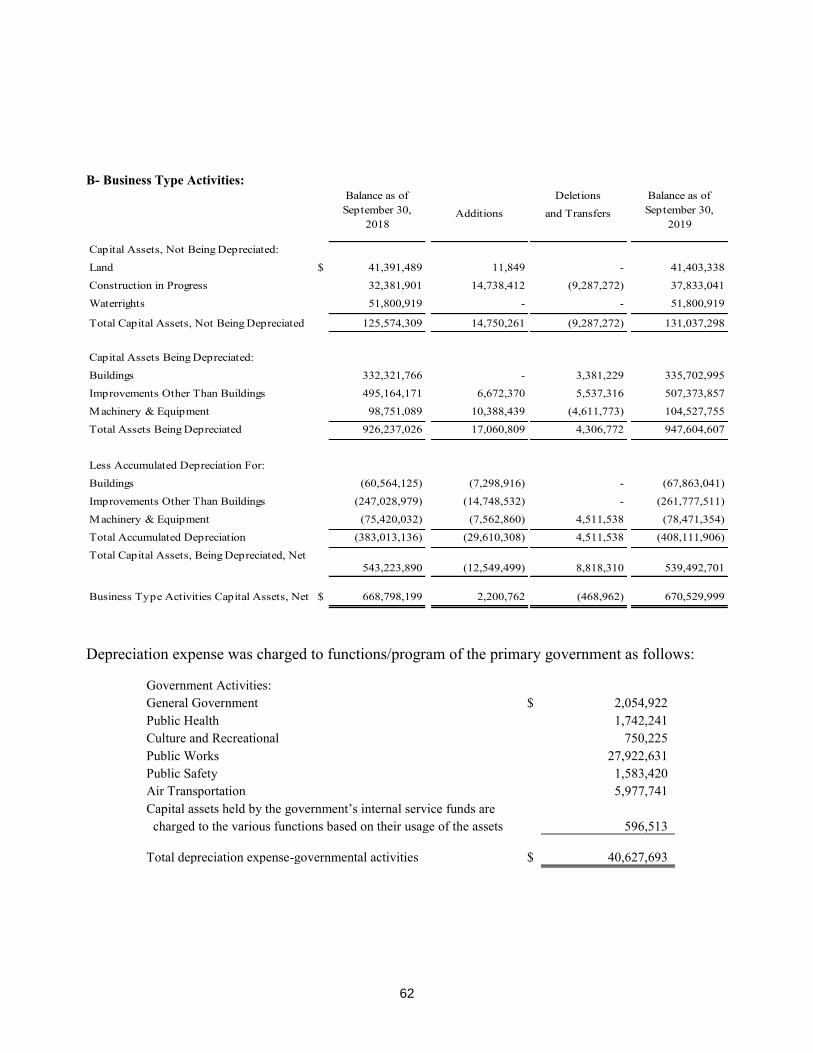
B- Business Type Activities:
Deletions
Additions and Transfers
Land $ 41,391,489 11,849 - 41,403,338
Construction in Progress 32,381,901 14,738,412 (9,287,272) 37,833,041
Waterrights 51,800,919 - - 51,800,919
Total Capital Assets, Not Being Depreciated 125,574,309 14,750,261 (9,287,272) 131,037,298
Capital Assets Being Depreciated:
Buildings 332,321,766 - 3,381,229 335,702,995
495,164,171 6,672,370 5,537,316 507,373,857
Machinery & Equipment 98,751,089 10,388,439 (4,611,773) 104,527,755
Total Assets Being Depreciated 926,237,026 17,060,809 4,306,772 947,604,607
Buildings (60,564,125) (7,298,916) - (67,863,041)
(247,028,979) (14,748,532) - (261,777,511)
Machinery & Equipment (75,420,032) (7,562,860) 4,511,538 (78,471,354)
Total Accumulated Depreciation (383,013,136) (29,610,308) 4,511,538 (408,111,906)
Total Capital Assets, Being Depreciated, Net 543,223,890 (12,549,499) 8,818,310 539,492,701
Business Type Activities Capital Assets, Net $ 668,798,199 2,200,762 (468,962) 670,529,999
Balance as of September 30,
2019
Capital Assets, Not Being Depreciated:
Improvements Other Than Buildings
Less Accumulated Depreciation For:
Improvements Other Than Buildings
Balance as of September 30,
2018
Depreciation expense was charged to functions/program of the primary government as follows:
Government Activities: General Government $ 2,054,922
Public Health
1,742,241 Culture and Recreational
750,225
Public Works
27,922,631 Public Safety
1,583,420
Air Transportation
5,977,741 Capital assets held by the government’s internal service funds are
charged to the various functions based on their usage of the assets
596,513
Total depreciation expense-governmental activities $ 40,627,693
62
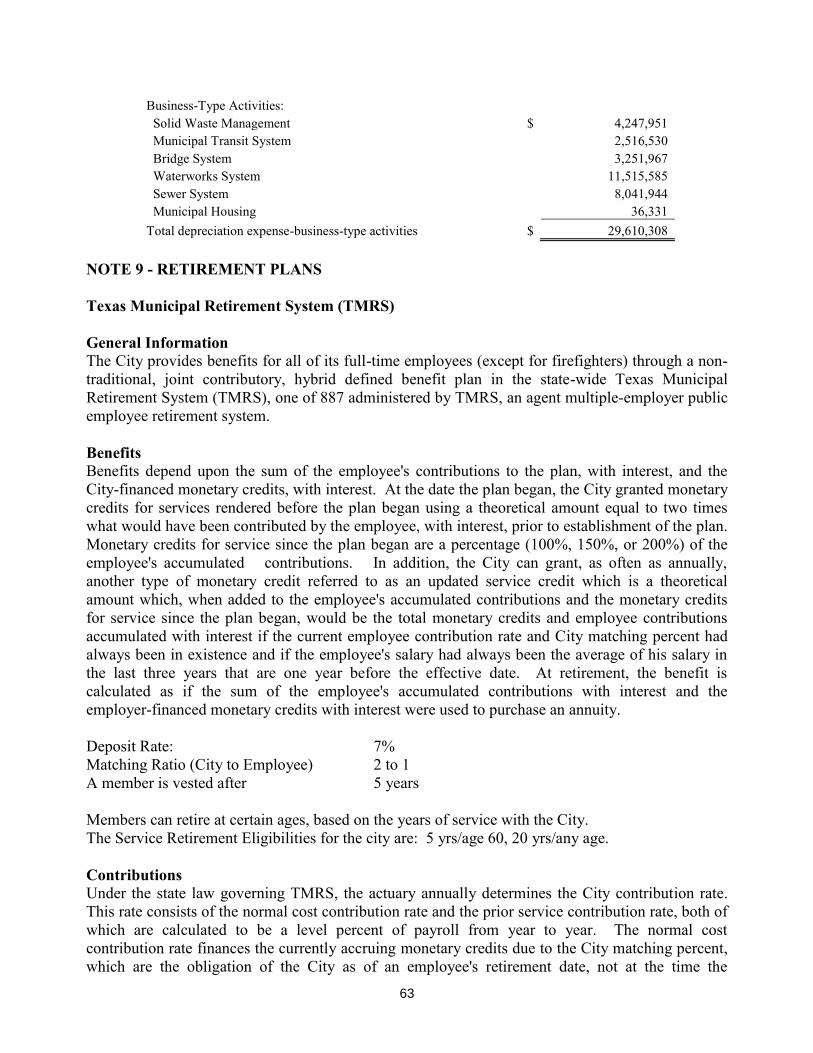
Business-Type Activities: Solid Waste Management $ 4,247,951
Municipal Transit System
2,516,530 Bridge System
3,251,967
Waterworks System
11,515,585 Sewer System
8,041,944
Municipal Housing
36,331 Total depreciation expense-business-type activities $ 29,610,308
NOTE 9 - RETIREMENT PLANS Texas Municipal Retirement System (TMRS) General Information The City provides benefits for all of its full-time employees (except for firefighters) through a non-traditional, joint contributory, hybrid defined benefit plan in the state-wide Texas Municipal Retirement System (TMRS), one of 887 administered by TMRS, an agent multiple-employer public employee retirement system. Benefits Benefits depend upon the sum of the employee's contributions to the plan, with interest, and the City-financed monetary credits, with interest. At the date the plan began, the City granted monetary credits for services rendered before the plan began using a theoretical amount equal to two times what would have been contributed by the employee, with interest, prior to establishment of the plan. Monetary credits for service since the plan began are a percentage (100%, 150%, or 200%) of the employee's accumulated contributions. In addition, the City can grant, as often as annually, another type of monetary credit referred to as an updated service credit which is a theoretical amount which, when added to the employee's accumulated contributions and the monetary credits for service since the plan began, would be the total monetary credits and employee contributions accumulated with interest if the current employee contribution rate and City matching percent had always been in existence and if the employee's salary had always been the average of his salary in the last three years that are one year before the effective date. At retirement, the benefit is calculated as if the sum of the employee's accumulated contributions with interest and the employer-financed monetary credits with interest were used to purchase an annuity. Deposit Rate: 7% Matching Ratio (City to Employee) 2 to 1 A member is vested after 5 years Members can retire at certain ages, based on the years of service with the City. The Service Retirement Eligibilities for the city are: 5 yrs/age 60, 20 yrs/any age. Contributions Under the state law governing TMRS, the actuary annually determines the City contribution rate. This rate consists of the normal cost contribution rate and the prior service contribution rate, both of which are calculated to be a level percent of payroll from year to year. The normal cost contribution rate finances the currently accruing monetary credits due to the City matching percent, which are the obligation of the City as of an employee's retirement date, not at the time the
63
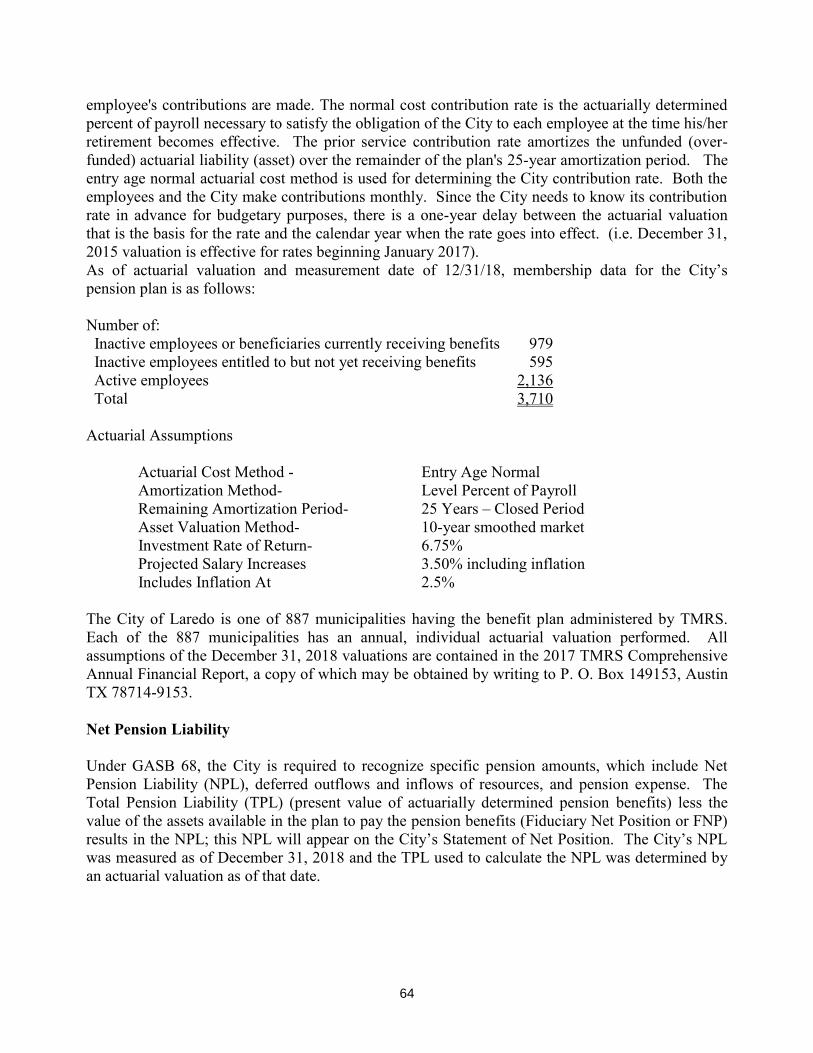
employee's contributions are made. The normal cost contribution rate is the actuarially determined percent of payroll necessary to satisfy the obligation of the City to each employee at the time his/her retirement becomes effective. The prior service contribution rate amortizes the unfunded (over-funded) actuarial liability (asset) over the remainder of the plan's 25-year amortization period. The entry age normal actuarial cost method is used for determining the City contribution rate. Both the employees and the City make contributions monthly. Since the City needs to know its contribution rate in advance for budgetary purposes, there is a one-year delay between the actuarial valuation that is the basis for the rate and the calendar year when the rate goes into effect. (i.e. December 31, 2015 valuation is effective for rates beginning January 2017). As of actuarial valuation and measurement date of 12/31/18, membership data for the City’s pension plan is as follows: Number of: Inactive employees or beneficiaries currently receiving benefits 979 Inactive employees entitled to but not yet receiving benefits 595 Active employees 2,136 Total 3,710 Actuarial Assumptions 0B0BActuarial Cost Method - Entry Age Normal Amortization Method- Level Percent of Payroll Remaining Amortization Period- 25 Years – Closed Period Asset Valuation Method- 10-year smoothed market Investment Rate of Return- 6.75% Projected Salary Increases 3.50% including inflation Includes Inflation At 2.5% The City of Laredo is one of 887 municipalities having the benefit plan administered by TMRS. Each of the 887 municipalities has an annual, individual actuarial valuation performed. All assumptions of the December 31, 2018 valuations are contained in the 2017 TMRS Comprehensive Annual Financial Report, a copy of which may be obtained by writing to P. O. Box 149153, Austin TX 78714-9153. Net Pension Liability Under GASB 68, the City is required to recognize specific pension amounts, which include Net Pension Liability (NPL), deferred outflows and inflows of resources, and pension expense. The Total Pension Liability (TPL) (present value of actuarially determined pension benefits) less the value of the assets available in the plan to pay the pension benefits (Fiduciary Net Position or FNP) results in the NPL; this NPL will appear on the City’s Statement of Net Position. The City’s NPL was measured as of December 31, 2018 and the TPL used to calculate the NPL was determined by an actuarial valuation as of that date.
64
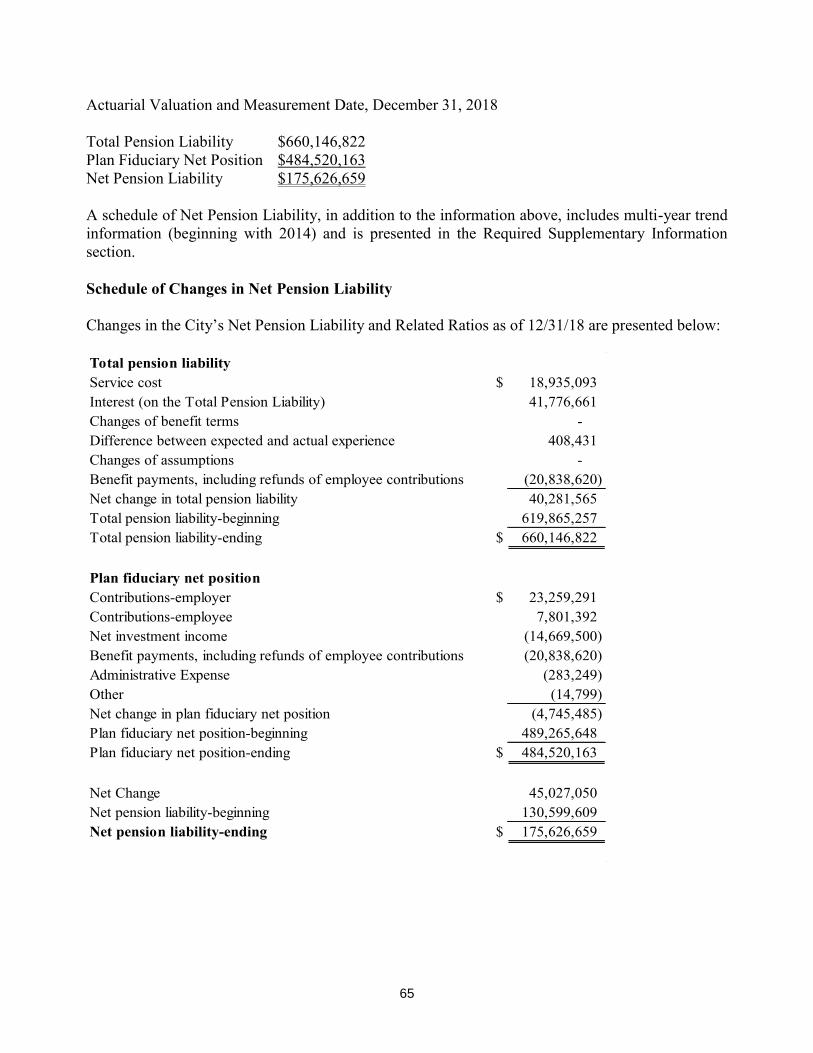
Actuarial Valuation and Measurement Date, December 31, 2018 Total Pension Liability $660,146,822 Plan Fiduciary Net Position $484,520,163 Net Pension Liability $175,626,659 A schedule of Net Pension Liability, in addition to the information above, includes multi-year trend information (beginning with 2014) and is presented in the Required Supplementary Information section. Schedule of Changes in Net Pension Liability Changes in the City’s Net Pension Liability and Related Ratios as of 12/31/18 are presented below: Total pension liabilityService cost $ 18,935,093 Interest (on the Total Pension Liability) 41,776,661 Changes of benefit terms - Difference between expected and actual experience 408,431 Changes of assumptions - Benefit payments, including refunds of employee contributions (20,838,620) Net change in total pension liability 40,281,565 Total pension liability-beginning 619,865,257 Total pension liability-ending $ 660,146,822
Plan fiduciary net positionContributions-employer $ 23,259,291 Contributions-employee 7,801,392 Net investment income (14,669,500) Benefit payments, including refunds of employee contributions (20,838,620) Administrative Expense (283,249) Other (14,799) Net change in plan fiduciary net position (4,745,485) Plan fiduciary net position-beginning 489,265,648 Plan fiduciary net position-ending $ 484,520,163
Net Change 45,027,050 Net pension liability-beginning 130,599,609 Net pension liability-ending $ 175,626,659
65
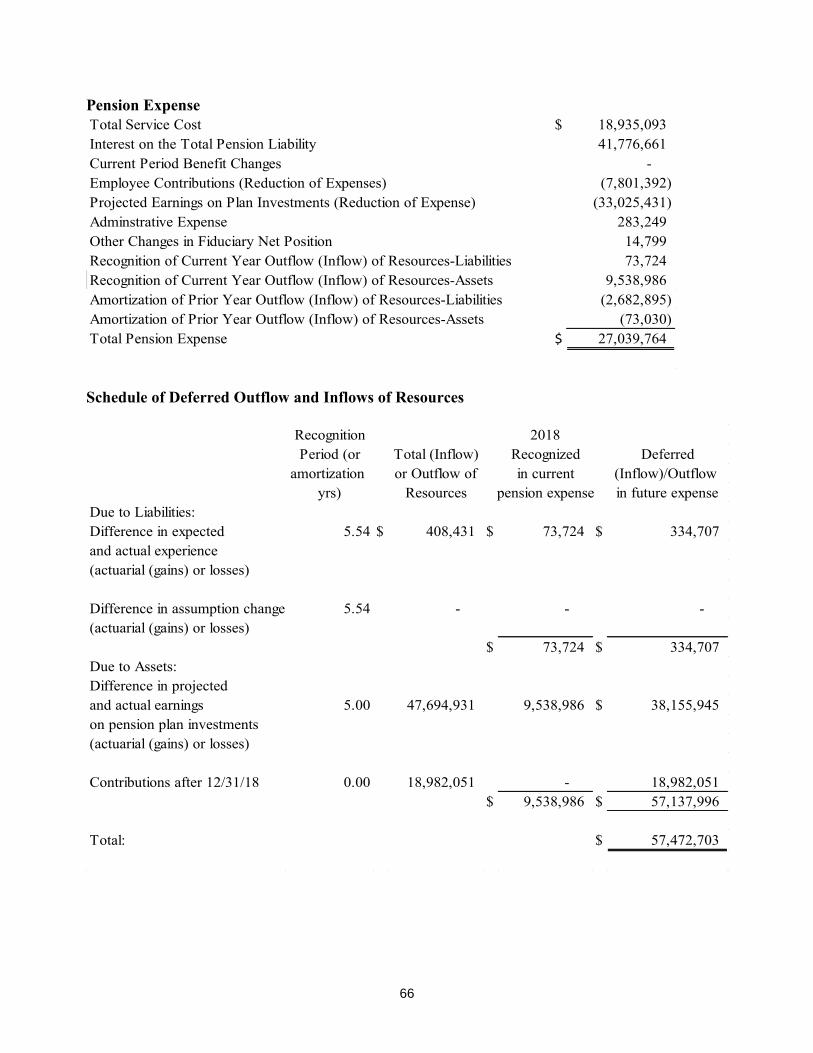
Pension Expense Total Service Cost $ 18,935,093 Interest on the Total Pension Liability 41,776,661 Current Period Benefit Changes - Employee Contributions (Reduction of Expenses) (7,801,392) Projected Earnings on Plan Investments (Reduction of Expense) (33,025,431) Adminstrative Expense 283,249 Other Changes in Fiduciary Net Position 14,799 Recognition of Current Year Outflow (Inflow) of Resources-Liabilities 73,724 Recognition of Current Year Outflow (Inflow) of Resources-Assets 9,538,986 Amortization of Prior Year Outflow (Inflow) of Resources-Liabilities (2,682,895) Amortization of Prior Year Outflow (Inflow) of Resources-Assets (73,030) Total Pension Expense $ 27,039,764
Schedule of Deferred Outflow and Inflows of Resources
Recognition 2018Period (or Total (Inflow) Recognized Deferred
amortization or Outflow of in current (Inflow)/Outflow yrs) Resources pension expense in future expense
Due to Liabilities:Difference in expected 5.54 $ 408,431 $ 73,724 $ 334,707 and actual experience(actuarial (gains) or losses)
Difference in assumption changes 5.54 - - - (actuarial (gains) or losses)
$ 73,724 $ 334,707 Due to Assets:Difference in projectedand actual earnings 5.00 47,694,931 9,538,986 $ 38,155,945 on pension plan investments(actuarial (gains) or losses)
Contributions after 12/31/18 0.00 18,982,051 - 18,982,051 $ 9,538,986 $ 57,137,996
Total: $ 57,472,703
66
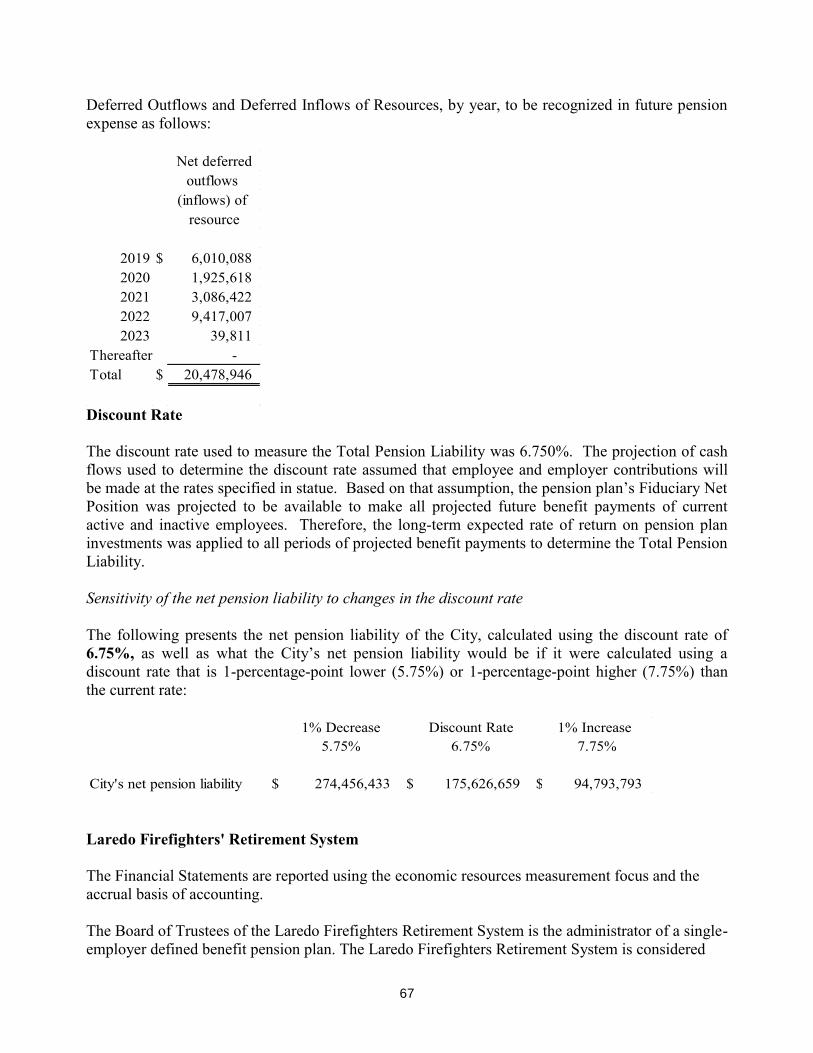
Deferred Outflows and Deferred Inflows of Resources, by year, to be recognized in future pension expense as follows:
Net deferredoutflows
(inflows) of resource
2019 $ 6,010,088 2020 1,925,618 2021 3,086,422 2022 9,417,007 2023 39,811
Thereafter - Total $ 20,478,946
Discount Rate The discount rate used to measure the Total Pension Liability was 6.750%. The projection of cash flows used to determine the discount rate assumed that employee and employer contributions will be made at the rates specified in statue. Based on that assumption, the pension plan’s Fiduciary Net Position was projected to be available to make all projected future benefit payments of current active and inactive employees. Therefore, the long-term expected rate of return on pension plan investments was applied to all periods of projected benefit payments to determine the Total Pension Liability. Sensitivity of the net pension liability to changes in the discount rate The following presents the net pension liability of the City, calculated using the discount rate of 6.75%, as well as what the City’s net pension liability would be if it were calculated using a discount rate that is 1-percentage-point lower (5.75%) or 1-percentage-point higher (7.75%) than the current rate:
1% Decrease Discount Rate 1% Increase 5.75% 6.75% 7.75%
City's net pension liability $ 274,456,433 $ 175,626,659 $ 94,793,793 Laredo Firefighters' Retirement System The Financial Statements are reported using the economic resources measurement focus and the accrual basis of accounting. The Board of Trustees of the Laredo Firefighters Retirement System is the administrator of a single-employer defined benefit pension plan. The Laredo Firefighters Retirement System is considered
67
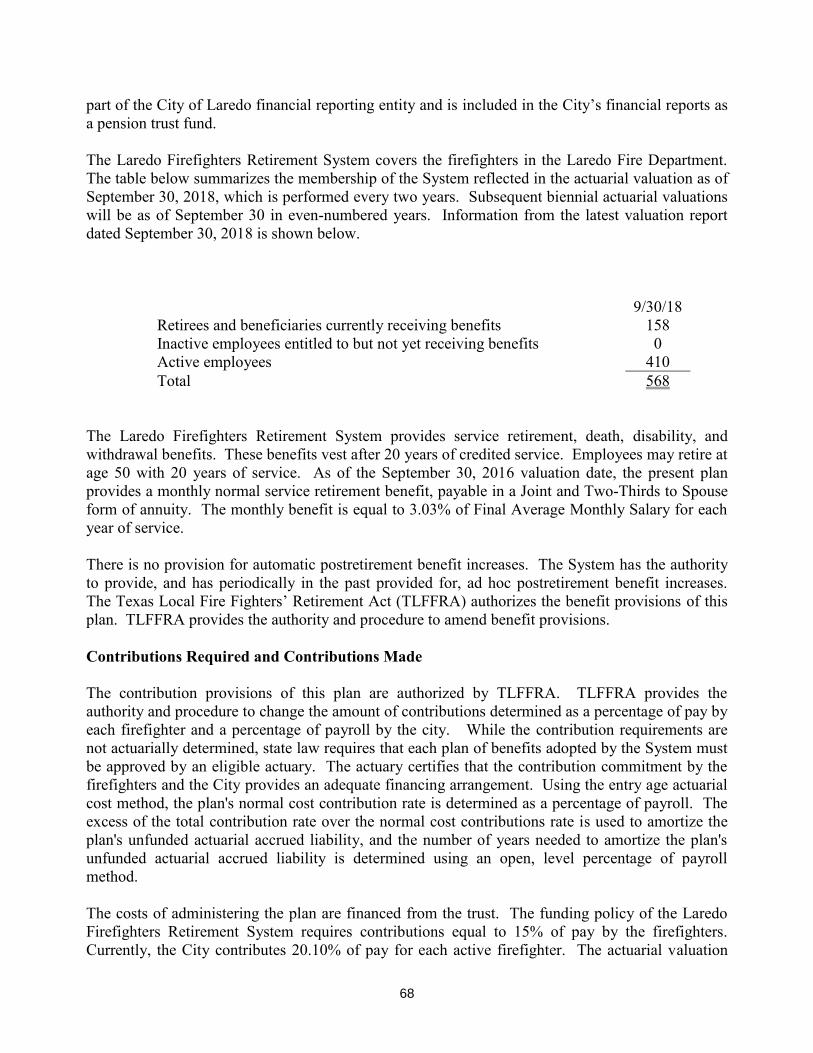
part of the City of Laredo financial reporting entity and is included in the City’s financial reports as a pension trust fund. The Laredo Firefighters Retirement System covers the firefighters in the Laredo Fire Department. The table below summarizes the membership of the System reflected in the actuarial valuation as of September 30, 2018, which is performed every two years. Subsequent biennial actuarial valuations will be as of September 30 in even-numbered years. Information from the latest valuation report dated September 30, 2018 is shown below.
Retirees and beneficiaries currently receiving benefits Inactive employees entitled to but not yet receiving benefits
9/30/18 158 0
Active employees 410 Total 568
The Laredo Firefighters Retirement System provides service retirement, death, disability, and withdrawal benefits. These benefits vest after 20 years of credited service. Employees may retire at age 50 with 20 years of service. As of the September 30, 2016 valuation date, the present plan provides a monthly normal service retirement benefit, payable in a Joint and Two-Thirds to Spouse form of annuity. The monthly benefit is equal to 3.03% of Final Average Monthly Salary for each year of service. There is no provision for automatic postretirement benefit increases. The System has the authority to provide, and has periodically in the past provided for, ad hoc postretirement benefit increases. The Texas Local Fire Fighters’ Retirement Act (TLFFRA) authorizes the benefit provisions of this plan. TLFFRA provides the authority and procedure to amend benefit provisions. Contributions Required and Contributions Made The contribution provisions of this plan are authorized by TLFFRA. TLFFRA provides the authority and procedure to change the amount of contributions determined as a percentage of pay by each firefighter and a percentage of payroll by the city. While the contribution requirements are not actuarially determined, state law requires that each plan of benefits adopted by the System must be approved by an eligible actuary. The actuary certifies that the contribution commitment by the firefighters and the City provides an adequate financing arrangement. Using the entry age actuarial cost method, the plan's normal cost contribution rate is determined as a percentage of payroll. The excess of the total contribution rate over the normal cost contributions rate is used to amortize the plan's unfunded actuarial accrued liability, and the number of years needed to amortize the plan's unfunded actuarial accrued liability is determined using an open, level percentage of payroll method. The costs of administering the plan are financed from the trust. The funding policy of the Laredo Firefighters Retirement System requires contributions equal to 15% of pay by the firefighters. Currently, the City contributes 20.10% of pay for each active firefighter. The actuarial valuation
68
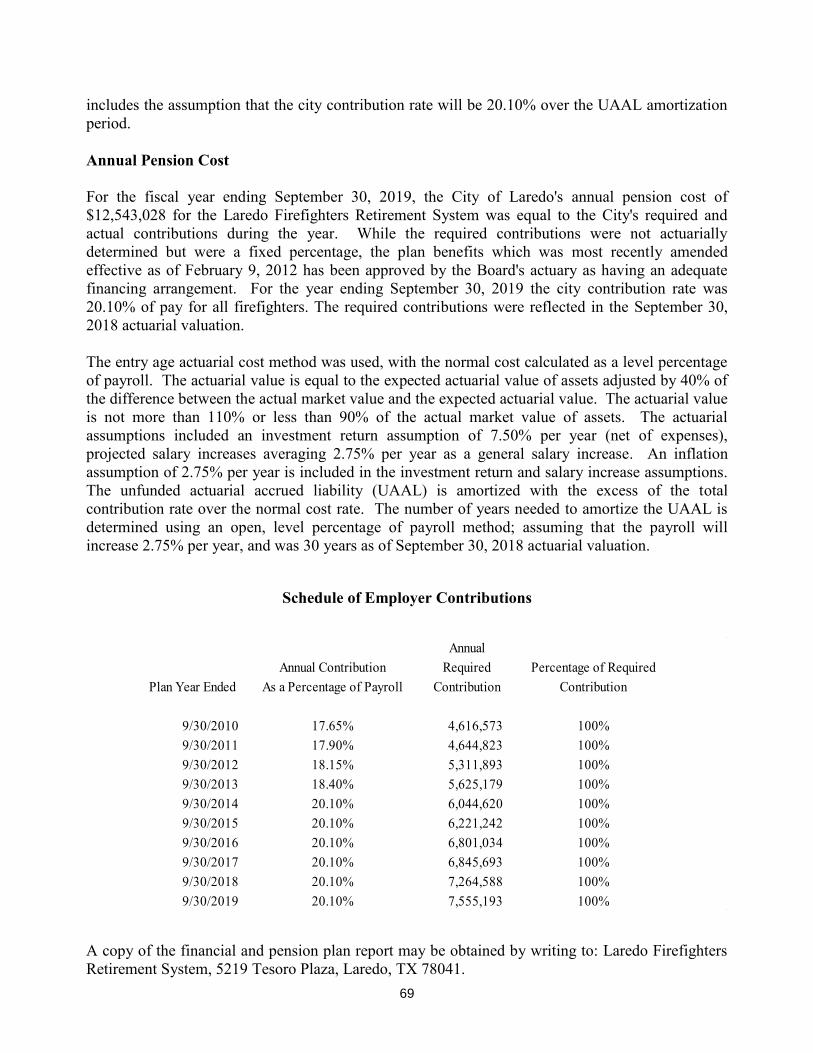
includes the assumption that the city contribution rate will be 20.10% over the UAAL amortization period. Annual Pension Cost For the fiscal year ending September 30, 2019, the City of Laredo's annual pension cost of $12,543,028 for the Laredo Firefighters Retirement System was equal to the City's required and actual contributions during the year. While the required contributions were not actuarially determined but were a fixed percentage, the plan benefits which was most recently amended effective as of February 9, 2012 has been approved by the Board's actuary as having an adequate financing arrangement. For the year ending September 30, 2019 the city contribution rate was 20.10% of pay for all firefighters. The required contributions were reflected in the September 30, 2018 actuarial valuation. The entry age actuarial cost method was used, with the normal cost calculated as a level percentage of payroll. The actuarial value is equal to the expected actuarial value of assets adjusted by 40% of the difference between the actual market value and the expected actuarial value. The actuarial value is not more than 110% or less than 90% of the actual market value of assets. The actuarial assumptions included an investment return assumption of 7.50% per year (net of expenses), projected salary increases averaging 2.75% per year as a general salary increase. An inflation assumption of 2.75% per year is included in the investment return and salary increase assumptions. The unfunded actuarial accrued liability (UAAL) is amortized with the excess of the total contribution rate over the normal cost rate. The number of years needed to amortize the UAAL is determined using an open, level percentage of payroll method; assuming that the payroll will increase 2.75% per year, and was 30 years as of September 30, 2018 actuarial valuation.
Schedule of Employer Contributions
AnnualAnnual Contribution Required Percentage of Required
Plan Year Ended As a Percentage of Payroll Contribution Contribution
9/30/2010 17.65% 4,616,573 100%9/30/2011 17.90% 4,644,823 100%9/30/2012 18.15% 5,311,893 100%9/30/2013 18.40% 5,625,179 100%9/30/2014 20.10% 6,044,620 100%9/30/2015 20.10% 6,221,242 100%9/30/2016 20.10% 6,801,034 100%9/30/2017 20.10% 6,845,693 100%9/30/2018 20.10% 7,264,588 100%9/30/2019 20.10% 7,555,193 100%
A copy of the financial and pension plan report may be obtained by writing to: Laredo Firefighters Retirement System, 5219 Tesoro Plaza, Laredo, TX 78041.
69
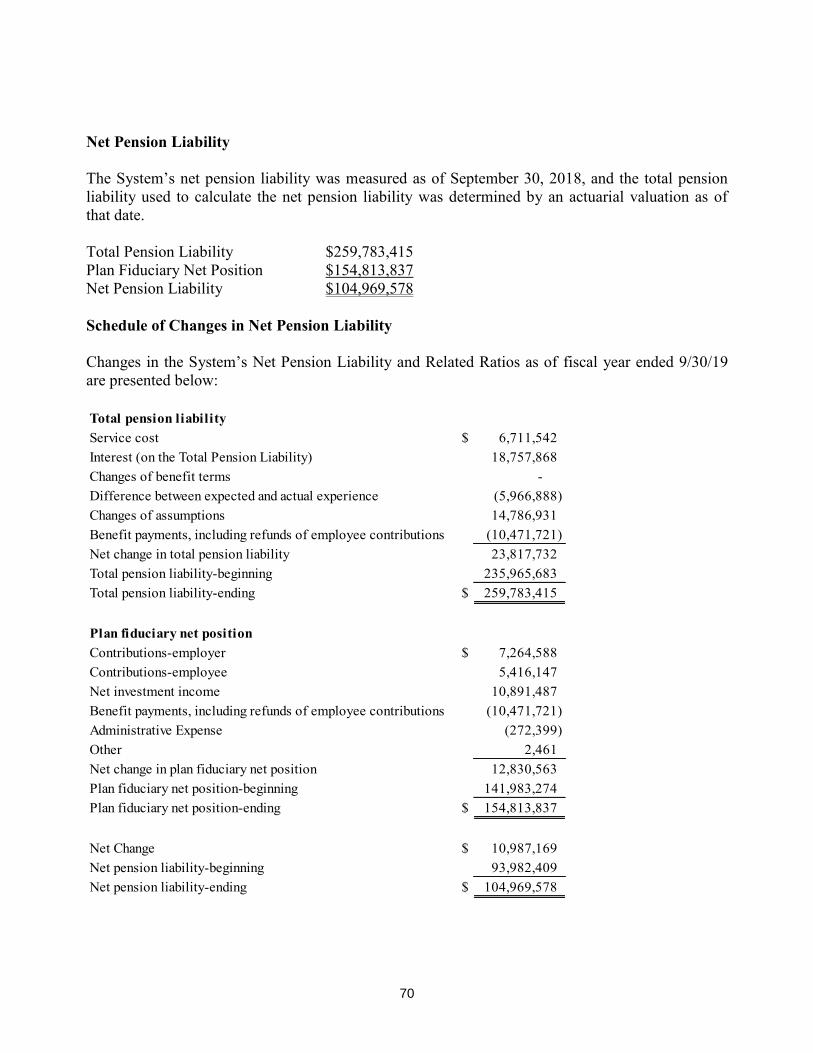
Net Pension Liability The System’s net pension liability was measured as of September 30, 2018, and the total pension liability used to calculate the net pension liability was determined by an actuarial valuation as of that date. Total Pension Liability $259,783,415 Plan Fiduciary Net Position $154,813,837 Net Pension Liability $104,969,578 Schedule of Changes in Net Pension Liability Changes in the System’s Net Pension Liability and Related Ratios as of fiscal year ended 9/30/19 are presented below: Total pension liabilityService cost $ 6,711,542 Interest (on the Total Pension Liability) 18,757,868 Changes of benefit terms - Difference between expected and actual experience (5,966,888) Changes of assumptions 14,786,931 Benefit payments, including refunds of employee contributions (10,471,721) Net change in total pension liability 23,817,732 Total pension liability-beginning 235,965,683 Total pension liability-ending $ 259,783,415
Plan fiduciary net positionContributions-employer $ 7,264,588 Contributions-employee 5,416,147 Net investment income 10,891,487 Benefit payments, including refunds of employee contributions (10,471,721) Administrative Expense (272,399) Other 2,461 Net change in plan fiduciary net position 12,830,563 Plan fiduciary net position-beginning 141,983,274 Plan fiduciary net position-ending $ 154,813,837
Net Change $ 10,987,169 Net pension liability-beginning 93,982,409 Net pension liability-ending $ 104,969,578
70
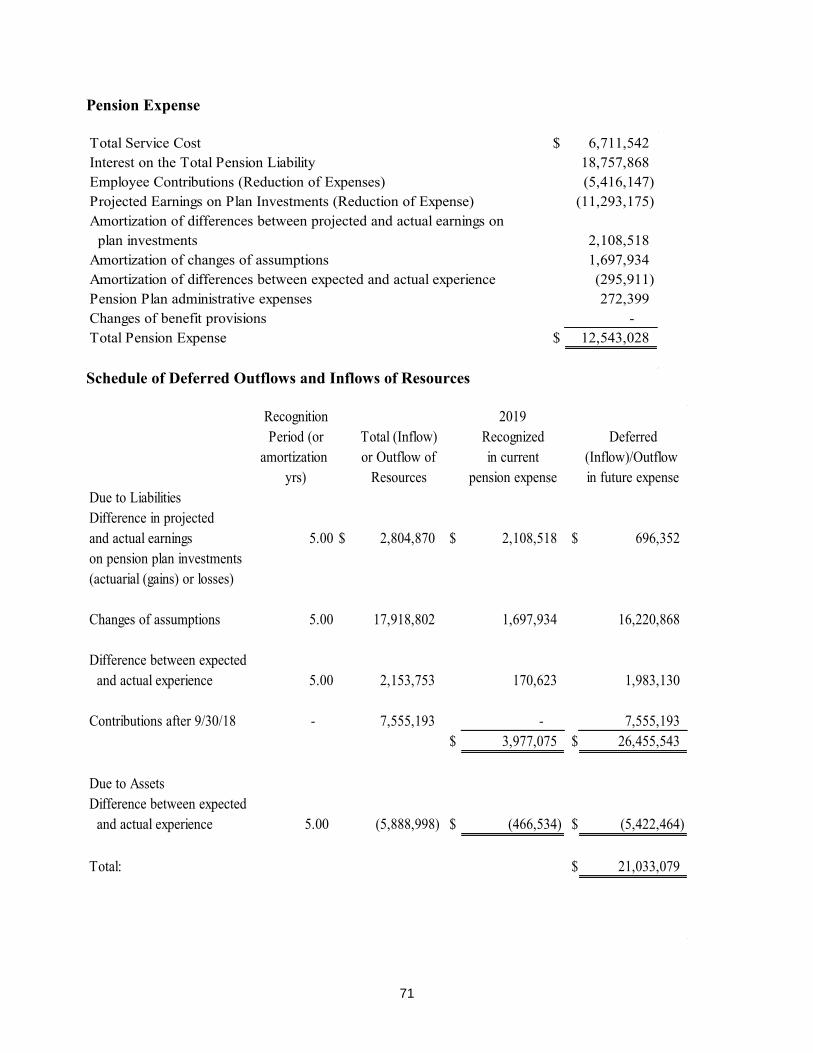
Pension Expense Total Service Cost $ 6,711,542 Interest on the Total Pension Liability 18,757,868 Employee Contributions (Reduction of Expenses) (5,416,147) Projected Earnings on Plan Investments (Reduction of Expense) (11,293,175) Amortization of differences between projected and actual earnings on plan investments 2,108,518 Amortization of changes of assumptions 1,697,934 Amortization of differences between expected and actual experience (295,911) Pension Plan administrative expenses 272,399 Changes of benefit provisions - Total Pension Expense $ 12,543,028
Schedule of Deferred Outflows and Inflows of Resources
Recognition 2019Period (or Total (Inflow) Recognized Deferred
amortization or Outflow of in current (Inflow)/Outflow yrs) Resources pension expense in future expense
Due to LiabilitiesDifference in projectedand actual earnings 5.00 $ 2,804,870 $ 2,108,518 $ 696,352 on pension plan investments(actuarial (gains) or losses)
Changes of assumptions 5.00 17,918,802 1,697,934 16,220,868
Difference between expected and actual experience 5.00 2,153,753 170,623 1,983,130
Contributions after 9/30/18 - 7,555,193 - 7,555,193 $ 3,977,075 $ 26,455,543
Due to AssetsDifference between expected and actual experience 5.00 (5,888,998) $ (466,534) $ (5,422,464)
Total: $ 21,033,079
71
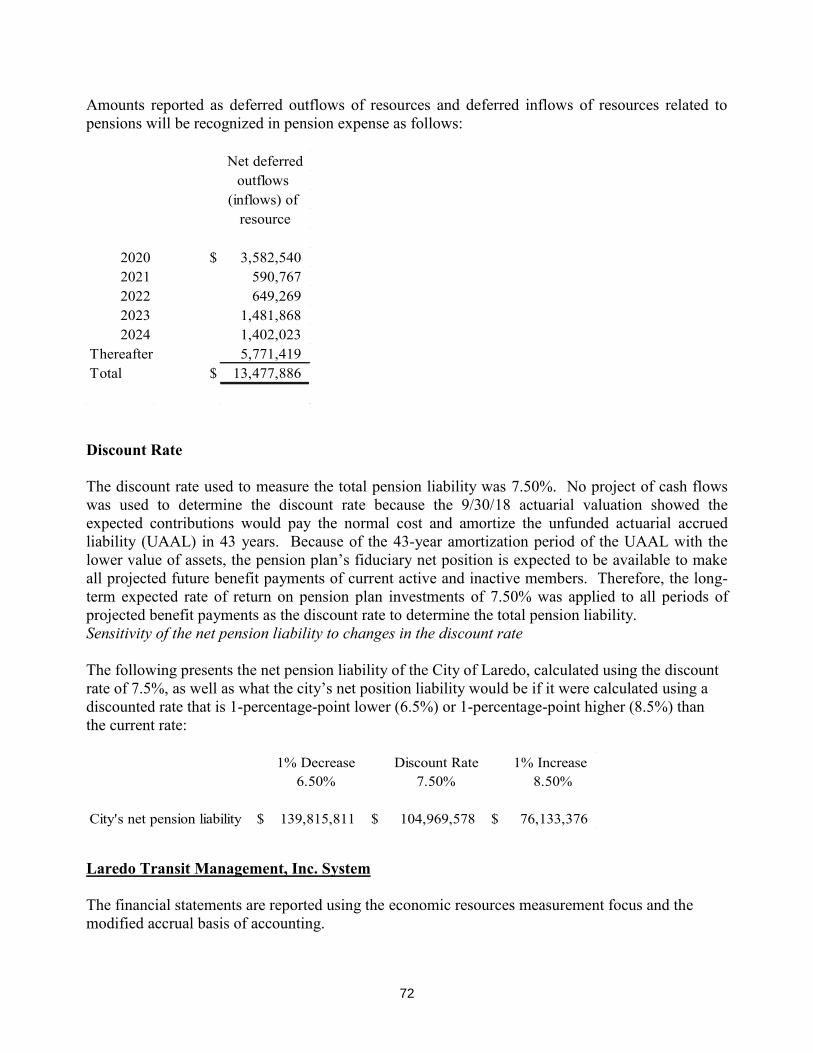
Amounts reported as deferred outflows of resources and deferred inflows of resources related to pensions will be recognized in pension expense as follows:
Net deferredoutflows
(inflows) of resource
2020 $ 3,582,540 2021 590,767 2022 649,269 2023 1,481,868 2024 1,402,023
Thereafter 5,771,419 Total $ 13,477,886
Discount Rate The discount rate used to measure the total pension liability was 7.50%. No project of cash flows was used to determine the discount rate because the 9/30/18 actuarial valuation showed the expected contributions would pay the normal cost and amortize the unfunded actuarial accrued liability (UAAL) in 43 years. Because of the 43-year amortization period of the UAAL with the lower value of assets, the pension plan’s fiduciary net position is expected to be available to make all projected future benefit payments of current active and inactive members. Therefore, the long-term expected rate of return on pension plan investments of 7.50% was applied to all periods of projected benefit payments as the discount rate to determine the total pension liability. Sensitivity of the net pension liability to changes in the discount rate The following presents the net pension liability of the City of Laredo, calculated using the discount rate of 7.5%, as well as what the city’s net position liability would be if it were calculated using a discounted rate that is 1-percentage-point lower (6.5%) or 1-percentage-point higher (8.5%) than the current rate:
1% Decrease Discount Rate 1% Increase 6.50% 7.50% 8.50%
City's net pension liability $ 139,815,811 $ 104,969,578 $ 76,133,376 Laredo Transit Management, Inc. System
The financial statements are reported using the economic resources measurement focus and the modified accrual basis of accounting.
72
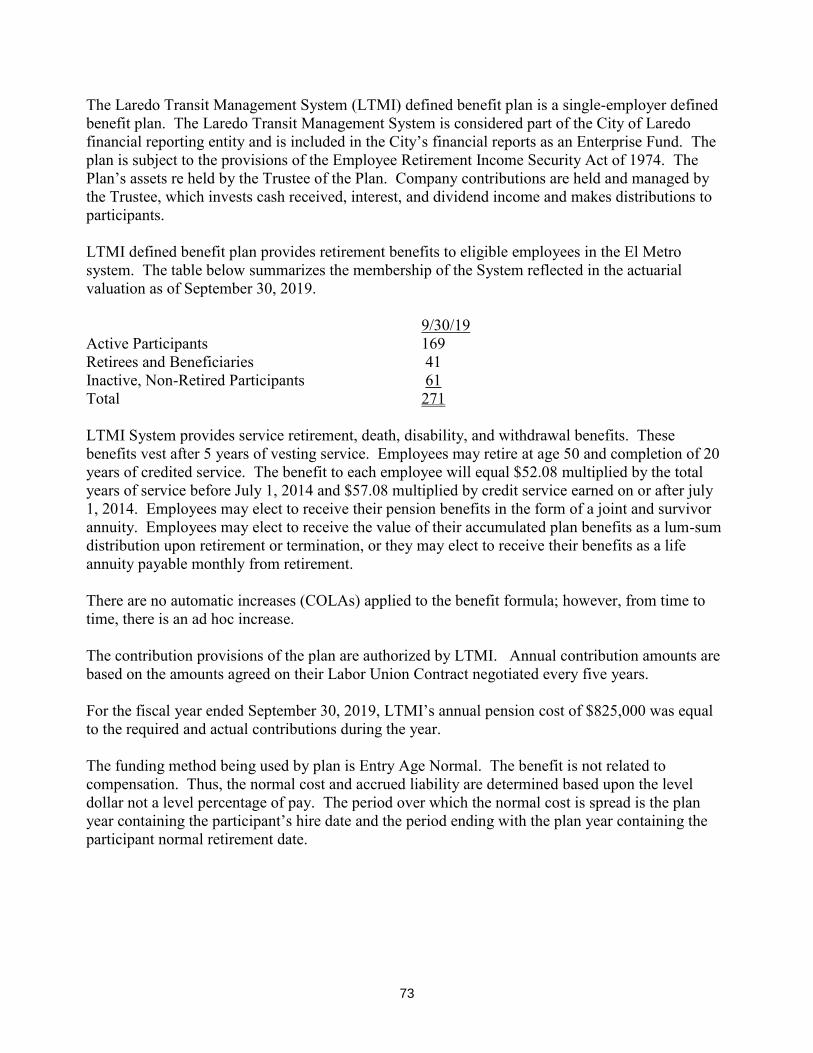
The Laredo Transit Management System (LTMI) defined benefit plan is a single-employer defined benefit plan. The Laredo Transit Management System is considered part of the City of Laredo financial reporting entity and is included in the City’s financial reports as an Enterprise Fund. The plan is subject to the provisions of the Employee Retirement Income Security Act of 1974. The Plan’s assets re held by the Trustee of the Plan. Company contributions are held and managed by the Trustee, which invests cash received, interest, and dividend income and makes distributions to participants. LTMI defined benefit plan provides retirement benefits to eligible employees in the El Metro system. The table below summarizes the membership of the System reflected in the actuarial valuation as of September 30, 2019. 9/30/19 Active Participants 169 Retirees and Beneficiaries 41 Inactive, Non-Retired Participants 61 Total 271 LTMI System provides service retirement, death, disability, and withdrawal benefits. These benefits vest after 5 years of vesting service. Employees may retire at age 50 and completion of 20 years of credited service. The benefit to each employee will equal $52.08 multiplied by the total years of service before July 1, 2014 and $57.08 multiplied by credit service earned on or after july 1, 2014. Employees may elect to receive their pension benefits in the form of a joint and survivor annuity. Employees may elect to receive the value of their accumulated plan benefits as a lum-sum distribution upon retirement or termination, or they may elect to receive their benefits as a life annuity payable monthly from retirement. There are no automatic increases (COLAs) applied to the benefit formula; however, from time to time, there is an ad hoc increase. The contribution provisions of the plan are authorized by LTMI. Annual contribution amounts are based on the amounts agreed on their Labor Union Contract negotiated every five years. For the fiscal year ended September 30, 2019, LTMI’s annual pension cost of $825,000 was equal to the required and actual contributions during the year. The funding method being used by plan is Entry Age Normal. The benefit is not related to compensation. Thus, the normal cost and accrued liability are determined based upon the level dollar not a level percentage of pay. The period over which the normal cost is spread is the plan year containing the participant’s hire date and the period ending with the plan year containing the participant normal retirement date.
73
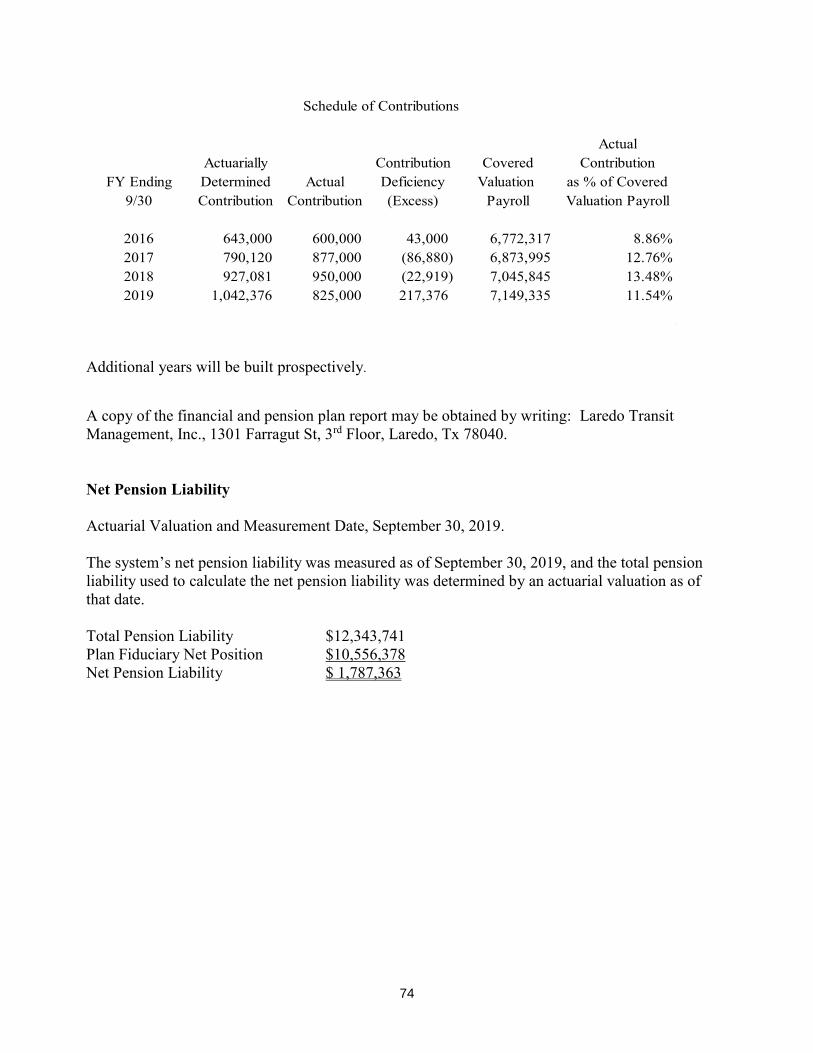
Schedule of Contributions
ActualActuarially Contribution Covered Contribution
FY Ending Determined Actual Deficiency Valuation as % of Covered9/30 Contribution Contribution (Excess) Payroll Valuation Payroll
2016 643,000 600,000 43,000 6,772,317 8.86%2017 790,120 877,000 (86,880) 6,873,995 12.76%2018 927,081 950,000 (22,919) 7,045,845 13.48%2019 1,042,376 825,000 217,376 7,149,335 11.54%
Additional years will be built prospectively. A copy of the financial and pension plan report may be obtained by writing: Laredo Transit Management, Inc., 1301 Farragut St, 3rd Floor, Laredo, Tx 78040. Net Pension Liability Actuarial Valuation and Measurement Date, September 30, 2019. The system’s net pension liability was measured as of September 30, 2019, and the total pension liability used to calculate the net pension liability was determined by an actuarial valuation as of that date. Total Pension Liability $12,343,741 Plan Fiduciary Net Position $10,556,378 Net Pension Liability $ 1,787,363
74
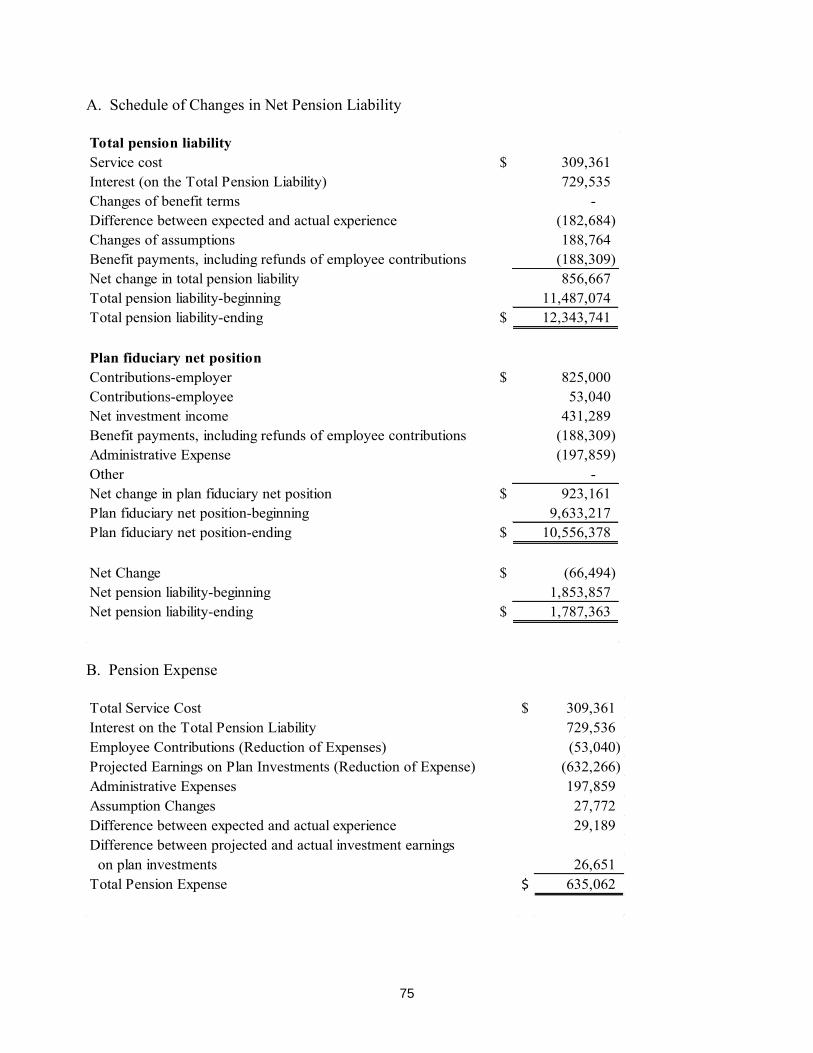
A. Schedule of Changes in Net Pension Liability Total pension liabilityService cost $ 309,361 Interest (on the Total Pension Liability) 729,535 Changes of benefit terms - Difference between expected and actual experience (182,684) Changes of assumptions 188,764 Benefit payments, including refunds of employee contributions (188,309) Net change in total pension liability 856,667 Total pension liability-beginning 11,487,074 Total pension liability-ending $ 12,343,741
Plan fiduciary net positionContributions-employer $ 825,000 Contributions-employee 53,040 Net investment income 431,289 Benefit payments, including refunds of employee contributions (188,309) Administrative Expense (197,859) Other - Net change in plan fiduciary net position $ 923,161 Plan fiduciary net position-beginning 9,633,217 Plan fiduciary net position-ending $ 10,556,378
Net Change $ (66,494) Net pension liability-beginning 1,853,857 Net pension liability-ending $ 1,787,363
B. Pension Expense Total Service Cost $ 309,361 Interest on the Total Pension Liability 729,536 Employee Contributions (Reduction of Expenses) (53,040) Projected Earnings on Plan Investments (Reduction of Expense) (632,266) Administrative Expenses 197,859 Assumption Changes 27,772 Difference between expected and actual experience 29,189 Difference between projected and actual investment earnings on plan investments 26,651 Total Pension Expense $ 635,062
75
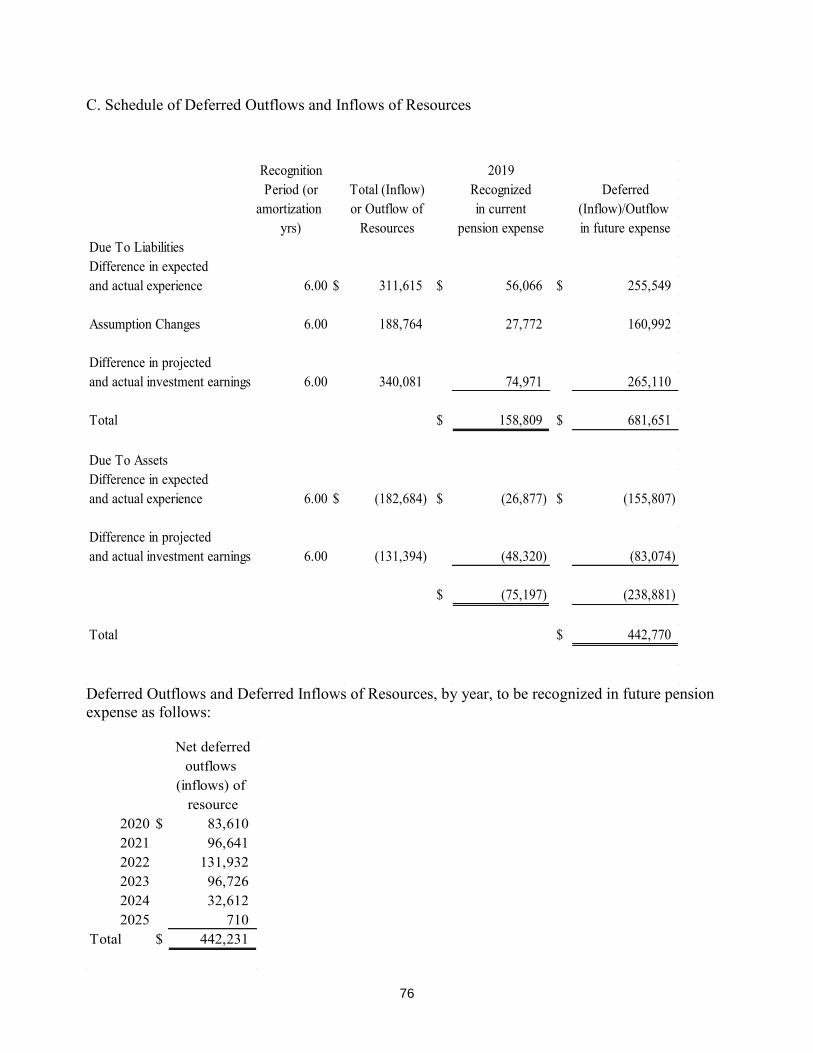
C. Schedule of Deferred Outflows and Inflows of Resources
Recognition 2019Period (or Total (Inflow) Recognized Deferred
amortization or Outflow of in current (Inflow)/Outflowyrs) Resources pension expense in future expense
Due To LiabilitiesDifference in expectedand actual experience 6.00 $ 311,615 $ 56,066 $ 255,549
Assumption Changes 6.00 188,764 27,772 160,992
Difference in projectedand actual investment earnings 6.00 340,081 74,971 265,110
Total $ 158,809 $ 681,651
Due To AssetsDifference in expectedand actual experience 6.00 $ (182,684) $ (26,877) $ (155,807)
Difference in projectedand actual investment earnings 6.00 (131,394) (48,320) (83,074)
$ (75,197) (238,881)
Total $ 442,770
Deferred Outflows and Deferred Inflows of Resources, by year, to be recognized in future pension expense as follows:
Net deferredoutflows
(inflows) of resource
2020 $ 83,610 2021 96,641 2022 131,932 2023 96,726 2024 32,612 2025 710
Total $ 442,231
76
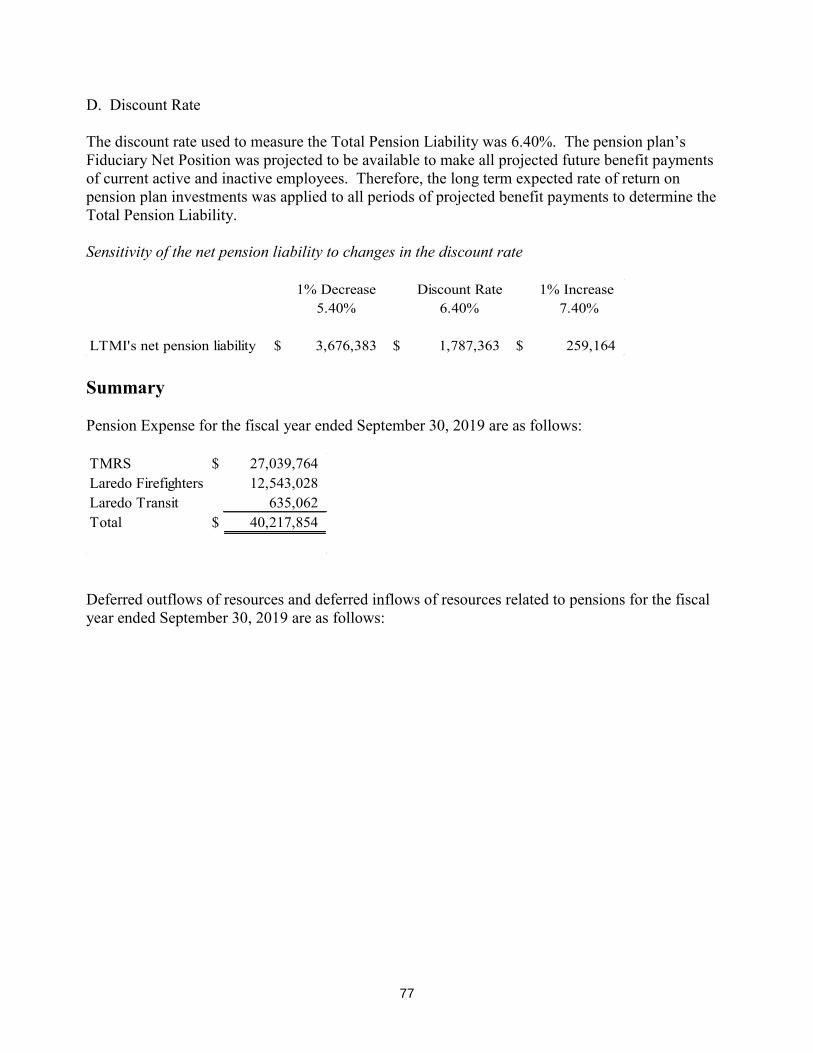
D. Discount Rate
The discount rate used to measure the Total Pension Liability was 6.40%. The pension plan’s Fiduciary Net Position was projected to be available to make all projected future benefit payments of current active and inactive employees. Therefore, the long term expected rate of return on pension plan investments was applied to all periods of projected benefit payments to determine the Total Pension Liability.
Sensitivity of the net pension liability to changes in the discount rate
1% Decrease Discount Rate 1% Increase 5.40% 6.40% 7.40%
LTMI's net pension liability $ 3,676,383 $ 1,787,363 $ 259,164
Summary
Pension Expense for the fiscal year ended September 30, 2019 are as follows:
TMRS $ 27,039,764 Laredo Firefighters 12,543,028 Laredo Transit 635,062 Total $ 40,217,854
Deferred outflows of resources and deferred inflows of resources related to pensions for the fiscal year ended September 30, 2019 are as follows:
77
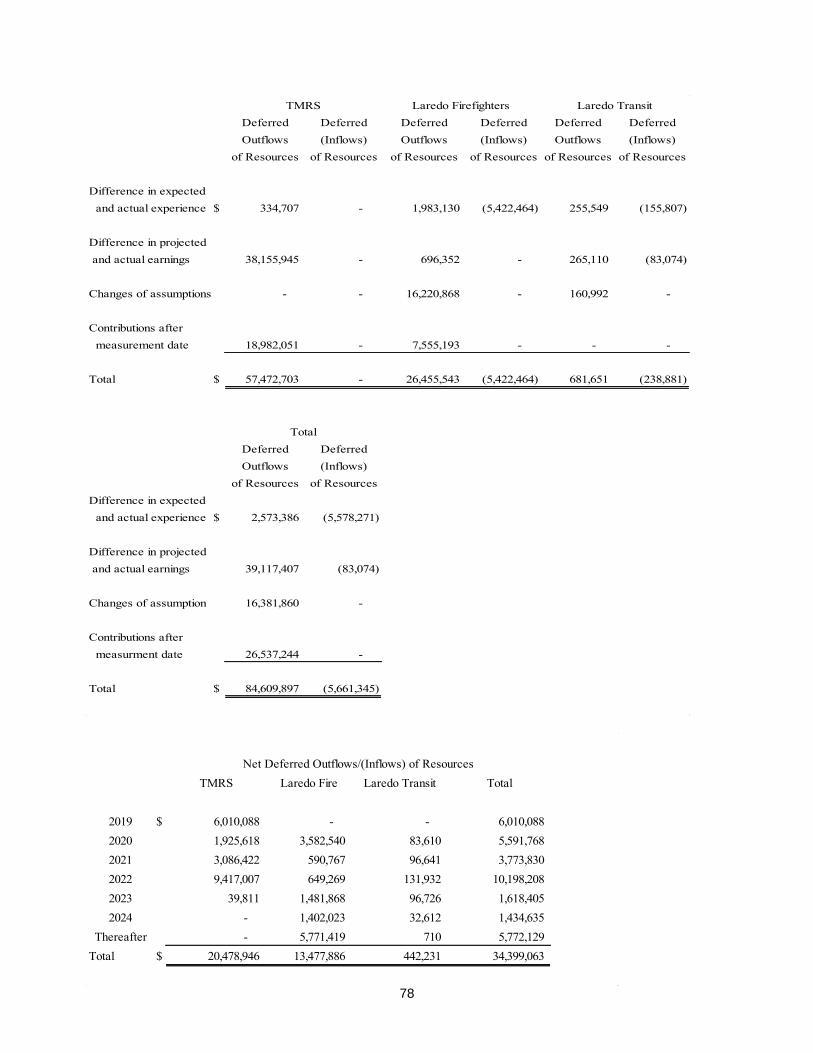
TMRS Laredo Firefighters Laredo TransitDeferred Deferred Deferred Deferred Deferred DeferredOutflows (Inflows) Outflows (Inflows) Outflows (Inflows)
of Resources of Resources of Resources of Resources of Resources of Resources
Difference in expected and actual experience $ 334,707 - 1,983,130 (5,422,464) 255,549 (155,807)
Difference in projected and actual earnings 38,155,945 - 696,352 - 265,110 (83,074)
Changes of assumptions - - 16,220,868 - 160,992 -
Contributions after measurement date 18,982,051 - 7,555,193 - - -
Total $ 57,472,703 - 26,455,543 (5,422,464) 681,651 (238,881)
TotalDeferred DeferredOutflows (Inflows)
of Resources of ResourcesDifference in expected and actual experience $ 2,573,386 (5,578,271)
Difference in projected and actual earnings 39,117,407 (83,074)
Changes of assumption 16,381,860 -
Contributions after measurment date 26,537,244 -
Total $ 84,609,897 (5,661,345)
Net Deferred Outflows/(Inflows) of ResourcesTMRS Laredo Fire Laredo Transit Total
2019 $ 6,010,088 - - 6,010,088 2020 1,925,618 3,582,540 83,610 5,591,768 2021 3,086,422 590,767 96,641 3,773,830 2022 9,417,007 649,269 131,932 10,198,208 2023 39,811 1,481,868 96,726 1,618,405 2024 - 1,402,023 32,612 1,434,635
Thereafter - 5,771,419 710 5,772,129 Total $ 20,478,946 13,477,886 442,231 34,399,063
78
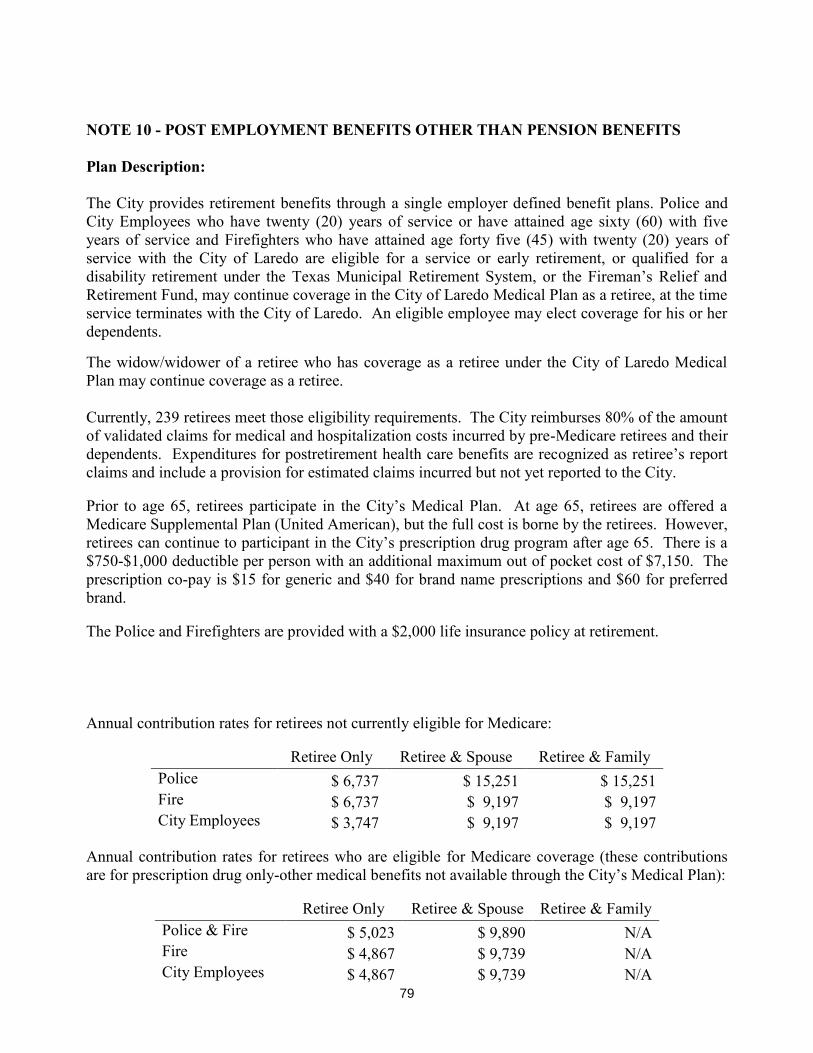
2B2B2B2B 1 1
NOTE 10 - POST EMPLOYMENT BENEFITS OTHER THAN PENSION BENEFITS Plan Description: The City provides retirement benefits through a single employer defined benefit plans. Police and City Employees who have twenty (20) years of service or have attained age sixty (60) with five years of service and Firefighters who have attained age forty five (45) with twenty (20) years of service with the City of Laredo are eligible for a service or early retirement, or qualified for a disability retirement under the Texas Municipal Retirement System, or the Fireman’s Relief and Retirement Fund, may continue coverage in the City of Laredo Medical Plan as a retiree, at the time service terminates with the City of Laredo. An eligible employee may elect coverage for his or her dependents. The widow/widower of a retiree who has coverage as a retiree under the City of Laredo Medical Plan may continue coverage as a retiree. Currently, 239 retirees meet those eligibility requirements. The City reimburses 80% of the amount of validated claims for medical and hospitalization costs incurred by pre-Medicare retirees and their dependents. Expenditures for postretirement health care benefits are recognized as retiree’s report claims and include a provision for estimated claims incurred but not yet reported to the City. Prior to age 65, retirees participate in the City’s Medical Plan. At age 65, retirees are offered a Medicare Supplemental Plan (United American), but the full cost is borne by the retirees. However, retirees can continue to participant in the City’s prescription drug program after age 65. There is a $750-$1,000 deductible per person with an additional maximum out of pocket cost of $7,150. The prescription co-pay is $15 for generic and $40 for brand name prescriptions and $60 for preferred brand. The Police and Firefighters are provided with a $2,000 life insurance policy at retirement. Annual contribution rates for retirees not currently eligible for Medicare:
Retiree Only Retiree & Spouse Retiree & Family Police $ 6,737 $ 15,251 $ 15,251 Fire $ 6,737 $ 9,197 $ 9,197 City Employees $ 3,747 $ 9,197 $ 9,197
Annual contribution rates for retirees who are eligible for Medicare coverage (these contributions are for prescription drug only-other medical benefits not available through the City’s Medical Plan):
Retiree Only Retiree & Spouse Retiree & Family Police & Fire $ 5,023 $ 9,890 N/A Fire $ 4,867 $ 9,739 N/A City Employees $ 4,867 $ 9,739 N/A
79
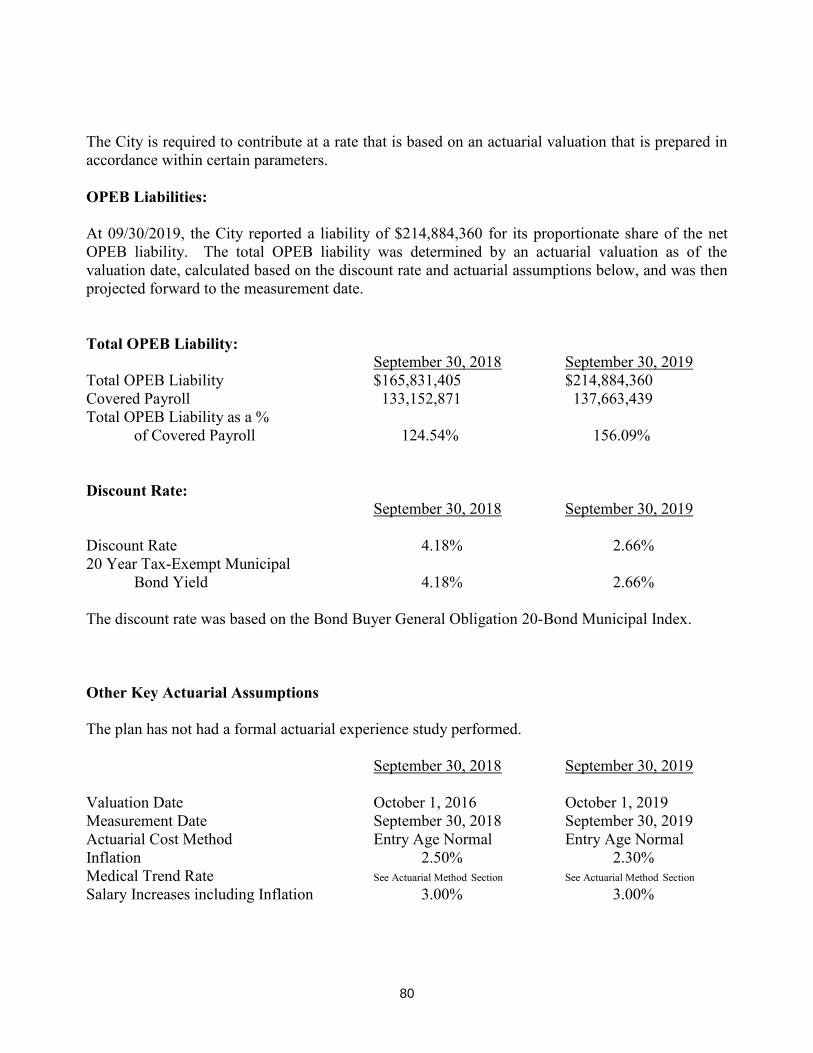
The City is required to contribute at a rate that is based on an actuarial valuation that is prepared in accordance within certain parameters. OPEB Liabilities: At 09/30/2019, the City reported a liability of $214,884,360 for its proportionate share of the net OPEB liability. The total OPEB liability was determined by an actuarial valuation as of the valuation date, calculated based on the discount rate and actuarial assumptions below, and was then projected forward to the measurement date. Total OPEB Liability: September 30, 2018 September 30, 2019 Total OPEB Liability $165,831,405 $214,884,360 Covered Payroll 133,152,871 137,663,439 Total OPEB Liability as a % of Covered Payroll 124.54% 156.09% Discount Rate: September 30, 2018 September 30, 2019 Discount Rate 4.18% 2.66% 20 Year Tax-Exempt Municipal Bond Yield 4.18% 2.66% The discount rate was based on the Bond Buyer General Obligation 20-Bond Municipal Index. Other Key Actuarial Assumptions The plan has not had a formal actuarial experience study performed.
September 30, 2018 September 30, 2019 Valuation Date October 1, 2016 October 1, 2019 Measurement Date September 30, 2018 September 30, 2019 Actuarial Cost Method Entry Age Normal Entry Age Normal Inflation 2.50% 2.30% Medical Trend Rate See Actuarial Method Section See Actuarial Method Section Salary Increases including Inflation 3.00% 3.00%
80
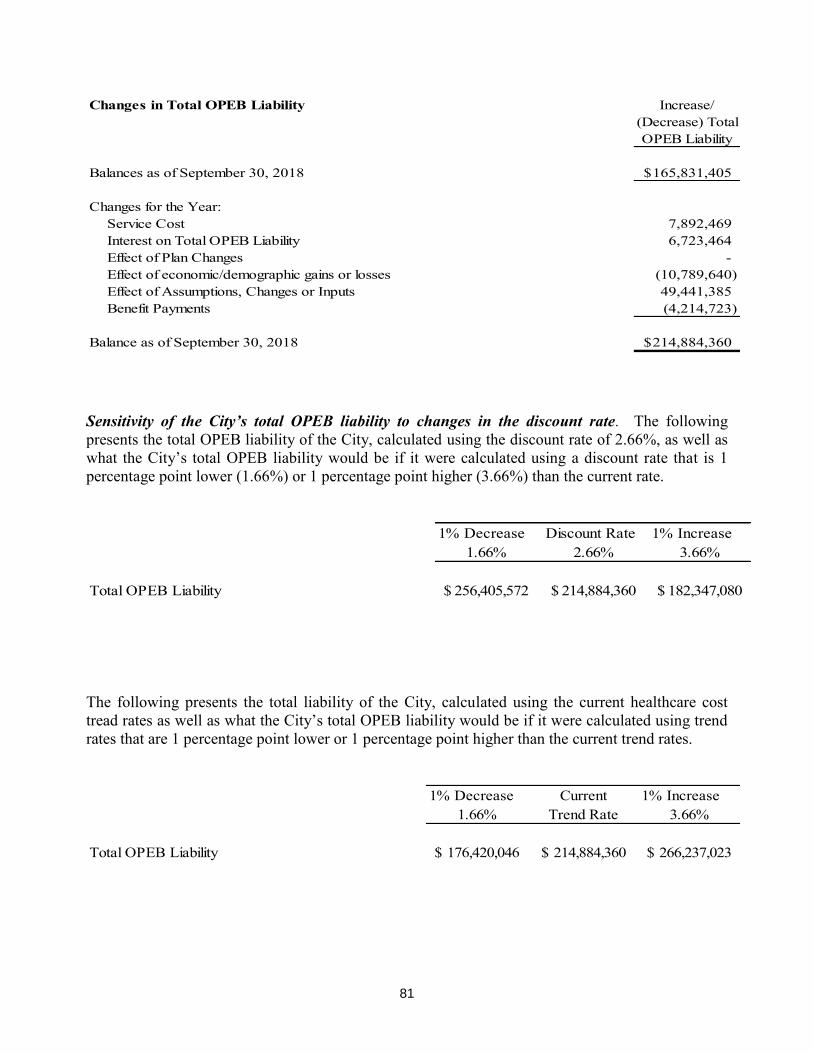
Changes in Total OPEB Liability Increase/(Decrease) TotalOPEB Liability
Balances as of September 30, 2018 165,831,405$
Changes for the Year:Service Cost 7,892,469 Interest on Total OPEB Liability 6,723,464 Effect of Plan Changes - Effect of economic/demographic gains or losses (10,789,640) Effect of Assumptions, Changes or Inputs 49,441,385 Benefit Payments (4,214,723)
Balance as of September 30, 2018 214,884,360$
Sensitivity of the City’s total OPEB liability to changes in the discount rate. The following presents the total OPEB liability of the City, calculated using the discount rate of 2.66%, as well as what the City’s total OPEB liability would be if it were calculated using a discount rate that is 1 percentage point lower (1.66%) or 1 percentage point higher (3.66%) than the current rate.
1% Decrease Discount Rate 1% Increase1.66% 2.66% 3.66%
Total OPEB Liability 256,405,572$ 214,884,360$ 182,347,080$
The following presents the total liability of the City, calculated using the current healthcare cost tread rates as well as what the City’s total OPEB liability would be if it were calculated using trend rates that are 1 percentage point lower or 1 percentage point higher than the current trend rates.
1% Decrease Current 1% Increase1.66% Trend Rate 3.66%
Total OPEB Liability 176,420,046$ 214,884,360$ 266,237,023$
81
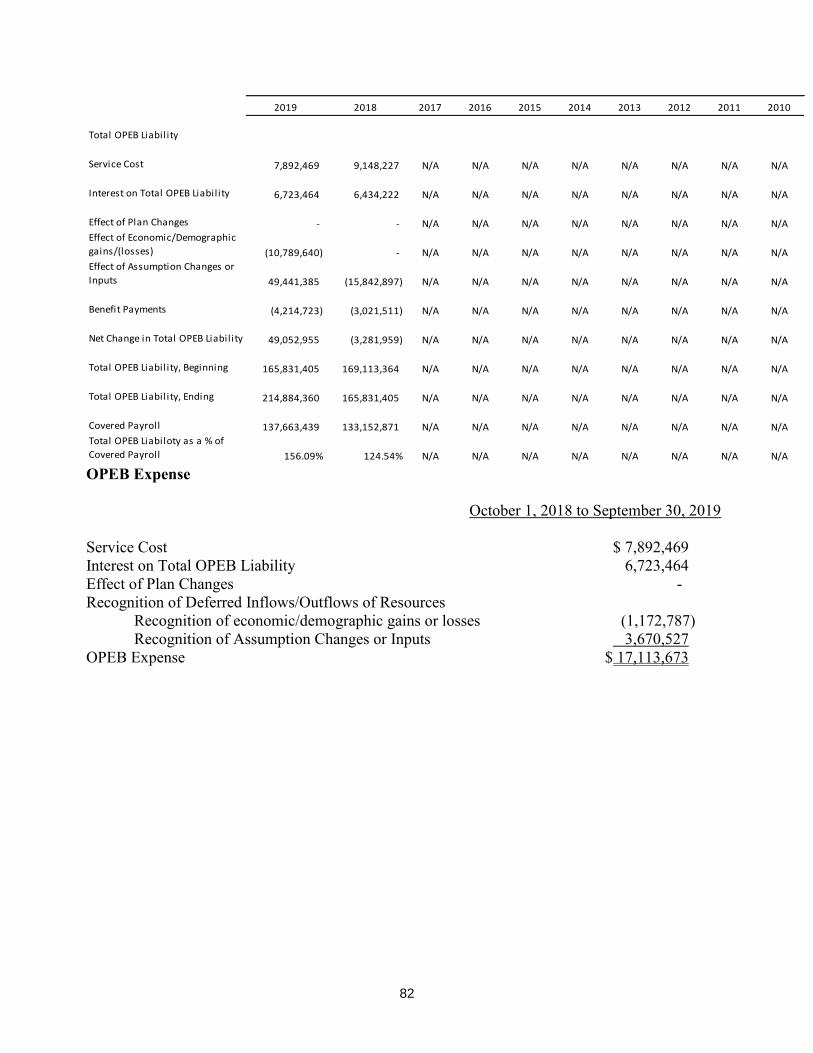
2019 2018 2017 2016 2015 2014 2013 2012 2011 2010
Total OPEB Liability
Service Cost 7,892,469 9,148,227 N/A N/A N/A N/A N/A N/A N/A N/A
Interest on Total OPEB Liability 6,723,464 6,434,222 N/A N/A N/A N/A N/A N/A N/A N/A
Effect of Plan Changes - - N/A N/A N/A N/A N/A N/A N/A N/A
Effect of Economic/Demographic
gains/(losses) (10,789,640) - N/A N/A N/A N/A N/A N/A N/A N/A
Effect of Assumption Changes or
Inputs 49,441,385 (15,842,897) N/A N/A N/A N/A N/A N/A N/A N/A
Benefit Payments (4,214,723) (3,021,511) N/A N/A N/A N/A N/A N/A N/A N/A
Net Change in Total OPEB Liability 49,052,955 (3,281,959) N/A N/A N/A N/A N/A N/A N/A N/A
Total OPEB Liability, Beginning 165,831,405 169,113,364 N/A N/A N/A N/A N/A N/A N/A N/A
Total OPEB Liability, Ending 214,884,360 165,831,405 N/A N/A N/A N/A N/A N/A N/A N/A
Covered Payroll 137,663,439 133,152,871 N/A N/A N/A N/A N/A N/A N/A N/A
Total OPEB Liabiloty as a % of
Covered Payroll 156.09% 124.54% N/A N/A N/A N/A N/A N/A N/A N/A
OPEB Expense October 1, 2018 to September 30, 2019 Service Cost $ 7,892,469 Interest on Total OPEB Liability 6,723,464 Effect of Plan Changes - Recognition of Deferred Inflows/Outflows of Resources Recognition of economic/demographic gains or losses (1,172,787) Recognition of Assumption Changes or Inputs 3,670,527 OPEB Expense $ 17,113,673
82
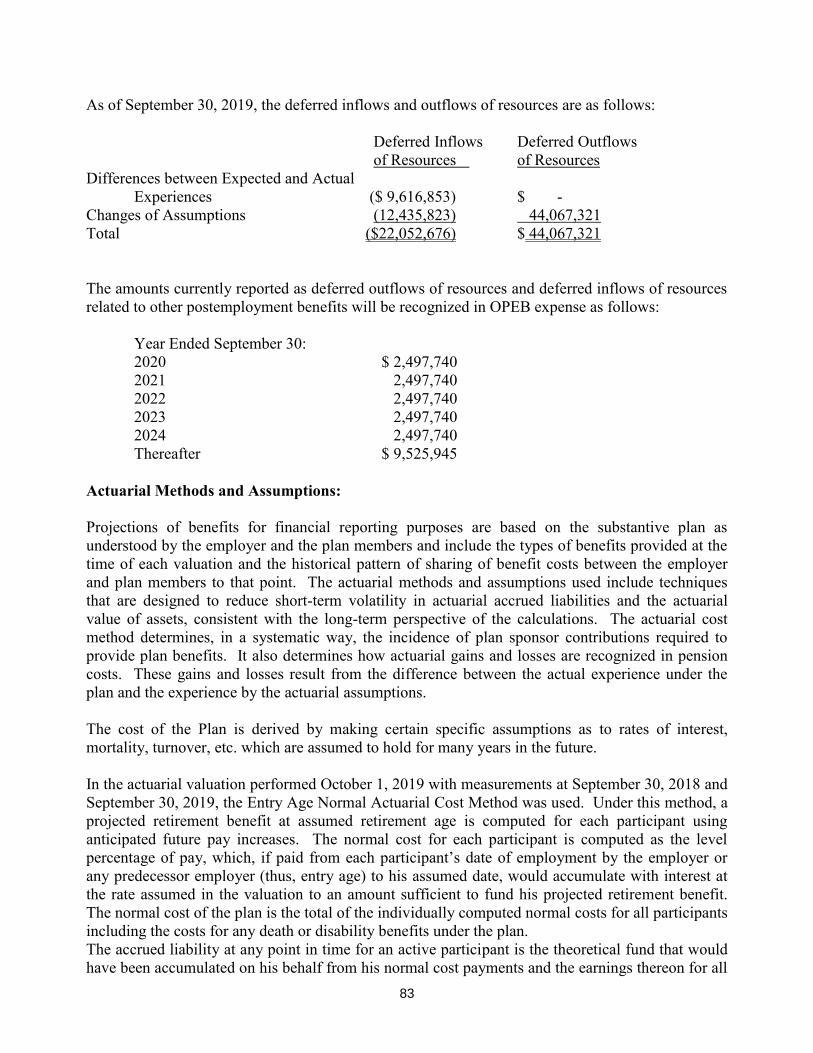
As of September 30, 2019, the deferred inflows and outflows of resources are as follows: Deferred Inflows Deferred Outflows of Resources of Resources Differences between Expected and Actual Experiences ($ 9,616,853) $ - Changes of Assumptions (12,435,823) 44,067,321 Total ($22,052,676) $ 44,067,321 The amounts currently reported as deferred outflows of resources and deferred inflows of resources related to other postemployment benefits will be recognized in OPEB expense as follows: Year Ended September 30: 2020 $ 2,497,740 2021 2,497,740 2022 2,497,740 2023 2,497,740 2024 2,497,740 Thereafter $ 9,525,945 Actuarial Methods and Assumptions: Projections of benefits for financial reporting purposes are based on the substantive plan as understood by the employer and the plan members and include the types of benefits provided at the time of each valuation and the historical pattern of sharing of benefit costs between the employer and plan members to that point. The actuarial methods and assumptions used include techniques that are designed to reduce short-term volatility in actuarial accrued liabilities and the actuarial value of assets, consistent with the long-term perspective of the calculations. The actuarial cost method determines, in a systematic way, the incidence of plan sponsor contributions required to provide plan benefits. It also determines how actuarial gains and losses are recognized in pension costs. These gains and losses result from the difference between the actual experience under the plan and the experience by the actuarial assumptions. The cost of the Plan is derived by making certain specific assumptions as to rates of interest, mortality, turnover, etc. which are assumed to hold for many years in the future. In the actuarial valuation performed October 1, 2019 with measurements at September 30, 2018 and September 30, 2019, the Entry Age Normal Actuarial Cost Method was used. Under this method, a projected retirement benefit at assumed retirement age is computed for each participant using anticipated future pay increases. The normal cost for each participant is computed as the level percentage of pay, which, if paid from each participant’s date of employment by the employer or any predecessor employer (thus, entry age) to his assumed date, would accumulate with interest at the rate assumed in the valuation to an amount sufficient to fund his projected retirement benefit. The normal cost of the plan is the total of the individually computed normal costs for all participants including the costs for any death or disability benefits under the plan. The accrued liability at any point in time for an active participant is the theoretical fund that would have been accumulated on his behalf from his normal cost payments and the earnings thereon for all
83
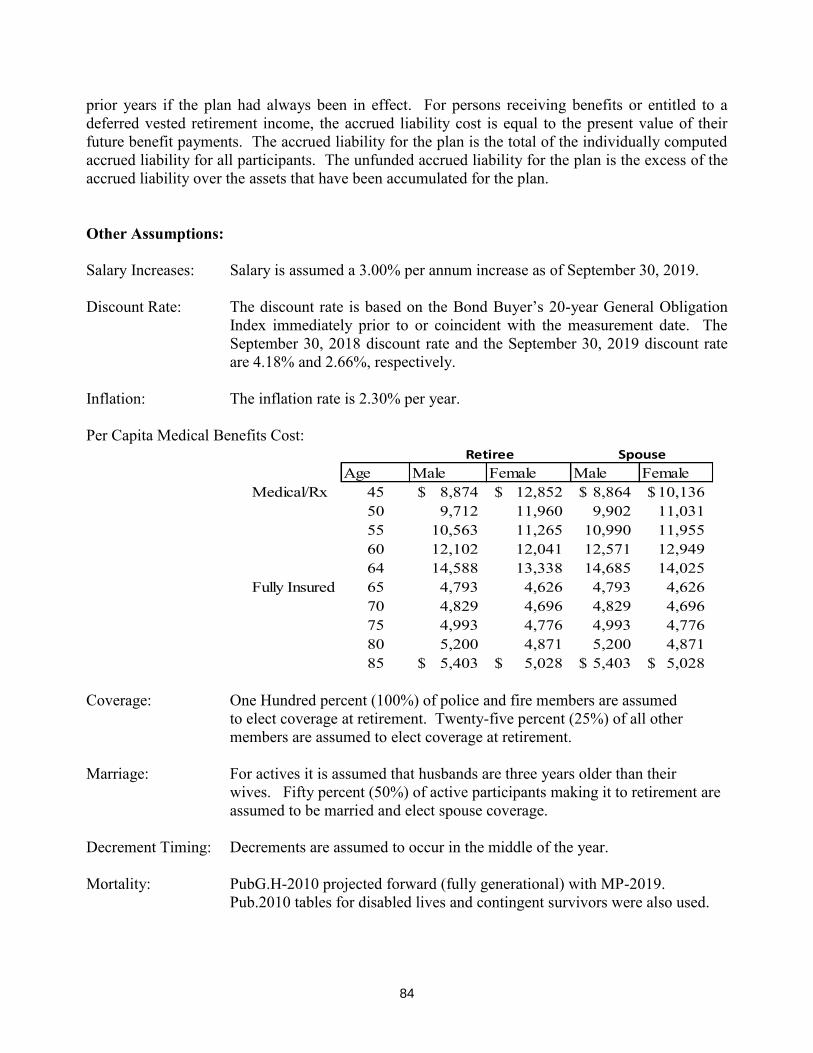
prior years if the plan had always been in effect. For persons receiving benefits or entitled to a deferred vested retirement income, the accrued liability cost is equal to the present value of their future benefit payments. The accrued liability for the plan is the total of the individually computed accrued liability for all participants. The unfunded accrued liability for the plan is the excess of the accrued liability over the assets that have been accumulated for the plan. Other Assumptions: Salary Increases: Salary is assumed a 3.00% per annum increase as of September 30, 2019. Discount Rate: The discount rate is based on the Bond Buyer’s 20-year General Obligation
Index immediately prior to or coincident with the measurement date. The September 30, 2018 discount rate and the September 30, 2019 discount rate are 4.18% and 2.66%, respectively.
Inflation: The inflation rate is 2.30% per year. Per Capita Medical Benefits Cost:
Age Male Female Male FemaleMedical/Rx 45 8,874$ 12,852$ 8,864$ 10,136$
50 9,712 11,960 9,902 11,031 55 10,563 11,265 10,990 11,955 60 12,102 12,041 12,571 12,949 64 14,588 13,338 14,685 14,025
Fully Insured 65 4,793 4,626 4,793 4,626 70 4,829 4,696 4,829 4,696 75 4,993 4,776 4,993 4,776 80 5,200 4,871 5,200 4,871 85 5,403$ 5,028$ 5,403$ 5,028$
Retiree Spouse
Coverage: One Hundred percent (100%) of police and fire members are assumed to elect coverage at retirement. Twenty-five percent (25%) of all other members are assumed to elect coverage at retirement. Marriage: For actives it is assumed that husbands are three years older than their wives. Fifty percent (50%) of active participants making it to retirement are assumed to be married and elect spouse coverage. Decrement Timing: Decrements are assumed to occur in the middle of the year. Mortality: PubG.H-2010 projected forward (fully generational) with MP-2019. Pub.2010 tables for disabled lives and contingent survivors were also used.
84
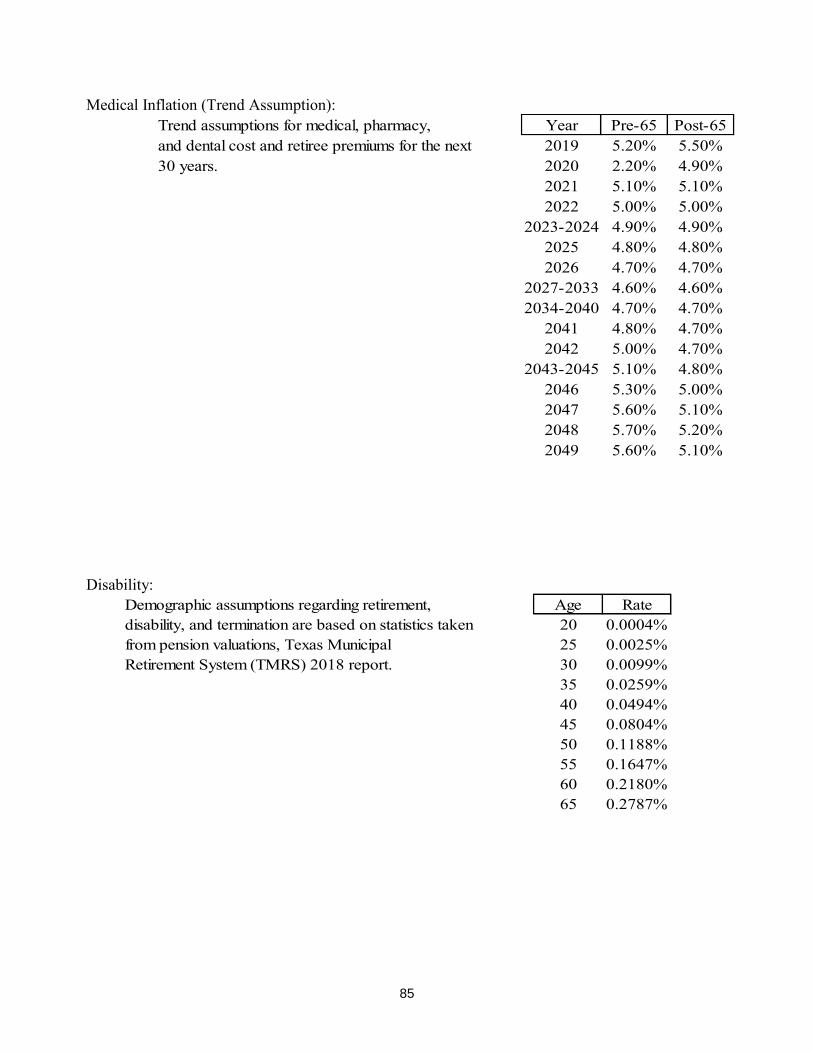
Medical Inflation (Trend Assumption): Trend assumptions for medical, pharmacy, Year Pre-65 Post-65and dental cost and retiree premiums for the next 2019 5.20% 5.50%30 years. 2020 2.20% 4.90%
2021 5.10% 5.10%2022 5.00% 5.00%
2023-2024 4.90% 4.90%2025 4.80% 4.80%2026 4.70% 4.70%
2027-2033 4.60% 4.60%2034-2040 4.70% 4.70%
2041 4.80% 4.70%2042 5.00% 4.70%
2043-2045 5.10% 4.80%2046 5.30% 5.00%2047 5.60% 5.10%2048 5.70% 5.20%2049 5.60% 5.10%
Disability:
Demographic assumptions regarding retirement, Age Ratedisability, and termination are based on statistics taken 20 0.0004%from pension valuations, Texas Municipal 25 0.0025%Retirement System (TMRS) 2018 report. 30 0.0099%
35 0.0259%40 0.0494%45 0.0804%50 0.1188%55 0.1647%60 0.2180%65 0.2787%
85
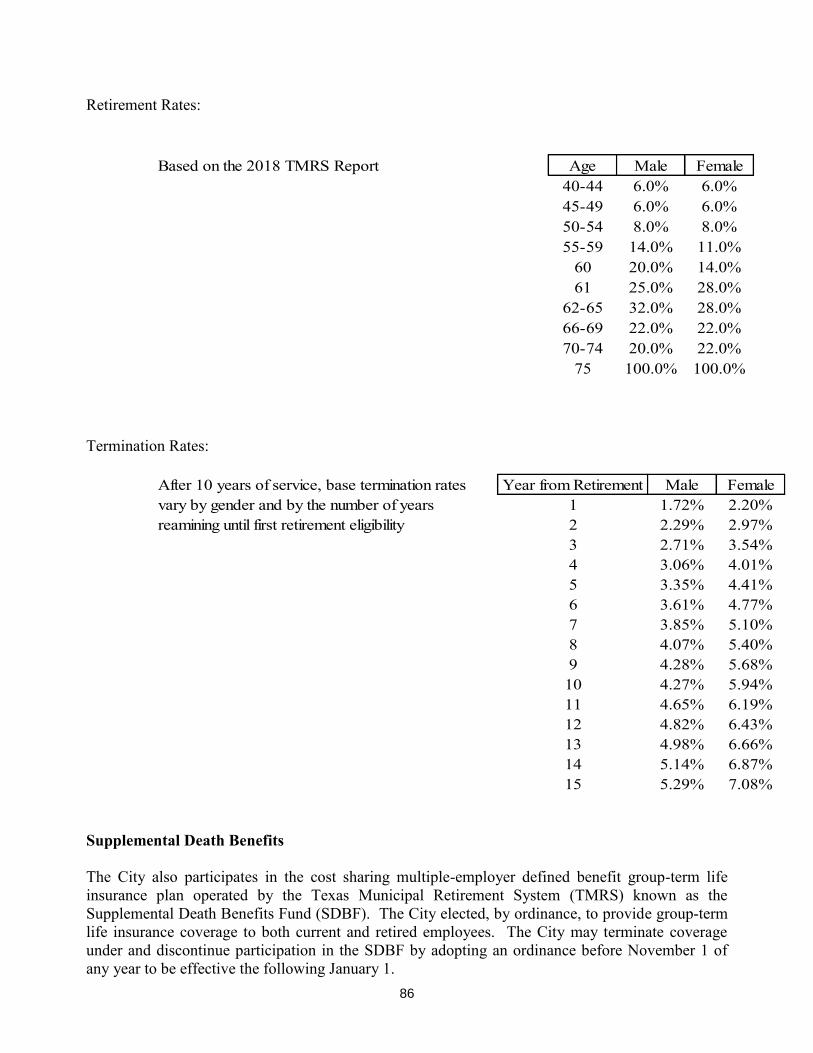
Retirement Rates:
Based on the 2018 TMRS Report Age Male Female40-44 6.0% 6.0%45-49 6.0% 6.0%50-54 8.0% 8.0%55-59 14.0% 11.0%
60 20.0% 14.0%61 25.0% 28.0%
62-65 32.0% 28.0%66-69 22.0% 22.0%70-74 20.0% 22.0%
75 100.0% 100.0%
Termination Rates:
After 10 years of service, base termination rates Year from Retirement Male Femalevary by gender and by the number of years 1 1.72% 2.20%reamining until first retirement eligibility 2 2.29% 2.97%
3 2.71% 3.54%4 3.06% 4.01%5 3.35% 4.41%6 3.61% 4.77%7 3.85% 5.10%8 4.07% 5.40%9 4.28% 5.68%
10 4.27% 5.94%11 4.65% 6.19%12 4.82% 6.43%13 4.98% 6.66%14 5.14% 6.87%15 5.29% 7.08%
Supplemental Death Benefits The City also participates in the cost sharing multiple-employer defined benefit group-term life insurance plan operated by the Texas Municipal Retirement System (TMRS) known as the Supplemental Death Benefits Fund (SDBF). The City elected, by ordinance, to provide group-term life insurance coverage to both current and retired employees. The City may terminate coverage under and discontinue participation in the SDBF by adopting an ordinance before November 1 of any year to be effective the following January 1.
86
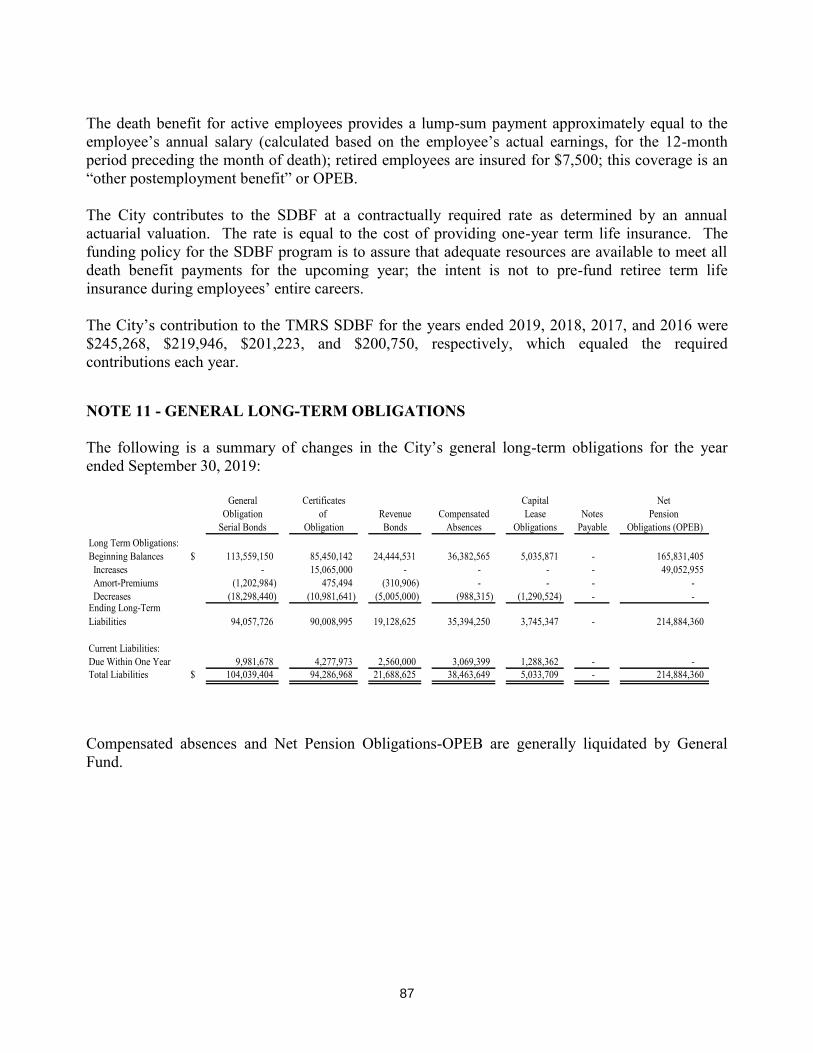
The death benefit for active employees provides a lump-sum payment approximately equal to the employee’s annual salary (calculated based on the employee’s actual earnings, for the 12-month period preceding the month of death); retired employees are insured for $7,500; this coverage is an “other postemployment benefit” or OPEB. The City contributes to the SDBF at a contractually required rate as determined by an annual actuarial valuation. The rate is equal to the cost of providing one-year term life insurance. The funding policy for the SDBF program is to assure that adequate resources are available to meet all death benefit payments for the upcoming year; the intent is not to pre-fund retiree term life insurance during employees’ entire careers. The City’s contribution to the TMRS SDBF for the years ended 2019, 2018, 2017, and 2016 were $245,268, $219,946, $201,223, and $200,750, respectively, which equaled the required contributions each year. NOTE 11 - GENERAL LONG-TERM OBLIGATIONS The following is a summary of changes in the City’s general long-term obligations for the year ended September 30, 2019:
General Certificates Capital Net Obligation of Revenue Compensated Lease Notes Pension
Serial Bonds Obligation Bonds Absences Obligations Payable Obligations (OPEB)Long Term Obligations:Beginning Balances $ 113,559,150 85,450,142 24,444,531 36,382,565 5,035,871 - 165,831,405 Increases - 15,065,000 - - - - 49,052,955 Amort-Premiums (1,202,984) 475,494 (310,906) - - - - Decreases (18,298,440) (10,981,641) (5,005,000) (988,315) (1,290,524) - - Ending Long-Term Liabilities 94,057,726 90,008,995 19,128,625 35,394,250 3,745,347 - 214,884,360
Current Liabilities:Due Within One Year 9,981,678 4,277,973 2,560,000 3,069,399 1,288,362 - - Total Liabilities $ 104,039,404 94,286,968 21,688,625 38,463,649 5,033,709 - 214,884,360
Compensated absences and Net Pension Obligations-OPEB are generally liquidated by General Fund.
87
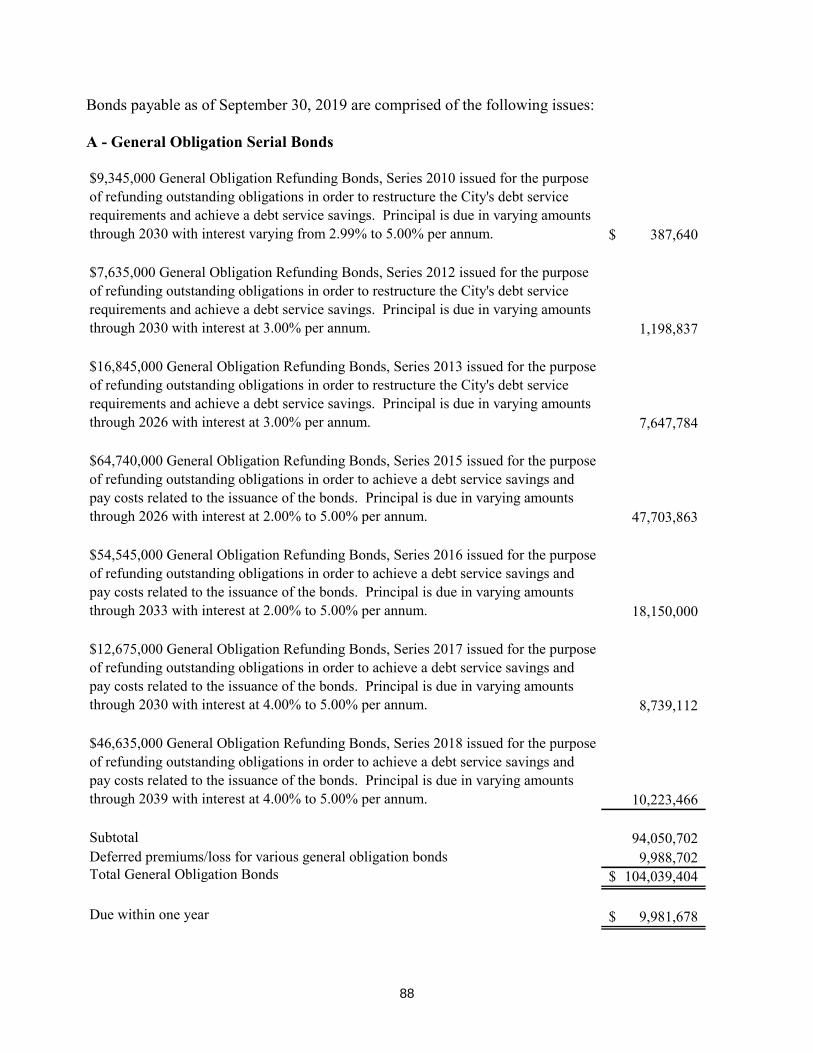
Bonds payable as of September 30, 2019 are comprised of the following issues: A - General Obligation Serial Bonds
$9,345,000 General Obligation Refunding Bonds, Series 2010 issued for the purpose of refunding outstanding obligations in order to restructure the City's debt service requirements and achieve a debt service savings. Principal is due in varying amounts through 2030 with interest varying from 2.99% to 5.00% per annum. 387,640$
$7,635,000 General Obligation Refunding Bonds, Series 2012 issued for the purpose of refunding outstanding obligations in order to restructure the City's debt service requirements and achieve a debt service savings. Principal is due in varying amounts through 2030 with interest at 3.00% per annum. 1,198,837
$16,845,000 General Obligation Refunding Bonds, Series 2013 issued for the purpose of refunding outstanding obligations in order to restructure the City's debt service requirements and achieve a debt service savings. Principal is due in varying amounts through 2026 with interest at 3.00% per annum. 7,647,784
$64,740,000 General Obligation Refunding Bonds, Series 2015 issued for the purpose of refunding outstanding obligations in order to achieve a debt service savings and pay costs related to the issuance of the bonds. Principal is due in varying amounts through 2026 with interest at 2.00% to 5.00% per annum. 47,703,863
$54,545,000 General Obligation Refunding Bonds, Series 2016 issued for the purpose of refunding outstanding obligations in order to achieve a debt service savings and pay costs related to the issuance of the bonds. Principal is due in varying amounts through 2033 with interest at 2.00% to 5.00% per annum. 18,150,000
$12,675,000 General Obligation Refunding Bonds, Series 2017 issued for the purpose of refunding outstanding obligations in order to achieve a debt service savings and pay costs related to the issuance of the bonds. Principal is due in varying amounts through 2030 with interest at 4.00% to 5.00% per annum. 8,739,112
$46,635,000 General Obligation Refunding Bonds, Series 2018 issued for the purpose of refunding outstanding obligations in order to achieve a debt service savings and pay costs related to the issuance of the bonds. Principal is due in varying amounts through 2039 with interest at 4.00% to 5.00% per annum. 10,223,466
Subtotal 94,050,702 Deferred premiums/loss for various general obligation bonds 9,988,702 Total General Obligation Bonds 104,039,404$
Due within one year 9,981,678$
88
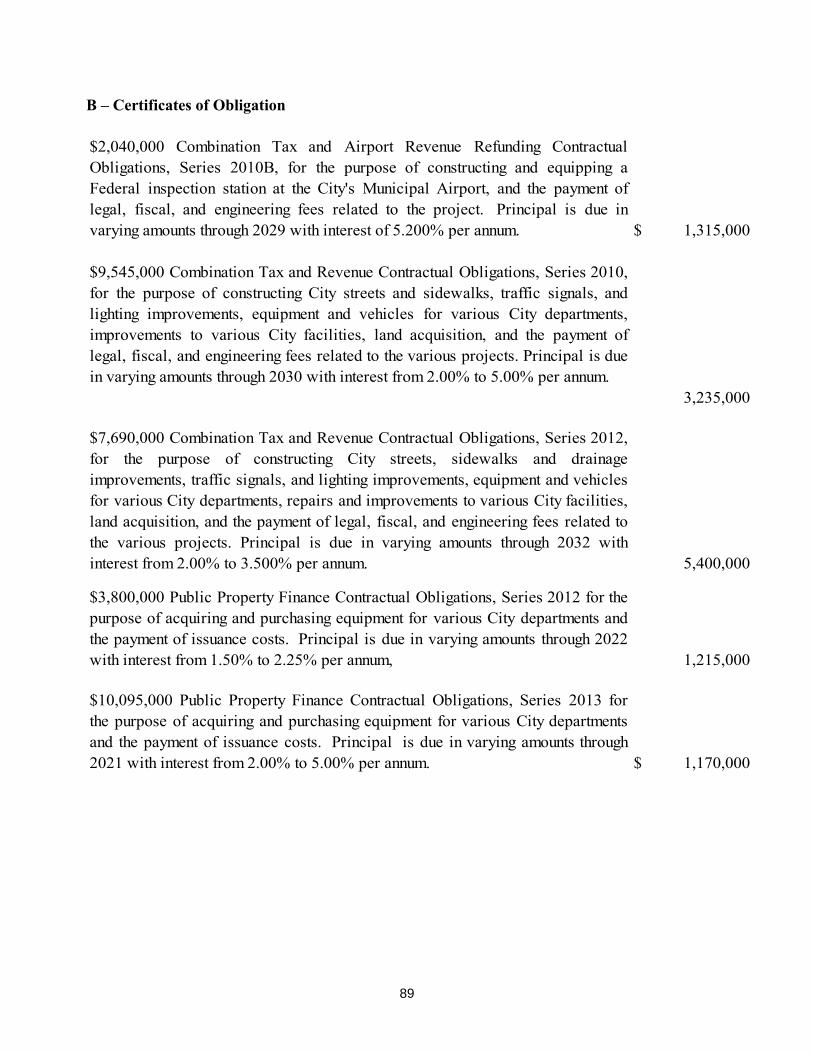
B – Certificates of Obligation
$2,040,000 Combination Tax and Airport Revenue Refunding ContractualObligations, Series 2010B, for the purpose of constructing and equipping aFederal inspection station at the City's Municipal Airport, and the payment oflegal, fiscal, and engineering fees related to the project. Principal is due invarying amounts through 2029 with interest of 5.200% per annum. $ 1,315,000
$9,545,000 Combination Tax and Revenue Contractual Obligations, Series 2010,for the purpose of constructing City streets and sidewalks, traffic signals, andlighting improvements, equipment and vehicles for various City departments,improvements to various City facilities, land acquisition, and the payment oflegal, fiscal, and engineering fees related to the various projects. Principal is duein varying amounts through 2030 with interest from 2.00% to 5.00% per annum.
3,235,000
$7,690,000 Combination Tax and Revenue Contractual Obligations, Series 2012,for the purpose of constructing City streets, sidewalks and drainageimprovements, traffic signals, and lighting improvements, equipment and vehiclesfor various City departments, repairs and improvements to various City facilities,land acquisition, and the payment of legal, fiscal, and engineering fees related tothe various projects. Principal is due in varying amounts through 2032 withinterest from 2.00% to 3.500% per annum. 5,400,000
$3,800,000 Public Property Finance Contractual Obligations, Series 2012 for thepurpose of acquiring and purchasing equipment for various City departments andthe payment of issuance costs. Principal is due in varying amounts through 2022with interest from 1.50% to 2.25% per annum, 1,215,000
$10,095,000 Public Property Finance Contractual Obligations, Series 2013 forthe purpose of acquiring and purchasing equipment for various City departmentsand the payment of issuance costs. Principal is due in varying amounts through2021 with interest from 2.00% to 5.00% per annum. $ 1,170,000
89
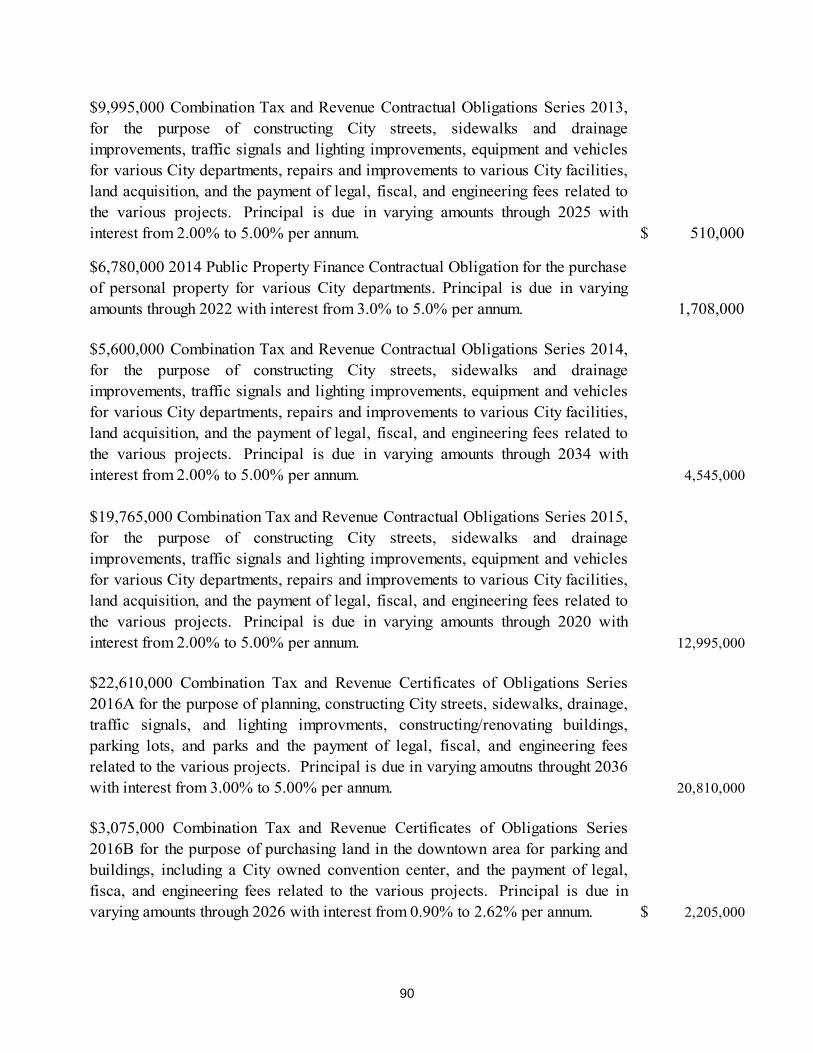
$9,995,000 Combination Tax and Revenue Contractual Obligations Series 2013,for the purpose of constructing City streets, sidewalks and drainageimprovements, traffic signals and lighting improvements, equipment and vehiclesfor various City departments, repairs and improvements to various City facilities,land acquisition, and the payment of legal, fiscal, and engineering fees related tothe various projects. Principal is due in varying amounts through 2025 withinterest from 2.00% to 5.00% per annum. $ 510,000
$6,780,000 2014 Public Property Finance Contractual Obligation for the purchase of personal property for various City departments. Principal is due in varyingamounts through 2022 with interest from 3.0% to 5.0% per annum. 1,708,000
$5,600,000 Combination Tax and Revenue Contractual Obligations Series 2014,for the purpose of constructing City streets, sidewalks and drainageimprovements, traffic signals and lighting improvements, equipment and vehiclesfor various City departments, repairs and improvements to various City facilities,land acquisition, and the payment of legal, fiscal, and engineering fees related tothe various projects. Principal is due in varying amounts through 2034 withinterest from 2.00% to 5.00% per annum. 4,545,000
$19,765,000 Combination Tax and Revenue Contractual Obligations Series 2015,for the purpose of constructing City streets, sidewalks and drainageimprovements, traffic signals and lighting improvements, equipment and vehiclesfor various City departments, repairs and improvements to various City facilities,land acquisition, and the payment of legal, fiscal, and engineering fees related tothe various projects. Principal is due in varying amounts through 2020 withinterest from 2.00% to 5.00% per annum. 12,995,000
$22,610,000 Combination Tax and Revenue Certificates of Obligations Series2016A for the purpose of planning, constructing City streets, sidewalks, drainage,traffic signals, and lighting improvments, constructing/renovating buildings,parking lots, and parks and the payment of legal, fiscal, and engineering feesrelated to the various projects. Principal is due in varying amoutns throught 2036with interest from 3.00% to 5.00% per annum. 20,810,000
$3,075,000 Combination Tax and Revenue Certificates of Obligations Series2016B for the purpose of purchasing land in the downtown area for parking andbuildings, including a City owned convention center, and the payment of legal,fisca, and engineering fees related to the various projects. Principal is due invarying amounts through 2026 with interest from 0.90% to 2.62% per annum. $ 2,205,000
90
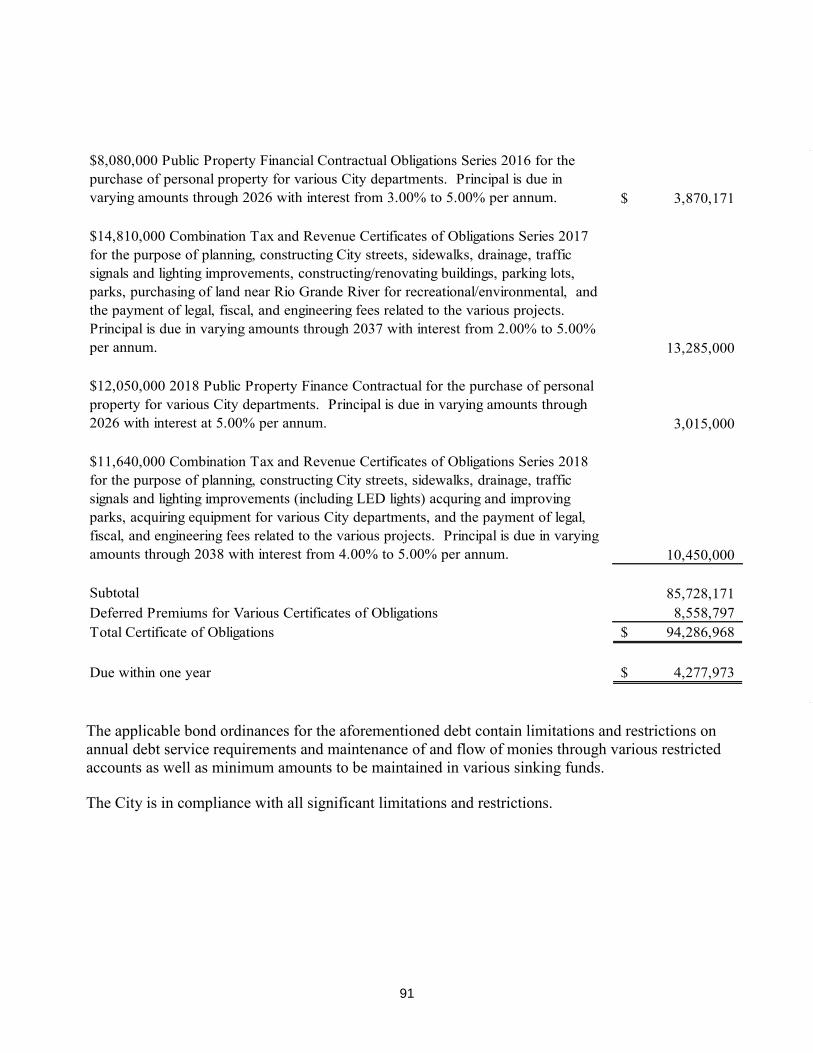
$8,080,000 Public Property Financial Contractual Obligations Series 2016 for the purchase of personal property for various City departments. Principal is due in varying amounts through 2026 with interest from 3.00% to 5.00% per annum. 3,870,171$
$14,810,000 Combination Tax and Revenue Certificates of Obligations Series 2017 for the purpose of planning, constructing City streets, sidewalks, drainage, traffic signals and lighting improvements, constructing/renovating buildings, parking lots, parks, purchasing of land near Rio Grande River for recreational/environmental, and the payment of legal, fiscal, and engineering fees related to the various projects. Principal is due in varying amounts through 2037 with interest from 2.00% to 5.00% per annum. 13,285,000
$12,050,000 2018 Public Property Finance Contractual for the purchase of personal property for various City departments. Principal is due in varying amounts through 2026 with interest at 5.00% per annum. 3,015,000
$11,640,000 Combination Tax and Revenue Certificates of Obligations Series 2018 for the purpose of planning, constructing City streets, sidewalks, drainage, traffic signals and lighting improvements (including LED lights) acquring and improving parks, acquiring equipment for various City departments, and the payment of legal, fiscal, and engineering fees related to the various projects. Principal is due in varying amounts through 2038 with interest from 4.00% to 5.00% per annum. 10,450,000
Subtotal 85,728,171 Deferred Premiums for Various Certificates of Obligations 8,558,797 Total Certificate of Obligations 94,286,968$
Due within one year 4,277,973$
The applicable bond ordinances for the aforementioned debt contain limitations and restrictions on annual debt service requirements and maintenance of and flow of monies through various restricted accounts as well as minimum amounts to be maintained in various sinking funds. The City is in compliance with all significant limitations and restrictions.
91
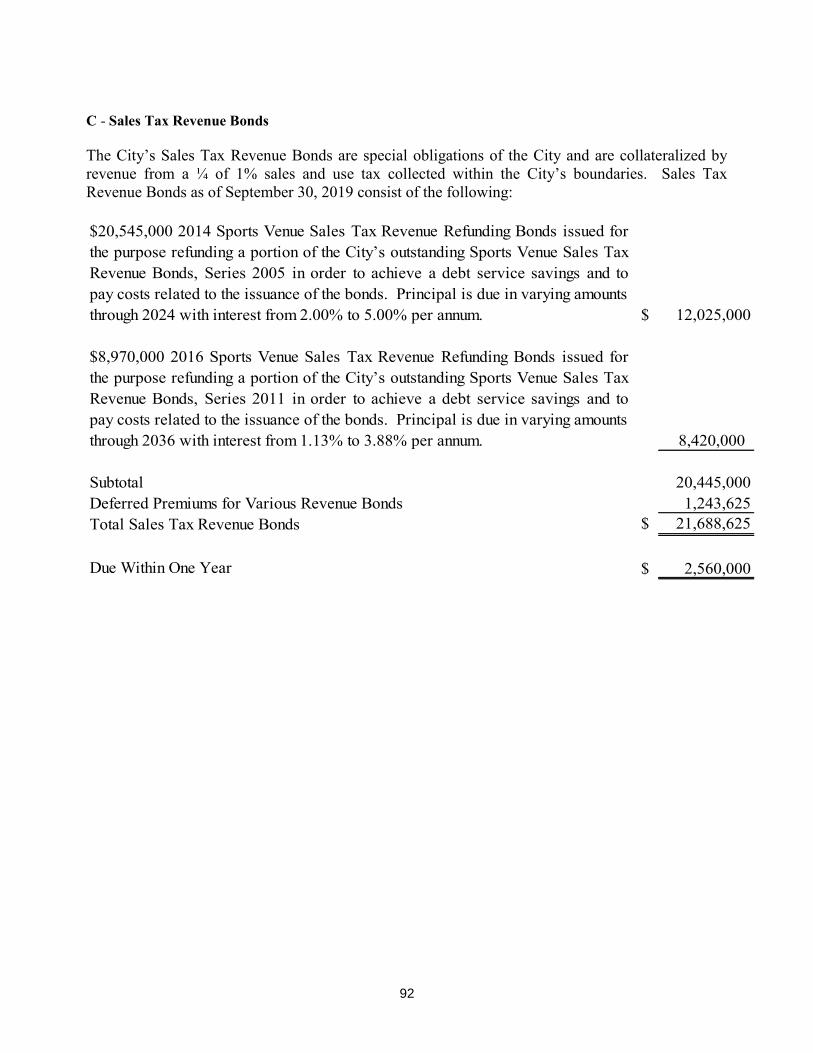
C - Sales Tax Revenue Bonds The City’s Sales Tax Revenue Bonds are special obligations of the City and are collateralized by revenue from a ¼ of 1% sales and use tax collected within the City’s boundaries. Sales Tax Revenue Bonds as of September 30, 2019 consist of the following: $20,545,000 2014 Sports Venue Sales Tax Revenue Refunding Bonds issued forthe purpose refunding a portion of the City’s outstanding Sports Venue Sales TaxRevenue Bonds, Series 2005 in order to achieve a debt service savings and topay costs related to the issuance of the bonds. Principal is due in varying amounts through 2024 with interest from 2.00% to 5.00% per annum. $ 12,025,000
$8,970,000 2016 Sports Venue Sales Tax Revenue Refunding Bonds issued forthe purpose refunding a portion of the City’s outstanding Sports Venue Sales TaxRevenue Bonds, Series 2011 in order to achieve a debt service savings and topay costs related to the issuance of the bonds. Principal is due in varying amounts through 2036 with interest from 1.13% to 3.88% per annum. 8,420,000
Subtotal 20,445,000Deferred Premiums for Various Revenue Bonds 1,243,625Total Sales Tax Revenue Bonds $ 21,688,625
Due Within One Year $ 2,560,000
92
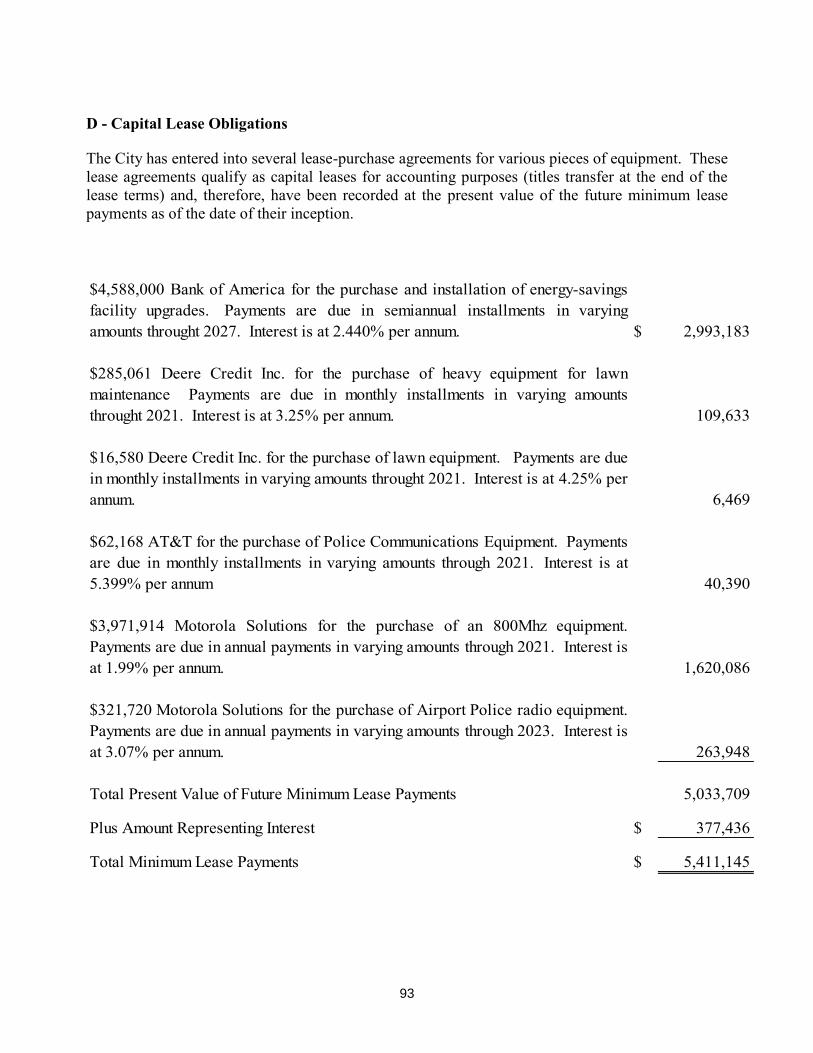
D - Capital Lease Obligations The City has entered into several lease-purchase agreements for various pieces of equipment. These lease agreements qualify as capital leases for accounting purposes (titles transfer at the end of the lease terms) and, therefore, have been recorded at the present value of the future minimum lease payments as of the date of their inception. $4,588,000 Bank of America for the purchase and installation of energy-savingsfacility upgrades. Payments are due in semiannual installments in varyingamounts throught 2027. Interest is at 2.440% per annum. $ 2,993,183
$285,061 Deere Credit Inc. for the purchase of heavy equipment for lawnmaintenance Payments are due in monthly installments in varying amountsthrought 2021. Interest is at 3.25% per annum. 109,633
$16,580 Deere Credit Inc. for the purchase of lawn equipment. Payments are duein monthly installments in varying amounts throught 2021. Interest is at 4.25% perannum. 6,469
$62,168 AT&T for the purchase of Police Communications Equipment. Paymentsare due in monthly installments in varying amounts through 2021. Interest is at5.399% per annum 40,390
$3,971,914 Motorola Solutions for the purchase of an 800Mhz equipment.Payments are due in annual payments in varying amounts through 2021. Interest isat 1.99% per annum. 1,620,086
$321,720 Motorola Solutions for the purchase of Airport Police radio equipment.Payments are due in annual payments in varying amounts through 2023. Interest isat 3.07% per annum. 263,948
Total Present Value of Future Minimum Lease Payments 5,033,709
Plus Amount Representing Interest $ 377,436
Total Minimum Lease Payments $ 5,411,145
93
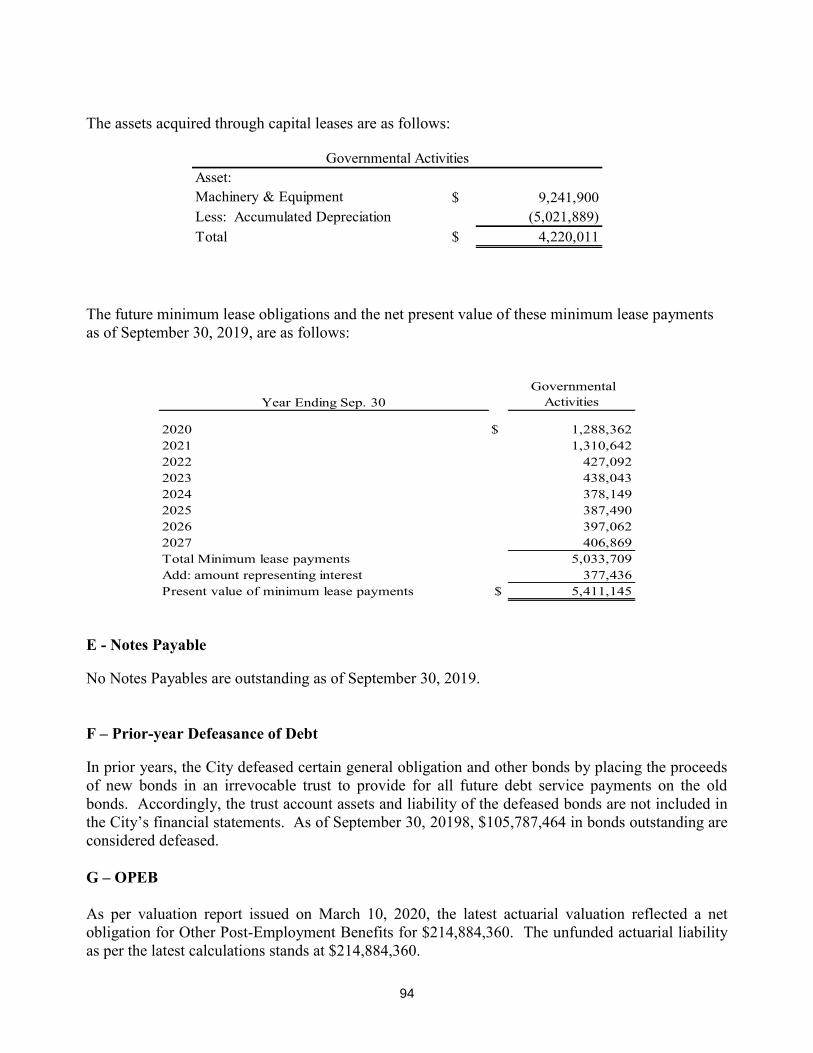
The assets acquired through capital leases are as follows:
Asset:Machinery & Equipment $ 9,241,900Less: Accumulated Depreciation (5,021,889)Total $ 4,220,011
Governmental Activities
The future minimum lease obligations and the net present value of these minimum lease payments as of September 30, 2019, are as follows:
Year Ending Sep. 30 Governmental
Activities
2020 $ 1,288,3622021 1,310,6422022 427,0922023 438,0432024 378,1492025 387,4902026 397,0622027 406,869Total Minimum lease payments 5,033,709Add: amount representing interest 377,436Present value of minimum lease payments $ 5,411,145
E - Notes Payable No Notes Payables are outstanding as of September 30, 2019. F – Prior-year Defeasance of Debt In prior years, the City defeased certain general obligation and other bonds by placing the proceeds of new bonds in an irrevocable trust to provide for all future debt service payments on the old bonds. Accordingly, the trust account assets and liability of the defeased bonds are not included in the City’s financial statements. As of September 30, 20198, $105,787,464 in bonds outstanding are considered defeased. G – OPEB As per valuation report issued on March 10, 2020, the latest actuarial valuation reflected a net obligation for Other Post-Employment Benefits for $214,884,360. The unfunded actuarial liability as per the latest calculations stands at $214,884,360.
94
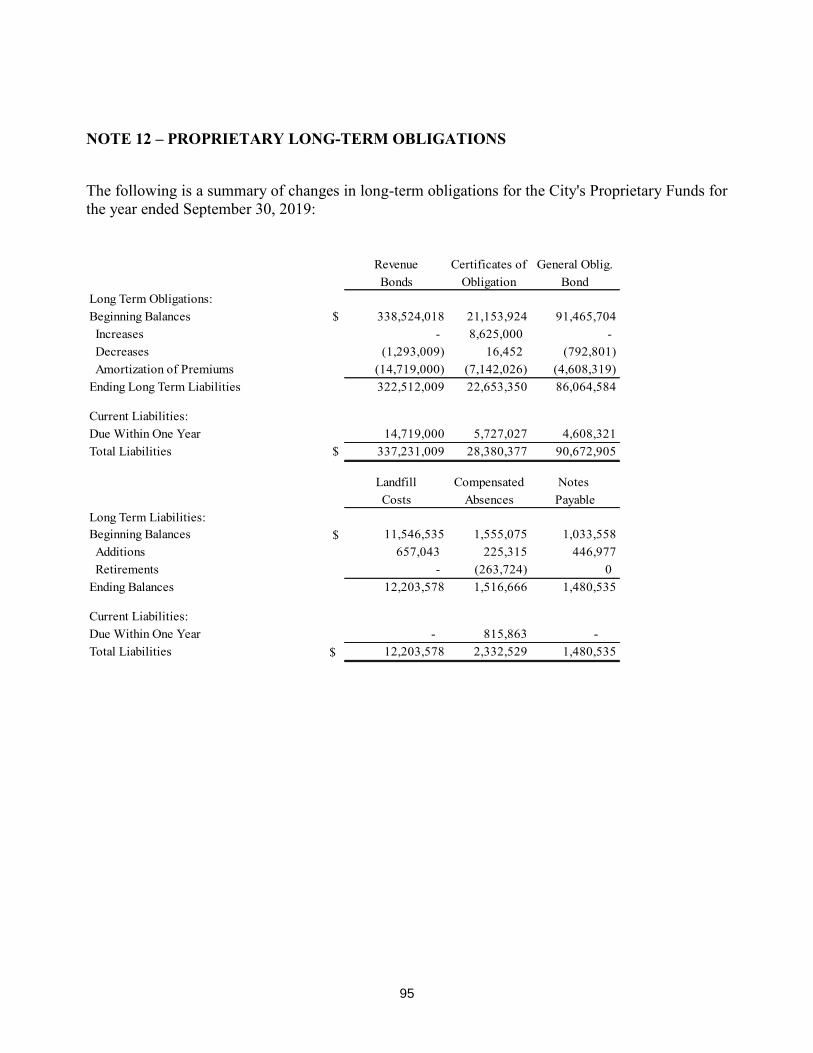
NOTE 12 – PROPRIETARY LONG-TERM OBLIGATIONS The following is a summary of changes in long-term obligations for the City's Proprietary Funds for the year ended September 30, 2019:
Revenue Certificates of General Oblig.Bonds Obligation Bond
Long Term Obligations:Beginning Balances $ 338,524,018 21,153,924 91,465,704 Increases - 8,625,000 - Decreases (1,293,009) 16,452 (792,801) Amortization of Premiums (14,719,000) (7,142,026) (4,608,319) Ending Long Term Liabilities 322,512,009 22,653,350 86,064,584
Current Liabilities:Due Within One Year 14,719,000 5,727,027 4,608,321Total Liabilities $ 337,231,009 28,380,377 90,672,905
Landfill Compensated Notes Costs Absences Payable
Long Term Liabilities:Beginning Balances $ 11,546,535 1,555,075 1,033,558 Additions 657,043 225,315 446,977 Retirements - (263,724) 0Ending Balances 12,203,578 1,516,666 1,480,535
Current Liabilities:Due Within One Year - 815,863 - Total Liabilities $ 12,203,578 2,332,529 1,480,535
95
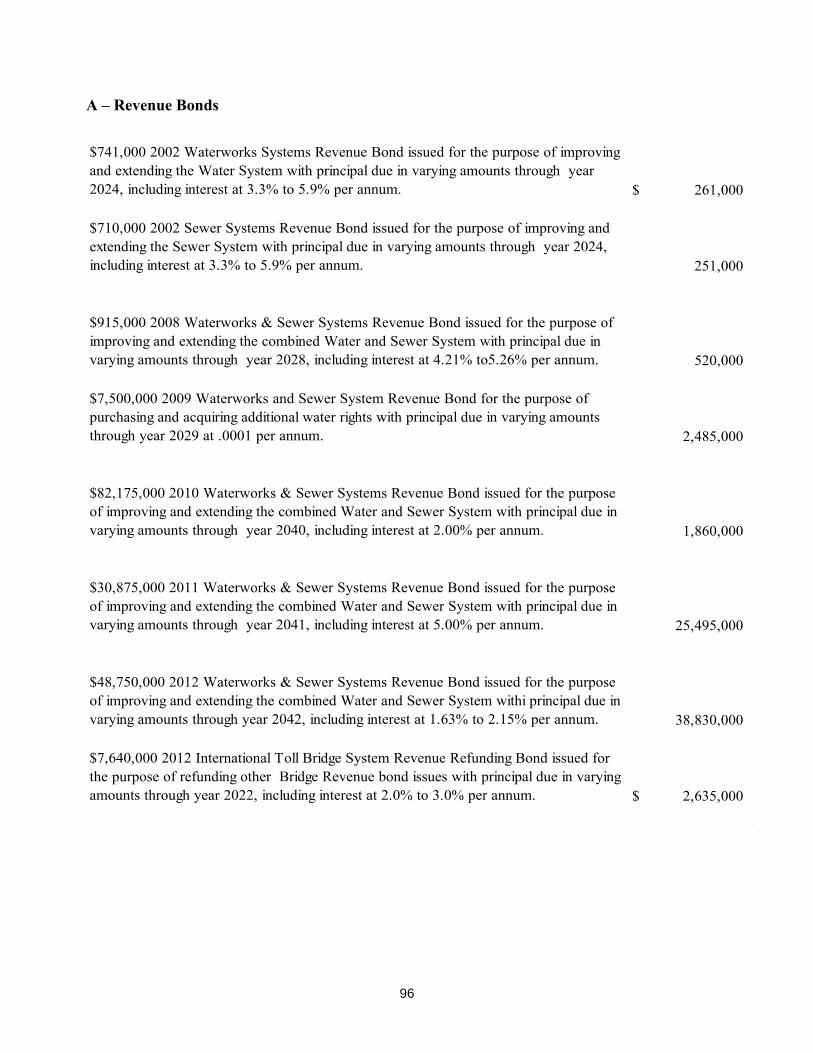
A – Revenue Bonds
$741,000 2002 Waterworks Systems Revenue Bond issued for the purpose of improving and extending the Water System with principal due in varying amounts through year 2024, including interest at 3.3% to 5.9% per annum. $ 261,000
$710,000 2002 Sewer Systems Revenue Bond issued for the purpose of improving and extending the Sewer System with principal due in varying amounts through year 2024, including interest at 3.3% to 5.9% per annum. 251,000
$915,000 2008 Waterworks & Sewer Systems Revenue Bond issued for the purpose of improving and extending the combined Water and Sewer System with principal due in varying amounts through year 2028, including interest at 4.21% to5.26% per annum. 520,000
$7,500,000 2009 Waterworks and Sewer System Revenue Bond for the purpose of purchasing and acquiring additional water rights with principal due in varying amounts through year 2029 at .0001 per annum. 2,485,000
$82,175,000 2010 Waterworks & Sewer Systems Revenue Bond issued for the purpose of improving and extending the combined Water and Sewer System with principal due in varying amounts through year 2040, including interest at 2.00% per annum. 1,860,000
$30,875,000 2011 Waterworks & Sewer Systems Revenue Bond issued for the purpose of improving and extending the combined Water and Sewer System with principal due in varying amounts through year 2041, including interest at 5.00% per annum. 25,495,000
$48,750,000 2012 Waterworks & Sewer Systems Revenue Bond issued for the purpose of improving and extending the combined Water and Sewer System withi principal due in varying amounts through year 2042, including interest at 1.63% to 2.15% per annum. 38,830,000
$7,640,000 2012 International Toll Bridge System Revenue Refunding Bond issued for the purpose of refunding other Bridge Revenue bond issues with principal due in varying amounts through year 2022, including interest at 2.0% to 3.0% per annum. $ 2,635,000
96
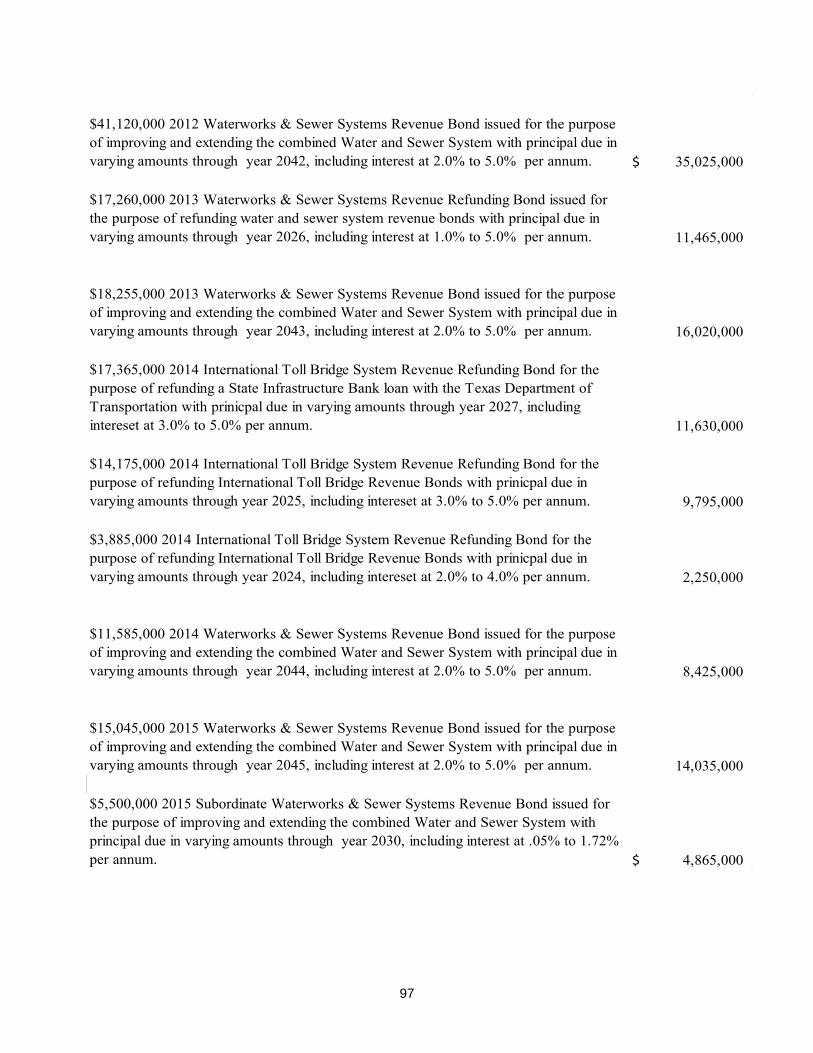
$41,120,000 2012 Waterworks & Sewer Systems Revenue Bond issued for the purpose of improving and extending the combined Water and Sewer System with principal due in varying amounts through year 2042, including interest at 2.0% to 5.0% per annum. $ 35,025,000
$17,260,000 2013 Waterworks & Sewer Systems Revenue Refunding Bond issued for the purpose of refunding water and sewer system revenue bonds with principal due in varying amounts through year 2026, including interest at 1.0% to 5.0% per annum. 11,465,000
$18,255,000 2013 Waterworks & Sewer Systems Revenue Bond issued for the purpose of improving and extending the combined Water and Sewer System with principal due in varying amounts through year 2043, including interest at 2.0% to 5.0% per annum. 16,020,000
$17,365,000 2014 International Toll Bridge System Revenue Refunding Bond for the purpose of refunding a State Infrastructure Bank loan with the Texas Department of Transportation with prinicpal due in varying amounts through year 2027, including intereset at 3.0% to 5.0% per annum. 11,630,000
$14,175,000 2014 International Toll Bridge System Revenue Refunding Bond for the purpose of refunding International Toll Bridge Revenue Bonds with prinicpal due in varying amounts through year 2025, including intereset at 3.0% to 5.0% per annum. 9,795,000
$3,885,000 2014 International Toll Bridge System Revenue Refunding Bond for the purpose of refunding International Toll Bridge Revenue Bonds with prinicpal due in varying amounts through year 2024, including intereset at 2.0% to 4.0% per annum. 2,250,000
$11,585,000 2014 Waterworks & Sewer Systems Revenue Bond issued for the purpose of improving and extending the combined Water and Sewer System with principal due in varying amounts through year 2044, including interest at 2.0% to 5.0% per annum. 8,425,000
$15,045,000 2015 Waterworks & Sewer Systems Revenue Bond issued for the purpose of improving and extending the combined Water and Sewer System with principal due in varying amounts through year 2045, including interest at 2.0% to 5.0% per annum. 14,035,000
$5,500,000 2015 Subordinate Waterworks & Sewer Systems Revenue Bond issued for the purpose of improving and extending the combined Water and Sewer System with principal due in varying amounts through year 2030, including interest at .05% to 1.72% per annum. $ 4,865,000
97
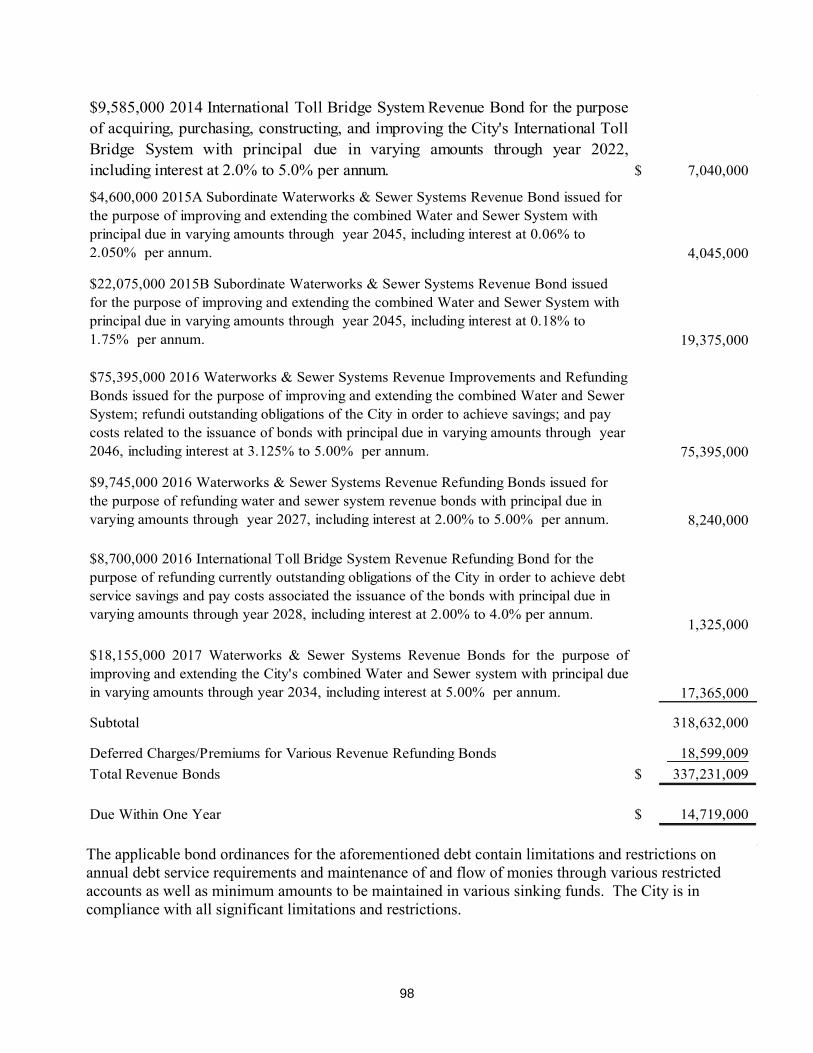
$9,585,000 2014 International Toll Bridge System Revenue Bond for the purposeof acquiring, purchasing, constructing, and improving the City's International TollBridge System with principal due in varying amounts through year 2022,including interest at 2.0% to 5.0% per annum. $ 7,040,000
$4,600,000 2015A Subordinate Waterworks & Sewer Systems Revenue Bond issued for the purpose of improving and extending the combined Water and Sewer System with principal due in varying amounts through year 2045, including interest at 0.06% to 2.050% per annum. 4,045,000
$22,075,000 2015B Subordinate Waterworks & Sewer Systems Revenue Bond issued for the purpose of improving and extending the combined Water and Sewer System with principal due in varying amounts through year 2045, including interest at 0.18% to 1.75% per annum. 19,375,000
$75,395,000 2016 Waterworks & Sewer Systems Revenue Improvements and Refunding Bonds issued for the purpose of improving and extending the combined Water and Sewer System; refundi outstanding obligations of the City in order to achieve savings; and pay costs related to the issuance of bonds with principal due in varying amounts through year 2046, including interest at 3.125% to 5.00% per annum. 75,395,000
$9,745,000 2016 Waterworks & Sewer Systems Revenue Refunding Bonds issued for the purpose of refunding water and sewer system revenue bonds with principal due in varying amounts through year 2027, including interest at 2.00% to 5.00% per annum. 8,240,000
$8,700,000 2016 International Toll Bridge System Revenue Refunding Bond for the purpose of refunding currently outstanding obligations of the City in order to achieve debt service savings and pay costs associated the issuance of the bonds with principal due in varying amounts through year 2028, including interest at 2.00% to 4.0% per annum.
1,325,000
$18,155,000 2017 Waterworks & Sewer Systems Revenue Bonds for the purpose ofimproving and extending the City's combined Water and Sewer system with principal duein varying amounts through year 2034, including interest at 5.00% per annum. 17,365,000
Subtotal 318,632,000
Deferred Charges/Premiums for Various Revenue Refunding Bonds 18,599,009 Total Revenue Bonds $ 337,231,009
Due Within One Year $ 14,719,000
The applicable bond ordinances for the aforementioned debt contain limitations and restrictions on annual debt service requirements and maintenance of and flow of monies through various restricted accounts as well as minimum amounts to be maintained in various sinking funds. The City is in compliance with all significant limitations and restrictions.
98
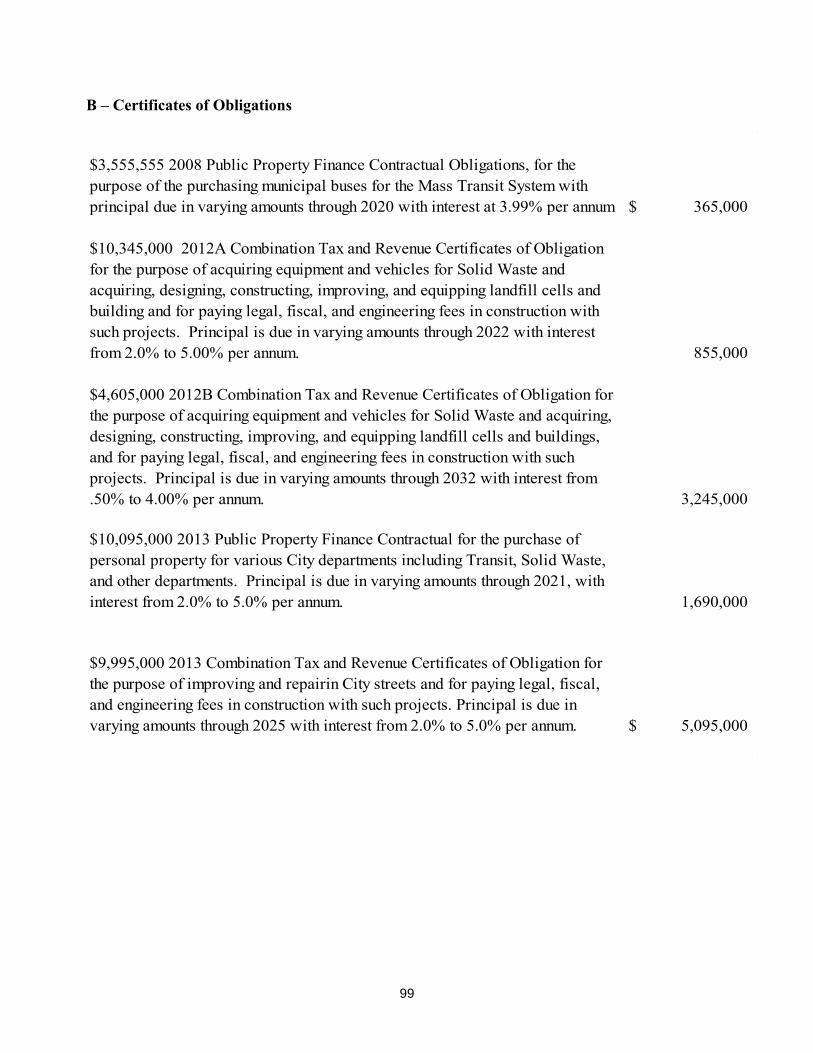
B – Certificates of Obligations
$3,555,555 2008 Public Property Finance Contractual Obligations, for the purpose of the purchasing municipal buses for the Mass Transit System with principal due in varying amounts through 2020 with interest at 3.99% per annum 365,000$
$10,345,000 2012A Combination Tax and Revenue Certificates of Obligation for the purpose of acquiring equipment and vehicles for Solid Waste and acquiring, designing, constructing, improving, and equipping landfill cells and building and for paying legal, fiscal, and engineering fees in construction with such projects. Principal is due in varying amounts through 2022 with interest from 2.0% to 5.00% per annum. 855,000
$4,605,000 2012B Combination Tax and Revenue Certificates of Obligation for the purpose of acquiring equipment and vehicles for Solid Waste and acquiring, designing, constructing, improving, and equipping landfill cells and buildings, and for paying legal, fiscal, and engineering fees in construction with such projects. Principal is due in varying amounts through 2032 with interest from .50% to 4.00% per annum. 3,245,000
$10,095,000 2013 Public Property Finance Contractual for the purchase of personal property for various City departments including Transit, Solid Waste, and other departments. Principal is due in varying amounts through 2021, with interest from 2.0% to 5.0% per annum. 1,690,000
$9,995,000 2013 Combination Tax and Revenue Certificates of Obligation for the purpose of improving and repairin City streets and for paying legal, fiscal, and engineering fees in construction with such projects. Principal is due in varying amounts through 2025 with interest from 2.0% to 5.0% per annum. 5,095,000$
99
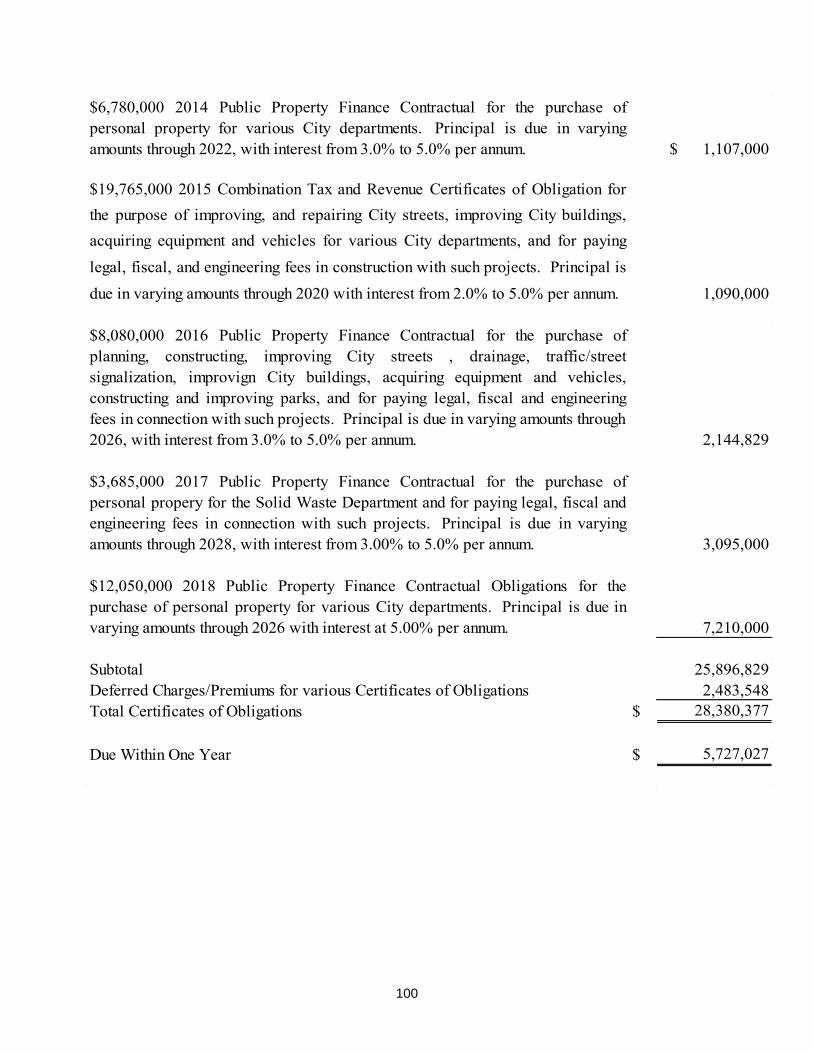
$6,780,000 2014 Public Property Finance Contractual for the purchase ofpersonal property for various City departments. Principal is due in varyingamounts through 2022, with interest from 3.0% to 5.0% per annum. $ 1,107,000
$19,765,000 2015 Combination Tax and Revenue Certificates of Obligation forthe purpose of improving, and repairing City streets, improving City buildings,acquiring equipment and vehicles for various City departments, and for payinglegal, fiscal, and engineering fees in construction with such projects. Principal isdue in varying amounts through 2020 with interest from 2.0% to 5.0% per annum. 1,090,000
$8,080,000 2016 Public Property Finance Contractual for the purchase ofplanning, constructing, improving City streets , drainage, traffic/streetsignalization, improvign City buildings, acquiring equipment and vehicles,constructing and improving parks, and for paying legal, fiscal and engineeringfees in connection with such projects. Principal is due in varying amounts through 2026, with interest from 3.0% to 5.0% per annum. 2,144,829
$3,685,000 2017 Public Property Finance Contractual for the purchase ofpersonal propery for the Solid Waste Department and for paying legal, fiscal andengineering fees in connection with such projects. Principal is due in varyingamounts through 2028, with interest from 3.00% to 5.0% per annum. 3,095,000
$12,050,000 2018 Public Property Finance Contractual Obligations for thepurchase of personal property for various City departments. Principal is due invarying amounts through 2026 with interest at 5.00% per annum. 7,210,000
Subtotal 25,896,829Deferred Charges/Premiums for various Certificates of Obligations 2,483,548Total Certificates of Obligations $ 28,380,377
Due Within One Year $ 5,727,027
100
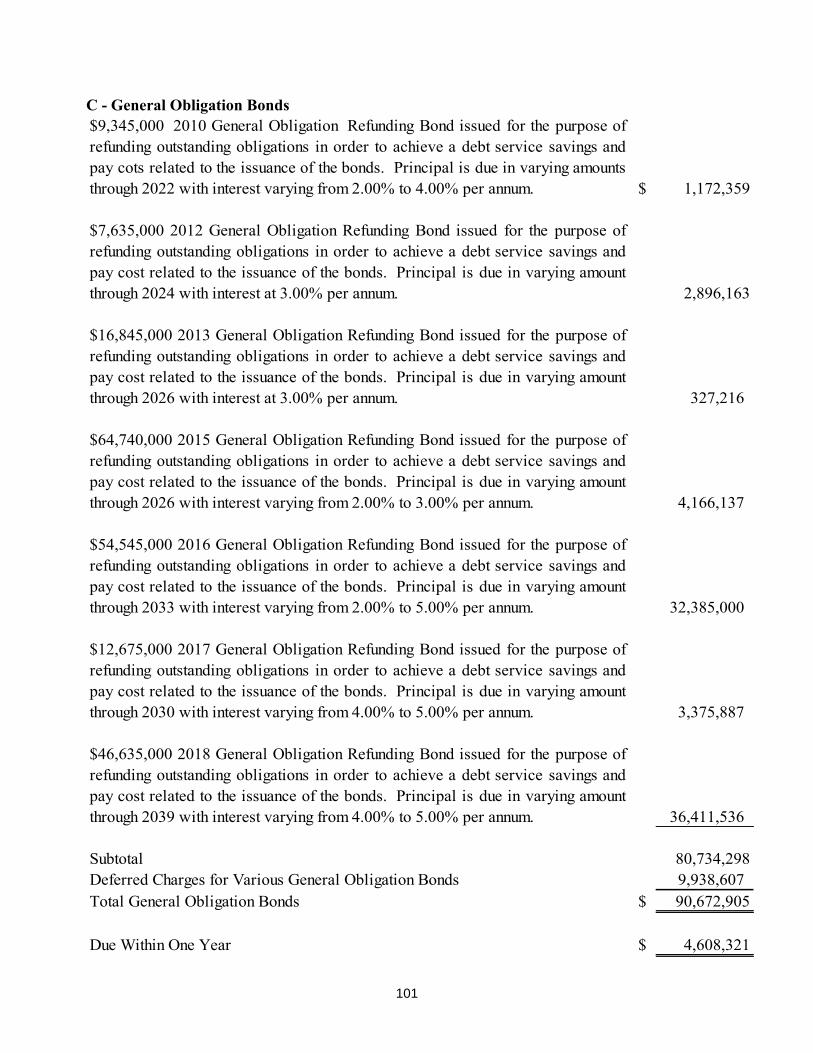
C - General Obligation Bonds $9,345,000 2010 General Obligation Refunding Bond issued for the purpose ofrefunding outstanding obligations in order to achieve a debt service savings andpay cots related to the issuance of the bonds. Principal is due in varying amountsthrough 2022 with interest varying from 2.00% to 4.00% per annum. $ 1,172,359
$7,635,000 2012 General Obligation Refunding Bond issued for the purpose ofrefunding outstanding obligations in order to achieve a debt service savings andpay cost related to the issuance of the bonds. Principal is due in varying amountthrough 2024 with interest at 3.00% per annum. 2,896,163
$16,845,000 2013 General Obligation Refunding Bond issued for the purpose ofrefunding outstanding obligations in order to achieve a debt service savings andpay cost related to the issuance of the bonds. Principal is due in varying amountthrough 2026 with interest at 3.00% per annum. 327,216
$64,740,000 2015 General Obligation Refunding Bond issued for the purpose ofrefunding outstanding obligations in order to achieve a debt service savings andpay cost related to the issuance of the bonds. Principal is due in varying amountthrough 2026 with interest varying from 2.00% to 3.00% per annum. 4,166,137
$54,545,000 2016 General Obligation Refunding Bond issued for the purpose ofrefunding outstanding obligations in order to achieve a debt service savings andpay cost related to the issuance of the bonds. Principal is due in varying amountthrough 2033 with interest varying from 2.00% to 5.00% per annum. 32,385,000
$12,675,000 2017 General Obligation Refunding Bond issued for the purpose ofrefunding outstanding obligations in order to achieve a debt service savings andpay cost related to the issuance of the bonds. Principal is due in varying amountthrough 2030 with interest varying from 4.00% to 5.00% per annum. 3,375,887
$46,635,000 2018 General Obligation Refunding Bond issued for the purpose ofrefunding outstanding obligations in order to achieve a debt service savings andpay cost related to the issuance of the bonds. Principal is due in varying amountthrough 2039 with interest varying from 4.00% to 5.00% per annum. 36,411,536
Subtotal 80,734,298Deferred Charges for Various General Obligation Bonds 9,938,607Total General Obligation Bonds $ 90,672,905
Due Within One Year $ 4,608,321
101
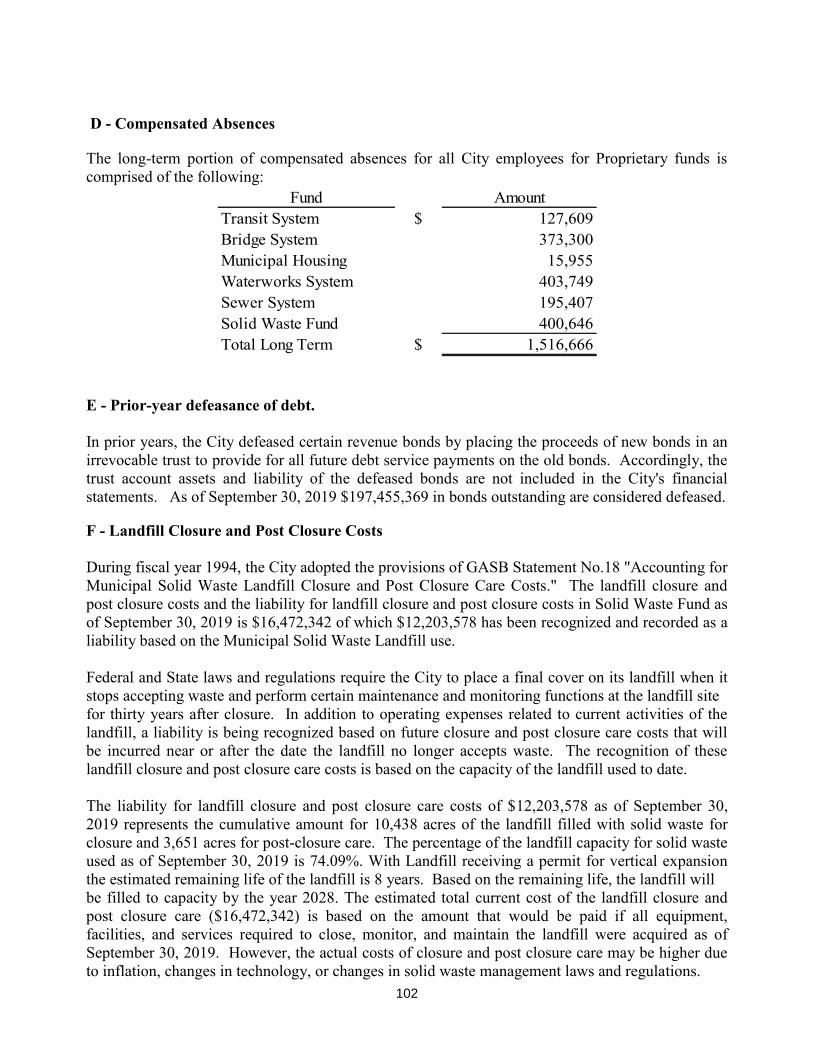
D - Compensated Absences The long-term portion of compensated absences for all City employees for Proprietary funds is comprised of the following:
Fund AmountTransit System $ 127,609Bridge System 373,300Municipal Housing 15,955Waterworks System 403,749Sewer System 195,407Solid Waste Fund 400,646Total Long Term $ 1,516,666
E - Prior-year defeasance of debt. In prior years, the City defeased certain revenue bonds by placing the proceeds of new bonds in an irrevocable trust to provide for all future debt service payments on the old bonds. Accordingly, the trust account assets and liability of the defeased bonds are not included in the City's financial statements. As of September 30, 2019 $197,455,369 in bonds outstanding are considered defeased. F - Landfill Closure and Post Closure Costs During fiscal year 1994, the City adopted the provisions of GASB Statement No.18 "Accounting for Municipal Solid Waste Landfill Closure and Post Closure Care Costs." The landfill closure and post closure costs and the liability for landfill closure and post closure costs in Solid Waste Fund as of September 30, 2019 is $16,472,342 of which $12,203,578 has been recognized and recorded as a liability based on the Municipal Solid Waste Landfill use. Federal and State laws and regulations require the City to place a final cover on its landfill when it stops accepting waste and perform certain maintenance and monitoring functions at the landfill site for thirty years after closure. In addition to operating expenses related to current activities of the landfill, a liability is being recognized based on future closure and post closure care costs that will be incurred near or after the date the landfill no longer accepts waste. The recognition of these landfill closure and post closure care costs is based on the capacity of the landfill used to date. The liability for landfill closure and post closure care costs of $12,203,578 as of September 30, 2019 represents the cumulative amount for 10,438 acres of the landfill filled with solid waste for closure and 3,651 acres for post-closure care. The percentage of the landfill capacity for solid waste used as of September 30, 2019 is 74.09%. With Landfill receiving a permit for vertical expansion the estimated remaining life of the landfill is 8 years. Based on the remaining life, the landfill will be filled to capacity by the year 2028. The estimated total current cost of the landfill closure and post closure care ($16,472,342) is based on the amount that would be paid if all equipment, facilities, and services required to close, monitor, and maintain the landfill were acquired as of September 30, 2019. However, the actual costs of closure and post closure care may be higher due to inflation, changes in technology, or changes in solid waste management laws and regulations.
102
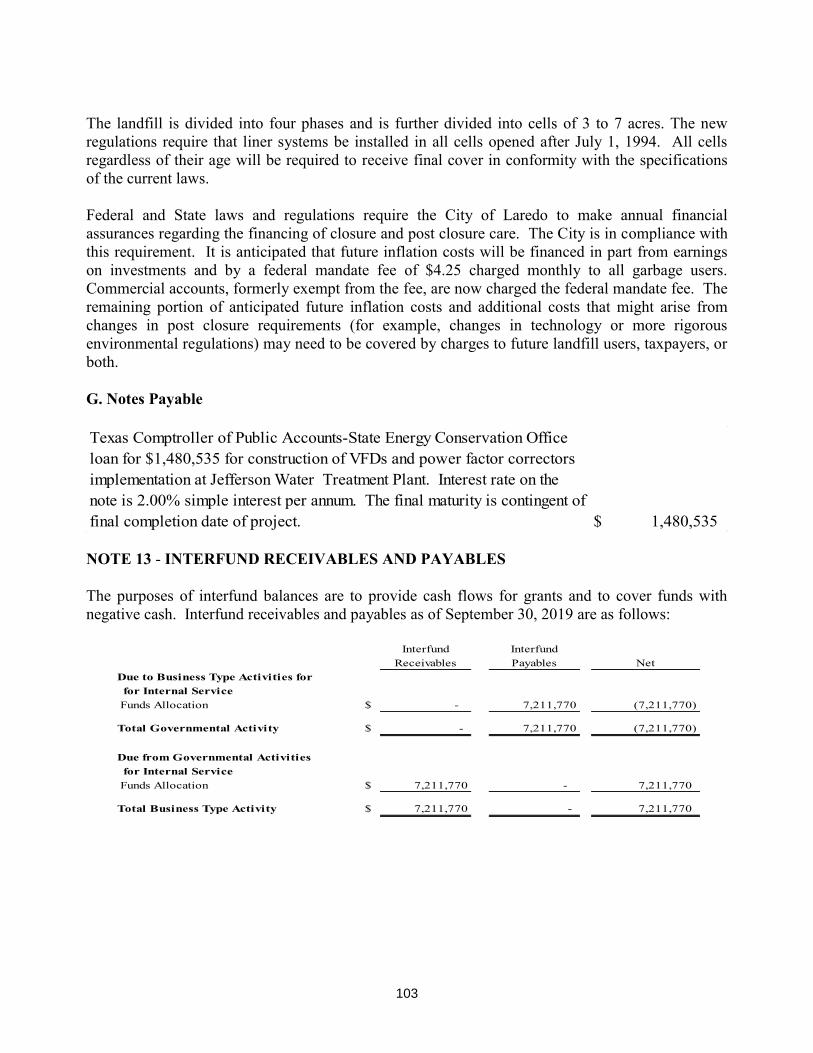
The landfill is divided into four phases and is further divided into cells of 3 to 7 acres. The new regulations require that liner systems be installed in all cells opened after July 1, 1994. All cells regardless of their age will be required to receive final cover in conformity with the specifications of the current laws. Federal and State laws and regulations require the City of Laredo to make annual financial assurances regarding the financing of closure and post closure care. The City is in compliance with this requirement. It is anticipated that future inflation costs will be financed in part from earnings on investments and by a federal mandate fee of $4.25 charged monthly to all garbage users. Commercial accounts, formerly exempt from the fee, are now charged the federal mandate fee. The remaining portion of anticipated future inflation costs and additional costs that might arise from changes in post closure requirements (for example, changes in technology or more rigorous environmental regulations) may need to be covered by charges to future landfill users, taxpayers, or both. G. Notes Payable Texas Comptroller of Public Accounts-State Energy Conservation Office loan for $1,480,535 for construction of VFDs and power factor correctors implementation at Jefferson Water Treatment Plant. Interest rate on the note is 2.00% simple interest per annum. The final maturity is contingent of final completion date of project. $ 1,480,535 NOTE 13 - INTERFUND RECEIVABLES AND PAYABLES The purposes of interfund balances are to provide cash flows for grants and to cover funds with negative cash. Interfund receivables and payables as of September 30, 2019 are as follows:
Interfund InterfundReceivables Payables Net
Due to Business Type Activities for for Internal Service Funds Allocation $ - 7,211,770 (7,211,770)
Total Governmental Activity $ - 7,211,770 (7,211,770)
Due from Governmental Activities for Internal Service Funds Allocation $ 7,211,770 - 7,211,770
Total Business Type Activity $ 7,211,770 - 7,211,770
103
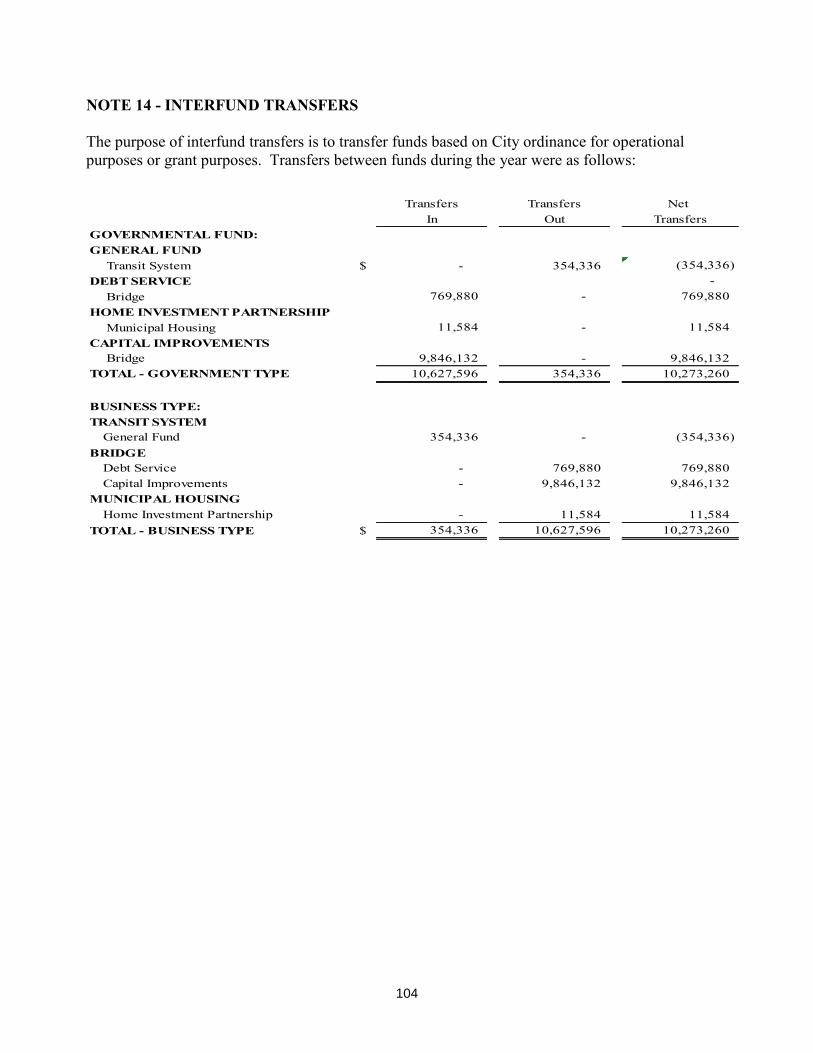
NOTE 14 - INTERFUND TRANSFERS The purpose of interfund transfers is to transfer funds based on City ordinance for operational purposes or grant purposes. Transfers between funds during the year were as follows:
Transfers Transfers Net In Out Transfers
GOVERNMENTAL FUND:GENERAL FUND Transit System $ - 354,336 (354,336) DEBT SERVICE - Bridge 769,880 - 769,880 HOME INVESTMENT PARTNERSHIP Municipal Housing 11,584 - 11,584 CAPITAL IMPROVEMENTS Bridge 9,846,132 - 9,846,132 TOTAL - GOVERNMENT TYPE 10,627,596 354,336 10,273,260
BUSINESS TYPE:TRANSIT SYSTEM General Fund 354,336 - (354,336) BRIDGE Debt Service - 769,880 769,880 Capital Improvements - 9,846,132 9,846,132 MUNICIPAL HOUSING Home Investment Partnership - 11,584 11,584 TOTAL - BUSINESS TYPE $ 354,336 10,627,596 10,273,260
104
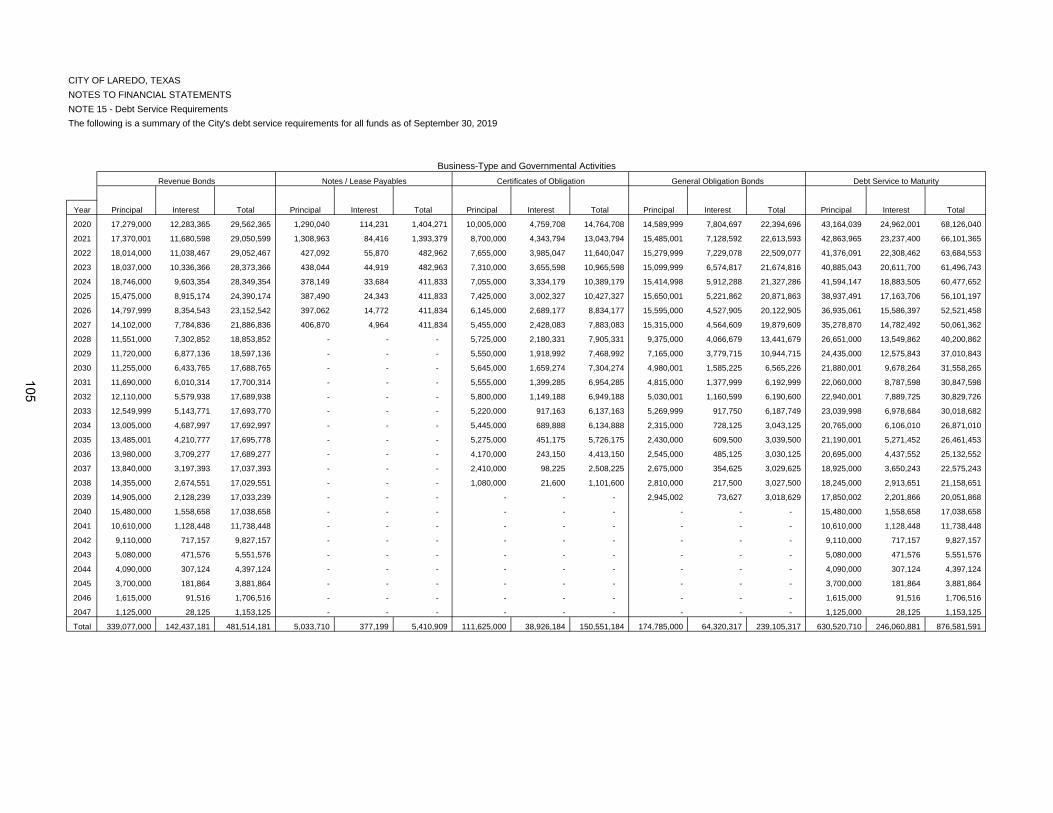
CITY OF LAREDO, TEXASNOTES TO FINANCIAL STATEMENTSNOTE 15 - Debt Service RequirementsThe following is a summary of the City's debt service requirements for all funds as of September 30, 2019
Revenue Bonds Notes / Lease Payables Certificates of Obligation General Obligation Bonds Debt Service to Maturity
Year Principal Interest Total Principal Interest Total Principal Interest Total Principal Interest Total Principal Interest Total
2020 17,279,000 12,283,365 29,562,365 1,290,040 114,231 1,404,271 10,005,000 4,759,708 14,764,708 14,589,999 7,804,697 22,394,696 43,164,039 24,962,001 68,126,040
2021 17,370,001 11,680,598 29,050,599 1,308,963 84,416 1,393,379 8,700,000 4,343,794 13,043,794 15,485,001 7,128,592 22,613,593 42,863,965 23,237,400 66,101,365
2022 18,014,000 11,038,467 29,052,467 427,092 55,870 482,962 7,655,000 3,985,047 11,640,047 15,279,999 7,229,078 22,509,077 41,376,091 22,308,462 63,684,553
2023 18,037,000 10,336,366 28,373,366 438,044 44,919 482,963 7,310,000 3,655,598 10,965,598 15,099,999 6,574,817 21,674,816 40,885,043 20,611,700 61,496,743
2024 18,746,000 9,603,354 28,349,354 378,149 33,684 411,833 7,055,000 3,334,179 10,389,179 15,414,998 5,912,288 21,327,286 41,594,147 18,883,505 60,477,652
2025 15,475,000 8,915,174 24,390,174 387,490 24,343 411,833 7,425,000 3,002,327 10,427,327 15,650,001 5,221,862 20,871,863 38,937,491 17,163,706 56,101,197
2026 14,797,999 8,354,543 23,152,542 397,062 14,772 411,834 6,145,000 2,689,177 8,834,177 15,595,000 4,527,905 20,122,905 36,935,061 15,586,397 52,521,458
2027 14,102,000 7,784,836 21,886,836 406,870 4,964 411,834 5,455,000 2,428,083 7,883,083 15,315,000 4,564,609 19,879,609 35,278,870 14,782,492 50,061,362
2028 11,551,000 7,302,852 18,853,852 - - - 5,725,000 2,180,331 7,905,331 9,375,000 4,066,679 13,441,679 26,651,000 13,549,862 40,200,862
2029 11,720,000 6,877,136 18,597,136 - - - 5,550,000 1,918,992 7,468,992 7,165,000 3,779,715 10,944,715 24,435,000 12,575,843 37,010,843
2030 11,255,000 6,433,765 17,688,765 - - - 5,645,000 1,659,274 7,304,274 4,980,001 1,585,225 6,565,226 21,880,001 9,678,264 31,558,265
2031 11,690,000 6,010,314 17,700,314 - - - 5,555,000 1,399,285 6,954,285 4,815,000 1,377,999 6,192,999 22,060,000 8,787,598 30,847,598
2032 12,110,000 5,579,938 17,689,938 - - - 5,800,000 1,149,188 6,949,188 5,030,001 1,160,599 6,190,600 22,940,001 7,889,725 30,829,726
2033 12,549,999 5,143,771 17,693,770 - - - 5,220,000 917,163 6,137,163 5,269,999 917,750 6,187,749 23,039,998 6,978,684 30,018,682
2034 13,005,000 4,687,997 17,692,997 - - - 5,445,000 689,888 6,134,888 2,315,000 728,125 3,043,125 20,765,000 6,106,010 26,871,010
2035 13,485,001 4,210,777 17,695,778 - - - 5,275,000 451,175 5,726,175 2,430,000 609,500 3,039,500 21,190,001 5,271,452 26,461,453
2036 13,980,000 3,709,277 17,689,277 - - - 4,170,000 243,150 4,413,150 2,545,000 485,125 3,030,125 20,695,000 4,437,552 25,132,552
2037 13,840,000 3,197,393 17,037,393 - - - 2,410,000 98,225 2,508,225 2,675,000 354,625 3,029,625 18,925,000 3,650,243 22,575,243
2038 14,355,000 2,674,551 17,029,551 - - - 1,080,000 21,600 1,101,600 2,810,000 217,500 3,027,500 18,245,000 2,913,651 21,158,651
2039 14,905,000 2,128,239 17,033,239 - - - - - - 2,945,002 73,627 3,018,629 17,850,002 2,201,866 20,051,868
2040 15,480,000 1,558,658 17,038,658 - - - - - - - - - 15,480,000 1,558,658 17,038,658
2041 10,610,000 1,128,448 11,738,448 - - - - - - - - - 10,610,000 1,128,448 11,738,448
2042 9,110,000 717,157 9,827,157 - - - - - - - - - 9,110,000 717,157 9,827,157
2043 5,080,000 471,576 5,551,576 - - - - - - - - - 5,080,000 471,576 5,551,576
2044 4,090,000 307,124 4,397,124 - - - - - - - - - 4,090,000 307,124 4,397,124
2045 3,700,000 181,864 3,881,864 - - - - - - - - - 3,700,000 181,864 3,881,864
2046 1,615,000 91,516 1,706,516 - - - - - - - - - 1,615,000 91,516 1,706,516
2047 1,125,000 28,125 1,153,125 - - - - - - - - - 1,125,000 28,125 1,153,125
Total 339,077,000 142,437,181 481,514,181 5,033,710 377,199 5,410,909 111,625,000 38,926,184 150,551,184 174,785,000 64,320,317 239,105,317 630,520,710 246,060,881 876,581,591
Business-Type and Governmental Activities
105
NOTE 16 - CONSTRUCTION AND IMPROVEMENT COMMITMENTS
As of September 30, 2019, the City had encumbrances for construction contractual commitments of $7,155,963 for various construction and improvement projects. The encumbrances are summarized as follows:
Project Description Encumbrance Financing Sources
Major Funds:Waterworks System $ 711,347 Bond ProceedsSewer System 1,365,003 Bond Proceeds
Total Major Funds: $ 2,076,350
Non-Major Funds:Community Development $ 200,692 Grant ProceedsAirport Construction 3,688,753 Grant Proceeds2015 C.O. Issue 93,640 Bond Proceeds2016 C.O. Issue 270,850 Bond Proceeds2017 C.O. Issue 708,895 Bond Proceeds2018 C.O. Issue 116,783 Bond Proceeds
Total Non-Major Funds: $ 5,079,613
Total Significant Construction Encumbrances $ 7,155,963
NOTE 17 – FUND EXPENDITURES EXCEEDING APPROPRIATIONS
During the fiscal year ended September 30, 2019, expenses in General Fund exceeded appropriations in the amount of $7,078,802, expenses in Noise Abatement Lease Program exceeded appropriations in the amount of $703,580, expenses in Sames Auto Arena exceeded appropriations in the amount of $447,000, and expenses in Max Mandel Golf Course exceeded appropriations in the amount of $30,547.
NOTE 18 - RISK MANAGEMENT
A. HEALTH AND BENEFITS FUND
In January 1990, the City established a partial self-insured plan for medical coverage for its employees and an internal service fund called Risk Management. On October 1, 1995, the fund name was changed to Health and Benefits Fund. Under this plan, the City will pay for medical claims up to the amount of $300,000.00 per employee, with no maximum lifetime benefit. There is a maximum medical aggregate liability of $28,088,637.00 and projected net claims of $24,967,678.00. Claims exceeding $300,000.00 per employee are paid by the City and reimbursed by the City's stop/loss insurance carrier. The City has accrued for claims that have been incurred but not reported.
106
The incurred claims liability of $3,712,518 reported in the Fund as of September 30, 2019 is based on the requirements of Governmental Accounting Standards Board Statement No. 10, which requires that a liability for claims be reported if information prior to the issuance of the financial statements indicates that it is probable that a liability has been incurred at the date of the financial statements and the amount of the claim liability can be reasonably estimated. Claim liabilities are calculated considering the recent claim settlements trends including frequency and amount of payouts and are due within one year of the date of the statement of net position. Changes in the Fund's claims liability amount in fiscal year 2017, 2018, and 2019 were:
Balance at Claims and Current yearBeginning of Changes in Claims & Balance at Fiscal
Year Fiscal Year Estimates Payments Year end ¹
2016-2017 $ 3,473,156 $ 23,306,260 $ 23,286,840 $ 3,492,5762017-2018 $ 3,492,576 $ 21,439,058 $ 21,679,682 $ 3,251,952 2018-2019 $ 3,251,952 $ 25,210,686 $ 24,750,120 $ 3,712,518
There were no changes or reductions in insurance coverage from prior years. Settled claims did not exceed commercial excess coverage in any of the past three years. ¹Claim Liabilities are due within one year of the date of the statement of net position.
107
B. RISK MANAGEMENT FUND
On October 1, 1996, the City established a self-insured retention program for the workers’ compensation liability within the Risk Management Fund which also accounts for the following policies: (a) General Liability (b) Law Enforcement Liability (c) Errors and Omission (d) Auto Liability (e) Auto Physical Damage - ACV. The self-insured retention program for worker's compensation was implemented with $300,000 retention per occurrence and a $2,000,000.00 aggregated for FY16-17 and $2,000,000.00 aggregated for FY17-18 and $2,000,000.00 aggregated for FY18-19. A deductible reimbursement program was also established for claims with $5,000 retention per occurrence through Texas Municipal League Intergovernmental Risk Pool (TMLIRP), with the exception of errors and omission, which has a $25,000 deductible. As of September 30, 2019, a liability was recorded based on fiscal year 2019 outstanding claims, which is due within one year of the date of the statement of net position. Changes in this claims liability amount in fiscal years 2017, 2018 and 2019 were:
Balance at Claims and Current yearBeginning of Changes in Claims & Balance at Fiscal
Year Fiscal Year Estimates Payments Year end ²
2016-2017 $ 1,657,168 $ 2,041,904 $ 2,157,726 $ 1,541,3462017-2018 $ 1,541,346 $ 1,659,818 $ 1,910,419 $ 1,290,745 2018-2019 $ 1,290,745 $ 1,867,009 $ 1,884,986 $ 1,272,768
There have been no significant changes in insurance coverage in any of the past three years. Settled claims did not exceed commercial excess coverage in any of the past three years.
²Claim Liabilities are due within one year of the date of the statement of assets.
NOTE 19 – TAX ABATEMENTS
The City of Laredo offers incentive agreements to promote economic development throughout City and to redevelop and revitalize target areas. The City provides property tax abatements under the authority of Chapter 312 and Chapter 378 of the Texas Local Government Code. Under Chapter 380 of the Texas Local Government Coe, the City may provide tax or sales tax abatements. The amount of taxes abated are contingent on the entities meeting the requirements made under their agreements. As of September 30, 2019, the City had six active agreements under Chapter 312 that resulted in $205,568 in tax abatements. Under Chapter 378, the City had twenty active agreements that resulted in $59,429 in tax abatements. The City had three active agreements under Chapter 380 that resulted in sales tax refunds of $614,368 and no tax abatements. The City has also adopted Tax Increment Financing Policy and Procedures pursuant to Chapter 311 of the Texas Code. This allows tax entities to dedicate the taxes collected on new development and redevelopment to the Tax Increment Fund to finance improvements to infrastructure within the designated area. As of September 30, 2019, the City has one Tax Increment agreement but no infrastructure plans have been finalized to utilize taxes collected.
108
NOTE 20 – CONTINGENCIES
The City participates in a number of grant programs which are governed by various rules and regulations of the grantor agencies. Costs charged to the respective grant programs are subject to audit and adjustment by the grantor agencies. Therefore, to the extent that the City has not complied with the rules and regulations governing the grants, refunds of any money received may be required and the collectability of any related receivable may be impaired. In the opinion of the City, there are no significant contingent liabilities relating to compliance with the rules and regulations. As of September 30, 2019, significant amounts of grant expenditures have not been audited by the grantor agencies. However, the City believes it has substantially complied with applicable laws and regulations and that the results of subsequent audits will not have a material effect on any of the individual governmental funds or the overall financial position of the City.
The City is a party to various lawsuits and claims arising in the ordinary course of operations. Although the outcome of these lawsuits is not presently determinable, in the opinion of the City Attorney, the resolution of these matters will not have a material, adverse effect on the financial condition of the City.
NOTE 21 – DONOR-RESTRICTED ENDOWMENTS
The Canseco Foundation Children’s Endowment Trust Fund was established on January of 1998, when the City accepted the endowment for the Canseco Foundation in the amount of $50,000. The program would have the City seek all opportunities to augment children’s programming resources provided though the Laredo Public Library. Funding of children’s programming from the fund each year will be based on interest accrued on the endowment. Interest distributions will be from the Canseco Foundation Children’s Endowment Fund. For September 30, 2019, the amount of unspent interest to date was $27,446. This amount is reported in the government-wide financial statements under Net Position-Restricted for other purposes. Texas State Law:
(a) Except as provided by Subsection (e), the governing board may appropriate for expenditure, for the uses and purposes for which the fund is established, the net appreciation, realized and unrealized, in the fair market value of the assets of an endowment fund over the historic dollar value of the fund to the extent prudent under the standard provided by Section 163.007.
(b) A determination of the historic dollar value made in good faith by the governing board is conclusive.
(c) Subsection (a) does not limit the authority of the governing board to expend funds as permitted under other law, the terms of the applicable gift instrument, or the charter or articles of incorporation of the institution.
(d) Subsection (a) does not apply if the applicable gift instrument indicates the donor’s intention that the net appreciation not be extended. A restriction on the expenditure of net appreciation may not be implied from a designation of a gift as an endowment or from a direction or authorization in the applicable gift instrument to use only “income” This rule of construction applies to gift instruments executed or in effect before, on, or after the effective date of this chapter.
109
NOTE 22- BUDGET BASIS REPORTING
The budgetary process is based upon accounting for certain transactions on a budget basis other than generally accepted accounting principles (GAAP Basis). The results of operations as presented in the General Fund Schedule of Revenues, Expenditures, and Changes in Fund Balances are reported in accordance with the budgetary process (budget basis) to provide a meaningful comparison with the budget.
The major difference between the budget basis “actual” and GAAP basis are that encumbrances are recorded as the equivalent of expenditures (budget) as opposed to a reservation of fund balance (GAAP) and non-budgeted increases in compensated absences, claims payable, workmen’s compensation insurance, and allowance for doubtful accounts are recorded as expenditures when payments are made (budget) as opposed to when the liability is incurred (GAAP).
Adjustments necessary to convert from the GAAP basis to the budget basis are as follows:
General Fund
Excess (Deficiency) of revenues and other financing sourcesover expenditures and other uses (GAAP Basis)- $ 1,124,539Adjustments: Timing Differences-Encumbrances (3,750,478) Basic Differences:
Non Budgeted-Allowance for Doubtful Accounts 4,938
Excess of revenues and other financing sources over expendituresand other uses (GAAP Basis)-budgetary classifications (2,621,001)
Other adjustments-Excess of revenues and other financing Sources over expenditures and other uses for non-budgeted Funds-(Entity Differences) 46,842,036
Excess (Deficiency) of revenues and other financing sources over expenditures and other uses – Budget Basis $ 44,221,035
110
NOTE 23 – FUND EQUITY
The City implemented GASB Statement No. 54, “Fund Balance Reporting and Governmental Fund type Definitions” effective October 1, 2010. The statement established new categories for reporting fund balance, revised the definitions for governmental fund types and change the presentation of fund balance. Components of fund balance of Governmental Funds are as follows:
NOTE 24 – PRIOR YEAR ADJUSTMENT
There were no prior year adjustment in the year ended September 30, 2019.
OtherGeneral Debt Governmental
Fund Service Funds
Inventory 16,261 - 133,209 Permanent Fund Principal - - 50,000
Debt Service - 6,259,232 1,508,248 Police 316,040 - 4,051,783 Municipal Court 505,325 - - 911 Regional Fund - - 670 Urban Redevelopment and Housing - - 624,033 Health Services - - 2,208,569 Welfare 105,809 - - Environmental Services - - 3,893,513 Noise Abatement - - 304,956 Convention and Tourism - - 5,479,359 Parks and Recreation 12,398 - 27,132,062 Education 74,859 - 1,289,490 Downtown TIRZ 1 - - 590,026 Parking Meters - - 3,975 Permanent Fund Revenues - - 27,446 Capital Projects (Parks, Infrastructure, Municipal Improvements) - - 42,067,881 Transportation - - 261,045
General Government 30,133,963 - - Police 936,307 - 2,564 Fire 143,221 - - Municipal Court 67,431 - - Traffic Safety 72,787 - - 911 Emergency - - 1,239,391 Convention and Tourism - - 973,866 Parking Meters - - 60,765 Public Works 46,568 - - Urban Redevelopment and Housing - - 2,061,001 Health Services - - 955,093 Welfare 207,131 - - Environmental Services - - 762,421 Noise Abatement - - 132,612 Parks and Recreation 1,059,371 - 963,754 Education - - 3,175 Other 1,028,865 - - Transportation - - 648,149 Capital Purchases (Equipment) - - 28,747 Capital Projects - - 753,007
Parking Meters - - 1,242,463 Environmental Services - - 4,060,392 Parks and Recreation - - 654,522 Transportation - - 5,093,281 Capital Projects - - 43,591,805
13,245,177 - (5,588,795) Total Fund Balances 47,971,513 6,259,232 147,264,478
Unassigned
Fund Balances: Nonspendable:
Restricted for:
Commited to:
Assigned to:
111
CITY OF LAREDO, TEXAS REQUIRED PENSION SYSTEM
SUPPLEMENTARY INFORMATION SCHEDULE OF CHANGES IN NET PENSION LIABILITY AND RELATED RATIOS
LAST TEN YEARS (1)
City Of Laredo (TMRS)
12/31/2018 12/31/2017 12/31/2016 12/31/2015 12/31/2014Total pension liability
Service Cost $ 18,935,093 18,055,726 17,550,829 16,137,452 14,954,531 Interest (on the Total Pension Liability) 41,776,661 39,304,497 36,935,879 36,278,827 34,062,490 Changes of benefit terms - - - - - Difference between expected and actual experience 408,431 (1,450,209) (2,007,074) (6,889,003) (3,571,761) Change of assumptions - - - (1,671,663) - Benefit payments, including refunds of employee contributions (20,838,620) (18,611,473) (16,671,410) (14,594,700) (14,154,831) Net Change in Total Pension Liability 40,281,565 37,298,541 35,808,224 29,260,913 31,290,429 Total Pension Liability-Beginning 619,865,257 582,566,716 546,758,492 517,497,579 486,207,150 Total Pension Liability-Ending $ 660,146,822 619,865,257 582,566,716 546,758,492 517,497,579
Plan Fiduciary Net Position
Contributions-Employer $ 23,259,291 22,434,463 21,915,367 20,857,055 19,414,300 Contributions-Employee 7,801,392 7,422,994 7,206,069 6,894,937 6,639,377 Net Investment Income (14,669,500) 58,259,387 25,837,605 544,191 19,324,455 Benefit payments, including refunds of employee contributions (20,838,620) (18,611,473) (16,671,410) (14,594,700) (14,154,831) Administrative Expense (283,249) (301,727) (291,637) (331,414) (201,717) Other (14,799) (15,292) (15,713) (16,368) (16,584) Net Change in Plan Fiduciary Net Position (4,745,485) 69,188,352 37,980,281 13,353,701 31,005,000 Plan Fiduciary Net Position-Beginning 489,265,648 420,077,296 382,097,015 368,743,314 337,738,314 Plan Fiduciary Net Position-Ending $ 484,520,163 489,265,648 420,077,296 382,097,015 368,743,314 Net Pension Liability-Ending $ 175,626,659 130,599,609 162,489,420 164,661,477 148,754,265
Plan Fiduciary Net Position as a Percentage of Total Pension Liability 73.40% 78.93% 72.11% 69.88% 71.26%
Covered Payroll $ 111,448,461 106,023,054 102,937,415 98,459,134 94,769,773 Net Pension Liability as a Percentage of Covered Payroll 157.59% 123.18% 157.85% 167.24% 156.96%
(1) This schedule was implemented by GASB starting in fiscal year 2015. Schedule is intended to show ten years of information and will be built as information becomes available.
112
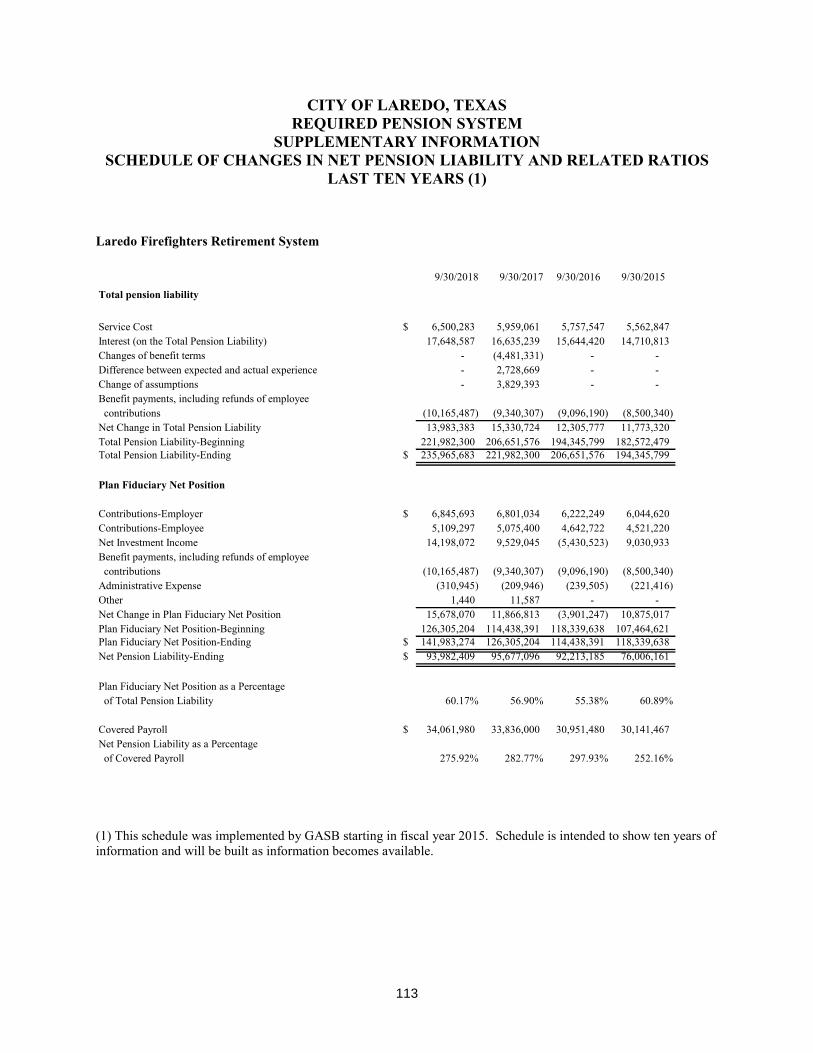
CITY OF LAREDO, TEXAS REQUIRED PENSION SYSTEM
SUPPLEMENTARY INFORMATION SCHEDULE OF CHANGES IN NET PENSION LIABILITY AND RELATED RATIOS
LAST TEN YEARS (1)
Laredo Firefighters Retirement System
9/30/2018 9/30/2017 9/30/2016 9/30/2015
Total pension liability
Service Cost $ 6,500,283 5,959,061 5,757,547 5,562,847 Interest (on the Total Pension Liability) 17,648,587 16,635,239 15,644,420 14,710,813 Changes of benefit terms - (4,481,331) - - Difference between expected and actual experience - 2,728,669 - - Change of assumptions - 3,829,393 - - Benefit payments, including refunds of employee contributions (10,165,487) (9,340,307) (9,096,190) (8,500,340) Net Change in Total Pension Liability 13,983,383 15,330,724 12,305,777 11,773,320 Total Pension Liability-Beginning 221,982,300 206,651,576 194,345,799 182,572,479 Total Pension Liability-Ending $ 235,965,683 221,982,300 206,651,576 194,345,799
Plan Fiduciary Net Position
Contributions-Employer $ 6,845,693 6,801,034 6,222,249 6,044,620 Contributions-Employee 5,109,297 5,075,400 4,642,722 4,521,220 Net Investment Income 14,198,072 9,529,045 (5,430,523) 9,030,933 Benefit payments, including refunds of employee contributions (10,165,487) (9,340,307) (9,096,190) (8,500,340) Administrative Expense (310,945) (209,946) (239,505) (221,416) Other 1,440 11,587 - - Net Change in Plan Fiduciary Net Position 15,678,070 11,866,813 (3,901,247) 10,875,017 Plan Fiduciary Net Position-Beginning 126,305,204 114,438,391 118,339,638 107,464,621 Plan Fiduciary Net Position-Ending $ 141,983,274 126,305,204 114,438,391 118,339,638 Net Pension Liability-Ending $ 93,982,409 95,677,096 92,213,185 76,006,161
Plan Fiduciary Net Position as a Percentage of Total Pension Liability 60.17% 56.90% 55.38% 60.89%
Covered Payroll $ 34,061,980 33,836,000 30,951,480 30,141,467 Net Pension Liability as a Percentage of Covered Payroll 275.92% 282.77% 297.93% 252.16%
(1) This schedule was implemented by GASB starting in fiscal year 2015. Schedule is intended to show ten years of information and will be built as information becomes available.
113
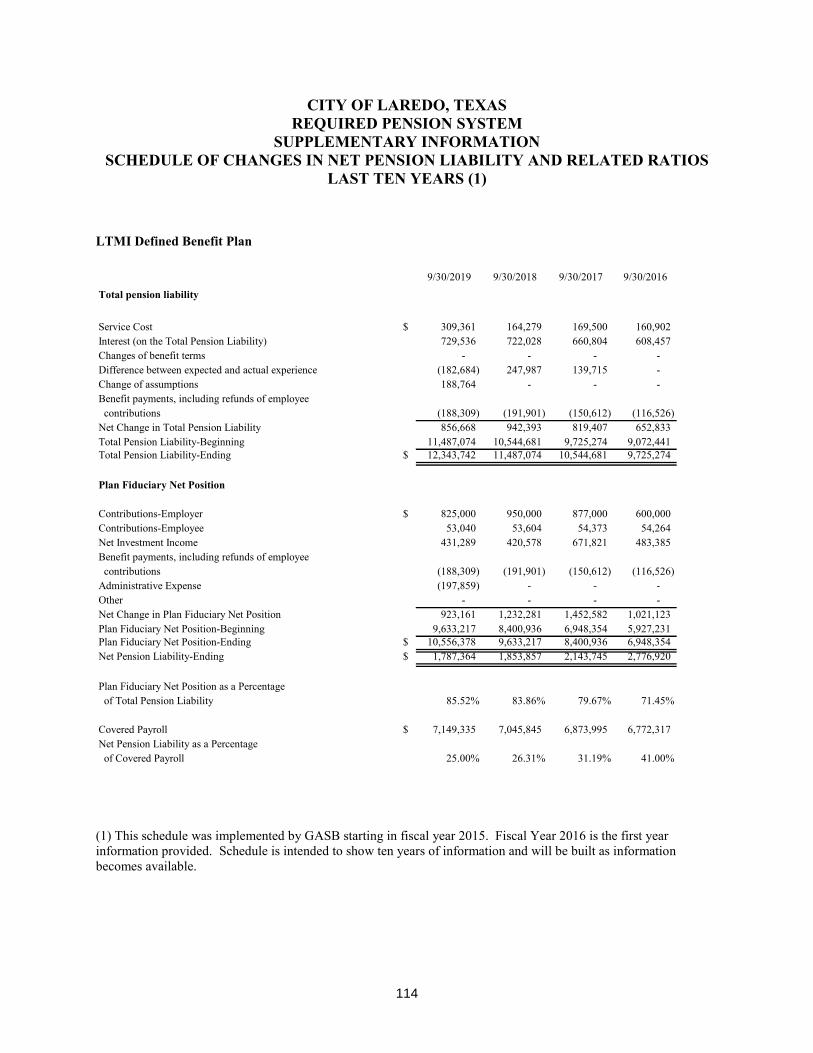
CITY OF LAREDO, TEXAS REQUIRED PENSION SYSTEM
SUPPLEMENTARY INFORMATION SCHEDULE OF CHANGES IN NET PENSION LIABILITY AND RELATED RATIOS
LAST TEN YEARS (1)
LTMI Defined Benefit Plan
9/30/2019 9/30/2018 9/30/2017 9/30/2016
Total pension liability
Service Cost $ 309,361 164,279 169,500 160,902 Interest (on the Total Pension Liability) 729,536 722,028 660,804 608,457 Changes of benefit terms - - - - Difference between expected and actual experience (182,684) 247,987 139,715 - Change of assumptions 188,764 - - - Benefit payments, including refunds of employee contributions (188,309) (191,901) (150,612) (116,526) Net Change in Total Pension Liability 856,668 942,393 819,407 652,833 Total Pension Liability-Beginning 11,487,074 10,544,681 9,725,274 9,072,441 Total Pension Liability-Ending $ 12,343,742 11,487,074 10,544,681 9,725,274
Plan Fiduciary Net Position
Contributions-Employer $ 825,000 950,000 877,000 600,000 Contributions-Employee 53,040 53,604 54,373 54,264 Net Investment Income 431,289 420,578 671,821 483,385 Benefit payments, including refunds of employee contributions (188,309) (191,901) (150,612) (116,526) Administrative Expense (197,859) - - - Other - - - - Net Change in Plan Fiduciary Net Position 923,161 1,232,281 1,452,582 1,021,123 Plan Fiduciary Net Position-Beginning 9,633,217 8,400,936 6,948,354 5,927,231 Plan Fiduciary Net Position-Ending $ 10,556,378 9,633,217 8,400,936 6,948,354 Net Pension Liability-Ending $ 1,787,364 1,853,857 2,143,745 2,776,920
Plan Fiduciary Net Position as a Percentage of Total Pension Liability 85.52% 83.86% 79.67% 71.45%
Covered Payroll $ 7,149,335 7,045,845 6,873,995 6,772,317 Net Pension Liability as a Percentage of Covered Payroll 25.00% 26.31% 31.19% 41.00%
(1) This schedule was implemented by GASB starting in fiscal year 2015. Fiscal Year 2016 is the first year information provided. Schedule is intended to show ten years of information and will be built as information becomes available.
114
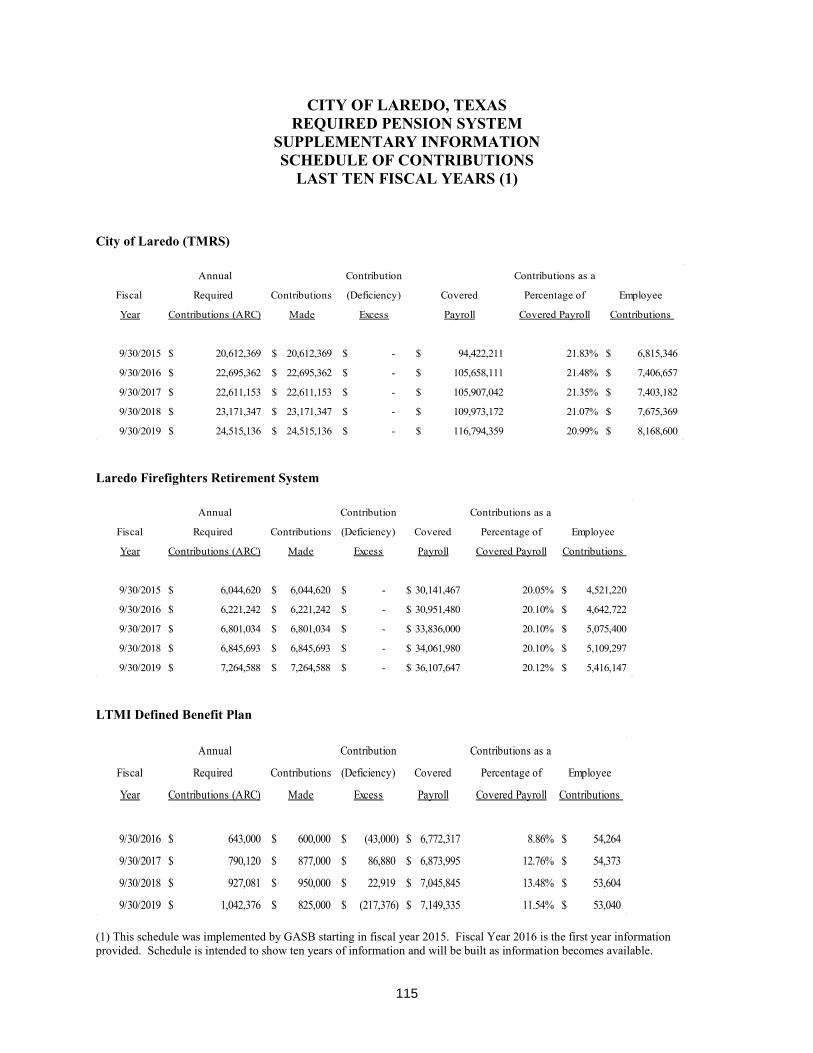
CITY OF LAREDO, TEXAS REQUIRED PENSION SYSTEM
SUPPLEMENTARY INFORMATION SCHEDULE OF CONTRIBUTIONS
LAST TEN FISCAL YEARS (1) City of Laredo (TMRS)
Annual Contribution Contributions as a
Fiscal Required Contributions (Deficiency) Covered Percentage of Employee
Year Contributions (ARC) Made Excess Payroll Covered Payroll Contributions
9/30/2015 20,612,369$ 20,612,369$ -$ 94,422,211$ 21.83% 6,815,346$
9/30/2016 22,695,362$ 22,695,362$ -$ 105,658,111$ 21.48% 7,406,657$
9/30/2017 22,611,153$ 22,611,153$ -$ 105,907,042$ 21.35% 7,403,182$
9/30/2018 23,171,347$ 23,171,347$ -$ 109,973,172$ 21.07% 7,675,369$
9/30/2019 24,515,136$ 24,515,136$ -$ 116,794,359$ 20.99% 8,168,600$ Laredo Firefighters Retirement System
Annual Contribution Contributions as a
Fiscal Required Contributions (Deficiency) Covered Percentage of Employee
Year Contributions (ARC) Made Excess Payroll Covered Payroll Contributions
9/30/2015 6,044,620$ 6,044,620$ -$ 30,141,467$ 20.05% 4,521,220$
9/30/2016 6,221,242$ 6,221,242$ -$ 30,951,480$ 20.10% 4,642,722$
9/30/2017 6,801,034$ 6,801,034$ -$ 33,836,000$ 20.10% 5,075,400$
9/30/2018 6,845,693$ 6,845,693$ -$ 34,061,980$ 20.10% 5,109,297$
9/30/2019 7,264,588$ 7,264,588$ -$ 36,107,647$ 20.12% 5,416,147$ LTMI Defined Benefit Plan
Annual Contribution Contributions as a
Fiscal Required Contributions (Deficiency) Covered Percentage of Employee
Year Contributions (ARC) Made Excess Payroll Covered Payroll Contributions
9/30/2016 643,000$ 600,000$ (43,000)$ 6,772,317$ 8.86% 54,264$
9/30/2017 790,120$ 877,000$ 86,880$ 6,873,995$ 12.76% 54,373$
9/30/2018 927,081$ 950,000$ 22,919$ 7,045,845$ 13.48% 53,604$
9/30/2019 1,042,376$ 825,000$ (217,376)$ 7,149,335$ 11.54% 53,040$ (1) This schedule was implemented by GASB starting in fiscal year 2015. Fiscal Year 2016 is the first year information provided. Schedule is intended to show ten years of information and will be built as information becomes available.
115
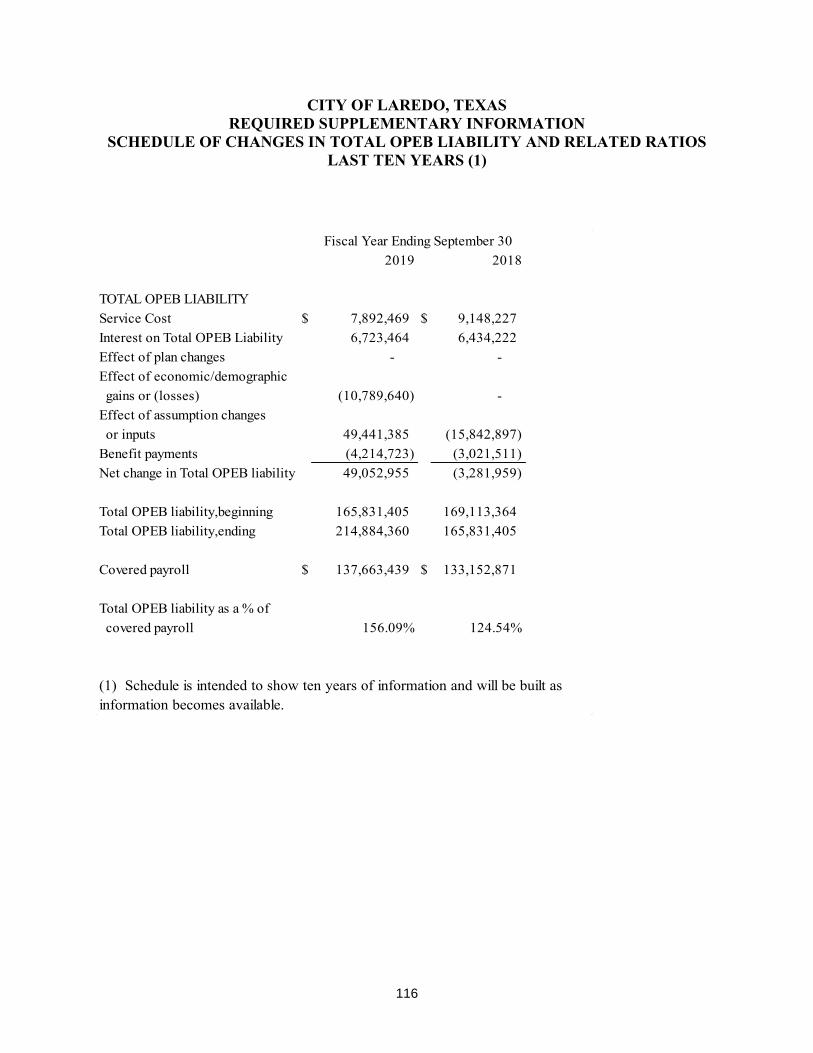
CITY OF LAREDO, TEXAS REQUIRED SUPPLEMENTARY INFORMATION
SCHEDULE OF CHANGES IN TOTAL OPEB LIABILITY AND RELATED RATIOS LAST TEN YEARS (1)
Fiscal Year Ending September 302019 2018
TOTAL OPEB LIABILITYService Cost $ 7,892,469 $ 9,148,227 Interest on Total OPEB Liability 6,723,464 6,434,222 Effect of plan changes - - Effect of economic/demographic gains or (losses) (10,789,640) - Effect of assumption changes or inputs 49,441,385 (15,842,897) Benefit payments (4,214,723) (3,021,511) Net change in Total OPEB liability 49,052,955 (3,281,959)
Total OPEB liability,beginning 165,831,405 169,113,364 Total OPEB liability,ending 214,884,360 165,831,405
Covered payroll $ 137,663,439 $ 133,152,871
Total OPEB liability as a % of covered payroll 156.09% 124.54%
(1) Schedule is intended to show ten years of information and will be built asinformation becomes available.
116

DEBT SERVICE
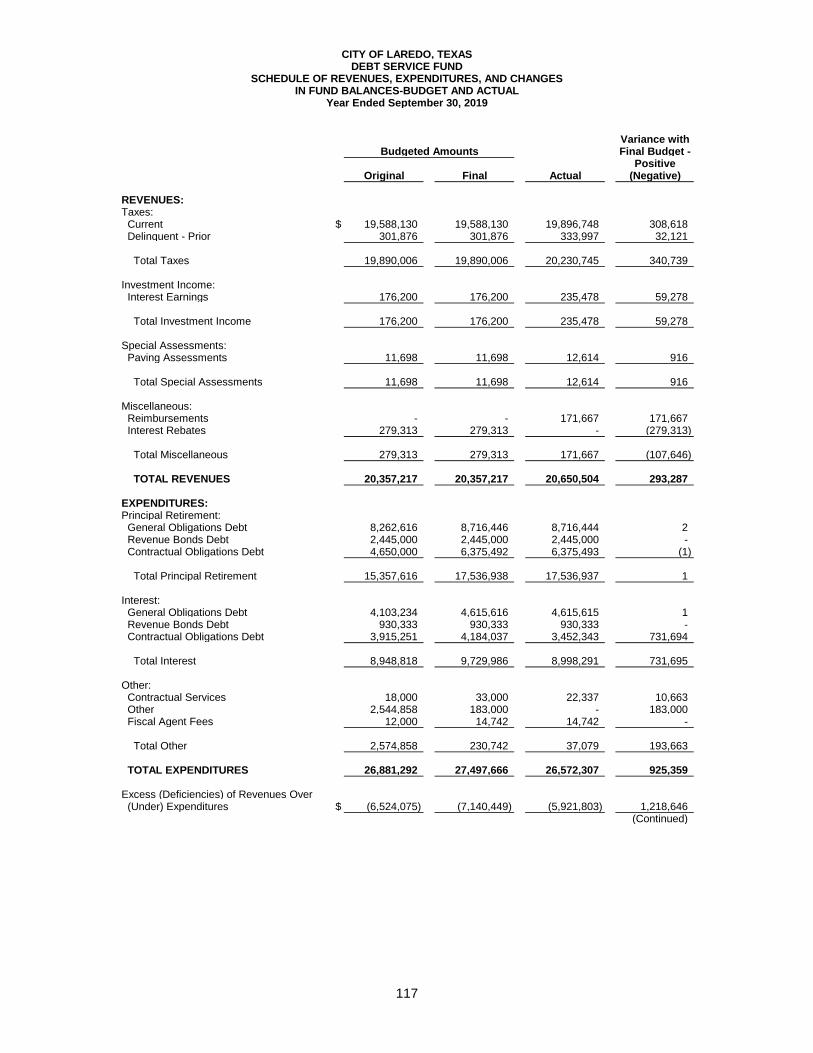
CITY OF LAREDO, TEXASDEBT SERVICE FUND
SCHEDULE OF REVENUES, EXPENDITURES, AND CHANGESIN FUND BALANCES-BUDGET AND ACTUAL
Year Ended September 30, 2019
Variance withBudgeted Amounts Final Budget -
PositiveOriginal Final Actual (Negative)
REVENUES:Taxes:
Current $ 19,588,130 19,588,130 19,896,748 308,618 Delinquent - Prior 301,876 301,876 333,997 32,121
Total Taxes 19,890,006 19,890,006 20,230,745 340,739
Investment Income:Interest Earnings 176,200 176,200 235,478 59,278
Total Investment Income 176,200 176,200 235,478 59,278
Special Assessments:Paving Assessments 11,698 11,698 12,614 916
Total Special Assessments 11,698 11,698 12,614 916
Miscellaneous:Reimbursements - - 171,667 171,667 Interest Rebates 279,313 279,313 - (279,313)
Total Miscellaneous 279,313 279,313 171,667 (107,646)
TOTAL REVENUES 20,357,217 20,357,217 20,650,504 293,287
EXPENDITURES:Principal Retirement:
General Obligations Debt 8,262,616 8,716,446 8,716,444 2 Revenue Bonds Debt 2,445,000 2,445,000 2,445,000 - Contractual Obligations Debt 4,650,000 6,375,492 6,375,493 (1)
Total Principal Retirement 15,357,616 17,536,938 17,536,937 1
Interest:General Obligations Debt 4,103,234 4,615,616 4,615,615 1 Revenue Bonds Debt 930,333 930,333 930,333 - Contractual Obligations Debt 3,915,251 4,184,037 3,452,343 731,694
Total Interest 8,948,818 9,729,986 8,998,291 731,695
Other:Contractual Services 18,000 33,000 22,337 10,663 Other 2,544,858 183,000 - 183,000 Fiscal Agent Fees 12,000 14,742 14,742 -
Total Other 2,574,858 230,742 37,079 193,663
TOTAL EXPENDITURES 26,881,292 27,497,666 26,572,307 925,359
Excess (Deficiencies) of Revenues Over(Under) Expenditures $ (6,524,075) (7,140,449) (5,921,803) 1,218,646
(Continued)
117
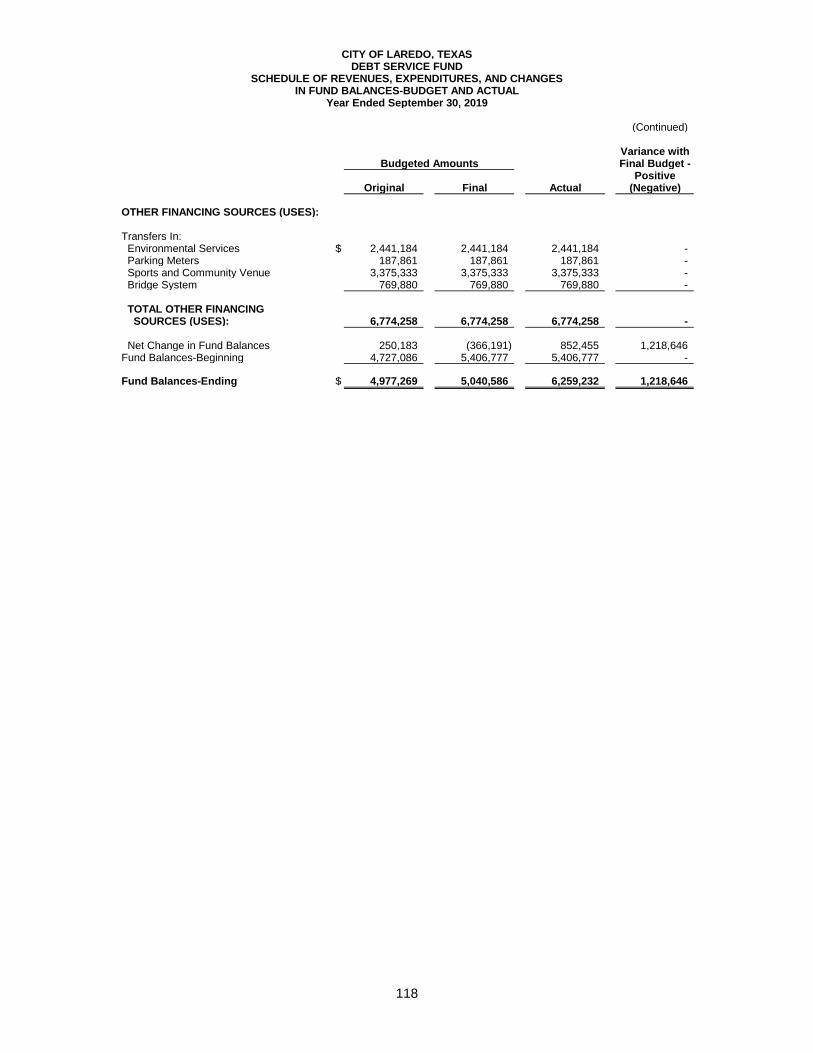
CITY OF LAREDO, TEXASDEBT SERVICE FUND
SCHEDULE OF REVENUES, EXPENDITURES, AND CHANGESIN FUND BALANCES-BUDGET AND ACTUAL
Year Ended September 30, 2019
(Continued)
Variance withBudgeted Amounts Final Budget -
PositiveOriginal Final Actual (Negative)
OTHER FINANCING SOURCES (USES):
Transfers In: Environmental Services $ 2,441,184 2,441,184 2,441,184 - Parking Meters 187,861 187,861 187,861 - Sports and Community Venue 3,375,333 3,375,333 3,375,333 - Bridge System 769,880 769,880 769,880 -
TOTAL OTHER FINANCING SOURCES (USES): 6,774,258 6,774,258 6,774,258 -
Net Change in Fund Balances 250,183 (366,191) 852,455 1,218,646 Fund Balances-Beginning 4,727,086 5,406,777 5,406,777 -
Fund Balances-Ending $ 4,977,269 5,040,586 6,259,232 1,218,646
118
NONMAJOR GOVERNMENTAL FUNDS
NONMAJOR GOVERNMENTAL FUNDS
SPECIAL REVENUE FUNDS Special Revenue Funds are used to account for the proceeds of specific revenue sources (other than special assessments, expendable trusts or major capital projects) that are legally restricted to expenditures for specific purposes. Special Revenue Funds include:
COMMUNITY DEVELOPMENT BLOCK GRANT - to account for the U.S.
Department of Housing and Urban Development grant and the related disbursements for street improvements, drainage improvements, water and sewer improvements, public service, open space, code enforcement, low income housing rehabilitation and for administration.
HOUSING REHABILITATION - to account for the U.S. Department of Housing and
Urban Development grant for low income housing rehabilitation loans and the related disbursements.
HOME INVESTMENT FUND - to account for the U. S. Department of Housing and
Urban Development grant and the related disbursements for new affordable housing units.
EMERGENCY SOLUTIONS GRANT - to account for the U.S. Department of
Housing and Urban Development grant and the disbursement of such proceeds for city shelters for the homeless.
HOME INVESTMENT AFFORDABLE HOUSING - to account for the proceeds
from the dissolution of the Laredo Affordable Housing Corporation as HOME Program Income to be used for the construction of the La Terraza project which will serve low to moderate income families.
AUTO THEFT TASK FORCE - to account for the Texas Department of Transportation
grant for the combined effort between the City of Laredo and Webb County to detect, investigate and apprehend individuals involved in auto theft.
FINANCIAL TASK FORCE - to account for the Office of National Drug Control and
Prevention grant for the investigation of illegal financial activities related to drug trafficking in the City.
SPECIAL POLICE PROGRAM - to account for federal and state law enforcement
grants. Major funding sources include intergovernmental revenues from Texas Department of Transportation, U.S. Department of Justice and U.S. Department of Treasury.
119
911 EMERGENCY COMMUNICATIONS FUND - to account for the Commission on State Emergency Communications grant funds to administer and operate emergency service communications programs for Jim Hogg, Starr, Webb and Zapata Counties.
HEALTH FUND - to account for the rendering of public health services to City and
County residents by administrating grants and contracts awarded by federal and state agencies and contributions by private foundations.
INTERNATIONAL AIRPORT - to account for the operation and maintenance of the
City of Laredo Airport, financed through restricted revenues from airport tenants. HOTEL-MOTEL OCCUPANCY TAX - to account for tax proceeds received from
hotels and motels and the disbursement of such to promote community agencies and projects as authorized by State statute and allocated by City Council.
PUBLIC ACCESS CHANNEL - to account for the operations of City owned studio
facilities for access channels and to provide training in television production, programming and transmitting, and the related revenue associated with such services.
LAREDO CONVENTION & VISITOR'S BUREAU - to account for the promotion of
the City of Laredo. Its primary function is to engage in visitor promotion by soliciting and servicing conventions and other related group businesses generating tourism.
RECREATION FUND - to account for the recreational activities provided to the general
public through various sports leagues, such as softball and basketball, and other activities such as swimming lessons and aerobics.
PARKING METERS - to account for the collection of parking meter revenues and to
enforce City ordinances on prohibited parking areas and where parking meters are installed.
ENVIRONMENTAL SERVICES - to account for federal and state grants and the
disbursements required by the storm water regulations. KEEP LAREDO BEAUTIFUL, INC. FUND - to account for the beautification of the
City of Laredo. The corporation is organized to promote public interest in the general improvement of the environment of the City of Laredo.
NOISE ABATEMENT LEASE PROGRAM - to account for all the units purchased
through the Noise Abatement Program that are being leased out as public housing and the related operating and maintenance disbursements.
120
SPORTS AND COMMUNITY VENUE - to account for the sales tax proceeds of ¼ of one percent designated for payments of debt service in connection with the financing of a sports venue complex and for the operation of the Uni-Trade Stadium.
SAMES AUTO ARENA - to account for the center’s operation. Its function is to
provide a diverse mixture of world-class entertainment. LAREDO PUBLIC FACILITY CORPORATION - to account for fees related to the
partnership between the City of Laredo, Ejido Holdings, LLC, and La Terraza at Lomas del Sur, Ltd. and to provide financing, acquisition, and construction of public facilities.
MAX MANDEL GOLF COURSE - to account for the golf course’s operation. Its
function is to provide a public golf course. PARLAND ACQUISITON/PARKLAND IMPROVEMENTS - to account for the
collection of park improvements fees for the acquisition and improvements to parklands in the City.
SPECIAL FIRE GRANTS – to account for various projects and improvements that
increase the public safety for the citizens of Laredo. Major funding sources include State Homeland Security and Environmental Protection Agency.
DOWNTOWN TIRZ NO. 1 – to account for the tax increment reinvestment zone for
improvements in the downtown area. POLICE TRUST FUND - to account for the proceeds from seized revenues from
narcotic operations to be used to acquire any necessary public safety equipment or improvements that will serve to further improve the law enforcement operations.
SUBDIVISION TRUST FUND - to account for funds received from developers and the
disbursement of such funds on subdivision streets and off-site improvements.
CAPITAL PROJECTS FUNDS
Capital Projects Funds are used to account for financial resources to be used for the acquisition or construction of major capital facilities other than those financed by proprietary funds and trust funds. Capital Projects Funds include:
121
PARKS CAPITAL GRANTS - to account for various projects and improvements that enhance the quality of life for the citizens of the City of Laredo. Major funding sources include intergovernmental revenues from Webb County, the Texas Department of Transportation, and the Texas Parks and Wildlife Service, as well as other revenue sources who dedicate funding for future recreational improvements.
CAPITAL GRANTS - to account for various State and Federal grants. Major funding
sources include intergovernmental revenues from the Texas Department of Transportation and the U.S. Department of Housing and Urban Development.
CONTRACTUAL OBLIGATIONS - to account for contractual obligation bond and
lease-purchase agreement proceeds for the purchase of equipment. CERTIFICATE OF OBLIGATION 2009 ISSUE - to account for $24,735,000 in bond
proceeds for the purpose of paying all or a portion of the City’s contractual obligations for the purpose of constructing and equipping various departments, street and drainage improvements, and traffic equipment.
CERTIFICATE OF OBLIGATION 2012 ISSUE - to account for $7,690,000 in bond
proceeds for the purpose of paying all or a portion of the City’s contractual obligations for the purpose of constructing and equipping various departments, street and drainage improvements, and traffic equipment.
CERTIFICATE OF OBLIGATION 2014 ISSUE - to account for $5,600,000 in bond
proceeds for the purpose of paying all or a portion of the City’s contractual obligations for the purpose of constructing and equipping various departments, street and drainage improvements.
CERTIFICATE OF OBLIGATION 2015 ISSUE - to account for $19,765,000 in bond
proceeds for the purpose of paying all or a portion of the City’s contractual obligations for the purpose of constructing and equipping various departments, street and drainage improvements.
CERTIFICATE OF OBLIGATION 2016 ISSUE - to account for $3,075,000 in bond
proceeds for the purpose of paying all or a portion of the City’s contractual obligations for the purpose of purchasing land in the downtown area for parking and buildings.
CERTIFICATE OF OBLIGATION 2017 ISSUE - to account for $14,810,000 in bond
proceeds for the purpose of paying all or a portion of the City’s contractual obligations for the purpose of constructing and equipping various departments, street and drainage improvements.
122
CERTIFICATE OF OBLIGATION 2018 ISSUE - to account for $11,640,000 in bond proceeds for the purpose of paying all or a portion of the City’s contractual obligations for the purpose of constructing and equipping various departments, street and drainage improvements, and traffic equipment.
AIRPORT CONSTRUCTION FUND - to account for the Federal Aviation Administration, the Texas Department of Transportation, and the U.S. Department of Transportation grants for the engineering design and construction of runway and taxiway improvements and promote air service.
CAPITAL IMPROVEMENTS - to account for capital improvement projects approved by City Council. Its major funding sources are revenues received from the Bridge System, General Fund, and interest earnings.
PERMANENT FUND
CANSECO ENDOWMENT FUND - to account for funds received from the Canseco Endowment Foundation for the benefit of the City of Laredo Public Library.
123
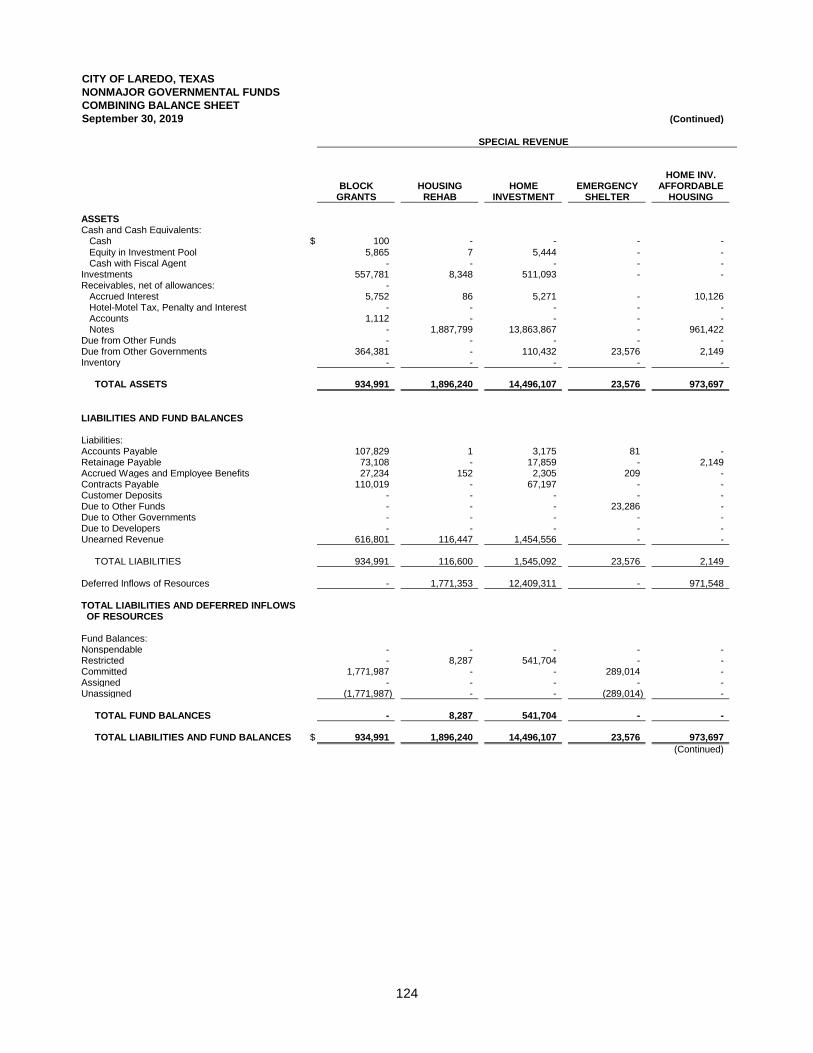
CITY OF LAREDO, TEXAS
NONMAJOR GOVERNMENTAL FUNDS
COMBINING BALANCE SHEET
September 30, 2019 (Continued)
HOME INV.BLOCK HOUSING HOME EMERGENCY AFFORDABLE
GRANTS REHAB INVESTMENT SHELTER HOUSING
ASSETSCash and Cash Equivalents:
Cash $ 100 - - - - Equity in Investment Pool 5,865 7 5,444 - - Cash with Fiscal Agent - - - - -
Investments 557,781 8,348 511,093 - - Receivables, net of allowances: -
Accrued Interest 5,752 86 5,271 - - 10,126 Hotel-Motel Tax, Penalty and Interest - - - - - Accounts 1,112 - - - - Notes - 1,887,799 13,863,867 - 961,422
Due from Other Funds - - - - - Due from Other Governments 364,381 - 110,432 23,576 2,149 Inventory - - - - -
TOTAL ASSETS 934,991 1,896,240 14,496,107 23,576 973,697
LIABILITIES AND FUND BALANCES
Liabilities:Accounts Payable 107,829 1 3,175 81 - Retainage Payable 73,108 - 17,859 - 2,149 Accrued Wages and Employee Benefits 27,234 152 2,305 209 - Contracts Payable 110,019 - 67,197 - - Customer Deposits - - - - - Due to Other Funds - - - 23,286 - Due to Other Governments - - - - - Due to Developers - - - - - Unearned Revenue 616,801 116,447 1,454,556 - -
TOTAL LIABILITIES 934,991 116,600 1,545,092 23,576 2,149
Deferred Inflows of Resources - 1,771,353 12,409,311 - 971,548
TOTAL LIABILITIES AND DEFERRED INFLOWS OF RESOURCES
Fund Balances:Nonspendable - - - - - Restricted - 8,287 541,704 - - Committed 1,771,987 - - 289,014 - Assigned - - - - - Unassigned (1,771,987) - - (289,014) -
TOTAL FUND BALANCES - 8,287 541,704 - -
TOTAL LIABILITIES AND FUND BALANCES $ 934,991 1,896,240 14,496,107 23,576 973,697
(Continued)
SPECIAL REVENUE
124
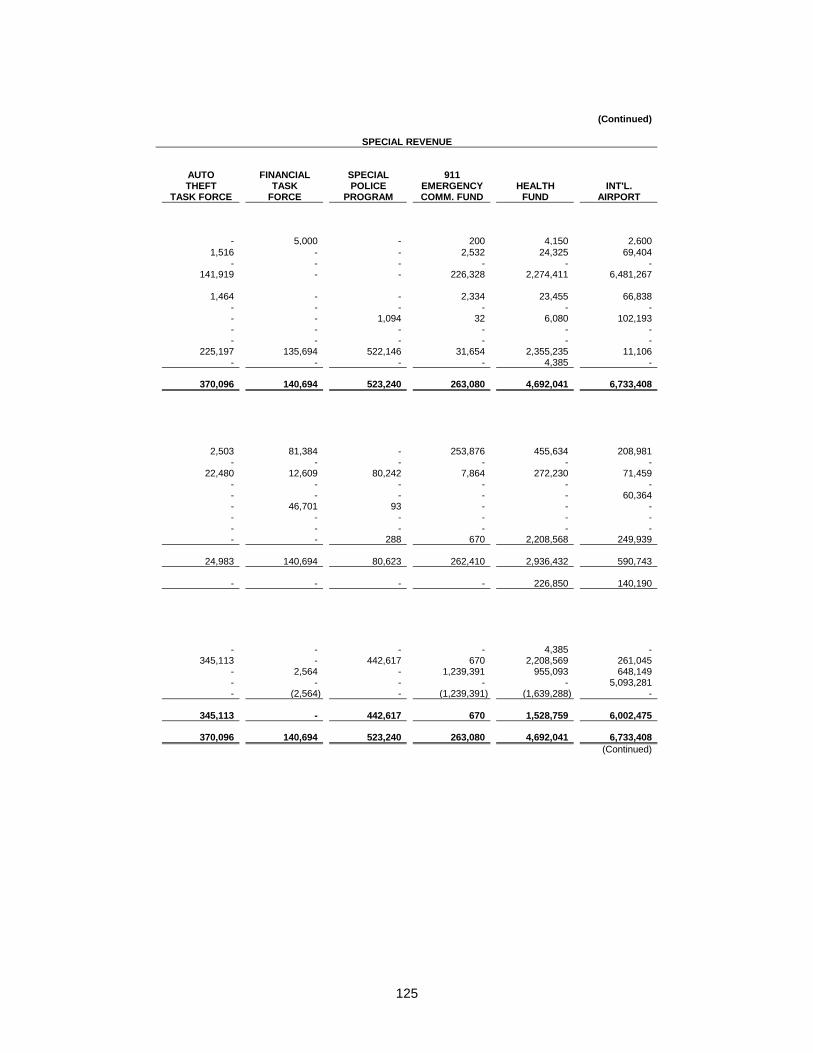
(Continued)
AUTO FINANCIAL SPECIAL 911THEFT TASK POLICE EMERGENCY HEALTH INT'L.
TASK FORCE FORCE PROGRAM COMM. FUND FUND AIRPORT
- 5,000 - 200 4,150 2,600 1,516 - - 2,532 24,325 69,404
- - - - - - 141,919 - - 226,328 2,274,411 6,481,267
1,464 - - 2,334 23,455 66,838 - - - - - - - - 1,094 32 6,080 102,193 - - - - - - - - - - - -
225,197 135,694 522,146 31,654 2,355,235 11,106 - - - - 4,385 -
370,096 140,694 523,240 263,080 4,692,041 6,733,408
2,503 81,384 - 253,876 455,634 208,981 - - - - - -
22,480 12,609 80,242 7,864 272,230 71,459 - - - - - - - - - - - 60,364 - 46,701 93 - - - - - - - - - - - - - - - - - 288 670 2,208,568 249,939
24,983 140,694 80,623 262,410 2,936,432 590,743
- - - - 226,850 140,190
- - - - 4,385 - 345,113 - 442,617 670 2,208,569 261,045
- 2,564 - 1,239,391 955,093 648,149 - - - - - 5,093,281 - (2,564) - (1,239,391) (1,639,288) -
345,113 - 442,617 670 1,528,759 6,002,475
370,096 140,694 523,240 263,080 4,692,041 6,733,408
(Continued)
SPECIAL REVENUE
125
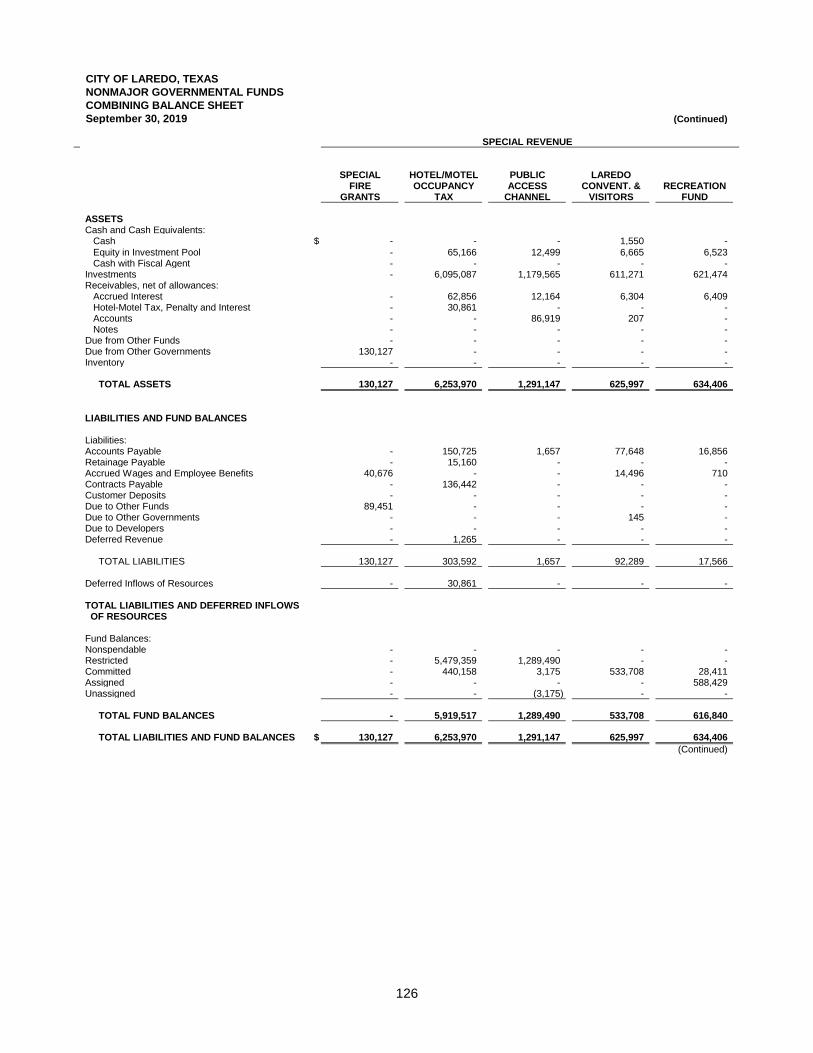
CITY OF LAREDO, TEXAS
NONMAJOR GOVERNMENTAL FUNDS
COMBINING BALANCE SHEET
September 30, 2019 (Continued)
SPECIAL REVENUE
SPECIAL HOTEL/MOTEL PUBLIC LAREDOFIRE OCCUPANCY ACCESS CONVENT. & RECREATION
GRANTS TAX CHANNEL VISITORS FUND
ASSETSCash and Cash Equivalents: Cash $ - - - 1,550 - Equity in Investment Pool - 65,166 12,499 6,665 6,523 Cash with Fiscal Agent - - - - - Investments - 6,095,087 1,179,565 611,271 621,474 Receivables, net of allowances: Accrued Interest - 62,856 12,164 6,304 6,409 Hotel-Motel Tax, Penalty and Interest - 30,861 - - - Accounts - - 86,919 207 - Notes - - - - - Due from Other Funds - - - - - Due from Other Governments 130,127 - - - - Inventory - - - - -
TOTAL ASSETS 130,127 6,253,970 1,291,147 625,997 634,406
LIABILITIES AND FUND BALANCES
Liabilities:Accounts Payable - 150,725 1,657 77,648 16,856 Retainage Payable - 15,160 - - - Accrued Wages and Employee Benefits 40,676 - - 14,496 710 Contracts Payable - 136,442 - - - Customer Deposits - - - - - Due to Other Funds 89,451 - - - - Due to Other Governments - - - 145 - Due to Developers - - - - - Deferred Revenue - 1,265 - - -
TOTAL LIABILITIES 130,127 303,592 1,657 92,289 17,566
Deferred Inflows of Resources - 30,861 - - -
TOTAL LIABILITIES AND DEFERRED INFLOWS OF RESOURCES
Fund Balances:Nonspendable - - - - - Restricted - 5,479,359 1,289,490 - - Committed - 440,158 3,175 533,708 28,411 Assigned - - - - 588,429 Unassigned - - (3,175) - -
TOTAL FUND BALANCES - 5,919,517 1,289,490 533,708 616,840
TOTAL LIABILITIES AND FUND BALANCES $ 130,127 6,253,970 1,291,147 625,997 634,406
(Continued)
126
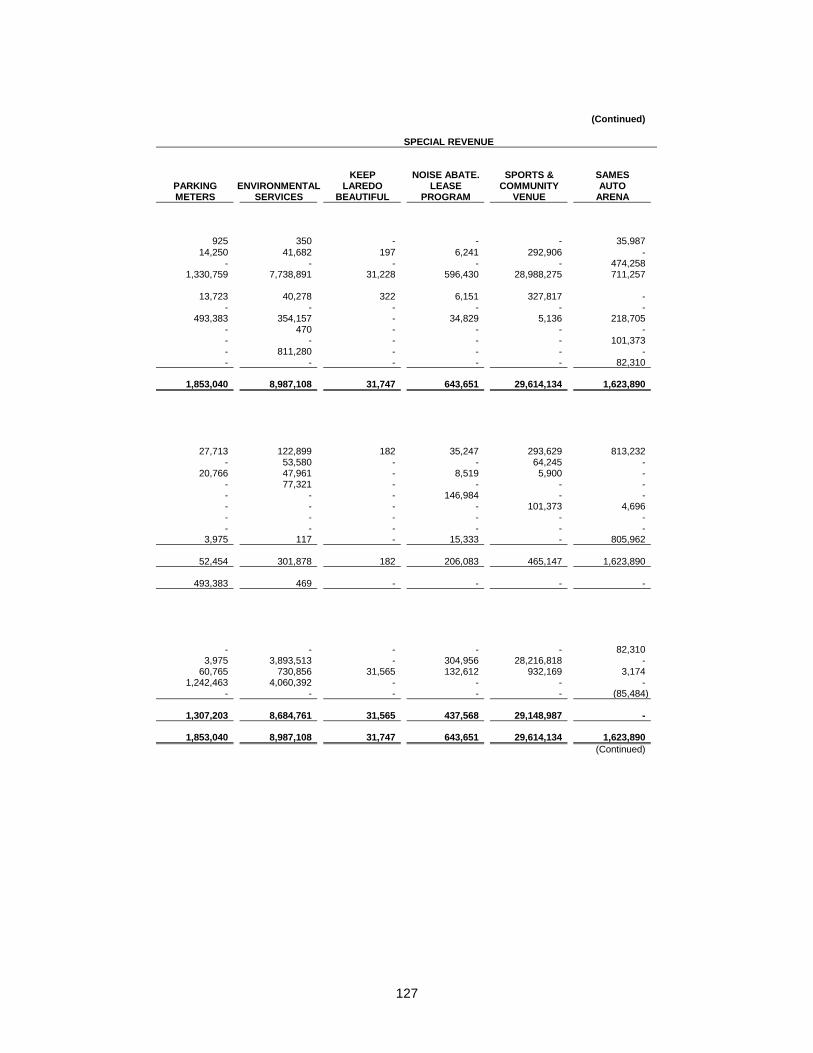
(Continued)
KEEP NOISE ABATE. SPORTS & SAMESPARKING ENVIRONMENTAL LAREDO LEASE COMMUNITY AUTOMETERS SERVICES BEAUTIFUL PROGRAM VENUE ARENA
925 350 - - - 35,987 14,250 41,682 197 6,241 292,906 -
- - - - - 474,258 1,330,759 7,738,891 31,228 596,430 28,988,275 711,257
13,723 40,278 322 6,151 327,817 - - - - - - -
493,383 354,157 - 34,829 5,136 218,705 - 470 - - - - - - - - - 101,373 - 811,280 - - - - - - - - - 82,310
1,853,040 8,987,108 31,747 643,651 29,614,134 1,623,890
27,713 122,899 182 35,247 293,629 813,232 - 53,580 - - 64,245 -
20,766 47,961 - 8,519 5,900 - - 77,321 - - - - - - - 146,984 - - - - - - 101,373 4,696 - - - - - - - - - - - -
3,975 117 - 15,333 - 805,962
52,454 301,878 182 206,083 465,147 1,623,890
493,383 469 - - - -
- - - - - 82,310 3,975 3,893,513 - 304,956 28,216,818 -
60,765 730,856 31,565 132,612 932,169 3,174 1,242,463 4,060,392 - - - -
- - - - - (85,484)
1,307,203 8,684,761 31,565 437,568 29,148,987 -
1,853,040 8,987,108 31,747 643,651 29,614,134 1,623,890
(Continued)
SPECIAL REVENUE
127
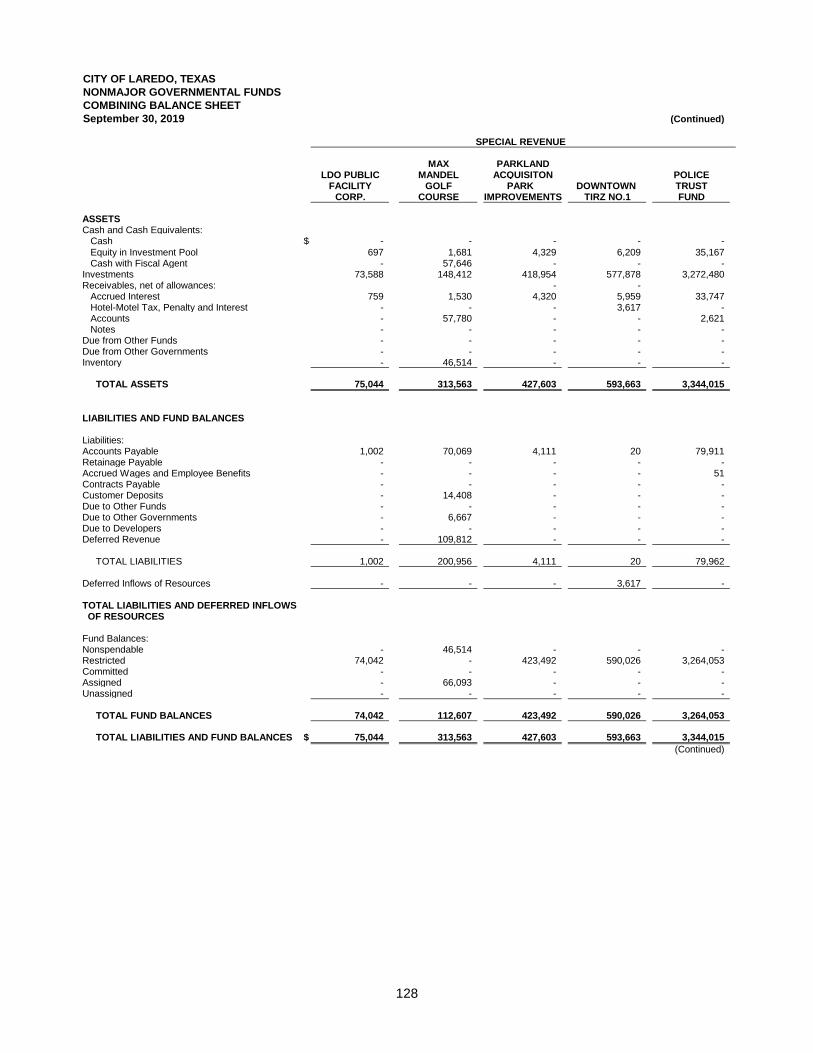
CITY OF LAREDO, TEXAS
NONMAJOR GOVERNMENTAL FUNDS
COMBINING BALANCE SHEET
September 30, 2019 (Continued)
SPECIAL REVENUE
MAX PARKLANDLDO PUBLIC MANDEL ACQUISITON POLICE
FACILITY GOLF PARK DOWNTOWN TRUSTCORP. COURSE IMPROVEMENTS TIRZ NO.1 FUND
ASSETSCash and Cash Equivalents: Cash $ - - - - - Equity in Investment Pool 697 1,681 4,329 6,209 35,167 Cash with Fiscal Agent - 57,646 - - - Investments 73,588 148,412 418,954 577,878 3,272,480 Receivables, net of allowances: - - Accrued Interest 759 1,530 4,320 5,959 33,747 Hotel-Motel Tax, Penalty and Interest - - - 3,617 - Accounts - 57,780 - - 2,621 Notes - - - - - Due from Other Funds - - - - - Due from Other Governments - - - - - Inventory - 46,514 - - -
TOTAL ASSETS 75,044 313,563 427,603 593,663 3,344,015
LIABILITIES AND FUND BALANCES
Liabilities:Accounts Payable 1,002 70,069 4,111 20 79,911 Retainage Payable - - - - - Accrued Wages and Employee Benefits - - - - 51 Contracts Payable - - - - - Customer Deposits - 14,408 - - - Due to Other Funds - - - - - Due to Other Governments - 6,667 - - - Due to Developers - - - - - Deferred Revenue - 109,812 - - -
TOTAL LIABILITIES 1,002 200,956 4,111 20 79,962
Deferred Inflows of Resources - - - 3,617 -
TOTAL LIABILITIES AND DEFERRED INFLOWS OF RESOURCES
Fund Balances:Nonspendable - 46,514 - - - Restricted 74,042 - 423,492 590,026 3,264,053 Committed - - - - - Assigned - 66,093 - - - Unassigned - - - - -
TOTAL FUND BALANCES 74,042 112,607 423,492 590,026 3,264,053
TOTAL LIABILITIES AND FUND BALANCES $ 75,044 313,563 427,603 593,663 3,344,015
(Continued)
128
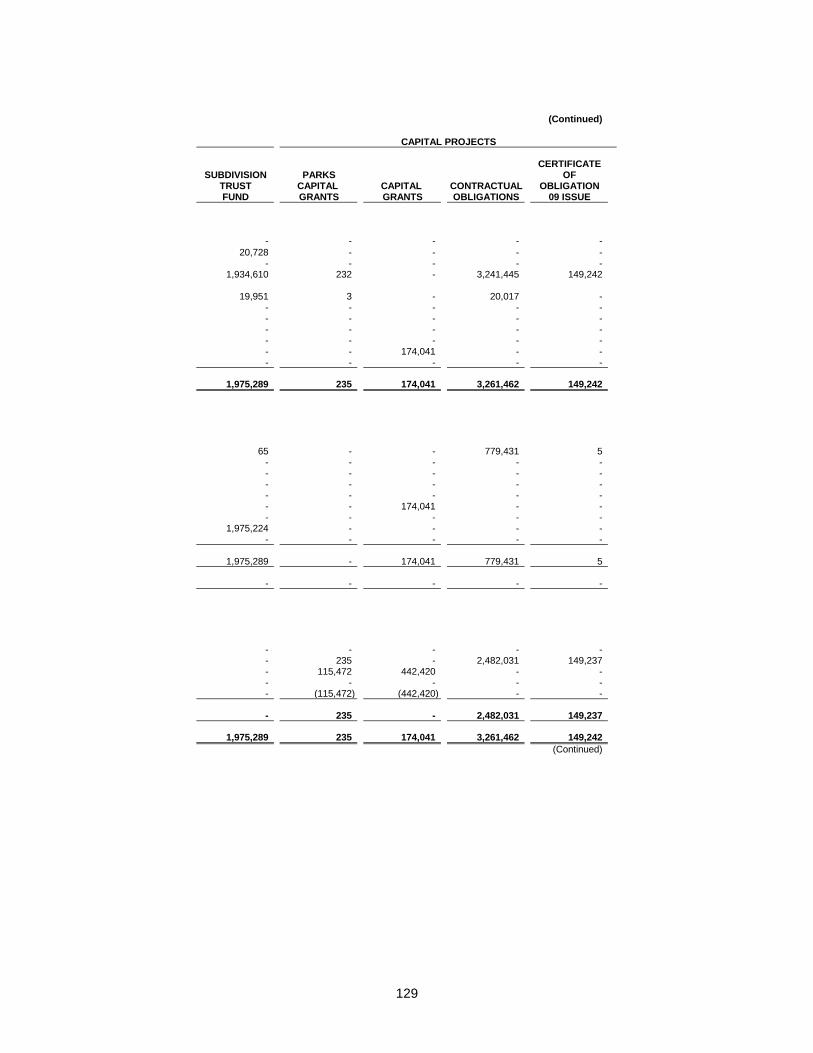
(Continued)
CERTIFICATESUBDIVISION PARKS OF
TRUST CAPITAL CAPITAL CONTRACTUAL OBLIGATIONFUND GRANTS GRANTS OBLIGATIONS 09 ISSUE
- - - - - 20,728 - - - -
- - - - - 1,934,610 232 - 3,241,445 149,242
19,951 3 - 20,017 - - - - - - - - - - - - - - - - - - - - - - - 174,041 - - - - - - -
1,975,289 235 174,041 3,261,462 149,242
65 - - 779,431 5 - - - - - - - - - - - - - - - - - - - - - - 174,041 - - - - - - -
1,975,224 - - - - - - - - -
1,975,289 - 174,041 779,431 5
- - - - -
- - - - - - 235 - 2,482,031 149,237 - 115,472 442,420 - - - - - - - - (115,472) (442,420) - -
- 235 - 2,482,031 149,237
1,975,289 235 174,041 3,261,462 149,242
(Continued)
CAPITAL PROJECTS
129
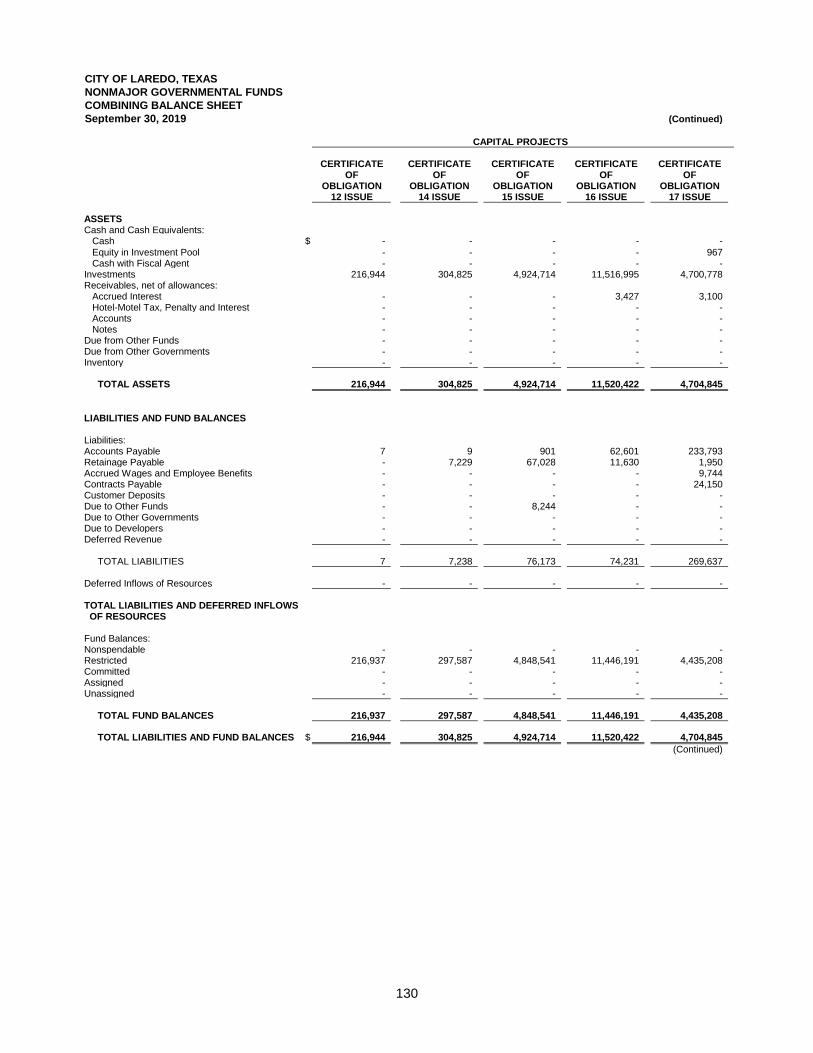
CITY OF LAREDO, TEXAS
NONMAJOR GOVERNMENTAL FUNDS
COMBINING BALANCE SHEET
September 30, 2019 (Continued)
CAPITAL PROJECTS
CERTIFICATE CERTIFICATE CERTIFICATE CERTIFICATE CERTIFICATEOF OF OF OF OF
OBLIGATION OBLIGATION OBLIGATION OBLIGATION OBLIGATION12 ISSUE 14 ISSUE 15 ISSUE 16 ISSUE 17 ISSUE
ASSETSCash and Cash Equivalents: Cash $ - - - - - Equity in Investment Pool - - - - 967 Cash with Fiscal Agent - - - - - Investments 216,944 304,825 4,924,714 11,516,995 4,700,778 Receivables, net of allowances: Accrued Interest - - - 3,427 3,100 Hotel-Motel Tax, Penalty and Interest - - - - - Accounts - - - - - Notes - - - - - Due from Other Funds - - - - - Due from Other Governments - - - - - Inventory - - - - -
TOTAL ASSETS 216,944 304,825 4,924,714 11,520,422 4,704,845
LIABILITIES AND FUND BALANCES
Liabilities:Accounts Payable 7 9 901 62,601 233,793 Retainage Payable - 7,229 67,028 11,630 1,950 Accrued Wages and Employee Benefits - - - - 9,744 Contracts Payable - - - - 24,150 Customer Deposits - - - - - Due to Other Funds - - 8,244 - - Due to Other Governments - - - - - Due to Developers - - - - - Deferred Revenue - - - - -
TOTAL LIABILITIES 7 7,238 76,173 74,231 269,637
Deferred Inflows of Resources - - - - -
TOTAL LIABILITIES AND DEFERRED INFLOWS OF RESOURCES
Fund Balances:Nonspendable - - - - - Restricted 216,937 297,587 4,848,541 11,446,191 4,435,208 Committed - - - - - Assigned - - - - - Unassigned - - - - -
TOTAL FUND BALANCES 216,937 297,587 4,848,541 11,446,191 4,435,208
TOTAL LIABILITIES AND FUND BALANCES $ 216,944 304,825 4,924,714 11,520,422 4,704,845
(Continued)
130
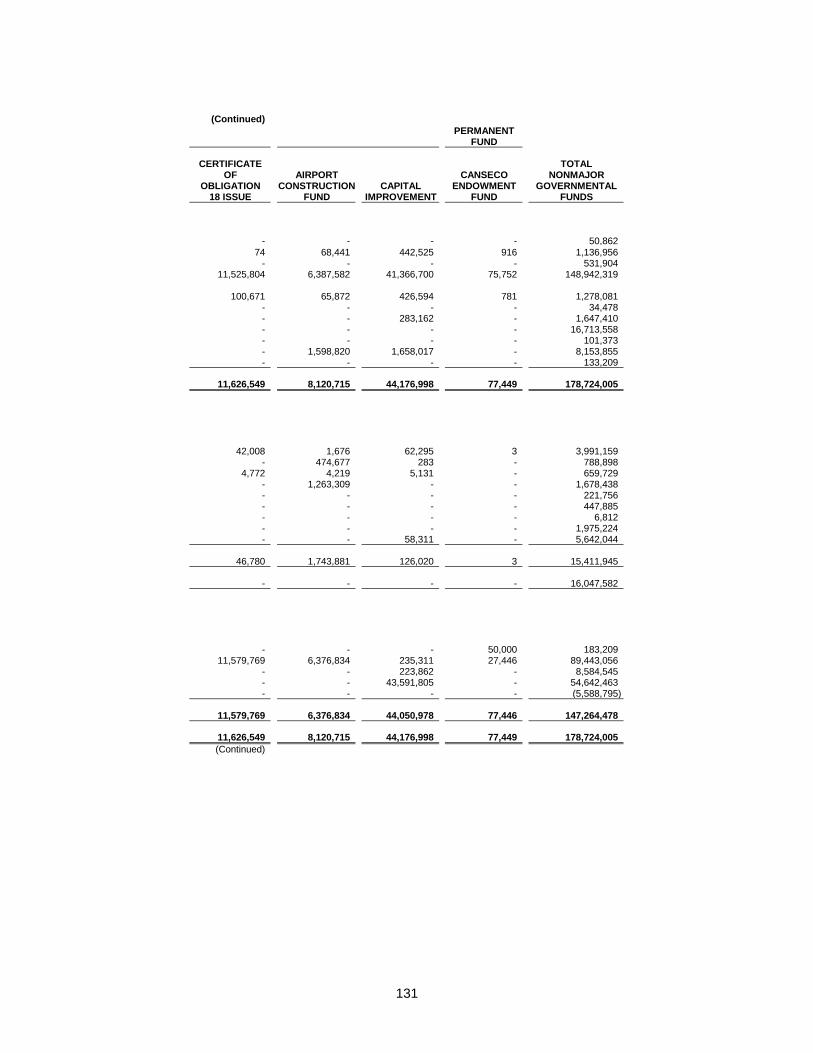
(Continued)
PERMANENTFUND
CERTIFICATE TOTALOF AIRPORT CANSECO NONMAJOR
OBLIGATION CONSTRUCTION CAPITAL ENDOWMENT GOVERNMENTAL18 ISSUE FUND IMPROVEMENT FUND FUNDS
- - - - 50,862 74 68,441 442,525 916 1,136,956
- - - - 531,904 11,525,804 6,387,582 41,366,700 75,752 148,942,319
100,671 65,872 426,594 781 1,278,081
- - - - 34,478 - - 283,162 - 1,647,410 - - - - 16,713,558 - - - - 101,373 - 1,598,820 1,658,017 - 8,153,855 - - - - 133,209
11,626,549 8,120,715 44,176,998 77,449 178,724,005
42,008 1,676 62,295 3 3,991,159 - 474,677 283 - 788,898
4,772 4,219 5,131 - 659,729 - 1,263,309 - - 1,678,438 - - - - 221,756 - - - - 447,885 - - - - 6,812 - - - - 1,975,224 - - 58,311 - 5,642,044
46,780 1,743,881 126,020 3 15,411,945
- - - - 16,047,582
- - - 50,000 183,209 11,579,769 6,376,834 235,311 27,446 89,443,056
- - 223,862 - 8,584,545 - - 43,591,805 - 54,642,463 - - - - (5,588,795)
11,579,769 6,376,834 44,050,978 77,446 147,264,478
11,626,549 8,120,715 44,176,998 77,449 178,724,005
(Continued)
131
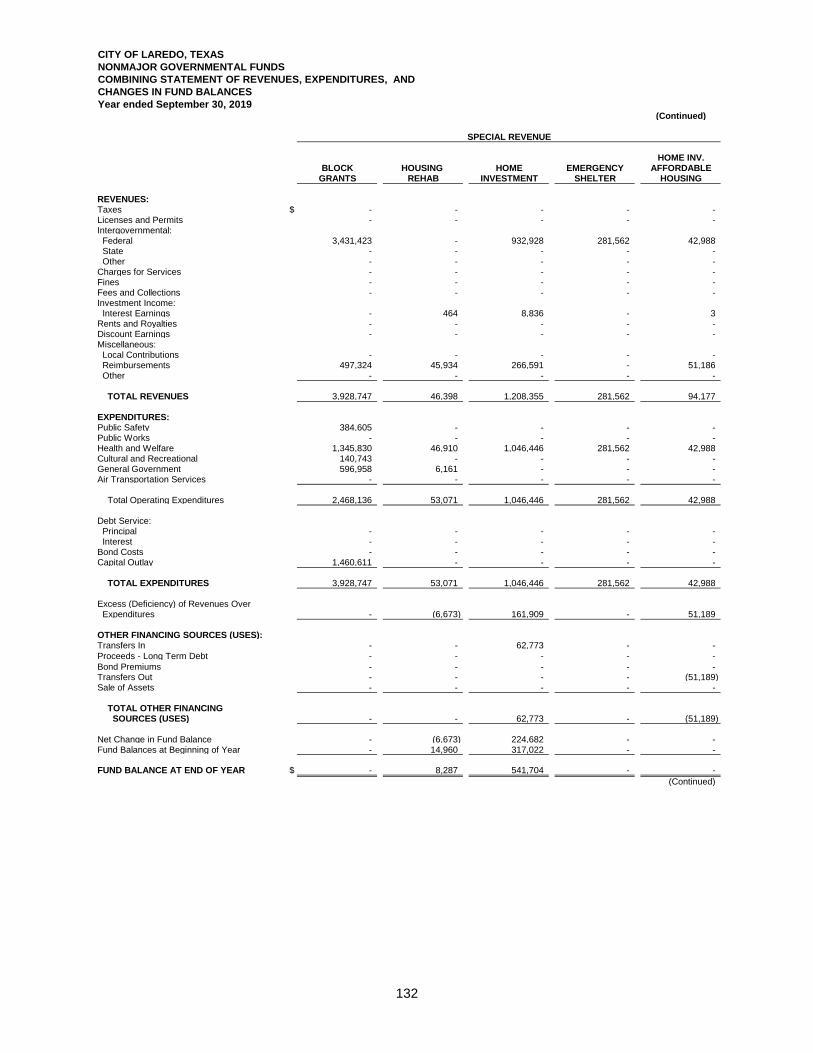
CITY OF LAREDO, TEXAS
NONMAJOR GOVERNMENTAL FUNDS
COMBINING STATEMENT OF REVENUES, EXPENDITURES, AND
CHANGES IN FUND BALANCES
Year ended September 30, 2019(Continued)
HOME INV.BLOCK HOUSING HOME EMERGENCY AFFORDABLE
GRANTS REHAB INVESTMENT SHELTER HOUSING
REVENUES:Taxes $ - - - - - Licenses and Permits - - - - - Intergovernmental: Federal 3,431,423 - 932,928 281,562 42,988 State - - - - - Other - - - - - Charges for Services - - - - - Fines - - - - - Fees and Collections - - - - - Investment Income: Interest Earnings - 464 8,836 - 3 Rents and Royalties - - - - - Discount Earnings - - - - - Miscellaneous: Local Contributions - - - - - Reimbursements 497,324 45,934 266,591 - 51,186 Other - - - - -
TOTAL REVENUES 3,928,747 46,398 1,208,355 281,562 94,177
EXPENDITURES:Public Safety 384,605 - - - - Public Works - - - - - Health and Welfare 1,345,830 46,910 1,046,446 281,562 42,988 Cultural and Recreational 140,743 - - - - General Government 596,958 6,161 - - - Air Transportation Services - - - - -
Total Operating Expenditures 2,468,136 53,071 1,046,446 281,562 42,988
Debt Service: Principal - - - - - Interest - - - - - Bond Costs - - - - - Capital Outlay 1,460,611 - - - -
TOTAL EXPENDITURES 3,928,747 53,071 1,046,446 281,562 42,988
Excess (Deficiency) of Revenues Over Expenditures - (6,673) 161,909 - 51,189
OTHER FINANCING SOURCES (USES):Transfers In - - 62,773 - - Proceeds - Long Term Debt - - - - - Bond Premiums - - - - - Transfers Out - - - - (51,189) Sale of Assets - - - - -
TOTAL OTHER FINANCING SOURCES (USES) - - 62,773 - (51,189)
Net Change in Fund Balance - (6,673) 224,682 - - Fund Balances at Beginning of Year - 14,960 317,022 - -
FUND BALANCE AT END OF YEAR $ - 8,287 541,704 - - (Continued)
SPECIAL REVENUE
132
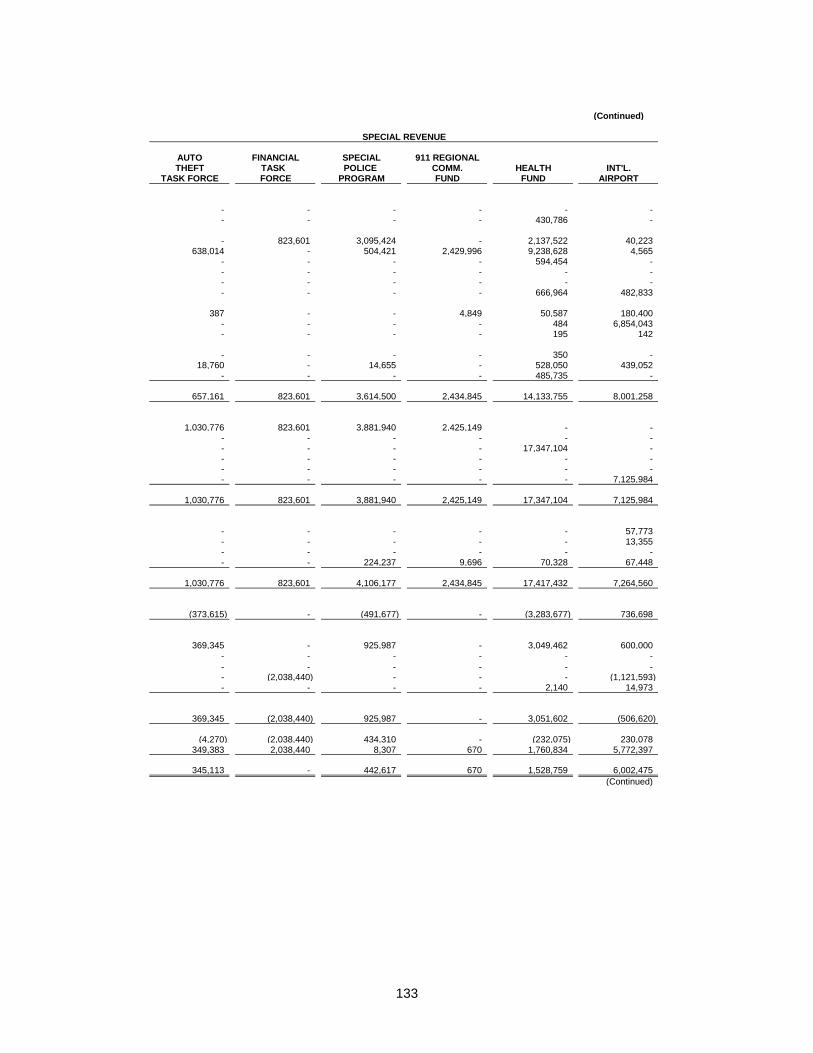
(Continued)
SPECIAL REVENUE SPECIAL REVENUE
AUTO FINANCIAL SPECIAL 911 REGIONALTHEFT TASK POLICE COMM. HEALTH INT'L.
TASK FORCE FORCE PROGRAM FUND FUND AIRPORT
- - - - - - - - - - 430,786 -
- 823,601 3,095,424 - 2,137,522 40,223 638,014 - 504,421 2,429,996 9,238,628 4,565
- - - - 594,454 - - - - - - - - - - - - - - - - - 666,964 482,833
387 - - 4,849 50,587 180,400 - - - - 484 6,854,043 - - - - 195 142
- - - - 350 - 18,760 - 14,655 - 528,050 439,052
- - - - 485,735 -
657,161 823,601 3,614,500 2,434,845 14,133,755 8,001,258
1,030,776 823,601 3,881,940 2,425,149 - - - - - - - - - - - - 17,347,104 - - - - - - - - - - - - - - - - - - 7,125,984
1,030,776 823,601 3,881,940 2,425,149 17,347,104 7,125,984
- - - - - 57,773 - - - - - 13,355 - - - - - - - - 224,237 9,696 70,328 67,448
1,030,776 823,601 4,106,177 2,434,845 17,417,432 7,264,560
(373,615) - (491,677) - (3,283,677) 736,698
369,345 - 925,987 - 3,049,462 600,000 - - - - - - - - - - - - - (2,038,440) - - - (1,121,593) - - - - 2,140 14,973
369,345 (2,038,440) 925,987 - 3,051,602 (506,620)
(4,270) (2,038,440) 434,310 - (232,075) 230,078 349,383 2,038,440 8,307 670 1,760,834 5,772,397
345,113 - 442,617 670 1,528,759 6,002,475 (Continued)
133
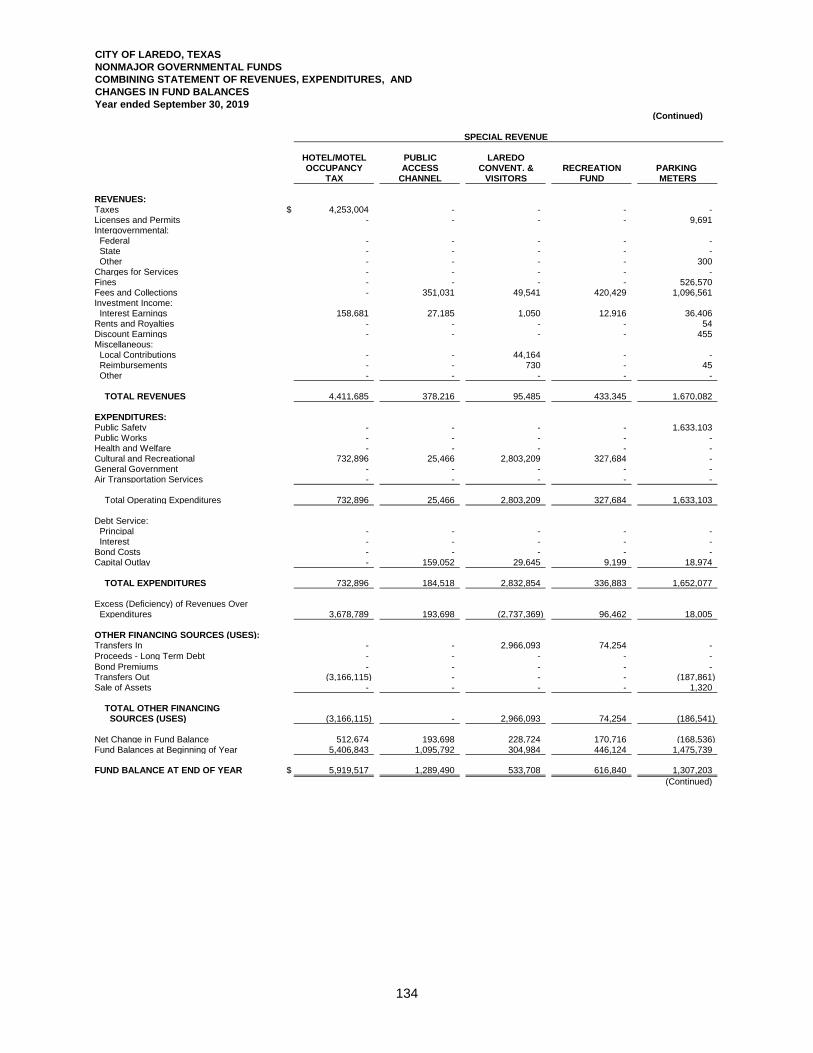
CITY OF LAREDO, TEXAS
NONMAJOR GOVERNMENTAL FUNDS
COMBINING STATEMENT OF REVENUES, EXPENDITURES, AND
CHANGES IN FUND BALANCES
Year ended September 30, 2019 (Continued)
SPECIAL REVENUE SPECIAL REVENUE
HOTEL/MOTEL PUBLIC LAREDOOCCUPANCY ACCESS CONVENT. & RECREATION PARKING ENVIRONMENTAL
TAX CHANNEL VISITORS FUND METERS
REVENUES:Taxes $ 4,253,004 - - - - Licenses and Permits - - - - 9,691 Intergovernmental: Federal - - - - - State - - - - - Other - - - - 300 Charges for Services - - - - - Fines - - - - 526,570 Fees and Collections - 351,031 49,541 420,429 1,096,561 Investment Income: Interest Earnings 158,681 27,185 1,050 12,916 36,406 Rents and Royalties - - - - 54 Discount Earnings - - - - 455 Miscellaneous: Local Contributions - - 44,164 - - Reimbursements - - 730 - 45 Other - - - - - TOTAL REVENUES 4,411,685 378,216 95,485 433,345 1,670,082
EXPENDITURES:Public Safety - - - - 1,633,103 Public Works - - - - - Health and Welfare - - - - - Cultural and Recreational 732,896 25,466 2,803,209 327,684 - General Government - - - - - Air Transportation Services - - - - - Total Operating Expenditures 732,896 25,466 2,803,209 327,684 1,633,103
Debt Service: Principal - - - - - Interest - - - - - Bond Costs - - - - - Capital Outlay - 159,052 29,645 9,199 18,974 TOTAL EXPENDITURES 732,896 184,518 2,832,854 336,883 1,652,077
Excess (Deficiency) of Revenues Over Expenditures 3,678,789 193,698 (2,737,369) 96,462 18,005
OTHER FINANCING SOURCES (USES):Transfers In - - 2,966,093 74,254 - Proceeds - Long Term Debt - - - - - Bond Premiums - - - - - Transfers Out (3,166,115) - - - (187,861) Sale of Assets - - - - 1,320
TOTAL OTHER FINANCING SOURCES (USES) (3,166,115) - 2,966,093 74,254 (186,541) Net Change in Fund Balance 512,674 193,698 228,724 170,716 (168,536) Fund Balances at Beginning of Year 5,406,843 1,095,792 304,984 446,124 1,475,739
FUND BALANCE AT END OF YEAR $ 5,919,517 1,289,490 533,708 616,840 1,307,203 (Continued)
134
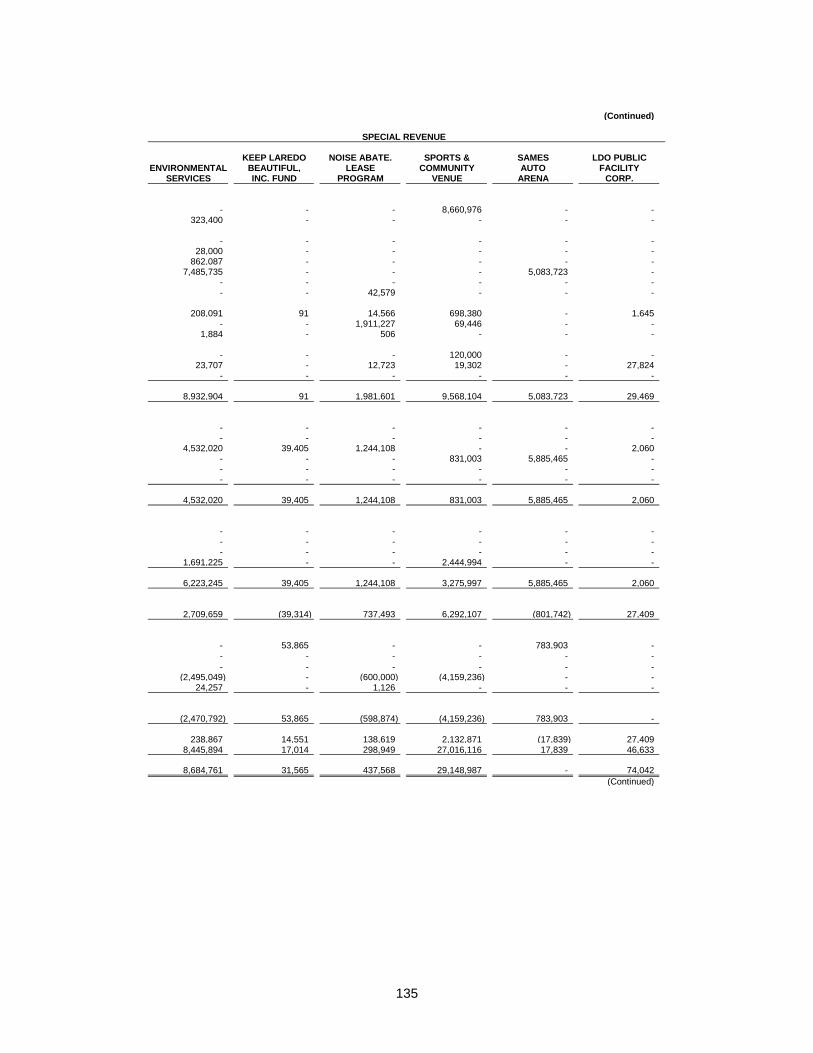
(Continued)
SPECIAL REVENUE
KEEP LAREDO NOISE ABATE. SPORTS & SAMES LDO PUBLICENVIRONMENTAL BEAUTIFUL, LEASE COMMUNITY AUTO FACILITY
SERVICES INC. FUND PROGRAM VENUE ARENA CORP.
- - - 8,660,976 - - 323,400 - - - - -
- - - - - - 28,000 - - - - -
862,087 - - - - - 7,485,735 - - - 5,083,723 -
- - - - - - - - 42,579 - - -
208,091 91 14,566 698,380 - 1,645 - - 1,911,227 69,446 - -
1,884 - 506 - - -
- - - 120,000 - - 23,707 - 12,723 19,302 - 27,824
- - - - - -
8,932,904 91 1,981,601 9,568,104 5,083,723 29,469
- - - - - - - - - - - -
4,532,020 39,405 1,244,108 - - 2,060 - - - 831,003 5,885,465 - - - - - - - - - - - - -
4,532,020 39,405 1,244,108 831,003 5,885,465 2,060
- - - - - - - - - - - - - - - - - -
1,691,225 - - 2,444,994 - -
6,223,245 39,405 1,244,108 3,275,997 5,885,465 2,060
2,709,659 (39,314) 737,493 6,292,107 (801,742) 27,409
- 53,865 - - 783,903 - - - - - - - - - - - - -
(2,495,049) - (600,000) (4,159,236) - - 24,257 - 1,126 - - -
(2,470,792) 53,865 (598,874) (4,159,236) 783,903 -
238,867 14,551 138,619 2,132,871 (17,839) 27,409 8,445,894 17,014 298,949 27,016,116 17,839 46,633
8,684,761 31,565 437,568 29,148,987 - 74,042 (Continued)
135
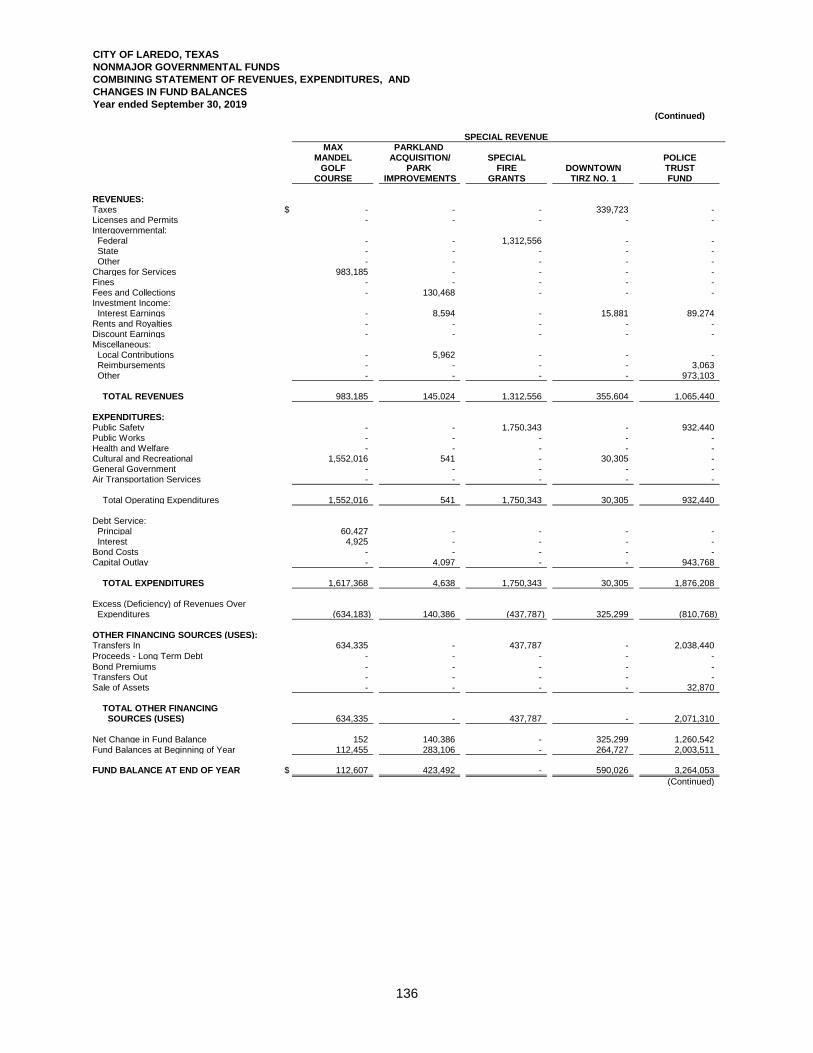
CITY OF LAREDO, TEXAS
NONMAJOR GOVERNMENTAL FUNDS
COMBINING STATEMENT OF REVENUES, EXPENDITURES, AND
CHANGES IN FUND BALANCES
Year ended September 30, 2019 (Continued)
MAX PARKLAND MANDEL ACQUISITION/ SPECIAL POLICE
GOLF PARK FIRE DOWNTOWN TRUSTCOURSE IMPROVEMENTS GRANTS TIRZ NO. 1 FUND
REVENUES:Taxes $ - - - 339,723 - Licenses and Permits - - - - - Intergovernmental: Federal - - 1,312,556 - - State - - - - - Other - - - - - Charges for Services 983,185 - - - - Fines - - - - - Fees and Collections - 130,468 - - - Investment Income: Interest Earnings - 8,594 - 15,881 89,274 Rents and Royalties - - - - - Discount Earnings - - - - - Miscellaneous: Local Contributions - 5,962 - - - Reimbursements - - - - 3,063 Other - - - - 973,103 TOTAL REVENUES 983,185 145,024 1,312,556 355,604 1,065,440
EXPENDITURES:Public Safety - - 1,750,343 - 932,440 Public Works - - - - - Health and Welfare - - - - - Cultural and Recreational 1,552,016 541 - 30,305 - General Government - - - - - Air Transportation Services - - - - - Total Operating Expenditures 1,552,016 541 1,750,343 30,305 932,440
Debt Service: Principal 60,427 - - - - Interest 4,925 - - - - Bond Costs - - - - - Capital Outlay - 4,097 - - 943,768 TOTAL EXPENDITURES 1,617,368 4,638 1,750,343 30,305 1,876,208
Excess (Deficiency) of Revenues Over Expenditures (634,183) 140,386 (437,787) 325,299 (810,768)
OTHER FINANCING SOURCES (USES):Transfers In 634,335 - 437,787 - 2,038,440 Proceeds - Long Term Debt - - - - - Bond Premiums - - - - - Transfers Out - - - - - Sale of Assets - - - - 32,870
TOTAL OTHER FINANCING SOURCES (USES) 634,335 - 437,787 - 2,071,310 Net Change in Fund Balance 152 140,386 - 325,299 1,260,542 Fund Balances at Beginning of Year 112,455 283,106 - 264,727 2,003,511
FUND BALANCE AT END OF YEAR $ 112,607 423,492 - 590,026 3,264,053 (Continued)
SPECIAL REVENUE
136
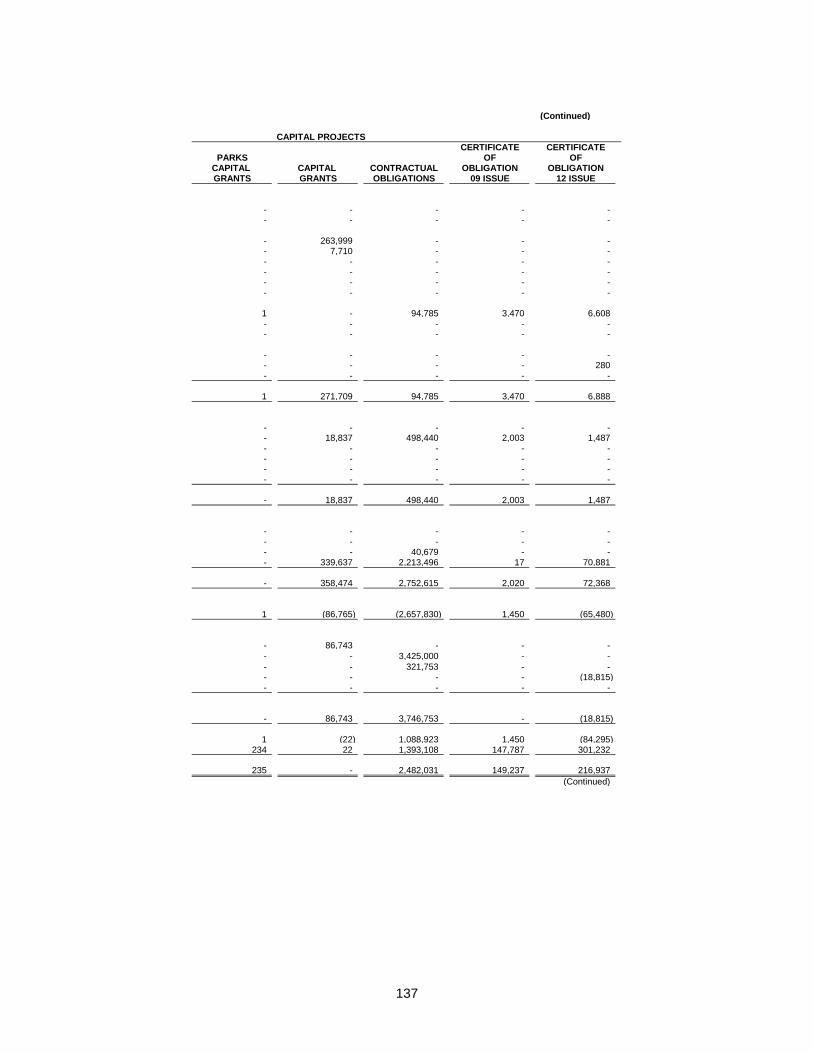
(Continued)
CERTIFICATE CERTIFICATEPARKS OF OF
CAPITAL CAPITAL CONTRACTUAL OBLIGATION OBLIGATIONGRANTS GRANTS OBLIGATIONS 09 ISSUE 12 ISSUE
- - - - - - - - - -
- 263,999 - - - - 7,710 - - - - - - - - - - - - - - - - - - - - - - -
1 - 94,785 3,470 6,608 - - - - - - - - - -
- - - - - - - - - 280 - - - - -
1 271,709 94,785 3,470 6,888
- - - - - - 18,837 498,440 2,003 1,487 - - - - - - - - - - - - - - - - - - - -
- 18,837 498,440 2,003 1,487
- - - - - - - - - - - - 40,679 - - - 339,637 2,213,496 17 70,881
- 358,474 2,752,615 2,020 72,368
1 (86,765) (2,657,830) 1,450 (65,480)
- 86,743 - - - - - 3,425,000 - - - - 321,753 - - - - - - (18,815) - - - - -
- 86,743 3,746,753 - (18,815)
1 (22) 1,088,923 1,450 (84,295) 234 22 1,393,108 147,787 301,232
235 - 2,482,031 149,237 216,937 (Continued)
CAPITAL PROJECTS
137
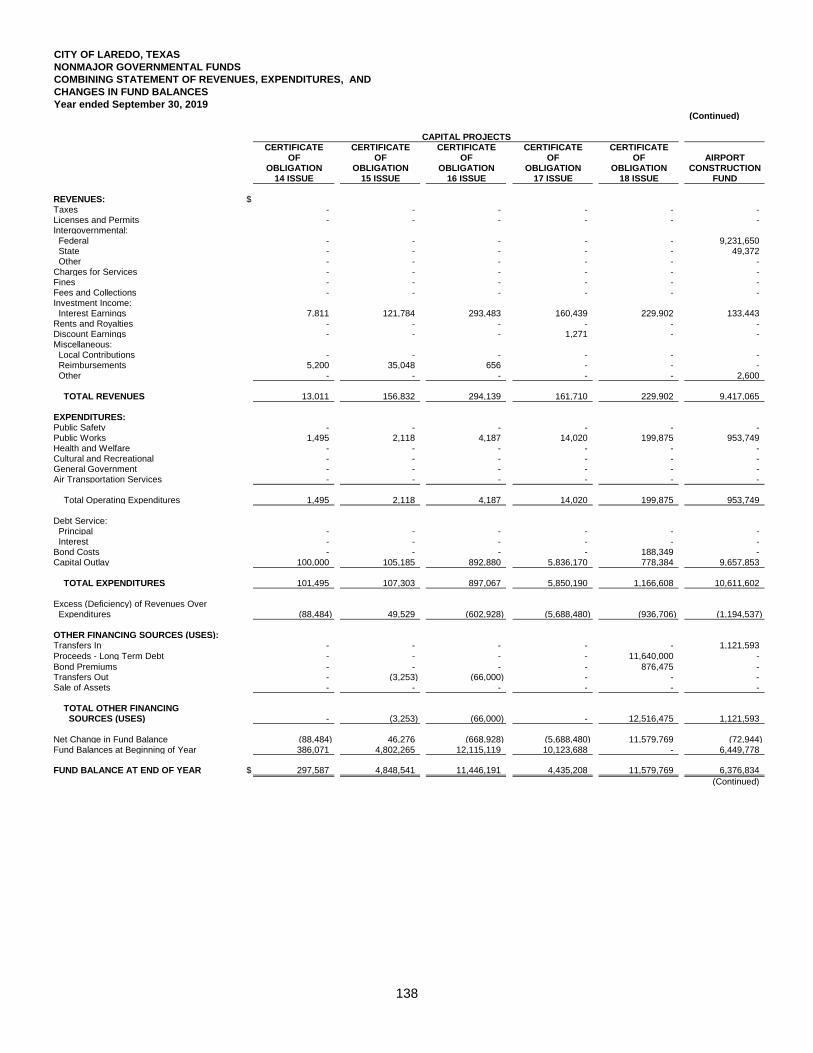
CITY OF LAREDO, TEXAS
NONMAJOR GOVERNMENTAL FUNDS
COMBINING STATEMENT OF REVENUES, EXPENDITURES, AND
CHANGES IN FUND BALANCES
Year ended September 30, 2019 (Continued)
CAPITAL PROJECTSCERTIFICATE CERTIFICATE CERTIFICATE CERTIFICATE CERTIFICATE
OF OF OF OF OF AIRPORTOBLIGATION OBLIGATION OBLIGATION OBLIGATION OBLIGATION CONSTRUCTION
14 ISSUE 15 ISSUE 16 ISSUE 17 ISSUE 18 ISSUE FUND
REVENUES: $Taxes - - - - - - Licenses and Permits - - - - - - Intergovernmental: Federal - - - - - 9,231,650 State - - - - - 49,372 Other - - - - - - Charges for Services - - - - - - Fines - - - - - - Fees and Collections - - - - - - Investment Income: Interest Earnings 7,811 121,784 293,483 160,439 229,902 133,443 Rents and Royalties - - - - - - Discount Earnings - - - 1,271 - - Miscellaneous: Local Contributions - - - - - - Reimbursements 5,200 35,048 656 - - - Other - - - - - 2,600 TOTAL REVENUES 13,011 156,832 294,139 161,710 229,902 9,417,065
EXPENDITURES:Public Safety - - - - - - Public Works 1,495 2,118 4,187 14,020 199,875 953,749 Health and Welfare - - - - - - Cultural and Recreational - - - - - - General Government - - - - - - Air Transportation Services - - - - - - Total Operating Expenditures 1,495 2,118 4,187 14,020 199,875 953,749
Debt Service: Principal - - - - - - Interest - - - - - - Bond Costs - - - - 188,349 - Capital Outlay 100,000 105,185 892,880 5,836,170 778,384 9,657,853 TOTAL EXPENDITURES 101,495 107,303 897,067 5,850,190 1,166,608 10,611,602
Excess (Deficiency) of Revenues Over Expenditures (88,484) 49,529 (602,928) (5,688,480) (936,706) (1,194,537)
OTHER FINANCING SOURCES (USES):Transfers In - - - - - 1,121,593 Proceeds - Long Term Debt - - - - 11,640,000 - Bond Premiums - - - - 876,475 - Transfers Out - (3,253) (66,000) - - - Sale of Assets - - - - - -
TOTAL OTHER FINANCING SOURCES (USES) - (3,253) (66,000) - 12,516,475 1,121,593 Net Change in Fund Balance (88,484) 46,276 (668,928) (5,688,480) 11,579,769 (72,944) Fund Balances at Beginning of Year 386,071 4,802,265 12,115,119 10,123,688 - 6,449,778
FUND BALANCE AT END OF YEAR $ 297,587 4,848,541 11,446,191 4,435,208 11,579,769 6,376,834 (Continued)
138
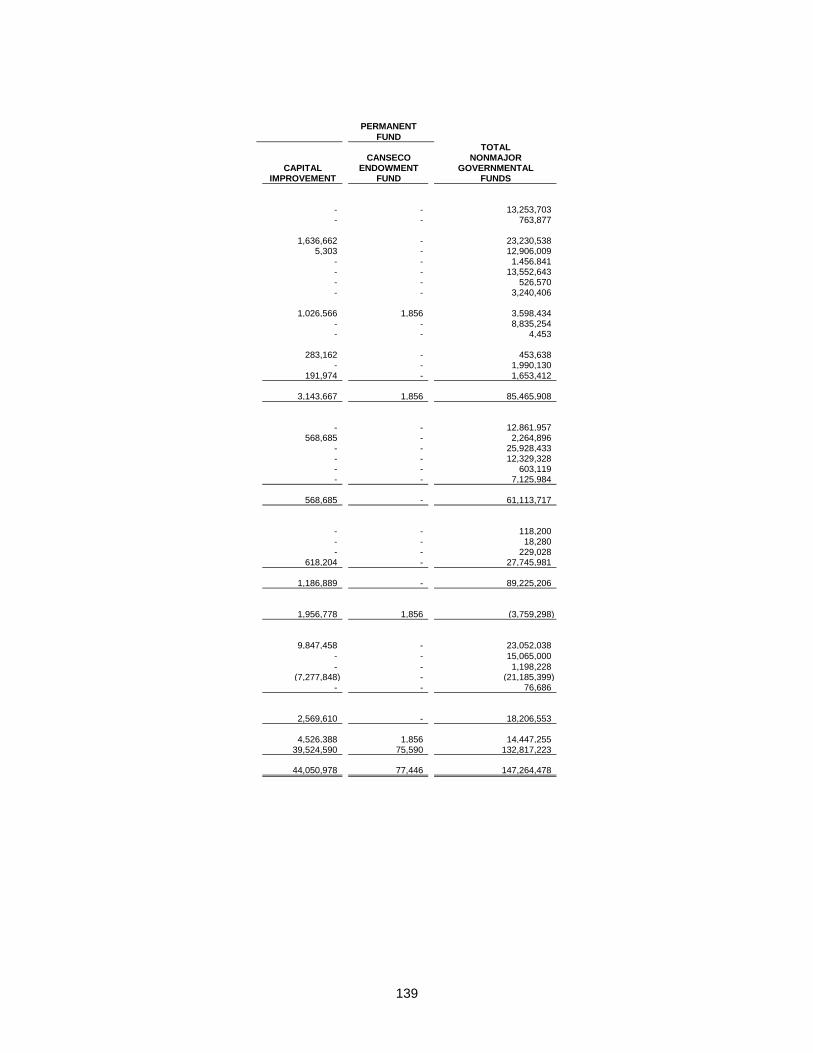
PERMANENT
FUNDTOTAL
CANSECO NONMAJORCAPITAL ENDOWMENT GOVERNMENTAL
IMPROVEMENT FUND FUNDS
- - 13,253,703 - - 763,877
1,636,662 - 23,230,538 5,303 - 12,906,009
- - 1,456,841 - - 13,552,643 - - 526,570 - - 3,240,406
1,026,566 1,856 3,598,434 - - 8,835,254 - - 4,453
283,162 - 453,638 - - 1,990,130
191,974 - 1,653,412
3,143,667 1,856 85,465,908
- - 12,861,957 568,685 - 2,264,896
- - 25,928,433 - - 12,329,328 - - 603,119 - - 7,125,984
568,685 - 61,113,717
- - 118,200 - - 18,280 - - 229,028
618,204 - 27,745,981
1,186,889 - 89,225,206
1,956,778 1,856 (3,759,298)
9,847,458 - 23,052,038 - - 15,065,000 - - 1,198,228
(7,277,848) - (21,185,399) - - 76,686
2,569,610 - 18,206,553
4,526,388 1,856 14,447,255 39,524,590 75,590 132,817,223
44,050,978 77,446 147,264,478
139
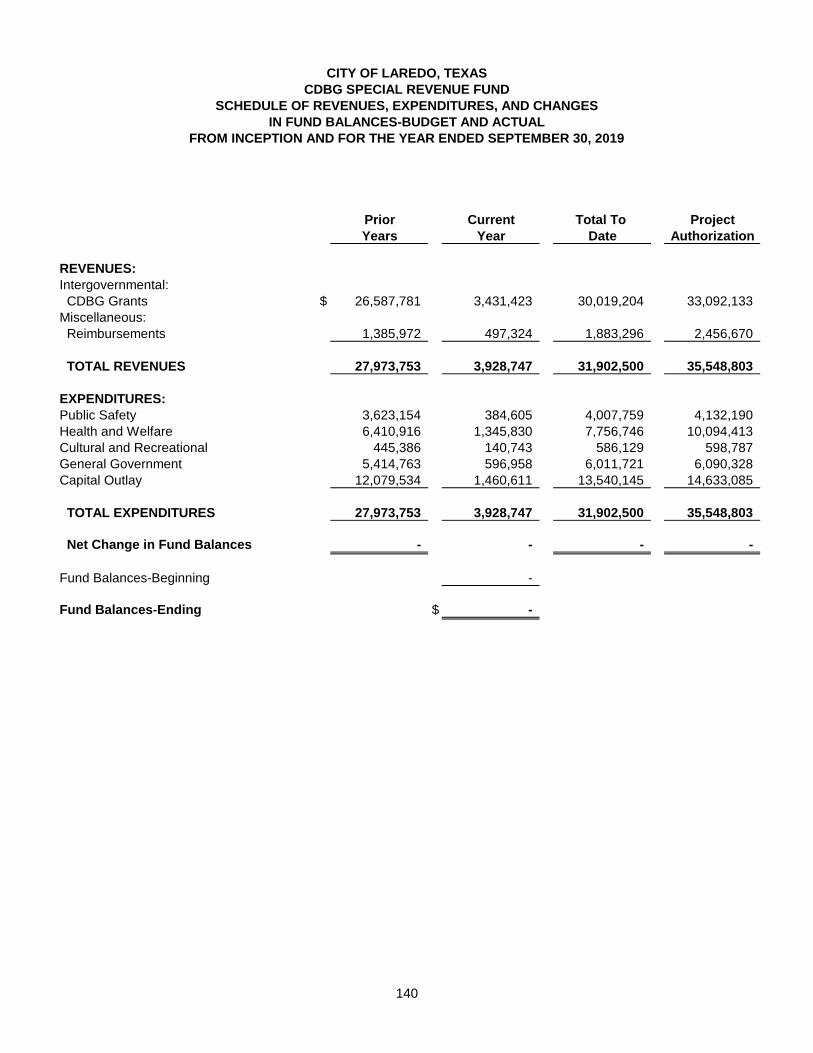
CITY OF LAREDO, TEXAS
CDBG SPECIAL REVENUE FUND
SCHEDULE OF REVENUES, EXPENDITURES, AND CHANGES
IN FUND BALANCES-BUDGET AND ACTUAL
FROM INCEPTION AND FOR THE YEAR ENDED SEPTEMBER 30, 2019
Prior Current Total To Project
Years Year Date Authorization
REVENUES:
Intergovernmental: CDBG Grants $ 26,587,781 3,431,423 30,019,204 33,092,133 Miscellaneous: Reimbursements 1,385,972 497,324 1,883,296 2,456,670
TOTAL REVENUES 27,973,753 3,928,747 31,902,500 35,548,803
EXPENDITURES:
Public Safety 3,623,154 384,605 4,007,759 4,132,190 Health and Welfare 6,410,916 1,345,830 7,756,746 10,094,413 Cultural and Recreational 445,386 140,743 586,129 598,787 General Government 5,414,763 596,958 6,011,721 6,090,328 Capital Outlay 12,079,534 1,460,611 13,540,145 14,633,085
TOTAL EXPENDITURES 27,973,753 3,928,747 31,902,500 35,548,803
Net Change in Fund Balances - - - -
Fund Balances-Beginning -
Fund Balances-Ending $ -
140
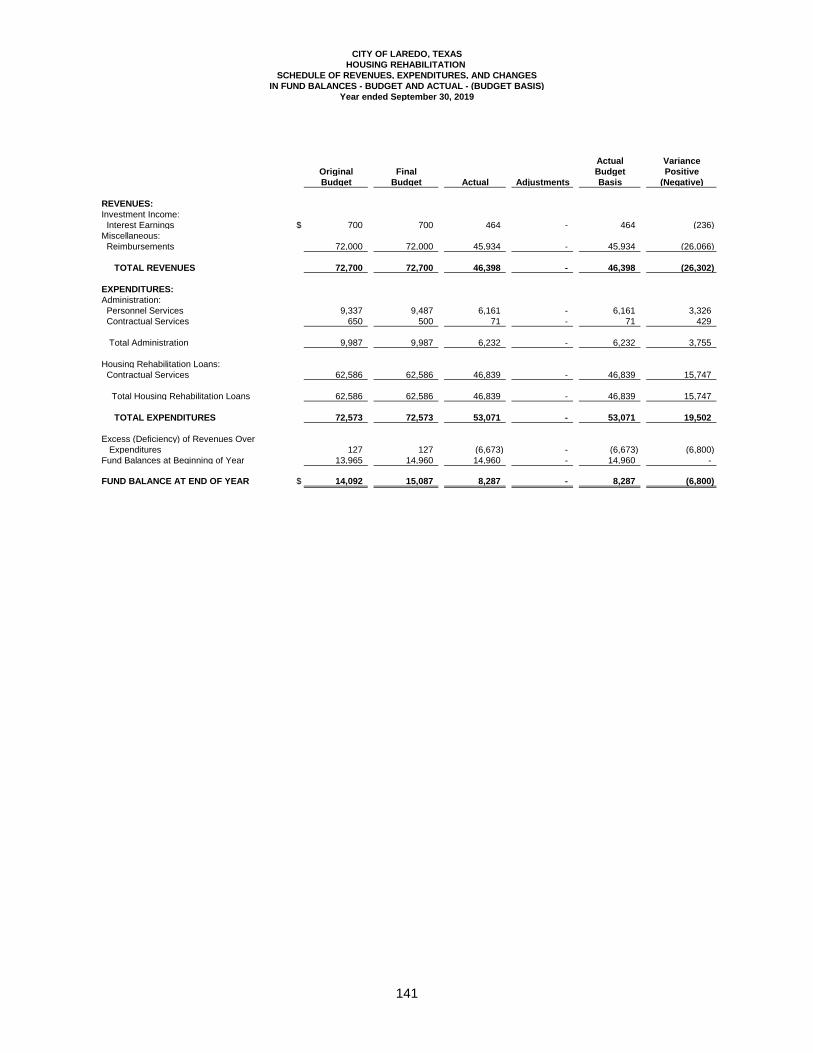
CITY OF LAREDO, TEXAS
HOUSING REHABILITATION
SCHEDULE OF REVENUES, EXPENDITURES, AND CHANGES
IN FUND BALANCES - BUDGET AND ACTUAL - (BUDGET BASIS)
Year ended September 30, 2019
Actual Variance
Original Final Budget Positive
Budget Budget Actual Adjustments Basis (Negative)
REVENUES:
Investment Income: Interest Earnings $ 700 700 464 - 464 (236) Miscellaneous: Reimbursements 72,000 72,000 45,934 - 45,934 (26,066)
TOTAL REVENUES 72,700 72,700 46,398 - 46,398 (26,302)
EXPENDITURES:
Administration: Personnel Services 9,337 9,487 6,161 - 6,161 3,326 Contractual Services 650 500 71 - 71 429
Total Administration 9,987 9,987 6,232 - 6,232 3,755
Housing Rehabilitation Loans: Contractual Services 62,586 62,586 46,839 - 46,839 15,747
Total Housing Rehabilitation Loans 62,586 62,586 46,839 - 46,839 15,747
TOTAL EXPENDITURES 72,573 72,573 53,071 - 53,071 19,502
Excess (Deficiency) of Revenues Over Expenditures 127 127 (6,673) - (6,673) (6,800) Fund Balances at Beginning of Year 13,965 14,960 14,960 - 14,960 -
FUND BALANCE AT END OF YEAR $ 14,092 15,087 8,287 - 8,287 (6,800)
141
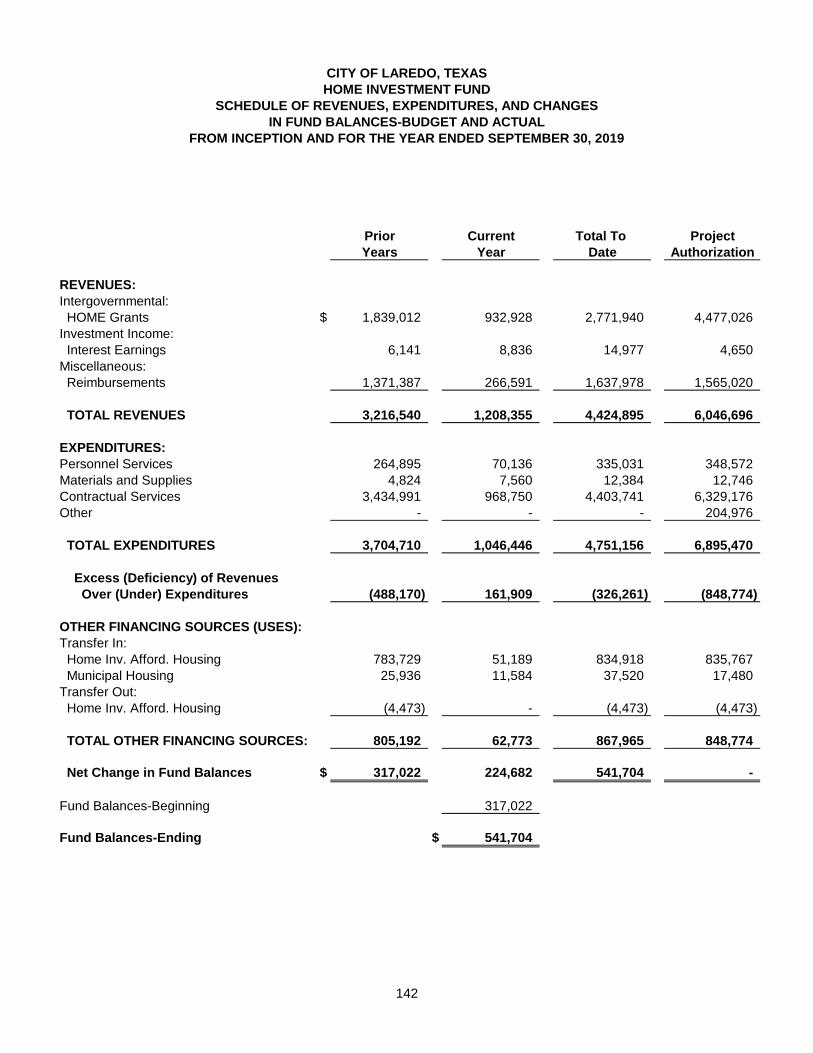
CITY OF LAREDO, TEXAS
HOME INVESTMENT FUND
SCHEDULE OF REVENUES, EXPENDITURES, AND CHANGES
IN FUND BALANCES-BUDGET AND ACTUAL
FROM INCEPTION AND FOR THE YEAR ENDED SEPTEMBER 30, 2019
Prior Current Total To Project
Years Year Date Authorization
REVENUES:
Intergovernmental: HOME Grants $ 1,839,012 932,928 2,771,940 4,477,026 Investment Income: Interest Earnings 6,141 8,836 14,977 4,650 Miscellaneous: Reimbursements 1,371,387 266,591 1,637,978 1,565,020
TOTAL REVENUES 3,216,540 1,208,355 4,424,895 6,046,696
EXPENDITURES:
Personnel Services 264,895 70,136 335,031 348,572 Materials and Supplies 4,824 7,560 12,384 12,746 Contractual Services 3,434,991 968,750 4,403,741 6,329,176 Other - - - 204,976
TOTAL EXPENDITURES 3,704,710 1,046,446 4,751,156 6,895,470
Excess (Deficiency) of Revenues
Over (Under) Expenditures (488,170) 161,909 (326,261) (848,774)
OTHER FINANCING SOURCES (USES):
Transfer In: Home Inv. Afford. Housing 783,729 51,189 834,918 835,767 Municipal Housing 25,936 11,584 37,520 17,480 Transfer Out: Home Inv. Afford. Housing (4,473) - (4,473) (4,473)
TOTAL OTHER FINANCING SOURCES: 805,192 62,773 867,965 848,774
Net Change in Fund Balances $ 317,022 224,682 541,704 -
Fund Balances-Beginning 317,022
Fund Balances-Ending $ 541,704
142
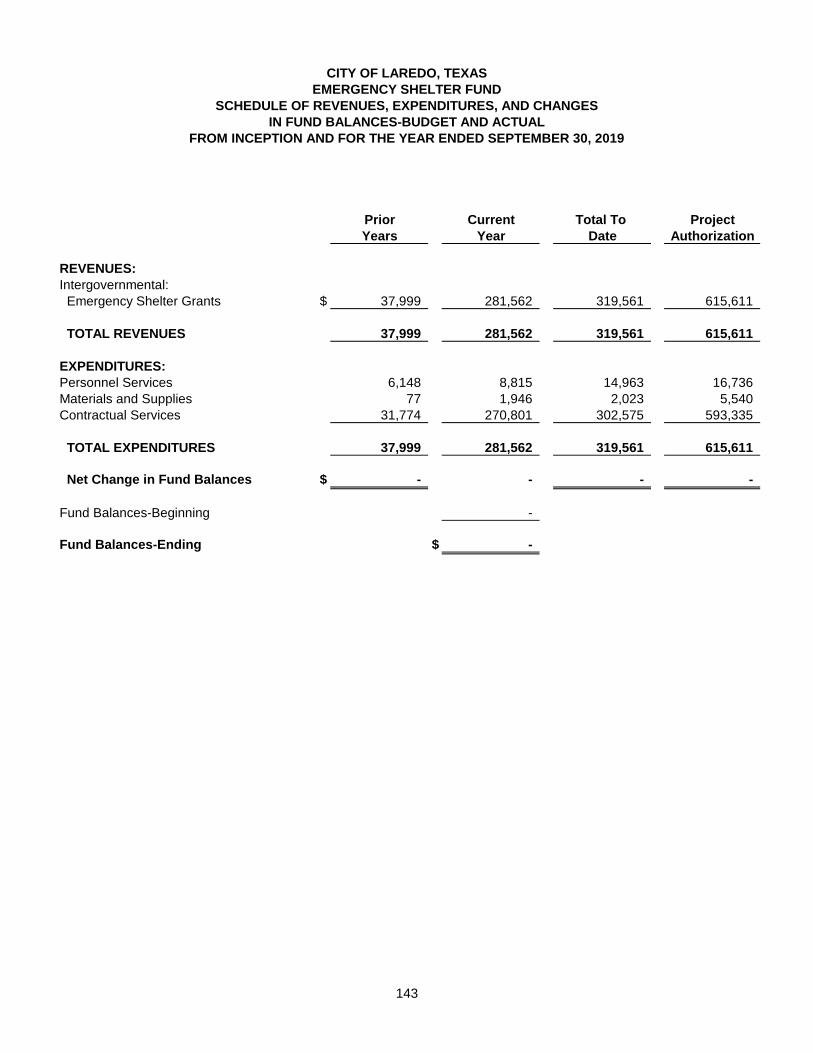
CITY OF LAREDO, TEXAS
EMERGENCY SHELTER FUND
SCHEDULE OF REVENUES, EXPENDITURES, AND CHANGES
IN FUND BALANCES-BUDGET AND ACTUAL
FROM INCEPTION AND FOR THE YEAR ENDED SEPTEMBER 30, 2019
Prior Current Total To Project
Years Year Date Authorization
REVENUES:
Intergovernmental: Emergency Shelter Grants $ 37,999 281,562 319,561 615,611
TOTAL REVENUES 37,999 281,562 319,561 615,611
EXPENDITURES:
Personnel Services 6,148 8,815 14,963 16,736 Materials and Supplies 77 1,946 2,023 5,540 Contractual Services 31,774 270,801 302,575 593,335
TOTAL EXPENDITURES 37,999 281,562 319,561 615,611
Net Change in Fund Balances $ - - - -
Fund Balances-Beginning -
Fund Balances-Ending $ -
143
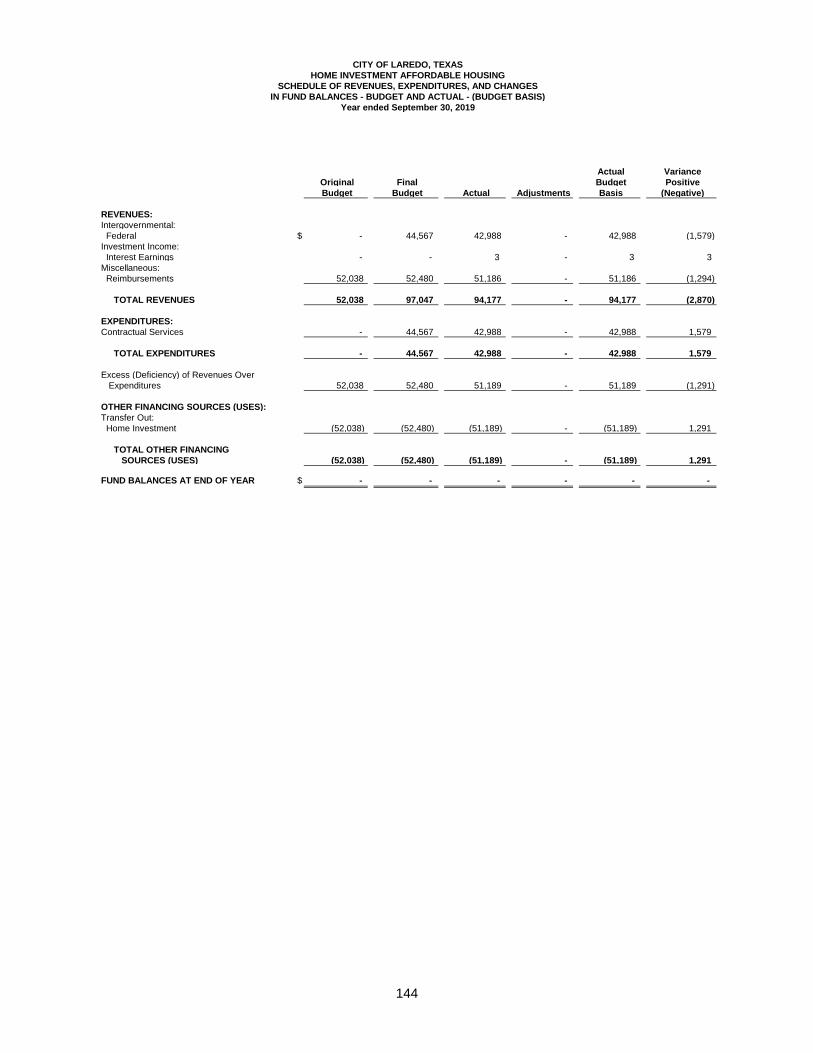
Actual Variance
Original Final Budget Positive
Budget Budget Actual Adjustments Basis (Negative)
REVENUES:
Intergovernmental: Federal $ - 44,567 42,988 - 42,988 (1,579) Investment Income: Interest Earnings - - 3 - 3 3 Miscellaneous: Reimbursements 52,038 52,480 51,186 - 51,186 (1,294) TOTAL REVENUES 52,038 97,047 94,177 - 94,177 (2,870)
EXPENDITURES:
Contractual Services - 44,567 42,988 - 42,988 1,579 TOTAL EXPENDITURES - 44,567 42,988 - 42,988 1,579
Excess (Deficiency) of Revenues Over Expenditures 52,038 52,480 51,189 - 51,189 (1,291)
OTHER FINANCING SOURCES (USES):
Transfer Out: Home Investment (52,038) (52,480) (51,189) - (51,189) 1,291
TOTAL OTHER FINANCING
SOURCES (USES) (52,038) (52,480) (51,189) - (51,189) 1,291
FUND BALANCES AT END OF YEAR $ - - - - - -
CITY OF LAREDO, TEXAS
SCHEDULE OF REVENUES, EXPENDITURES, AND CHANGES
HOME INVESTMENT AFFORDABLE HOUSING
Year ended September 30, 2019
IN FUND BALANCES - BUDGET AND ACTUAL - (BUDGET BASIS)
144
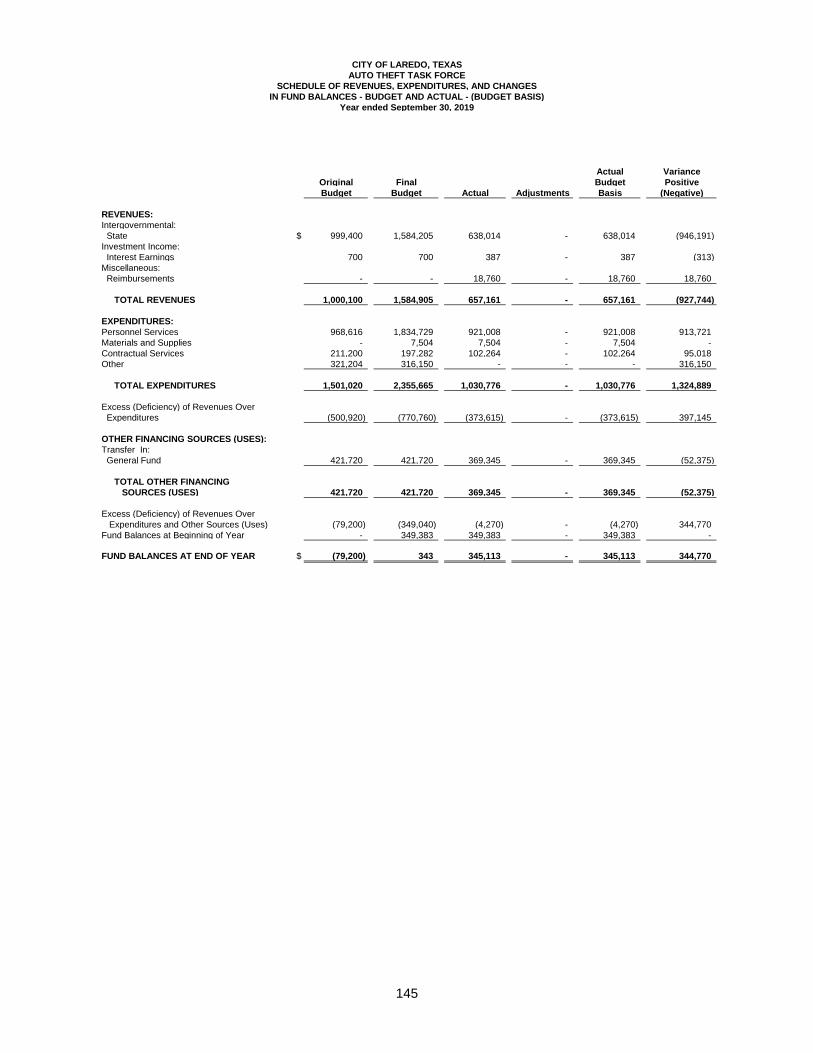
CITY OF LAREDO, TEXAS
AUTO THEFT TASK FORCE
SCHEDULE OF REVENUES, EXPENDITURES, AND CHANGES
IN FUND BALANCES - BUDGET AND ACTUAL - (BUDGET BASIS)
Year ended September 30, 2019
Actual Variance
Original Final Budget Positive
Budget Budget Actual Adjustments Basis (Negative)
REVENUES:
Intergovernmental: State $ 999,400 1,584,205 638,014 - 638,014 (946,191) Investment Income: Interest Earnings 700 700 387 - 387 (313) Miscellaneous: Reimbursements - - 18,760 - 18,760 18,760
TOTAL REVENUES 1,000,100 1,584,905 657,161 - 657,161 (927,744)
EXPENDITURES:
Personnel Services 968,616 1,834,729 921,008 - 921,008 913,721 Materials and Supplies - 7,504 7,504 - 7,504 - Contractual Services 211,200 197,282 102,264 - 102,264 95,018 Other 321,204 316,150 - - - 316,150
TOTAL EXPENDITURES 1,501,020 2,355,665 1,030,776 - 1,030,776 1,324,889
Excess (Deficiency) of Revenues Over Expenditures (500,920) (770,760) (373,615) - (373,615) 397,145
OTHER FINANCING SOURCES (USES):
Transfer In: General Fund 421,720 421,720 369,345 - 369,345 (52,375)
TOTAL OTHER FINANCING
SOURCES (USES) 421,720 421,720 369,345 - 369,345 (52,375)
Excess (Deficiency) of Revenues Over Expenditures and Other Sources (Uses) (79,200) (349,040) (4,270) - (4,270) 344,770 Fund Balances at Beginning of Year - 349,383 349,383 - 349,383 -
FUND BALANCES AT END OF YEAR $ (79,200) 343 345,113 - 345,113 344,770
145
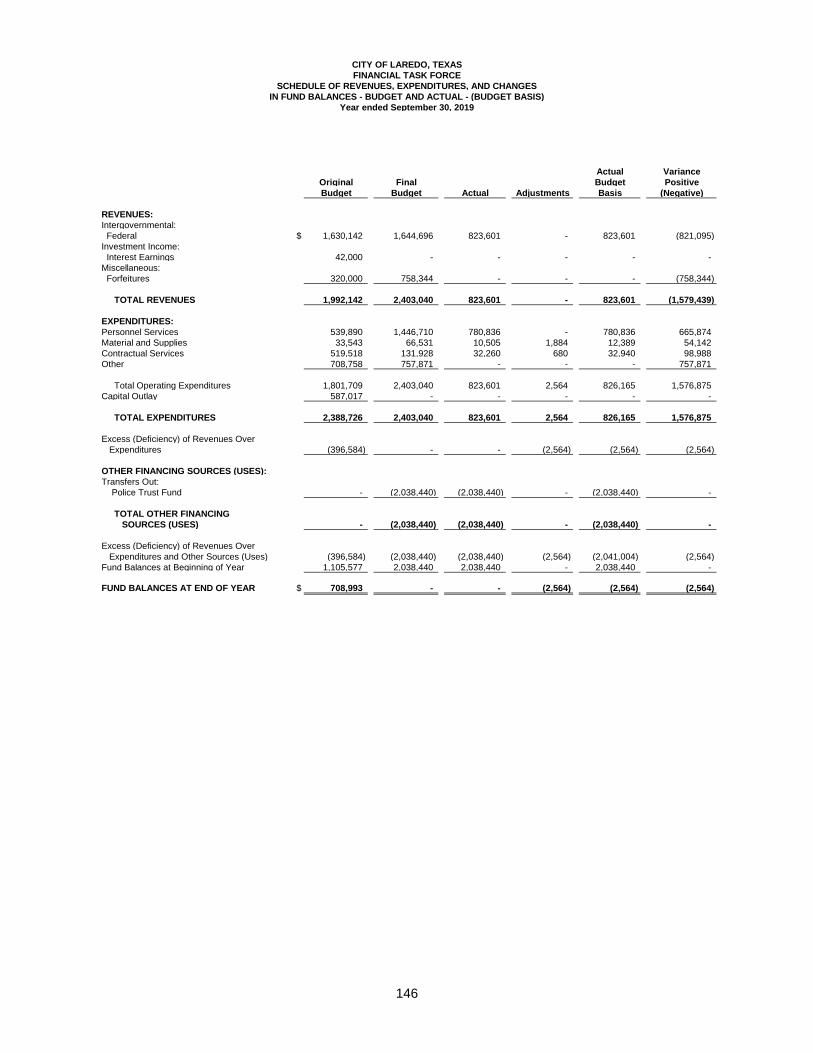
CITY OF LAREDO, TEXAS
FINANCIAL TASK FORCE
SCHEDULE OF REVENUES, EXPENDITURES, AND CHANGES
IN FUND BALANCES - BUDGET AND ACTUAL - (BUDGET BASIS)
Year ended September 30, 2019
Actual Variance
Original Final Budget Positive
Budget Budget Actual Adjustments Basis (Negative)
REVENUES:
Intergovernmental: Federal $ 1,630,142 1,644,696 823,601 - 823,601 (821,095) Investment Income: Interest Earnings 42,000 - - - - - Miscellaneous: Forfeitures 320,000 758,344 - - - (758,344)
TOTAL REVENUES 1,992,142 2,403,040 823,601 - 823,601 (1,579,439)
EXPENDITURES:
Personnel Services 539,890 1,446,710 780,836 - 780,836 665,874 Material and Supplies 33,543 66,531 10,505 1,884 12,389 54,142 Contractual Services 519,518 131,928 32,260 680 32,940 98,988 Other 708,758 757,871 - - - 757,871
Total Operating Expenditures 1,801,709 2,403,040 823,601 2,564 826,165 1,576,875 Capital Outlay 587,017 - - - - -
TOTAL EXPENDITURES 2,388,726 2,403,040 823,601 2,564 826,165 1,576,875
Excess (Deficiency) of Revenues Over Expenditures (396,584) - - (2,564) (2,564) (2,564)
OTHER FINANCING SOURCES (USES):
Transfers Out: Police Trust Fund - (2,038,440) (2,038,440) - (2,038,440) -
TOTAL OTHER FINANCING
SOURCES (USES) - (2,038,440) (2,038,440) - (2,038,440) -
Excess (Deficiency) of Revenues Over Expenditures and Other Sources (Uses) (396,584) (2,038,440) (2,038,440) (2,564) (2,041,004) (2,564) Fund Balances at Beginning of Year 1,105,577 2,038,440 2,038,440 - 2,038,440 -
FUND BALANCES AT END OF YEAR $ 708,993 - - (2,564) (2,564) (2,564)
146
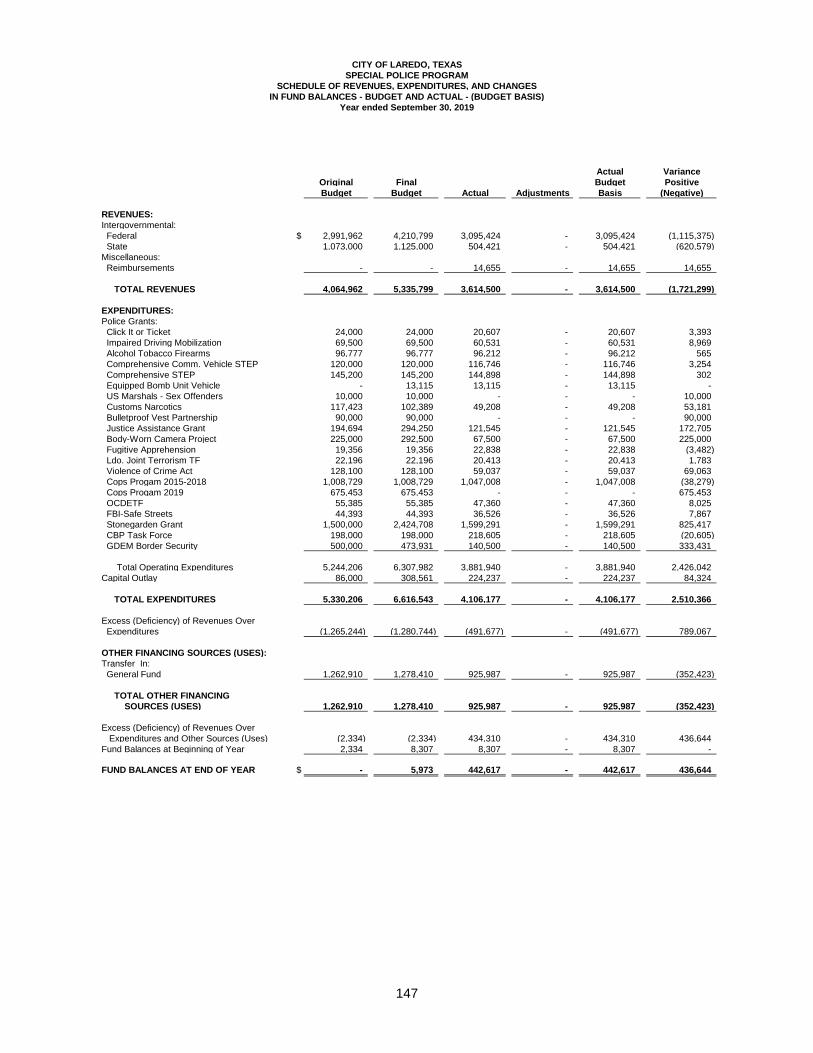
CITY OF LAREDO, TEXAS
SPECIAL POLICE PROGRAM
SCHEDULE OF REVENUES, EXPENDITURES, AND CHANGES
IN FUND BALANCES - BUDGET AND ACTUAL - (BUDGET BASIS)
Year ended September 30, 2019
Actual Variance
Original Final Budget Positive
Budget Budget Actual Adjustments Basis (Negative)
REVENUES:
Intergovernmental: Federal $ 2,991,962 4,210,799 3,095,424 - 3,095,424 (1,115,375) State 1,073,000 1,125,000 504,421 - 504,421 (620,579) Miscellaneous: Reimbursements - - 14,655 - 14,655 14,655
TOTAL REVENUES 4,064,962 5,335,799 3,614,500 - 3,614,500 (1,721,299)
EXPENDITURES:
Police Grants: Click It or Ticket 24,000 24,000 20,607 - 20,607 3,393 Impaired Driving Mobilization 69,500 69,500 60,531 - 60,531 8,969 Alcohol Tobacco Firearms 96,777 96,777 96,212 - 96,212 565 Comprehensive Comm. Vehicle STEP 120,000 120,000 116,746 - 116,746 3,254 Comprehensive STEP 145,200 145,200 144,898 - 144,898 302 Equipped Bomb Unit Vehicle - 13,115 13,115 - 13,115 - US Marshals - Sex Offenders 10,000 10,000 - - - 10,000 Customs Narcotics 117,423 102,389 49,208 - 49,208 53,181 Bulletproof Vest Partnership 90,000 90,000 - - - 90,000 Justice Assistance Grant 194,694 294,250 121,545 - 121,545 172,705 Body-Worn Camera Project 225,000 292,500 67,500 - 67,500 225,000 Fugitive Apprehension 19,356 19,356 22,838 - 22,838 (3,482) Ldo. Joint Terrorism TF 22,196 22,196 20,413 - 20,413 1,783 Violence of Crime Act 128,100 128,100 59,037 - 59,037 69,063 Cops Progam 2015-2018 1,008,729 1,008,729 1,047,008 - 1,047,008 (38,279) Cops Progam 2019 675,453 675,453 - - - 675,453 OCDETF 55,385 55,385 47,360 - 47,360 8,025 FBI-Safe Streets 44,393 44,393 36,526 - 36,526 7,867 Stonegarden Grant 1,500,000 2,424,708 1,599,291 - 1,599,291 825,417 CBP Task Force 198,000 198,000 218,605 - 218,605 (20,605) GDEM Border Security 500,000 473,931 140,500 - 140,500 333,431
Total Operating Expenditures 5,244,206 6,307,982 3,881,940 - 3,881,940 2,426,042 Capital Outlay 86,000 308,561 224,237 - 224,237 84,324
TOTAL EXPENDITURES 5,330,206 6,616,543 4,106,177 - 4,106,177 2,510,366
Excess (Deficiency) of Revenues Over Expenditures (1,265,244) (1,280,744) (491,677) - (491,677) 789,067
OTHER FINANCING SOURCES (USES):
Transfer In: General Fund 1,262,910 1,278,410 925,987 - 925,987 (352,423)
TOTAL OTHER FINANCING
SOURCES (USES) 1,262,910 1,278,410 925,987 - 925,987 (352,423)
Excess (Deficiency) of Revenues Over Expenditures and Other Sources (Uses) (2,334) (2,334) 434,310 - 434,310 436,644 Fund Balances at Beginning of Year 2,334 8,307 8,307 - 8,307 -
FUND BALANCES AT END OF YEAR $ - 5,973 442,617 - 442,617 436,644
147
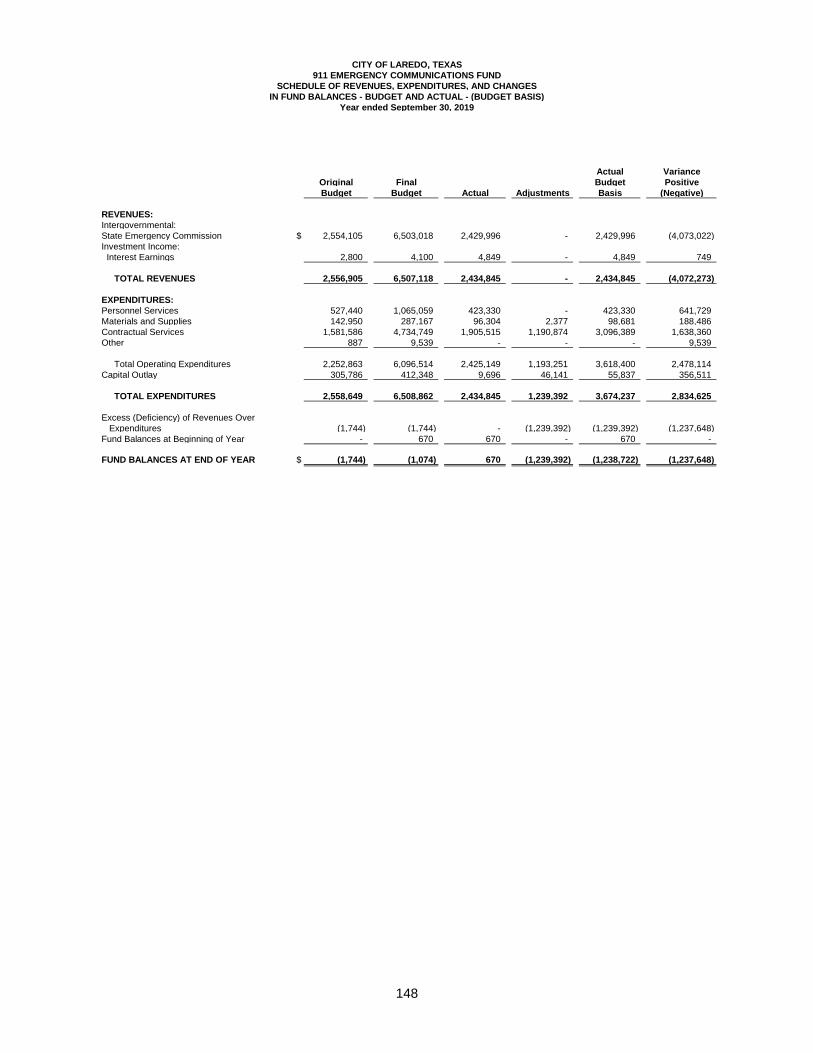
CITY OF LAREDO, TEXAS
911 EMERGENCY COMMUNICATIONS FUND
SCHEDULE OF REVENUES, EXPENDITURES, AND CHANGES
IN FUND BALANCES - BUDGET AND ACTUAL - (BUDGET BASIS)
Year ended September 30, 2019
Actual Variance
Original Final Budget Positive
Budget Budget Actual Adjustments Basis (Negative)
REVENUES:
Intergovernmental:State Emergency Commission $ 2,554,105 6,503,018 2,429,996 - 2,429,996 (4,073,022) Investment Income: Interest Earnings 2,800 4,100 4,849 - 4,849 749
TOTAL REVENUES 2,556,905 6,507,118 2,434,845 - 2,434,845 (4,072,273)
EXPENDITURES:
Personnel Services 527,440 1,065,059 423,330 - 423,330 641,729 Materials and Supplies 142,950 287,167 96,304 2,377 98,681 188,486 Contractual Services 1,581,586 4,734,749 1,905,515 1,190,874 3,096,389 1,638,360 Other 887 9,539 - - - 9,539
Total Operating Expenditures 2,252,863 6,096,514 2,425,149 1,193,251 3,618,400 2,478,114 Capital Outlay 305,786 412,348 9,696 46,141 55,837 356,511 TOTAL EXPENDITURES 2,558,649 6,508,862 2,434,845 1,239,392 3,674,237 2,834,625
Excess (Deficiency) of Revenues Over Expenditures (1,744) (1,744) - (1,239,392) (1,239,392) (1,237,648) Fund Balances at Beginning of Year - 670 670 - 670 - FUND BALANCES AT END OF YEAR $ (1,744) (1,074) 670 (1,239,392) (1,238,722) (1,237,648)
148
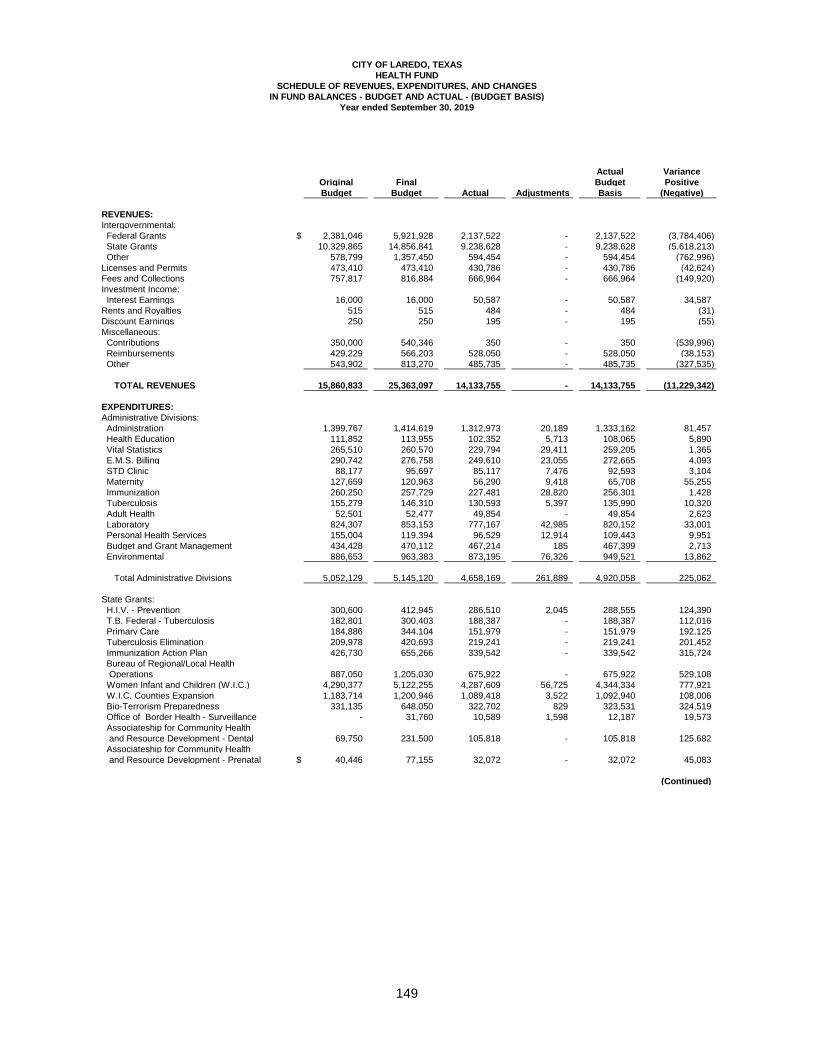
CITY OF LAREDO, TEXAS
HEALTH FUND
SCHEDULE OF REVENUES, EXPENDITURES, AND CHANGES
IN FUND BALANCES - BUDGET AND ACTUAL - (BUDGET BASIS)
Year ended September 30, 2019
Actual Variance
Original Final Budget Positive
Budget Budget Actual Adjustments Basis (Negative)
REVENUES:
Intergovernmental: Federal Grants $ 2,381,046 5,921,928 2,137,522 - 2,137,522 (3,784,406) State Grants 10,329,865 14,856,841 9,238,628 - 9,238,628 (5,618,213) Other 578,799 1,357,450 594,454 - 594,454 (762,996) Licenses and Permits 473,410 473,410 430,786 - 430,786 (42,624) Fees and Collections 757,817 816,884 666,964 - 666,964 (149,920) Investment Income: Interest Earnings 16,000 16,000 50,587 - 50,587 34,587 Rents and Royalties 515 515 484 - 484 (31) Discount Earnings 250 250 195 - 195 (55) Miscellaneous: Contributions 350,000 540,346 350 - 350 (539,996) Reimbursements 429,229 566,203 528,050 - 528,050 (38,153) Other 543,902 813,270 485,735 - 485,735 (327,535)
TOTAL REVENUES 15,860,833 25,363,097 14,133,755 - 14,133,755 (11,229,342)
EXPENDITURES:
Administrative Divisions: Administration 1,399,767 1,414,619 1,312,973 20,189 1,333,162 81,457 Health Education 111,852 113,955 102,352 5,713 108,065 5,890 Vital Statistics 265,510 260,570 229,794 29,411 259,205 1,365 E.M.S. Billing 290,742 276,758 249,610 23,055 272,665 4,093 STD Clinic 88,177 95,697 85,117 7,476 92,593 3,104 Maternity 127,659 120,963 56,290 9,418 65,708 55,255 Immunization 260,250 257,729 227,481 28,820 256,301 1,428 Tuberculosis 155,279 146,310 130,593 5,397 135,990 10,320 Adult Health 52,501 52,477 49,854 - 49,854 2,623 Laboratory 824,307 853,153 777,167 42,985 820,152 33,001 Personal Health Services 155,004 119,394 96,529 12,914 109,443 9,951 Budget and Grant Management 434,428 470,112 467,214 185 467,399 2,713 Environmental 886,653 963,383 873,195 76,326 949,521 13,862
Total Administrative Divisions 5,052,129 5,145,120 4,658,169 261,889 4,920,058 225,062
State Grants: H.I.V. - Prevention 300,600 412,945 286,510 2,045 288,555 124,390 T.B. Federal - Tuberculosis 182,801 300,403 188,387 - 188,387 112,016 Primary Care 184,886 344,104 151,979 - 151,979 192,125 Tuberculosis Elimination 209,978 420,693 219,241 - 219,241 201,452 Immunization Action Plan 426,730 655,266 339,542 - 339,542 315,724 Bureau of Regional/Local Health Operations 887,050 1,205,030 675,922 - 675,922 529,108 Women Infant and Children (W.I.C.) 4,290,377 5,122,255 4,287,609 56,725 4,344,334 777,921 W.I.C. Counties Expansion 1,183,714 1,200,946 1,089,418 3,522 1,092,940 108,006 Bio-Terrorism Preparedness 331,135 648,050 322,702 829 323,531 324,519 Office of Border Health - Surveillance - 31,760 10,589 1,598 12,187 19,573 Associateship for Community Health and Resource Development - Dental 69,750 231,500 105,818 - 105,818 125,682 Associateship for Community Health and Resource Development - Prenatal $ 40,446 77,155 32,072 - 32,072 45,083
(Continued)
149
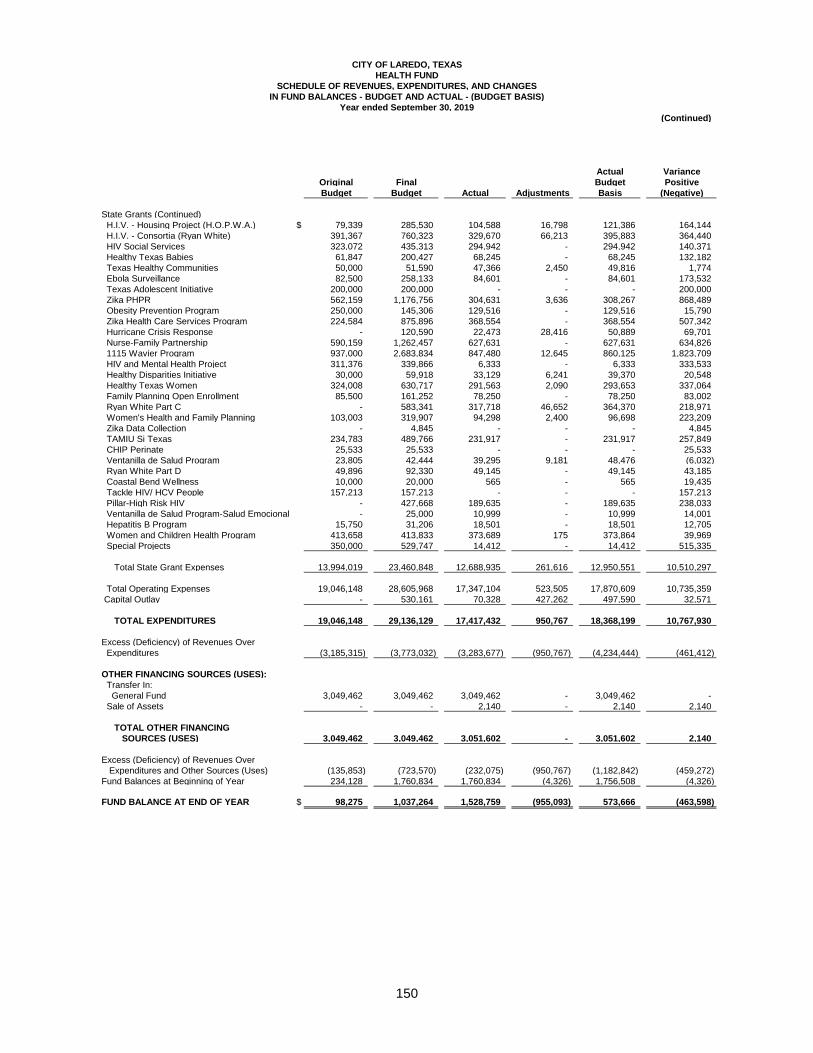
HEALTH FUND
SCHEDULE OF REVENUES, EXPENDITURES, AND CHANGES
IN FUND BALANCES - BUDGET AND ACTUAL - (BUDGET BASIS)
Year ended September 30, 2019
(Continued)
Actual Variance
Original Final Budget Positive
Budget Budget Actual Adjustments Basis (Negative)
State Grants (Continued) H.I.V. - Housing Project (H.O.P.W.A.) $ 79,339 285,530 104,588 16,798 121,386 164,144 H.I.V. - Consortia (Ryan White) 391,367 760,323 329,670 66,213 395,883 364,440 HIV Social Services 323,072 435,313 294,942 - 294,942 140,371 Healthy Texas Babies 61,847 200,427 68,245 - 68,245 132,182 Texas Healthy Communities 50,000 51,590 47,366 2,450 49,816 1,774 Ebola Surveillance 82,500 258,133 84,601 - 84,601 173,532 Texas Adolescent Initiative 200,000 200,000 - - - 200,000 Zika PHPR 562,159 1,176,756 304,631 3,636 308,267 868,489 Obesity Prevention Program 250,000 145,306 129,516 - 129,516 15,790 Zika Health Care Services Program 224,584 875,896 368,554 - 368,554 507,342 Hurricane Crisis Response - 120,590 22,473 28,416 50,889 69,701 Nurse-Family Partnership 590,159 1,262,457 627,631 - 627,631 634,826 1115 Wavier Program 937,000 2,683,834 847,480 12,645 860,125 1,823,709 HIV and Mental Health Project 311,376 339,866 6,333 - 6,333 333,533 Healthy Disparities Initiative 30,000 59,918 33,129 6,241 39,370 20,548 Healthy Texas Women 324,008 630,717 291,563 2,090 293,653 337,064 Family Planning Open Enrollment 85,500 161,252 78,250 - 78,250 83,002 Ryan White Part C - 583,341 317,718 46,652 364,370 218,971 Women's Health and Family Planning 103,003 319,907 94,298 2,400 96,698 223,209 Zika Data Collection - 4,845 - - - 4,845 TAMIU Si Texas 234,783 489,766 231,917 - 231,917 257,849 CHIP Perinate 25,533 25,533 - - - 25,533 Ventanilla de Salud Program 23,805 42,444 39,295 9,181 48,476 (6,032) Ryan White Part D 49,896 92,330 49,145 - 49,145 43,185 Coastal Bend Wellness 10,000 20,000 565 - 565 19,435 Tackle HIV/ HCV People 157,213 157,213 - - - 157,213 Pillar-High Risk HIV - 427,668 189,635 - 189,635 238,033 Ventanilla de Salud Program-Salud Emocional - 25,000 10,999 - 10,999 14,001 Hepatitis B Program 15,750 31,206 18,501 - 18,501 12,705 Women and Children Health Program 413,658 413,833 373,689 175 373,864 39,969 Special Projects 350,000 529,747 14,412 - 14,412 515,335
Total State Grant Expenses 13,994,019 23,460,848 12,688,935 261,616 12,950,551 10,510,297
Total Operating Expenses 19,046,148 28,605,968 17,347,104 523,505 17,870,609 10,735,359 Capital Outlay - 530,161 70,328 427,262 497,590 32,571
TOTAL EXPENDITURES 19,046,148 29,136,129 17,417,432 950,767 18,368,199 10,767,930
Excess (Deficiency) of Revenues Over Expenditures (3,185,315) (3,773,032) (3,283,677) (950,767) (4,234,444) (461,412)
OTHER FINANCING SOURCES (USES):
Transfer In: General Fund 3,049,462 3,049,462 3,049,462 - 3,049,462 - Sale of Assets - - 2,140 - 2,140 2,140
TOTAL OTHER FINANCING
SOURCES (USES) 3,049,462 3,049,462 3,051,602 - 3,051,602 2,140
Excess (Deficiency) of Revenues Over Expenditures and Other Sources (Uses) (135,853) (723,570) (232,075) (950,767) (1,182,842) (459,272) Fund Balances at Beginning of Year 234,128 1,760,834 1,760,834 (4,326) 1,756,508 (4,326)
FUND BALANCE AT END OF YEAR $ 98,275 1,037,264 1,528,759 (955,093) 573,666 (463,598)
CITY OF LAREDO, TEXAS
150
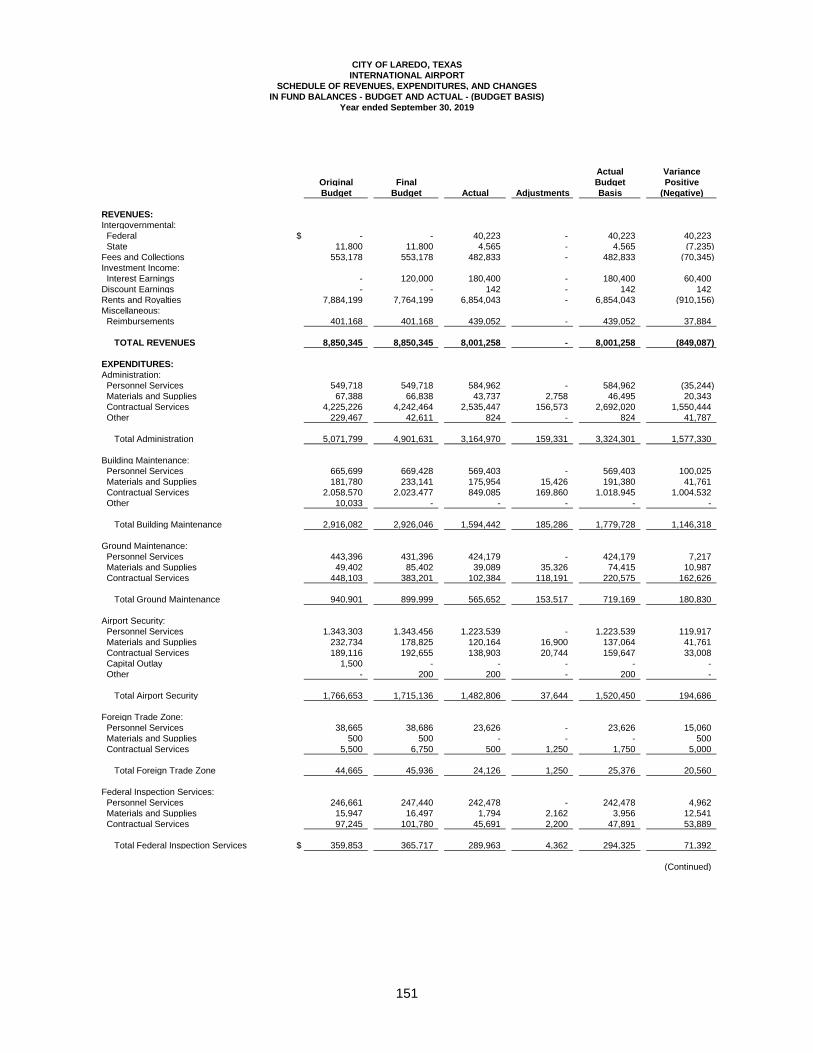
CITY OF LAREDO, TEXAS
INTERNATIONAL AIRPORT
SCHEDULE OF REVENUES, EXPENDITURES, AND CHANGES
IN FUND BALANCES - BUDGET AND ACTUAL - (BUDGET BASIS)
Year ended September 30, 2019
Actual Variance
Original Final Budget Positive
Budget Budget Actual Adjustments Basis (Negative)
REVENUES:
Intergovernmental: Federal $ - - 40,223 - 40,223 40,223 State 11,800 11,800 4,565 - 4,565 (7,235) Fees and Collections 553,178 553,178 482,833 - 482,833 (70,345) Investment Income: Interest Earnings - 120,000 180,400 - 180,400 60,400 Discount Earnings - - 142 - 142 142 Rents and Royalties 7,884,199 7,764,199 6,854,043 - 6,854,043 (910,156) Miscellaneous: Reimbursements 401,168 401,168 439,052 - 439,052 37,884
TOTAL REVENUES 8,850,345 8,850,345 8,001,258 - 8,001,258 (849,087)
EXPENDITURES:
Administration: Personnel Services 549,718 549,718 584,962 - 584,962 (35,244) Materials and Supplies 67,388 66,838 43,737 2,758 46,495 20,343 Contractual Services 4,225,226 4,242,464 2,535,447 156,573 2,692,020 1,550,444 Other 229,467 42,611 824 - 824 41,787
Total Administration 5,071,799 4,901,631 3,164,970 159,331 3,324,301 1,577,330
Building Maintenance: Personnel Services 665,699 669,428 569,403 - 569,403 100,025 Materials and Supplies 181,780 233,141 175,954 15,426 191,380 41,761 Contractual Services 2,058,570 2,023,477 849,085 169,860 1,018,945 1,004,532 Other 10,033 - - - - -
Total Building Maintenance 2,916,082 2,926,046 1,594,442 185,286 1,779,728 1,146,318
Ground Maintenance: Personnel Services 443,396 431,396 424,179 - 424,179 7,217 Materials and Supplies 49,402 85,402 39,089 35,326 74,415 10,987 Contractual Services 448,103 383,201 102,384 118,191 220,575 162,626
Total Ground Maintenance 940,901 899,999 565,652 153,517 719,169 180,830
Airport Security: Personnel Services 1,343,303 1,343,456 1,223,539 - 1,223,539 119,917 Materials and Supplies 232,734 178,825 120,164 16,900 137,064 41,761 Contractual Services 189,116 192,655 138,903 20,744 159,647 33,008 Capital Outlay 1,500 - - - - - Other - 200 200 - 200 -
Total Airport Security 1,766,653 1,715,136 1,482,806 37,644 1,520,450 194,686
Foreign Trade Zone: Personnel Services 38,665 38,686 23,626 - 23,626 15,060 Materials and Supplies 500 500 - - - 500 Contractual Services 5,500 6,750 500 1,250 1,750 5,000
Total Foreign Trade Zone 44,665 45,936 24,126 1,250 25,376 20,560
Federal Inspection Services: Personnel Services 246,661 247,440 242,478 - 242,478 4,962 Materials and Supplies 15,947 16,497 1,794 2,162 3,956 12,541 Contractual Services 97,245 101,780 45,691 2,200 47,891 53,889
Total Federal Inspection Services $ 359,853 365,717 289,963 4,362 294,325 71,392
(Continued)
151
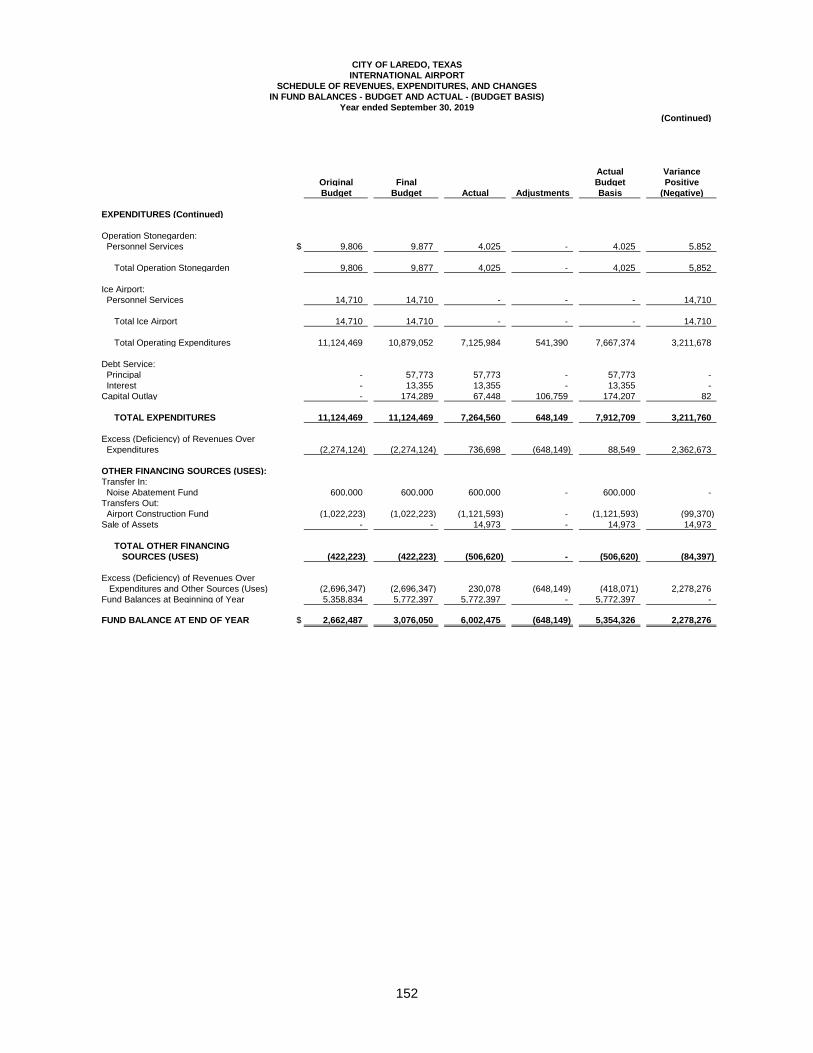
CITY OF LAREDO, TEXAS
INTERNATIONAL AIRPORT
SCHEDULE OF REVENUES, EXPENDITURES, AND CHANGES
IN FUND BALANCES - BUDGET AND ACTUAL - (BUDGET BASIS)
Year ended September 30, 2019
(Continued)
Actual Variance
Original Final Budget Positive
Budget Budget Actual Adjustments Basis (Negative)
EXPENDITURES (Continued)
Operation Stonegarden: Personnel Services $ 9,806 9,877 4,025 - 4,025 5,852
Total Operation Stonegarden 9,806 9,877 4,025 - 4,025 5,852
Ice Airport: Personnel Services 14,710 14,710 - - - 14,710
Total Ice Airport 14,710 14,710 - - - 14,710
Total Operating Expenditures 11,124,469 10,879,052 7,125,984 541,390 7,667,374 3,211,678
Debt Service: Principal - 57,773 57,773 - 57,773 - Interest - 13,355 13,355 - 13,355 - Capital Outlay - 174,289 67,448 106,759 174,207 82
TOTAL EXPENDITURES 11,124,469 11,124,469 7,264,560 648,149 7,912,709 3,211,760
Excess (Deficiency) of Revenues Over Expenditures (2,274,124) (2,274,124) 736,698 (648,149) 88,549 2,362,673
OTHER FINANCING SOURCES (USES):
Transfer In: Noise Abatement Fund 600,000 600,000 600,000 - 600,000 - Transfers Out: Airport Construction Fund (1,022,223) (1,022,223) (1,121,593) - (1,121,593) (99,370) Sale of Assets - - 14,973 - 14,973 14,973
TOTAL OTHER FINANCING
SOURCES (USES) (422,223) (422,223) (506,620) - (506,620) (84,397)
Excess (Deficiency) of Revenues Over Expenditures and Other Sources (Uses) (2,696,347) (2,696,347) 230,078 (648,149) (418,071) 2,278,276 Fund Balances at Beginning of Year 5,358,834 5,772,397 5,772,397 - 5,772,397 -
FUND BALANCE AT END OF YEAR $ 2,662,487 3,076,050 6,002,475 (648,149) 5,354,326 2,278,276
152
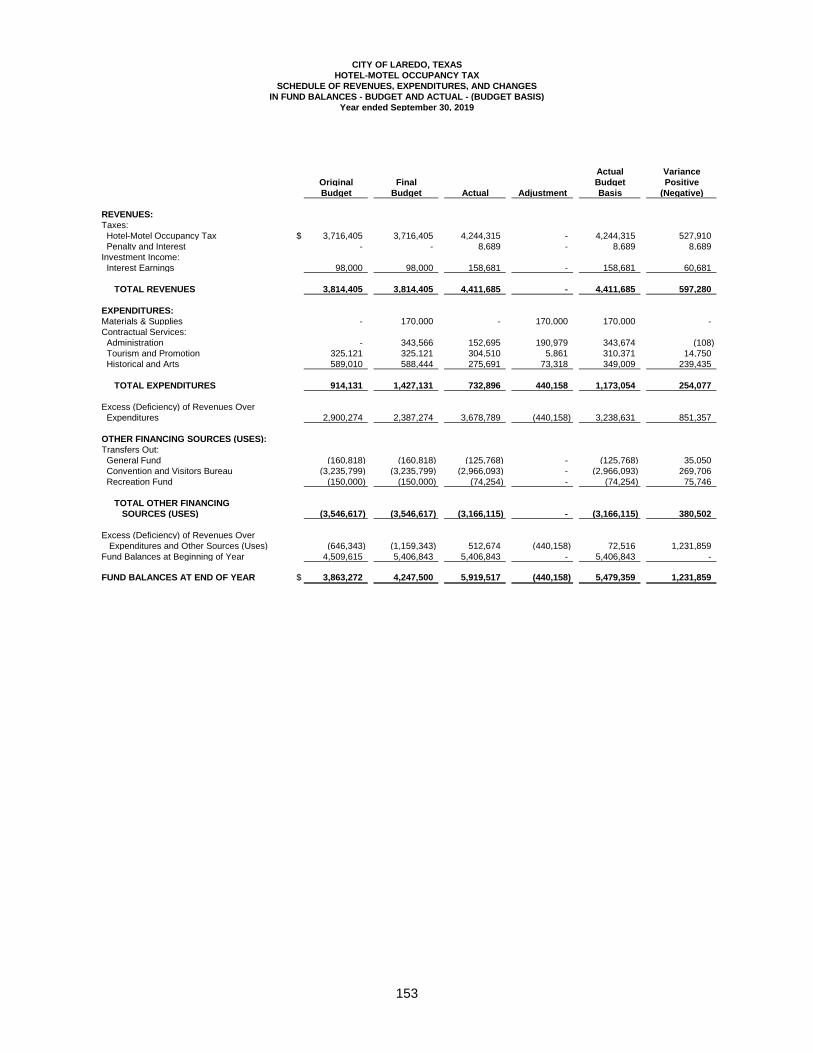
CITY OF LAREDO, TEXAS
HOTEL-MOTEL OCCUPANCY TAX
SCHEDULE OF REVENUES, EXPENDITURES, AND CHANGES
IN FUND BALANCES - BUDGET AND ACTUAL - (BUDGET BASIS)
Year ended September 30, 2019
Actual Variance
Original Final Budget Positive
Budget Budget Actual Adjustment Basis (Negative)
REVENUES:
Taxes: Hotel-Motel Occupancy Tax $ 3,716,405 3,716,405 4,244,315 - 4,244,315 527,910 Penalty and Interest - - 8,689 - 8,689 8,689 Investment Income: Interest Earnings 98,000 98,000 158,681 - 158,681 60,681
TOTAL REVENUES 3,814,405 3,814,405 4,411,685 - 4,411,685 597,280
EXPENDITURES:
Materials & Supplies - 170,000 - 170,000 170,000 - Contractual Services: Administration - 343,566 152,695 190,979 343,674 (108) Tourism and Promotion 325,121 325,121 304,510 5,861 310,371 14,750 Historical and Arts 589,010 588,444 275,691 73,318 349,009 239,435
TOTAL EXPENDITURES 914,131 1,427,131 732,896 440,158 1,173,054 254,077
Excess (Deficiency) of Revenues Over Expenditures 2,900,274 2,387,274 3,678,789 (440,158) 3,238,631 851,357
OTHER FINANCING SOURCES (USES):
Transfers Out: General Fund (160,818) (160,818) (125,768) - (125,768) 35,050 Convention and Visitors Bureau (3,235,799) (3,235,799) (2,966,093) - (2,966,093) 269,706 Recreation Fund (150,000) (150,000) (74,254) - (74,254) 75,746
TOTAL OTHER FINANCING
SOURCES (USES) (3,546,617) (3,546,617) (3,166,115) - (3,166,115) 380,502
Excess (Deficiency) of Revenues Over Expenditures and Other Sources (Uses) (646,343) (1,159,343) 512,674 (440,158) 72,516 1,231,859 Fund Balances at Beginning of Year 4,509,615 5,406,843 5,406,843 - 5,406,843 -
FUND BALANCES AT END OF YEAR $ 3,863,272 4,247,500 5,919,517 (440,158) 5,479,359 1,231,859
153
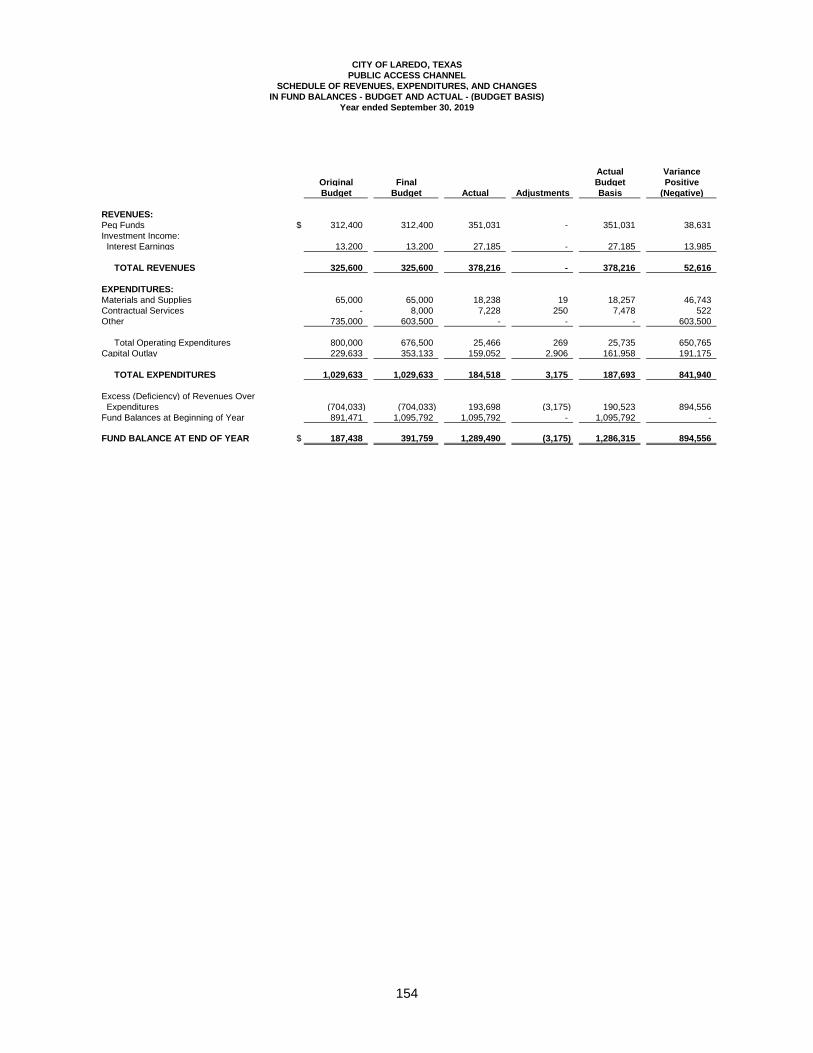
CITY OF LAREDO, TEXAS
PUBLIC ACCESS CHANNEL
SCHEDULE OF REVENUES, EXPENDITURES, AND CHANGES
IN FUND BALANCES - BUDGET AND ACTUAL - (BUDGET BASIS)
Year ended September 30, 2019
Actual Variance
Original Final Budget Positive
Budget Budget Actual Adjustments Basis (Negative)
REVENUES:
Peg Funds $ 312,400 312,400 351,031 - 351,031 38,631 Investment Income: Interest Earnings 13,200 13,200 27,185 - 27,185 13,985
TOTAL REVENUES 325,600 325,600 378,216 - 378,216 52,616
EXPENDITURES:
Materials and Supplies 65,000 65,000 18,238 19 18,257 46,743 Contractual Services - 8,000 7,228 250 7,478 522 Other 735,000 603,500 - - - 603,500
Total Operating Expenditures 800,000 676,500 25,466 269 25,735 650,765 Capital Outlay 229,633 353,133 159,052 2,906 161,958 191,175
TOTAL EXPENDITURES 1,029,633 1,029,633 184,518 3,175 187,693 841,940
Excess (Deficiency) of Revenues Over Expenditures (704,033) (704,033) 193,698 (3,175) 190,523 894,556 Fund Balances at Beginning of Year 891,471 1,095,792 1,095,792 - 1,095,792 -
FUND BALANCE AT END OF YEAR $ 187,438 391,759 1,289,490 (3,175) 1,286,315 894,556
154
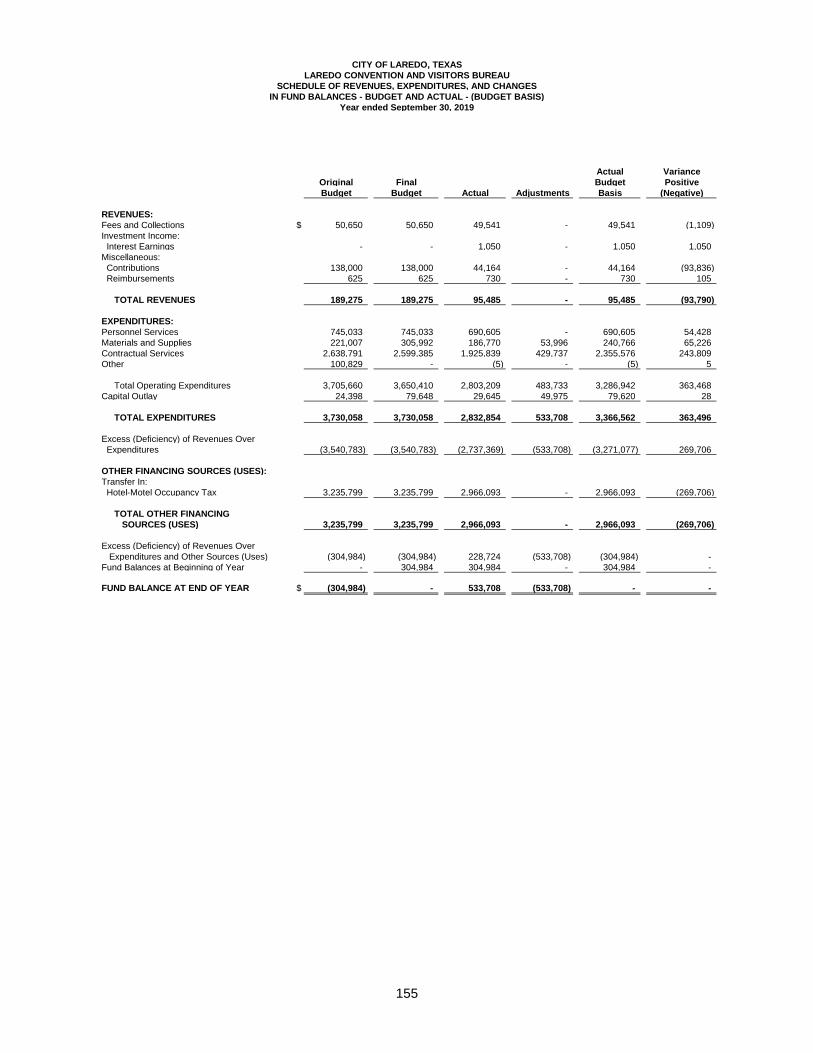
CITY OF LAREDO, TEXAS
LAREDO CONVENTION AND VISITORS BUREAU
SCHEDULE OF REVENUES, EXPENDITURES, AND CHANGES
IN FUND BALANCES - BUDGET AND ACTUAL - (BUDGET BASIS)
Year ended September 30, 2019
Actual Variance
Original Final Budget Positive
Budget Budget Actual Adjustments Basis (Negative)
REVENUES:
Fees and Collections $ 50,650 50,650 49,541 - 49,541 (1,109) Investment Income: Interest Earnings - - 1,050 - 1,050 1,050 Miscellaneous: Contributions 138,000 138,000 44,164 - 44,164 (93,836) Reimbursements 625 625 730 - 730 105
TOTAL REVENUES 189,275 189,275 95,485 - 95,485 (93,790)
EXPENDITURES:
Personnel Services 745,033 745,033 690,605 - 690,605 54,428 Materials and Supplies 221,007 305,992 186,770 53,996 240,766 65,226 Contractual Services 2,638,791 2,599,385 1,925,839 429,737 2,355,576 243,809 Other 100,829 - (5) - (5) 5
Total Operating Expenditures 3,705,660 3,650,410 2,803,209 483,733 3,286,942 363,468 Capital Outlay 24,398 79,648 29,645 49,975 79,620 28
TOTAL EXPENDITURES 3,730,058 3,730,058 2,832,854 533,708 3,366,562 363,496
Excess (Deficiency) of Revenues Over Expenditures (3,540,783) (3,540,783) (2,737,369) (533,708) (3,271,077) 269,706
OTHER FINANCING SOURCES (USES):
Transfer In: Hotel-Motel Occupancy Tax 3,235,799 3,235,799 2,966,093 - 2,966,093 (269,706)
TOTAL OTHER FINANCING
SOURCES (USES) 3,235,799 3,235,799 -2,966,093 - 2,966,093 (269,706)
Excess (Deficiency) of Revenues Over Expenditures and Other Sources (Uses) (304,984) (304,984) 228,724 (533,708) (304,984) - Fund Balances at Beginning of Year - 304,984 304,984 - 304,984 -
FUND BALANCE AT END OF YEAR $ (304,984) - 533,708 (533,708) - -
155
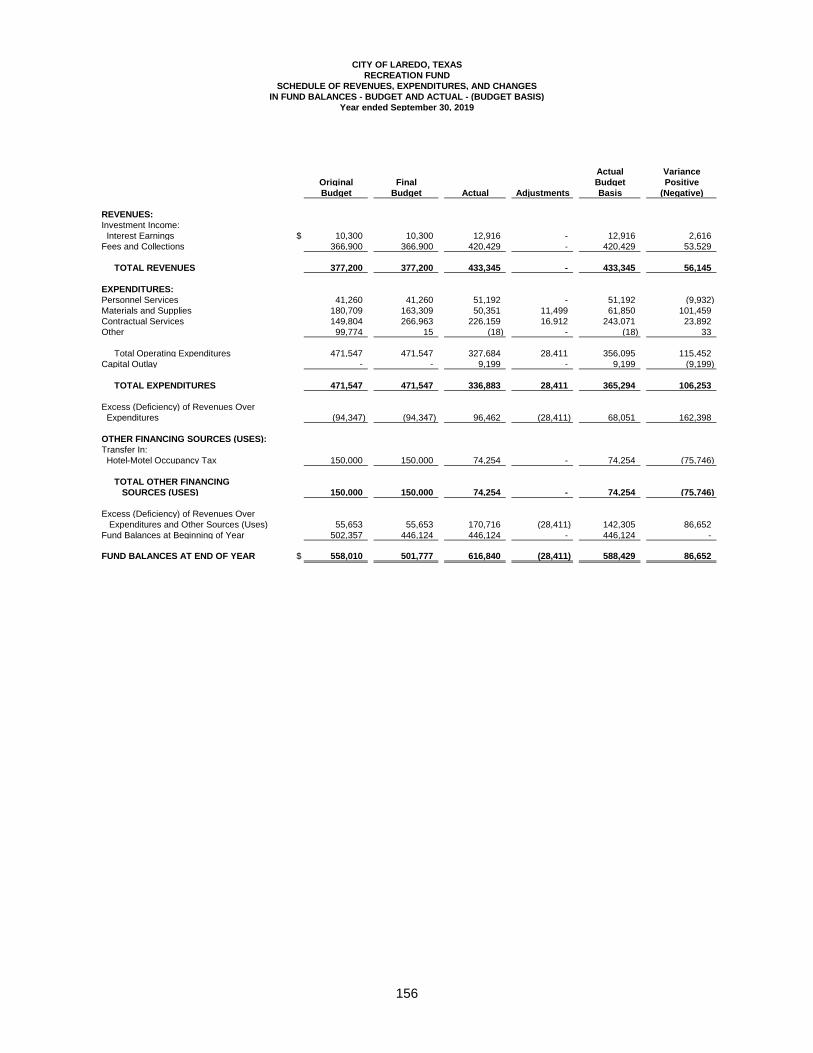
CITY OF LAREDO, TEXAS
RECREATION FUND
SCHEDULE OF REVENUES, EXPENDITURES, AND CHANGES
IN FUND BALANCES - BUDGET AND ACTUAL - (BUDGET BASIS)
Year ended September 30, 2019
Actual Variance
Original Final Budget Positive
Budget Budget Actual Adjustments Basis (Negative)
REVENUES:
Investment Income: Interest Earnings $ 10,300 10,300 12,916 - 12,916 2,616 Fees and Collections 366,900 366,900 420,429 - 420,429 53,529
TOTAL REVENUES 377,200 377,200 433,345 - 433,345 56,145
EXPENDITURES:
Personnel Services 41,260 41,260 51,192 - 51,192 (9,932) Materials and Supplies 180,709 163,309 50,351 11,499 61,850 101,459 Contractual Services 149,804 266,963 226,159 16,912 243,071 23,892 Other 99,774 15 (18) - (18) 33
Total Operating Expenditures 471,547 471,547 327,684 28,411 356,095 115,452 Capital Outlay - - 9,199 - 9,199 (9,199)
TOTAL EXPENDITURES 471,547 471,547 336,883 28,411 365,294 106,253
Excess (Deficiency) of Revenues Over Expenditures (94,347) (94,347) 96,462 (28,411) 68,051 162,398 OTHER FINANCING SOURCES (USES):
Transfer In: Hotel-Motel Occupancy Tax 150,000 150,000 74,254 - 74,254 (75,746)
TOTAL OTHER FINANCING
SOURCES (USES) 150,000 150,000 - 74,254 - - 74,254 (75,746)
Excess (Deficiency) of Revenues Over Expenditures and Other Sources (Uses) 55,653 55,653 170,716 (28,411) 142,305 86,652 Fund Balances at Beginning of Year 502,357 446,124 446,124 - 446,124 - FUND BALANCES AT END OF YEAR $ 558,010 501,777 616,840 (28,411) 588,429 86,652
156
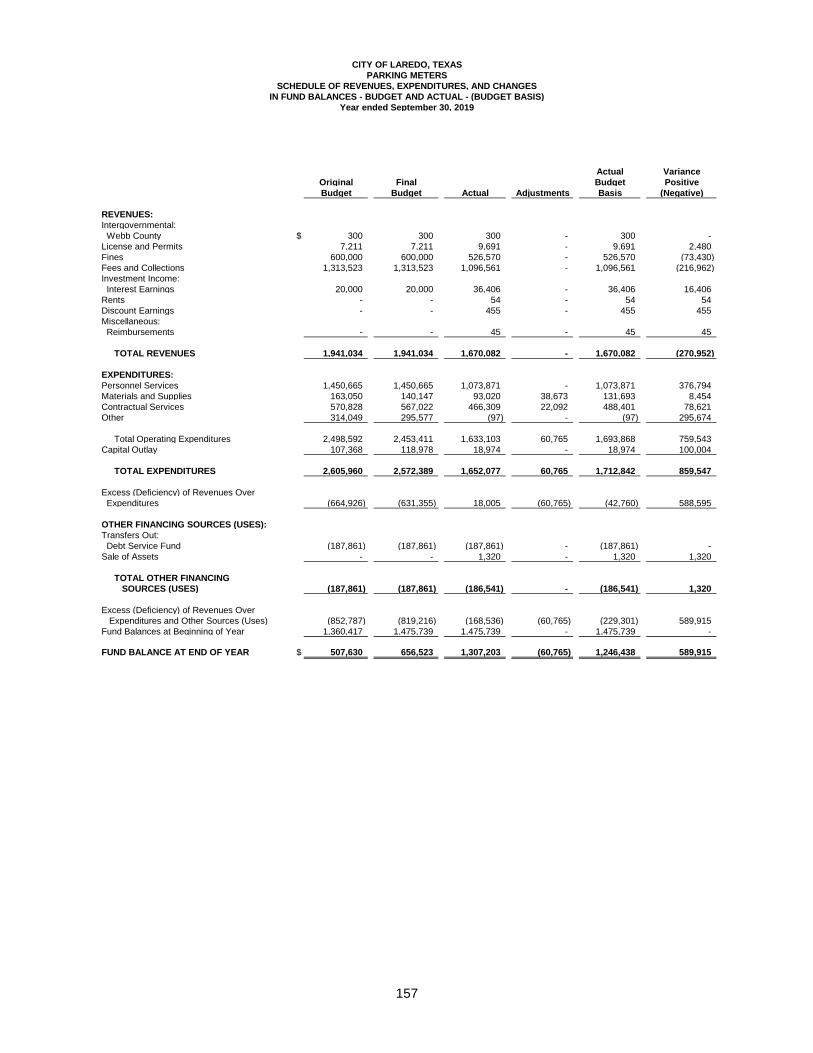
CITY OF LAREDO, TEXAS
PARKING METERS
SCHEDULE OF REVENUES, EXPENDITURES, AND CHANGES
IN FUND BALANCES - BUDGET AND ACTUAL - (BUDGET BASIS)
Year ended September 30, 2019
Actual Variance
Original Final Budget Positive
Budget Budget Actual Adjustments Basis (Negative)
REVENUES:
Intergovernmental: Webb County $ 300 300 300 - 300 - License and Permits 7,211 7,211 9,691 - 9,691 2,480 Fines 600,000 600,000 526,570 - 526,570 (73,430) Fees and Collections 1,313,523 1,313,523 1,096,561 - 1,096,561 (216,962) Investment Income: Interest Earnings 20,000 20,000 36,406 - 36,406 16,406 Rents - - 54 - 54 54 Discount Earnings - - 455 - 455 455 Miscellaneous: Reimbursements - - 45 - 45 45
TOTAL REVENUES 1,941,034 1,941,034 1,670,082 - 1,670,082 (270,952)
EXPENDITURES:
Personnel Services 1,450,665 1,450,665 1,073,871 - 1,073,871 376,794 Materials and Supplies 163,050 140,147 93,020 38,673 131,693 8,454 Contractual Services 570,828 567,022 466,309 22,092 488,401 78,621 Other 314,049 295,577 (97) - (97) 295,674 Total Operating Expenditures 2,498,592 2,453,411 1,633,103 60,765 1,693,868 759,543 Capital Outlay 107,368 118,978 18,974 - 18,974 100,004 TOTAL EXPENDITURES 2,605,960 2,572,389 1,652,077 60,765 1,712,842 859,547
Excess (Deficiency) of Revenues Over Expenditures (664,926) (631,355) 18,005 (60,765) (42,760) 588,595
OTHER FINANCING SOURCES (USES):
Transfers Out: Debt Service Fund (187,861) (187,861) (187,861) - (187,861) - Sale of Assets - - 1,320 - 1,320 1,320
TOTAL OTHER FINANCING
SOURCES (USES) (187,861) (187,861) (186,541) - (186,541) 1,320
Excess (Deficiency) of Revenues Over Expenditures and Other Sources (Uses) (852,787) (819,216) (168,536) (60,765) (229,301) 589,915 Fund Balances at Beginning of Year 1,360,417 1,475,739 1,475,739 - 1,475,739 -
FUND BALANCE AT END OF YEAR $ 507,630 656,523 1,307,203 (60,765) 1,246,438 589,915
157
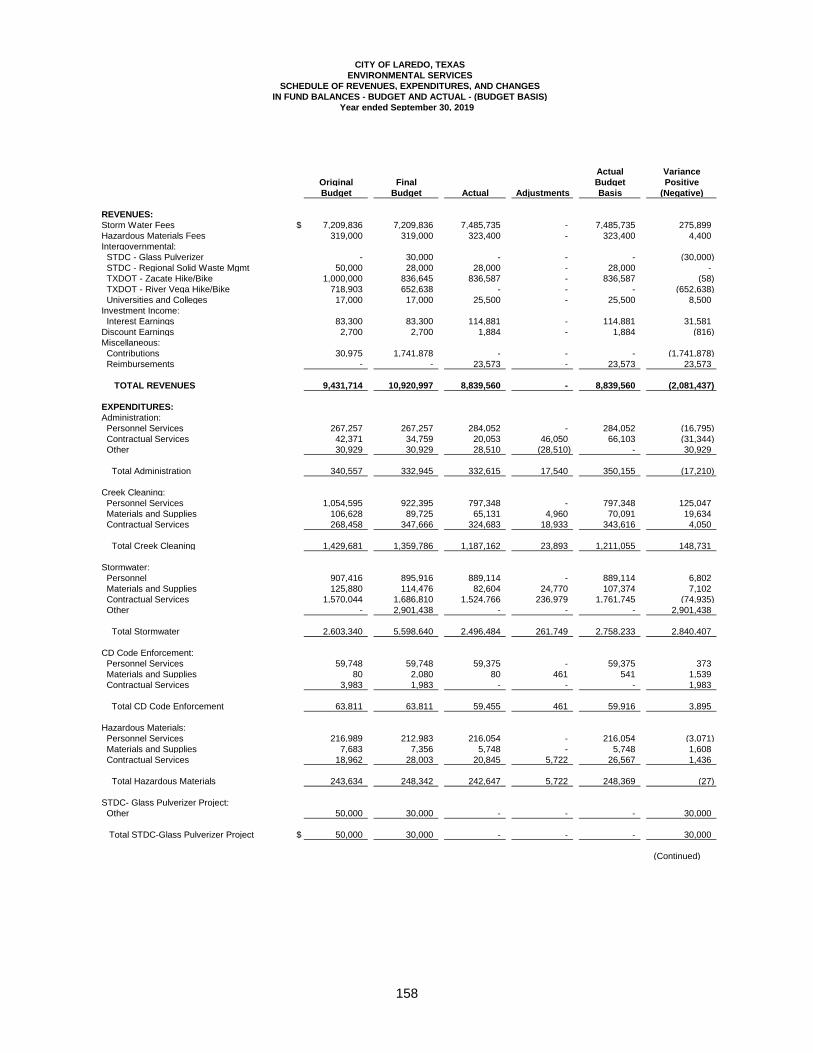
CITY OF LAREDO, TEXAS
ENVIRONMENTAL SERVICES
SCHEDULE OF REVENUES, EXPENDITURES, AND CHANGES
IN FUND BALANCES - BUDGET AND ACTUAL - (BUDGET BASIS)
Year ended September 30, 2019
Actual Variance
Original Final Budget Positive
Budget Budget Actual Adjustments Basis (Negative)
REVENUES:
Storm Water Fees $ 7,209,836 7,209,836 7,485,735 - 7,485,735 275,899 Hazardous Materials Fees 319,000 319,000 323,400 - 323,400 4,400 Intergovernmental: STDC - Glass Pulverizer - 30,000 - - - (30,000) STDC - Regional Solid Waste Mgmt 50,000 28,000 28,000 - 28,000 - TXDOT - Zacate Hike/Bike 1,000,000 836,645 836,587 - 836,587 (58) TXDOT - River Vega Hike/Bike 718,903 652,638 - - - (652,638) Universities and Colleges 17,000 17,000 25,500 - 25,500 8,500 Investment Income: Interest Earnings 83,300 83,300 114,881 - 114,881 31,581 Discount Earnings 2,700 2,700 1,884 - 1,884 (816) Miscellaneous: Contributions 30,975 1,741,878 - - - (1,741,878) Reimbursements - - 23,573 - 23,573 23,573
TOTAL REVENUES 9,431,714 10,920,997 8,839,560 - 8,839,560 (2,081,437)
EXPENDITURES:
Administration: Personnel Services 267,257 267,257 284,052 - 284,052 (16,795) Contractual Services 42,371 34,759 20,053 46,050 66,103 (31,344) Other 30,929 30,929 28,510 (28,510) - 30,929
Total Administration 340,557 332,945 332,615 17,540 350,155 (17,210)
Creek Cleaning: Personnel Services 1,054,595 922,395 797,348 - 797,348 125,047 Materials and Supplies 106,628 89,725 65,131 4,960 70,091 19,634 Contractual Services 268,458 347,666 324,683 18,933 343,616 4,050
Total Creek Cleaning 1,429,681 1,359,786 1,187,162 23,893 1,211,055 148,731
Stormwater: Personnel 907,416 895,916 889,114 - 889,114 6,802 Materials and Supplies 125,880 114,476 82,604 24,770 107,374 7,102 Contractual Services 1,570,044 1,686,810 1,524,766 236,979 1,761,745 (74,935) Other - 2,901,438 - - - 2,901,438
Total Stormwater 2,603,340 5,598,640 2,496,484 261,749 2,758,233 2,840,407
CD Code Enforcement: Personnel Services 59,748 59,748 59,375 - 59,375 373 Materials and Supplies 80 2,080 80 461 541 1,539 Contractual Services 3,983 1,983 - - - 1,983
Total CD Code Enforcement 63,811 63,811 59,455 461 59,916 3,895
Hazardous Materials: Personnel Services 216,989 212,983 216,054 - 216,054 (3,071) Materials and Supplies 7,683 7,356 5,748 - 5,748 1,608 Contractual Services 18,962 28,003 20,845 5,722 26,567 1,436
Total Hazardous Materials 243,634 248,342 242,647 5,722 248,369 (27)
STDC- Glass Pulverizer Project: Other 50,000 30,000 - - - 30,000
Total STDC-Glass Pulverizer Project $ 50,000 30,000 - - - 30,000
(Continued)
158
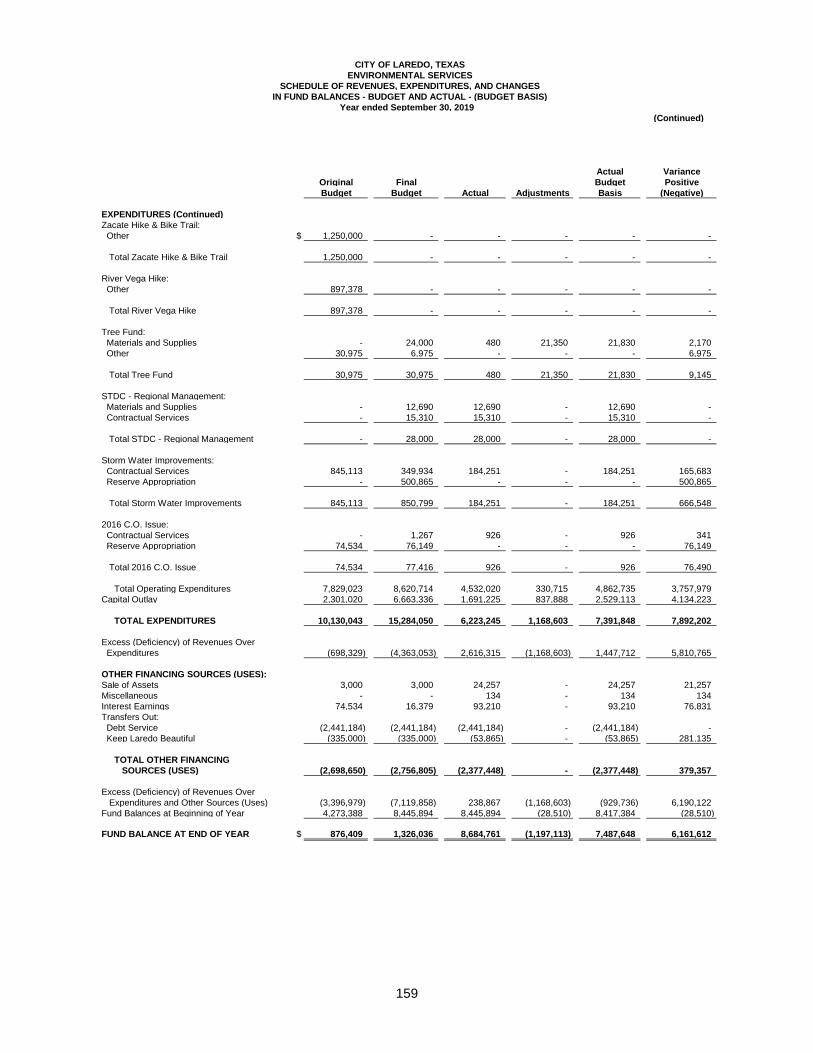
CITY OF LAREDO, TEXAS
ENVIRONMENTAL SERVICES
SCHEDULE OF REVENUES, EXPENDITURES, AND CHANGES
IN FUND BALANCES - BUDGET AND ACTUAL - (BUDGET BASIS)
Year ended September 30, 2019
(Continued)
Actual Variance
Original Final Budget Positive
Budget Budget Actual Adjustments Basis (Negative)
EXPENDITURES (Continued)
Zacate Hike & Bike Trail: Other $ 1,250,000 - - - - -
Total Zacate Hike & Bike Trail 1,250,000 - - - - -
River Vega Hike: Other 897,378 - - - - -
Total River Vega Hike 897,378 - - - - -
Tree Fund: Materials and Supplies - 24,000 480 21,350 21,830 2,170 Other 30,975 6,975 - - - 6,975
Total Tree Fund 30,975 30,975 480 21,350 21,830 9,145
STDC - Regional Management: Materials and Supplies - 12,690 12,690 - 12,690 - Contractual Services - 15,310 15,310 - 15,310 -
Total STDC - Regional Management - 28,000 28,000 - 28,000 -
Storm Water Improvements: Contractual Services 845,113 349,934 184,251 - 184,251 165,683 Reserve Appropriation - 500,865 - - - 500,865
Total Storm Water Improvements 845,113 850,799 184,251 - 184,251 666,548
2016 C.O. Issue: Contractual Services - 1,267 926 - 926 341 Reserve Appropriation 74,534 76,149 - - - 76,149
Total 2016 C.O. Issue 74,534 77,416 926 - 926 76,490
Total Operating Expenditures 7,829,023 8,620,714 4,532,020 330,715 4,862,735 3,757,979 Capital Outlay 2,301,020 6,663,336 1,691,225 837,888 2,529,113 4,134,223
TOTAL EXPENDITURES 10,130,043 15,284,050 6,223,245 1,168,603 7,391,848 7,892,202
Excess (Deficiency) of Revenues Over Expenditures (698,329) (4,363,053) 2,616,315 (1,168,603) 1,447,712 5,810,765
OTHER FINANCING SOURCES (USES):
Sale of Assets 3,000 3,000 24,257 - 24,257 21,257 Miscellaneous - - 134 - 134 134 Interest Earnings 74,534 16,379 93,210 - 93,210 76,831 Transfers Out: Debt Service (2,441,184) (2,441,184) (2,441,184) - (2,441,184) - Keep Laredo Beautiful (335,000) (335,000) (53,865) - (53,865) 281,135
TOTAL OTHER FINANCING
SOURCES (USES) (2,698,650) (2,756,805) -(2,377,448) - -(2,377,448) 379,357
Excess (Deficiency) of Revenues Over Expenditures and Other Sources (Uses) (3,396,979) (7,119,858) 238,867 (1,168,603) (929,736) 6,190,122 Fund Balances at Beginning of Year 4,273,388 8,445,894 8,445,894 (28,510) 8,417,384 (28,510)
FUND BALANCE AT END OF YEAR $ 876,409 1,326,036 8,684,761 (1,197,113) 7,487,648 6,161,612
159
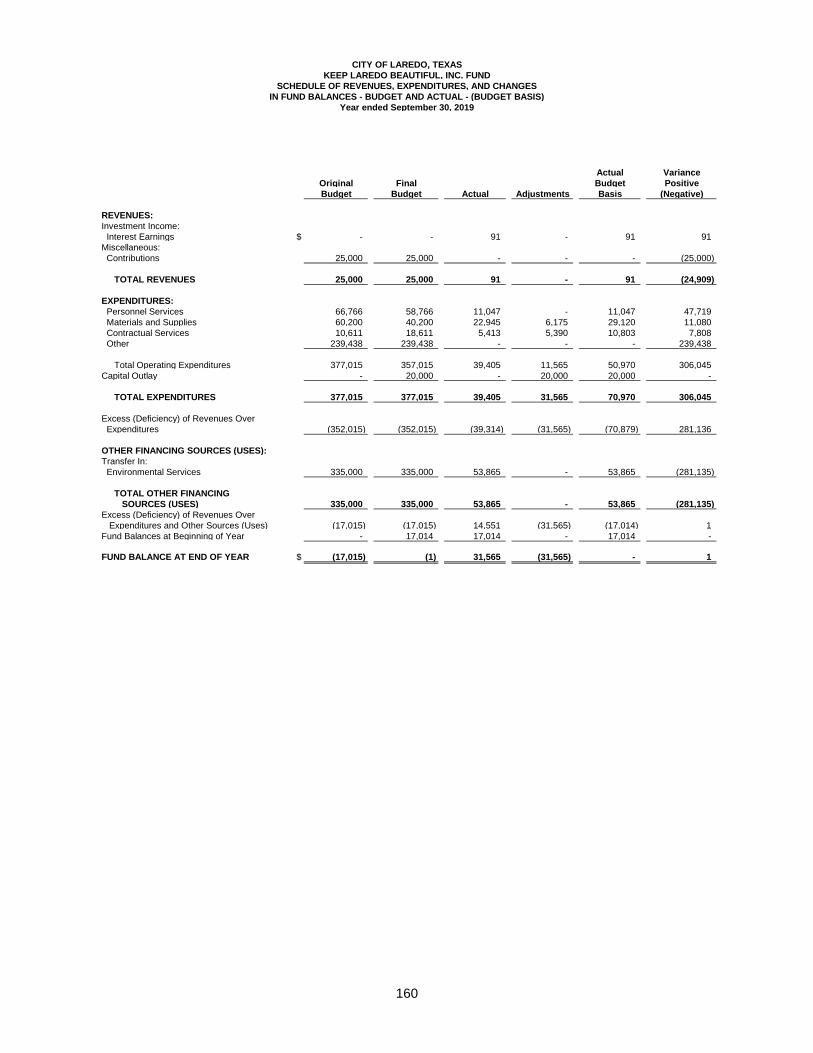
CITY OF LAREDO, TEXAS
KEEP LAREDO BEAUTIFUL, INC. FUND
SCHEDULE OF REVENUES, EXPENDITURES, AND CHANGES
IN FUND BALANCES - BUDGET AND ACTUAL - (BUDGET BASIS)
Year ended September 30, 2019
Actual Variance
Original Final Budget Positive
Budget Budget Actual Adjustments Basis (Negative)
REVENUES:
Investment Income: Interest Earnings $ - - 91 - 91 91 Miscellaneous: Contributions 25,000 25,000 - - - (25,000) TOTAL REVENUES 25,000 25,000 91 - 91 (24,909)
EXPENDITURES:
Personnel Services 66,766 58,766 11,047 - 11,047 47,719 Materials and Supplies 60,200 40,200 22,945 6,175 29,120 11,080 Contractual Services 10,611 18,611 5,413 5,390 10,803 7,808 Other 239,438 239,438 - - - 239,438
Total Operating Expenditures 377,015 357,015 39,405 11,565 50,970 306,045 Capital Outlay - 20,000 - 20,000 20,000 - TOTAL EXPENDITURES 377,015 377,015 39,405 31,565 70,970 306,045
Excess (Deficiency) of Revenues Over Expenditures (352,015) (352,015) (39,314) (31,565) (70,879) 281,136
OTHER FINANCING SOURCES (USES):
Transfer In: Environmental Services 335,000 335,000 53,865 - 53,865 (281,135)
TOTAL OTHER FINANCING
SOURCES (USES) 335,000 335,000 53,865 - 53,865 (281,135)
Excess (Deficiency) of Revenues Over Expenditures and Other Sources (Uses) (17,015) (17,015) 14,551 (31,565) (17,014) 1 Fund Balances at Beginning of Year - 17,014 17,014 - 17,014 -
FUND BALANCE AT END OF YEAR $ (17,015) (1) 31,565 (31,565) - 1
160
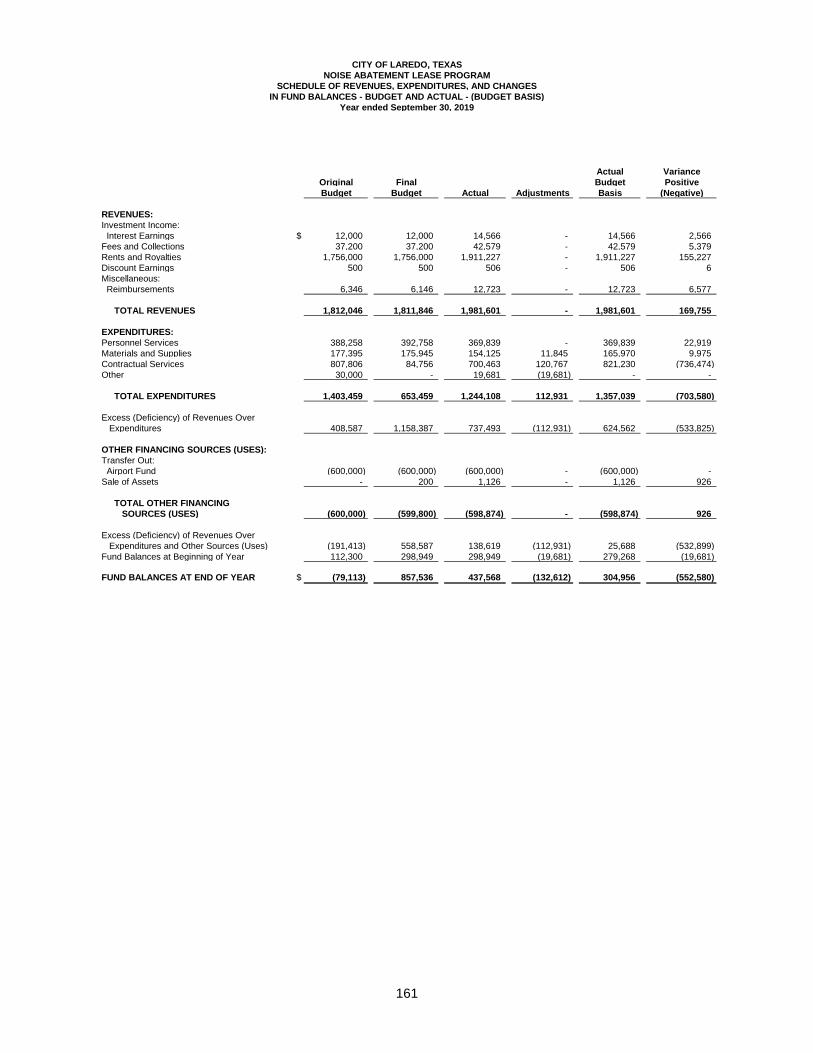
CITY OF LAREDO, TEXAS
NOISE ABATEMENT LEASE PROGRAM
SCHEDULE OF REVENUES, EXPENDITURES, AND CHANGES
IN FUND BALANCES - BUDGET AND ACTUAL - (BUDGET BASIS)
Year ended September 30, 2019
Actual Variance
Original Final Budget Positive
Budget Budget Actual Adjustments Basis (Negative)
REVENUES:
Investment Income: Interest Earnings $ 12,000 12,000 14,566 - 14,566 2,566 Fees and Collections 37,200 37,200 42,579 - 42,579 5,379 Rents and Royalties 1,756,000 1,756,000 1,911,227 - 1,911,227 155,227 Discount Earnings 500 500 506 - 506 6 Miscellaneous: Reimbursements 6,346 6,146 12,723 - 12,723 6,577 TOTAL REVENUES 1,812,046 1,811,846 1,981,601 - 1,981,601 169,755
EXPENDITURES:
Personnel Services 388,258 392,758 369,839 - 369,839 22,919 Materials and Supplies 177,395 175,945 154,125 11,845 165,970 9,975 Contractual Services 807,806 84,756 700,463 120,767 821,230 (736,474) Other 30,000 - 19,681 (19,681) - - TOTAL EXPENDITURES 1,403,459 653,459 1,244,108 112,931 1,357,039 (703,580)
Excess (Deficiency) of Revenues Over Expenditures 408,587 1,158,387 737,493 (112,931) 624,562 (533,825)
OTHER FINANCING SOURCES (USES):
Transfer Out: Airport Fund (600,000) (600,000) (600,000) - (600,000) - Sale of Assets - 200 1,126 - 1,126 926
TOTAL OTHER FINANCING
SOURCES (USES) (600,000) (599,800) (598,874) - (598,874) 926
Excess (Deficiency) of Revenues Over Expenditures and Other Sources (Uses) (191,413) 558,587 138,619 (112,931) 25,688 (532,899) Fund Balances at Beginning of Year 112,300 298,949 298,949 (19,681) 279,268 (19,681) FUND BALANCES AT END OF YEAR $ (79,113) 857,536 437,568 (132,612) 304,956 (552,580)
161
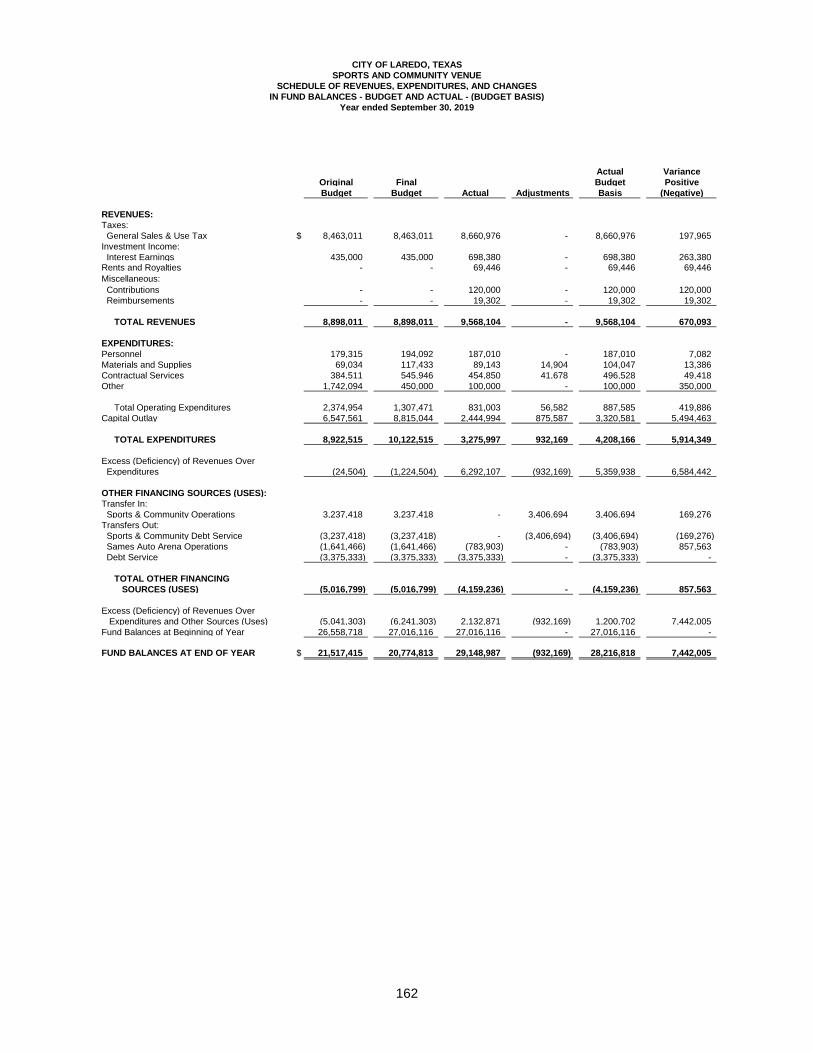
CITY OF LAREDO, TEXAS
SPORTS AND COMMUNITY VENUE
SCHEDULE OF REVENUES, EXPENDITURES, AND CHANGES
IN FUND BALANCES - BUDGET AND ACTUAL - (BUDGET BASIS)
Year ended September 30, 2019
Actual Variance
Original Final Budget Positive
Budget Budget Actual Adjustments Basis (Negative)
REVENUES:
Taxes: General Sales & Use Tax $ 8,463,011 8,463,011 8,660,976 - 8,660,976 197,965 Investment Income: Interest Earnings 435,000 435,000 698,380 - 698,380 263,380 Rents and Royalties - - 69,446 - 69,446 69,446 Miscellaneous: Contributions - - 120,000 - 120,000 120,000 Reimbursements - - 19,302 - 19,302 19,302
TOTAL REVENUES 8,898,011 8,898,011 9,568,104 - 9,568,104 670,093
EXPENDITURES:
Personnel 179,315 194,092 187,010 - 187,010 7,082 Materials and Supplies 69,034 117,433 89,143 14,904 104,047 13,386 Contractual Services 384,511 545,946 454,850 41,678 496,528 49,418 Other 1,742,094 450,000 100,000 - 100,000 350,000
Total Operating Expenditures 2,374,954 1,307,471 831,003 56,582 887,585 419,886 Capital Outlay 6,547,561 8,815,044 2,444,994 875,587 3,320,581 5,494,463
TOTAL EXPENDITURES 8,922,515 10,122,515 3,275,997 932,169 4,208,166 5,914,349
Excess (Deficiency) of Revenues Over Expenditures (24,504) (1,224,504) 6,292,107 (932,169) 5,359,938 6,584,442
OTHER FINANCING SOURCES (USES):
Transfer In: Sports & Community Operations 3,237,418 3,237,418 - 3,406,694 3,406,694 169,276 Transfers Out: Sports & Community Debt Service (3,237,418) (3,237,418) - (3,406,694) (3,406,694) (169,276) Sames Auto Arena Operations (1,641,466) (1,641,466) (783,903) - (783,903) 857,563 Debt Service (3,375,333) (3,375,333) (3,375,333) - (3,375,333) -
TOTAL OTHER FINANCING
SOURCES (USES) (5,016,799) (5,016,799) (4,159,236) - (4,159,236) 857,563
Excess (Deficiency) of Revenues Over Expenditures and Other Sources (Uses) (5,041,303) (6,241,303) 2,132,871 (932,169) 1,200,702 7,442,005 Fund Balances at Beginning of Year 26,558,718 27,016,116 27,016,116 - 27,016,116 -
FUND BALANCES AT END OF YEAR $ 21,517,415 20,774,813 29,148,987 (932,169) 28,216,818 7,442,005
162
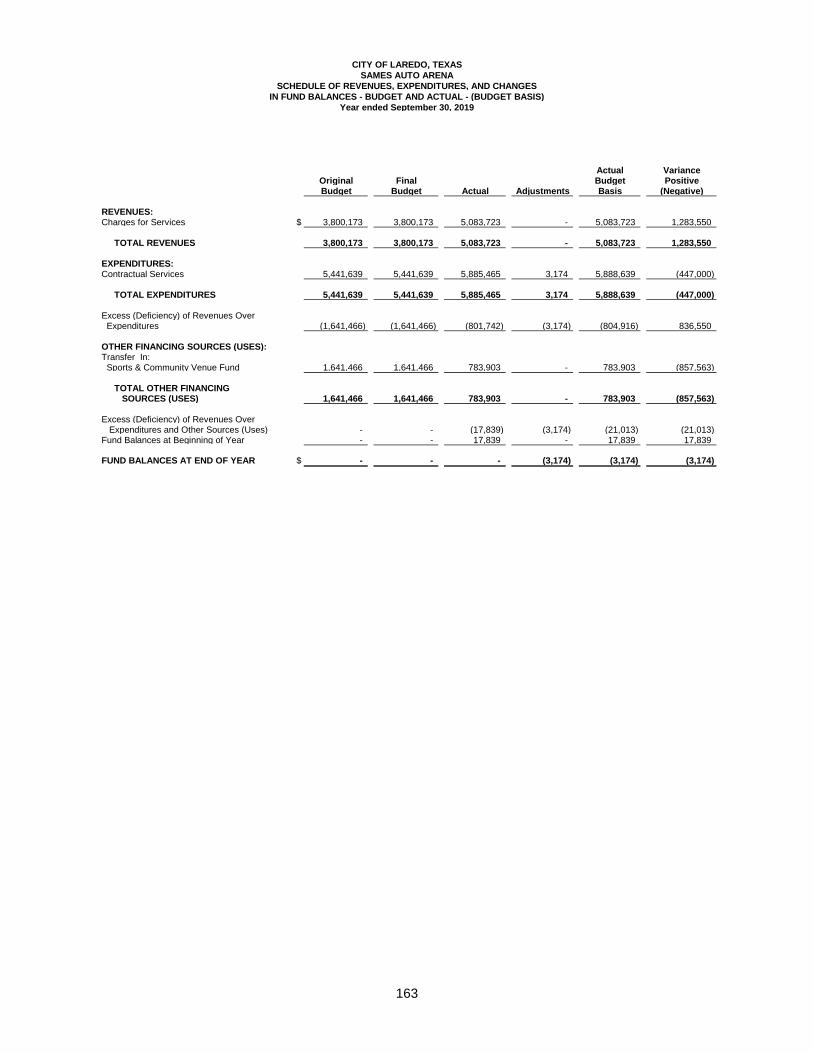
CITY OF LAREDO, TEXAS
SAMES AUTO ARENA
SCHEDULE OF REVENUES, EXPENDITURES, AND CHANGES
IN FUND BALANCES - BUDGET AND ACTUAL - (BUDGET BASIS)
Year ended September 30, 2019
Actual VarianceOriginal Final Budget PositiveBudget Budget Actual Adjustments Basis (Negative)
REVENUES:Charges for Services $ 3,800,173 3,800,173 5,083,723 - 5,083,723 1,283,550
TOTAL REVENUES 3,800,173 3,800,173 5,083,723 - 5,083,723 1,283,550
EXPENDITURES:Contractual Services 5,441,639 5,441,639 5,885,465 3,174 5,888,639 (447,000)
TOTAL EXPENDITURES 5,441,639 5,441,639 5,885,465 3,174 5,888,639 (447,000)
Excess (Deficiency) of Revenues Over Expenditures (1,641,466) (1,641,466) (801,742) (3,174) (804,916) 836,550
OTHER FINANCING SOURCES (USES):Transfer In: Sports & Community Venue Fund 1,641,466 1,641,466 783,903 - 783,903 (857,563)
TOTAL OTHER FINANCING SOURCES (USES) 1,641,466 1,641,466 783,903 - 783,903 (857,563)
Excess (Deficiency) of Revenues Over Expenditures and Other Sources (Uses) - - (17,839) (3,174) (21,013) (21,013) Fund Balances at Beginning of Year - - 17,839 - 17,839 17,839
FUND BALANCES AT END OF YEAR $ - - - (3,174) (3,174) (3,174)
163
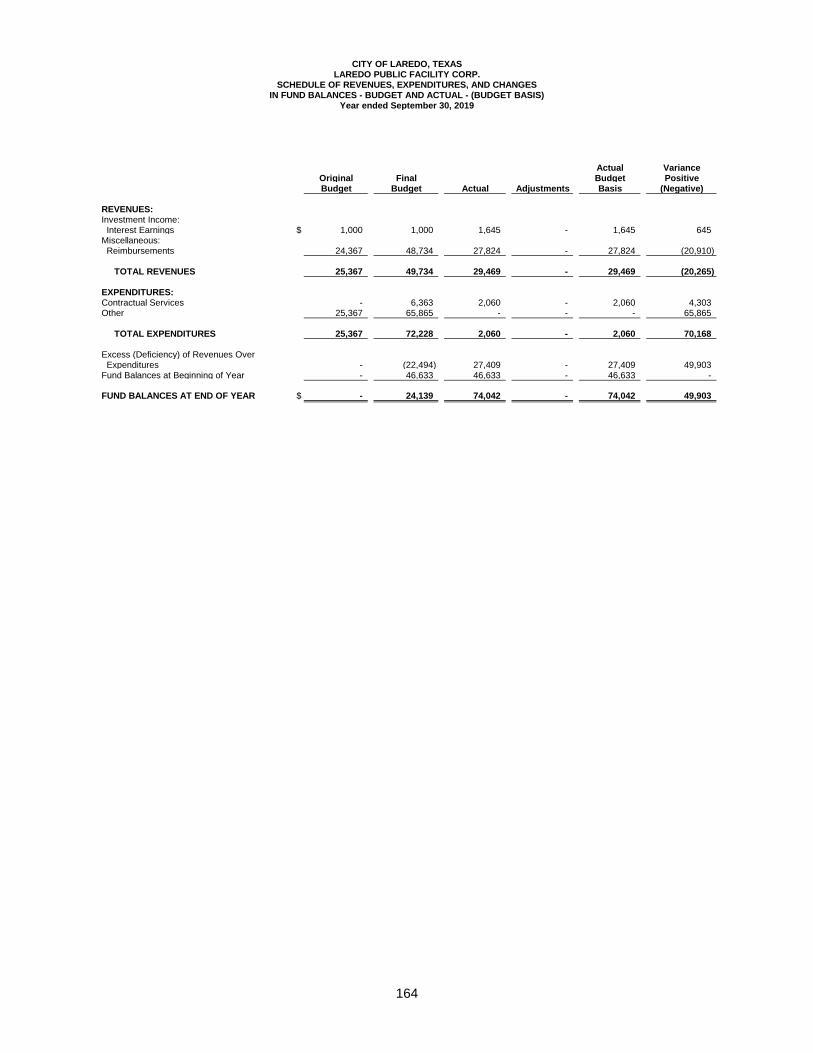
Actual VarianceOriginal Final Budget PositiveBudget Budget Actual Adjustments Basis (Negative)
REVENUES:Investment Income: Interest Earnings $ 1,000 1,000 1,645 - 1,645 645 Miscellaneous: Reimbursements 24,367 48,734 27,824 - 27,824 (20,910)
TOTAL REVENUES 25,367 49,734 29,469 - 29,469 (20,265)
EXPENDITURES:Contractual Services - 6,363 2,060 - 2,060 4,303 Other 25,367 65,865 - - - 65,865
TOTAL EXPENDITURES 25,367 72,228 2,060 - 2,060 70,168
Excess (Deficiency) of Revenues Over Expenditures - (22,494) 27,409 - 27,409 49,903 Fund Balances at Beginning of Year - 46,633 46,633 - 46,633 -
FUND BALANCES AT END OF YEAR $ - 24,139 74,042 - 74,042 49,903
Year ended September 30, 2019
CITY OF LAREDO, TEXASLAREDO PUBLIC FACILITY CORP.
SCHEDULE OF REVENUES, EXPENDITURES, AND CHANGESIN FUND BALANCES - BUDGET AND ACTUAL - (BUDGET BASIS)
164
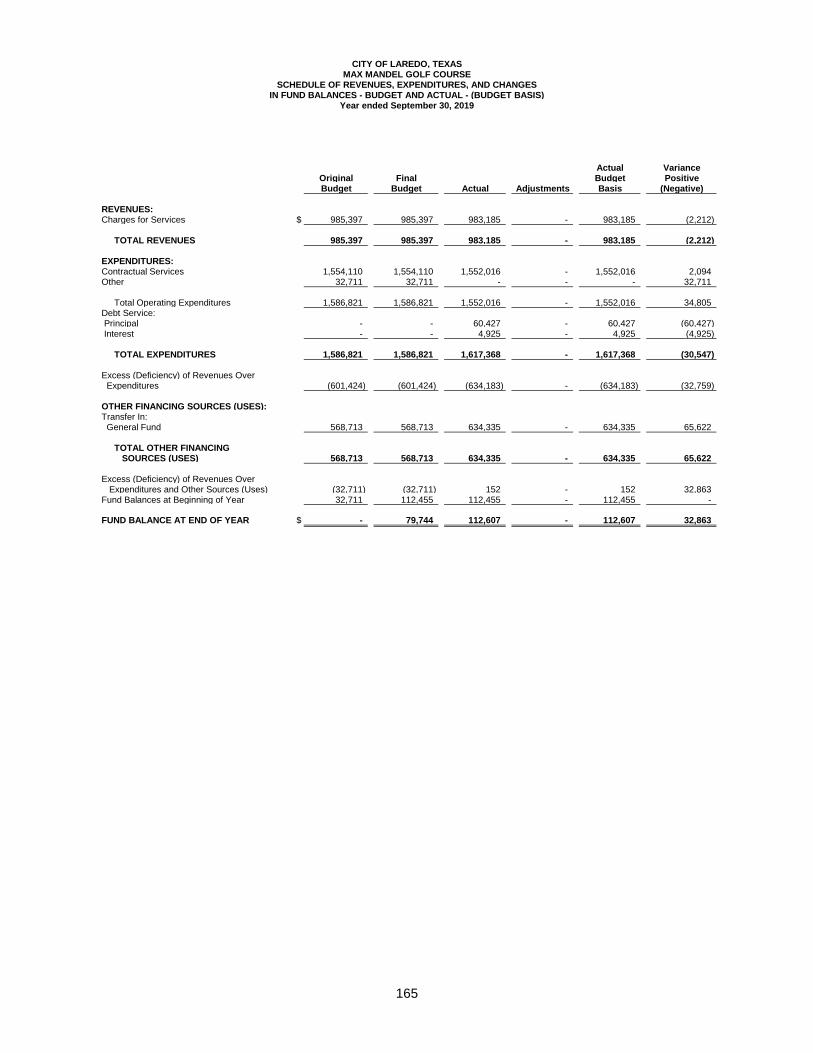
CITY OF LAREDO, TEXASMAX MANDEL GOLF COURSE
SCHEDULE OF REVENUES, EXPENDITURES, AND CHANGESIN FUND BALANCES - BUDGET AND ACTUAL - (BUDGET BASIS)
Year ended September 30, 2019
Actual VarianceOriginal Final Budget PositiveBudget Budget Actual Adjustments Basis (Negative)
REVENUES:Charges for Services $ 985,397 985,397 983,185 - 983,185 (2,212)
TOTAL REVENUES 985,397 985,397 983,185 - 983,185 (2,212)
EXPENDITURES:Contractual Services 1,554,110 1,554,110 1,552,016 - 1,552,016 2,094 Other 32,711 32,711 - - - 32,711
Total Operating Expenditures 1,586,821 1,586,821 1,552,016 - 1,552,016 34,805 Debt Service: Principal - - 60,427 - 60,427 (60,427) Interest - - 4,925 - 4,925 (4,925)
TOTAL EXPENDITURES 1,586,821 1,586,821 1,617,368 - 1,617,368 (30,547)
Excess (Deficiency) of Revenues Over Expenditures (601,424) (601,424) (634,183) - (634,183) (32,759)
OTHER FINANCING SOURCES (USES):Transfer In: General Fund 568,713 568,713 634,335 - 634,335 65,622
TOTAL OTHER FINANCING SOURCES (USES) 568,713 568,713 - 634,335 - 634,335 65,622
Excess (Deficiency) of Revenues Over Expenditures and Other Sources (Uses) (32,711) (32,711) 152 - 152 32,863 Fund Balances at Beginning of Year 32,711 112,455 112,455 - 112,455 -
FUND BALANCE AT END OF YEAR $ - 79,744 112,607 - 112,607 32,863
165
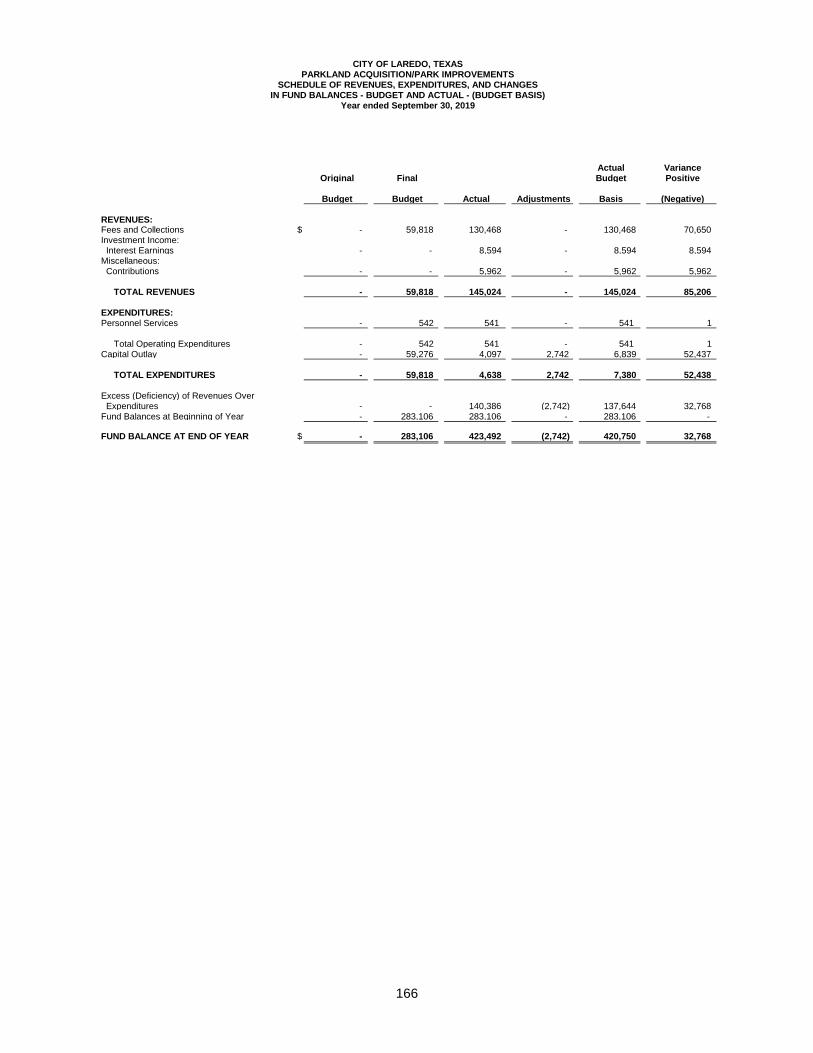
Actual Variance Original Final Budget Positive
Budget Budget Actual Adjustments Basis (Negative)
REVENUES: Fees and Collections $ - 59,818 130,468 - 130,468 70,650 Investment Income: Interest Earnings - - 8,594 - 8,594 8,594 Miscellaneous: Contributions - - 5,962 - 5,962 5,962
TOTAL REVENUES - 59,818 145,024 - 145,024 85,206
EXPENDITURES: Personnel Services - 542 541 - 541 1
Total Operating Expenditures - 542 541 - 541 1 Capital Outlay - 59,276 4,097 2,742 6,839 52,437
TOTAL EXPENDITURES - 59,818 4,638 2,742 7,380 52,438
Excess (Deficiency) of Revenues Over Expenditures - - 140,386 (2,742) 137,644 32,768 Fund Balances at Beginning of Year - 283,106 283,106 - 283,106 -
FUND BALANCE AT END OF YEAR $ - 283,106 423,492 (2,742) 420,750 32,768
CITY OF LAREDO, TEXAS PARKLAND ACQUISITION/PARK IMPROVEMENTS
SCHEDULE OF REVENUES, EXPENDITURES, AND CHANGES IN FUND BALANCES - BUDGET AND ACTUAL - (BUDGET BASIS)
Year ended September 30, 2019
166
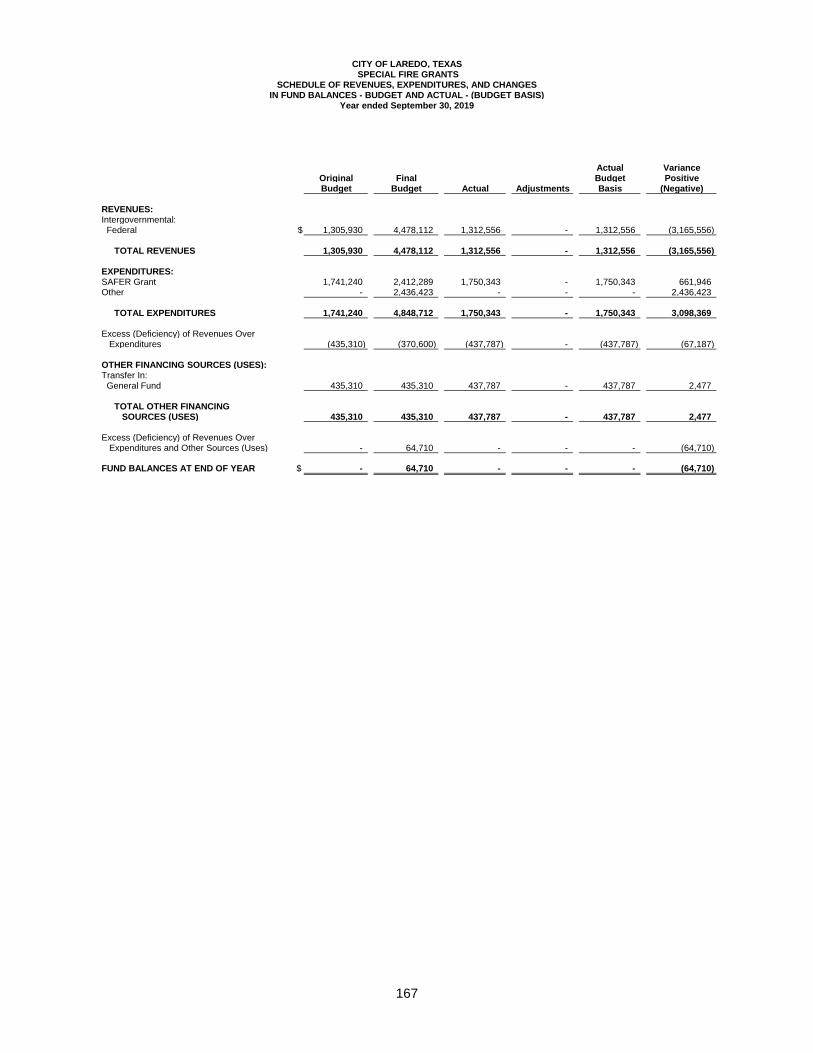
CITY OF LAREDO, TEXAS SPECIAL FIRE GRANTS
SCHEDULE OF REVENUES, EXPENDITURES, AND CHANGESIN FUND BALANCES - BUDGET AND ACTUAL - (BUDGET BASIS)
Year ended September 30, 2019
Actual VarianceOriginal Final Budget PositiveBudget Budget Actual Adjustments Basis (Negative)
REVENUES:Intergovernmental: Federal $ 1,305,930 4,478,112 1,312,556 - 1,312,556 (3,165,556) TOTAL REVENUES 1,305,930 4,478,112 1,312,556 - 1,312,556 (3,165,556)
EXPENDITURES:SAFER Grant 1,741,240 2,412,289 1,750,343 - 1,750,343 661,946 Other - 2,436,423 - - - 2,436,423 TOTAL EXPENDITURES 1,741,240 4,848,712 1,750,343 - 1,750,343 3,098,369 Excess (Deficiency) of Revenues Over Expenditures (435,310) (370,600) (437,787) - (437,787) (67,187)
OTHER FINANCING SOURCES (USES):Transfer In: General Fund 435,310 435,310 437,787 - 437,787 2,477
TOTAL OTHER FINANCING SOURCES (USES) 435,310 435,310 437,787 - 437,787 2,477
Excess (Deficiency) of Revenues Over Expenditures and Other Sources (Uses) - 64,710 - - - (64,710) FUND BALANCES AT END OF YEAR $ - 64,710 - - - (64,710)
167
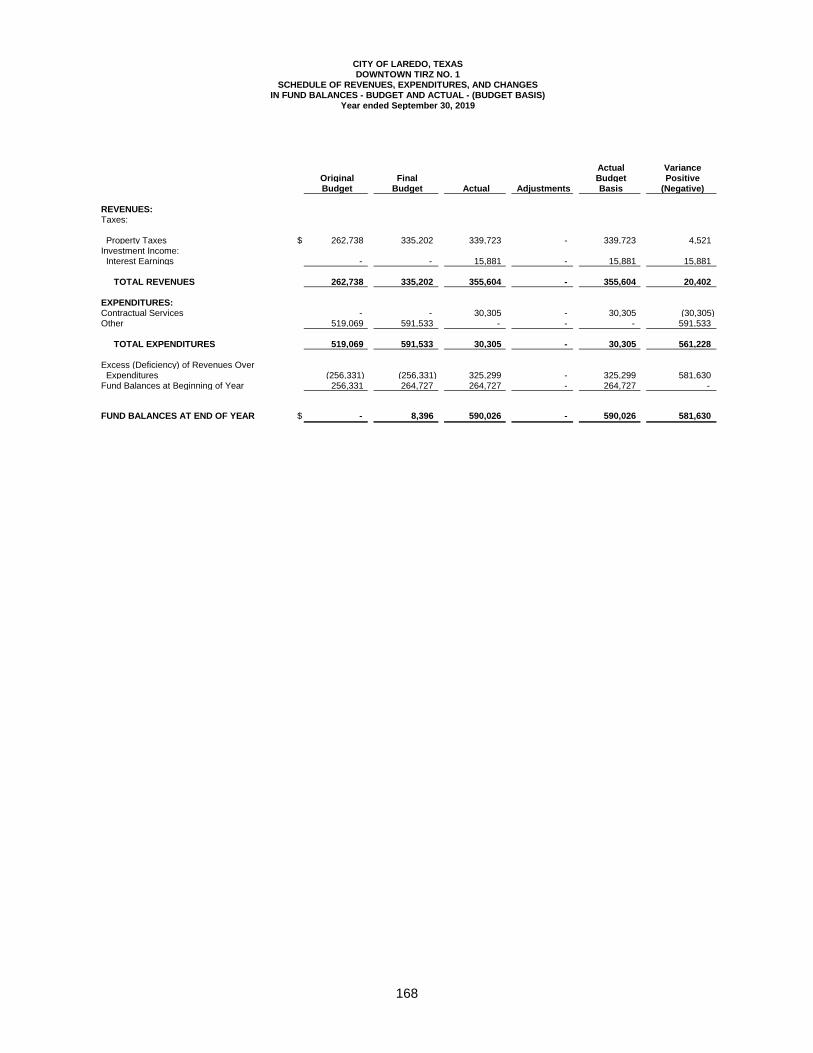
Actual Variance Original Final Budget Positive Budget Budget Actual Adjustments Basis (Negative)
REVENUES: Taxes:
Property Taxes $ 262,738 335,202 339,723 - 339,723 4,521 Investment Income: Interest Earnings - - 15,881 - 15,881 15,881
TOTAL REVENUES 262,738 335,202 355,604 - 355,604 20,402
EXPENDITURES: Contractual Services - - 30,305 - 30,305 (30,305) Other 519,069 591,533 - - - 591,533
TOTAL EXPENDITURES 519,069 591,533 30,305 - 30,305 561,228
Excess (Deficiency) of Revenues Over Expenditures (256,331) (256,331) 325,299 - 325,299 581,630 Fund Balances at Beginning of Year 256,331 264,727 264,727 - 264,727 -
FUND BALANCES AT END OF YEAR $ - 8,396 590,026 - 590,026 581,630
CITY OF LAREDO, TEXAS DOWNTOWN TIRZ NO. 1
SCHEDULE OF REVENUES, EXPENDITURES, AND CHANGES IN FUND BALANCES - BUDGET AND ACTUAL - (BUDGET BASIS)
Year ended September 30, 2019
168
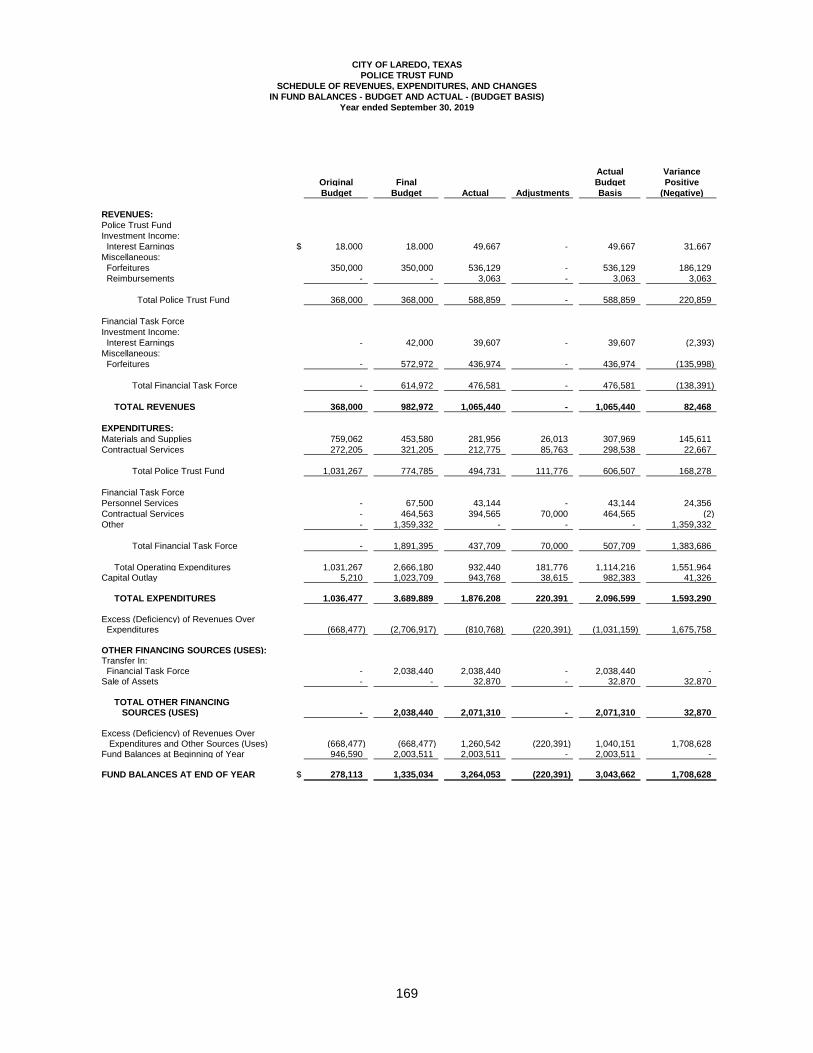
CITY OF LAREDO, TEXAS
POLICE TRUST FUND
SCHEDULE OF REVENUES, EXPENDITURES, AND CHANGES
IN FUND BALANCES - BUDGET AND ACTUAL - (BUDGET BASIS)
Year ended September 30, 2019
Actual Variance
Original Final Budget Positive
Budget Budget Actual Adjustments Basis (Negative)
REVENUES:
Police Trust FundInvestment Income: Interest Earnings $ 18,000 18,000 49,667 - 49,667 31,667 Miscellaneous: Forfeitures 350,000 350,000 536,129 - 536,129 186,129 Reimbursements - - 3,063 - 3,063 3,063
Total Police Trust Fund 368,000 368,000 588,859 - 588,859 220,859
Financial Task ForceInvestment Income: Interest Earnings - 42,000 39,607 - 39,607 (2,393) Miscellaneous: Forfeitures - 572,972 436,974 - 436,974 (135,998)
Total Financial Task Force - 614,972 476,581 - 476,581 (138,391) TOTAL REVENUES 368,000 982,972 1,065,440 - 1,065,440 82,468
EXPENDITURES:
Materials and Supplies 759,062 453,580 281,956 26,013 307,969 145,611 Contractual Services 272,205 321,205 212,775 85,763 298,538 22,667
Total Police Trust Fund 1,031,267 774,785 494,731 111,776 606,507 168,278
Financial Task ForcePersonnel Services - 67,500 43,144 - 43,144 24,356 Contractual Services - 464,563 394,565 70,000 464,565 (2) Other - 1,359,332 - - - 1,359,332
Total Financial Task Force - 1,891,395 437,709 70,000 507,709 1,383,686
Total Operating Expenditures 1,031,267 2,666,180 932,440 181,776 1,114,216 1,551,964 Capital Outlay 5,210 1,023,709 943,768 38,615 982,383 41,326 TOTAL EXPENDITURES 1,036,477 3,689,889 1,876,208 220,391 2,096,599 1,593,290 Excess (Deficiency) of Revenues Over Expenditures (668,477) (2,706,917) (810,768) (220,391) (1,031,159) 1,675,758
OTHER FINANCING SOURCES (USES):Transfer In: Financial Task Force - 2,038,440 2,038,440 - 2,038,440 - Sale of Assets - - 32,870 - 32,870 32,870
TOTAL OTHER FINANCING SOURCES (USES) - 2,038,440 2,071,310 - 2,071,310 32,870
Excess (Deficiency) of Revenues Over Expenditures and Other Sources (Uses) (668,477) (668,477) 1,260,542 (220,391) 1,040,151 1,708,628 Fund Balances at Beginning of Year 946,590 2,003,511 2,003,511 - 2,003,511 - FUND BALANCES AT END OF YEAR $ 278,113 1,335,034 3,264,053 (220,391) 3,043,662 1,708,628
169
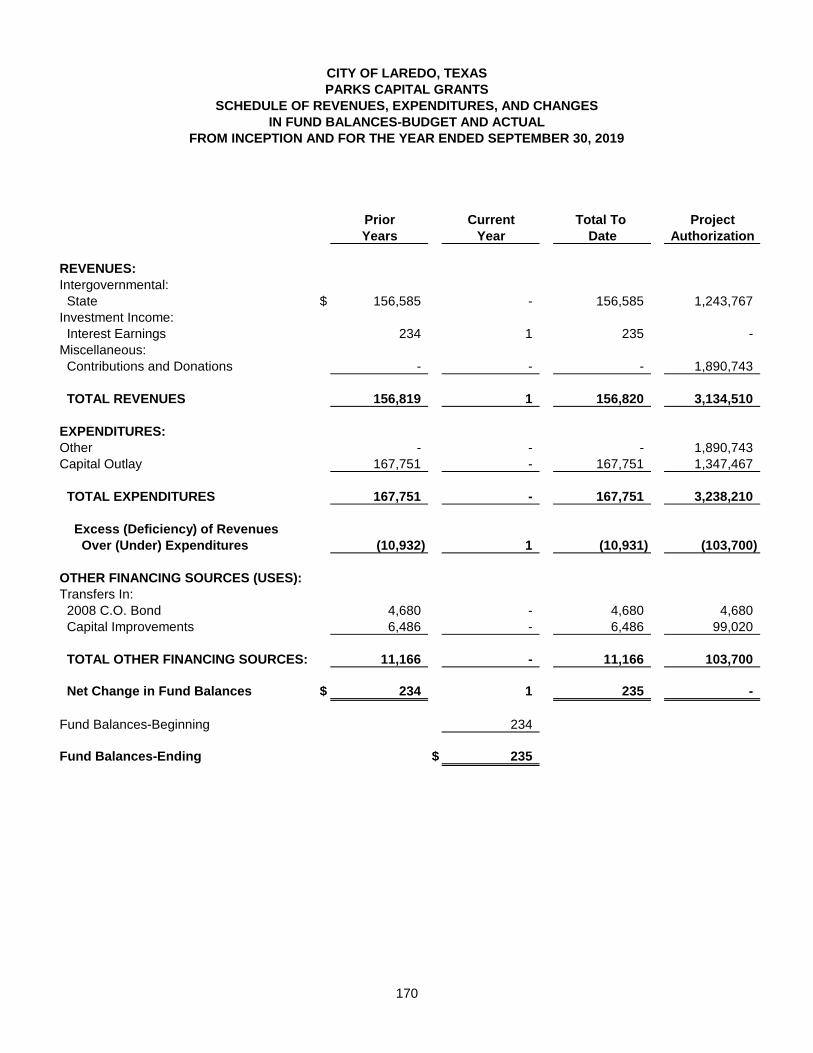
CITY OF LAREDO, TEXAS
PARKS CAPITAL GRANTS
SCHEDULE OF REVENUES, EXPENDITURES, AND CHANGES
IN FUND BALANCES-BUDGET AND ACTUAL
FROM INCEPTION AND FOR THE YEAR ENDED SEPTEMBER 30, 2019
Prior Current Total To Project
Years Year Date Authorization
REVENUES:
Intergovernmental: State $ 156,585 - 156,585 1,243,767 Investment Income: Interest Earnings 234 1 235 - Miscellaneous: Contributions and Donations - - - 1,890,743
TOTAL REVENUES 156,819 1 156,820 3,134,510
EXPENDITURES:
Other - - - 1,890,743 Capital Outlay 167,751 - 167,751 1,347,467
TOTAL EXPENDITURES 167,751 - 167,751 3,238,210
Excess (Deficiency) of Revenues
Over (Under) Expenditures (10,932) 1 (10,931) (103,700)
OTHER FINANCING SOURCES (USES):
Transfers In: 2008 C.O. Bond 4,680 - 4,680 4,680 Capital Improvements 6,486 - 6,486 99,020
TOTAL OTHER FINANCING SOURCES: 11,166 - 11,166 103,700
Net Change in Fund Balances $ 234 1 235 -
Fund Balances-Beginning 234
Fund Balances-Ending $ 235
170

CITY OF LAREDO, TEXAS
CAPITAL GRANTS
SCHEDULE OF REVENUES, EXPENDITURES, AND CHANGES
IN FUND BALANCES-BUDGET AND ACTUAL
FROM INCEPTION AND FOR THE YEAR ENDED SEPTEMBER 30, 2019
Prior Current Total To Project
Years Year Date Authorization
REVENUES:
Intergovernmental: Federal $ 92,734 263,999 356,733 480,000 State 2,180,505 7,710 2,188,215 19,283,624 Investment Income: Interest Earnings 67 - 67 45
TOTAL REVENUES 2,273,306 271,709 2,545,015 19,763,669
EXPENDITURES:
Other - 18,837 18,837 244,962 Capital Outlay 2,407,211 339,637 2,746,848 29,143,787
TOTAL EXPENDITURES 2,407,211 358,474 2,765,685 29,388,749
Excess (Deficiency) of Revenues
Over (Under) Expenditures (133,905) (86,765) (220,670) (9,625,080)
OTHER FINANCING SOURCES (USES):
Transfers In: Capital Improvements Fund 397 - 397 5,239,381 2012 C.O. Bond 38,624 18,815 57,439 57,439 2015 C.O. Bond 56,723 1,928 58,651 1,193,260 2016 C.O. Bond 38,183 66,000 104,183 135,000 2018 C.O. Bond - - - 3,000,000
TOTAL OTHER FINANCING SOURCES: 133,927 86,743 220,670 9,625,080
Net Change in Fund Balances $ 22 (22) - -
Fund Balances-Beginning 22
Fund Balances-Ending $ -
171

CITY OF LAREDO, TEXAS
CONTRACTUAL OBLIGATIONS
SCHEDULE OF REVENUES, EXPENDITURES, AND CHANGES
IN FUND BALANCES-BUDGET AND ACTUAL
FROM INCEPTION AND FOR THE YEAR ENDED SEPTEMBER 30, 2019
Prior Current Total To Project
Years Year Date Authorization
REVENUES:
Investment Income: Interest Earnings $ 66,496 94,785 161,281 74,324 Miscellaneous: Other 35,580 - 35,580 35,580
TOTAL REVENUES 102,076 94,785 196,861 109,904
EXPENDITURES:
Materials and Supplies 553,238 497,793 1,051,031 988,243 Contractual Services 7,063 647 7,710 7,729 Other - - - 28,771 Bond Costs 149,903 40,679 190,582 201,169 Capital Outlay 7,169,796 2,213,496 9,383,292 11,801,777
TOTAL EXPENDITURES 7,880,000 2,752,615 10,632,615 13,027,689
Excess (Deficiency) of Revenues
Over (Under) Expenditures (7,777,924) (2,657,830) (10,435,754) (12,917,785)
OTHER FINANCING SOURCES (USES):
Bond Issues 8,208,000 3,425,000 11,633,000 11,633,000 Bond Premium 952,032 321,753 1,273,785 1,273,785 Sale of Assets 11,000 - 11,000 11,000
TOTAL OTHER FINANCING SOURCES: 9,171,032 3,746,753 12,917,785 12,917,785
Net Change in Fund Balances $ 1,393,108 1,088,923 2,482,031 -
Fund Balances-Beginning 1,393,108
Fund Balances-Ending $ 2,482,031
172
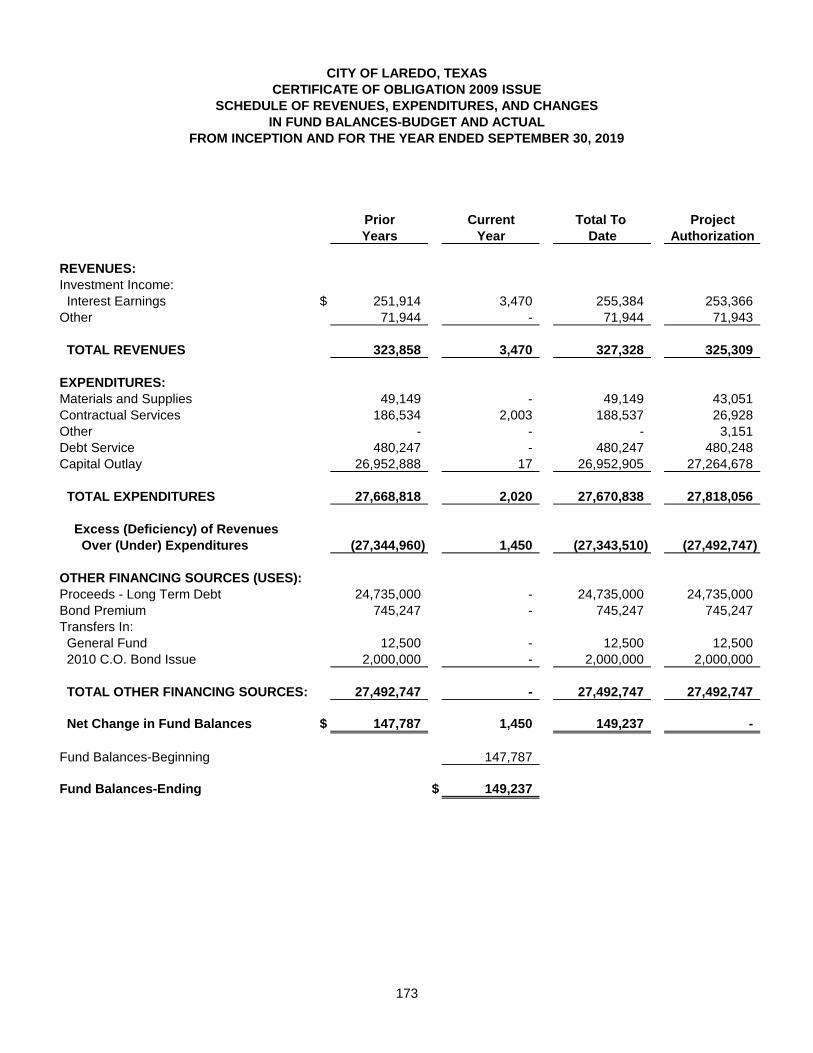
CITY OF LAREDO, TEXAS
CERTIFICATE OF OBLIGATION 2009 ISSUE
SCHEDULE OF REVENUES, EXPENDITURES, AND CHANGES
IN FUND BALANCES-BUDGET AND ACTUAL
FROM INCEPTION AND FOR THE YEAR ENDED SEPTEMBER 30, 2019
Prior Current Total To Project
Years Year Date Authorization
REVENUES:
Investment Income: Interest Earnings $ 251,914 3,470 255,384 253,366 Other 71,944 - 71,944 71,943
TOTAL REVENUES 323,858 3,470 327,328 325,309
EXPENDITURES:
Materials and Supplies 49,149 - 49,149 43,051 Contractual Services 186,534 2,003 188,537 26,928 Other - - - 3,151 Debt Service 480,247 - 480,247 480,248 Capital Outlay 26,952,888 17 26,952,905 27,264,678
TOTAL EXPENDITURES 27,668,818 2,020 27,670,838 27,818,056
Excess (Deficiency) of Revenues
Over (Under) Expenditures (27,344,960) 1,450 (27,343,510) (27,492,747)
OTHER FINANCING SOURCES (USES):
Proceeds - Long Term Debt 24,735,000 - 24,735,000 24,735,000 Bond Premium 745,247 - 745,247 745,247 Transfers In: General Fund 12,500 - 12,500 12,500 2010 C.O. Bond Issue 2,000,000 - 2,000,000 2,000,000
TOTAL OTHER FINANCING SOURCES: 27,492,747 - 27,492,747 27,492,747
Net Change in Fund Balances $ 147,787 1,450 149,237 -
Fund Balances-Beginning 147,787
Fund Balances-Ending $ 149,237
173
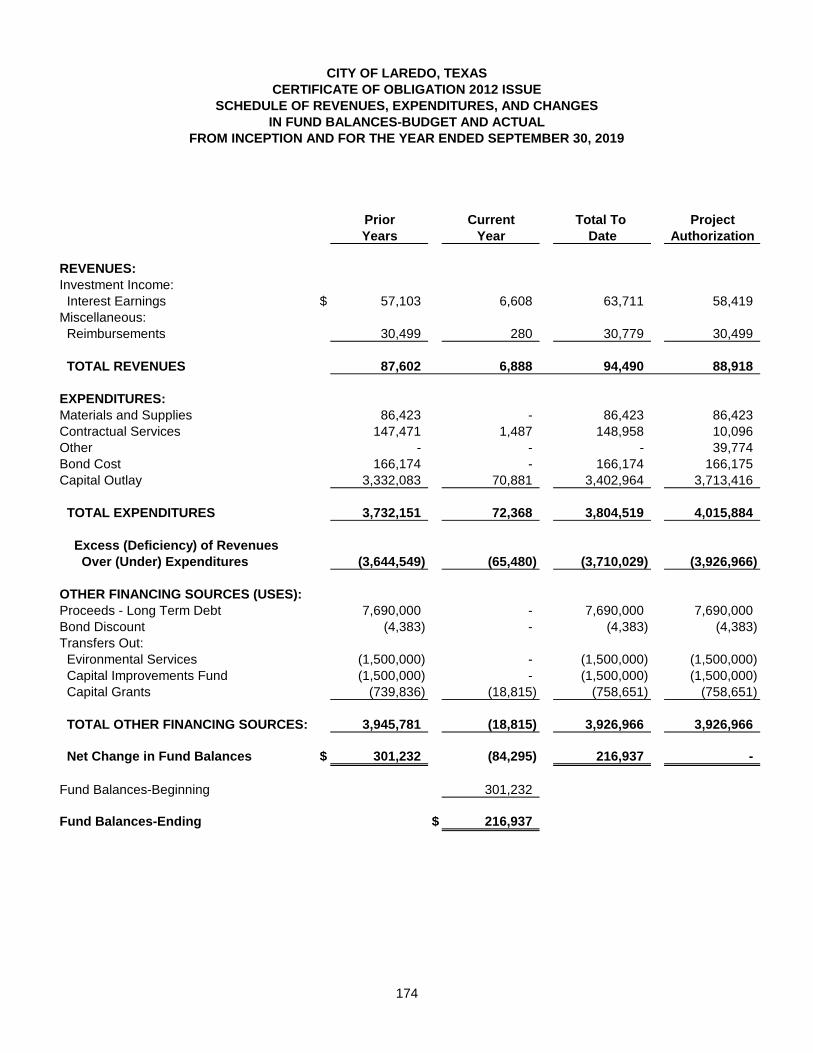
CITY OF LAREDO, TEXAS
CERTIFICATE OF OBLIGATION 2012 ISSUE
SCHEDULE OF REVENUES, EXPENDITURES, AND CHANGES
IN FUND BALANCES-BUDGET AND ACTUAL
FROM INCEPTION AND FOR THE YEAR ENDED SEPTEMBER 30, 2019
Prior Current Total To Project
Years Year Date Authorization
REVENUES:
Investment Income: Interest Earnings $ 57,103 6,608 63,711 58,419 Miscellaneous: Reimbursements 30,499 280 30,779 30,499
TOTAL REVENUES 87,602 6,888 94,490 88,918
EXPENDITURES:
Materials and Supplies 86,423 - 86,423 86,423 Contractual Services 147,471 1,487 148,958 10,096 Other - - - 39,774 Bond Cost 166,174 - 166,174 166,175 Capital Outlay 3,332,083 70,881 3,402,964 3,713,416
TOTAL EXPENDITURES 3,732,151 72,368 3,804,519 4,015,884
Excess (Deficiency) of Revenues
Over (Under) Expenditures (3,644,549) (65,480) (3,710,029) (3,926,966)
OTHER FINANCING SOURCES (USES):
Proceeds - Long Term Debt 7,690,000 - 7,690,000 7,690,000 Bond Discount (4,383) - (4,383) (4,383) Transfers Out: Evironmental Services (1,500,000) - (1,500,000) (1,500,000) Capital Improvements Fund (1,500,000) - (1,500,000) (1,500,000) Capital Grants (739,836) (18,815) (758,651) (758,651)
TOTAL OTHER FINANCING SOURCES: 3,945,781 (18,815) 3,926,966 3,926,966
Net Change in Fund Balances $ 301,232 (84,295) 216,937 -
Fund Balances-Beginning 301,232
Fund Balances-Ending $ 216,937
174
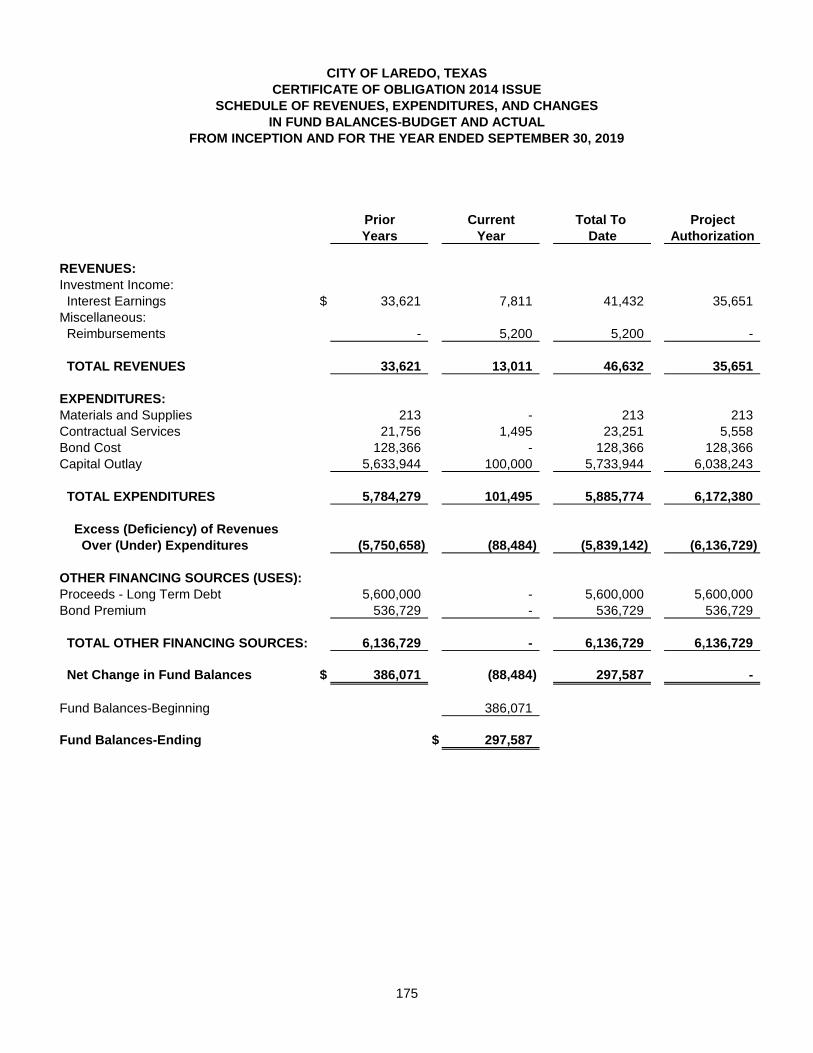
CITY OF LAREDO, TEXAS
CERTIFICATE OF OBLIGATION 2014 ISSUE
SCHEDULE OF REVENUES, EXPENDITURES, AND CHANGES
IN FUND BALANCES-BUDGET AND ACTUAL
FROM INCEPTION AND FOR THE YEAR ENDED SEPTEMBER 30, 2019
Prior Current Total To Project
Years Year Date Authorization
REVENUES:
Investment Income: Interest Earnings $ 33,621 7,811 41,432 35,651 Miscellaneous: Reimbursements - 5,200 5,200 -
TOTAL REVENUES 33,621 13,011 46,632 35,651
EXPENDITURES:
Materials and Supplies 213 - 213 213 Contractual Services 21,756 1,495 23,251 5,558 Bond Cost 128,366 - 128,366 128,366 Capital Outlay 5,633,944 100,000 5,733,944 6,038,243
TOTAL EXPENDITURES 5,784,279 101,495 5,885,774 6,172,380
Excess (Deficiency) of Revenues
Over (Under) Expenditures (5,750,658) (88,484) (5,839,142) (6,136,729)
OTHER FINANCING SOURCES (USES):
Proceeds - Long Term Debt 5,600,000 - 5,600,000 5,600,000 Bond Premium 536,729 - 536,729 536,729
TOTAL OTHER FINANCING SOURCES: 6,136,729 - 6,136,729 6,136,729
Net Change in Fund Balances $ 386,071 (88,484) 297,587 -
Fund Balances-Beginning 386,071
Fund Balances-Ending $ 297,587
175
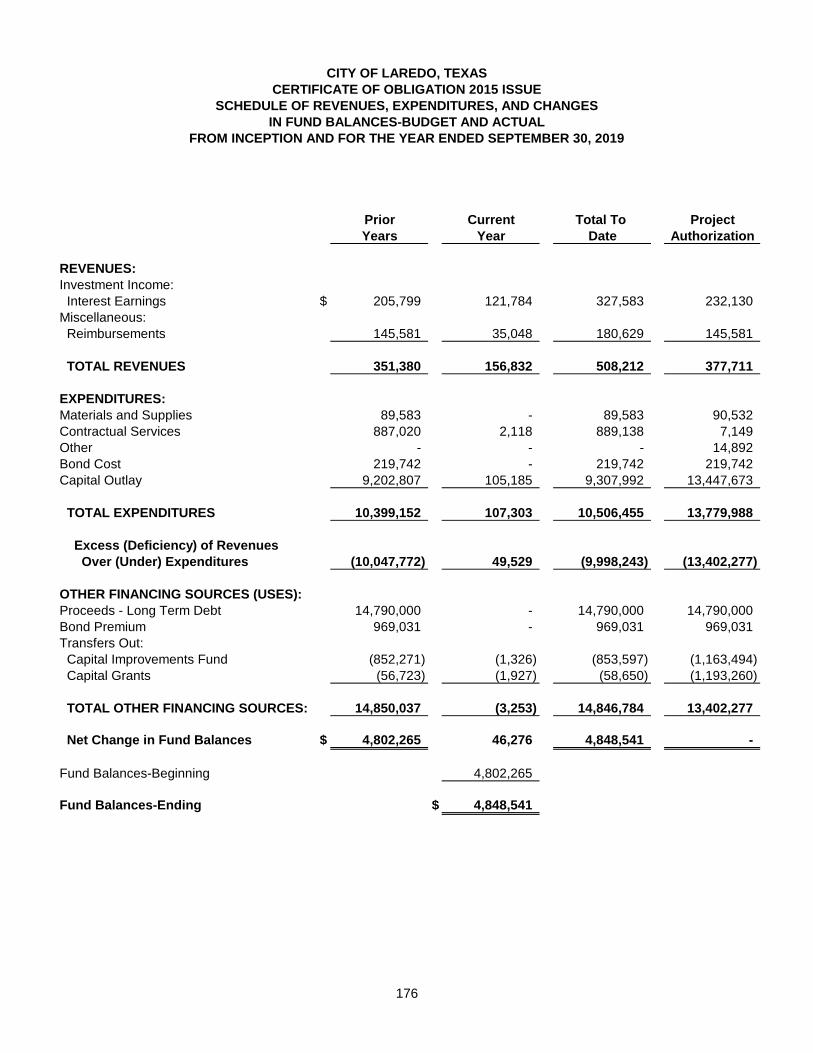
CITY OF LAREDO, TEXAS
CERTIFICATE OF OBLIGATION 2015 ISSUE
SCHEDULE OF REVENUES, EXPENDITURES, AND CHANGES
IN FUND BALANCES-BUDGET AND ACTUAL
FROM INCEPTION AND FOR THE YEAR ENDED SEPTEMBER 30, 2019
Prior Current Total To Project
Years Year Date Authorization
REVENUES:
Investment Income: Interest Earnings $ 205,799 121,784 327,583 232,130 Miscellaneous: Reimbursements 145,581 35,048 180,629 145,581
TOTAL REVENUES 351,380 156,832 508,212 377,711
EXPENDITURES:
Materials and Supplies 89,583 - 89,583 90,532 Contractual Services 887,020 2,118 889,138 7,149 Other - - - 14,892 Bond Cost 219,742 - 219,742 219,742 Capital Outlay 9,202,807 105,185 9,307,992 13,447,673
TOTAL EXPENDITURES 10,399,152 107,303 10,506,455 13,779,988
Excess (Deficiency) of Revenues
Over (Under) Expenditures (10,047,772) 49,529 (9,998,243) (13,402,277)
OTHER FINANCING SOURCES (USES):
Proceeds - Long Term Debt 14,790,000 - 14,790,000 14,790,000 Bond Premium 969,031 - 969,031 969,031 Transfers Out: Capital Improvements Fund (852,271) (1,326) (853,597) (1,163,494) Capital Grants (56,723) (1,927) (58,650) (1,193,260)
TOTAL OTHER FINANCING SOURCES: 14,850,037 (3,253) 14,846,784 13,402,277
Net Change in Fund Balances $ 4,802,265 46,276 4,848,541 -
Fund Balances-Beginning 4,802,265
Fund Balances-Ending $ 4,848,541
176
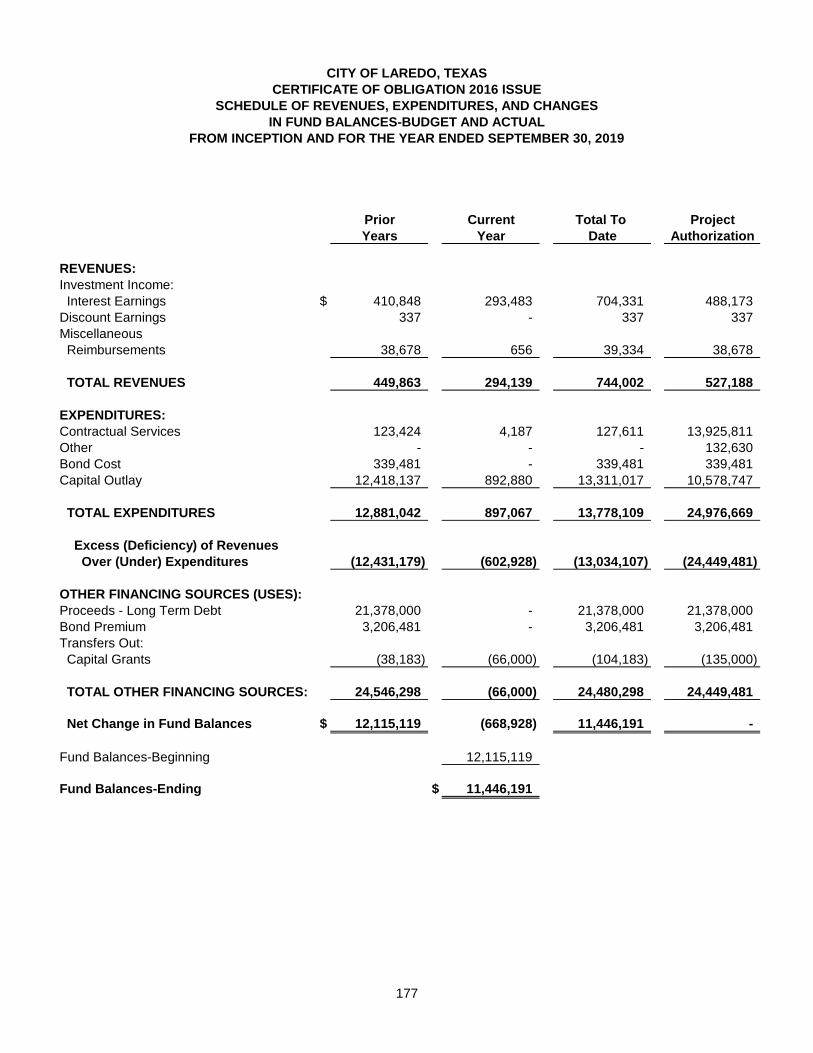
CITY OF LAREDO, TEXAS
CERTIFICATE OF OBLIGATION 2016 ISSUE
SCHEDULE OF REVENUES, EXPENDITURES, AND CHANGES
IN FUND BALANCES-BUDGET AND ACTUAL
FROM INCEPTION AND FOR THE YEAR ENDED SEPTEMBER 30, 2019
Prior Current Total To Project
Years Year Date Authorization
REVENUES:
Investment Income: Interest Earnings $ 410,848 293,483 704,331 488,173 Discount Earnings 337 - 337 337 Miscellaneous Reimbursements 38,678 656 39,334 38,678
TOTAL REVENUES 449,863 294,139 744,002 527,188
EXPENDITURES:
Contractual Services 123,424 4,187 127,611 13,925,811 Other - - - 132,630 Bond Cost 339,481 - 339,481 339,481 Capital Outlay 12,418,137 892,880 13,311,017 10,578,747
TOTAL EXPENDITURES 12,881,042 897,067 13,778,109 24,976,669
Excess (Deficiency) of Revenues
Over (Under) Expenditures (12,431,179) (602,928) (13,034,107) (24,449,481)
OTHER FINANCING SOURCES (USES):
Proceeds - Long Term Debt 21,378,000 - 21,378,000 21,378,000 Bond Premium 3,206,481 - 3,206,481 3,206,481 Transfers Out: Capital Grants (38,183) (66,000) (104,183) (135,000)
TOTAL OTHER FINANCING SOURCES: 24,546,298 (66,000) 24,480,298 24,449,481
Net Change in Fund Balances $ 12,115,119 (668,928) 11,446,191 -
Fund Balances-Beginning 12,115,119
Fund Balances-Ending $ 11,446,191
177
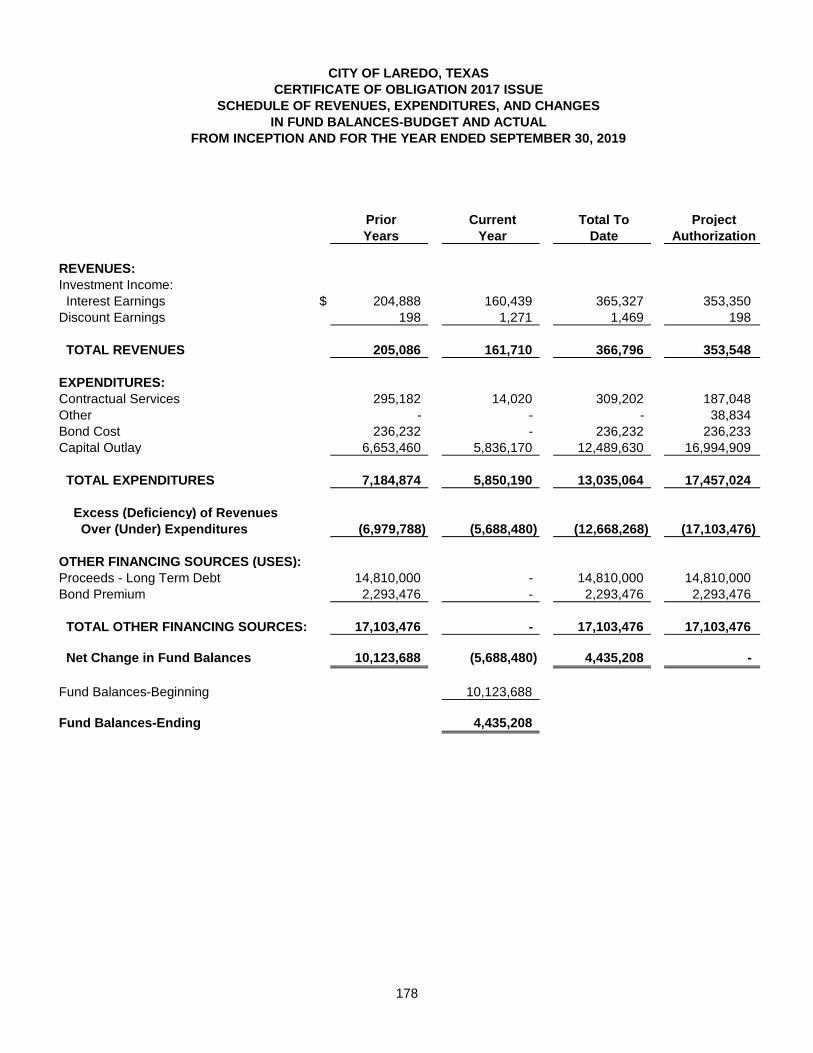
CITY OF LAREDO, TEXAS
CERTIFICATE OF OBLIGATION 2017 ISSUE
SCHEDULE OF REVENUES, EXPENDITURES, AND CHANGES
IN FUND BALANCES-BUDGET AND ACTUAL
FROM INCEPTION AND FOR THE YEAR ENDED SEPTEMBER 30, 2019
Prior Current Total To Project
Years Year Date Authorization
REVENUES:
Investment Income: Interest Earnings
$ 204,888 160,439 365,327 353,350
Discount Earnings 198 1,271 1,469 198
TOTAL REVENUES 205,086 161,710 366,796 353,548
EXPENDITURES:
Contractual Services 295,182 14,020 309,202 187,048 Other - - - 38,834 Bond Cost 236,232 - 236,232 236,233 Capital Outlay 6,653,460 5,836,170 12,489,630 16,994,909
TOTAL EXPENDITURES 7,184,874 5,850,190 13,035,064 17,457,024
Excess (Deficiency) of Revenues
Over (Under) Expenditures (6,979,788) (5,688,480) (12,668,268) (17,103,476)
OTHER FINANCING SOURCES (USES):
Proceeds - Long Term Debt 14,810,000 - 14,810,000 14,810,000 Bond Premium 2,293,476 - 2,293,476 2,293,476
TOTAL OTHER FINANCING SOURCES: 17,103,476 - 17,103,476 17,103,476
Net Change in Fund Balances 10,123,688 (5,688,480) 4,435,208 -
Fund Balances-Beginning 10,123,688
Fund Balances-Ending 4,435,208
178
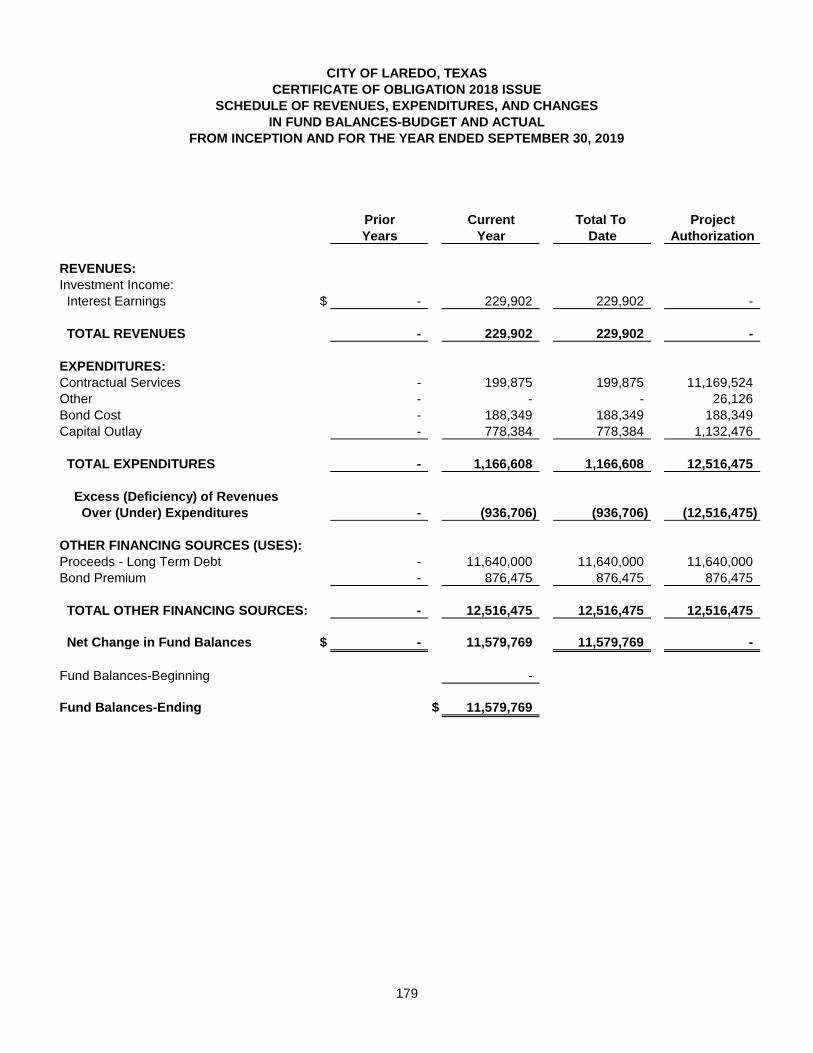
CITY OF LAREDO, TEXAS
CERTIFICATE OF OBLIGATION 2018 ISSUE
SCHEDULE OF REVENUES, EXPENDITURES, AND CHANGES
IN FUND BALANCES-BUDGET AND ACTUAL
FROM INCEPTION AND FOR THE YEAR ENDED SEPTEMBER 30, 2019
Prior Current Total To Project
Years Year Date Authorization
REVENUES:
Investment Income: Interest Earnings $ - 229,902 229,902 -
TOTAL REVENUES - 229,902 229,902 -
EXPENDITURES:
Contractual Services - 199,875 199,875 11,169,524 Other - - - 26,126 Bond Cost - 188,349 188,349 188,349 Capital Outlay - 778,384 778,384 1,132,476
TOTAL EXPENDITURES - 1,166,608 1,166,608 12,516,475
Excess (Deficiency) of Revenues
Over (Under) Expenditures - (936,706) (936,706) (12,516,475)
OTHER FINANCING SOURCES (USES):
Proceeds - Long Term Debt - 11,640,000 11,640,000 11,640,000 Bond Premium - 876,475 876,475 876,475
TOTAL OTHER FINANCING SOURCES: - 12,516,475 12,516,475 12,516,475
Net Change in Fund Balances $ - 11,579,769 11,579,769 -
Fund Balances-Beginning -
Fund Balances-Ending $ 11,579,769
179
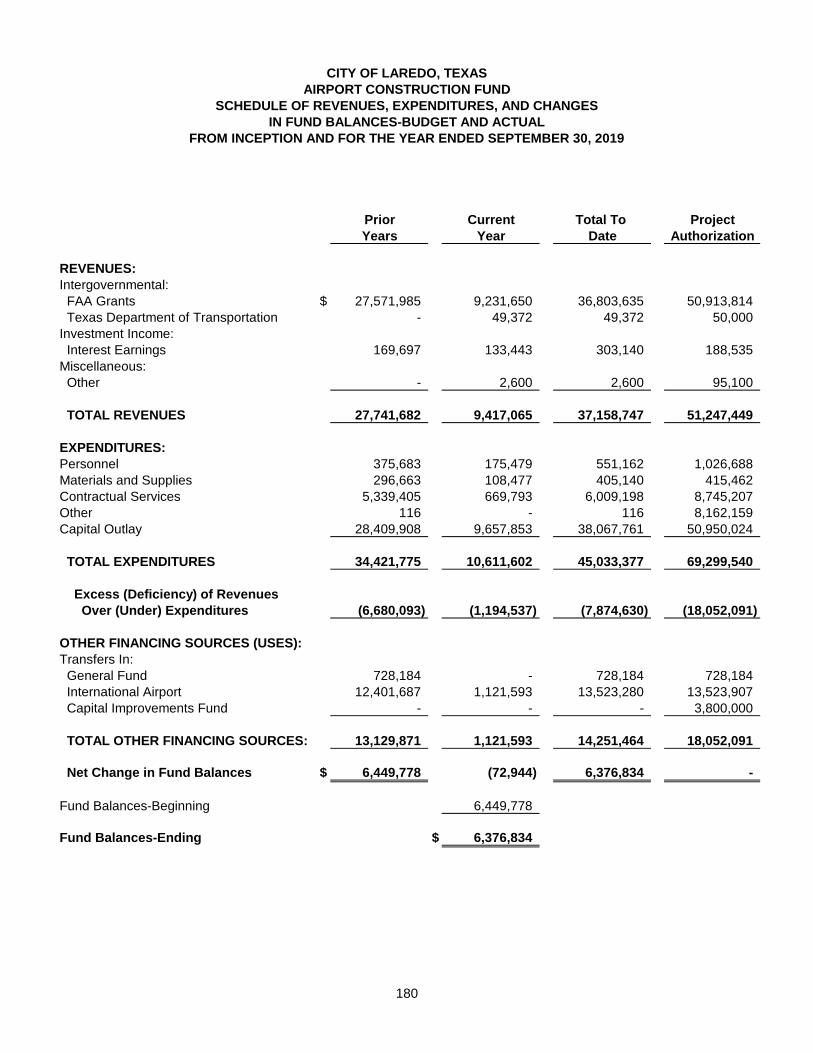
CITY OF LAREDO, TEXAS
AIRPORT CONSTRUCTION FUND
SCHEDULE OF REVENUES, EXPENDITURES, AND CHANGES
IN FUND BALANCES-BUDGET AND ACTUAL
FROM INCEPTION AND FOR THE YEAR ENDED SEPTEMBER 30, 2019
Prior Current Total To Project
Years Year Date Authorization
REVENUES:
Intergovernmental: FAA Grants $ 27,571,985 9,231,650 36,803,635 50,913,814 Texas Department of Transportation - 49,372 49,372 50,000 Investment Income: Interest Earnings 169,697 133,443 303,140 188,535 Miscellaneous: Other - 2,600 2,600 95,100
TOTAL REVENUES 27,741,682 9,417,065 37,158,747 51,247,449
EXPENDITURES:
Personnel 375,683 175,479 551,162 1,026,688 Materials and Supplies 296,663 108,477 405,140 415,462 Contractual Services 5,339,405 669,793 6,009,198 8,745,207 Other 116 - 116 8,162,159 Capital Outlay 28,409,908 9,657,853 38,067,761 50,950,024
TOTAL EXPENDITURES 34,421,775 10,611,602 45,033,377 69,299,540
Excess (Deficiency) of Revenues
Over (Under) Expenditures (6,680,093) (1,194,537) (7,874,630) (18,052,091)
OTHER FINANCING SOURCES (USES):
Transfers In: General Fund 728,184 - 728,184 728,184 International Airport 12,401,687 1,121,593 13,523,280 13,523,907 Capital Improvements Fund - - - 3,800,000
TOTAL OTHER FINANCING SOURCES: 13,129,871 1,121,593 14,251,464 18,052,091
Net Change in Fund Balances $ 6,449,778 (72,944) 6,376,834 -
Fund Balances-Beginning 6,449,778
Fund Balances-Ending $ 6,376,834
180
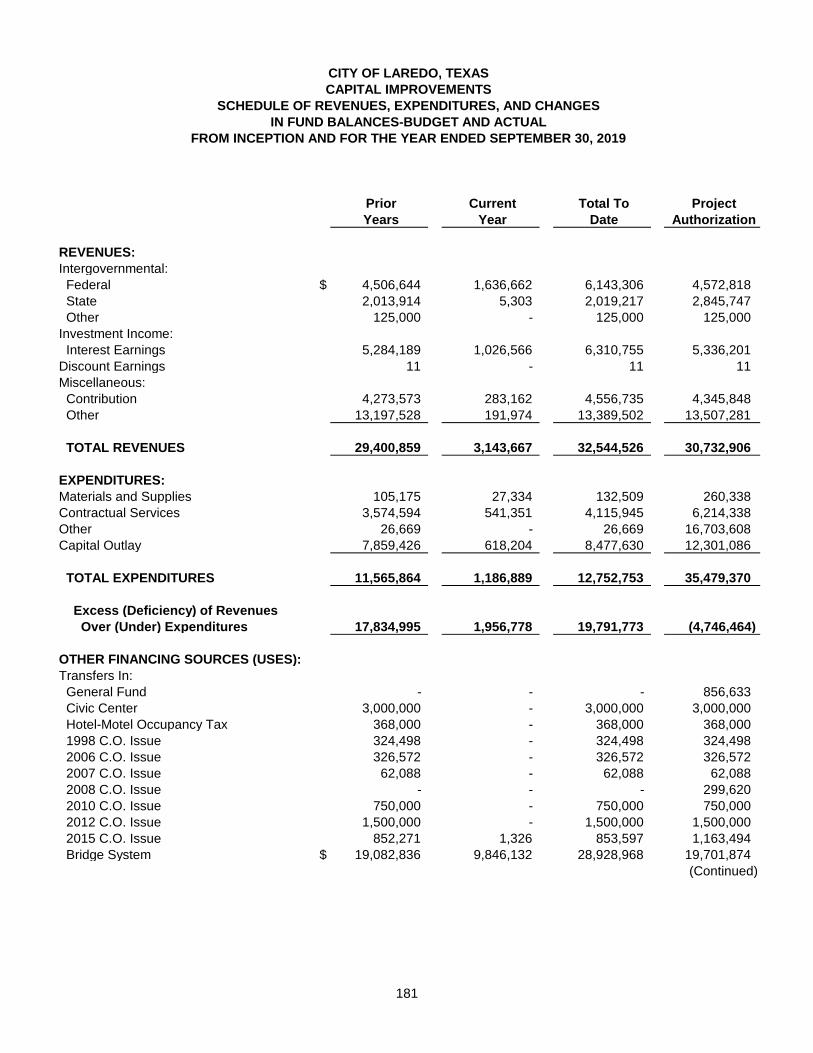
CITY OF LAREDO, TEXAS
CAPITAL IMPROVEMENTS
SCHEDULE OF REVENUES, EXPENDITURES, AND CHANGES
IN FUND BALANCES-BUDGET AND ACTUAL
FROM INCEPTION AND FOR THE YEAR ENDED SEPTEMBER 30, 2019
Prior Current Total To Project
Years Year Date Authorization
REVENUES:
Intergovernmental: Federal
$ 4,506,644 1,636,662 6,143,306 4,572,818
State 2,013,914 5,303 2,019,217 2,845,747 Other 125,000 - 125,000 125,000 Investment Income: Interest Earnings 5,284,189 1,026,566 6,310,755 5,336,201 Discount Earnings 11 - 11 11 Miscellaneous: Contribution 4,273,573 283,162 4,556,735 4,345,848 Other 13,197,528 191,974 13,389,502 13,507,281
TOTAL REVENUES 29,400,859 3,143,667 32,544,526 30,732,906
EXPENDITURES:
Materials and Supplies 105,175 27,334 132,509 260,338 Contractual Services 3,574,594 541,351 4,115,945 6,214,338 Other 26,669 - 26,669 16,703,608 Capital Outlay 7,859,426 618,204 8,477,630 12,301,086
TOTAL EXPENDITURES 11,565,864 1,186,889 12,752,753 35,479,370
Excess (Deficiency) of Revenues
Over (Under) Expenditures 17,834,995 1,956,778 19,791,773 (4,746,464)
OTHER FINANCING SOURCES (USES):
Transfers In: General Fund - - - 856,633 Civic Center 3,000,000 - 3,000,000 3,000,000 Hotel-Motel Occupancy Tax 368,000 - 368,000 368,000 1998 C.O. Issue 324,498 - 324,498 324,498 2006 C.O. Issue 326,572 - 326,572 326,572 2007 C.O. Issue 62,088 - 62,088 62,088 2008 C.O. Issue - - - 299,620 2010 C.O. Issue 750,000 - 750,000 750,000 2012 C.O. Issue 1,500,000 - 1,500,000 1,500,000 2015 C.O. Issue 852,271 1,326 853,597 1,163,494 Bridge System
$ 19,082,836 9,846,132 28,928,968 19,701,874
(Continued)
181
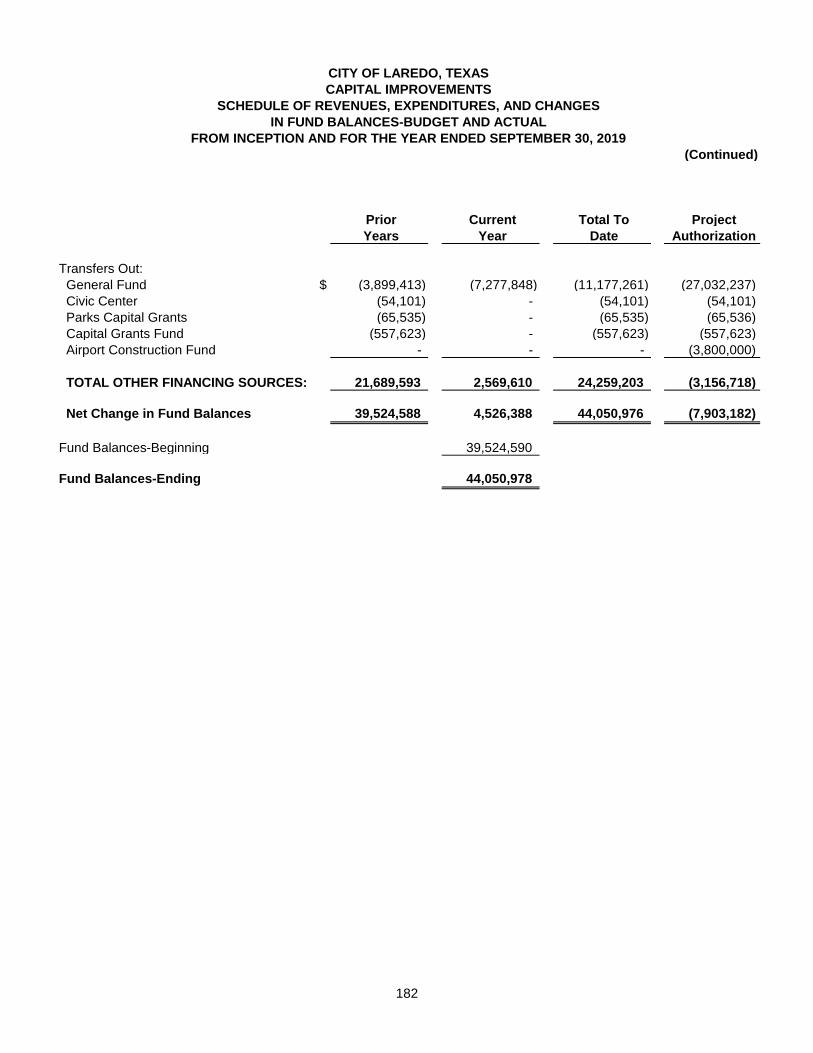
CITY OF LAREDO, TEXAS
CAPITAL IMPROVEMENTS
SCHEDULE OF REVENUES, EXPENDITURES, AND CHANGES
IN FUND BALANCES-BUDGET AND ACTUAL
FROM INCEPTION AND FOR THE YEAR ENDED SEPTEMBER 30, 2019
(Continued)
Prior Current Total To Project
Years Year Date Authorization
Transfers Out: General Fund
$ (3,899,413) (7,277,848) (11,177,261) (27,032,237)
Civic Center (54,101) - (54,101) (54,101) Parks Capital Grants (65,535) - (65,535) (65,536) Capital Grants Fund (557,623) - (557,623) (557,623) Airport Construction Fund - - - (3,800,000)
TOTAL OTHER FINANCING SOURCES: 21,689,593 2,569,610 24,259,203 (3,156,718)
Net Change in Fund Balances 39,524,588 4,526,388 44,050,976 (7,903,182)
Fund Balances-Beginning 39,524,590
Fund Balances-Ending 44,050,978
182
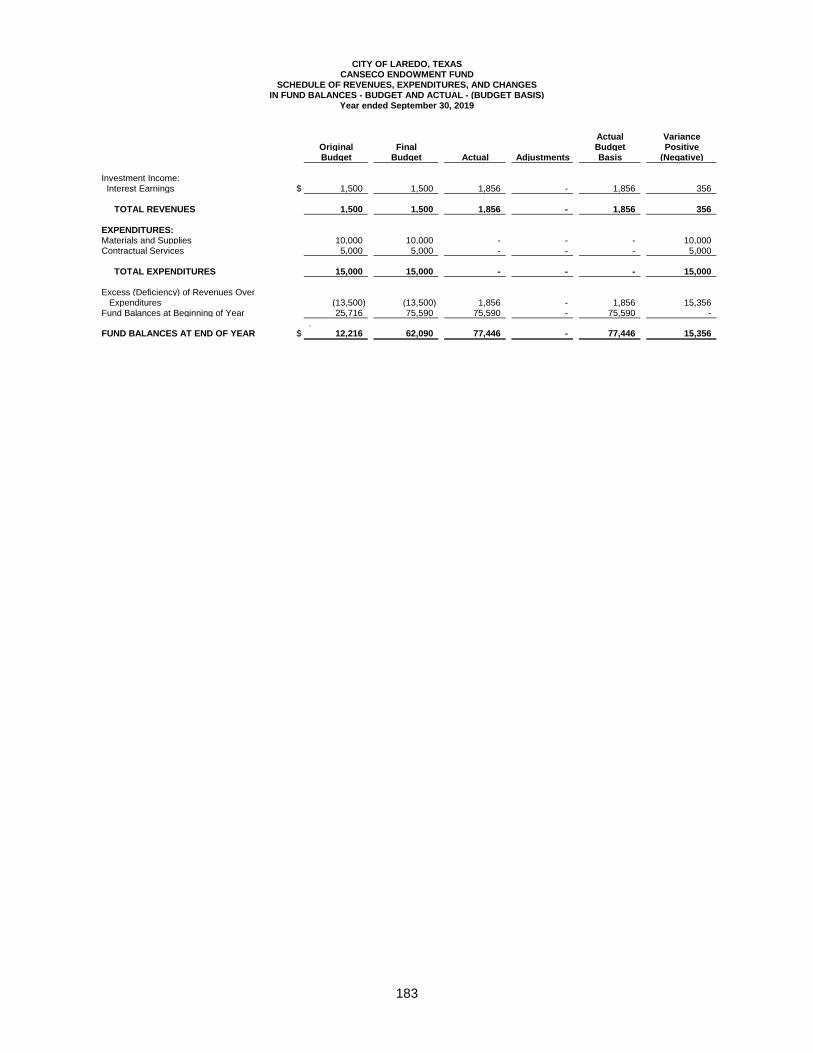
CITY OF LAREDO, TEXASCANSECO ENDOWMENT FUND
SCHEDULE OF REVENUES, EXPENDITURES, AND CHANGESIN FUND BALANCES - BUDGET AND ACTUAL - (BUDGET BASIS)
Year ended September 30, 2019
Actual VarianceOriginal Final Budget PositiveBudget Budget Actual Adjustments Basis (Negative)
Investment Income: Interest Earnings $ 1,500 1,500 1,856 - 1,856 356 TOTAL REVENUES 1,500 1,500 1,856 - 1,856 356
EXPENDITURES:Materials and Supplies 10,000 10,000 - - - 10,000 Contractual Services 5,000 5,000 - - - 5,000 TOTAL EXPENDITURES 15,000 15,000 - - - 15,000 Excess (Deficiency) of Revenues Over Expenditures (13,500) (13,500) 1,856 - 1,856 15,356 Fund Balances at Beginning of Year 25,716 75,590 75,590 - 75,590 - .FUND BALANCES AT END OF YEAR $ 12,216 62,090 77,446 - 77,446 15,356
183

This page intentionally left blank
184
INTERNAL SERVICE FUNDS
INTERNAL SERVICE FUNDS
Internal Service funds account for the financing of goods or services provided by one City department or agency to other City departments or agencies, or to other governmental entities, on a cost- reimbursement basis. Internal Service Funds include: RISK MANAGEMENT FUND - to account for the transactions related to the partial
self-insurance plan for medical coverage for City employees. HEALTH AND BENEFITS FUND - to account for all expenses associated with the
City's partially self-funded health benefits program. FLEET MANAGEMENT - to account for the providing of fuel and repair services to all
city owned vehicles and machinery, on a cost reimbursement basis. INFORMATION TECHNOLOGY - to account for the providing of
telecommunications services, iSeries technical support, and network technical support.
185
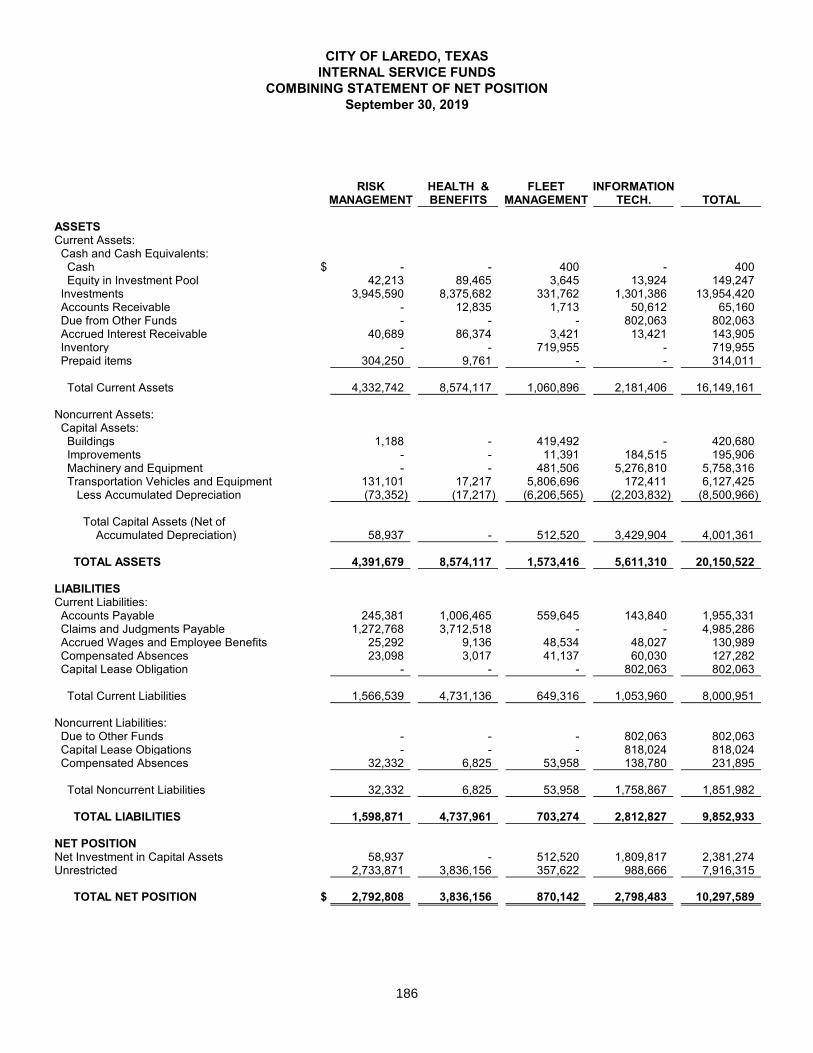
CITY OF LAREDO, TEXASINTERNAL SERVICE FUNDS
COMBINING STATEMENT OF NET POSITIONSeptember 30, 2019
RISK HEALTH & FLEET INFORMATIONMANAGEMENT BENEFITS MANAGEMENT TECH. TOTAL
ASSETSCurrent Assets: Cash and Cash Equivalents: Cash $ - - 400 - 400 Equity in Investment Pool 42,213 89,465 3,645 13,924 149,247 Investments 3,945,590 8,375,682 331,762 1,301,386 13,954,420 Accounts Receivable - 12,835 1,713 50,612 65,160 Due from Other Funds - - - 802,063 802,063 Accrued Interest Receivable 40,689 86,374 3,421 13,421 143,905 Inventory - - 719,955 - 719,955 Prepaid items 304,250 9,761 - - 314,011
Total Current Assets 4,332,742 8,574,117 1,060,896 2,181,406 16,149,161
Noncurrent Assets: Capital Assets: Buildings 1,188 - 419,492 - 420,680 Improvements - - 11,391 184,515 195,906 Machinery and Equipment - - 481,506 5,276,810 5,758,316 Transportation Vehicles and Equipment 131,101 17,217 5,806,696 172,411 6,127,425 Less Accumulated Depreciation (73,352) (17,217) (6,206,565) (2,203,832) (8,500,966)
Total Capital Assets (Net of Accumulated Depreciation) 58,937 - 512,520 3,429,904 4,001,361
TOTAL ASSETS 4,391,679 8,574,117 1,573,416 5,611,310 20,150,522
LIABILITIESCurrent Liabilities: Accounts Payable 245,381 1,006,465 559,645 143,840 1,955,331 Claims and Judgments Payable 1,272,768 3,712,518 - - 4,985,286 Accrued Wages and Employee Benefits 25,292 9,136 48,534 48,027 130,989 Compensated Absences 23,098 3,017 41,137 60,030 127,282 Capital Lease Obligation - - - 802,063 802,063
Total Current Liabilities 1,566,539 4,731,136 649,316 1,053,960 8,000,951
Noncurrent Liabilities: Due to Other Funds - - - 802,063 802,063 Capital Lease Obigations - - - 818,024 818,024 Compensated Absences 32,332 6,825 53,958 138,780 231,895
Total Noncurrent Liabilities 32,332 6,825 53,958 1,758,867 1,851,982
TOTAL LIABILITIES 1,598,871 4,737,961 703,274 2,812,827 9,852,933
NET POSITIONNet Investment in Capital Assets 58,937 - 512,520 1,809,817 2,381,274 Unrestricted 2,733,871 3,836,156 357,622 988,666 7,916,315
TOTAL NET POSITION $ 2,792,808 3,836,156 870,142 2,798,483 10,297,589
186
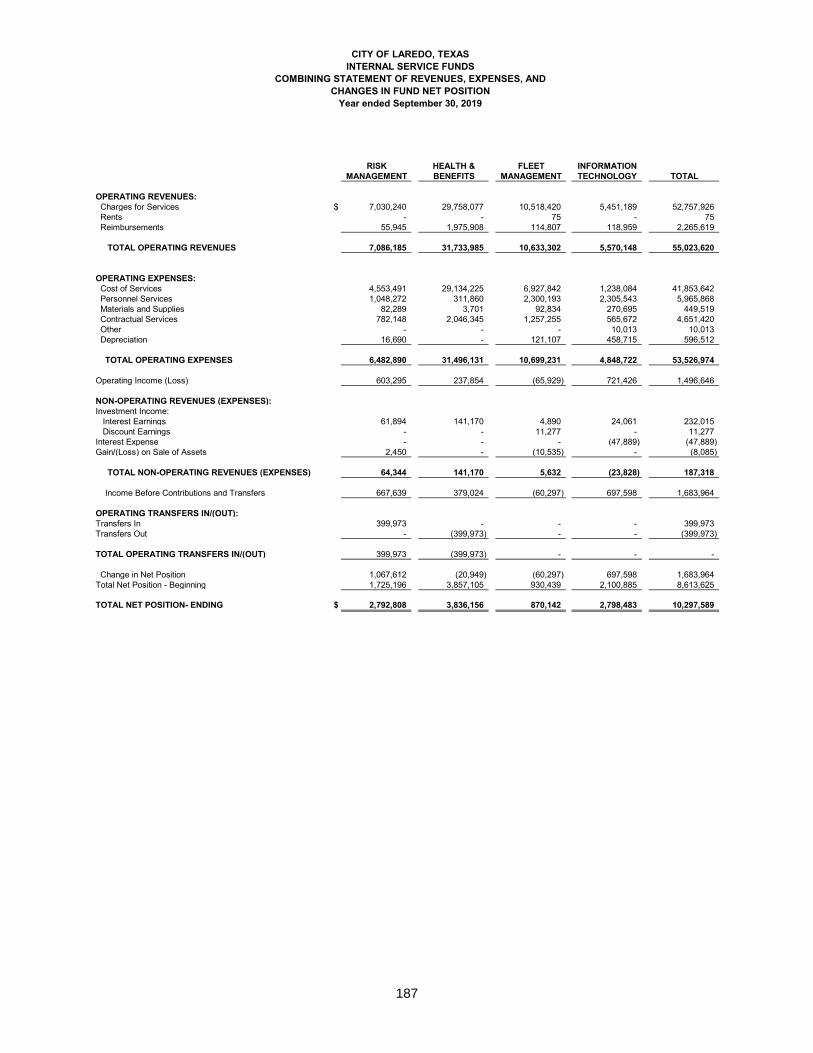
CITY OF LAREDO, TEXASINTERNAL SERVICE FUNDS
COMBINING STATEMENT OF REVENUES, EXPENSES, ANDCHANGES IN FUND NET POSITION
Year ended September 30, 2019
RISK HEALTH & FLEET INFORMATIONMANAGEMENT BENEFITS MANAGEMENT TECHNOLOGY TOTAL
OPERATING REVENUES: Charges for Services $ 7,030,240 29,758,077 10,518,420 5,451,189 52,757,926 Rents - - 75 - 75 Reimbursements 55,945 1,975,908 114,807 118,959 2,265,619
TOTAL OPERATING REVENUES 7,086,185 31,733,985 10,633,302 5,570,148 55,023,620
OPERATING EXPENSES: Cost of Services 4,553,491 29,134,225 6,927,842 1,238,084 41,853,642 Personnel Services 1,048,272 311,860 2,300,193 2,305,543 5,965,868 Materials and Supplies 82,289 3,701 92,834 270,695 449,519 Contractual Services 782,148 2,046,345 1,257,255 565,672 4,651,420 Other - - - 10,013 10,013 Depreciation 16,690 - 121,107 458,715 596,512
TOTAL OPERATING EXPENSES 6,482,890 31,496,131 10,699,231 4,848,722 53,526,974
Operating Income (Loss) 603,295 237,854 (65,929) 721,426 1,496,646
NON-OPERATING REVENUES (EXPENSES):Investment Income: Interest Earnings 61,894 141,170 4,890 24,061 232,015 Discount Earnings - - 11,277 - 11,277 Interest Expense - - - (47,889) (47,889) Gain/(Loss) on Sale of Assets 2,450 - (10,535) - (8,085)
TOTAL NON-OPERATING REVENUES (EXPENSES) 64,344 141,170 5,632 (23,828) 187,318
Income Before Contributions and Transfers 667,639 379,024 (60,297) 697,598 1,683,964
OPERATING TRANSFERS IN/(OUT):Transfers In 399,973 - - - 399,973 Transfers Out - (399,973) - - (399,973)
TOTAL OPERATING TRANSFERS IN/(OUT) 399,973 (399,973) - - -
Change in Net Position 1,067,612 (20,949) (60,297) 697,598 1,683,964 Total Net Position - Beginning 1,725,196 3,857,105 930,439 2,100,885 8,613,625
TOTAL NET POSITION- ENDING $ 2,792,808 3,836,156 870,142 2,798,483 10,297,589
187
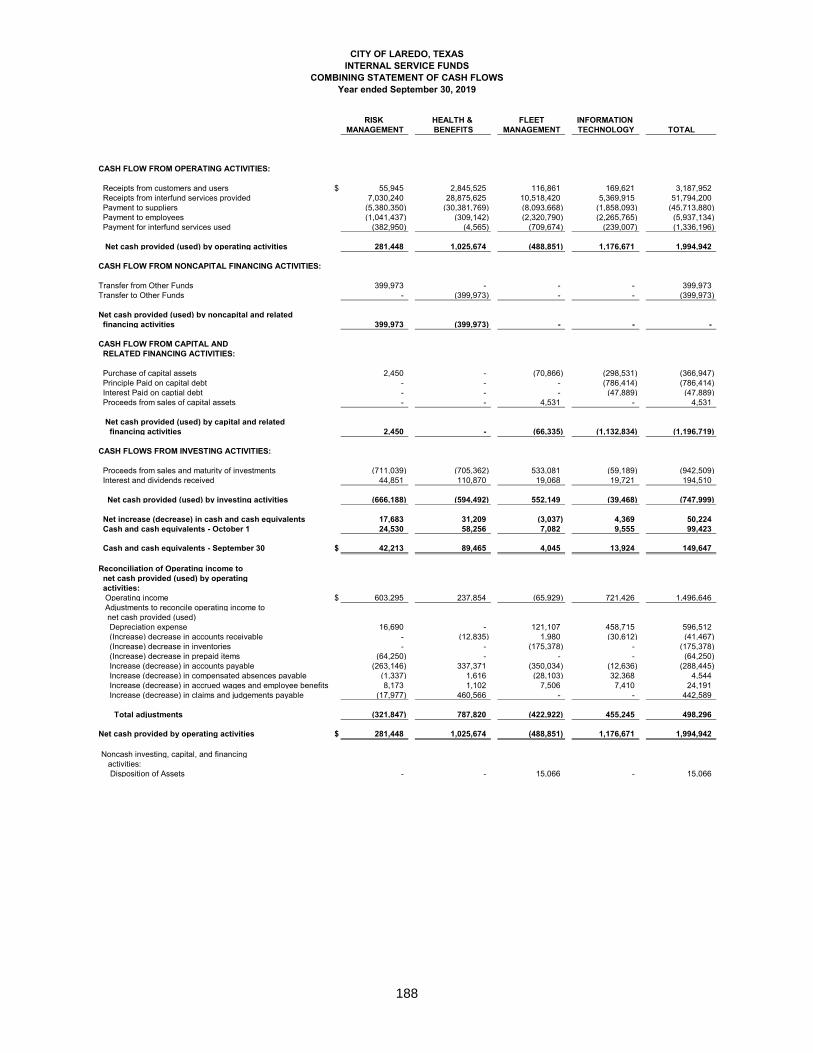
CITY OF LAREDO, TEXASINTERNAL SERVICE FUNDS
COMBINING STATEMENT OF CASH FLOWSYear ended September 30, 2019
RISK HEALTH & FLEET INFORMATION MANAGEMENT BENEFITS MANAGEMENT TECHNOLOGY TOTAL
CASH FLOW FROM OPERATING ACTIVITIES:
Receipts from customers and users $ 55,945 2,845,525 116,861 169,621 3,187,952 Receipts from interfund services provided 7,030,240 28,875,625 10,518,420 5,369,915 51,794,200 Payment to suppliers (5,380,350) (30,381,769) (8,093,668) (1,858,093) (45,713,880) Payment to employees (1,041,437) (309,142) (2,320,790) (2,265,765) (5,937,134) Payment for interfund services used (382,950) (4,565) (709,674) (239,007) (1,336,196)
Net cash provided (used) by operating activities 281,448 1,025,674 (488,851) 1,176,671 1,994,942
CASH FLOW FROM NONCAPITAL FINANCING ACTIVITIES:
Transfer from Other Funds 399,973 - - - 399,973 Transfer to Other Funds - (399,973) - - (399,973)
Net cash provided (used) by noncapital and related financing activities 399,973 (399,973) - - -
CASH FLOW FROM CAPITAL AND RELATED FINANCING ACTIVITIES:
Purchase of capital assets 2,450 - (70,866) (298,531) (366,947) Principle Paid on capital debt - - - (786,414) (786,414) Interest Paid on captial debt - - - (47,889) (47,889) Proceeds from sales of capital assets - - 4,531 - 4,531
Net cash provided (used) by capital and related financing activities 2,450 - (66,335) (1,132,834) (1,196,719)
CASH FLOWS FROM INVESTING ACTIVITIES:
Proceeds from sales and maturity of investments (711,039) (705,362) 533,081 (59,189) (942,509) Interest and dividends received 44,851 110,870 19,068 19,721 194,510
Net cash provided (used) by investing activities (666,188) (594,492) 552,149 (39,468) (747,999)
Net increase (decrease) in cash and cash equivalents 17,683 31,209 (3,037) 4,369 50,224 Cash and cash equivalents - October 1 24,530 58,256 7,082 9,555 99,423
Cash and cash equivalents - September 30 $ 42,213 89,465 4,045 13,924 149,647
Reconciliation of Operating income to net cash provided (used) by operating activities: Operating income $ 603,295 237,854 (65,929) 721,426 1,496,646 Adjustments to reconcile operating income to net cash provided (used) Depreciation expense 16,690 - 121,107 458,715 596,512 (Increase) decrease in accounts receivable - (12,835) 1,980 (30,612) (41,467) (Increase) decrease in inventories - - (175,378) - (175,378) (Increase) decrease in prepaid items (64,250) - - - (64,250) Increase (decrease) in accounts payable (263,146) 337,371 (350,034) (12,636) (288,445) Increase (decrease) in compensated absences payable (1,337) 1,616 (28,103) 32,368 4,544 Increase (decrease) in accrued wages and employee benefits 8,173 1,102 7,506 7,410 24,191 Increase (decrease) in claims and judgements payable (17,977) 460,566 - - 442,589
Total adjustments (321,847) 787,820 (422,922) 455,245 498,296
Net cash provided by operating activities $ 281,448 1,025,674 (488,851) 1,176,671 1,994,942
Noncash investing, capital, and financing activities: Disposition of Assets - - 15,066 - 15,066
188

This page intentionally left blank
189
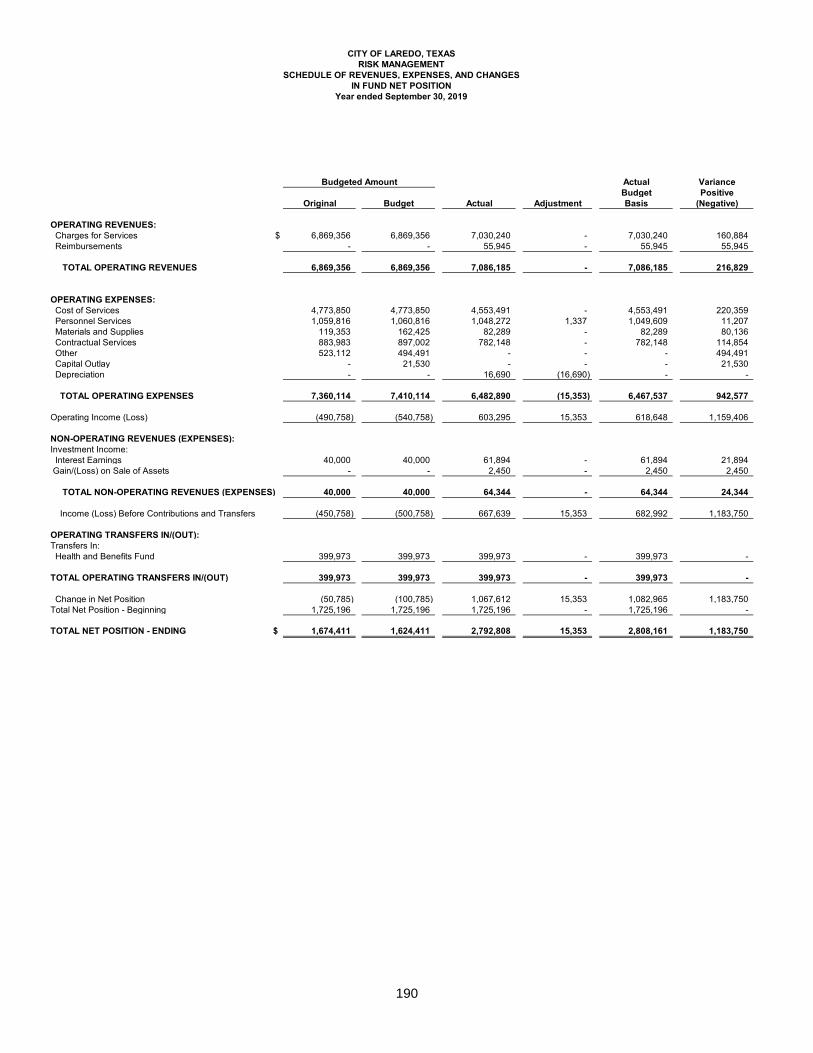
CITY OF LAREDO, TEXASRISK MANAGEMENT
SCHEDULE OF REVENUES, EXPENSES, AND CHANGESIN FUND NET POSITION
Year ended September 30, 2019
Actual Variance Budget Positive
Original Budget Actual Adjustment Basis (Negative)
OPERATING REVENUES: Charges for Services $ 6,869,356 6,869,356 7,030,240 - 7,030,240 160,884 Reimbursements - - 55,945 - 55,945 55,945
TOTAL OPERATING REVENUES 6,869,356 6,869,356 7,086,185 - 7,086,185 216,829
OPERATING EXPENSES: Cost of Services 4,773,850 4,773,850 4,553,491 - 4,553,491 220,359 Personnel Services 1,059,816 1,060,816 1,048,272 1,337 1,049,609 11,207 Materials and Supplies 119,353 162,425 82,289 - 82,289 80,136 Contractual Services 883,983 897,002 782,148 - 782,148 114,854 Other 523,112 494,491 - - - 494,491 Capital Outlay - 21,530 - - - 21,530 Depreciation - - 16,690 (16,690) - -
TOTAL OPERATING EXPENSES 7,360,114 7,410,114 6,482,890 (15,353) 6,467,537 942,577
Operating Income (Loss) (490,758) (540,758) 603,295 15,353 618,648 1,159,406
NON-OPERATING REVENUES (EXPENSES):Investment Income: Interest Earnings 40,000 40,000 61,894 - 61,894 21,894 Gain/(Loss) on Sale of Assets - - 2,450 - 2,450 2,450
TOTAL NON-OPERATING REVENUES (EXPENSES) 40,000 40,000 64,344 - 64,344 24,344
Income (Loss) Before Contributions and Transfers (450,758) (500,758) 667,639 15,353 682,992 1,183,750
OPERATING TRANSFERS IN/(OUT):Transfers In: Health and Benefits Fund 399,973 399,973 399,973 - 399,973 -
TOTAL OPERATING TRANSFERS IN/(OUT) 399,973 399,973 399,973 - 399,973 -
Change in Net Position (50,785) (100,785) 1,067,612 15,353 1,082,965 1,183,750 Total Net Position - Beginning 1,725,196 1,725,196 1,725,196 - 1,725,196 -
TOTAL NET POSITION - ENDING $ 1,674,411 1,624,411 2,792,808 15,353 2,808,161 1,183,750
Budgeted Amount
190
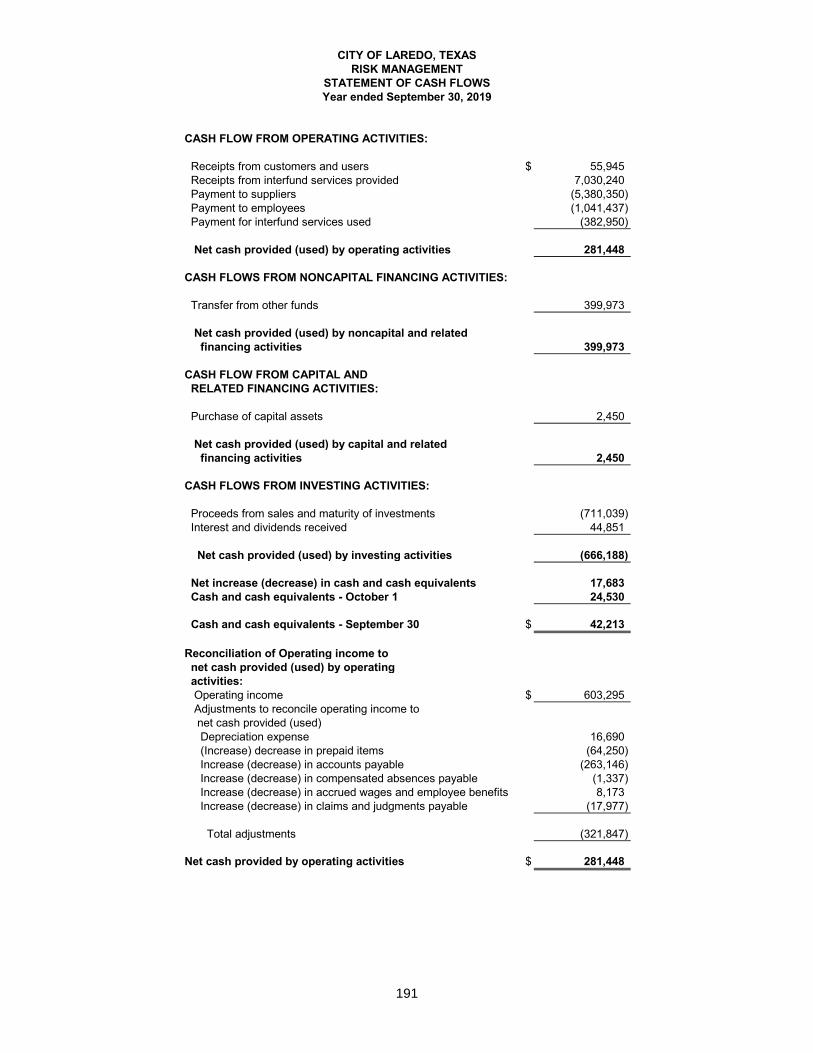
CITY OF LAREDO, TEXASRISK MANAGEMENT
STATEMENT OF CASH FLOWSYear ended September 30, 2019
CASH FLOW FROM OPERATING ACTIVITIES:
Receipts from customers and users $ 55,945 Receipts from interfund services provided 7,030,240 Payment to suppliers (5,380,350) Payment to employees (1,041,437) Payment for interfund services used (382,950)
Net cash provided (used) by operating activities 281,448
CASH FLOWS FROM NONCAPITAL FINANCING ACTIVITIES:
Transfer from other funds 399,973
Net cash provided (used) by noncapital and related financing activities 399,973
CASH FLOW FROM CAPITAL AND RELATED FINANCING ACTIVITIES:
Purchase of capital assets 2,450
Net cash provided (used) by capital and related financing activities 2,450
CASH FLOWS FROM INVESTING ACTIVITIES:
Proceeds from sales and maturity of investments (711,039) Interest and dividends received 44,851
Net cash provided (used) by investing activities (666,188)
Net increase (decrease) in cash and cash equivalents 17,683 Cash and cash equivalents - October 1 24,530
Cash and cash equivalents - September 30 $ 42,213
Reconciliation of Operating income to net cash provided (used) by operating activities: Operating income $ 603,295 Adjustments to reconcile operating income to net cash provided (used) Depreciation expense 16,690 (Increase) decrease in prepaid items (64,250) Increase (decrease) in accounts payable (263,146) Increase (decrease) in compensated absences payable (1,337) Increase (decrease) in accrued wages and employee benefits 8,173 Increase (decrease) in claims and judgments payable (17,977)
Total adjustments (321,847)
Net cash provided by operating activities $ 281,448
191
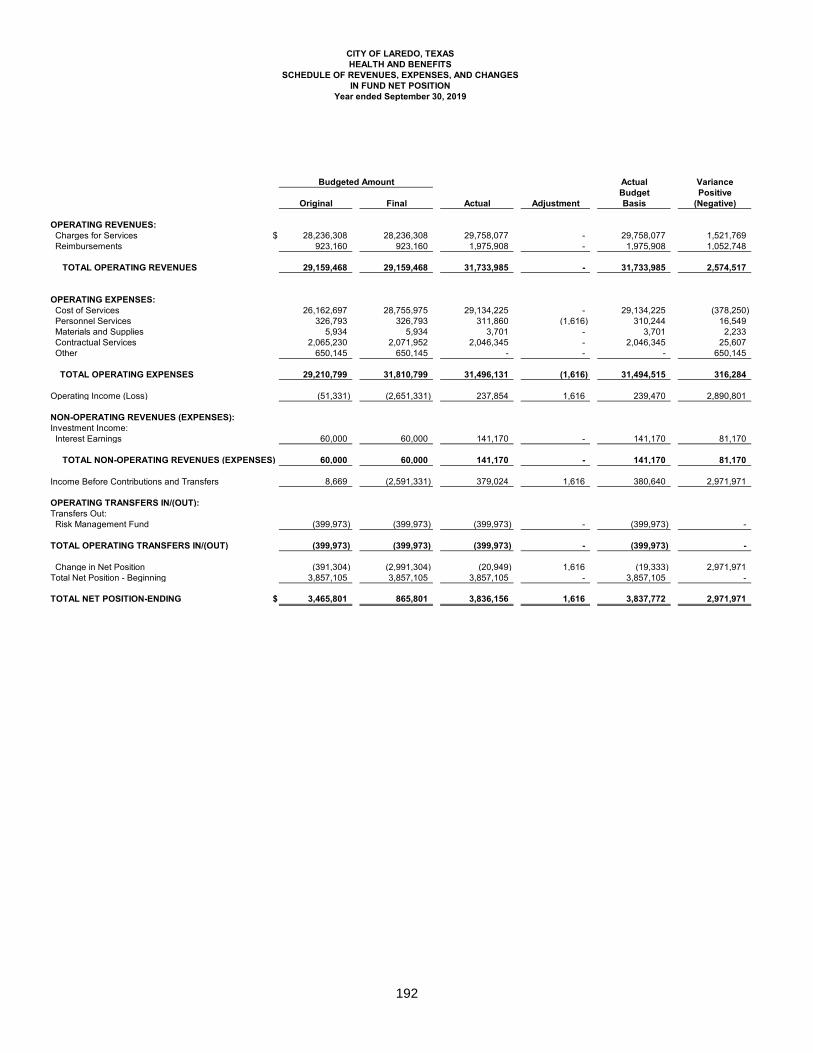
CITY OF LAREDO, TEXASHEALTH AND BENEFITS
SCHEDULE OF REVENUES, EXPENSES, AND CHANGESIN FUND NET POSITION
Year ended September 30, 2019
Actual VarianceBudget Positive
Original Final Actual Adjustment Basis (Negative)
OPERATING REVENUES: Charges for Services $ 28,236,308 28,236,308 29,758,077 - 29,758,077 1,521,769 Reimbursements 923,160 923,160 1,975,908 - 1,975,908 1,052,748
TOTAL OPERATING REVENUES 29,159,468 29,159,468 31,733,985 - 31,733,985 2,574,517
OPERATING EXPENSES: Cost of Services 26,162,697 28,755,975 29,134,225 - 29,134,225 (378,250) Personnel Services 326,793 326,793 311,860 (1,616) 310,244 16,549 Materials and Supplies 5,934 5,934 3,701 - 3,701 2,233 Contractual Services 2,065,230 2,071,952 2,046,345 - 2,046,345 25,607 Other 650,145 650,145 - - - 650,145
TOTAL OPERATING EXPENSES 29,210,799 31,810,799 31,496,131 (1,616) 31,494,515 316,284
Operating Income (Loss) (51,331) (2,651,331) 237,854 1,616 239,470 2,890,801
NON-OPERATING REVENUES (EXPENSES):Investment Income: Interest Earnings 60,000 60,000 141,170 - 141,170 81,170
TOTAL NON-OPERATING REVENUES (EXPENSES) 60,000 60,000 141,170 - 141,170 81,170
Income Before Contributions and Transfers 8,669 (2,591,331) 379,024 1,616 380,640 2,971,971
OPERATING TRANSFERS IN/(OUT):Transfers Out: Risk Management Fund (399,973) (399,973) (399,973) - (399,973) -
TOTAL OPERATING TRANSFERS IN/(OUT) (399,973) (399,973) (399,973) - (399,973) -
Change in Net Position (391,304) (2,991,304) (20,949) 1,616 (19,333) 2,971,971 Total Net Position - Beginning 3,857,105 3,857,105 3,857,105 - 3,857,105 -
TOTAL NET POSITION-ENDING $ 3,465,801 865,801 3,836,156 1,616 3,837,772 2,971,971
Budgeted Amount
192

CITY OF LAREDO, TEXASHEALTH AND BENEFITS
STATEMENT OF CASH FLOWSYear ended September 30, 2019
CASH FLOW FROM OPERATING ACTIVITIES:
Receipts from customers and users $ 2,845,525 Receipts from interfund services provided 28,875,625 Payment to suppliers (30,381,769) Payment to employees (309,142) Payment for interfund services used (4,565)
Net cash provided (used) by operating activities 1,025,674
CASH FLOWS FROM NONCAPITAL FINANCING ACTIVITIES:
Transfer to other funds (399,973)
Net cash provided (used) by noncapital and related financing activities (399,973)
CASH FLOWS FROM INVESTING ACTIVITIES:
Proceeds from sales and maturity of investments (705,362) Interest and dividends received 110,870
Net cash provided (used) by investing activities (594,492)
Net increase (decrease) in cash and cash equivalents 31,209 Cash and cash equivalents - October 1 58,256
Cash and cash equivalents - September 30 $ 89,465
Reconciliation of Operating income to net cash provided (used) by operating activities: Operating income $ 237,854 Adjustments to reconcile operating income to net cash provided (used) (Increase) decrease in accounts receivable (12,835) Increase (decrease) in accounts payable 337,371 Increase (decrease) in compensated absences payable 1,616 Increase (decrease) in accrued wages and employee benefits 1,102 Increase (decrease) in claims and judgements payable 460,566
Total adjustments 787,820
Net cash provided by operating activities $ 1,025,674
193
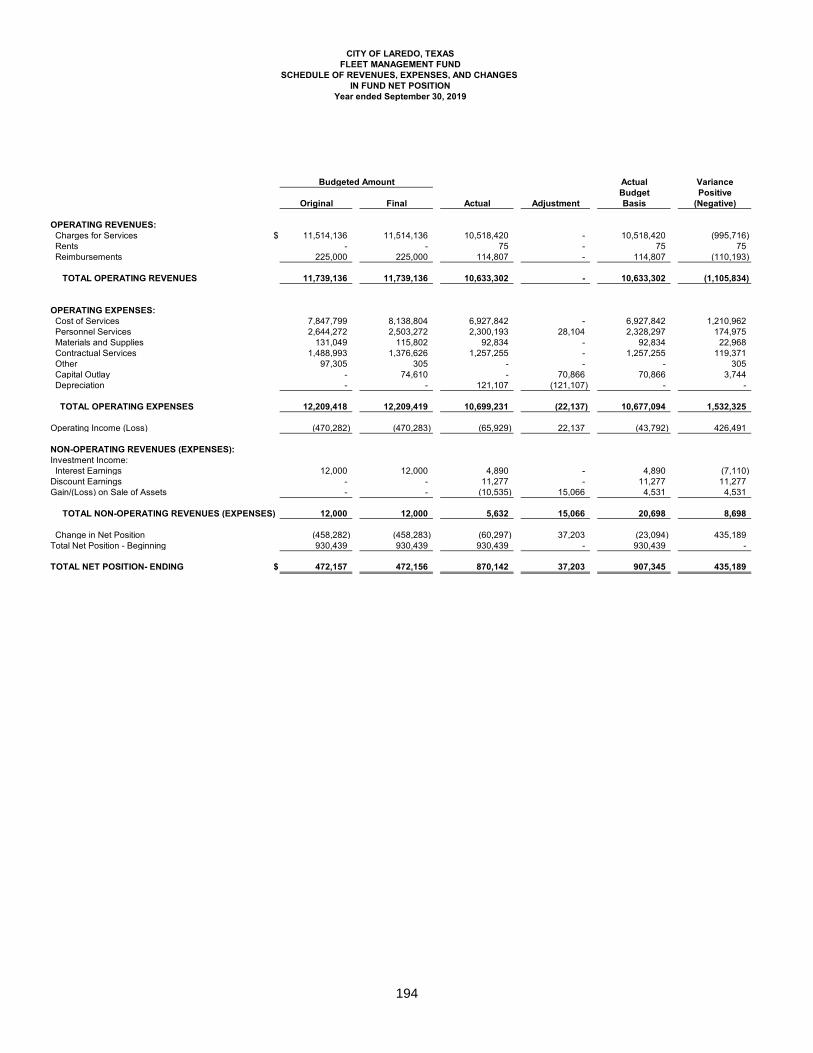
CITY OF LAREDO, TEXASFLEET MANAGEMENT FUND
SCHEDULE OF REVENUES, EXPENSES, AND CHANGES IN FUND NET POSITION
Year ended September 30, 2019
Budgeted Amount Actual VarianceBudget Positive
Original Final Actual Adjustment Basis (Negative)
OPERATING REVENUES: Charges for Services $ 11,514,136 11,514,136 10,518,420 - 10,518,420 (995,716) Rents - - 75 - 75 75 Reimbursements 225,000 225,000 114,807 - 114,807 (110,193)
TOTAL OPERATING REVENUES 11,739,136 11,739,136 10,633,302 - 10,633,302 (1,105,834)
OPERATING EXPENSES: Cost of Services 7,847,799 8,138,804 6,927,842 - 6,927,842 1,210,962 Personnel Services 2,644,272 2,503,272 2,300,193 28,104 2,328,297 174,975 Materials and Supplies 131,049 115,802 92,834 - 92,834 22,968 Contractual Services 1,488,993 1,376,626 1,257,255 - 1,257,255 119,371 Other 97,305 305 - - - 305 Capital Outlay - 74,610 - 70,866 70,866 3,744 Depreciation - - 121,107 (121,107) - -
TOTAL OPERATING EXPENSES 12,209,418 12,209,419 10,699,231 (22,137) 10,677,094 1,532,325
Operating Income (Loss) (470,282) (470,283) (65,929) 22,137 (43,792) 426,491
NON-OPERATING REVENUES (EXPENSES):Investment Income: Interest Earnings 12,000 12,000 4,890 - 4,890 (7,110) Discount Earnings - - 11,277 - 11,277 11,277 Gain/(Loss) on Sale of Assets - - (10,535) 15,066 4,531 4,531
TOTAL NON-OPERATING REVENUES (EXPENSES) 12,000 12,000 5,632 15,066 20,698 8,698
Change in Net Position (458,282) (458,283) (60,297) 37,203 (23,094) 435,189 Total Net Position - Beginning 930,439 930,439 930,439 - 930,439 -
TOTAL NET POSITION- ENDING $ 472,157 472,156 870,142 37,203 907,345 435,189
194
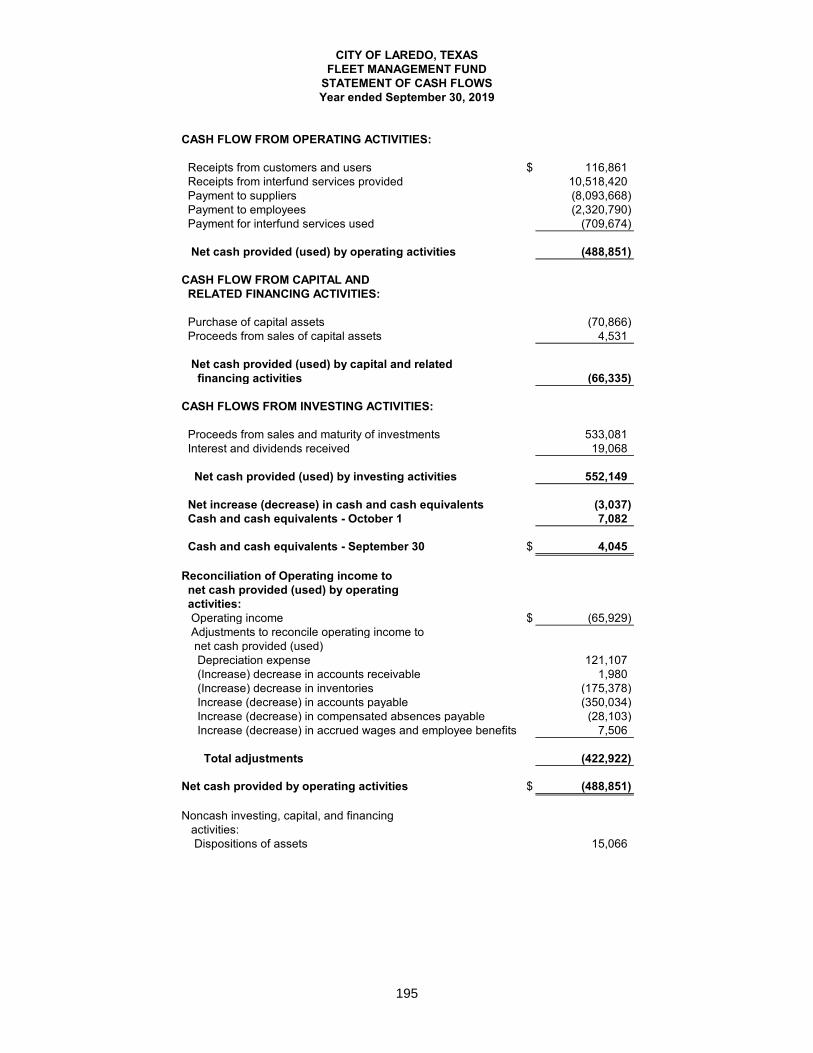
CITY OF LAREDO, TEXASFLEET MANAGEMENT FUND
STATEMENT OF CASH FLOWSYear ended September 30, 2019
CASH FLOW FROM OPERATING ACTIVITIES:
Receipts from customers and users $ 116,861 Receipts from interfund services provided 10,518,420 Payment to suppliers (8,093,668) Payment to employees (2,320,790) Payment for interfund services used (709,674)
Net cash provided (used) by operating activities (488,851)
CASH FLOW FROM CAPITAL AND RELATED FINANCING ACTIVITIES:
Purchase of capital assets (70,866) Proceeds from sales of capital assets 4,531
Net cash provided (used) by capital and related financing activities (66,335)
CASH FLOWS FROM INVESTING ACTIVITIES:
Proceeds from sales and maturity of investments 533,081 Interest and dividends received 19,068
Net cash provided (used) by investing activities 552,149
Net increase (decrease) in cash and cash equivalents (3,037) Cash and cash equivalents - October 1 7,082
Cash and cash equivalents - September 30 $ 4,045
Reconciliation of Operating income to net cash provided (used) by operating activities: Operating income $ (65,929) Adjustments to reconcile operating income to net cash provided (used) Depreciation expense 121,107 (Increase) decrease in accounts receivable 1,980 (Increase) decrease in inventories (175,378) Increase (decrease) in accounts payable (350,034) Increase (decrease) in compensated absences payable (28,103) Increase (decrease) in accrued wages and employee benefits 7,506
Total adjustments (422,922)
Net cash provided by operating activities $ (488,851)
Noncash investing, capital, and financing activities: Dispositions of assets 15,066
195
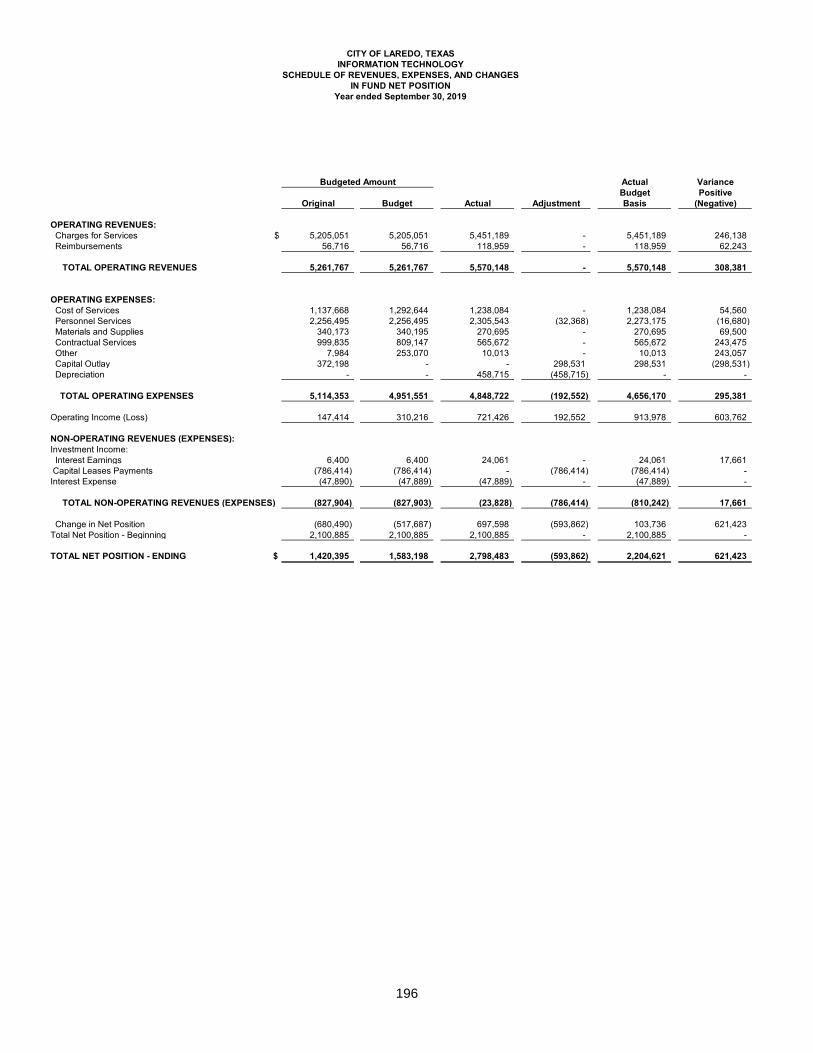
CITY OF LAREDO, TEXASINFORMATION TECHNOLOGY
SCHEDULE OF REVENUES, EXPENSES, AND CHANGESIN FUND NET POSITION
Year ended September 30, 2019
Actual Variance Budget Positive
Original Budget Actual Adjustment Basis (Negative)
OPERATING REVENUES: Charges for Services $ 5,205,051 5,205,051 5,451,189 - 5,451,189 246,138 Reimbursements 56,716 56,716 118,959 - 118,959 62,243
TOTAL OPERATING REVENUES 5,261,767 5,261,767 5,570,148 - 5,570,148 308,381
OPERATING EXPENSES: Cost of Services 1,137,668 1,292,644 1,238,084 - 1,238,084 54,560 Personnel Services 2,256,495 2,256,495 2,305,543 (32,368) 2,273,175 (16,680) Materials and Supplies 340,173 340,195 270,695 - 270,695 69,500 Contractual Services 999,835 809,147 565,672 - 565,672 243,475 Other 7,984 253,070 10,013 - 10,013 243,057 Capital Outlay 372,198 - - 298,531 298,531 (298,531) Depreciation - - 458,715 (458,715) - -
TOTAL OPERATING EXPENSES 5,114,353 4,951,551 4,848,722 (192,552) 4,656,170 295,381
Operating Income (Loss) 147,414 310,216 721,426 192,552 913,978 603,762
NON-OPERATING REVENUES (EXPENSES):Investment Income: Interest Earnings 6,400 6,400 24,061 - 24,061 17,661 Capital Leases Payments (786,414) (786,414) - (786,414) (786,414) - Interest Expense (47,890) (47,889) (47,889) - (47,889) -
TOTAL NON-OPERATING REVENUES (EXPENSES) (827,904) (827,903) (23,828) (786,414) (810,242) 17,661
Change in Net Position (680,490) (517,687) 697,598 (593,862) 103,736 621,423 Total Net Position - Beginning 2,100,885 2,100,885 2,100,885 - 2,100,885 -
TOTAL NET POSITION - ENDING $ 1,420,395 1,583,198 2,798,483 (593,862) 2,204,621 621,423
Budgeted Amount
196
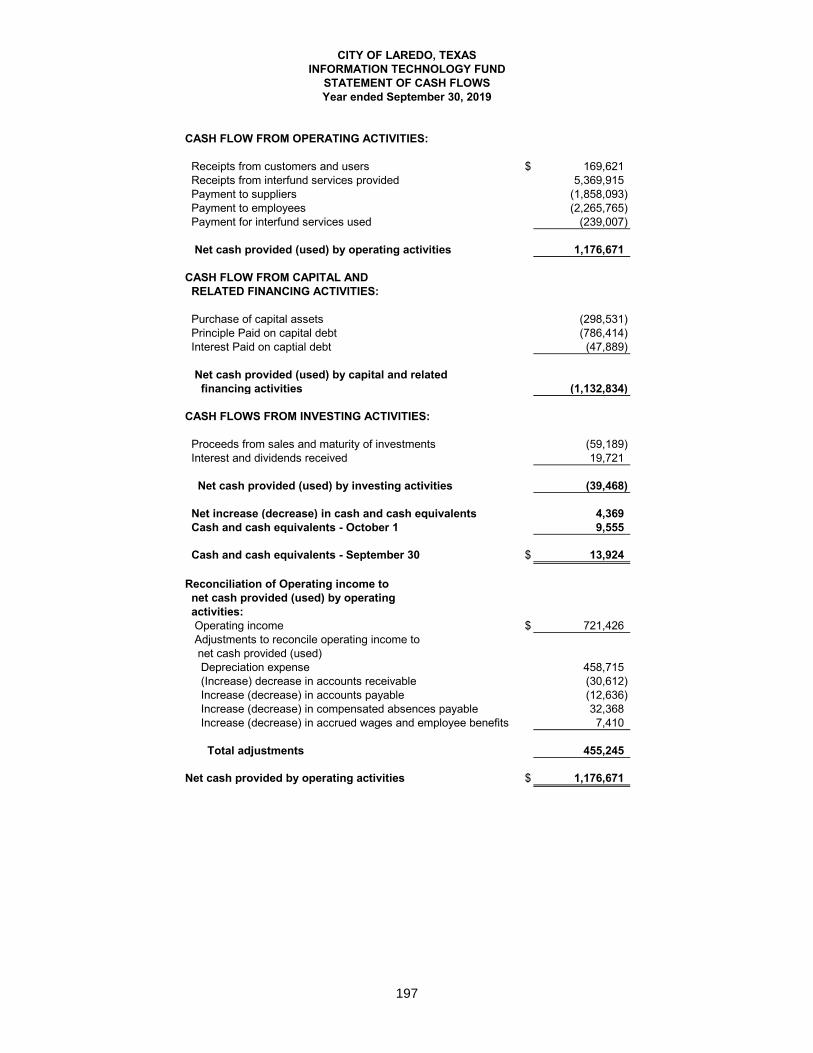
CITY OF LAREDO, TEXASINFORMATION TECHNOLOGY FUND
STATEMENT OF CASH FLOWSYear ended September 30, 2019
CASH FLOW FROM OPERATING ACTIVITIES:
Receipts from customers and users $ 169,621 Receipts from interfund services provided 5,369,915 Payment to suppliers (1,858,093) Payment to employees (2,265,765) Payment for interfund services used (239,007)
Net cash provided (used) by operating activities 1,176,671
CASH FLOW FROM CAPITAL AND RELATED FINANCING ACTIVITIES:
Purchase of capital assets (298,531) Principle Paid on capital debt (786,414) Interest Paid on captial debt (47,889)
Net cash provided (used) by capital and related financing activities (1,132,834)
CASH FLOWS FROM INVESTING ACTIVITIES:
Proceeds from sales and maturity of investments (59,189) Interest and dividends received 19,721
Net cash provided (used) by investing activities (39,468)
Net increase (decrease) in cash and cash equivalents 4,369 Cash and cash equivalents - October 1 9,555
Cash and cash equivalents - September 30 $ 13,924
Reconciliation of Operating income to net cash provided (used) by operating activities: Operating income $ 721,426 Adjustments to reconcile operating income to net cash provided (used) Depreciation expense 458,715 (Increase) decrease in accounts receivable (30,612) Increase (decrease) in accounts payable (12,636) Increase (decrease) in compensated absences payable 32,368 Increase (decrease) in accrued wages and employee benefits 7,410
Total adjustments 455,245
Net cash provided by operating activities $ 1,176,671
197

This page intentionally left blank
198

CAPITAL ASSETS
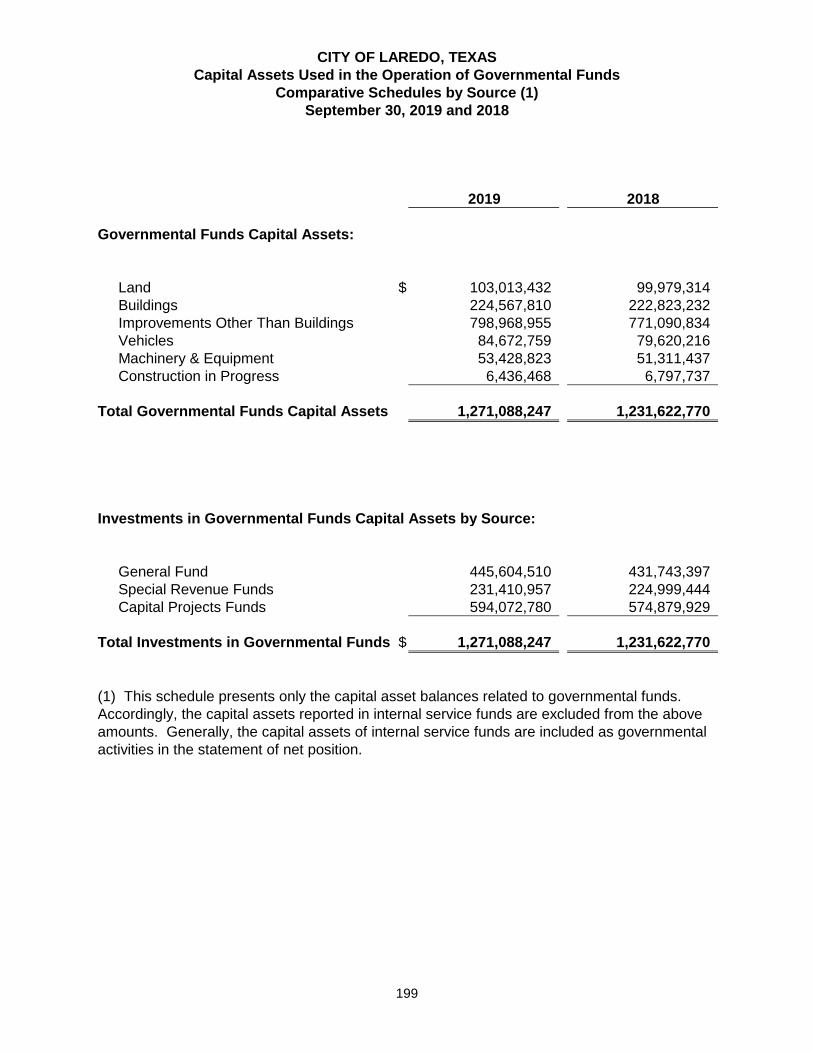
CITY OF LAREDO, TEXAS
Capital Assets Used in the Operation of Governmental Funds
September 30, 2019 and 2018
2019 2018
Governmental Funds Capital Assets:
Land $ 103,013,432 99,979,314 Buildings 224,567,810 222,823,232 Improvements Other Than Buildings 798,968,955 771,090,834 Vehicles 84,672,759 79,620,216 Machinery & Equipment 53,428,823 51,311,437 Construction in Progress 6,436,468 6,797,737
Total Governmental Funds Capital Assets 1,271,088,247 1,231,622,770
Investments in Governmental Funds Capital Assets by Source:
General Fund 445,604,510 431,743,397 Special Revenue Funds 231,410,957 224,999,444 Capital Projects Funds 594,072,780 574,879,929
Total Investments in Governmental Funds $ 1,271,088,247 1,231,622,770
(1) This schedule presents only the capital asset balances related to governmental funds. Accordingly, the capital assets reported in internal service funds are excluded from the above amounts. Generally, the capital assets of internal service funds are included as governmental activities in the statement of net position.
Comparative Schedules by Source (1)
199
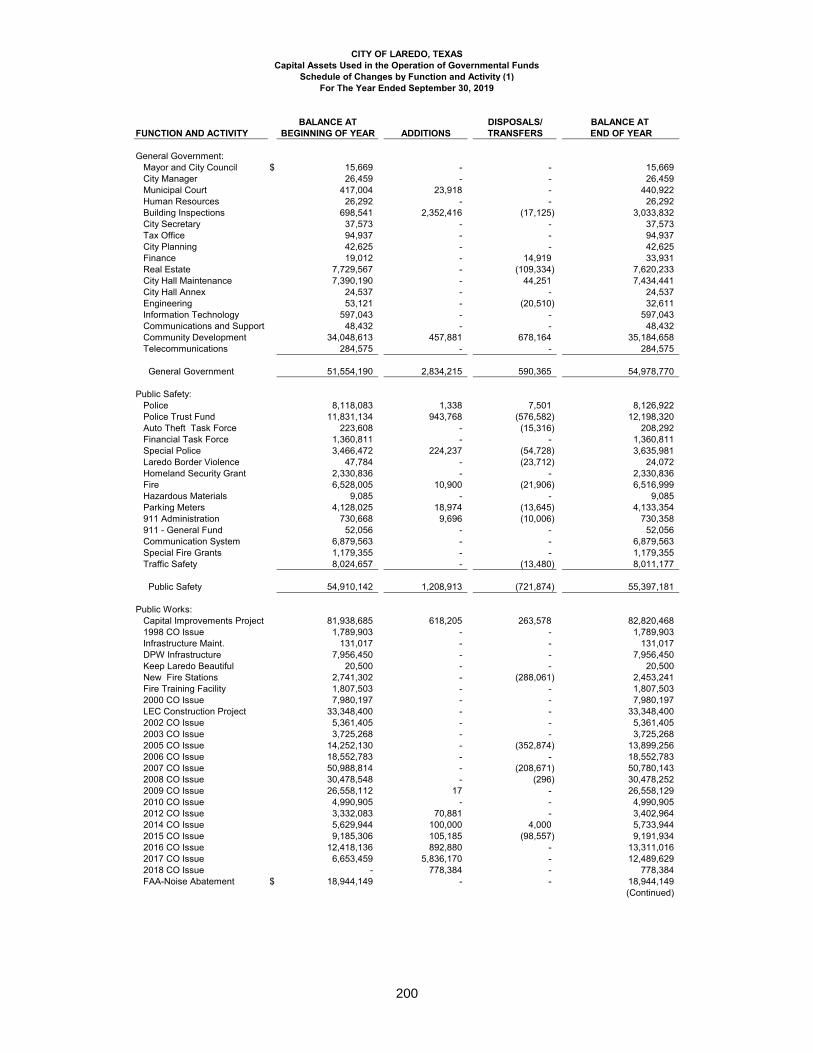
CITY OF LAREDO, TEXASCapital Assets Used in the Operation of Governmental Funds
Schedule of Changes by Function and Activity (1)For The Year Ended September 30, 2019
BALANCE AT DISPOSALS/ BALANCE AT FUNCTION AND ACTIVITY BEGINNING OF YEAR ADDITIONS TRANSFERS END OF YEAR
General Government: Mayor and City Council $ 15,669 - - 15,669 City Manager 26,459 - - 26,459 Municipal Court 417,004 23,918 - 440,922 Human Resources 26,292 - - 26,292 Building Inspections 698,541 2,352,416 (17,125) 3,033,832 City Secretary 37,573 - - 37,573 Tax Office 94,937 - - 94,937 City Planning 42,625 - - 42,625 Finance 19,012 - 14,919 33,931 Real Estate 7,729,567 - (109,334) 7,620,233 City Hall Maintenance 7,390,190 - 44,251 7,434,441 City Hall Annex 24,537 - - 24,537 Engineering 53,121 - (20,510) 32,611 Information Technology 597,043 - - 597,043 Communications and Support 48,432 - - 48,432 Community Development 34,048,613 457,881 678,164 35,184,658 Telecommunications 284,575 - - 284,575
General Government 51,554,190 2,834,215 590,365 54,978,770
Public Safety: Police 8,118,083 1,338 7,501 8,126,922 Police Trust Fund 11,831,134 943,768 (576,582) 12,198,320 Auto Theft Task Force 223,608 - (15,316) 208,292 Financial Task Force 1,360,811 - - 1,360,811 Special Police 3,466,472 224,237 (54,728) 3,635,981 Laredo Border Violence 47,784 - (23,712) 24,072 Homeland Security Grant 2,330,836 - - 2,330,836 Fire 6,528,005 10,900 (21,906) 6,516,999 Hazardous Materials 9,085 - - 9,085 Parking Meters 4,128,025 18,974 (13,645) 4,133,354 911 Administration 730,668 9,696 (10,006) 730,358 911 - General Fund 52,056 - - 52,056 Communication System 6,879,563 - - 6,879,563 Special Fire Grants 1,179,355 - - 1,179,355 Traffic Safety 8,024,657 - (13,480) 8,011,177
Public Safety 54,910,142 1,208,913 (721,874) 55,397,181
Public Works: Capital Improvements Project 81,938,685 618,205 263,578 82,820,468 1998 CO Issue 1,789,903 - - 1,789,903 Infrastructure Maint. 131,017 - - 131,017 DPW Infrastructure 7,956,450 - - 7,956,450 Keep Laredo Beautiful 20,500 - - 20,500 New Fire Stations 2,741,302 - (288,061) 2,453,241 Fire Training Facility 1,807,503 - - 1,807,503 2000 CO Issue 7,980,197 - - 7,980,197 LEC Construction Project 33,348,400 - - 33,348,400 2002 CO Issue 5,361,405 - - 5,361,405 2003 CO Issue 3,725,268 - - 3,725,268 2005 CO Issue 14,252,130 - (352,874) 13,899,256 2006 CO Issue 18,552,783 - - 18,552,783 2007 CO Issue 50,988,814 - (208,671) 50,780,143 2008 CO Issue 30,478,548 - (296) 30,478,252 2009 CO Issue 26,558,112 17 - 26,558,129 2010 CO Issue 4,990,905 - - 4,990,905 2012 CO Issue 3,332,083 70,881 - 3,402,964 2014 CO Issue 5,629,944 100,000 4,000 5,733,944 2015 CO Issue 9,185,306 105,185 (98,557) 9,191,934 2016 CO Issue 12,418,136 892,880 - 13,311,016 2017 CO Issue 6,653,459 5,836,170 - 12,489,629 2018 CO Issue - 778,384 - 778,384 FAA-Noise Abatement $ 18,944,149 - - 18,944,149
(Continued)
200
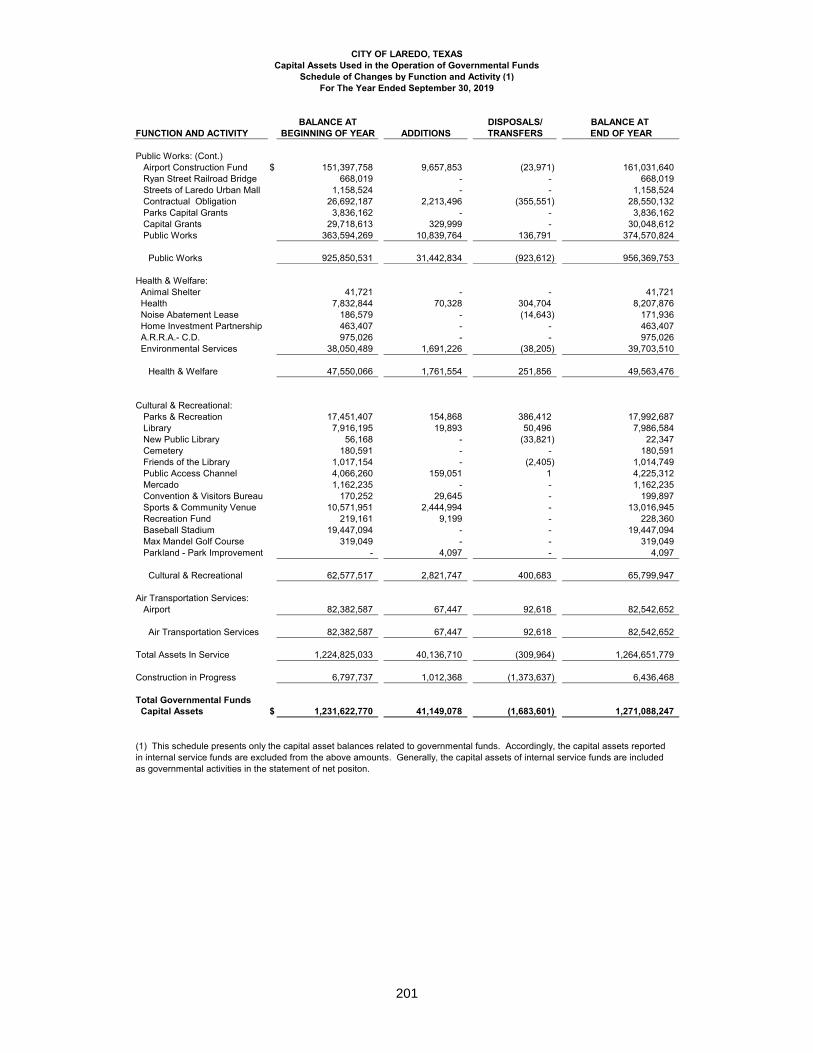
CITY OF LAREDO, TEXASCapital Assets Used in the Operation of Governmental Funds
Schedule of Changes by Function and Activity (1)For The Year Ended September 30, 2019
BALANCE AT DISPOSALS/ BALANCE AT FUNCTION AND ACTIVITY BEGINNING OF YEAR ADDITIONS TRANSFERS END OF YEAR
Public Works: (Cont.) Airport Construction Fund $ 151,397,758 9,657,853 (23,971) 161,031,640 Ryan Street Railroad Bridge 668,019 - - 668,019 Streets of Laredo Urban Mall 1,158,524 - - 1,158,524 Contractual Obligation 26,692,187 2,213,496 (355,551) 28,550,132 Parks Capital Grants 3,836,162 - - 3,836,162 Capital Grants 29,718,613 329,999 - 30,048,612 Public Works 363,594,269 10,839,764 136,791 374,570,824
Public Works 925,850,531 31,442,834 (923,612) 956,369,753
Health & Welfare: Animal Shelter 41,721 - - 41,721 Health 7,832,844 70,328 304,704 8,207,876 Noise Abatement Lease 186,579 - (14,643) 171,936 Home Investment Partnership 463,407 - - 463,407 A.R.R.A.- C.D. 975,026 - - 975,026 Environmental Services 38,050,489 1,691,226 (38,205) 39,703,510
Health & Welfare 47,550,066 1,761,554 251,856 49,563,476
Cultural & Recreational: Parks & Recreation 17,451,407 154,868 386,412 17,992,687 Library 7,916,195 19,893 50,496 7,986,584 New Public Library 56,168 - (33,821) 22,347 Cemetery 180,591 - - 180,591 Friends of the Library 1,017,154 - (2,405) 1,014,749 Public Access Channel 4,066,260 159,051 1 4,225,312 Mercado 1,162,235 - - 1,162,235 Convention & Visitors Bureau 170,252 29,645 - 199,897 Sports & Community Venue 10,571,951 2,444,994 - 13,016,945 Recreation Fund 219,161 9,199 - 228,360 Baseball Stadium 19,447,094 - - 19,447,094 Max Mandel Golf Course 319,049 - - 319,049 Parkland - Park Improvement - 4,097 - 4,097
Cultural & Recreational 62,577,517 2,821,747 400,683 65,799,947
Air Transportation Services: Airport 82,382,587 67,447 92,618 82,542,652
Air Transportation Services 82,382,587 67,447 92,618 82,542,652
Total Assets In Service 1,224,825,033 40,136,710 (309,964) 1,264,651,779
Construction in Progress 6,797,737 1,012,368 (1,373,637) 6,436,468
Total Governmental Funds Capital Assets $ 1,231,622,770 41,149,078 (1,683,601) 1,271,088,247
(1) This schedule presents only the capital asset balances related to governmental funds. Accordingly, the capital assets reported in internal service funds are excluded from the above amounts. Generally, the capital assets of internal service funds are includedas governmental activities in the statement of net positon.
201
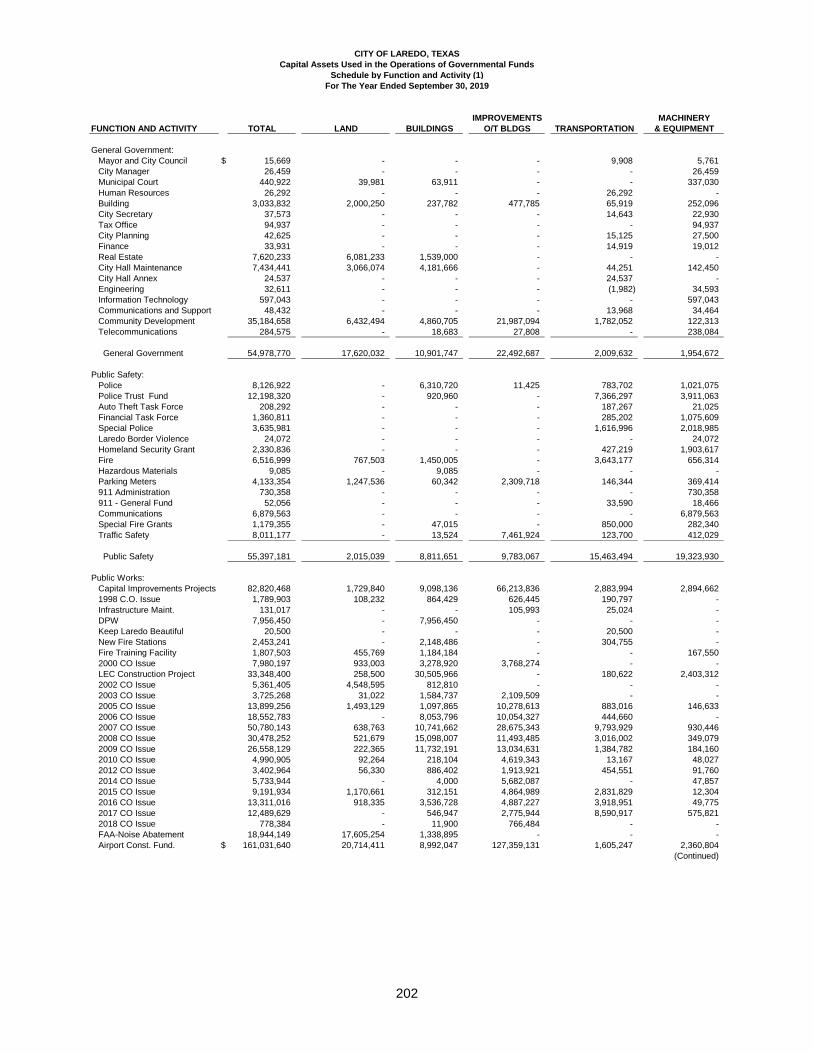
CITY OF LAREDO, TEXAS
Capital Assets Used in the Operations of Governmental Funds
Schedule by Function and Activity (1)
For The Year Ended September 30, 2019
IMPROVEMENTS MACHINERY
FUNCTION AND ACTIVITY TOTAL LAND BUILDINGS O/T BLDGS TRANSPORTATION & EQUIPMENT
General Government: Mayor and City Council $ 15,669 - - - 9,908 5,761 City Manager 26,459 - - - - 26,459 Municipal Court 440,922 39,981 63,911 - - 337,030 Human Resources 26,292 - - - 26,292 - Building 3,033,832 2,000,250 237,782 477,785 65,919 252,096 City Secretary 37,573 - - - 14,643 22,930 Tax Office 94,937 - - - - 94,937 City Planning 42,625 - - - 15,125 27,500 Finance 33,931 - - - 14,919 19,012 Real Estate 7,620,233 6,081,233 1,539,000 - - - City Hall Maintenance 7,434,441 3,066,074 4,181,666 - 44,251 142,450 City Hall Annex 24,537 - - - 24,537 - Engineering 32,611 - - - (1,982) 34,593 Information Technology 597,043 - - - - 597,043 Communications and Support 48,432 - - - 13,968 34,464 Community Development 35,184,658 6,432,494 4,860,705 21,987,094 1,782,052 122,313 Telecommunications 284,575 - 18,683 27,808 - 238,084
General Government 54,978,770 17,620,032 10,901,747 22,492,687 2,009,632 1,954,672
Public Safety: Police 8,126,922 - 6,310,720 11,425 783,702 1,021,075 Police Trust Fund 12,198,320 - 920,960 - 7,366,297 3,911,063 Auto Theft Task Force 208,292 - - - 187,267 21,025 Financial Task Force 1,360,811 - - - 285,202 1,075,609 Special Police 3,635,981 - - - 1,616,996 2,018,985 Laredo Border Violence 24,072 - - - - 24,072 Homeland Security Grant 2,330,836 - - - 427,219 1,903,617 Fire 6,516,999 767,503 1,450,005 - 3,643,177 656,314 Hazardous Materials 9,085 - 9,085 - - - Parking Meters 4,133,354 1,247,536 60,342 2,309,718 146,344 369,414 911 Administration 730,358 - - - - 730,358 911 - General Fund 52,056 - - - 33,590 18,466 Communications 6,879,563 - - - - 6,879,563 Special Fire Grants 1,179,355 - 47,015 - 850,000 282,340 Traffic Safety 8,011,177 - 13,524 7,461,924 123,700 412,029
Public Safety 55,397,181 2,015,039 8,811,651 9,783,067 15,463,494 19,323,930
Public Works: Capital Improvements Projects 82,820,468 1,729,840 9,098,136 66,213,836 2,883,994 2,894,662 1998 C.O. Issue 1,789,903 108,232 864,429 626,445 190,797 - Infrastructure Maint. 131,017 - - 105,993 25,024 - DPW 7,956,450 - 7,956,450 - - - Keep Laredo Beautiful 20,500 - - - 20,500 - New Fire Stations 2,453,241 - 2,148,486 - 304,755 - Fire Training Facility 1,807,503 455,769 1,184,184 - - 167,550 2000 CO Issue 7,980,197 933,003 3,278,920 3,768,274 - - LEC Construction Project 33,348,400 258,500 30,505,966 - 180,622 2,403,312 2002 CO Issue 5,361,405 4,548,595 812,810 - - - 2003 CO Issue 3,725,268 31,022 1,584,737 2,109,509 - - 2005 CO Issue 13,899,256 1,493,129 1,097,865 10,278,613 883,016 146,633 2006 CO Issue 18,552,783 - 8,053,796 10,054,327 444,660 - 2007 CO Issue 50,780,143 638,763 10,741,662 28,675,343 9,793,929 930,446 2008 CO Issue 30,478,252 521,679 15,098,007 11,493,485 3,016,002 349,079 2009 CO Issue 26,558,129 222,365 11,732,191 13,034,631 1,384,782 184,160 2010 CO Issue 4,990,905 92,264 218,104 4,619,343 13,167 48,027 2012 CO Issue 3,402,964 56,330 886,402 1,913,921 454,551 91,760 2014 CO Issue 5,733,944 - 4,000 5,682,087 - 47,857 2015 CO Issue 9,191,934 1,170,661 312,151 4,864,989 2,831,829 12,304 2016 CO Issue 13,311,016 918,335 3,536,728 4,887,227 3,918,951 49,775 2017 CO Issue 12,489,629 - 546,947 2,775,944 8,590,917 575,821 2018 CO Issue 778,384 - 11,900 766,484 - - FAA-Noise Abatement 18,944,149 17,605,254 1,338,895 - - - Airport Const. Fund. $ 161,031,640 20,714,411 8,992,047 127,359,131 1,605,247 2,360,804
(Continued)
202
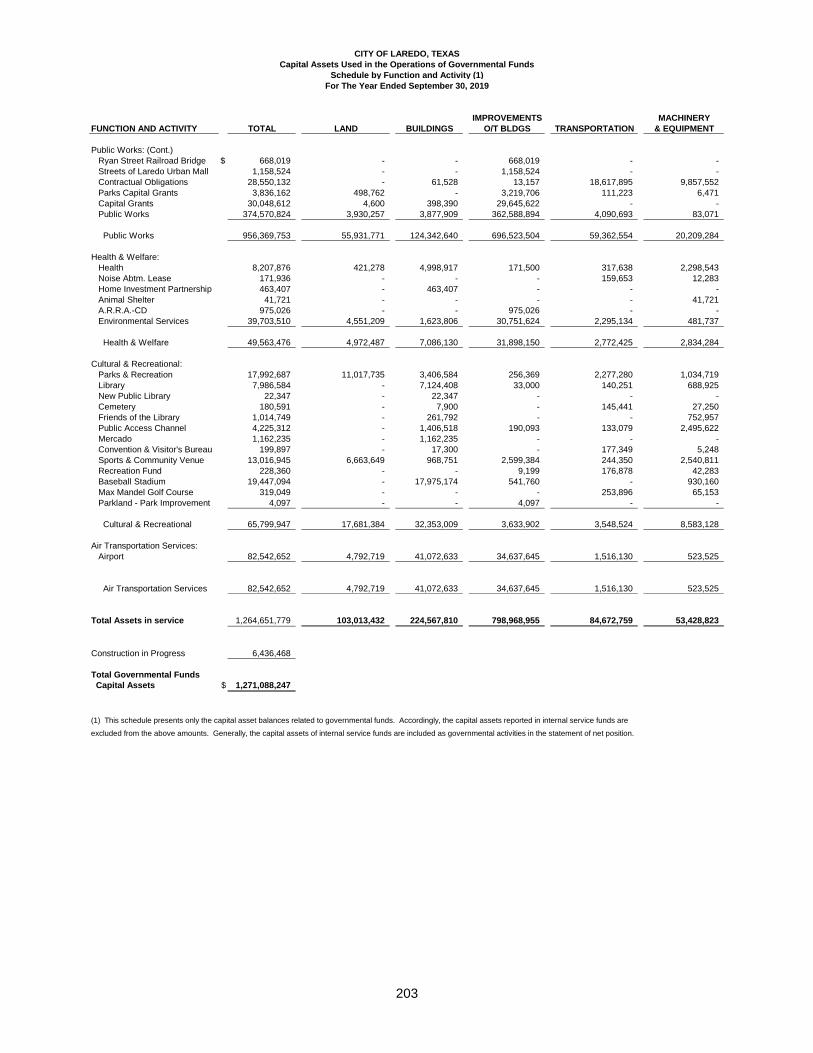
CITY OF LAREDO, TEXAS
Capital Assets Used in the Operations of Governmental Funds
Schedule by Function and Activity (1)
For The Year Ended September 30, 2019
IMPROVEMENTS MACHINERY
FUNCTION AND ACTIVITY TOTAL LAND BUILDINGS O/T BLDGS TRANSPORTATION & EQUIPMENT
Public Works: (Cont.) Ryan Street Railroad Bridge $ 668,019 - - 668,019 - - Streets of Laredo Urban Mall 1,158,524 - - 1,158,524 - - Contractual Obligations 28,550,132 - 61,528 13,157 18,617,895 9,857,552 Parks Capital Grants 3,836,162 498,762 - 3,219,706 111,223 6,471 Capital Grants 30,048,612 4,600 398,390 29,645,622 - - Public Works 374,570,824 3,930,257 3,877,909 362,588,894 4,090,693 83,071
Public Works 956,369,753 55,931,771 124,342,640 696,523,504 59,362,554 20,209,284
Health & Welfare: Health 8,207,876 421,278 4,998,917 171,500 317,638 2,298,543 Noise Abtm. Lease 171,936 - - - 159,653 12,283 Home Investment Partnership 463,407 - 463,407 - - - Animal Shelter 41,721 - - - - 41,721 A.R.R.A.-CD 975,026 - - 975,026 - - Environmental Services 39,703,510 4,551,209 1,623,806 30,751,624 2,295,134 481,737
Health & Welfare 49,563,476 4,972,487 7,086,130 31,898,150 2,772,425 2,834,284
Cultural & Recreational: Parks & Recreation 17,992,687 11,017,735 3,406,584 256,369 2,277,280 1,034,719 Library 7,986,584 - 7,124,408 33,000 140,251 688,925 New Public Library 22,347 - 22,347 - - - Cemetery 180,591 - 7,900 - 145,441 27,250 Friends of the Library 1,014,749 - 261,792 - - 752,957 Public Access Channel 4,225,312 - 1,406,518 190,093 133,079 2,495,622 Mercado 1,162,235 - 1,162,235 - - - Convention & Visitor's Bureau 199,897 - 17,300 - 177,349 5,248 Sports & Community Venue 13,016,945 6,663,649 968,751 2,599,384 244,350 2,540,811 Recreation Fund 228,360 - - 9,199 176,878 42,283 Baseball Stadium 19,447,094 - 17,975,174 541,760 - 930,160 Max Mandel Golf Course 319,049 - - - 253,896 65,153 Parkland - Park Improvement 4,097 - - 4,097 - -
Cultural & Recreational 65,799,947 17,681,384 32,353,009 3,633,902 3,548,524 8,583,128
Air Transportation Services: Airport 82,542,652 4,792,719 41,072,633 34,637,645 1,516,130 523,525
Air Transportation Services 82,542,652 4,792,719 41,072,633 34,637,645 1,516,130 523,525
Total Assets in service 1,264,651,779 103,013,432 224,567,810 798,968,955 84,672,759 53,428,823
Construction in Progress 6,436,468
Total Governmental Funds
Capital Assets $ 1,271,088,247
(1) This schedule presents only the capital asset balances related to governmental funds. Accordingly, the capital assets reported in internal service funds areexcluded from the above amounts. Generally, the capital assets of internal service funds are included as governmental activities in the statement of net position.
203

This page intentionally left blank
204

ENTERPRISE FUNDS
ENTERPRISE FUNDS Enterprise funds account for the acquisition, operation and maintenance of the City's facilities and services which are entirely or predominantly supported by user charges or those for which the City has decided that periodic determination of the revenues earned, expenses incurred, and/or net income is appropriate for capital maintenance, public policy, management control, accountability and or other purposes. All activities necessary to provide services are accounted for in these funds, including, but not limited to, administration, operations, and maintenance. Enterprise Funds include: MUNICIPAL TRANSIT SYSTEM - to account for the proceeds from the City's Transit
System and a grant from the U.S. Department of Transportation, Urban Mass Transportation, used for operating and maintaining the Transit System.
BRIDGE SYSTEM - to account for toll proceeds from four international bridges and the
related operations, maintenance and debt service. MUNICIPAL HOUSING FUND- to account for proceeds from low income housing
units partially funded from HUD Section 8 and the related operational and maintenance disbursements.
WATERWORKS SYSTEM - to account for the operations, maintenance and debt
service from two water treatment plants and twenty four booster stations and the related revenue received from customers.
SEWER SYSTEM - to account for the operations, maintenance and debt service of the
City's six sewage treatment plants and its related revenue received from customers.
SOLID WASTE FUND - to account for the landfill and recycling center operations and
revenues collected from landfill fees and Federal and State mandates fees, and for the construction of the municipal landfill.
205
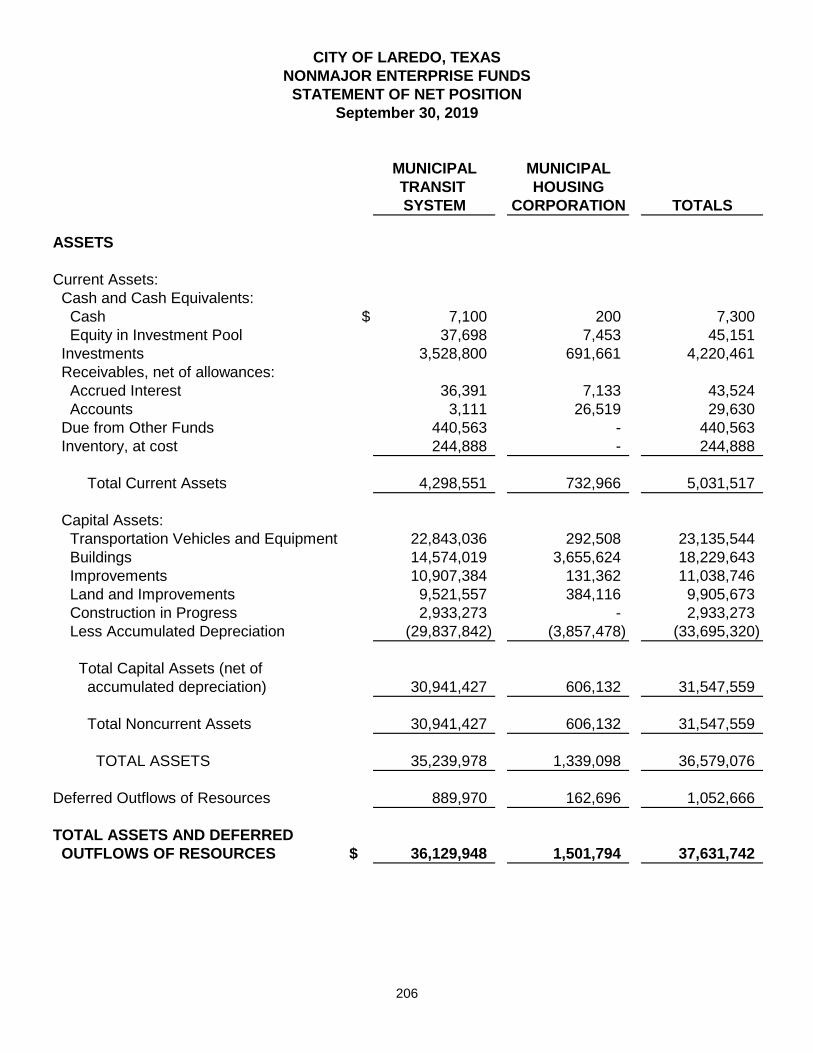
CITY OF LAREDO, TEXAS
NONMAJOR ENTERPRISE FUNDS
STATEMENT OF NET POSITION
September 30, 2019
MUNICIPAL MUNICIPAL
TRANSIT HOUSING
SYSTEM CORPORATION TOTALS
ASSETS
Current Assets: Cash and Cash Equivalents: Cash $ 7,100 200 7,300 Equity in Investment Pool 37,698 7,453 45,151 Investments 3,528,800 691,661 4,220,461 Receivables, net of allowances: Accrued Interest 36,391 7,133 43,524 Accounts 3,111 26,519 29,630 Due from Other Funds 440,563 - 440,563 Inventory, at cost 244,888 - 244,888
Total Current Assets 4,298,551 732,966 5,031,517
Capital Assets: Transportation Vehicles and Equipment 22,843,036 292,508 23,135,544 Buildings 14,574,019 3,655,624 18,229,643 Improvements 10,907,384 131,362 11,038,746 Land and Improvements 9,521,557 384,116 9,905,673 Construction in Progress 2,933,273 - 2,933,273 Less Accumulated Depreciation (29,837,842) (3,857,478) (33,695,320)
Total Capital Assets (net of accumulated depreciation) 30,941,427 606,132 31,547,559
Total Noncurrent Assets 30,941,427 606,132 31,547,559
TOTAL ASSETS 35,239,978 1,339,098 36,579,076
Deferred Outflows of Resources 889,970 162,696 1,052,666
TOTAL ASSETS AND DEFERRED
OUTFLOWS OF RESOURCES $ 36,129,948 1,501,794 37,631,742
206
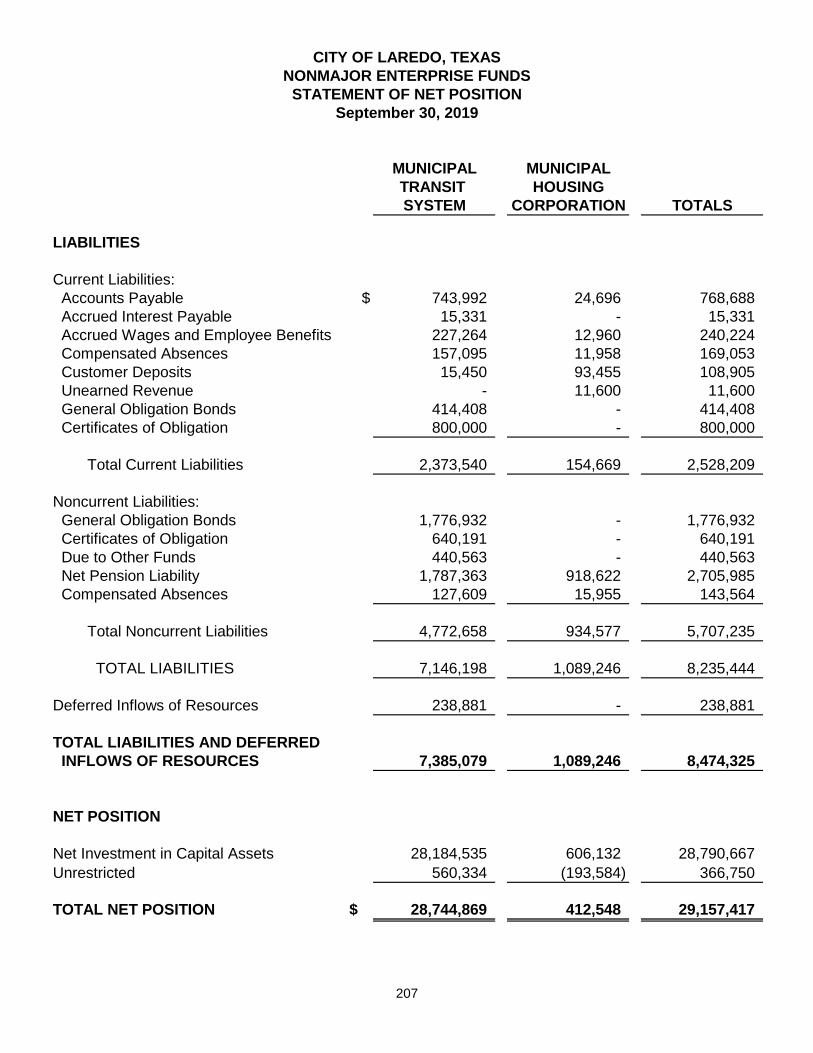
CITY OF LAREDO, TEXAS
NONMAJOR ENTERPRISE FUNDS
STATEMENT OF NET POSITION
September 30, 2019
MUNICIPAL MUNICIPAL
TRANSIT HOUSING
SYSTEM CORPORATION TOTALS
LIABILITIES
Current Liabilities: Accounts Payable $ 743,992 24,696 768,688 Accrued Interest Payable 15,331 - 15,331 Accrued Wages and Employee Benefits 227,264 12,960 240,224 Compensated Absences 157,095 11,958 169,053 Customer Deposits 15,450 93,455 108,905 Unearned Revenue - 11,600 11,600 General Obligation Bonds 414,408 - 414,408 Certificates of Obligation 800,000 - 800,000
Total Current Liabilities 2,373,540 154,669 2,528,209
Noncurrent Liabilities: General Obligation Bonds 1,776,932 - 1,776,932 Certificates of Obligation 640,191 - 640,191 Due to Other Funds 440,563 - 440,563 Net Pension Liability 1,787,363 918,622 2,705,985 Compensated Absences 127,609 15,955 143,564
Total Noncurrent Liabilities 4,772,658 934,577 5,707,235
TOTAL LIABILITIES 7,146,198 1,089,246 8,235,444
Deferred Inflows of Resources 238,881 - 238,881
TOTAL LIABILITIES AND DEFERRED
INFLOWS OF RESOURCES 7,385,079 1,089,246 8,474,325
NET POSITION
Net Investment in Capital Assets 28,184,535 606,132 28,790,667 Unrestricted 560,334 (193,584) 366,750
TOTAL NET POSITION $ 28,744,869 412,548 29,157,417
207
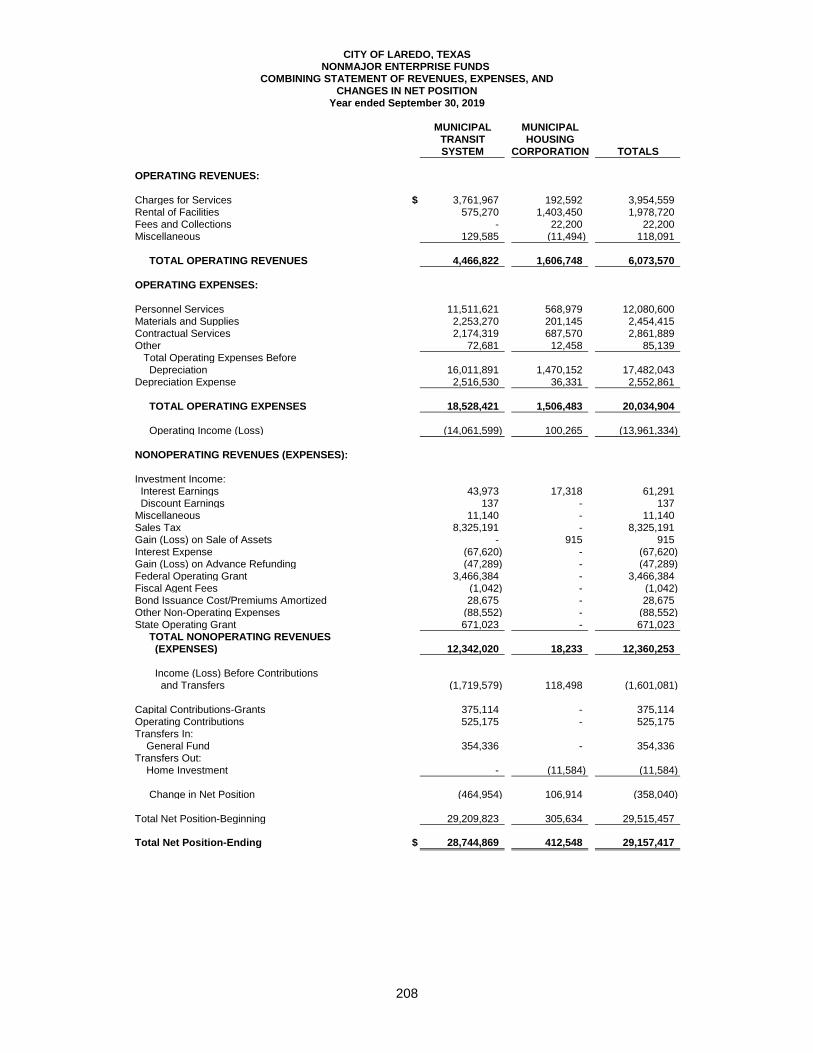
CITY OF LAREDO, TEXASNONMAJOR ENTERPRISE FUNDS
COMBINING STATEMENT OF REVENUES, EXPENSES, ANDCHANGES IN NET POSITION
Year ended September 30, 2019
MUNICIPAL MUNICIPALTRANSIT HOUSINGSYSTEM CORPORATION TOTALS
OPERATING REVENUES:
Charges for Services $ 3,761,967 192,592 3,954,559 Rental of Facilities 575,270 1,403,450 1,978,720 Fees and Collections - 22,200 22,200 Miscellaneous 129,585 (11,494) 118,091
TOTAL OPERATING REVENUES 4,466,822 1,606,748 6,073,570
OPERATING EXPENSES:
Personnel Services 11,511,621 568,979 12,080,600 Materials and Supplies 2,253,270 201,145 2,454,415 Contractual Services 2,174,319 687,570 2,861,889 Other 72,681 12,458 85,139 Total Operating Expenses Before Depreciation 16,011,891 1,470,152 17,482,043 Depreciation Expense 2,516,530 36,331 2,552,861
TOTAL OPERATING EXPENSES 18,528,421 1,506,483 20,034,904
Operating Income (Loss) (14,061,599) 100,265 (13,961,334)
NONOPERATING REVENUES (EXPENSES):
Investment Income: Interest Earnings 43,973 17,318 61,291 Discount Earnings 137 - 137 Miscellaneous 11,140 - 11,140 Sales Tax 8,325,191 - 8,325,191 Gain (Loss) on Sale of Assets - 915 915 Interest Expense (67,620) - (67,620) Gain (Loss) on Advance Refunding (47,289) - (47,289) Federal Operating Grant 3,466,384 - 3,466,384 Fiscal Agent Fees (1,042) - (1,042) Bond Issuance Cost/Premiums Amortized 28,675 - 28,675 Other Non-Operating Expenses (88,552) - (88,552) State Operating Grant 671,023 - 671,023 TOTAL NONOPERATING REVENUES (EXPENSES) 12,342,020 18,233 12,360,253
Income (Loss) Before Contributions and Transfers (1,719,579) 118,498 (1,601,081)
Capital Contributions-Grants 375,114 - 375,114 Operating Contributions 525,175 - 525,175 Transfers In: General Fund 354,336 - 354,336 Transfers Out: Home Investment - (11,584) (11,584)
Change in Net Position (464,954) 106,914 (358,040)
Total Net Position-Beginning 29,209,823 305,634 29,515,457
Total Net Position-Ending $ 28,744,869 412,548 29,157,417
208
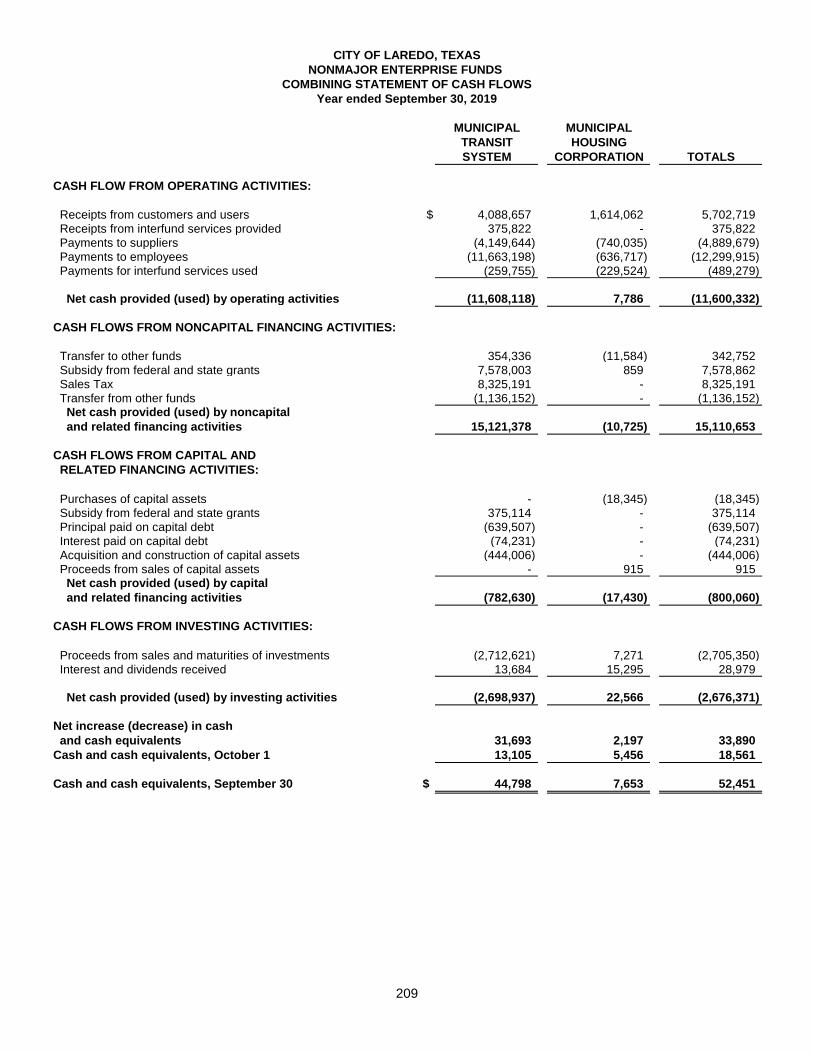
CITY OF LAREDO, TEXAS
NONMAJOR ENTERPRISE FUNDS
COMBINING STATEMENT OF CASH FLOWS
Year ended September 30, 2019
MUNICIPAL MUNICIPAL
TRANSIT HOUSING
SYSTEM CORPORATION TOTALS
CASH FLOW FROM OPERATING ACTIVITIES:
Receipts from customers and users $ 4,088,657 1,614,062 5,702,719 Receipts from interfund services provided 375,822 - 375,822 Payments to suppliers (4,149,644) (740,035) (4,889,679) Payments to employees (11,663,198) (636,717) (12,299,915) Payments for interfund services used (259,755) (229,524) (489,279)
Net cash provided (used) by operating activities (11,608,118) 7,786 (11,600,332)
CASH FLOWS FROM NONCAPITAL FINANCING ACTIVITIES:
Transfer to other funds 354,336 (11,584) 342,752 Subsidy from federal and state grants 7,578,003 859 7,578,862 Sales Tax 8,325,191 - 8,325,191 Transfer from other funds (1,136,152) - (1,136,152) Net cash provided (used) by noncapital
and related financing activities 15,121,378 (10,725) 15,110,653
CASH FLOWS FROM CAPITAL AND
RELATED FINANCING ACTIVITIES:
Purchases of capital assets - (18,345) (18,345) Subsidy from federal and state grants 375,114 - 375,114 Principal paid on capital debt (639,507) - (639,507) Interest paid on capital debt (74,231) - (74,231) Acquisition and construction of capital assets (444,006) - (444,006) Proceeds from sales of capital assets - 915 915 Net cash provided (used) by capital
and related financing activities (782,630) (17,430) (800,060)
CASH FLOWS FROM INVESTING ACTIVITIES:
Proceeds from sales and maturities of investments (2,712,621) 7,271 (2,705,350) Interest and dividends received 13,684 15,295 28,979
Net cash provided (used) by investing activities (2,698,937) 22,566 (2,676,371)
Net increase (decrease) in cash
and cash equivalents 31,693 2,197 33,890
Cash and cash equivalents, October 1 13,105 5,456 18,561
Cash and cash equivalents, September 30 $ 44,798 7,653 52,451
209
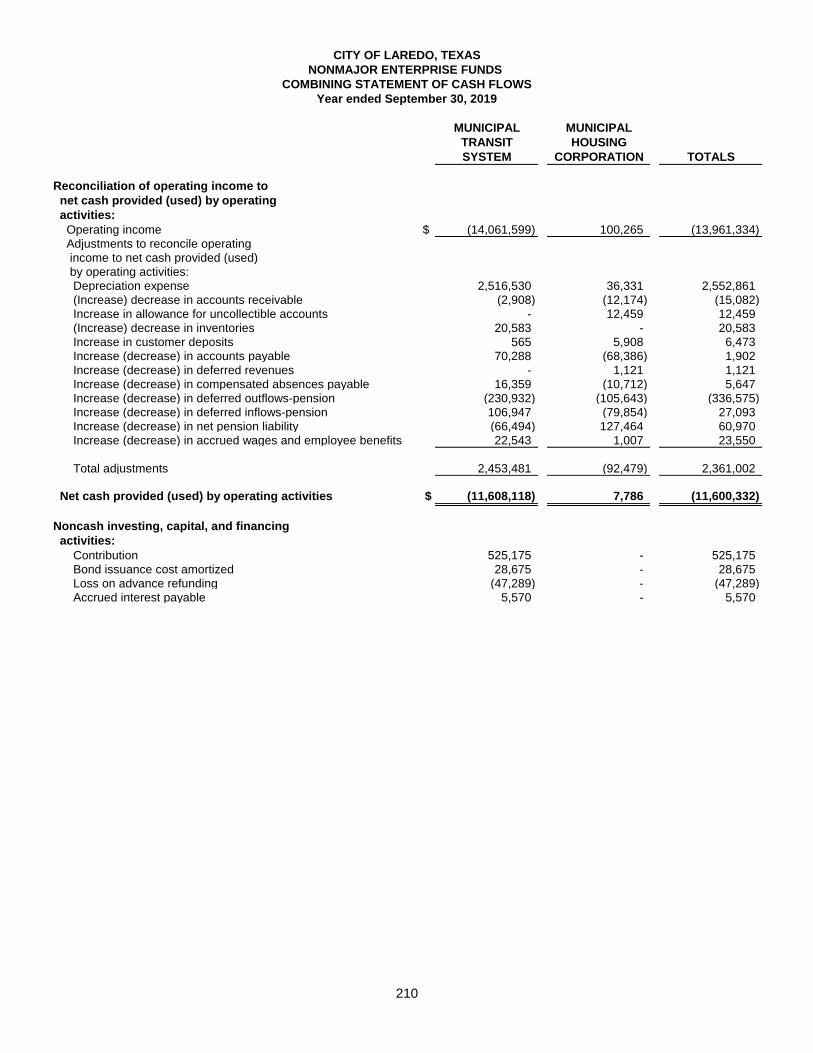
CITY OF LAREDO, TEXAS
NONMAJOR ENTERPRISE FUNDS
COMBINING STATEMENT OF CASH FLOWS
Year ended September 30, 2019
MUNICIPAL MUNICIPAL
TRANSIT HOUSING
SYSTEM CORPORATION TOTALS
Reconciliation of operating income to
net cash provided (used) by operating
activities:
Operating income $ (14,061,599) 100,265 (13,961,334) Adjustments to reconcile operating income to net cash provided (used) by operating activities: Depreciation expense 2,516,530 36,331 2,552,861 (Increase) decrease in accounts receivable (2,908) (12,174) (15,082) Increase in allowance for uncollectible accounts - 12,459 12,459 (Increase) decrease in inventories 20,583 - 20,583 Increase in customer deposits 565 5,908 6,473 Increase (decrease) in accounts payable 70,288 (68,386) 1,902 Increase (decrease) in deferred revenues - 1,121 1,121 Increase (decrease) in compensated absences payable 16,359 (10,712) 5,647 Increase (decrease) in deferred outflows-pension (230,932) (105,643) (336,575) Increase (decrease) in deferred inflows-pension 106,947 (79,854) 27,093 Increase (decrease) in net pension liability (66,494) 127,464 60,970 Increase (decrease) in accrued wages and employee benefits 22,543 1,007 23,550
Total adjustments 2,453,481 (92,479) 2,361,002
Net cash provided (used) by operating activities $ (11,608,118) 7,786 (11,600,332)
Noncash investing, capital, and financing
activities:
Contribution 525,175 - 525,175 Bond issuance cost amortized 28,675 - 28,675 Loss on advance refunding (47,289) - (47,289) Accrued interest payable 5,570 - 5,570
210
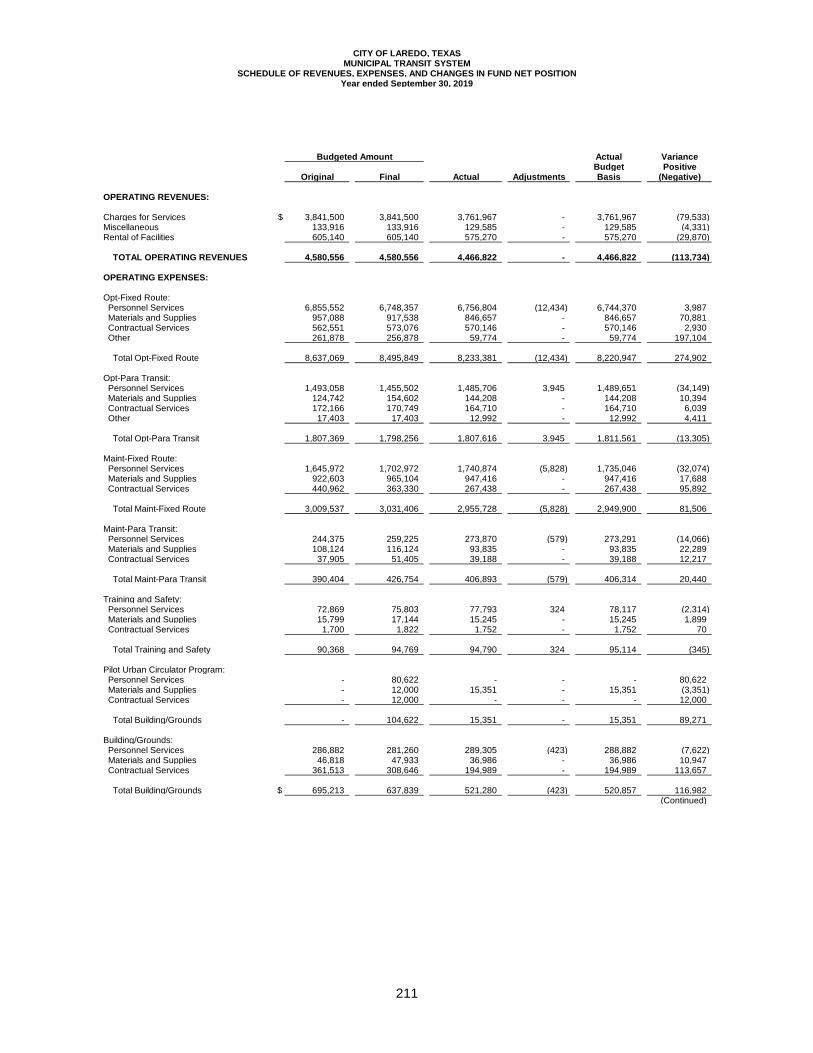
CITY OF LAREDO, TEXASMUNICIPAL TRANSIT SYSTEM
SCHEDULE OF REVENUES, EXPENSES, AND CHANGES IN FUND NET POSITIONYear ended September 30, 2019
Budgeted Amount Actual VarianceBudget Positive
Original Final Actual Adjustments Basis (Negative)
OPERATING REVENUES:
Charges for Services $ 3,841,500 3,841,500 3,761,967 - 3,761,967 (79,533) Miscellaneous 133,916 133,916 129,585 - 129,585 (4,331) Rental of Facilities 605,140 605,140 575,270 - 575,270 (29,870)
TOTAL OPERATING REVENUES 4,580,556 4,580,556 4,466,822 - 4,466,822 (113,734)
OPERATING EXPENSES:
Opt-Fixed Route: Personnel Services 6,855,552 6,748,357 6,756,804 (12,434) 6,744,370 3,987 Materials and Supplies 957,088 917,538 846,657 - 846,657 70,881 Contractual Services 562,551 573,076 570,146 - 570,146 2,930 Other 261,878 256,878 59,774 - 59,774 197,104
Total Opt-Fixed Route 8,637,069 8,495,849 8,233,381 (12,434) 8,220,947 274,902
Opt-Para Transit: Personnel Services 1,493,058 1,455,502 1,485,706 3,945 1,489,651 (34,149) Materials and Supplies 124,742 154,602 144,208 - 144,208 10,394 Contractual Services 172,166 170,749 164,710 - 164,710 6,039 Other 17,403 17,403 12,992 - 12,992 4,411
Total Opt-Para Transit 1,807,369 1,798,256 1,807,616 3,945 1,811,561 (13,305)
Maint-Fixed Route: Personnel Services 1,645,972 1,702,972 1,740,874 (5,828) 1,735,046 (32,074) Materials and Supplies 922,603 965,104 947,416 - 947,416 17,688 Contractual Services 440,962 363,330 267,438 - 267,438 95,892
Total Maint-Fixed Route 3,009,537 3,031,406 2,955,728 (5,828) 2,949,900 81,506
Maint-Para Transit: Personnel Services 244,375 259,225 273,870 (579) 273,291 (14,066) Materials and Supplies 108,124 116,124 93,835 - 93,835 22,289 Contractual Services 37,905 51,405 39,188 - 39,188 12,217
Total Maint-Para Transit 390,404 426,754 406,893 (579) 406,314 20,440
Training and Safety: Personnel Services 72,869 75,803 77,793 324 78,117 (2,314) Materials and Supplies 15,799 17,144 15,245 - 15,245 1,899 Contractual Services 1,700 1,822 1,752 - 1,752 70
Total Training and Safety 90,368 94,769 94,790 324 95,114 (345)
Pilot Urban Circulator Program: Personnel Services - 80,622 - - - 80,622 Materials and Supplies - 12,000 15,351 - 15,351 (3,351) Contractual Services - 12,000 - - - 12,000
Total Building/Grounds - 104,622 15,351 - 15,351 89,271
Building/Grounds: Personnel Services 286,882 281,260 289,305 (423) 288,882 (7,622) Materials and Supplies 46,818 47,933 36,986 - 36,986 10,947 Contractual Services 361,513 308,646 194,989 - 194,989 113,657
Total Building/Grounds $ 695,213 637,839 521,280 (423) 520,857 116,982 (Continued)
211
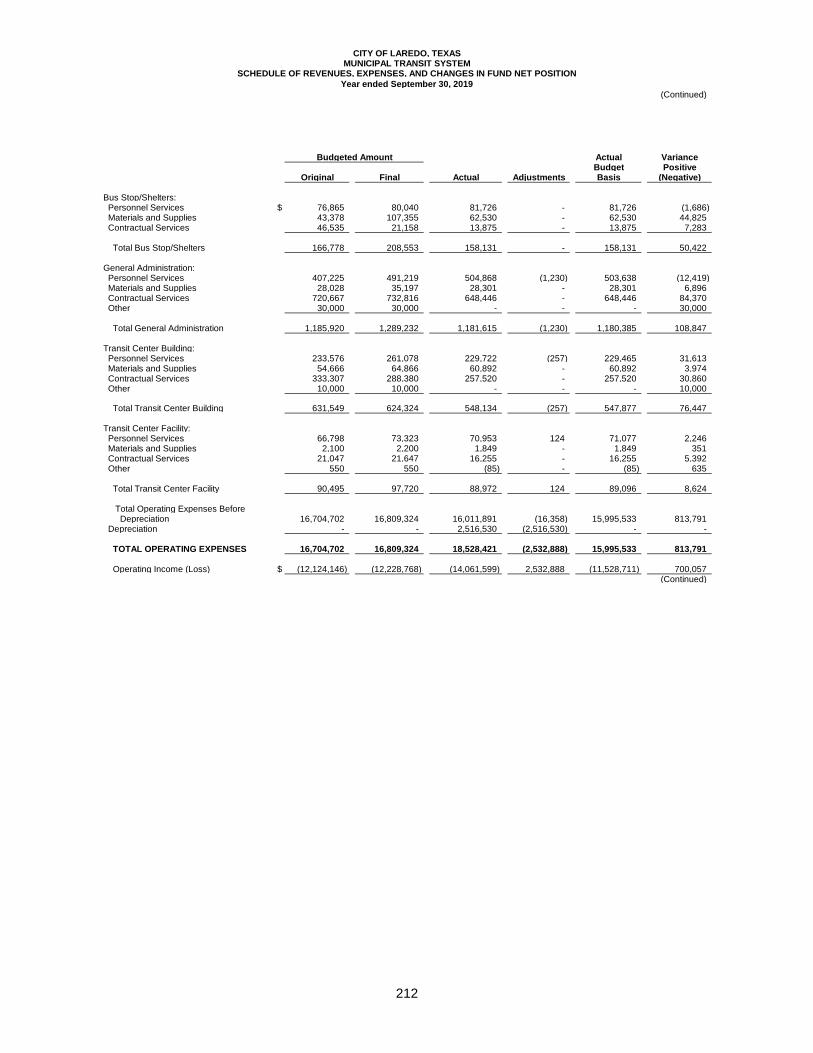
CITY OF LAREDO, TEXASMUNICIPAL TRANSIT SYSTEM
SCHEDULE OF REVENUES, EXPENSES, AND CHANGES IN FUND NET POSITION
Year ended September 30, 2019
(Continued)
Budgeted Amount Actual VarianceBudget Positive
Original Final Actual Adjustments Basis (Negative)
Bus Stop/Shelters: Personnel Services $ 76,865 80,040 81,726 - 81,726 (1,686) Materials and Supplies 43,378 107,355 62,530 - 62,530 44,825 Contractual Services 46,535 21,158 13,875 - 13,875 7,283
Total Bus Stop/Shelters 166,778 208,553 158,131 - 158,131 50,422
General Administration: Personnel Services 407,225 491,219 504,868 (1,230) 503,638 (12,419) Materials and Supplies 28,028 35,197 28,301 - 28,301 6,896 Contractual Services 720,667 732,816 648,446 - 648,446 84,370 Other 30,000 30,000 - - - 30,000
Total General Administration 1,185,920 1,289,232 1,181,615 (1,230) 1,180,385 108,847
Transit Center Building: Personnel Services 233,576 261,078 229,722 (257) 229,465 31,613 Materials and Supplies 54,666 64,866 60,892 - 60,892 3,974 Contractual Services 333,307 288,380 257,520 - 257,520 30,860 Other 10,000 10,000 - - - 10,000
Total Transit Center Building 631,549 624,324 548,134 (257) 547,877 76,447
Transit Center Facility: Personnel Services 66,798 73,323 70,953 124 71,077 2,246 Materials and Supplies 2,100 2,200 1,849 - 1,849 351 Contractual Services 21,047 21,647 16,255 - 16,255 5,392 Other 550 550 (85) - (85) 635
Total Transit Center Facility 90,495 97,720 88,972 124 89,096 8,624
Total Operating Expenses Before Depreciation 16,704,702 16,809,324 16,011,891 (16,358) 15,995,533 813,791 Depreciation - - 2,516,530 (2,516,530) - -
TOTAL OPERATING EXPENSES 16,704,702 16,809,324 18,528,421 (2,532,888) 15,995,533 813,791
Operating Income (Loss) $ (12,124,146) (12,228,768) (14,061,599) 2,532,888 (11,528,711) 700,057 (Continued)
212
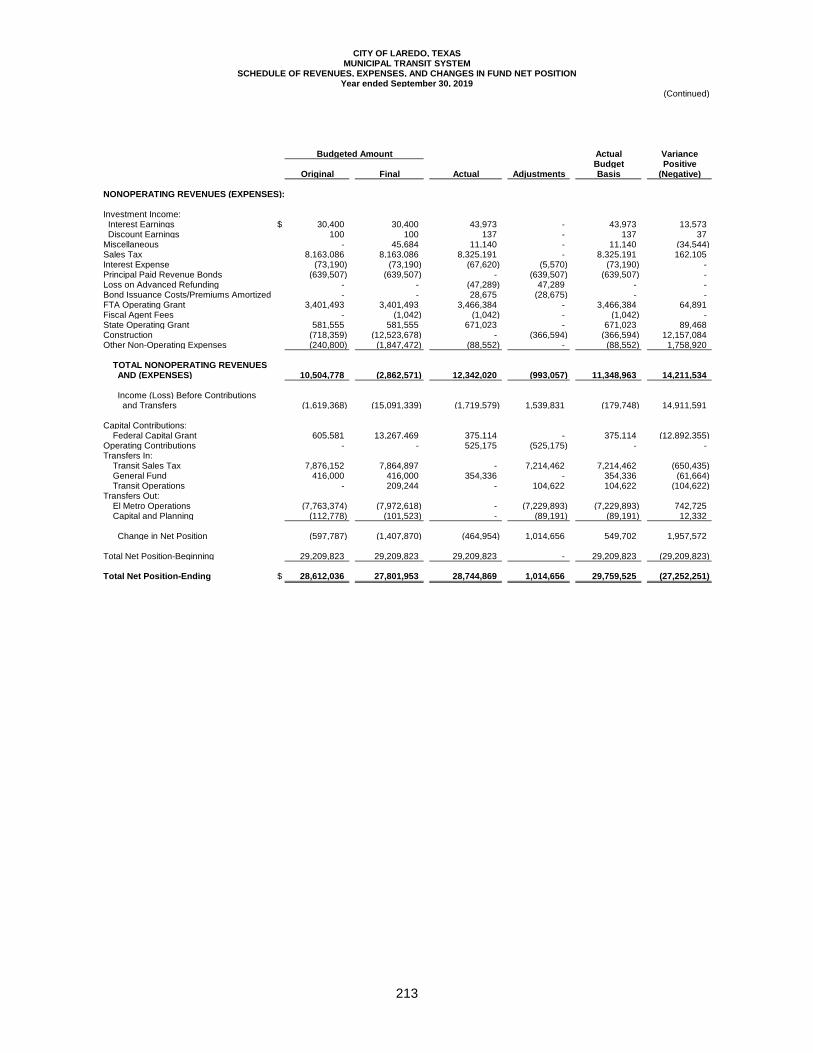
CITY OF LAREDO, TEXASMUNICIPAL TRANSIT SYSTEM
SCHEDULE OF REVENUES, EXPENSES, AND CHANGES IN FUND NET POSITIONYear ended September 30, 2019
(Continued)
Budgeted Amount Actual VarianceBudget Positive
Original Final Actual Adjustments Basis (Negative)
NONOPERATING REVENUES (EXPENSES):
Investment Income: Interest Earnings $ 30,400 30,400 43,973 - 43,973 13,573 Discount Earnings 100 100 137 - 137 37 Miscellaneous - 45,684 11,140 - 11,140 (34,544) Sales Tax 8,163,086 8,163,086 8,325,191 - 8,325,191 162,105 Interest Expense (73,190) (73,190) (67,620) (5,570) (73,190) - Principal Paid Revenue Bonds (639,507) (639,507) - (639,507) (639,507) - Loss on Advanced Refunding - - (47,289) 47,289 - - Bond Issuance Costs/Premiums Amortized - - 28,675 (28,675) - - FTA Operating Grant 3,401,493 3,401,493 3,466,384 - 3,466,384 64,891 Fiscal Agent Fees - (1,042) (1,042) - (1,042) - State Operating Grant 581,555 581,555 671,023 - 671,023 89,468 Construction (718,359) (12,523,678) - (366,594) (366,594) 12,157,084 Other Non-Operating Expenses (240,800) (1,847,472) (88,552) - (88,552) 1,758,920
TOTAL NONOPERATING REVENUES AND (EXPENSES) 10,504,778 (2,862,571) 12,342,020 (993,057) 11,348,963 14,211,534
Income (Loss) Before Contributions and Transfers (1,619,368) (15,091,339) (1,719,579) 1,539,831 (179,748) 14,911,591
Capital Contributions: Federal Capital Grant 605,581 13,267,469 375,114 - 375,114 (12,892,355) Operating Contributions - - 525,175 (525,175) - - Transfers In: Transit Sales Tax 7,876,152 7,864,897 - 7,214,462 7,214,462 (650,435) General Fund 416,000 416,000 354,336 - 354,336 (61,664) Transit Operations - 209,244 - 104,622 104,622 (104,622) Transfers Out: El Metro Operations (7,763,374) (7,972,618) - (7,229,893) (7,229,893) 742,725 Capital and Planning (112,778) (101,523) - (89,191) (89,191) 12,332
Change in Net Position (597,787) (1,407,870) (464,954) 1,014,656 549,702 1,957,572
Total Net Position-Beginning 29,209,823 29,209,823 29,209,823 - 29,209,823 (29,209,823)
Total Net Position-Ending $ 28,612,036 27,801,953 28,744,869 1,014,656 29,759,525 (27,252,251)
213
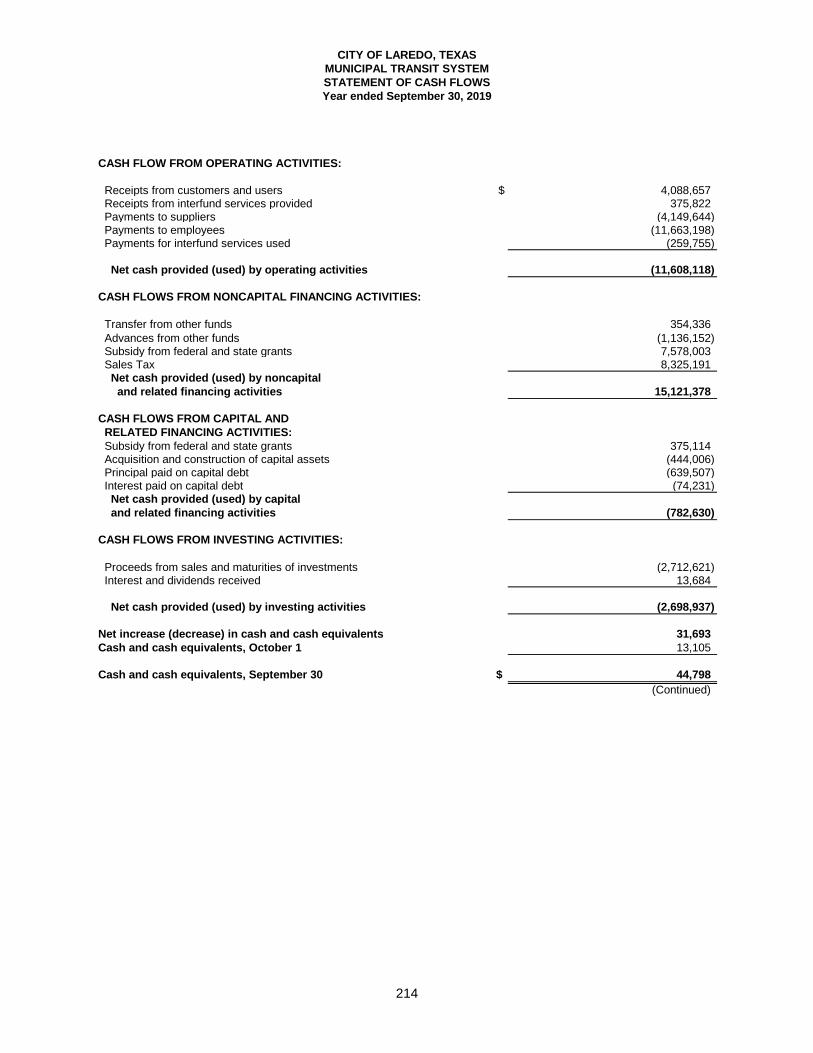
CITY OF LAREDO, TEXAS
MUNICIPAL TRANSIT SYSTEM
STATEMENT OF CASH FLOWS
Year ended September 30, 2019
CASH FLOW FROM OPERATING ACTIVITIES:
Receipts from customers and users $ 4,088,657 Receipts from interfund services provided 375,822 Payments to suppliers (4,149,644) Payments to employees (11,663,198) Payments for interfund services used (259,755)
Net cash provided (used) by operating activities (11,608,118)
CASH FLOWS FROM NONCAPITAL FINANCING ACTIVITIES:
Transfer from other funds 354,336 Advances from other funds (1,136,152) Subsidy from federal and state grants 7,578,003 Sales Tax 8,325,191 Net cash provided (used) by noncapital
and related financing activities 15,121,378
CASH FLOWS FROM CAPITAL AND
RELATED FINANCING ACTIVITIES:
Subsidy from federal and state grants 375,114 Acquisition and construction of capital assets (444,006) Principal paid on capital debt (639,507) Interest paid on capital debt (74,231) Net cash provided (used) by capital
and related financing activities (782,630)
CASH FLOWS FROM INVESTING ACTIVITIES:
Proceeds from sales and maturities of investments (2,712,621) Interest and dividends received 13,684
Net cash provided (used) by investing activities (2,698,937)
Net increase (decrease) in cash and cash equivalents 31,693
Cash and cash equivalents, October 1 13,105
Cash and cash equivalents, September 30 $ 44,798
(Continued)
214

CITY OF LAREDO, TEXAS
MUNICIPAL TRANSIT SYSTEM
STATEMENT OF CASH FLOWS
Year ended September 30, 2019
(Continued)
Reconciliation of operating income to
net cash provided (used) by operating
activities:
Operating income $ (14,061,599) Adjustments to reconcile operating income to net cash provided (used) by operating activities: Depreciation expense 2,516,530 (Increase) decrease in accounts receivable (2,908) (Increase) decrease in inventories 20,583 Increase in customer deposits 565 Increase (decrease) in accounts payable 70,288 Increase (decrease) in compensated absences payable 16,359 Increase (decrease) in net pension liability (66,494) Increase (decrease) in deferred outflows-pension (230,932) Increase (decrease) in deferred inflows-pension 106,947 Increase (decrease) in accrued wages and employee benefits 22,543
Total adjustments 2,453,481
Net cash provided (used) by operating activities $ (11,608,118)
Noncash investing, capital and financing
activities:
Contribution 525,175 Bond issuance cost amortized 28,675 Accrued interest payable 5,570 Loss on Advance Refunding (47,289)
215
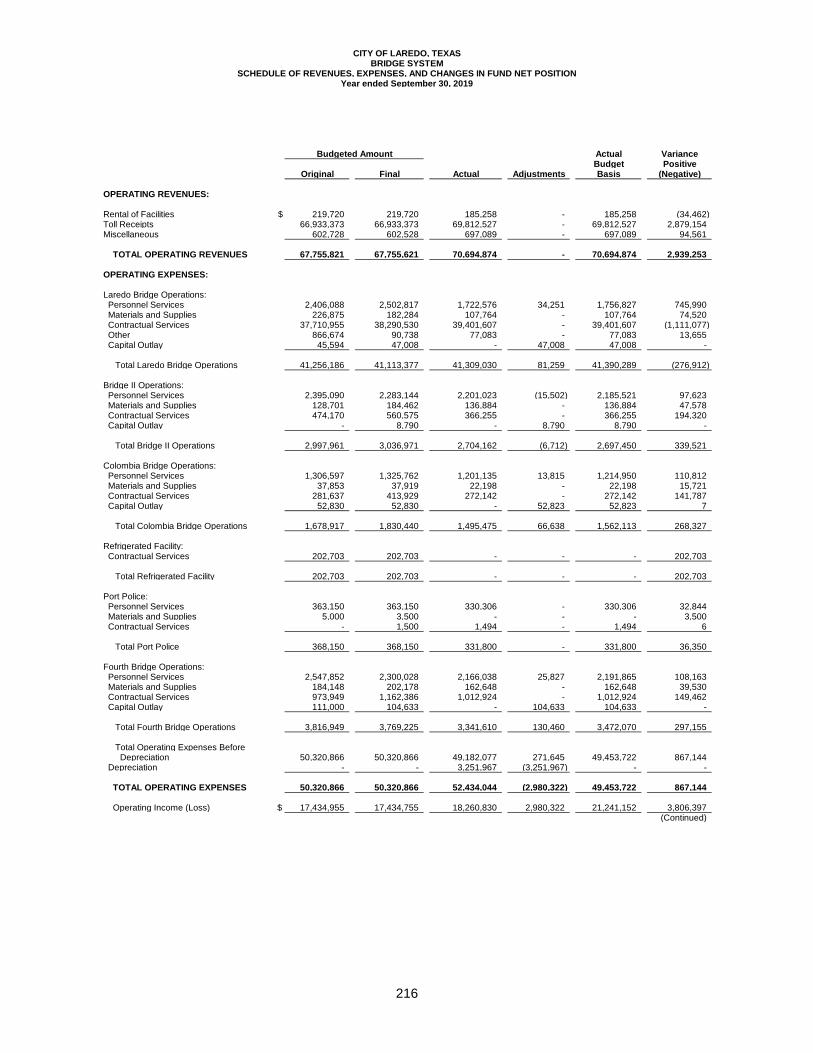
CITY OF LAREDO, TEXASBRIDGE SYSTEM
SCHEDULE OF REVENUES, EXPENSES, AND CHANGES IN FUND NET POSITIONYear ended September 30, 2019
Budgeted Amount Actual VarianceBudget Positive
Original Final Actual Adjustments Basis (Negative)
OPERATING REVENUES:
Rental of Facilities $ 219,720 219,720 185,258 - 185,258 (34,462) Toll Receipts 66,933,373 66,933,373 69,812,527 - 69,812,527 2,879,154 Miscellaneous 602,728 602,528 697,089 - 697,089 94,561
TOTAL OPERATING REVENUES 67,755,821 67,755,621 70,694,874 - 70,694,874 2,939,253
OPERATING EXPENSES:
Laredo Bridge Operations: Personnel Services 2,406,088 2,502,817 1,722,576 34,251 1,756,827 745,990 Materials and Supplies 226,875 182,284 107,764 - 107,764 74,520 Contractual Services 37,710,955 38,290,530 39,401,607 - 39,401,607 (1,111,077) Other 866,674 90,738 77,083 - 77,083 13,655 Capital Outlay 45,594 47,008 - 47,008 47,008 -
Total Laredo Bridge Operations 41,256,186 41,113,377 41,309,030 81,259 41,390,289 (276,912)
Bridge II Operations: Personnel Services 2,395,090 2,283,144 2,201,023 (15,502) 2,185,521 97,623 Materials and Supplies 128,701 184,462 136,884 - 136,884 47,578 Contractual Services 474,170 560,575 366,255 - 366,255 194,320 Capital Outlay - 8,790 - 8,790 8,790 -
Total Bridge II Operations 2,997,961 3,036,971 2,704,162 (6,712) 2,697,450 339,521
Colombia Bridge Operations: Personnel Services 1,306,597 1,325,762 1,201,135 13,815 1,214,950 110,812 Materials and Supplies 37,853 37,919 22,198 - 22,198 15,721 Contractual Services 281,637 413,929 272,142 - 272,142 141,787 Capital Outlay 52,830 52,830 - 52,823 52,823 7
Total Colombia Bridge Operations 1,678,917 1,830,440 1,495,475 66,638 1,562,113 268,327
Refrigerated Facility: Contractual Services 202,703 202,703 - - - 202,703
Total Refrigerated Facility 202,703 202,703 - - - 202,703
Port Police: Personnel Services 363,150 363,150 330,306 - 330,306 32,844 Materials and Supplies 5,000 3,500 - - - 3,500 Contractual Services - 1,500 1,494 - 1,494 6
Total Port Police 368,150 368,150 331,800 - 331,800 36,350
Fourth Bridge Operations: Personnel Services 2,547,852 2,300,028 2,166,038 25,827 2,191,865 108,163 Materials and Supplies 184,148 202,178 162,648 - 162,648 39,530 Contractual Services 973,949 1,162,386 1,012,924 - 1,012,924 149,462 Capital Outlay 111,000 104,633 - 104,633 104,633 -
Total Fourth Bridge Operations 3,816,949 3,769,225 3,341,610 130,460 3,472,070 297,155
Total Operating Expenses Before Depreciation 50,320,866 50,320,866 49,182,077 271,645 49,453,722 867,144 Depreciation - - 3,251,967 (3,251,967) - -
TOTAL OPERATING EXPENSES 50,320,866 50,320,866 52,434,044 (2,980,322) 49,453,722 867,144 Operating Income (Loss) $ 17,434,955 17,434,755 18,260,830 2,980,322 21,241,152 3,806,397
(Continued)
216
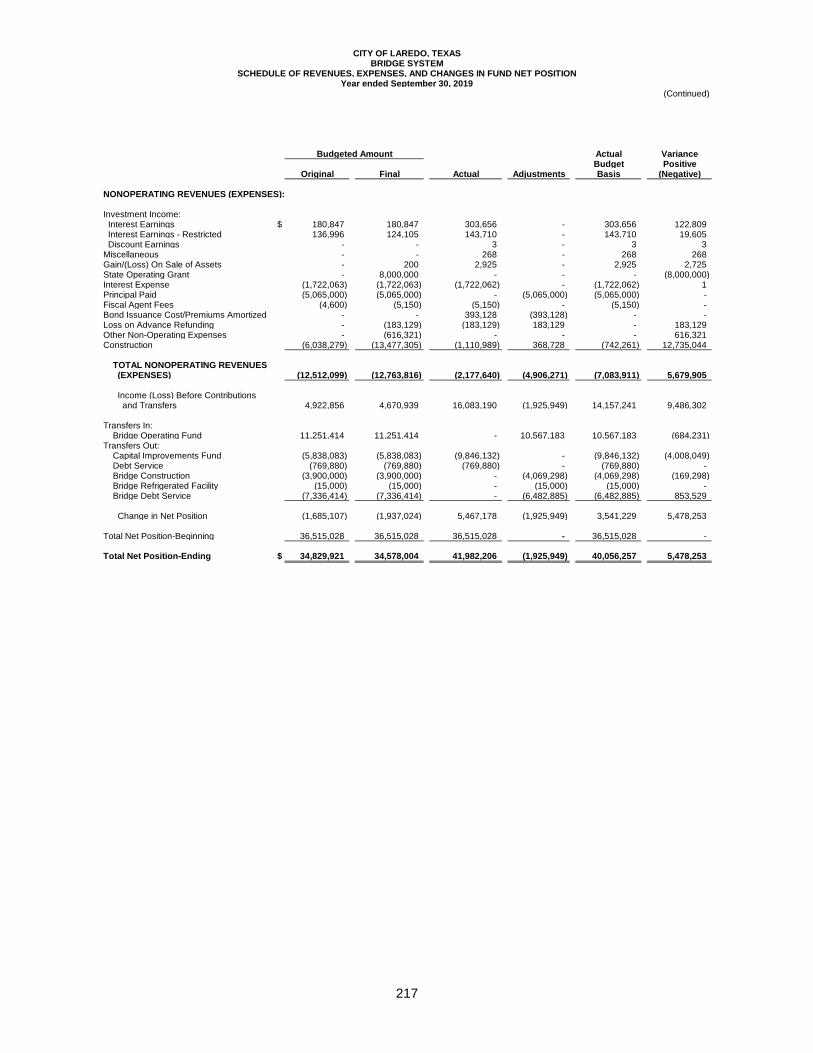
CITY OF LAREDO, TEXASBRIDGE SYSTEM
SCHEDULE OF REVENUES, EXPENSES, AND CHANGES IN FUND NET POSITIONYear ended September 30, 2019
(Continued)
Budgeted Amount Actual VarianceBudget Positive
Original Final Actual Adjustments Basis (Negative)
NONOPERATING REVENUES (EXPENSES):
Investment Income: Interest Earnings $ 180,847 180,847 303,656 - 303,656 122,809 Interest Earnings - Restricted 136,996 124,105 143,710 - 143,710 19,605 Discount Earnings - - 3 - 3 3 Miscellaneous - - 268 - 268 268 Gain/(Loss) On Sale of Assets - 200 2,925 - 2,925 2,725 State Operating Grant - 8,000,000 - - - (8,000,000) Interest Expense (1,722,063) (1,722,063) (1,722,062) - (1,722,062) 1 Principal Paid (5,065,000) (5,065,000) - (5,065,000) (5,065,000) - Fiscal Agent Fees (4,600) (5,150) (5,150) - (5,150) - Bond Issuance Cost/Premiums Amortized - - 393,128 (393,128) - - Loss on Advance Refunding - (183,129) (183,129) 183,129 - 183,129 Other Non-Operating Expenses - (616,321) - - - 616,321 Construction (6,038,279) (13,477,305) (1,110,989) 368,728 (742,261) 12,735,044
TOTAL NONOPERATING REVENUES (EXPENSES) (12,512,099) (12,763,816) (2,177,640) (4,906,271) (7,083,911) 5,679,905
Income (Loss) Before Contributions and Transfers 4,922,856 4,670,939 16,083,190 (1,925,949) 14,157,241 9,486,302
Transfers In: Bridge Operating Fund 11,251,414 11,251,414 - 10,567,183 10,567,183 (684,231) Transfers Out: Capital Improvements Fund (5,838,083) (5,838,083) (9,846,132) - (9,846,132) (4,008,049) Debt Service (769,880) (769,880) (769,880) - (769,880) - Bridge Construction (3,900,000) (3,900,000) - (4,069,298) (4,069,298) (169,298) Bridge Refrigerated Facility (15,000) (15,000) - (15,000) (15,000) - Bridge Debt Service (7,336,414) (7,336,414) - (6,482,885) (6,482,885) 853,529
Change in Net Position (1,685,107) (1,937,024) 5,467,178 (1,925,949) 3,541,229 5,478,253
Total Net Position-Beginning 36,515,028 36,515,028 36,515,028 - 36,515,028 -
Total Net Position-Ending $ 34,829,921 34,578,004 41,982,206 (1,925,949) 40,056,257 5,478,253
217
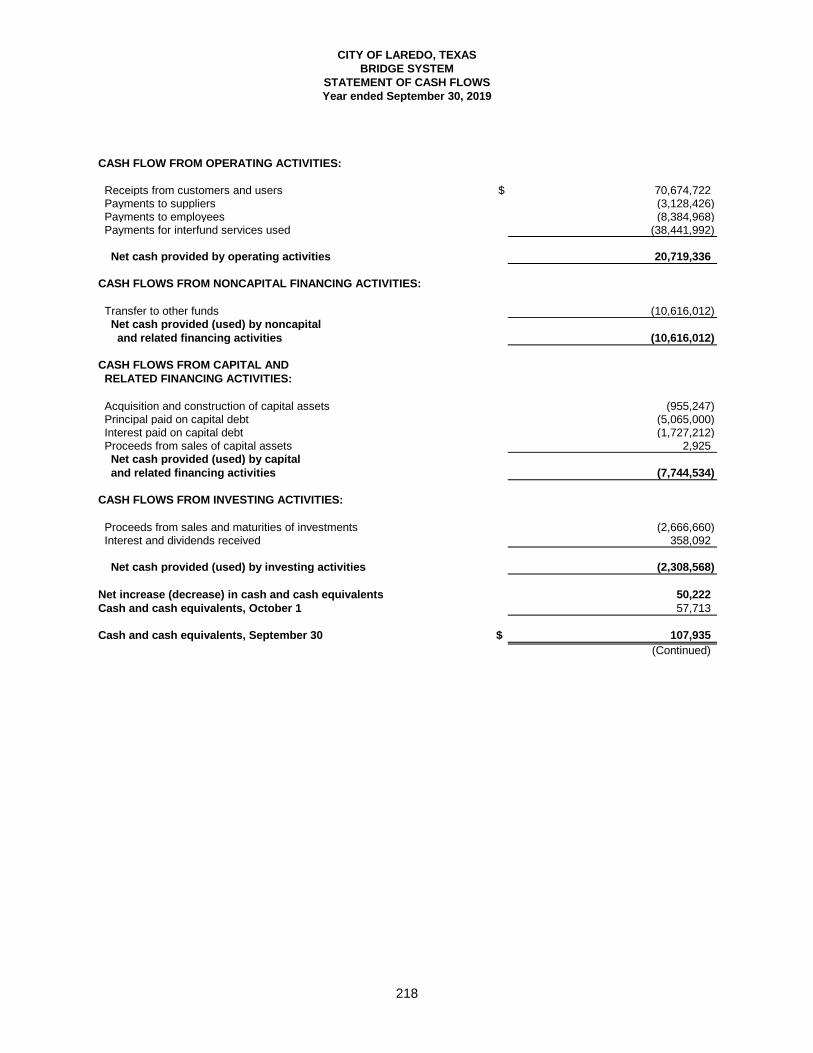
CITY OF LAREDO, TEXAS
BRIDGE SYSTEM
STATEMENT OF CASH FLOWS
Year ended September 30, 2019
CASH FLOW FROM OPERATING ACTIVITIES:
Receipts from customers and users $ 70,674,722 Payments to suppliers (3,128,426) Payments to employees (8,384,968) Payments for interfund services used (38,441,992)
Net cash provided by operating activities 20,719,336
CASH FLOWS FROM NONCAPITAL FINANCING ACTIVITIES:
Transfer to other funds (10,616,012) Net cash provided (used) by noncapital
and related financing activities (10,616,012)
CASH FLOWS FROM CAPITAL AND
RELATED FINANCING ACTIVITIES:
Acquisition and construction of capital assets (955,247) Principal paid on capital debt (5,065,000) Interest paid on capital debt (1,727,212) Proceeds from sales of capital assets 2,925 Net cash provided (used) by capital
and related financing activities (7,744,534)
CASH FLOWS FROM INVESTING ACTIVITIES:
Proceeds from sales and maturities of investments (2,666,660) Interest and dividends received 358,092
Net cash provided (used) by investing activities (2,308,568)
Net increase (decrease) in cash and cash equivalents 50,222
Cash and cash equivalents, October 1 57,713
Cash and cash equivalents, September 30 $ 107,935
(Continued)
218
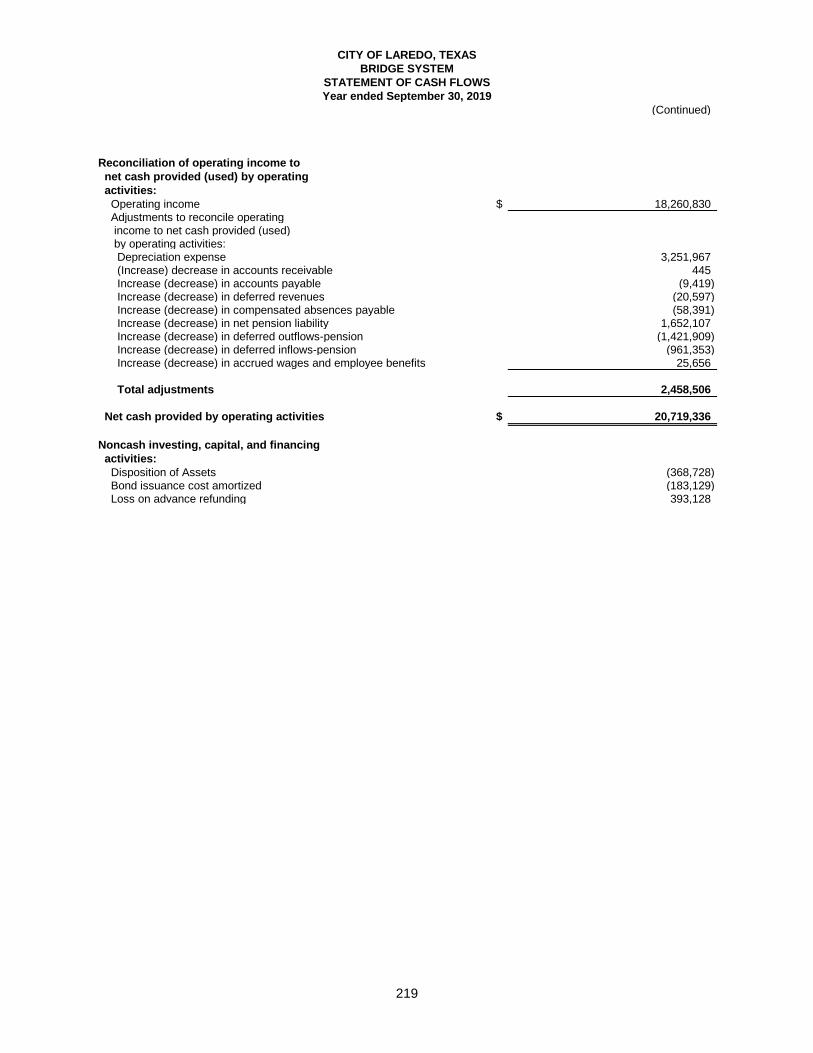
CITY OF LAREDO, TEXAS
BRIDGE SYSTEM
STATEMENT OF CASH FLOWS
Year ended September 30, 2019
(Continued)
Reconciliation of operating income to
net cash provided (used) by operating
activities:
Operating income $ 18,260,830 Adjustments to reconcile operating income to net cash provided (used) by operating activities: Depreciation expense 3,251,967 (Increase) decrease in accounts receivable 445
Increase (decrease) in accounts payable (9,419) Increase (decrease) in deferred revenues (20,597) Increase (decrease) in compensated absences payable (58,391) Increase (decrease) in net pension liability 1,652,107 Increase (decrease) in deferred outflows-pension (1,421,909) Increase (decrease) in deferred inflows-pension (961,353) Increase (decrease) in accrued wages and employee benefits 25,656
Total adjustments 2,458,506
Net cash provided by operating activities $ 20,719,336
Noncash investing, capital, and financing
activities:
Disposition of Assets (368,728) Bond issuance cost amortized (183,129) Loss on advance refunding 393,128
219
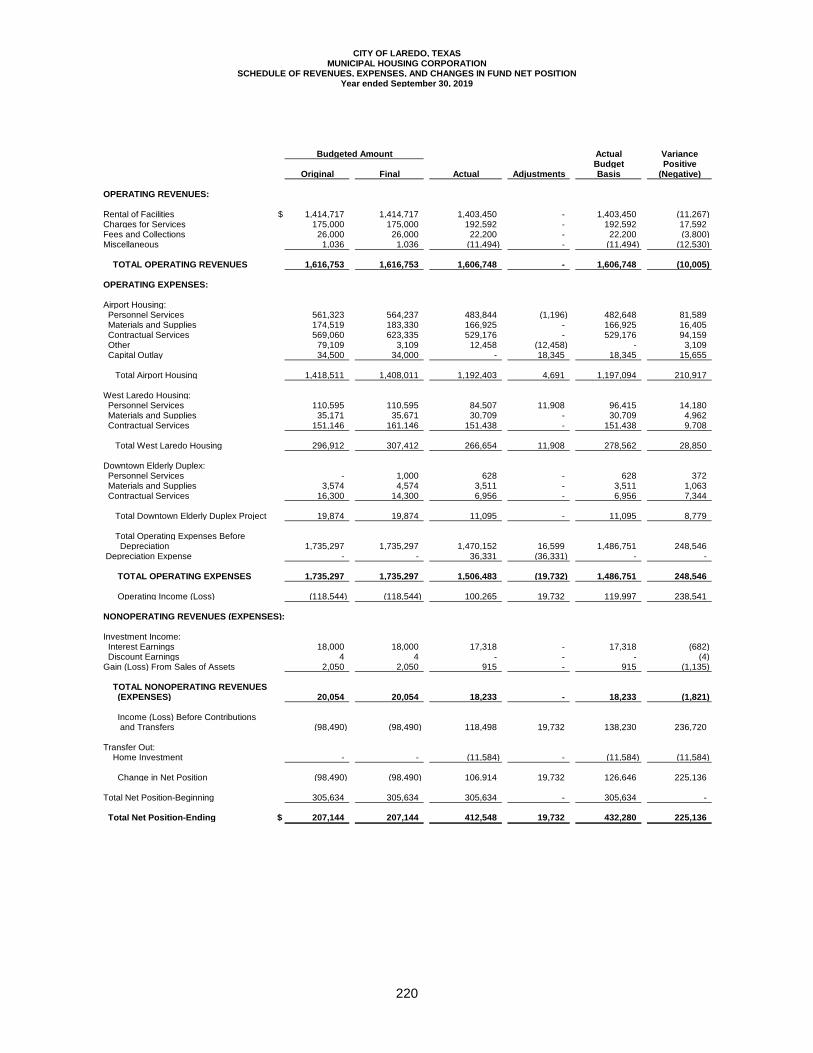
CITY OF LAREDO, TEXASMUNICIPAL HOUSING CORPORATION
SCHEDULE OF REVENUES, EXPENSES, AND CHANGES IN FUND NET POSITIONYear ended September 30, 2019
Budgeted Amount Actual VarianceBudget Positive
Original Final Actual Adjustments Basis (Negative)
OPERATING REVENUES:
Rental of Facilities $ 1,414,717 1,414,717 1,403,450 - 1,403,450 (11,267) Charges for Services 175,000 175,000 192,592 - 192,592 17,592 Fees and Collections 26,000 26,000 22,200 - 22,200 (3,800) Miscellaneous 1,036 1,036 (11,494) - (11,494) (12,530)
TOTAL OPERATING REVENUES 1,616,753 1,616,753 1,606,748 - 1,606,748 (10,005)
OPERATING EXPENSES:
Airport Housing: Personnel Services 561,323 564,237 483,844 (1,196) 482,648 81,589 Materials and Supplies 174,519 183,330 166,925 - 166,925 16,405 Contractual Services 569,060 623,335 529,176 - 529,176 94,159 Other 79,109 3,109 12,458 (12,458) - 3,109 Capital Outlay 34,500 34,000 - 18,345 18,345 15,655
Total Airport Housing 1,418,511 1,408,011 1,192,403 4,691 1,197,094 210,917
West Laredo Housing: Personnel Services 110,595 110,595 84,507 11,908 96,415 14,180 Materials and Supplies 35,171 35,671 30,709 - 30,709 4,962 Contractual Services 151,146 161,146 151,438 - 151,438 9,708
Total West Laredo Housing 296,912 307,412 266,654 11,908 278,562 28,850
Downtown Elderly Duplex: Personnel Services - 1,000 628 - 628 372 Materials and Supplies 3,574 4,574 3,511 - 3,511 1,063 Contractual Services 16,300 14,300 6,956 - 6,956 7,344
Total Downtown Elderly Duplex Project 19,874 19,874 11,095 - 11,095 8,779
Total Operating Expenses Before Depreciation 1,735,297 1,735,297 1,470,152 16,599 1,486,751 248,546 Depreciation Expense - - 36,331 (36,331) - -
TOTAL OPERATING EXPENSES 1,735,297 1,735,297 1,506,483 (19,732) 1,486,751 248,546
Operating Income (Loss) (118,544) (118,544) 100,265 19,732 119,997 238,541
NONOPERATING REVENUES (EXPENSES):
Investment Income: Interest Earnings 18,000 18,000 17,318 - 17,318 (682) Discount Earnings 4 4 - - - (4) Gain (Loss) From Sales of Assets 2,050 2,050 915 - 915 (1,135)
TOTAL NONOPERATING REVENUES (EXPENSES) 20,054 20,054 18,233 - 18,233 (1,821)
Income (Loss) Before Contributions and Transfers (98,490) (98,490) 118,498 19,732 138,230 236,720
Transfer Out: Home Investment - - (11,584) - (11,584) (11,584)
Change in Net Position (98,490) (98,490) 106,914 19,732 126,646 225,136
Total Net Position-Beginning 305,634 305,634 305,634 - 305,634 -
Total Net Position-Ending $ 207,144 207,144 412,548 19,732 432,280 225,136
220
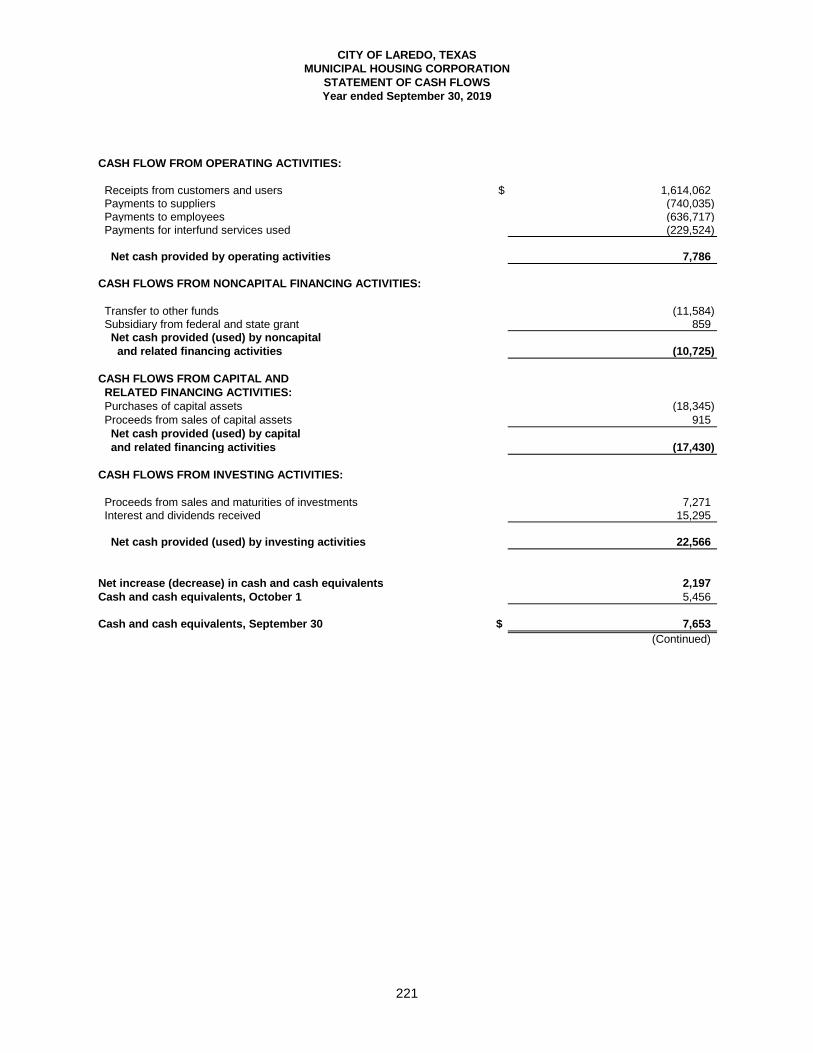
CITY OF LAREDO, TEXAS
MUNICIPAL HOUSING CORPORATION
STATEMENT OF CASH FLOWS
Year ended September 30, 2019
CASH FLOW FROM OPERATING ACTIVITIES:
Receipts from customers and users $ 1,614,062 Payments to suppliers (740,035) Payments to employees (636,717) Payments for interfund services used (229,524)
Net cash provided by operating activities 7,786
CASH FLOWS FROM NONCAPITAL FINANCING ACTIVITIES:
Transfer to other funds (11,584) Subsidiary from federal and state grant 859 Net cash provided (used) by noncapital
and related financing activities (10,725)
CASH FLOWS FROM CAPITAL AND
RELATED FINANCING ACTIVITIES:
Purchases of capital assets (18,345) Proceeds from sales of capital assets 915 Net cash provided (used) by capital
and related financing activities (17,430)
CASH FLOWS FROM INVESTING ACTIVITIES:
Proceeds from sales and maturities of investments 7,271 Interest and dividends received 15,295
Net cash provided (used) by investing activities 22,566
Net increase (decrease) in cash and cash equivalents 2,197
Cash and cash equivalents, October 1 5,456
Cash and cash equivalents, September 30 $ 7,653
(Continued)
221
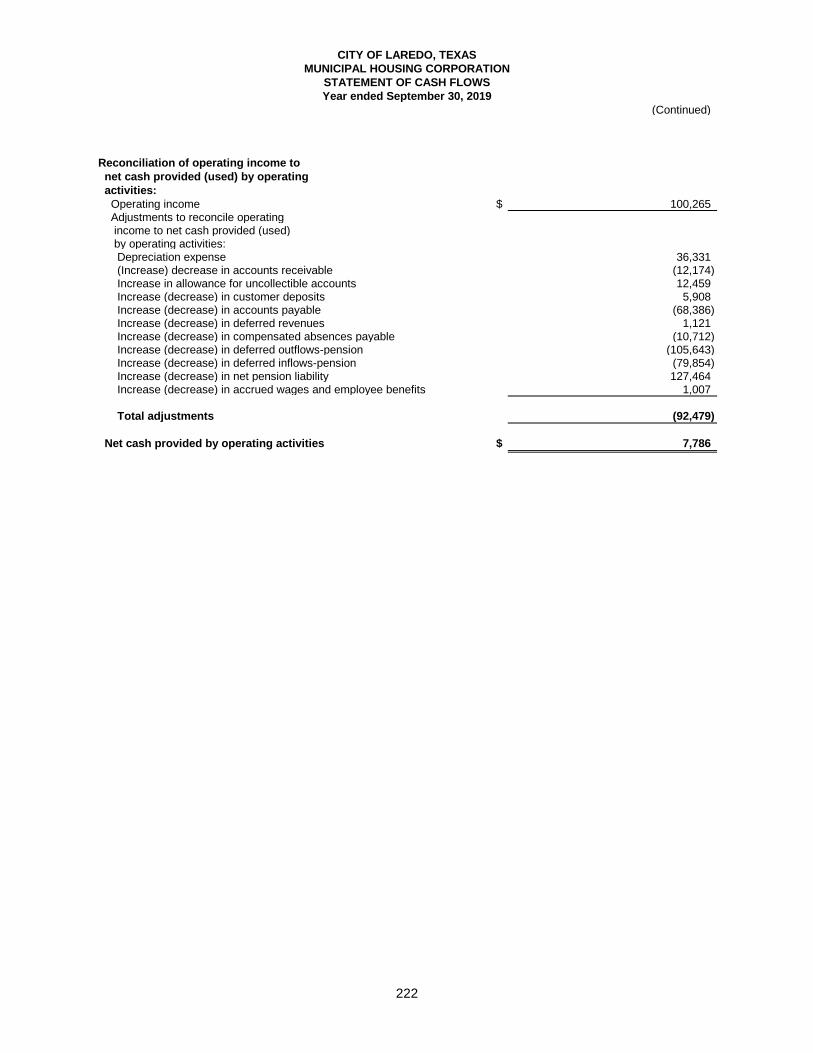
CITY OF LAREDO, TEXAS
MUNICIPAL HOUSING CORPORATION
STATEMENT OF CASH FLOWS
Year ended September 30, 2019
(Continued)
Reconciliation of operating income to
net cash provided (used) by operating
activities:
Operating income $ 100,265 Adjustments to reconcile operating income to net cash provided (used) by operating activities: Depreciation expense 36,331 (Increase) decrease in accounts receivable (12,174) Increase in allowance for uncollectible accounts 12,459 Increase (decrease) in customer deposits 5,908 Increase (decrease) in accounts payable (68,386) Increase (decrease) in deferred revenues 1,121 Increase (decrease) in compensated absences payable (10,712) Increase (decrease) in deferred outflows-pension (105,643) Increase (decrease) in deferred inflows-pension (79,854) Increase (decrease) in net pension liability 127,464 Increase (decrease) in accrued wages and employee benefits 1,007
Total adjustments (92,479)
Net cash provided by operating activities $ 7,786
222
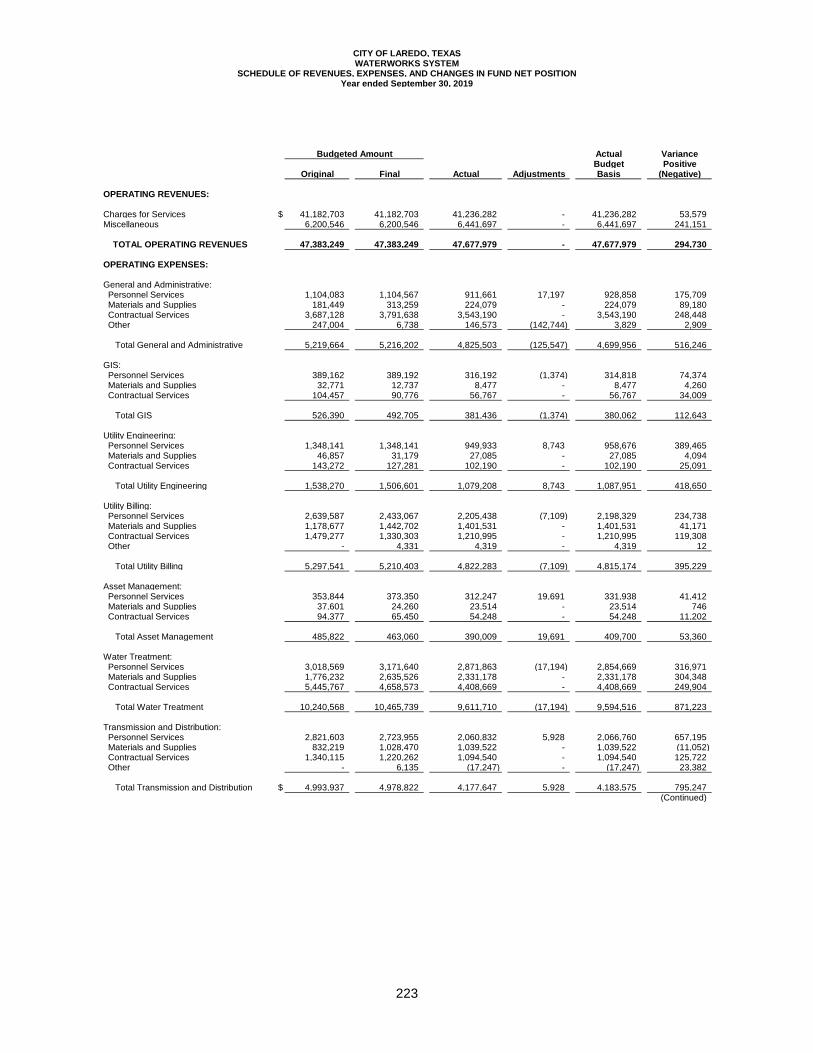
CITY OF LAREDO, TEXASWATERWORKS SYSTEM
SCHEDULE OF REVENUES, EXPENSES, AND CHANGES IN FUND NET POSITIONYear ended September 30, 2019
Budgeted Amount Actual VarianceBudget Positive
Original Final Actual Adjustments Basis (Negative)
OPERATING REVENUES:
Charges for Services $ 41,182,703 41,182,703 41,236,282 - 41,236,282 53,579 Miscellaneous 6,200,546 6,200,546 6,441,697 - 6,441,697 241,151
TOTAL OPERATING REVENUES 47,383,249 47,383,249 47,677,979 - 47,677,979 294,730
OPERATING EXPENSES:
General and Administrative: Personnel Services 1,104,083 1,104,567 911,661 17,197 928,858 175,709 Materials and Supplies 181,449 313,259 224,079 - 224,079 89,180 Contractual Services 3,687,128 3,791,638 3,543,190 - 3,543,190 248,448 Other 247,004 6,738 146,573 (142,744) 3,829 2,909
Total General and Administrative 5,219,664 5,216,202 4,825,503 (125,547) 4,699,956 516,246
GIS: Personnel Services 389,162 389,192 316,192 (1,374) 314,818 74,374 Materials and Supplies 32,771 12,737 8,477 - 8,477 4,260 Contractual Services 104,457 90,776 56,767 - 56,767 34,009
Total GIS 526,390 492,705 381,436 (1,374) 380,062 112,643
Utility Engineering: Personnel Services 1,348,141 1,348,141 949,933 8,743 958,676 389,465 Materials and Supplies 46,857 31,179 27,085 - 27,085 4,094 Contractual Services 143,272 127,281 102,190 - 102,190 25,091
Total Utility Engineering 1,538,270 1,506,601 1,079,208 8,743 1,087,951 418,650
Utility Billing: Personnel Services 2,639,587 2,433,067 2,205,438 (7,109) 2,198,329 234,738 Materials and Supplies 1,178,677 1,442,702 1,401,531 - 1,401,531 41,171 Contractual Services 1,479,277 1,330,303 1,210,995 - 1,210,995 119,308 Other - 4,331 4,319 - 4,319 12
Total Utility Billing 5,297,541 5,210,403 4,822,283 (7,109) 4,815,174 395,229
Asset Management: Personnel Services 353,844 373,350 312,247 19,691 331,938 41,412 Materials and Supplies 37,601 24,260 23,514 - 23,514 746 Contractual Services 94,377 65,450 54,248 - 54,248 11,202
Total Asset Management 485,822 463,060 390,009 19,691 409,700 53,360
Water Treatment: Personnel Services 3,018,569 3,171,640 2,871,863 (17,194) 2,854,669 316,971 Materials and Supplies 1,776,232 2,635,526 2,331,178 - 2,331,178 304,348 Contractual Services 5,445,767 4,658,573 4,408,669 - 4,408,669 249,904
Total Water Treatment 10,240,568 10,465,739 9,611,710 (17,194) 9,594,516 871,223
Transmission and Distribution: Personnel Services 2,821,603 2,723,955 2,060,832 5,928 2,066,760 657,195 Materials and Supplies 832,219 1,028,470 1,039,522 - 1,039,522 (11,052) Contractual Services 1,340,115 1,220,262 1,094,540 - 1,094,540 125,722 Other - 6,135 (17,247) - (17,247) 23,382
Total Transmission and Distribution $ 4,993,937 4,978,822 4,177,647 5,928 4,183,575 795,247 (Continued)
223
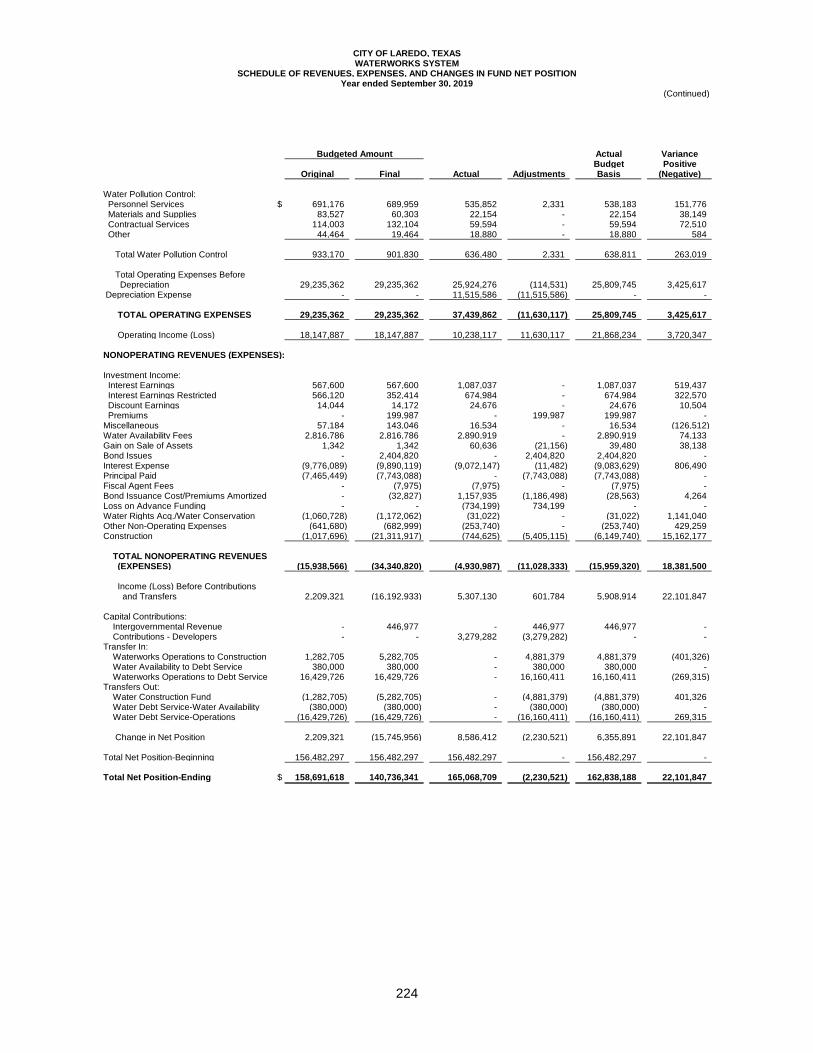
CITY OF LAREDO, TEXASWATERWORKS SYSTEM
SCHEDULE OF REVENUES, EXPENSES, AND CHANGES IN FUND NET POSITIONYear ended September 30, 2019
(Continued)
Budgeted Amount Actual VarianceBudget Positive
Original Final Actual Adjustments Basis (Negative)
Water Pollution Control: Personnel Services $ 691,176 689,959 535,852 2,331 538,183 151,776 Materials and Supplies 83,527 60,303 22,154 - 22,154 38,149 Contractual Services 114,003 132,104 59,594 - 59,594 72,510 Other 44,464 19,464 18,880 - 18,880 584
Total Water Pollution Control 933,170 901,830 636,480 2,331 638,811 263,019
Total Operating Expenses Before Depreciation 29,235,362 29,235,362 25,924,276 (114,531) 25,809,745 3,425,617 Depreciation Expense - - 11,515,586 (11,515,586) - -
TOTAL OPERATING EXPENSES 29,235,362 29,235,362 37,439,862 (11,630,117) 25,809,745 3,425,617
Operating Income (Loss) 18,147,887 18,147,887 10,238,117 11,630,117 21,868,234 3,720,347
NONOPERATING REVENUES (EXPENSES):
Investment Income: Interest Earnings 567,600 567,600 1,087,037 - 1,087,037 519,437 Interest Earnings Restricted 566,120 352,414 674,984 - 674,984 322,570 Discount Earnings 14,044 14,172 24,676 - 24,676 10,504 Premiums - 199,987 - 199,987 199,987 - Miscellaneous 57,184 143,046 16,534 - 16,534 (126,512) Water Availability Fees 2,816,786 2,816,786 2,890,919 - 2,890,919 74,133 Gain on Sale of Assets 1,342 1,342 60,636 (21,156) 39,480 38,138 Bond Issues - 2,404,820 - 2,404,820 2,404,820 - Interest Expense (9,776,089) (9,890,119) (9,072,147) (11,482) (9,083,629) 806,490 Principal Paid (7,465,449) (7,743,088) - (7,743,088) (7,743,088) - Fiscal Agent Fees - (7,975) (7,975) - (7,975) - Bond Issuance Cost/Premiums Amortized - (32,827) 1,157,935 (1,186,498) (28,563) 4,264 Loss on Advance Funding - - (734,199) 734,199 - - Water Rights Acq./Water Conservation (1,060,728) (1,172,062) (31,022) - (31,022) 1,141,040 Other Non-Operating Expenses (641,680) (682,999) (253,740) - (253,740) 429,259 Construction (1,017,696) (21,311,917) (744,625) (5,405,115) (6,149,740) 15,162,177
TOTAL NONOPERATING REVENUES (EXPENSES) (15,938,566) (34,340,820) (4,930,987) (11,028,333) (15,959,320) 18,381,500
Income (Loss) Before Contributions and Transfers 2,209,321 (16,192,933) 5,307,130 601,784 5,908,914 22,101,847
Capital Contributions: Intergovernmental Revenue - 446,977 - 446,977 446,977 - Contributions - Developers - - 3,279,282 (3,279,282) - - Transfer In: Waterworks Operations to Construction 1,282,705 5,282,705 - 4,881,379 4,881,379 (401,326) Water Availability to Debt Service 380,000 380,000 - 380,000 380,000 - Waterworks Operations to Debt Service 16,429,726 16,429,726 - 16,160,411 16,160,411 (269,315) Transfers Out: Water Construction Fund (1,282,705) (5,282,705) - (4,881,379) (4,881,379) 401,326 Water Debt Service-Water Availability (380,000) (380,000) - (380,000) (380,000) - Water Debt Service-Operations (16,429,726) (16,429,726) - (16,160,411) (16,160,411) 269,315
Change in Net Position 2,209,321 (15,745,956) 8,586,412 (2,230,521) 6,355,891 22,101,847
Total Net Position-Beginning 156,482,297 156,482,297 156,482,297 - 156,482,297 -
Total Net Position-Ending $ 158,691,618 140,736,341 165,068,709 (2,230,521) 162,838,188 22,101,847
224
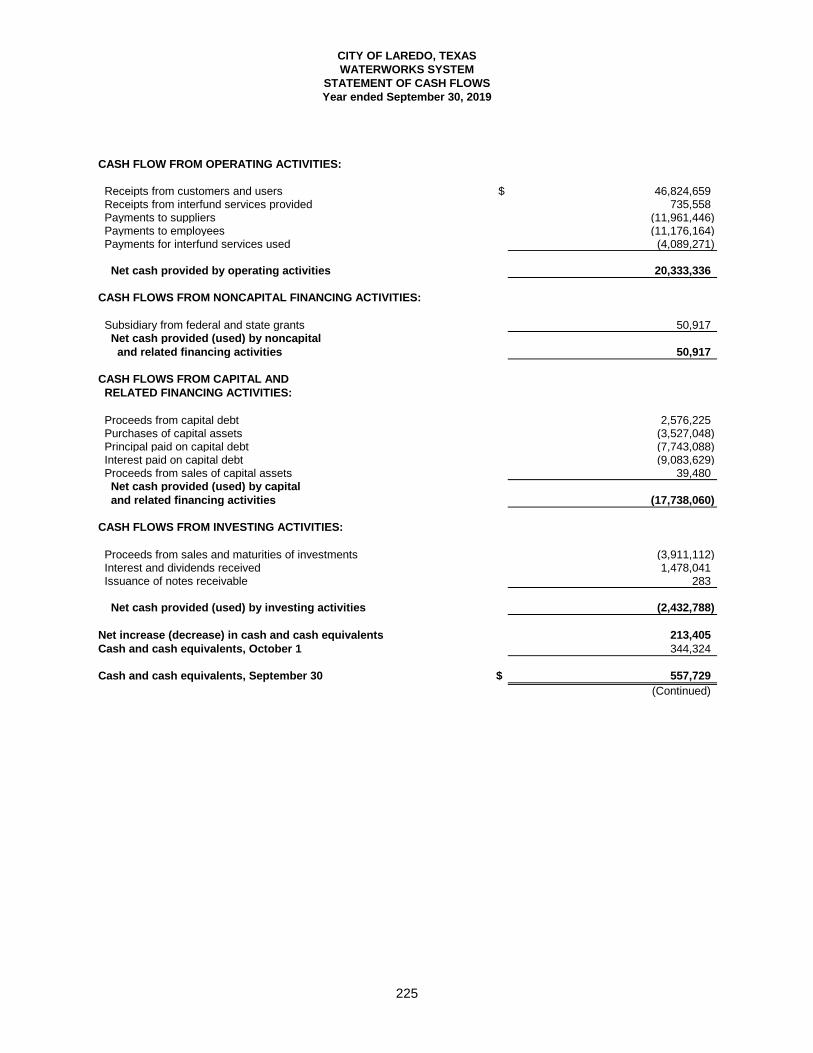
WATERWORKS SYSTEM
STATEMENT OF CASH FLOWS
Year ended September 30, 2019
CASH FLOW FROM OPERATING ACTIVITIES:
Receipts from customers and users $ 46,824,659 Receipts from interfund services provided 735,558 Payments to suppliers (11,961,446) Payments to employees (11,176,164) Payments for interfund services used (4,089,271)
Net cash provided by operating activities 20,333,336
CASH FLOWS FROM NONCAPITAL FINANCING ACTIVITIES:
Subsidiary from federal and state grants 50,917 Net cash provided (used) by noncapital
and related financing activities 50,917
CASH FLOWS FROM CAPITAL AND
RELATED FINANCING ACTIVITIES:
Proceeds from capital debt 2,576,225 Purchases of capital assets (3,527,048) Principal paid on capital debt (7,743,088) Interest paid on capital debt (9,083,629) Proceeds from sales of capital assets 39,480 Net cash provided (used) by capital
and related financing activities (17,738,060)
CASH FLOWS FROM INVESTING ACTIVITIES:
Proceeds from sales and maturities of investments (3,911,112) Interest and dividends received 1,478,041 Issuance of notes receivable 283
Net cash provided (used) by investing activities (2,432,788)
Net increase (decrease) in cash and cash equivalents 213,405
Cash and cash equivalents, October 1 344,324
Cash and cash equivalents, September 30 $ 557,729
(Continued)
CITY OF LAREDO, TEXAS
225
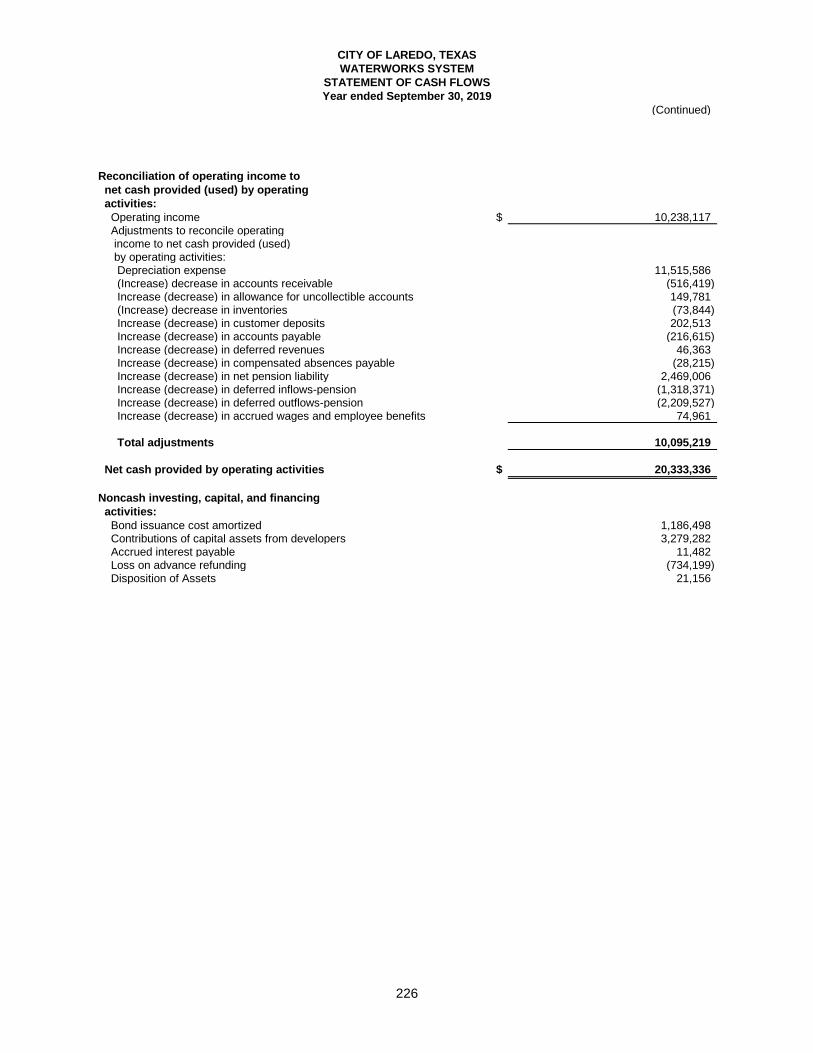
CITY OF LAREDO, TEXAS
WATERWORKS SYSTEM
STATEMENT OF CASH FLOWS
Year ended September 30, 2019
(Continued)
Reconciliation of operating income to
net cash provided (used) by operating
activities:
Operating income $ 10,238,117 Adjustments to reconcile operating income to net cash provided (used) by operating activities: Depreciation expense 11,515,586 (Increase) decrease in accounts receivable (516,419) Increase (decrease) in allowance for uncollectible accounts 149,781 (Increase) decrease in inventories (73,844) Increase (decrease) in customer deposits 202,513 Increase (decrease) in accounts payable (216,615) Increase (decrease) in deferred revenues 46,363 Increase (decrease) in compensated absences payable (28,215) Increase (decrease) in net pension liability 2,469,006 Increase (decrease) in deferred inflows-pension (1,318,371) Increase (decrease) in deferred outflows-pension (2,209,527) Increase (decrease) in accrued wages and employee benefits 74,961
Total adjustments 10,095,219
Net cash provided by operating activities $ 20,333,336
Noncash investing, capital, and financing
activities:
Bond issuance cost amortized 1,186,498 Contributions of capital assets from developers 3,279,282 Accrued interest payable 11,482 Loss on advance refunding (734,199) Disposition of Assets 21,156
226
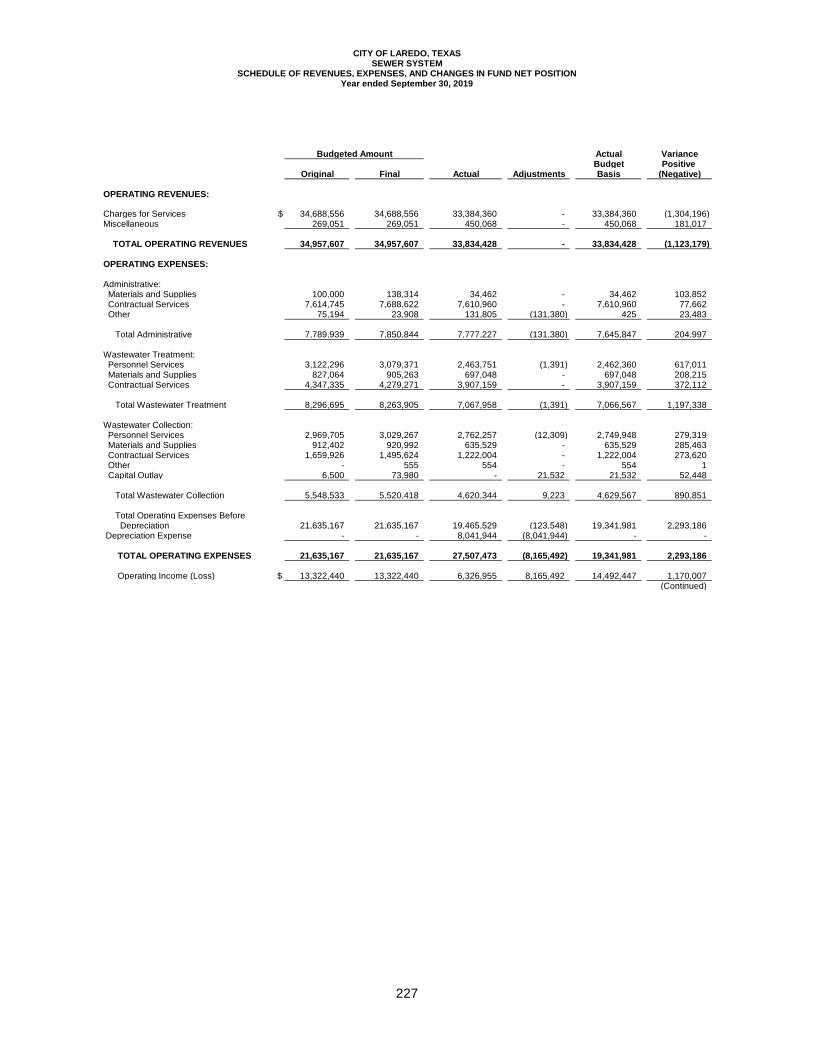
CITY OF LAREDO, TEXASSEWER SYSTEM
SCHEDULE OF REVENUES, EXPENSES, AND CHANGES IN FUND NET POSITION
Budgeted Amount Actual VarianceBudget Positive
Original Final Actual Adjustments Basis (Negative)
OPERATING REVENUES:
Charges for Services $ 34,688,556 34,688,556 33,384,360 - 33,384,360 (1,304,196) Miscellaneous 269,051 269,051 450,068 - 450,068 181,017
TOTAL OPERATING REVENUES 34,957,607 34,957,607 33,834,428 - 33,834,428 (1,123,179)
OPERATING EXPENSES:
Administrative: Materials and Supplies 100,000 138,314 34,462 - 34,462 103,852 Contractual Services 7,614,745 7,688,622 7,610,960 - 7,610,960 77,662 Other 75,194 23,908 131,805 (131,380) 425 23,483
Total Administrative 7,789,939 7,850,844 7,777,227 (131,380) 7,645,847 204,997
Wastewater Treatment: Personnel Services 3,122,296 3,079,371 2,463,751 (1,391) 2,462,360 617,011 Materials and Supplies 827,064 905,263 697,048 - 697,048 208,215 Contractual Services 4,347,335 4,279,271 3,907,159 - 3,907,159 372,112
Total Wastewater Treatment 8,296,695 8,263,905 7,067,958 (1,391) 7,066,567 1,197,338
Wastewater Collection: Personnel Services 2,969,705 3,029,267 2,762,257 (12,309) 2,749,948 279,319 Materials and Supplies 912,402 920,992 635,529 - 635,529 285,463 Contractual Services 1,659,926 1,495,624 1,222,004 - 1,222,004 273,620 Other - 555 554 - 554 1 Capital Outlay 6,500 73,980 - 21,532 21,532 52,448
Total Wastewater Collection 5,548,533 5,520,418 4,620,344 9,223 4,629,567 890,851
Total Operating Expenses Before Depreciation 21,635,167 21,635,167 19,465,529 (123,548) 19,341,981 2,293,186 Depreciation Expense - - 8,041,944 (8,041,944) - -
TOTAL OPERATING EXPENSES 21,635,167 21,635,167 27,507,473 (8,165,492) 19,341,981 2,293,186
Operating Income (Loss) $ 13,322,440 13,322,440 6,326,955 8,165,492 14,492,447 1,170,007 (Continued)
Year ended September 30, 2019
227
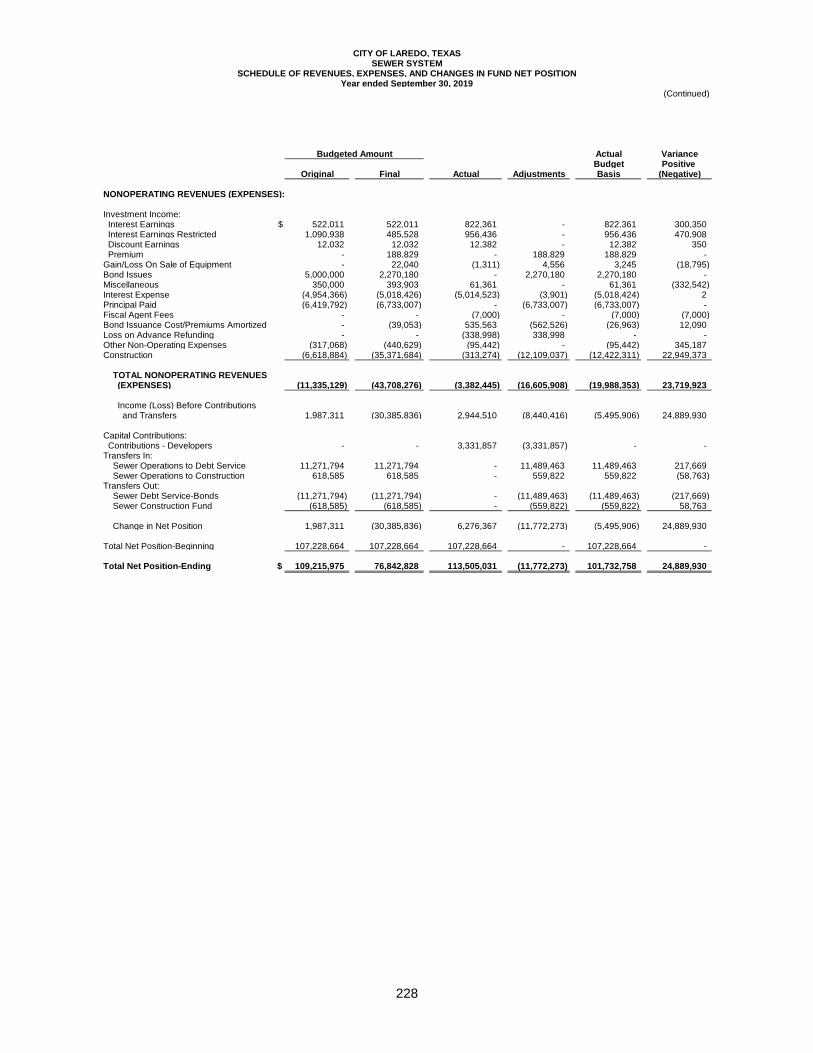
CITY OF LAREDO, TEXASSEWER SYSTEM
SCHEDULE OF REVENUES, EXPENSES, AND CHANGES IN FUND NET POSITIONYear ended September 30, 2019
(Continued)
Budgeted Amount Actual VarianceBudget Positive
Original Final Actual Adjustments Basis (Negative)
NONOPERATING REVENUES (EXPENSES):
Investment Income: Interest Earnings $ 522,011 522,011 822,361 - 822,361 300,350 Interest Earnings Restricted 1,090,938 485,528 956,436 - 956,436 470,908 Discount Earnings 12,032 12,032 12,382 - 12,382 350 Premium - 188,829 - 188,829 188,829 - Gain/Loss On Sale of Equipment - 22,040 (1,311) 4,556 3,245 (18,795) Bond Issues 5,000,000 2,270,180 - 2,270,180 2,270,180 - Miscellaneous 350,000 393,903 61,361 - 61,361 (332,542) Interest Expense (4,954,366) (5,018,426) (5,014,523) (3,901) (5,018,424) 2 Principal Paid (6,419,792) (6,733,007) - (6,733,007) (6,733,007) - Fiscal Agent Fees - - (7,000) - (7,000) (7,000) Bond Issuance Cost/Premiums Amortized - (39,053) 535,563 (562,526) (26,963) 12,090 Loss on Advance Refunding - - (338,998) 338,998 - - Other Non-Operating Expenses (317,068) (440,629) (95,442) - (95,442) 345,187 Construction (6,618,884) (35,371,684) (313,274) (12,109,037) (12,422,311) 22,949,373
TOTAL NONOPERATING REVENUES (EXPENSES) (11,335,129) (43,708,276) (3,382,445) (16,605,908) (19,988,353) 23,719,923
Income (Loss) Before Contributions and Transfers 1,987,311 (30,385,836) 2,944,510 (8,440,416) (5,495,906) 24,889,930
Capital Contributions: Contributions - Developers - - 3,331,857 (3,331,857) - - Transfers In: Sewer Operations to Debt Service 11,271,794 11,271,794 - 11,489,463 11,489,463 217,669 Sewer Operations to Construction 618,585 618,585 - 559,822 559,822 (58,763) Transfers Out: Sewer Debt Service-Bonds (11,271,794) (11,271,794) - (11,489,463) (11,489,463) (217,669) Sewer Construction Fund (618,585) (618,585) - (559,822) (559,822) 58,763
Change in Net Position 1,987,311 (30,385,836) 6,276,367 (11,772,273) (5,495,906) 24,889,930
Total Net Position-Beginning 107,228,664 107,228,664 107,228,664 - 107,228,664 -
Total Net Position-Ending $ 109,215,975 76,842,828 113,505,031 (11,772,273) 101,732,758 24,889,930
228
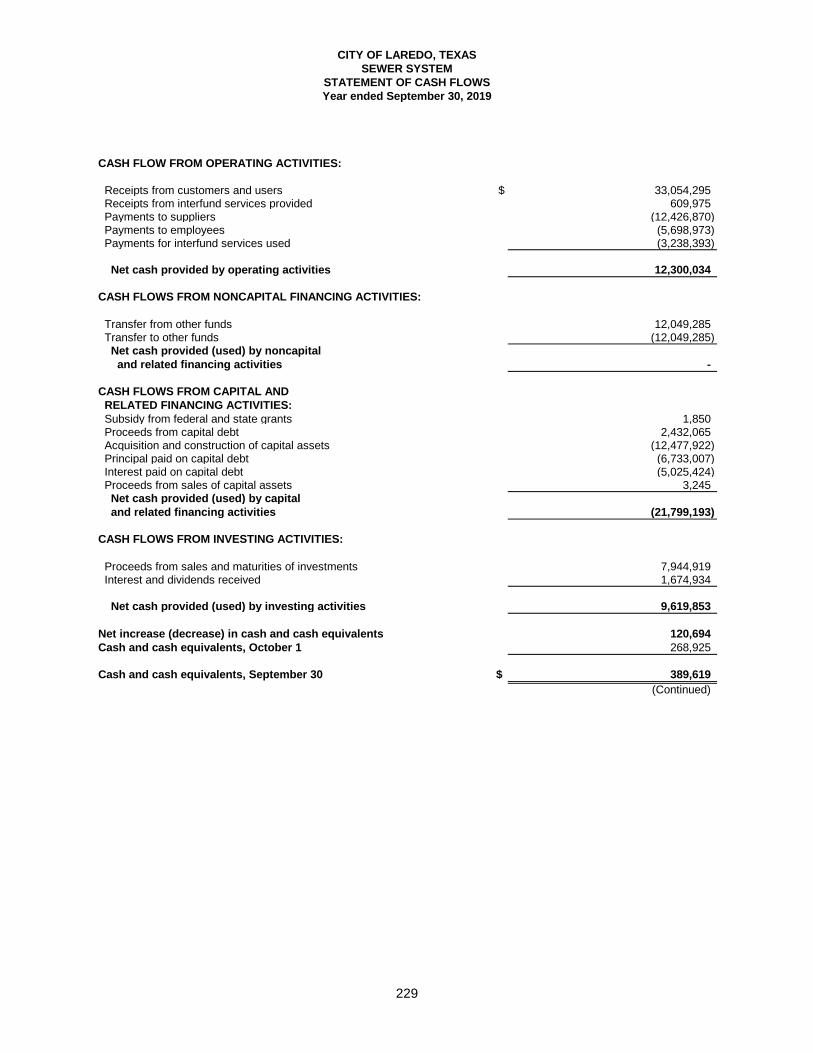
CITY OF LAREDO, TEXAS
SEWER SYSTEM
STATEMENT OF CASH FLOWS
Year ended September 30, 2019
CASH FLOW FROM OPERATING ACTIVITIES:
Receipts from customers and users $ 33,054,295 Receipts from interfund services provided 609,975 Payments to suppliers (12,426,870) Payments to employees (5,698,973) Payments for interfund services used (3,238,393)
Net cash provided by operating activities 12,300,034
CASH FLOWS FROM NONCAPITAL FINANCING ACTIVITIES:
Transfer from other funds 12,049,285 Transfer to other funds (12,049,285) Net cash provided (used) by noncapital
and related financing activities -
CASH FLOWS FROM CAPITAL AND
RELATED FINANCING ACTIVITIES:
Subsidy from federal and state grants 1,850 Proceeds from capital debt 2,432,065 Acquisition and construction of capital assets (12,477,922) Principal paid on capital debt (6,733,007) Interest paid on capital debt (5,025,424) Proceeds from sales of capital assets 3,245 Net cash provided (used) by capital
and related financing activities (21,799,193)
CASH FLOWS FROM INVESTING ACTIVITIES:
Proceeds from sales and maturities of investments 7,944,919 Interest and dividends received 1,674,934
Net cash provided (used) by investing activities 9,619,853
Net increase (decrease) in cash and cash equivalents 120,694
Cash and cash equivalents, October 1 268,925
Cash and cash equivalents, September 30 $ 389,619
(Continued)
229
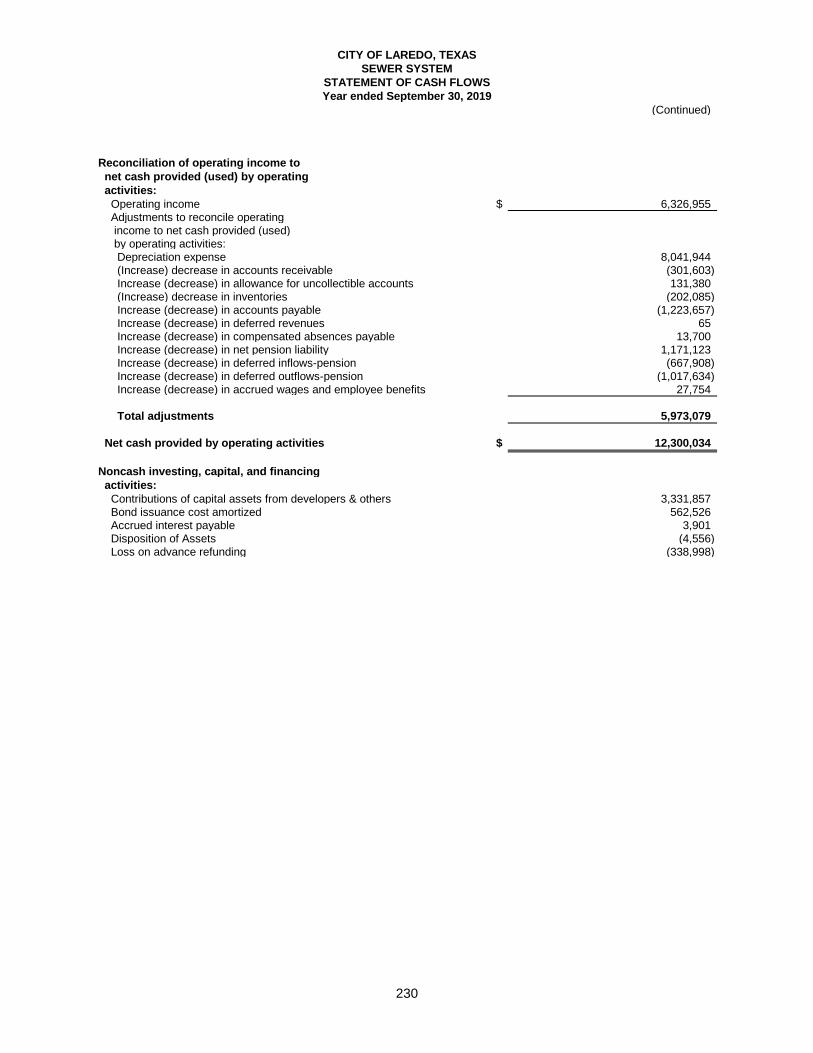
CITY OF LAREDO, TEXAS
SEWER SYSTEM
STATEMENT OF CASH FLOWS
Year ended September 30, 2019
(Continued)
Reconciliation of operating income to
net cash provided (used) by operating
activities:
Operating income $ 6,326,955 Adjustments to reconcile operating income to net cash provided (used) by operating activities: Depreciation expense 8,041,944 (Increase) decrease in accounts receivable (301,603) Increase (decrease) in allowance for uncollectible accounts 131,380 (Increase) decrease in inventories (202,085) Increase (decrease) in accounts payable (1,223,657) Increase (decrease) in deferred revenues 65 Increase (decrease) in compensated absences payable 13,700 Increase (decrease) in net pension liability 1,171,123 Increase (decrease) in deferred inflows-pension (667,908) Increase (decrease) in deferred outflows-pension (1,017,634) Increase (decrease) in accrued wages and employee benefits 27,754
Total adjustments 5,973,079
Net cash provided by operating activities $ 12,300,034
Noncash investing, capital, and financing
activities:
Contributions of capital assets from developers & others 3,331,857 Bond issuance cost amortized 562,526 Accrued interest payable 3,901 Disposition of Assets (4,556) Loss on advance refunding (338,998)
230
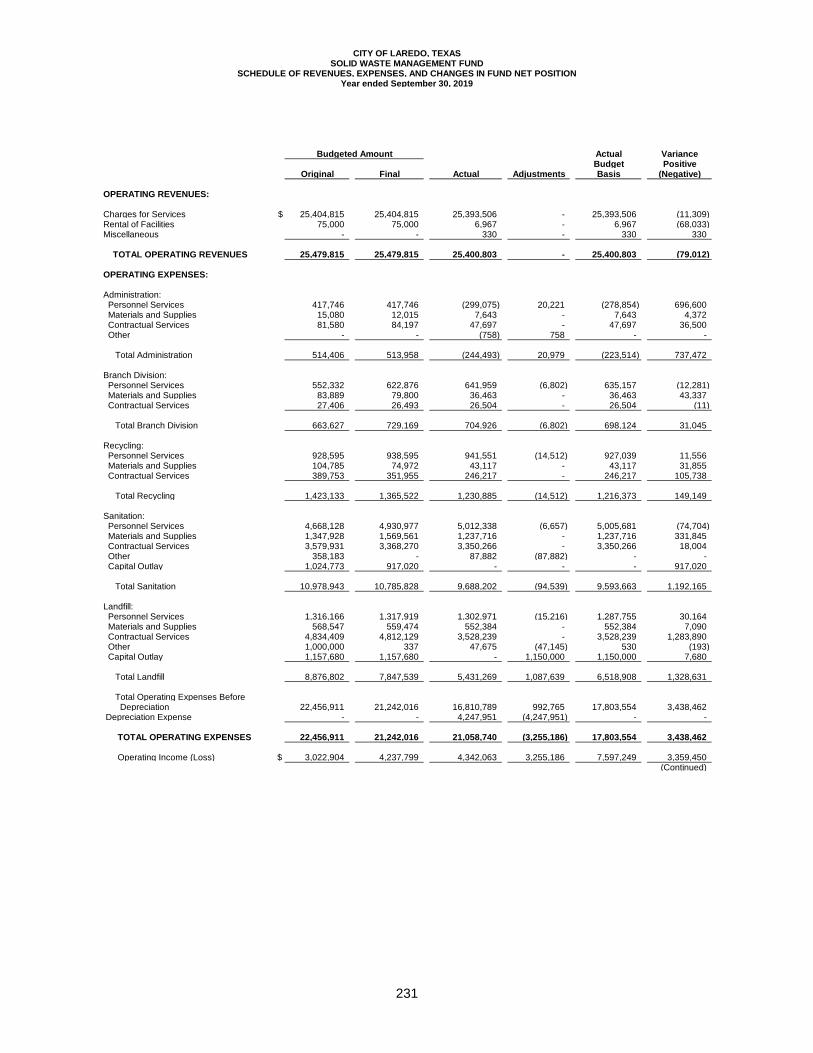
CITY OF LAREDO, TEXASSOLID WASTE MANAGEMENT FUND
SCHEDULE OF REVENUES, EXPENSES, AND CHANGES IN FUND NET POSITIONYear ended September 30, 2019
Budgeted Amount Actual VarianceBudget Positive
Original Final Actual Adjustments Basis (Negative)
OPERATING REVENUES:
Charges for Services $ 25,404,815 25,404,815 25,393,506 - 25,393,506 (11,309) Rental of Facilities 75,000 75,000 6,967 - 6,967 (68,033) Miscellaneous - - 330 - 330 330
TOTAL OPERATING REVENUES 25,479,815 25,479,815 25,400,803 - 25,400,803 (79,012)
OPERATING EXPENSES:
Administration: Personnel Services 417,746 417,746 (299,075) 20,221 (278,854) 696,600 Materials and Supplies 15,080 12,015 7,643 - 7,643 4,372 Contractual Services 81,580 84,197 47,697 - 47,697 36,500 Other - - (758) 758 - -
Total Administration 514,406 513,958 (244,493) 20,979 (223,514) 737,472
Branch Division: Personnel Services 552,332 622,876 641,959 (6,802) 635,157 (12,281) Materials and Supplies 83,889 79,800 36,463 - 36,463 43,337 Contractual Services 27,406 26,493 26,504 - 26,504 (11)
Total Branch Division 663,627 729,169 704,926 (6,802) 698,124 31,045
Recycling: Personnel Services 928,595 938,595 941,551 (14,512) 927,039 11,556 Materials and Supplies 104,785 74,972 43,117 - 43,117 31,855 Contractual Services 389,753 351,955 246,217 - 246,217 105,738
Total Recycling 1,423,133 1,365,522 1,230,885 (14,512) 1,216,373 149,149
Sanitation: Personnel Services 4,668,128 4,930,977 5,012,338 (6,657) 5,005,681 (74,704) Materials and Supplies 1,347,928 1,569,561 1,237,716 - 1,237,716 331,845 Contractual Services 3,579,931 3,368,270 3,350,266 - 3,350,266 18,004 Other 358,183 - 87,882 (87,882) - - Capital Outlay 1,024,773 917,020 - - - 917,020
Total Sanitation 10,978,943 10,785,828 9,688,202 (94,539) 9,593,663 1,192,165
Landfill: Personnel Services 1,316,166 1,317,919 1,302,971 (15,216) 1,287,755 30,164 Materials and Supplies 568,547 559,474 552,384 - 552,384 7,090 Contractual Services 4,834,409 4,812,129 3,528,239 - 3,528,239 1,283,890 Other 1,000,000 337 47,675 (47,145) 530 (193) Capital Outlay 1,157,680 1,157,680 - 1,150,000 1,150,000 7,680
Total Landfill 8,876,802 7,847,539 5,431,269 1,087,639 6,518,908 1,328,631
Total Operating Expenses Before Depreciation 22,456,911 21,242,016 16,810,789 992,765 17,803,554 3,438,462 Depreciation Expense - - 4,247,951 (4,247,951) - -
TOTAL OPERATING EXPENSES 22,456,911 21,242,016 21,058,740 (3,255,186) 17,803,554 3,438,462
Operating Income (Loss) $ 3,022,904 4,237,799 4,342,063 3,255,186 7,597,249 3,359,450 (Continued)
231
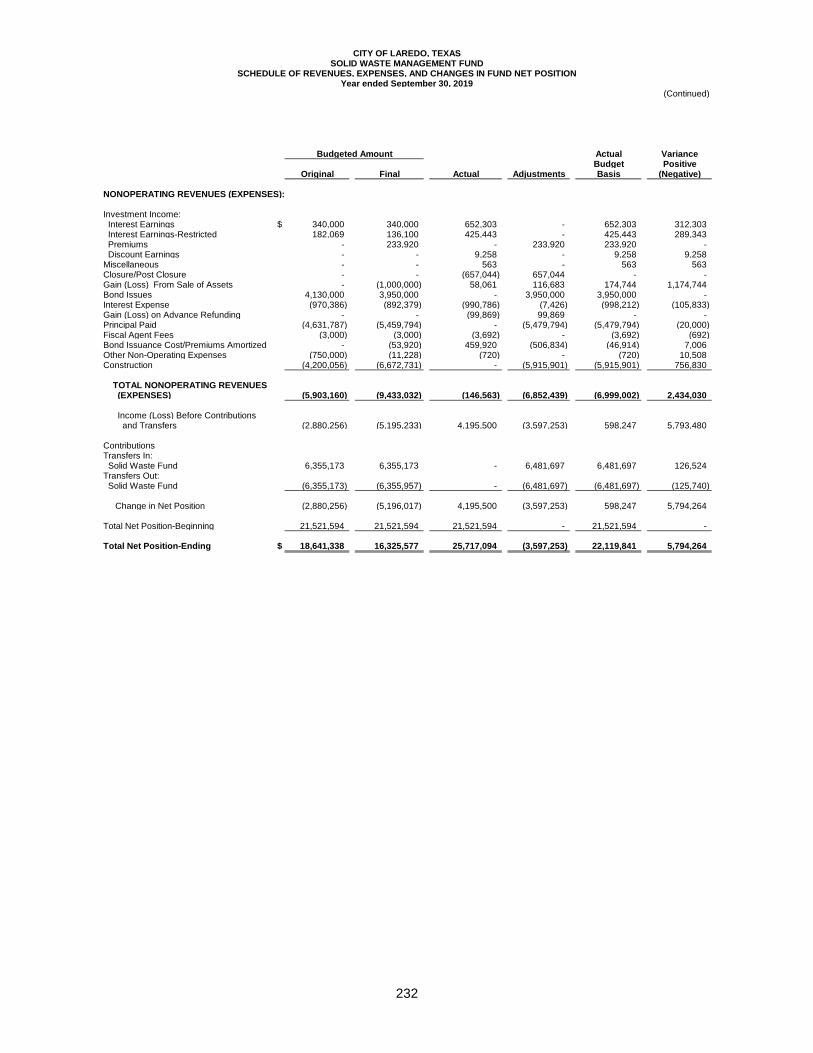
CITY OF LAREDO, TEXASSOLID WASTE MANAGEMENT FUND
SCHEDULE OF REVENUES, EXPENSES, AND CHANGES IN FUND NET POSITIONYear ended September 30, 2019
(Continued)
Budgeted Amount Actual VarianceBudget Positive
Original Final Actual Adjustments Basis (Negative)
NONOPERATING REVENUES (EXPENSES):
Investment Income: Interest Earnings $ 340,000 340,000 652,303 - 652,303 312,303 Interest Earnings-Restricted 182,069 136,100 425,443 - 425,443 289,343 Premiums - 233,920 - 233,920 233,920 - Discount Earnings - - 9,258 - 9,258 9,258 Miscellaneous - - 563 - 563 563 Closure/Post Closure - - (657,044) 657,044 - - Gain (Loss) From Sale of Assets - (1,000,000) 58,061 116,683 174,744 1,174,744 Bond Issues 4,130,000 3,950,000 - 3,950,000 3,950,000 - Interest Expense (970,386) (892,379) (990,786) (7,426) (998,212) (105,833) Gain (Loss) on Advance Refunding - - (99,869) 99,869 - - Principal Paid (4,631,787) (5,459,794) - (5,479,794) (5,479,794) (20,000) Fiscal Agent Fees (3,000) (3,000) (3,692) - (3,692) (692) Bond Issuance Cost/Premiums Amortized - (53,920) 459,920 (506,834) (46,914) 7,006 Other Non-Operating Expenses (750,000) (11,228) (720) - (720) 10,508 Construction (4,200,056) (6,672,731) - (5,915,901) (5,915,901) 756,830
TOTAL NONOPERATING REVENUES (EXPENSES) (5,903,160) (9,433,032) (146,563) (6,852,439) (6,999,002) 2,434,030
Income (Loss) Before Contributions and Transfers (2,880,256) (5,195,233) 4,195,500 (3,597,253) 598,247 5,793,480
ContributionsTransfers In: Solid Waste Fund 6,355,173 6,355,173 - 6,481,697 6,481,697 126,524 Transfers Out: Solid Waste Fund (6,355,173) (6,355,957) - (6,481,697) (6,481,697) (125,740)
Change in Net Position (2,880,256) (5,196,017) 4,195,500 (3,597,253) 598,247 5,794,264
Total Net Position-Beginning 21,521,594 21,521,594 21,521,594 - 21,521,594 -
Total Net Position-Ending $ 18,641,338 16,325,577 25,717,094 (3,597,253) 22,119,841 5,794,264
232
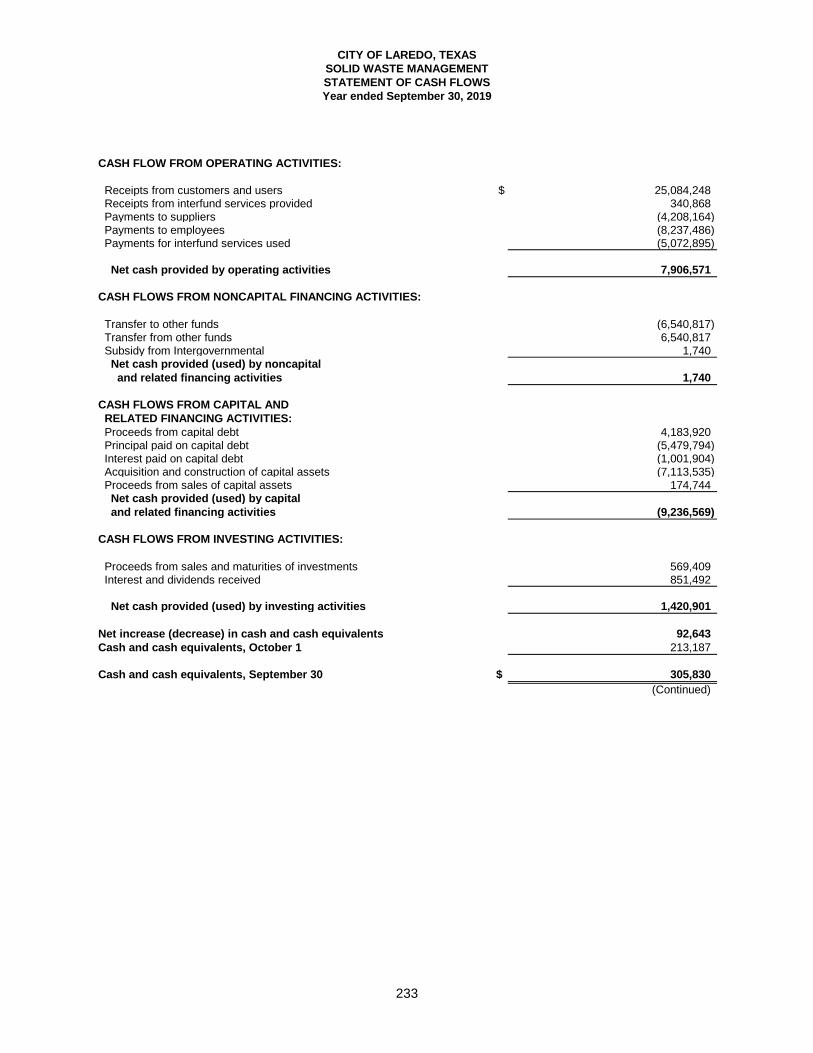
CITY OF LAREDO, TEXAS
SOLID WASTE MANAGEMENT
STATEMENT OF CASH FLOWS
Year ended September 30, 2019
CASH FLOW FROM OPERATING ACTIVITIES:
Receipts from customers and users $ 25,084,248 Receipts from interfund services provided 340,868 Payments to suppliers (4,208,164) Payments to employees (8,237,486) Payments for interfund services used (5,072,895)
Net cash provided by operating activities 7,906,571
CASH FLOWS FROM NONCAPITAL FINANCING ACTIVITIES:
Transfer to other funds (6,540,817) Transfer from other funds 6,540,817 Subsidy from Intergovernmental 1,740 Net cash provided (used) by noncapital
and related financing activities 1,740
CASH FLOWS FROM CAPITAL AND
RELATED FINANCING ACTIVITIES:
Proceeds from capital debt 4,183,920 Principal paid on capital debt (5,479,794) Interest paid on capital debt (1,001,904) Acquisition and construction of capital assets (7,113,535) Proceeds from sales of capital assets 174,744 Net cash provided (used) by capital
and related financing activities (9,236,569)
CASH FLOWS FROM INVESTING ACTIVITIES:
Proceeds from sales and maturities of investments 569,409 Interest and dividends received 851,492
Net cash provided (used) by investing activities 1,420,901
Net increase (decrease) in cash and cash equivalents 92,643
Cash and cash equivalents, October 1 213,187
Cash and cash equivalents, September 30 $ 305,830
(Continued)
233
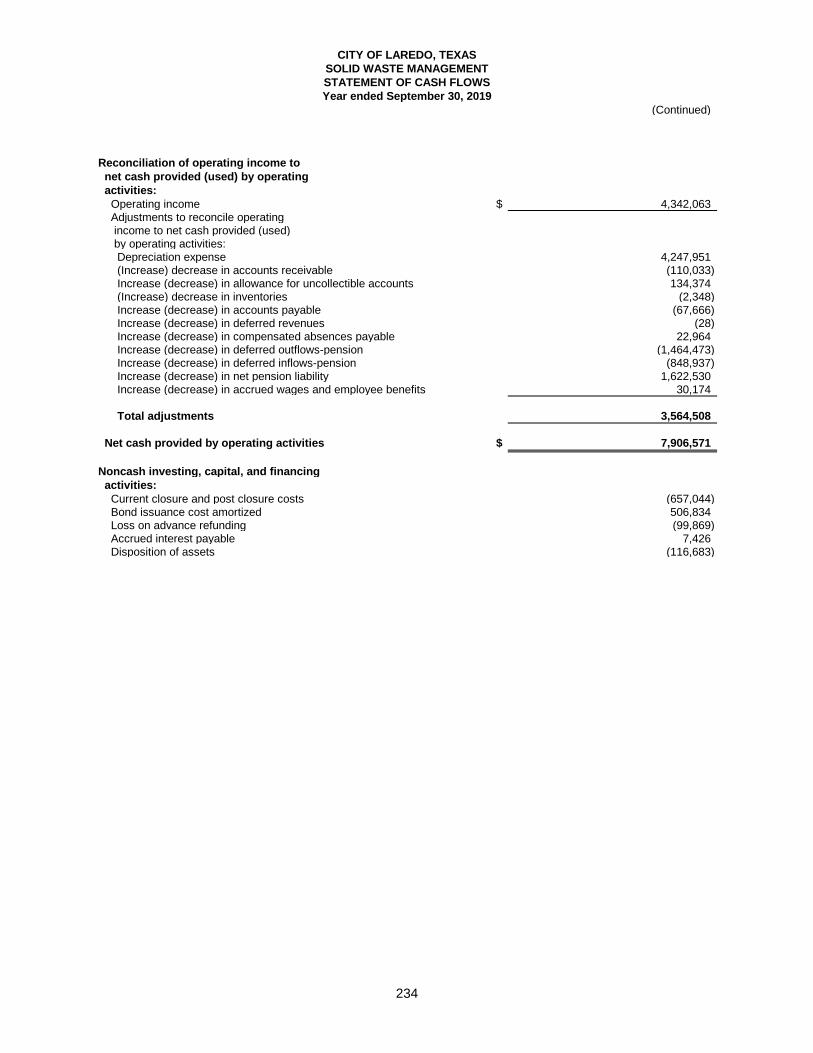
CITY OF LAREDO, TEXAS
SOLID WASTE MANAGEMENT
STATEMENT OF CASH FLOWS
Year ended September 30, 2019
(Continued)
Reconciliation of operating income to
net cash provided (used) by operating
activities:
Operating income $ 4,342,063 Adjustments to reconcile operating income to net cash provided (used) by operating activities: Depreciation expense 4,247,951 (Increase) decrease in accounts receivable (110,033) Increase (decrease) in allowance for uncollectible accounts 134,374 (Increase) decrease in inventories (2,348) Increase (decrease) in accounts payable (67,666) Increase (decrease) in deferred revenues (28) Increase (decrease) in compensated absences payable 22,964 Increase (decrease) in deferred outflows-pension (1,464,473) Increase (decrease) in deferred inflows-pension (848,937) Increase (decrease) in net pension liability 1,622,530 Increase (decrease) in accrued wages and employee benefits 30,174
Total adjustments 3,564,508
Net cash provided by operating activities $ 7,906,571
Noncash investing, capital, and financing
activities:
Current closure and post closure costs (657,044) Bond issuance cost amortized 506,834 Loss on advance refunding (99,869) Accrued interest payable 7,426 Disposition of assets (116,683)
234
FIDUCIARY FUNDS
FIDUCIARY FUNDS
Fiduciary funds account for assets held by the City in a trustee capacity or as an agent for other agencies or individuals, private organizations or governmental units, and/or other funds. Fiduciary funds include agency funds and pension trust funds. Agency Funds include: POLICE RETIREE DEPENDENTS - to account for contributions made by city police
officers and the City for expenses associated with health benefits premiums for retired police officers’ dependents.
FIRE RETIREE DEPENDENTS - to account for contributions made by city fire
fighters and the City for expenses associated with health benefits premiums for retired fire fighters’ dependents.
PAYROLL CLEARING - to account for cash transfers received from other City funds
and the disbursement of net wages and payroll related fringe benefits and payables.
Pension Trust Funds include: CITY ANNUITY - to account for contributions made by the city departments to pay for
City retirees’ health insurance and death benefits. LAREDO FIREFIGHTERS’ RETIREMENT SYSTEM – administers the retirement
system for the City of Laredo firefighter employees.
235
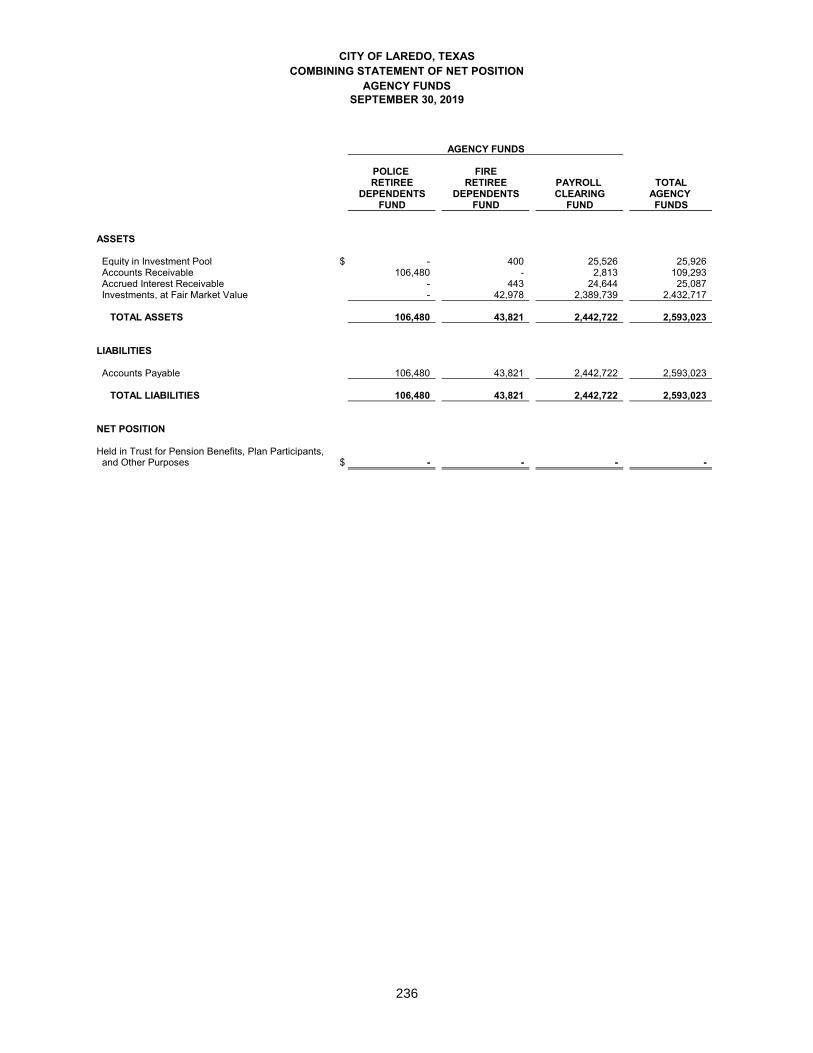
CITY OF LAREDO, TEXASCOMBINING STATEMENT OF NET POSITION
AGENCY FUNDSSEPTEMBER 30, 2019
POLICE FIRERETIREE RETIREE PAYROLL TOTAL
DEPENDENTS DEPENDENTS CLEARING AGENCY FUND FUND FUND FUNDS
ASSETS
Equity in Investment Pool $ - 400 25,526 25,926 Accounts Receivable 106,480 - 2,813 109,293 Accrued Interest Receivable - 443 24,644 25,087 Investments, at Fair Market Value - 42,978 2,389,739 2,432,717
TOTAL ASSETS 106,480 43,821 2,442,722 2,593,023
LIABILITIES
Accounts Payable 106,480 43,821 2,442,722 2,593,023
TOTAL LIABILITIES 106,480 43,821 2,442,722 2,593,023
NET POSITION
Held in Trust for Pension Benefits, Plan Participants, and Other Purposes $ - - - -
AGENCY FUNDS
236
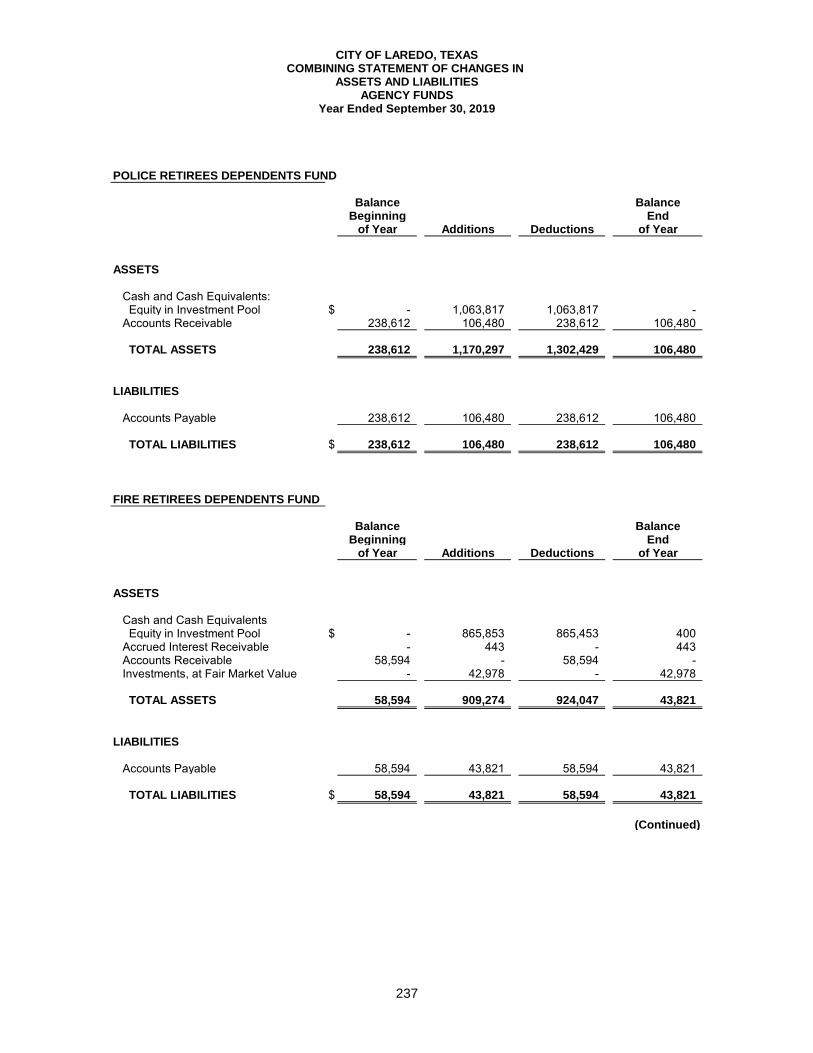
CITY OF LAREDO, TEXASCOMBINING STATEMENT OF CHANGES IN
ASSETS AND LIABILITIESAGENCY FUNDS
Year Ended September 30, 2019
POLICE RETIREES DEPENDENTS FUND
Balance BalanceBeginning End
of Year Additions Deductions of Year
ASSETS
Cash and Cash Equivalents: Equity in Investment Pool $ - 1,063,817 1,063,817 - Accounts Receivable 238,612 106,480 238,612 106,480
TOTAL ASSETS 238,612 1,170,297 1,302,429 106,480
LIABILITIES
Accounts Payable 238,612 106,480 238,612 106,480
TOTAL LIABILITIES $ 238,612 106,480 238,612 106,480
FIRE RETIREES DEPENDENTS FUND
Balance BalanceBeginning End
of Year Additions Deductions of Year
ASSETS
Cash and Cash Equivalents Equity in Investment Pool $ - 865,853 865,453 400 Accrued Interest Receivable - 443 - 443 Accounts Receivable 58,594 - 58,594 - Investments, at Fair Market Value - 42,978 - 42,978
TOTAL ASSETS 58,594 909,274 924,047 43,821
LIABILITIES
Accounts Payable 58,594 43,821 58,594 43,821
TOTAL LIABILITIES $ 58,594 43,821 58,594 43,821
(Continued)
237
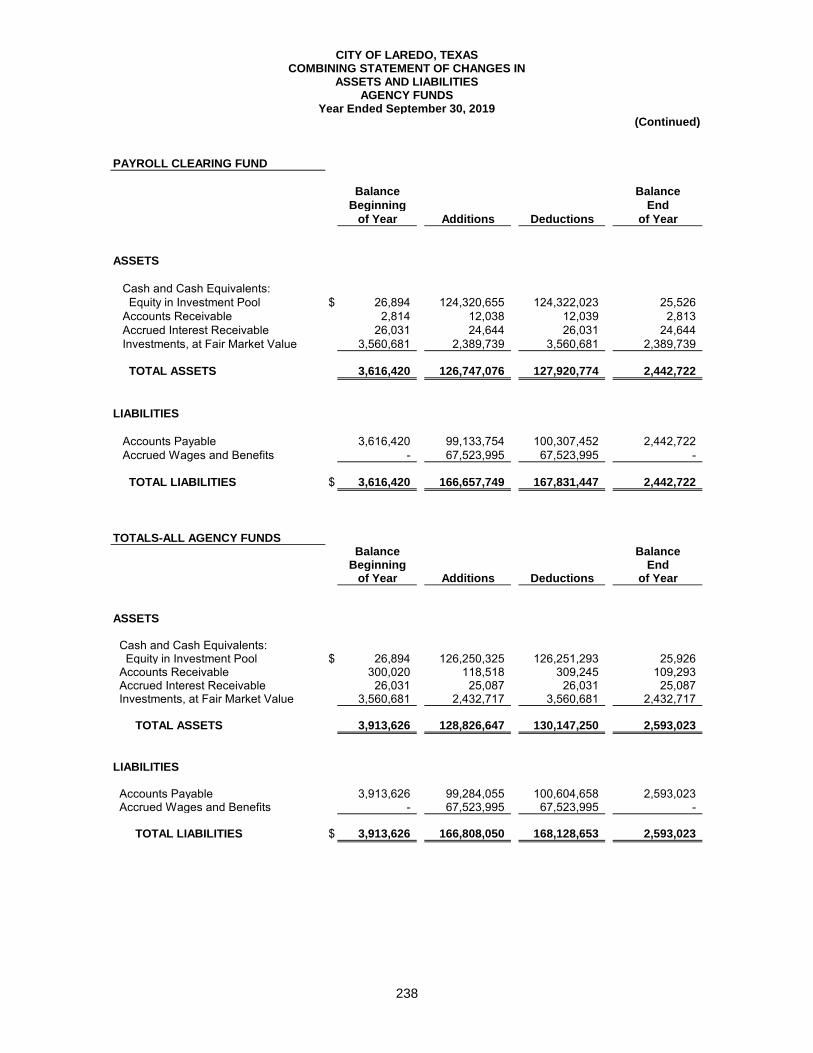
CITY OF LAREDO, TEXASCOMBINING STATEMENT OF CHANGES IN
ASSETS AND LIABILITIESAGENCY FUNDS
Year Ended September 30, 2019 (Continued)
PAYROLL CLEARING FUND
Balance Balance
Beginning End
of Year Additions Deductions of Year
ASSETS
Cash and Cash Equivalents: Equity in Investment Pool $ 26,894 124,320,655 124,322,023 25,526 Accounts Receivable 2,814 12,038 12,039 2,813 Accrued Interest Receivable 26,031 24,644 26,031 24,644 Investments, at Fair Market Value 3,560,681 2,389,739 3,560,681 2,389,739
TOTAL ASSETS 3,616,420 126,747,076 127,920,774 2,442,722
LIABILITIES
Accounts Payable 3,616,420 99,133,754 100,307,452 2,442,722 Accrued Wages and Benefits - 67,523,995 67,523,995 -
TOTAL LIABILITIES $ 3,616,420 166,657,749 167,831,447 2,442,722
TOTALS-ALL AGENCY FUNDSBalance Balance
Beginning Endof Year Additions Deductions of Year
ASSETS
Cash and Cash Equivalents: Equity in Investment Pool $ 26,894 126,250,325 126,251,293 25,926 Accounts Receivable 300,020 118,518 309,245 109,293 Accrued Interest Receivable 26,031 25,087 26,031 25,087 Investments, at Fair Market Value 3,560,681 2,432,717 3,560,681 2,432,717
TOTAL ASSETS 3,913,626 128,826,647 130,147,250 2,593,023
LIABILITIES
Accounts Payable 3,913,626 99,284,055 100,604,658 2,593,023 Accrued Wages and Benefits - 67,523,995 67,523,995 -
TOTAL LIABILITIES $ 3,913,626 166,808,050 168,128,653 2,593,023
238
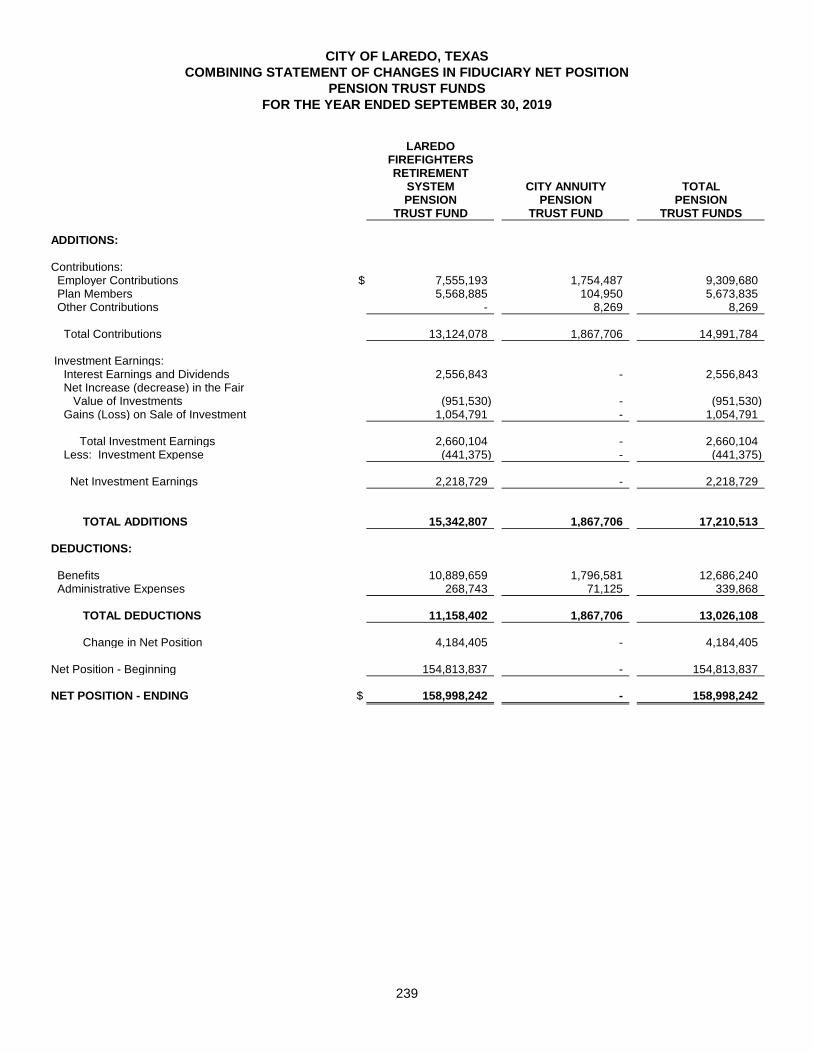
CITY OF LAREDO, TEXAS
COMBINING STATEMENT OF CHANGES IN FIDUCIARY NET POSITION
PENSION TRUST FUNDS
FOR THE YEAR ENDED SEPTEMBER 30, 2019
LAREDOFIREFIGHTERSRETIREMENT
SYSTEM CITY ANNUITY TOTALPENSION PENSION PENSION
TRUST FUND TRUST FUND TRUST FUNDS
ADDITIONS:
Contributions: Employer Contributions $ 7,555,193 1,754,487 9,309,680 Plan Members 5,568,885 104,950 5,673,835 Other Contributions - 8,269 8,269
Total Contributions 13,124,078 1,867,706 14,991,784
Investment Earnings: Interest Earnings and Dividends 2,556,843 - 2,556,843 Net Increase (decrease) in the Fair Value of Investments (951,530) - (951,530) Gains (Loss) on Sale of Investment 1,054,791 - 1,054,791
Total Investment Earnings 2,660,104 - 2,660,104 Less: Investment Expense (441,375) - (441,375)
Net Investment Earnings 2,218,729 - 2,218,729
TOTAL ADDITIONS 15,342,807 1,867,706 17,210,513
DEDUCTIONS:
Benefits 10,889,659 1,796,581 12,686,240 Administrative Expenses 268,743 71,125 339,868
TOTAL DEDUCTIONS 11,158,402 1,867,706 13,026,108
Change in Net Position 4,184,405 - 4,184,405
Net Position - Beginning 154,813,837 - 154,813,837
NET POSITION - ENDING $ 158,998,242 - 158,998,242
239

This page intentionally left blank
240
STATISTICAL SECTION
STATISTICAL SECTION
This part of the City of Laredo’s comprehensive annual financial report presents detailed information as a context for understanding what the information in the financial statements, note disclosures, and required supplementary information says about the City of Laredo’s overall financial health.
FINANCIAL TRENDS These schedules contain trend information to help the reader understand how the government’s financial performance and well-being have changed over time. (Tables 1-5)
REVENUE CAPACITY These schedules contain information to help the reader assess the government’s most significant local revenue source, the property tax. (Tables 6-10)
DEBT CAPACITY These schedules present information to help the reader assess the affordability of the government’s current levels of outstanding debt and the government’s ability to issue additional debt in the future. (Tables 11-16)
DEMOGRAPHIC AND ECONOMIC INFORMATION These schedules offer demographic and economic indicators to help the reader understand the environment within which the government’s financial activities take place. (Tables 17-20)
OPERATING INFORMATION These schedules contain service and infrastructure data to help the reader understand how the information in the government’s financial report. (Tables 21-25)
Source: Unless otherwise noted, the information in these schedules is derived from the comprehensive annual financial report for the relevant year.
241
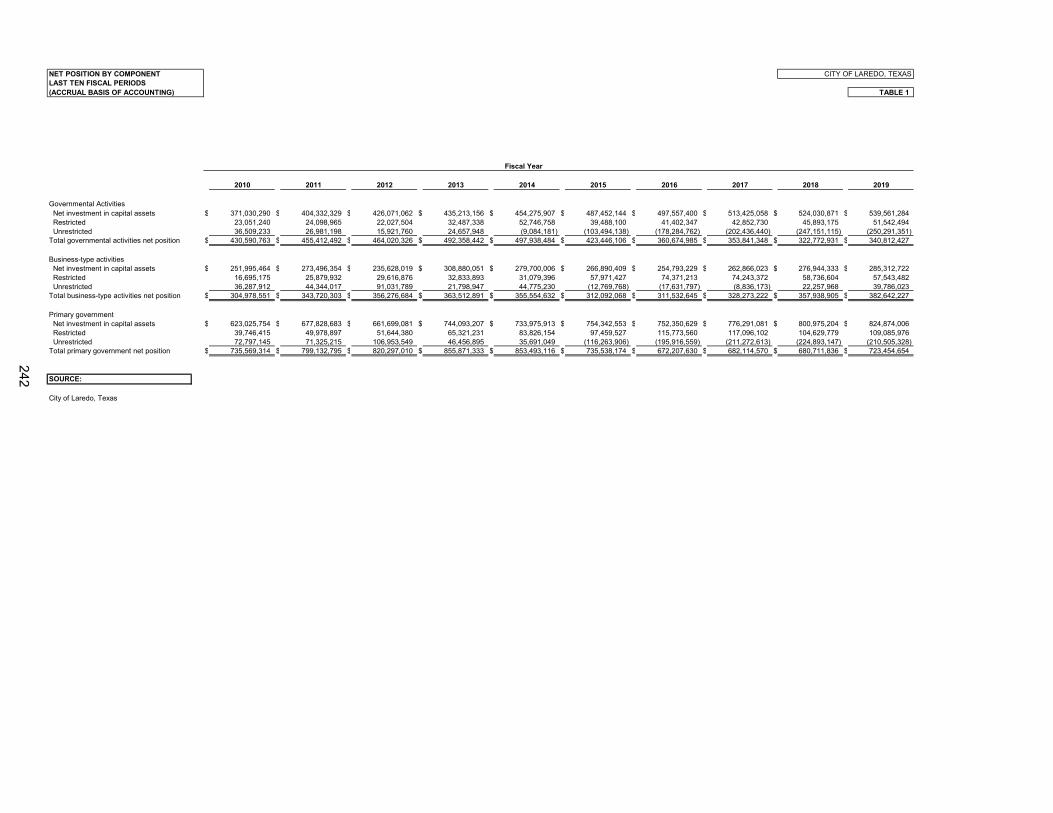
NET POSITION BY COMPONENTLAST TEN FISCAL PERIODS(ACCRUAL BASIS OF ACCOUNTING) TABLE 1
2010 2011 2012 2013 2014 2015 2016 2017 2018 2019
Governmental Activities Net investment in capital assets $ 371,030,290 $ 404,332,329 $ 426,071,062 $ 435,213,156 $ 454,275,907 $ 487,452,144 $ 497,557,400 $ 513,425,058 $ 524,030,871 $ 539,561,284 Restricted 23,051,240 24,098,965 22,027,504 32,487,338 52,746,758 39,488,100 41,402,347 42,852,730 45,893,175 51,542,494 Unrestricted 36,509,233 26,981,198 15,921,760 24,657,948 (9,084,181) (103,494,138) (178,284,762) (202,436,440) (247,151,115) (250,291,351) Total governmental activities net position $ 430,590,763 $ 455,412,492 $ 464,020,326 $ 492,358,442 $ 497,938,484 $ 423,446,106 $ 360,674,985 $ 353,841,348 $ 322,772,931 $ 340,812,427
Business-type activities Net investment in capital assets $ 251,995,464 $ 273,496,354 $ 235,628,019 $ 308,880,051 $ 279,700,006 $ 266,890,409 $ 254,793,229 $ 262,866,023 $ 276,944,333 $ 285,312,722 Restricted 16,695,175 25,879,932 29,616,876 32,833,893 31,079,396 57,971,427 74,371,213 74,243,372 58,736,604 57,543,482 Unrestricted 36,287,912 44,344,017 91,031,789 21,798,947 44,775,230 (12,769,768) (17,631,797) (8,836,173) 22,257,968 39,786,023Total business-type activities net position $ 304,978,551 $ 343,720,303 $ 356,276,684 $ 363,512,891 $ 355,554,632 $ 312,092,068 $ 311,532,645 $ 328,273,222 $ 357,938,905 $ 382,642,227
Primary government Net investment in capital assets $ 623,025,754 $ 677,828,683 $ 661,699,081 $ 744,093,207 $ 733,975,913 $ 754,342,553 $ 752,350,629 $ 776,291,081 $ 800,975,204 $ 824,874,006 Restricted 39,746,415 49,978,897 51,644,380 65,321,231 83,826,154 97,459,527 115,773,560 117,096,102 104,629,779 109,085,976 Unrestricted 72,797,145 71,325,215 106,953,549 46,456,895 35,691,049 (116,263,906) (195,916,559) (211,272,613) (224,893,147) (210,505,328) Total primary government net position $ 735,569,314 $ 799,132,795 $ 820,297,010 $ 855,871,333 $ 853,493,116 $ 735,538,174 $ 672,207,630 $ 682,114,570 $ 680,711,836 $ 723,454,654
SOURCE:
City of Laredo, Texas
Fiscal Year
CITY OF LAREDO, TEXAS
242

This page intentionally left blank
243
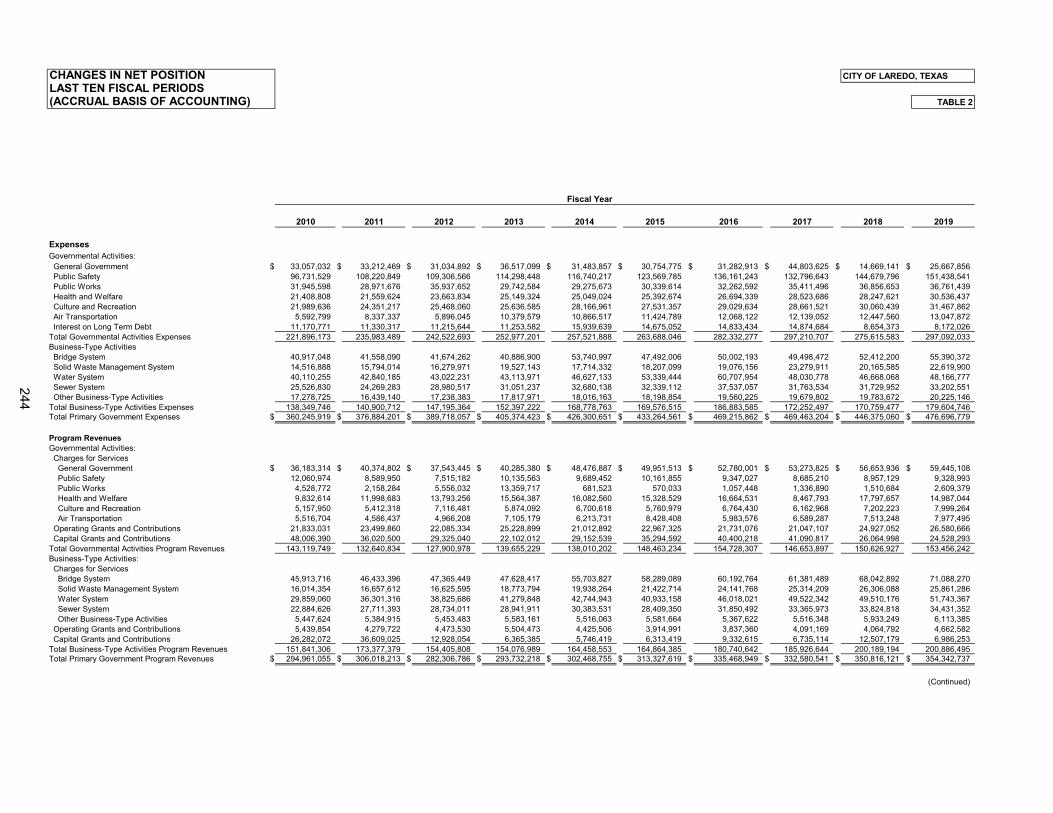
CHANGES IN NET POSITION CITY OF LAREDO, TEXASLAST TEN FISCAL PERIODS(ACCRUAL BASIS OF ACCOUNTING) TABLE 2
2010 2011 2012 2013 2014 2015 2016 2017 2018 2019
ExpensesGovernmental Activities: General Government $ 33,057,032 $ 33,212,469 $ 31,034,892 $ 36,517,099 $ 31,483,857 $ 30,754,775 $ 31,282,913 $ 44,803,625 $ 14,669,141 $ 25,667,856 Public Safety 96,731,529 108,220,849 109,306,566 114,298,448 116,740,217 123,569,785 136,161,243 132,796,643 144,679,796 151,438,541 Public Works 31,945,598 28,971,676 35,937,652 29,742,584 29,275,673 30,339,614 32,262,592 35,411,496 36,856,653 36,761,439 Health and Welfare 21,408,808 21,559,624 23,663,834 25,149,324 25,049,024 25,392,674 26,694,339 28,523,686 28,247,621 30,536,437 Culture and Recreation 21,989,636 24,351,217 25,468,060 25,636,585 28,166,961 27,531,357 29,029,634 28,661,521 30,060,439 31,467,862 Air Transportation 5,592,799 8,337,337 5,896,045 10,379,579 10,866,517 11,424,789 12,068,122 12,139,052 12,447,560 13,047,872 Interest on Long Term Debt 11,170,771 11,330,317 11,215,644 11,253,582 15,939,639 14,675,052 14,833,434 14,874,684 8,654,373 8,172,026 Total Governmental Activities Expenses 221,896,173 235,983,489 242,522,693 252,977,201 257,521,888 263,688,046 282,332,277 297,210,707 275,615,583 297,092,033 Business-Type Activities Bridge System 40,917,048 41,558,090 41,674,262 40,886,900 53,740,997 47,492,006 50,002,193 49,498,472 52,412,200 55,390,372 Solid Waste Management System 14,516,888 15,794,014 16,279,971 19,527,143 17,714,332 18,207,099 19,076,156 23,279,911 20,165,585 22,619,900 Water System 40,110,255 42,840,185 43,022,231 43,113,971 46,627,133 53,339,444 60,707,954 48,030,778 46,668,068 48,166,777 Sewer System 25,526,830 24,269,283 28,980,517 31,051,237 32,680,138 32,339,112 37,537,057 31,763,534 31,729,952 33,202,551 Other Business-Type Activities 17,278,725 16,439,140 17,238,383 17,817,971 18,016,163 18,198,854 19,560,225 19,679,802 19,783,672 20,225,146 Total Business-Type Activities Expenses 138,349,746 140,900,712 147,195,364 152,397,222 168,778,763 169,576,515 186,883,585 172,252,497 170,759,477 179,604,746 Total Primary Government Expenses $ 360,245,919 $ 376,884,201 $ 389,718,057 $ 405,374,423 $ 426,300,651 $ 433,264,561 $ 469,215,862 $ 469,463,204 $ 446,375,060 $ 476,696,779
Program RevenuesGovernmental Activities: Charges for Services General Government $ 36,183,314 $ 40,374,802 $ 37,543,445 $ 40,285,380 $ 48,476,887 $ 49,951,513 $ 52,780,001 $ 53,273,825 $ 56,653,936 $ 59,445,108 Public Safety 12,060,974 8,589,950 7,515,182 10,135,563 9,689,452 10,161,855 9,347,027 8,685,210 8,957,129 9,328,993 Public Works 4,528,772 2,158,284 5,556,032 13,359,717 681,523 570,033 1,057,448 1,336,890 1,510,684 2,609,379 Health and Welfare 9,832,614 11,998,683 13,793,256 15,564,387 16,082,560 15,328,529 16,664,531 8,467,793 17,797,657 14,987,044 Culture and Recreation 5,157,950 5,412,318 7,116,481 5,874,092 6,700,618 5,760,979 6,764,430 6,162,968 7,202,223 7,999,264 Air Transportation 5,516,704 4,586,437 4,966,208 7,105,179 6,213,731 8,428,408 5,983,576 6,589,287 7,513,248 7,977,495 Operating Grants and Contributions 21,833,031 23,499,860 22,085,334 25,228,899 21,012,892 22,967,325 21,731,076 21,047,107 24,927,052 26,580,666 Capital Grants and Contributions 48,006,390 36,020,500 29,325,040 22,102,012 29,152,539 35,294,592 40,400,218 41,090,817 26,064,998 24,528,293 Total Governmental Activities Program Revenues 143,119,749 132,640,834 127,900,978 139,655,229 138,010,202 148,463,234 154,728,307 146,653,897 150,626,927 153,456,242 Business-Type Activities: Charges for Services Bridge System 45,913,716 46,433,396 47,365,449 47,628,417 55,703,827 58,289,089 60,192,764 61,381,489 68,042,892 71,088,270 Solid Waste Management System 16,014,354 16,657,612 16,625,595 18,773,794 19,938,264 21,422,714 24,141,768 25,314,209 26,306,088 25,861,286 Water System 29,859,060 36,301,316 38,825,686 41,279,848 42,744,943 40,933,158 46,018,021 49,522,342 49,510,176 51,743,367 Sewer System 22,884,626 27,711,393 28,734,011 28,941,911 30,383,531 28,409,350 31,850,492 33,365,973 33,824,818 34,431,352 Other Business-Type Activities 5,447,624 5,384,915 5,453,483 5,583,161 5,516,063 5,581,664 5,367,622 5,516,348 5,933,249 6,113,385 Operating Grants and Contributions 5,439,854 4,279,722 4,473,530 5,504,473 4,425,506 3,914,991 3,837,360 4,091,169 4,064,792 4,662,582 Capital Grants and Contributions 26,282,072 36,609,025 12,928,054 6,365,385 5,746,419 6,313,419 9,332,615 6,735,114 12,507,179 6,986,253 Total Business-Type Activities Program Revenues 151,841,306 173,377,379 154,405,808 154,076,989 164,458,553 164,864,385 180,740,642 185,926,644 200,189,194 200,886,495 Total Primary Government Program Revenues $ 294,961,055 $ 306,018,213 $ 282,306,786 $ 293,732,218 $ 302,468,755 $ 313,327,619 $ 335,468,949 $ 332,580,541 $ 350,816,121 $ 354,342,737
(Continued)
Fiscal Year
244
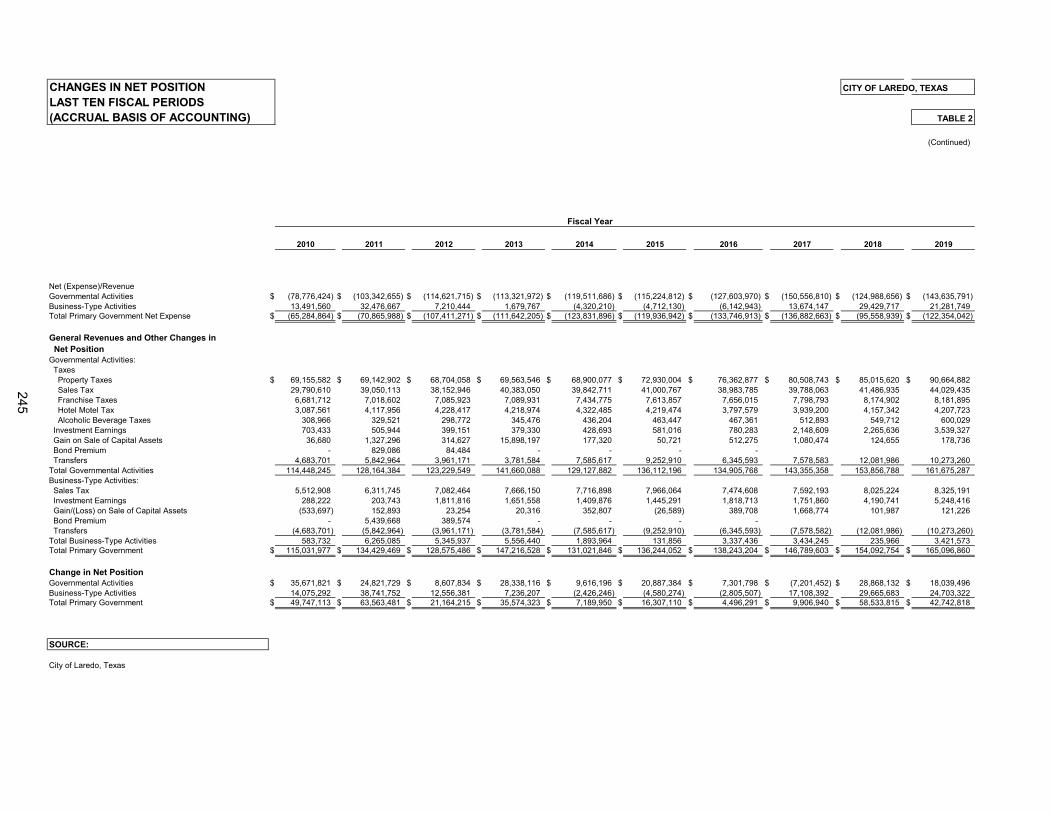
CHANGES IN NET POSITION CITY OF LAREDO, TEXASLAST TEN FISCAL PERIODS(ACCRUAL BASIS OF ACCOUNTING) TABLE 2
(Continued)
2010 2011 2012 2013 2014 2015 2016 2017 2018 2019
Net (Expense)/RevenueGovernmental Activities $ (78,776,424) $ (103,342,655) $ (114,621,715) $ (113,321,972) $ (119,511,686) $ (115,224,812) $ (127,603,970) $ (150,556,810) $ (124,988,656) $ (143,635,791) Business-Type Activities 13,491,560 32,476,667 7,210,444 1,679,767 (4,320,210) (4,712,130) (6,142,943) 13,674,147 29,429,717 21,281,749 Total Primary Government Net Expense $ (65,284,864) $ (70,865,988) $ (107,411,271) $ (111,642,205) $ (123,831,896) $ (119,936,942) $ (133,746,913) $ (136,882,663) $ (95,558,939) $ (122,354,042)
General Revenues and Other Changes in Net PositionGovernmental Activities: Taxes Property Taxes $ 69,155,582 $ 69,142,902 $ 68,704,058 $ 69,563,546 $ 68,900,077 $ 72,930,004 $ 76,362,877 $ 80,508,743 $ 85,015,620 $ 90,664,882 Sales Tax 29,790,610 39,050,113 38,152,946 40,383,050 39,842,711 41,000,767 38,983,785 39,788,063 41,486,935 44,029,435 Franchise Taxes 6,681,712 7,018,602 7,085,923 7,089,931 7,434,775 7,613,857 7,656,015 7,798,793 8,174,902 8,181,895 Hotel Motel Tax 3,087,561 4,117,956 4,228,417 4,218,974 4,322,485 4,219,474 3,797,579 3,939,200 4,157,342 4,207,723 Alcoholic Beverage Taxes 308,966 329,521 298,772 345,476 436,204 463,447 467,361 512,893 549,712 600,029 Investment Earnings 703,433 505,944 399,151 379,330 428,693 581,016 780,283 2,148,609 2,265,636 3,539,327 Gain on Sale of Capital Assets 36,680 1,327,296 314,627 15,898,197 177,320 50,721 512,275 1,080,474 124,655 178,736 Bond Premium - 829,086 84,484 - - - - Transfers 4,683,701 5,842,964 3,961,171 3,781,584 7,585,617 9,252,910 6,345,593 7,578,583 12,081,986 10,273,260Total Governmental Activities 114,448,245 128,164,384 123,229,549 141,660,088 129,127,882 136,112,196 134,905,768 143,355,358 153,856,788 161,675,287 Business-Type Activities: Sales Tax 5,512,908 6,311,745 7,082,464 7,666,150 7,716,898 7,966,064 7,474,608 7,592,193 8,025,224 8,325,191 Investment Earnings 288,222 203,743 1,811,816 1,651,558 1,409,876 1,445,291 1,818,713 1,751,860 4,190,741 5,248,416 Gain/(Loss) on Sale of Capital Assets (533,697) 152,893 23,254 20,316 352,807 (26,589) 389,708 1,668,774 101,987 121,226 Bond Premium - 5,439,668 389,574 - - - - Transfers (4,683,701) (5,842,964) (3,961,171) (3,781,584) (7,585,617) (9,252,910) (6,345,593) (7,578,582) (12,081,986) (10,273,260)Total Business-Type Activities 583,732 6,265,085 5,345,937 5,556,440 1,893,964 131,856 3,337,436 3,434,245 235,966 3,421,573 Total Primary Government $ 115,031,977 $ 134,429,469 $ 128,575,486 $ 147,216,528 $ 131,021,846 $ 136,244,052 $ 138,243,204 $ 146,789,603 $ 154,092,754 $ 165,096,860
Change in Net PositionGovernmental Activities $ 35,671,821 $ 24,821,729 $ 8,607,834 $ 28,338,116 $ 9,616,196 $ 20,887,384 $ 7,301,798 $ (7,201,452) $ 28,868,132 $ 18,039,496 Business-Type Activities 14,075,292 38,741,752 12,556,381 7,236,207 (2,426,246) (4,580,274) (2,805,507) 17,108,392 29,665,683 24,703,322 Total Primary Government $ 49,747,113 $ 63,563,481 $ 21,164,215 $ 35,574,323 $ 7,189,950 $ 16,307,110 $ 4,496,291 $ 9,906,940 $ 58,533,815 $ 42,742,818
SOURCE:
City of Laredo, Texas
Fiscal Year
245
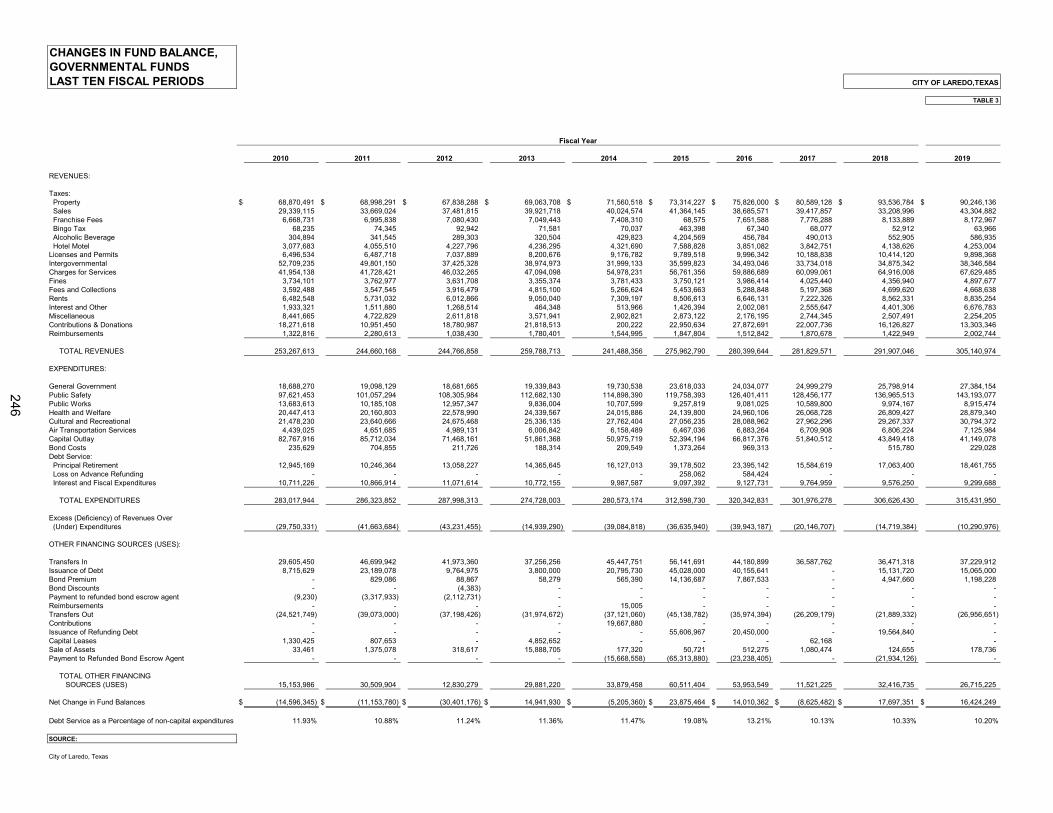
CHANGES IN FUND BALANCE,GOVERNMENTAL FUNDSLAST TEN FISCAL PERIODS CITY OF LAREDO,TEXAS
TABLE 3
2010 2011 2012 2013 2014 2015 2016 2017 2018 2019
REVENUES:
Taxes: Property $ 68,870,491 $ 68,998,291 $ 67,838,288 $ 69,063,708 $ 71,560,518 $ 73,314,227 $ 75,826,000 $ 80,589,128 $ 93,536,784 $ 90,246,136 Sales 29,339,115 33,669,024 37,481,815 39,921,718 40,024,574 41,364,145 38,685,571 39,417,857 33,208,996 43,304,882 Franchise Fees 6,668,731 6,995,838 7,080,430 7,049,443 7,408,310 68,575 7,651,588 7,776,288 8,133,889 8,172,967 Bingo Tax 68,235 74,345 92,942 71,581 70,037 463,398 67,340 68,077 52,912 63,966 Alcoholic Beverage 304,894 341,545 289,303 320,504 429,823 4,204,569 456,784 490,013 552,905 586,935 Hotel Motel 3,077,683 4,055,510 4,227,796 4,236,295 4,321,690 7,588,828 3,851,082 3,842,751 4,138,626 4,253,004 Licenses and Permits 6,496,534 6,487,718 7,037,889 8,200,676 9,176,782 9,789,518 9,996,342 10,188,838 10,414,120 9,898,368Intergovernmental 52,709,235 49,801,150 37,425,328 38,974,973 31,999,133 35,599,823 34,493,046 33,734,018 34,875,342 38,346,584Charges for Services 41,954,138 41,728,421 46,032,265 47,094,098 54,978,231 56,761,356 59,886,689 60,099,061 64,916,008 67,629,485Fines 3,734,101 3,762,977 3,631,708 3,355,374 3,781,433 3,750,121 3,986,414 4,025,440 4,356,940 4,897,677Fees and Collections 3,592,488 3,547,545 3,916,479 4,815,100 5,266,624 5,453,663 5,288,848 5,197,368 4,699,620 4,668,638Rents 6,482,548 5,731,032 6,012,866 9,050,040 7,309,197 8,506,613 6,646,131 7,222,326 8,562,331 8,835,254Interest and Other 1,933,321 1,511,880 1,268,514 464,348 513,966 1,426,394 2,002,081 2,555,647 4,401,306 6,676,783Miscellaneous 8,441,665 4,722,829 2,611,818 3,571,941 2,902,821 2,873,122 2,176,195 2,744,345 2,507,491 2,254,205Contributions & Donations 18,271,618 10,951,450 18,780,987 21,818,513 200,222 22,950,634 27,872,691 22,007,736 16,126,827 13,303,346Reimbursements 1,322,816 2,280,613 1,038,430 1,780,401 1,544,995 1,847,804 1,512,842 1,870,678 1,422,949 2,002,744
TOTAL REVENUES 253,267,613 244,660,168 244,766,858 259,788,713 241,488,356 275,962,790 280,399,644 281,829,571 291,907,046 305,140,974
EXPENDITURES:
General Government 18,688,270 19,098,129 18,681,665 19,339,843 19,730,538 23,618,033 24,034,077 24,999,279 25,798,914 27,384,154Public Safety 97,621,453 101,057,294 108,305,984 112,682,130 114,898,390 119,758,393 126,401,411 128,456,177 136,965,513 143,193,077Public Works 13,683,613 10,185,108 12,957,347 9,836,004 10,707,599 9,257,819 9,081,025 10,589,800 9,974,167 8,915,474Health and Welfare 20,447,413 20,160,803 22,578,990 24,339,567 24,015,886 24,139,800 24,960,106 26,068,728 26,809,427 28,879,340Cultural and Recreational 21,478,230 23,640,666 24,675,468 25,336,135 27,762,404 27,056,235 28,088,962 27,962,296 29,267,337 30,794,372Air Transportation Services 4,439,025 4,651,685 4,989,131 6,006,842 6,158,489 6,467,036 6,883,264 6,709,908 6,806,224 7,125,984Capital Outlay 82,767,916 85,712,034 71,468,161 51,861,368 50,975,719 52,394,194 66,817,376 51,840,512 43,849,418 41,149,078Bond Costs 235,629 704,855 211,726 188,314 209,549 1,373,264 969,313 - 515,780 229,028Debt Service: Principal Retirement 12,945,169 10,246,364 13,058,227 14,365,645 16,127,013 39,178,502 23,395,142 15,584,619 17,063,400 18,461,755 Loss on Advance Refunding - - - - - 258,062 584,424 - - - Interest and Fiscal Expenditures 10,711,226 10,866,914 11,071,614 10,772,155 9,987,587 9,097,392 9,127,731 9,764,959 9,576,250 9,299,688
TOTAL EXPENDITURES 283,017,944 286,323,852 287,998,313 274,728,003 280,573,174 312,598,730 320,342,831 301,976,278 306,626,430 315,431,950
Excess (Deficiency) of Revenues Over (Under) Expenditures (29,750,331) (41,663,684) (43,231,455) (14,939,290) (39,084,818) (36,635,940) (39,943,187) (20,146,707) (14,719,384) (10,290,976)
OTHER FINANCING SOURCES (USES):
Transfers In 29,605,450 46,699,942 41,973,360 37,256,256 45,447,751 56,141,691 44,180,899 36,587,762 36,471,318 37,229,912Issuance of Debt 8,715,629 23,189,078 9,764,975 3,800,000 20,795,730 45,028,000 40,155,641 - 15,131,720 15,065,000Bond Premium - 829,086 88,867 58,279 565,390 14,136,687 7,867,533 - 4,947,660 1,198,228Bond Discounts - - (4,383) - - - - - - - Payment to refunded bond escrow agent (9,230) (3,317,933) (2,112,731) - - - - - - - Reimbursements - - - - 15,005 - - - - - Transfers Out (24,521,749) (39,073,000) (37,198,426) (31,974,672) (37,121,060) (45,138,782) (35,974,394) (26,209,179) (21,889,332) (26,956,651)Contributions - - - - 19,667,880 - - - - - Issuance of Refunding Debt - - - - - 55,606,967 20,450,000 - 19,564,840 - Capital Leases 1,330,425 807,653 - 4,852,652 - - - 62,168 - - Sale of Assets 33,461 1,375,078 318,617 15,888,705 177,320 50,721 512,275 1,080,474 124,655 178,736Payment to Refunded Bond Escrow Agent - - - - (15,668,558) (65,313,880) (23,238,405) - (21,934,126) -
TOTAL OTHER FINANCING SOURCES (USES) 15,153,986 30,509,904 12,830,279 29,881,220 33,879,458 60,511,404 53,953,549 11,521,225 32,416,735 26,715,225
Net Change in Fund Balances $ (14,596,345) $ (11,153,780) $ (30,401,176) $ 14,941,930 $ (5,205,360) $ 23,875,464 $ 14,010,362 $ (8,625,482) $ 17,697,351 $ 16,424,249
Debt Service as a Percentage of non-capital expenditures 11.93% 10.88% 11.24% 11.36% 11.47% 19.08% 13.21% 10.13% 10.33% 10.20%
SOURCE:
City of Laredo, Texas
Fiscal Year
246
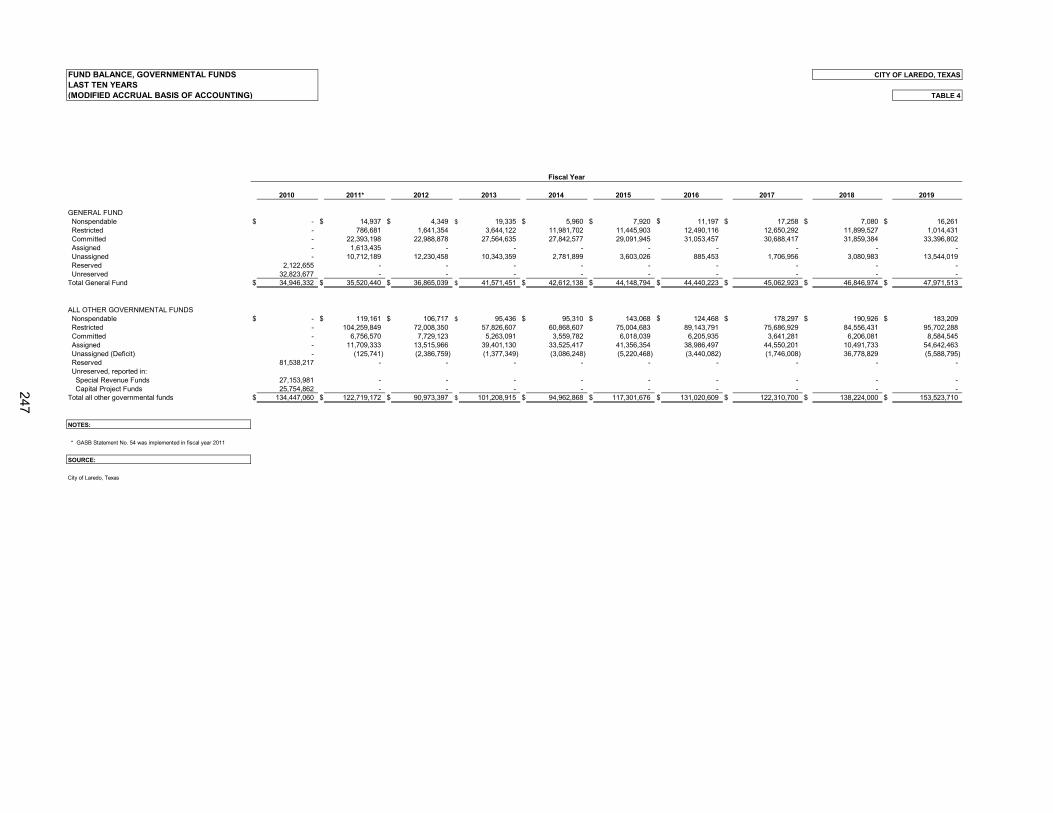
FUND BALANCE, GOVERNMENTAL FUNDS CITY OF LAREDO, TEXASLAST TEN YEARS(MODIFIED ACCRUAL BASIS OF ACCOUNTING) TABLE 4
2010 2011* 2012 2013 2014 2015 2016 2017 2018 2019
GENERAL FUND Nonspendable $ - $ 14,937 $ 4,349 $ 19,335 $ 5,960 $ 7,920 $ 11,197 $ 17,258 $ 7,080 $ 16,261 Restricted - 786,681 1,641,354 3,644,122 11,981,702 11,445,903 12,490,116 12,650,292 11,899,527 1,014,431 Committed - 22,393,198 22,988,878 27,564,635 27,842,577 29,091,945 31,053,457 30,688,417 31,859,384 33,396,802 Assigned - 1,613,435 - - - - - - - - Unassigned - 10,712,189 12,230,458 10,343,359 2,781,899 3,603,026 885,453 1,706,956 3,080,983 13,544,019 Reserved 2,122,655 - - - - - - - - - Unreserved 32,823,677 - - - - - - - - - Total General Fund $ 34,946,332 $ 35,520,440 $ 36,865,039 $ 41,571,451 $ 42,612,138 $ 44,148,794 $ 44,440,223 $ 45,062,923 $ 46,846,974 $ 47,971,513
ALL OTHER GOVERNMENTAL FUNDS Nonspendable $ - $ 119,161 $ 106,717 $ 95,436 $ 95,310 $ 143,068 $ 124,468 $ 178,297 $ 190,926 $ 183,209 Restricted - 104,259,849 72,008,350 57,826,607 60,868,607 75,004,683 89,143,791 75,686,929 84,556,431 95,702,288 Committed - 6,756,570 7,729,123 5,263,091 3,559,782 6,018,039 6,205,935 3,641,281 6,206,081 8,584,545 Assigned - 11,709,333 13,515,966 39,401,130 33,525,417 41,356,354 38,986,497 44,550,201 10,491,733 54,642,463 Unassigned (Deficit) - (125,741) (2,386,759) (1,377,349) (3,086,248) (5,220,468) (3,440,082) (1,746,008) 36,778,829 (5,588,795) Reserved 81,538,217 - - - - - - - - - Unreserved, reported in: Special Revenue Funds 27,153,981 - - - - - - - - - Capital Project Funds 25,754,862 - - - - - - - - - Total all other governmental funds $ 134,447,060 $ 122,719,172 $ 90,973,397 $ 101,208,915 $ 94,962,868 $ 117,301,676 $ 131,020,609 $ 122,310,700 $ 138,224,000 $ 153,523,710
NOTES:
* GASB Statement No. 54 was implemented in fiscal year 2011
SOURCE:
City of Laredo, Texas
Fiscal Year
247
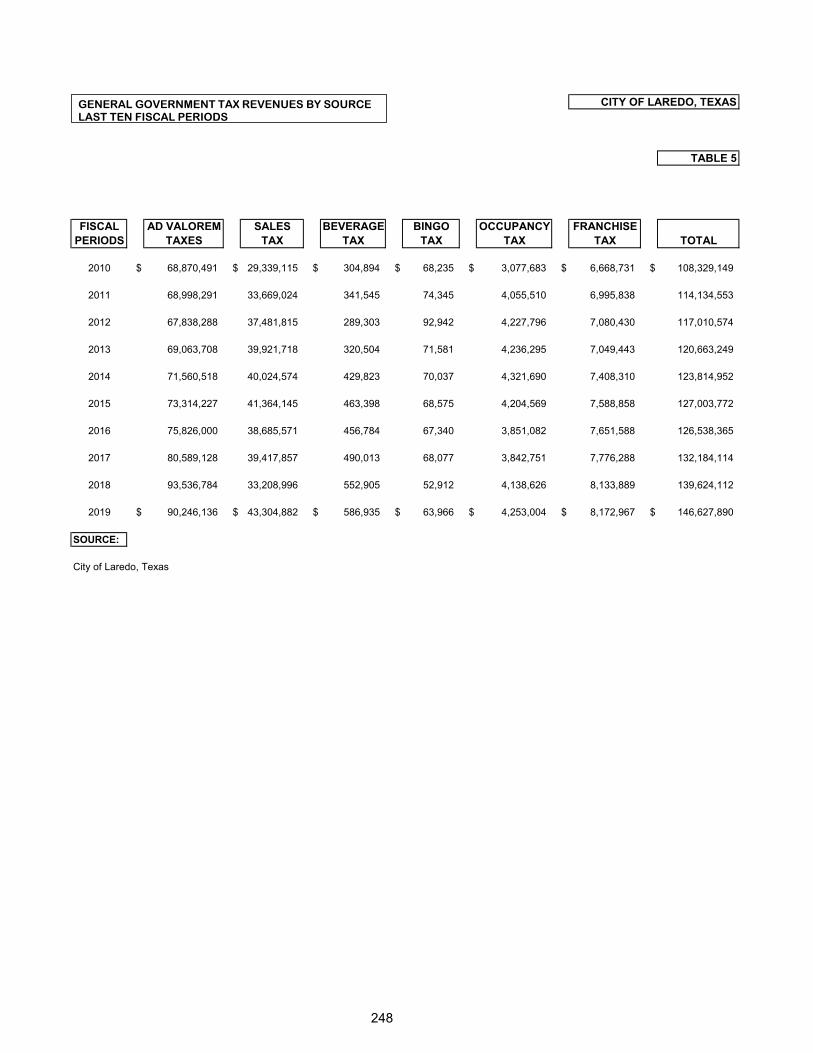
CITY OF LAREDO, TEXAS
TABLE 5
FISCAL AD VALOREM SALES BEVERAGE BINGO OCCUPANCY FRANCHISEPERIODS TAXES TAX TAX TAX TAX TAX
2010 $ 68,870,491 $ 29,339,115 $ 304,894 $ 68,235 $ 3,077,683 $ 6,668,731 $ 108,329,149
2011 68,998,291 33,669,024 341,545 74,345 4,055,510 6,995,838 114,134,553
2012 67,838,288 37,481,815 289,303 92,942 4,227,796 7,080,430 117,010,574
2013 69,063,708 39,921,718 320,504 71,581 4,236,295 7,049,443 120,663,249
2014 71,560,518 40,024,574 429,823 70,037 4,321,690 7,408,310 123,814,952
2015 73,314,227 41,364,145 463,398 68,575 4,204,569 7,588,858 127,003,772
2016 75,826,000 38,685,571 456,784 67,340 3,851,082 7,651,588 126,538,365
2017 80,589,128 39,417,857 490,013 68,077 3,842,751 7,776,288 132,184,114
2018 93,536,784 33,208,996 552,905 52,912 4,138,626 8,133,889 139,624,112
2019 $ 90,246,136 $ 43,304,882 $ 586,935 $ 63,966 $ 4,253,004 $ 8,172,967 $ 146,627,890
SOURCE:
City of Laredo, Texas
TOTAL
GENERAL GOVERNMENT TAX REVENUES BY SOURCELAST TEN FISCAL PERIODS
248
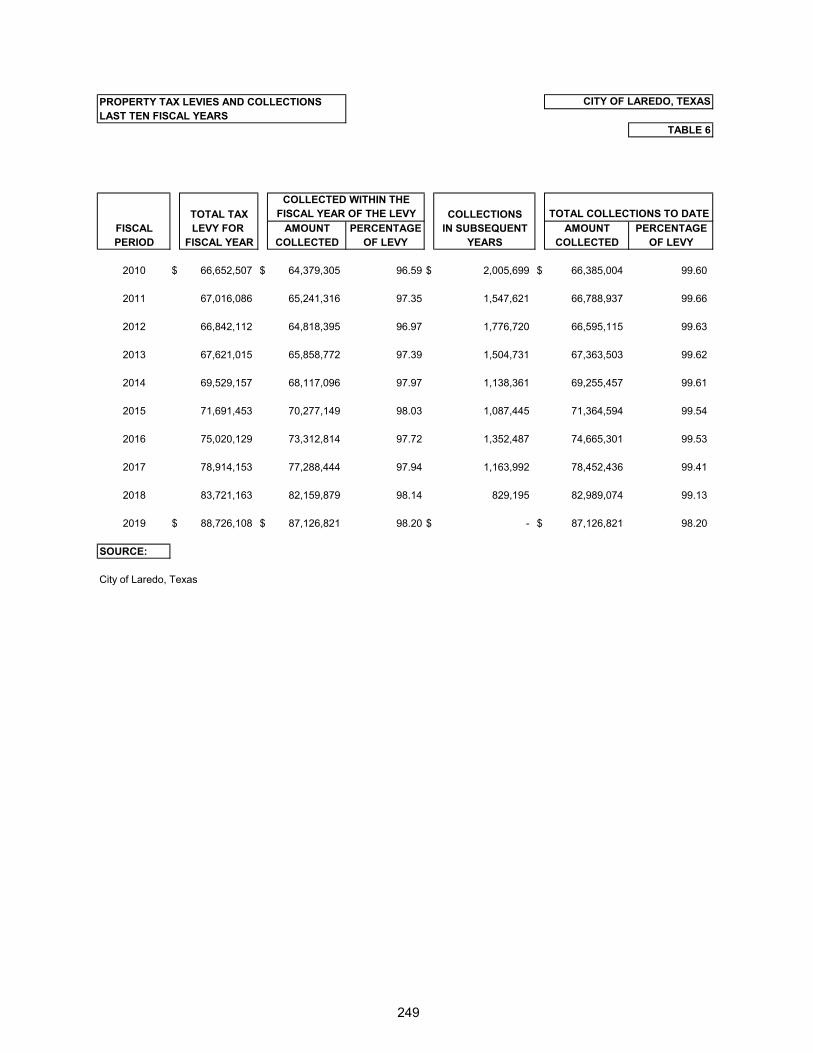
PROPERTY TAX LEVIES AND COLLECTIONSLAST TEN FISCAL YEARS
TABLE 6
TOTAL TAX COLLECTIONSFISCAL LEVY FOR AMOUNT PERCENTAGE IN SUBSEQUENT AMOUNT PERCENTAGEPERIOD FISCAL YEAR COLLECTED OF LEVY YEARS COLLECTED OF LEVY
2010 $ 66,652,507 $ 64,379,305 96.59 $ 2,005,699 $ 66,385,004 99.60
2011 67,016,086 65,241,316 97.35 1,547,621 66,788,937 99.66
2012 66,842,112 64,818,395 96.97 1,776,720 66,595,115 99.63
2013 67,621,015 65,858,772 97.39 1,504,731 67,363,503 99.62
2014 69,529,157 68,117,096 97.97 1,138,361 69,255,457 99.61
2015 71,691,453 70,277,149 98.03 1,087,445 71,364,594 99.54
2016 75,020,129 73,312,814 97.72 1,352,487 74,665,301 99.53
2017 78,914,153 77,288,444 97.94 1,163,992 78,452,436 99.41
2018 83,721,163 82,159,879 98.14 829,195 82,989,074 99.13
2019 $ 88,726,108 $ 87,126,821 98.20 $ - $ 87,126,821 98.20
SOURCE:
City of Laredo, Texas
COLLECTED WITHIN THEFISCAL YEAR OF THE LEVY TOTAL COLLECTIONS TO DATE
CITY OF LAREDO, TEXAS
249
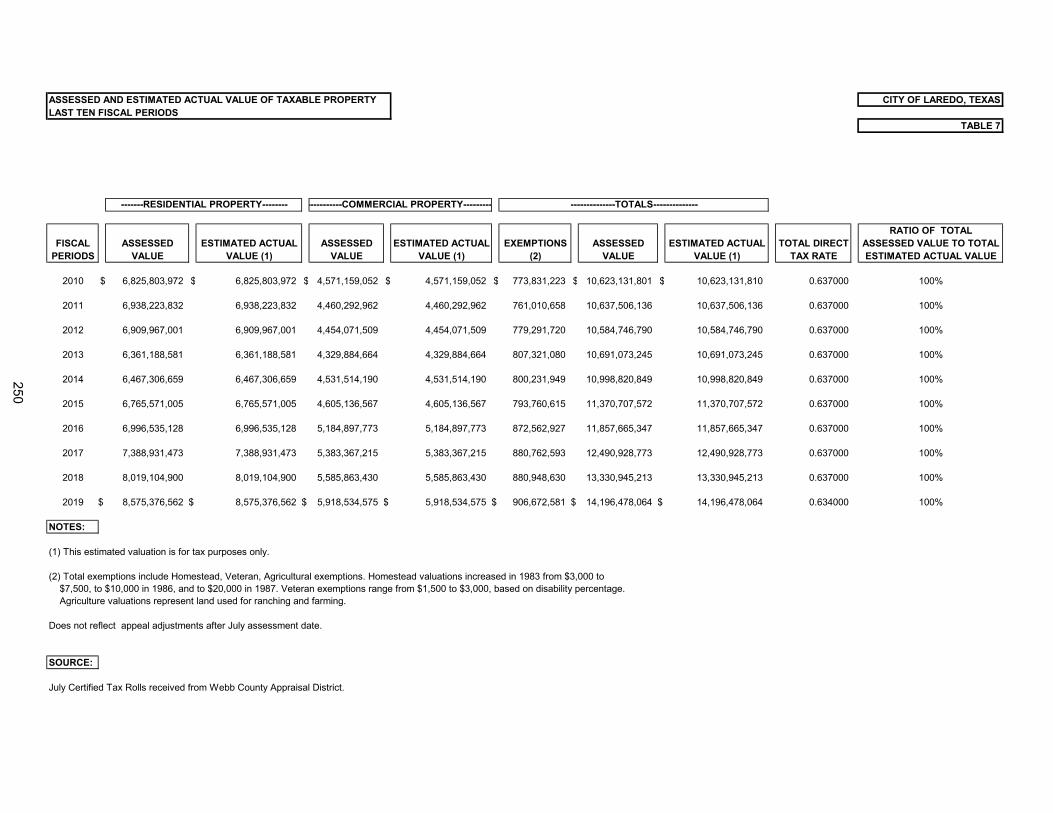
ASSESSED AND ESTIMATED ACTUAL VALUE OF TAXABLE PROPERTY CITY OF LAREDO, TEXASLAST TEN FISCAL PERIODS
TABLE 7
RATIO OF TOTALFISCAL ASSESSED ESTIMATED ACTUAL ASSESSED ESTIMATED ACTUAL EXEMPTIONS ASSESSED ESTIMATED ACTUAL TOTAL DIRECT ASSESSED VALUE TO TOTAL
PERIODS VALUE VALUE (1) VALUE VALUE (1) (2) VALUE VALUE (1) TAX RATE ESTIMATED ACTUAL VALUE
2010 $ 6,825,803,972 $ 6,825,803,972 $ 4,571,159,052 $ 4,571,159,052 $ 773,831,223 $ 10,623,131,801 $ 10,623,131,810 0.637000 100%
2011 6,938,223,832 6,938,223,832 4,460,292,962 4,460,292,962 761,010,658 10,637,506,136 10,637,506,136 0.637000 100%
2012 6,909,967,001 6,909,967,001 4,454,071,509 4,454,071,509 779,291,720 10,584,746,790 10,584,746,790 0.637000 100%
2013 6,361,188,581 6,361,188,581 4,329,884,664 4,329,884,664 807,321,080 10,691,073,245 10,691,073,245 0.637000 100%
2014 6,467,306,659 6,467,306,659 4,531,514,190 4,531,514,190 800,231,949 10,998,820,849 10,998,820,849 0.637000 100%
2015 6,765,571,005 6,765,571,005 4,605,136,567 4,605,136,567 793,760,615 11,370,707,572 11,370,707,572 0.637000 100%
2016 6,996,535,128 6,996,535,128 5,184,897,773 5,184,897,773 872,562,927 11,857,665,347 11,857,665,347 0.637000 100%
2017 7,388,931,473 7,388,931,473 5,383,367,215 5,383,367,215 880,762,593 12,490,928,773 12,490,928,773 0.637000 100%
2018 8,019,104,900 8,019,104,900 5,585,863,430 5,585,863,430 880,948,630 13,330,945,213 13,330,945,213 0.637000 100%
2019 $ 8,575,376,562 $ 8,575,376,562 $ 5,918,534,575 $ 5,918,534,575 $ 906,672,581 $ 14,196,478,064 $ 14,196,478,064 0.634000 100%
NOTES:
(1) This estimated valuation is for tax purposes only.
(2) Total exemptions include Homestead, Veteran, Agricultural exemptions. Homestead valuations increased in 1983 from $3,000 to $7,500, to $10,000 in 1986, and to $20,000 in 1987. Veteran exemptions range from $1,500 to $3,000, based on disability percentage. Agriculture valuations represent land used for ranching and farming.
Does not reflect appeal adjustments after July assessment date.
SOURCE:
July Certified Tax Rolls received from Webb County Appraisal District.
-------RESIDENTIAL PROPERTY-------- -----------COMMERCIAL PROPERTY--------- --------------TOTALS--------------
250
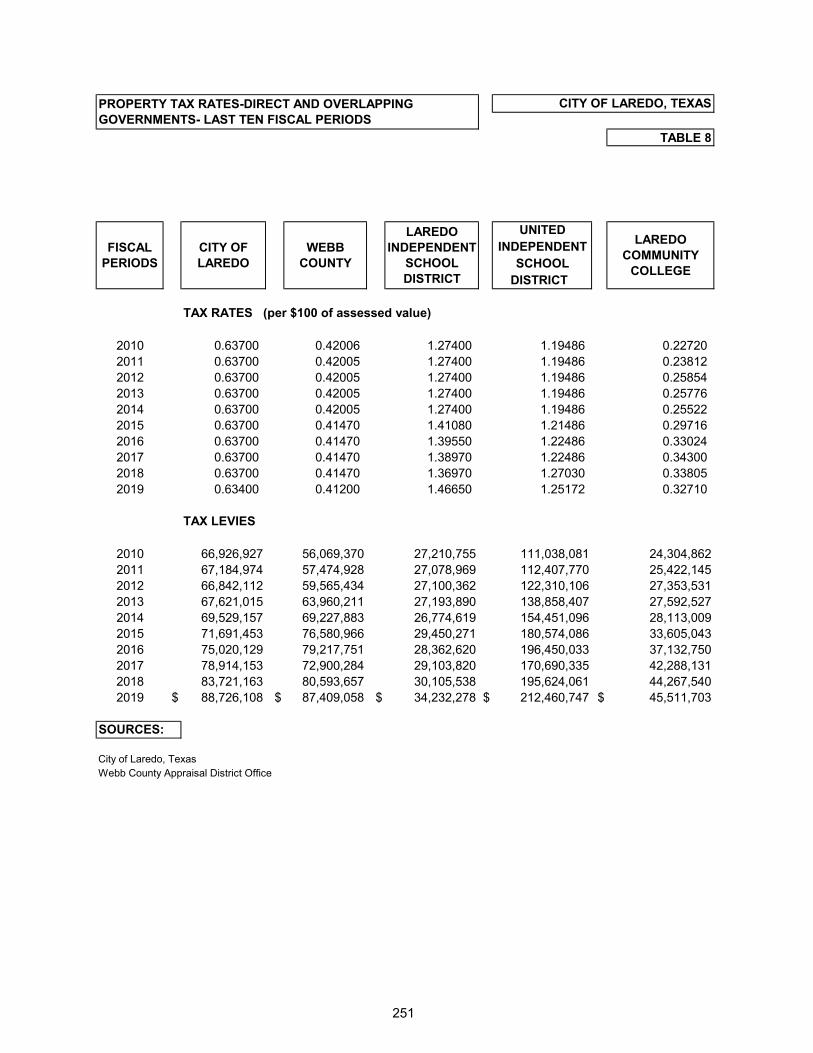
TABLE 8
UNITEDINDEPENDENT
SCHOOLDISTRICT
TAX RATES (per $100 of assessed value)
2010 0.63700 0.42006 1.27400 1.19486 0.22720 2011 0.63700 0.42005 1.27400 1.19486 0.23812 2012 0.63700 0.42005 1.27400 1.19486 0.25854 2013 0.63700 0.42005 1.27400 1.19486 0.25776 2014 0.63700 0.42005 1.27400 1.19486 0.25522 2015 0.63700 0.41470 1.41080 1.21486 0.29716 2016 0.63700 0.41470 1.39550 1.22486 0.33024 2017 0.63700 0.41470 1.38970 1.22486 0.34300 2018 0.63700 0.41470 1.36970 1.27030 0.33805 2019 0.63400 0.41200 1.46650 1.25172 0.32710
TAX LEVIES
2010 66,926,927 56,069,370 27,210,755 111,038,081 24,304,8622011 67,184,974 57,474,928 27,078,969 112,407,770 25,422,1452012 66,842,112 59,565,434 27,100,362 122,310,106 27,353,5312013 67,621,015 63,960,211 27,193,890 138,858,407 27,592,5272014 69,529,157 69,227,883 26,774,619 154,451,096 28,113,0092015 71,691,453 76,580,966 29,450,271 180,574,086 33,605,0432016 75,020,129 79,217,751 28,362,620 196,450,033 37,132,7502017 78,914,153 72,900,284 29,103,820 170,690,335 42,288,1312018 83,721,163 80,593,657 30,105,538 195,624,061 44,267,5402019 $ 88,726,108 $ 87,409,058 $ 34,232,278 $ 212,460,747 $ 45,511,703
SOURCES:
City of Laredo, TexasWebb County Appraisal District Office
LAREDO COMMUNITY
COLLEGE
CITY OF LAREDO, TEXASPROPERTY TAX RATES-DIRECT AND OVERLAPPING GOVERNMENTS- LAST TEN FISCAL PERIODS
FISCAL PERIODS
CITY OF LAREDO
WEBB COUNTY
LAREDO INDEPENDENT
SCHOOL DISTRICT
251
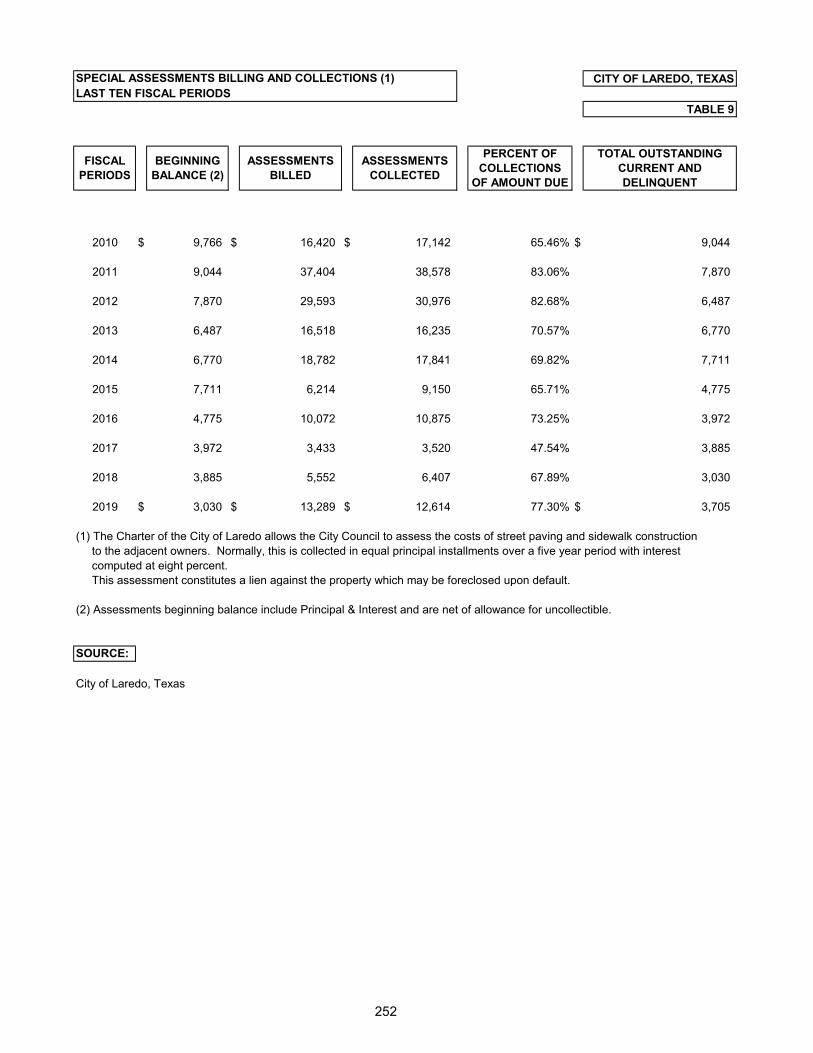
SPECIAL ASSESSMENTS BILLING AND COLLECTIONS (1) CITY OF LAREDO, TEXASLAST TEN FISCAL PERIODS
TABLE 9
2010 $ 9,766 $ 16,420 $ 17,142 65.46% $ 9,044
2011 9,044 37,404 38,578 83.06% 7,870
2012 7,870 29,593 30,976 82.68% 6,487
2013 6,487 16,518 16,235 70.57% 6,770
2014 6,770 18,782 17,841 69.82% 7,711
2015 7,711 6,214 9,150 65.71% 4,775
2016 4,775 10,072 10,875 73.25% 3,972
2017 3,972 3,433 3,520 47.54% 3,885
2018 3,885 5,552 6,407 67.89% 3,030
2019 $ 3,030 $ 13,289 $ 12,614 77.30% $ 3,705
(1) The Charter of the City of Laredo allows the City Council to assess the costs of street paving and sidewalk construction to the adjacent owners. Normally, this is collected in equal principal installments over a five year period with interest computed at eight percent. This assessment constitutes a lien against the property which may be foreclosed upon default.
(2) Assessments beginning balance include Principal & Interest and are net of allowance for uncollectible.
SOURCE:
City of Laredo, Texas
TOTAL OUTSTANDING CURRENT AND DELINQUENT
FISCAL PERIODS
BEGINNING BALANCE (2)
ASSESSMENTS BILLED
ASSESSMENTS COLLECTED
PERCENT OF COLLECTIONS
OF AMOUNT DUE
252

PRINCIPAL TAXPAYERS CITY OF LAREDO, TEXASSEPTEMBER 30, 2019
TABLE 10
AEP Texas Central Company Electricity $159,177,560 1.08%
Laredo Texas Hospital Co. LP Hospital 95,913,380 0.65%
Laredo Outlet Shoppes, LLC Retail 63,629,750 0.43%
Mall Del Norte, LLC Retail 68,868,140 0.46%
The Geo Group, Inc. Jail 57,371,340 0.39%
Farias Development LTD Real Estate 57,298,520 0.39%
Laredo Regional Medical CTR LP Hospital 49,307,150 0.34%
Killam Industrial Dev. Partnership, Ltd. Real Estate 51,026,479 0.35%
AEP Electric Transmission of Texas, LLC Electricity Transmission 42,104,660 0.29%
United States Cold Storage, Inc. Cold Storage 50,339,870 0.34%
TOTAL $695,036,849 4.73%
PRINCIPAL TAXPAYERSSEPTEMBER 30, 2009
Laredo Texas Hospital Co. LP Hospital $104,560,410 1.01%
The Geo Group Inc. Jail 52,769,480 0.51%
Mall Del Norte, LLC Retail 52,630,460 0.51%
AEP Texas Central Company Electricity 45,142,760 0.43%
Laredo Regional Medical CTR LP Medical Center 44,354,480 0.43%
Electric Transmission of Texas Electricity 36,509,720 0.35%
International Bank of Commerce Bank 35,222,910 0.34%
Killam Industrial Dev. Partnership, Ltd. Real Estate 33,287,120 0.32%
San Isidro Northeast LTD Real Estate 32,941,770 0.32%
H.E. Butt Grocery Company Retail 29,168,450 0.28%
Total $466,587,560 4.49%
Numbers show total comparison for principal taxpayers as of 2019 and 10 years ago.
SOURCE:
City of Laredo, Texas
TAXPAYER TYPE OF BUSINESS
2019 ASSESSED VALUATION REAL &
PERSONAL PROPERTY
PERCENTAGE OF TOTAL ASSESSED
VALUATION
TAXPAYER TYPE OF BUSINESS
2009 ASSESSED VALUATION REAL &
PERSONAL PROPERTY
PERCENTAGE OF TOTAL ASSESSED
VALUATION
253
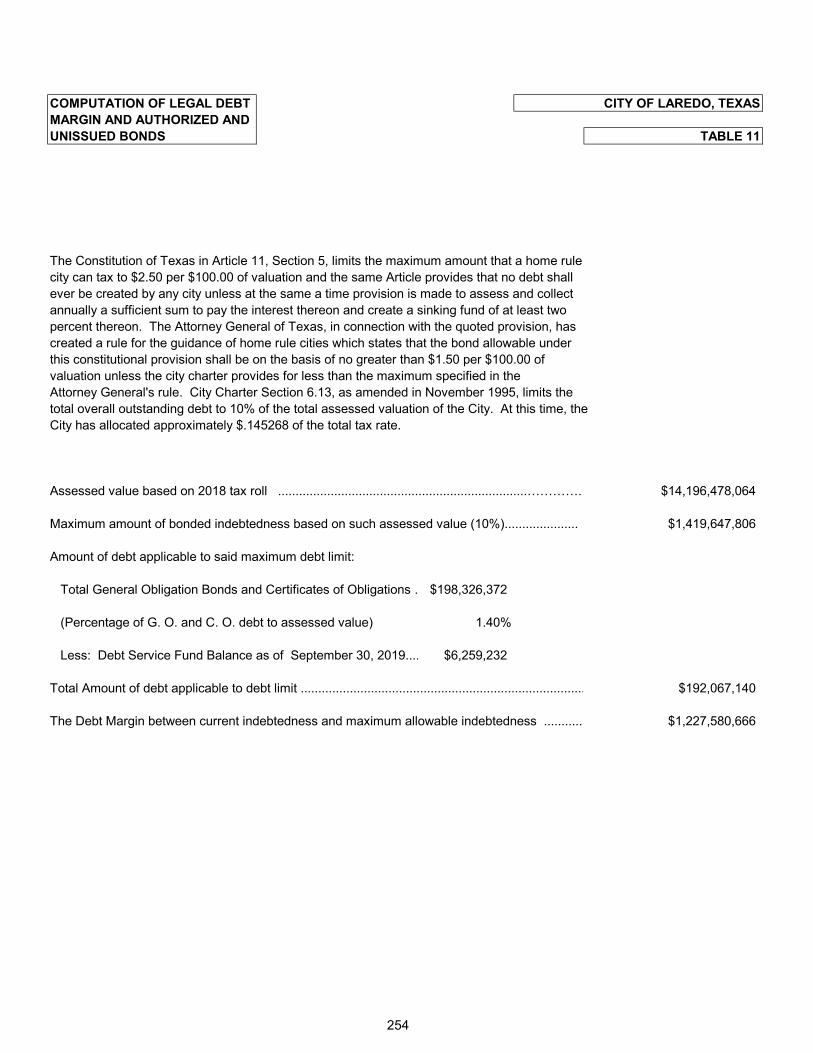
COMPUTATION OF LEGAL DEBT CITY OF LAREDO, TEXASMARGIN AND AUTHORIZED ANDUNISSUED BONDS TABLE 11
The Constitution of Texas in Article 11, Section 5, limits the maximum amount that a home rulecity can tax to $2.50 per $100.00 of valuation and the same Article provides that no debt shall ever be created by any city unless at the same a time provision is made to assess and collectannually a sufficient sum to pay the interest thereon and create a sinking fund of at least twopercent thereon. The Attorney General of Texas, in connection with the quoted provision, hascreated a rule for the guidance of home rule cities which states that the bond allowable underthis constitutional provision shall be on the basis of no greater than $1.50 per $100.00 ofvaluation unless the city charter provides for less than the maximum specified in theAttorney General's rule. City Charter Section 6.13, as amended in November 1995, limits the total overall outstanding debt to 10% of the total assessed valuation of the City. At this time, theCity has allocated approximately $.145268 of the total tax rate.
Assessed value based on 2018 tax roll .......................................................................…………. $14,196,478,064
Maximum amount of bonded indebtedness based on such assessed value (10%)..................... $1,419,647,806
Amount of debt applicable to said maximum debt limit:
Total General Obligation Bonds and Certificates of Obligations … $198,326,372
(Percentage of G. O. and C. O. debt to assessed value) 1.40%
Less: Debt Service Fund Balance as of September 30, 2019.... $6,259,232
Total Amount of debt applicable to debt limit ................................................................................. $192,067,140
The Debt Margin between current indebtedness and maximum allowable indebtedness ........... $1,227,580,666
254
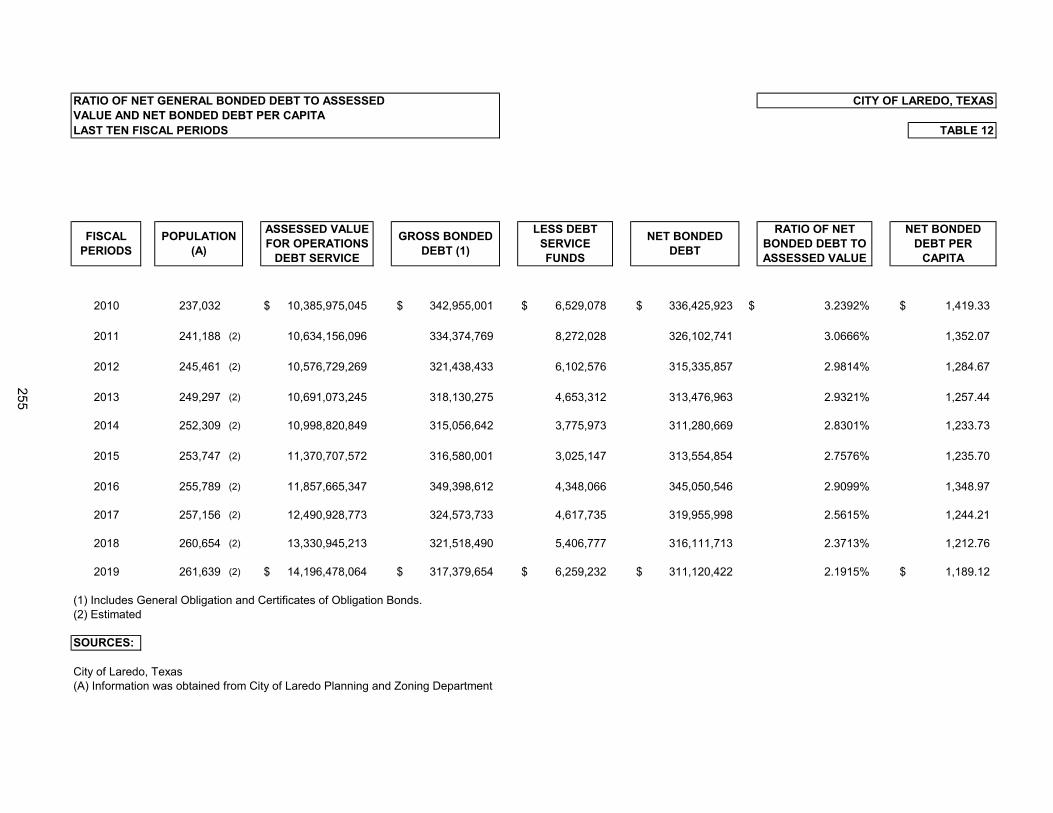
RATIO OF NET GENERAL BONDED DEBT TO ASSESSED CITY OF LAREDO, TEXASVALUE AND NET BONDED DEBT PER CAPITALAST TEN FISCAL PERIODS TABLE 12
2010 237,032 $ 10,385,975,045 $ 342,955,001 $ 6,529,078 $ 336,425,923 $ 3.2392% $ 1,419.33
2011 241,188 (2) 10,634,156,096 334,374,769 8,272,028 326,102,741 3.0666% 1,352.07
2012 245,461 (2) 10,576,729,269 321,438,433 6,102,576 315,335,857 2.9814% 1,284.67
2013 249,297 (2) 10,691,073,245 318,130,275 4,653,312 313,476,963 2.9321% 1,257.44
2014 252,309 (2) 10,998,820,849 315,056,642 3,775,973 311,280,669 2.8301% 1,233.73
2015 253,747 (2) 11,370,707,572 316,580,001 3,025,147 313,554,854 2.7576% 1,235.70
2016 255,789 (2) 11,857,665,347 349,398,612 4,348,066 345,050,546 2.9099% 1,348.97
2017 257,156 (2) 12,490,928,773 324,573,733 4,617,735 319,955,998 2.5615% 1,244.21
2018 260,654 (2) 13,330,945,213 321,518,490 5,406,777 316,111,713 2.3713% 1,212.76
2019 261,639 (2) $ 14,196,478,064 $ 317,379,654 $ 6,259,232 $ 311,120,422 2.1915% $ 1,189.12
(1) Includes General Obligation and Certificates of Obligation Bonds.(2) Estimated
SOURCES:
City of Laredo, Texas(A) Information was obtained from City of Laredo Planning and Zoning Department
NET BONDED DEBT PER
CAPITA
RATIO OF NET BONDED DEBT TO ASSESSED VALUE
FISCAL PERIODS
POPULATION (A)
ASSESSED VALUE FOR OPERATIONS
DEBT SERVICE
GROSS BONDED DEBT (1)
LESS DEBT SERVICE FUNDS
NET BONDED DEBT
255
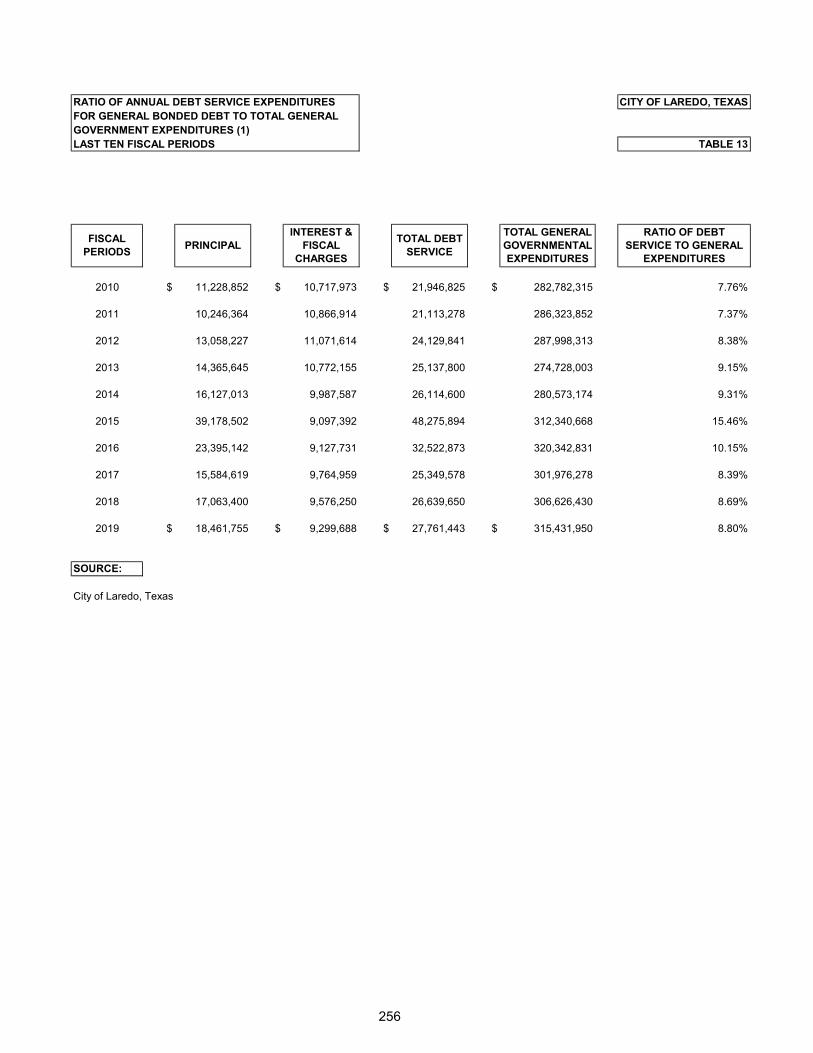
RATIO OF ANNUAL DEBT SERVICE EXPENDITURES CITY OF LAREDO, TEXASFOR GENERAL BONDED DEBT TO TOTAL GENERALGOVERNMENT EXPENDITURES (1)LAST TEN FISCAL PERIODS TABLE 13
2010 $ 11,228,852 $ 10,717,973 $ 21,946,825 $ 282,782,315 7.76%
2011 10,246,364 10,866,914 21,113,278 286,323,852 7.37%
2012 13,058,227 11,071,614 24,129,841 287,998,313 8.38%
2013 14,365,645 10,772,155 25,137,800 274,728,003 9.15%
2014 16,127,013 9,987,587 26,114,600 280,573,174 9.31%
2015 39,178,502 9,097,392 48,275,894 312,340,668 15.46%
2016 23,395,142 9,127,731 32,522,873 320,342,831 10.15%
2017 15,584,619 9,764,959 25,349,578 301,976,278 8.39%
2018 17,063,400 9,576,250 26,639,650 306,626,430 8.69%
2019 $ 18,461,755 $ 9,299,688 $ 27,761,443 $ 315,431,950 8.80%
SOURCE:
City of Laredo, Texas
RATIO OF DEBT SERVICE TO GENERAL
EXPENDITURES
FISCAL PERIODS PRINCIPAL
INTEREST & FISCAL
CHARGES
TOTAL DEBT SERVICE
TOTAL GENERAL GOVERNMENTAL EXPENDITURES
256
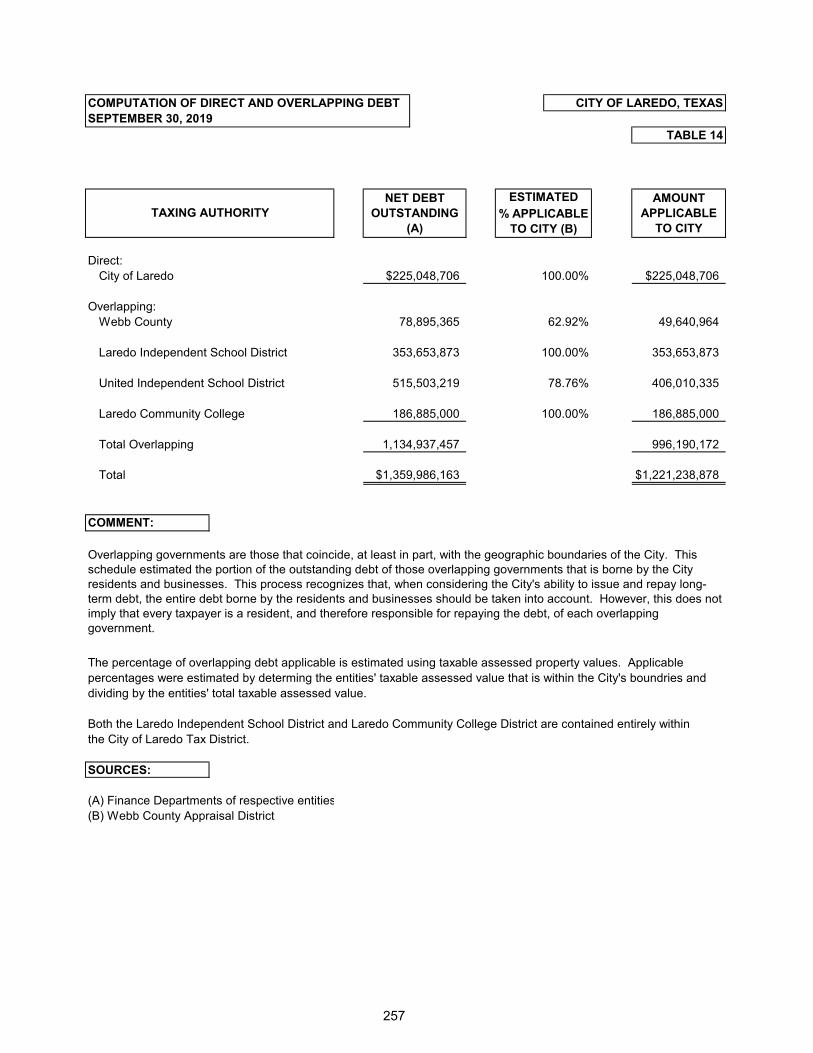
COMPUTATION OF DIRECT AND OVERLAPPING DEBT CITY OF LAREDO, TEXAS
TABLE 14
$225,048,706
49,640,964
353,653,873
406,010,335
186,885,000
996,190,172
$1,221,238,878
COMMENT:
SOURCES:
78,895,365
1,134,937,457
$1,359,986,163
100.00%
(A) Finance Departments of respective entities(B) Webb County Appraisal District
100.00%
62.92%
United Independent School District
Laredo Community College
Total Overlapping
Overlapping:
186,885,000
SEPTEMBER 30, 2019
TAXING AUTHORITY
Direct:City of Laredo
Total
Webb County
Laredo Independent School District
Both the Laredo Independent School District and Laredo Community College District are contained entirely withinthe City of Laredo Tax District.
AMOUNT APPLICABLE
TO CITY
NET DEBT OUTSTANDING
(A)
$225,048,706
353,653,873
515,503,219
% APPLICABLE TO CITY (B)
ESTIMATED
100.00%
78.76%
Overlapping governments are those that coincide, at least in part, with the geographic boundaries of the City. This schedule estimated the portion of the outstanding debt of those overlapping governments that is borne by the City residents and businesses. This process recognizes that, when considering the City's ability to issue and repay long-term debt, the entire debt borne by the residents and businesses should be taken into account. However, this does not imply that every taxpayer is a resident, and therefore responsible for repaying the debt, of each overlapping government.
The percentage of overlapping debt applicable is estimated using taxable assessed property values. Applicablepercentages were estimated by determing the entities' taxable assessed value that is within the City's boundries and dividing by the entities' total taxable assessed value.
257
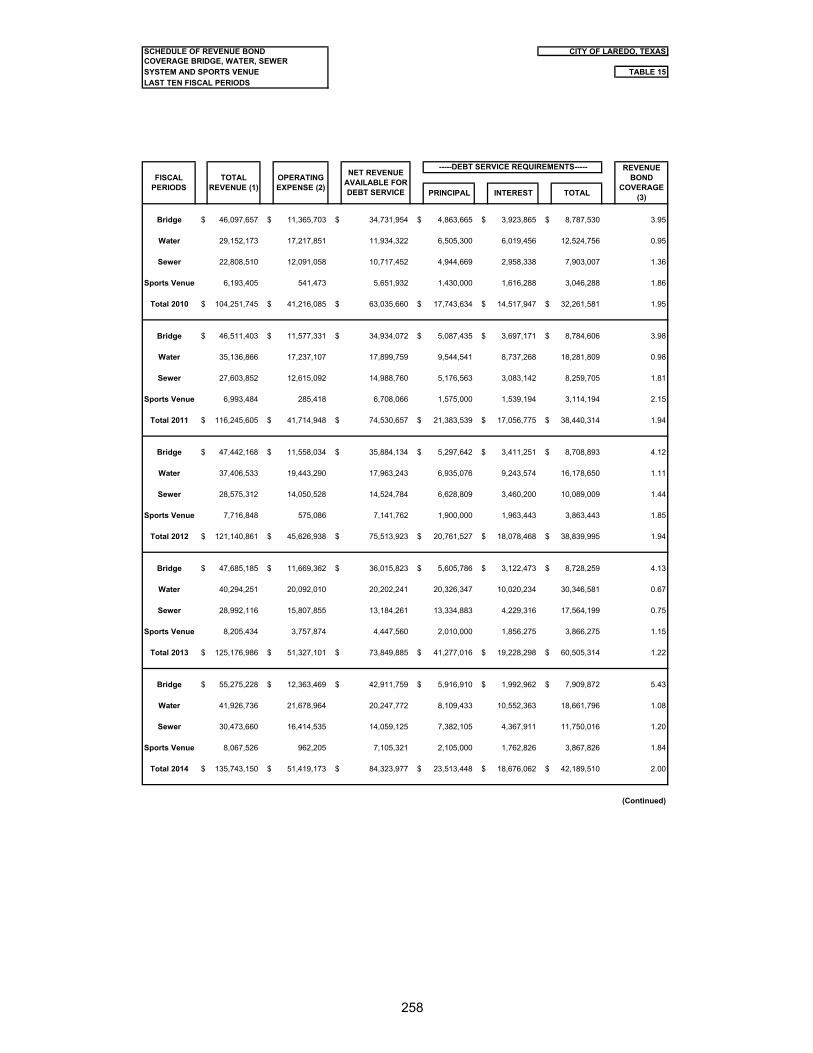
SCHEDULE OF REVENUE BOND CITY OF LAREDO, TEXASCOVERAGE BRIDGE, WATER, SEWERSYSTEM AND SPORTS VENUE TABLE 15LAST TEN FISCAL PERIODS
Bridge $ 46,097,657 $ 11,365,703 $ 34,731,954 $ 4,863,665 $ 3,923,865 $ 8,787,530 3.95
Water 29,152,173 17,217,851 11,934,322 6,505,300 6,019,456 12,524,756 0.95
Sewer 22,808,510 12,091,058 10,717,452 4,944,669 2,958,338 7,903,007 1.36
Sports Venue 6,193,405 541,473 5,651,932 1,430,000 1,616,288 3,046,288 1.86
Total 2010 $ 104,251,745 $ 41,216,085 $ 63,035,660 $ 17,743,634 $ 14,517,947 $ 32,261,581 1.95
Bridge $ 46,511,403 $ 11,577,331 $ 34,934,072 $ 5,087,435 $ 3,697,171 $ 8,784,606 3.98
Water 35,136,866 17,237,107 17,899,759 9,544,541 8,737,268 18,281,809 0.98
Sewer 27,603,852 12,615,092 14,988,760 5,176,563 3,083,142 8,259,705 1.81
Sports Venue 6,993,484 285,418 6,708,066 1,575,000 1,539,194 3,114,194 2.15
Total 2011 $ 116,245,605 $ 41,714,948 $ 74,530,657 $ 21,383,539 $ 17,056,775 $ 38,440,314 1.94
Bridge $ 47,442,168 $ 11,558,034 $ 35,884,134 $ 5,297,642 $ 3,411,251 $ 8,708,893 4.12
Water 37,406,533 19,443,290 17,963,243 6,935,076 9,243,574 16,178,650 1.11
Sewer 28,575,312 14,050,528 14,524,784 6,628,809 3,460,200 10,089,009 1.44
Sports Venue 7,716,848 575,086 7,141,762 1,900,000 1,963,443 3,863,443 1.85
Total 2012 $ 121,140,861 $ 45,626,938 $ 75,513,923 $ 20,761,527 $ 18,078,468 $ 38,839,995 1.94
Bridge $ 47,685,185 $ 11,669,362 $ 36,015,823 $ 5,605,786 $ 3,122,473 $ 8,728,259 4.13
Water 40,294,251 20,092,010 20,202,241 20,326,347 10,020,234 30,346,581 0.67
Sewer 28,992,116 15,807,855 13,184,261 13,334,883 4,229,316 17,564,199 0.75
Sports Venue 8,205,434 3,757,874 4,447,560 2,010,000 1,856,275 3,866,275 1.15
Total 2013 $ 125,176,986 $ 51,327,101 $ 73,849,885 $ 41,277,016 $ 19,228,298 $ 60,505,314 1.22
Bridge $ 55,275,228 $ 12,363,469 $ 42,911,759 $ 5,916,910 $ 1,992,962 $ 7,909,872 5.43
Water 41,926,736 21,678,964 20,247,772 8,109,433 10,552,363 18,661,796 1.08
Sewer 30,473,660 16,414,535 14,059,125 7,382,105 4,367,911 11,750,016 1.20
Sports Venue 8,067,526 962,205 7,105,321 2,105,000 1,762,826 3,867,826 1.84
Total 2014 $ 135,743,150 $ 51,419,173 $ 84,323,977 $ 23,513,448 $ 18,676,062 $ 42,189,510 2.00
(Continued)
FISCAL PERIODS
OPERATING EXPENSE (2)
TOTAL REVENUE (1) INTEREST TOTAL
REVENUE BOND
COVERAGE (3)
-----DEBT SERVICE REQUIREMENTS-----
PRINCIPAL
NET REVENUE AVAILABLE FOR DEBT SERVICE
258
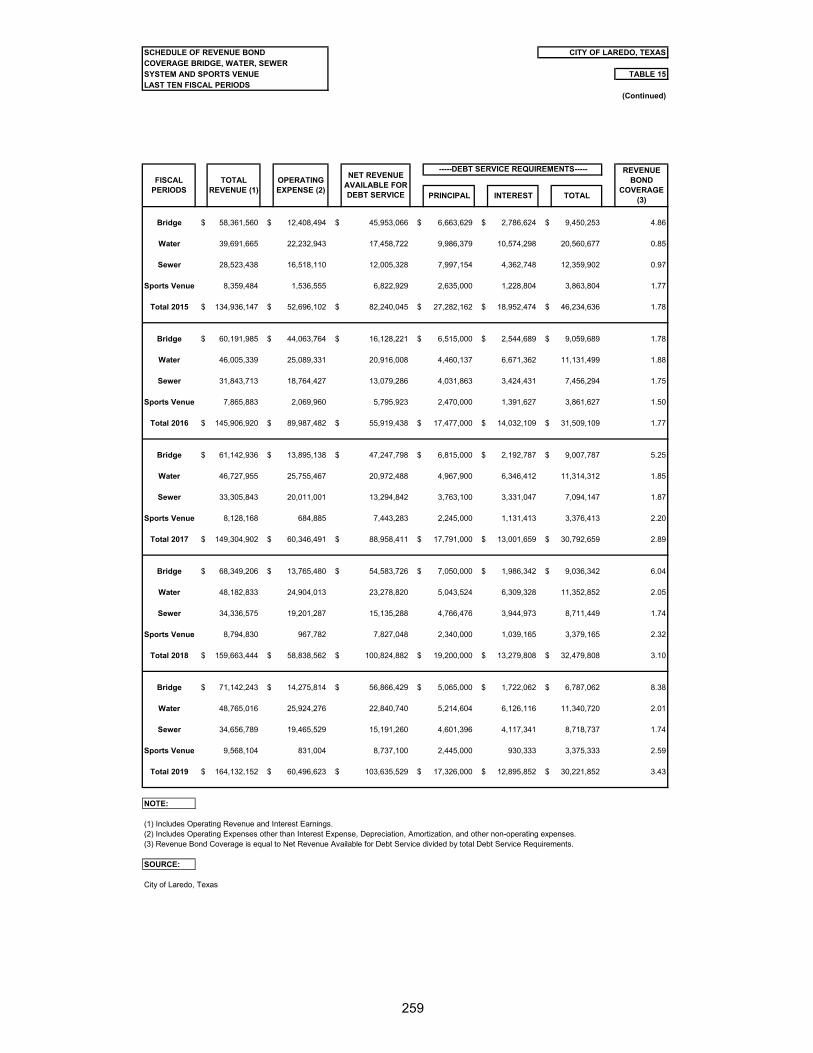
SCHEDULE OF REVENUE BOND CITY OF LAREDO, TEXASCOVERAGE BRIDGE, WATER, SEWERSYSTEM AND SPORTS VENUE TABLE 15LAST TEN FISCAL PERIODS
(Continued)
Bridge $ 58,361,560 $ 12,408,494 $ 45,953,066 $ 6,663,629 $ 2,786,624 $ 9,450,253 4.86
Water 39,691,665 22,232,943 17,458,722 9,986,379 10,574,298 20,560,677 0.85
Sewer 28,523,438 16,518,110 12,005,328 7,997,154 4,362,748 12,359,902 0.97
Sports Venue 8,359,484 1,536,555 6,822,929 2,635,000 1,228,804 3,863,804 1.77
Total 2015 $ 134,936,147 $ 52,696,102 $ 82,240,045 $ 27,282,162 $ 18,952,474 $ 46,234,636 1.78
Bridge $ 60,191,985 $ 44,063,764 $ 16,128,221 $ 6,515,000 $ 2,544,689 $ 9,059,689 1.78
Water 46,005,339 25,089,331 20,916,008 4,460,137 6,671,362 11,131,499 1.88
Sewer 31,843,713 18,764,427 13,079,286 4,031,863 3,424,431 7,456,294 1.75
Sports Venue 7,865,883 2,069,960 5,795,923 2,470,000 1,391,627 3,861,627 1.50
Total 2016 $ 145,906,920 $ 89,987,482 $ 55,919,438 $ 17,477,000 $ 14,032,109 $ 31,509,109 1.77
Bridge $ 61,142,936 $ 13,895,138 $ 47,247,798 $ 6,815,000 $ 2,192,787 $ 9,007,787 5.25
Water 46,727,955 25,755,467 20,972,488 4,967,900 6,346,412 11,314,312 1.85
Sewer 33,305,843 20,011,001 13,294,842 3,763,100 3,331,047 7,094,147 1.87
Sports Venue 8,128,168 684,885 7,443,283 2,245,000 1,131,413 3,376,413 2.20
Total 2017 $ 149,304,902 $ 60,346,491 $ 88,958,411 $ 17,791,000 $ 13,001,659 $ 30,792,659 2.89
Bridge $ 68,349,206 $ 13,765,480 $ 54,583,726 $ 7,050,000 $ 1,986,342 $ 9,036,342 6.04
Water 48,182,833 24,904,013 23,278,820 5,043,524 6,309,328 11,352,852 2.05
Sewer 34,336,575 19,201,287 15,135,288 4,766,476 3,944,973 8,711,449 1.74
Sports Venue 8,794,830 967,782 7,827,048 2,340,000 1,039,165 3,379,165 2.32
Total 2018 $ 159,663,444 $ 58,838,562 $ 100,824,882 $ 19,200,000 $ 13,279,808 $ 32,479,808 3.10
Bridge $ 71,142,243 $ 14,275,814 $ 56,866,429 $ 5,065,000 $ 1,722,062 $ 6,787,062 8.38
Water 48,765,016 25,924,276 22,840,740 5,214,604 6,126,116 11,340,720 2.01
Sewer 34,656,789 19,465,529 15,191,260 4,601,396 4,117,341 8,718,737 1.74
Sports Venue 9,568,104 831,004 8,737,100 2,445,000 930,333 3,375,333 2.59
Total 2019 $ 164,132,152 $ 60,496,623 $ 103,635,529 $ 17,326,000 $ 12,895,852 $ 30,221,852 3.43
NOTE:
(1) Includes Operating Revenue and Interest Earnings.(2) Includes Operating Expenses other than Interest Expense, Depreciation, Amortization, and other non-operating expenses.(3) Revenue Bond Coverage is equal to Net Revenue Available for Debt Service divided by total Debt Service Requirements.
SOURCE:
City of Laredo, Texas
NET REVENUE AVAILABLE FOR DEBT SERVICE
OPERATING EXPENSE (2)
TOTAL REVENUE (1)
FISCAL PERIODS
REVENUE BOND
COVERAGE (3)PRINCIPAL INTEREST TOTAL
-----DEBT SERVICE REQUIREMENTS-----
259
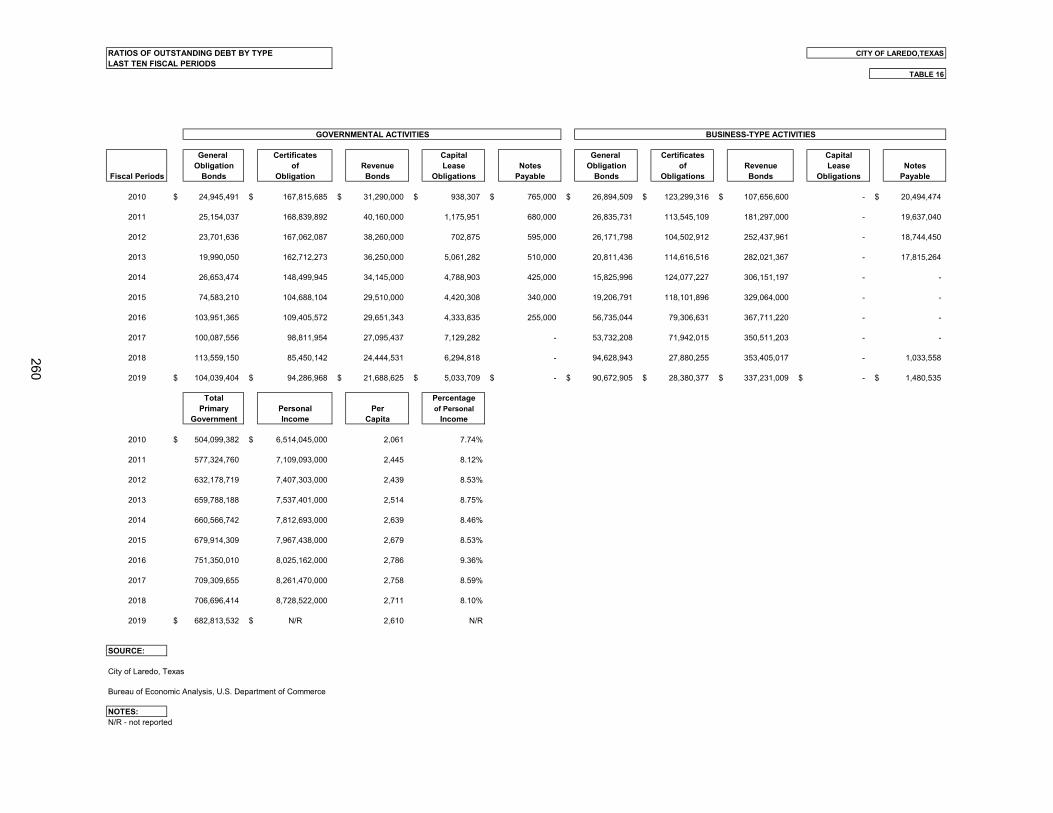
RATIOS OF OUTSTANDING DEBT BY TYPELAST TEN FISCAL PERIODS
General Certificates Capital General Certificates CapitalObligation of Revenue Lease Notes Obligation of Revenue Lease Notes
Fiscal Periods Bonds Obligation Bonds Obligations Payable Bonds Obligations Bonds Obligations Payable
2010 $ 24,945,491 $ 167,815,685 $ 31,290,000 $ 938,307 $ 765,000 $ 26,894,509 $ 123,299,316 $ 107,656,600 - $ 20,494,474
2011 25,154,037 168,839,892 40,160,000 1,175,951 680,000 26,835,731 113,545,109 181,297,000 - 19,637,040
2012 23,701,636 167,062,087 38,260,000 702,875 595,000 26,171,798 104,502,912 252,437,961 - 18,744,450
2013 19,990,050 162,712,273 36,250,000 5,061,282 510,000 20,811,436 114,616,516 282,021,367 - 17,815,264
2014 26,653,474 148,499,945 34,145,000 4,788,903 425,000 15,825,996 124,077,227 306,151,197 - -
2015 74,583,210 104,688,104 29,510,000 4,420,308 340,000 19,206,791 118,101,896 329,064,000 - -
2016 103,951,365 109,405,572 29,651,343 4,333,835 255,000 56,735,044 79,306,631 367,711,220 - -
2017 100,087,556 98,811,954 27,095,437 7,129,282 - 53,732,208 71,942,015 350,511,203 - -
2018 113,559,150 85,450,142 24,444,531 6,294,818 - 94,628,943 27,880,255 353,405,017 - 1,033,558
2019 $ 104,039,404 $ 94,286,968 $ 21,688,625 $ 5,033,709 $ - $ 90,672,905 $ 28,380,377 $ 337,231,009 $ - $ 1,480,535
Total PercentagePrimary Personal Per of Personal
Government Income Capita Income
2010 $ 504,099,382 $ 6,514,045,000 2,061 7.74%
2011 577,324,760 7,109,093,000 2,445 8.12%
2012 632,178,719 7,407,303,000 2,439 8.53%
2013 659,788,188 7,537,401,000 2,514 8.75%
2014 660,566,742 7,812,693,000 2,639 8.46%
2015 679,914,309 7,967,438,000 2,679 8.53%
2016 751,350,010 8,025,162,000 2,786 9.36%
2017 709,309,655 8,261,470,000 2,758 8.59%
2018 706,696,414 8,728,522,000 2,711 8.10%
2019 $ 682,813,532 $ N/R 2,610 N/R
SOURCE:
City of Laredo, Texas
Bureau of Economic Analysis, U.S. Department of Commerce
NOTES:N/R - not reported
GOVERNMENTAL ACTIVITIES
TABLE 16
CITY OF LAREDO,TEXAS
BUSINESS-TYPE ACTIVITIES
260
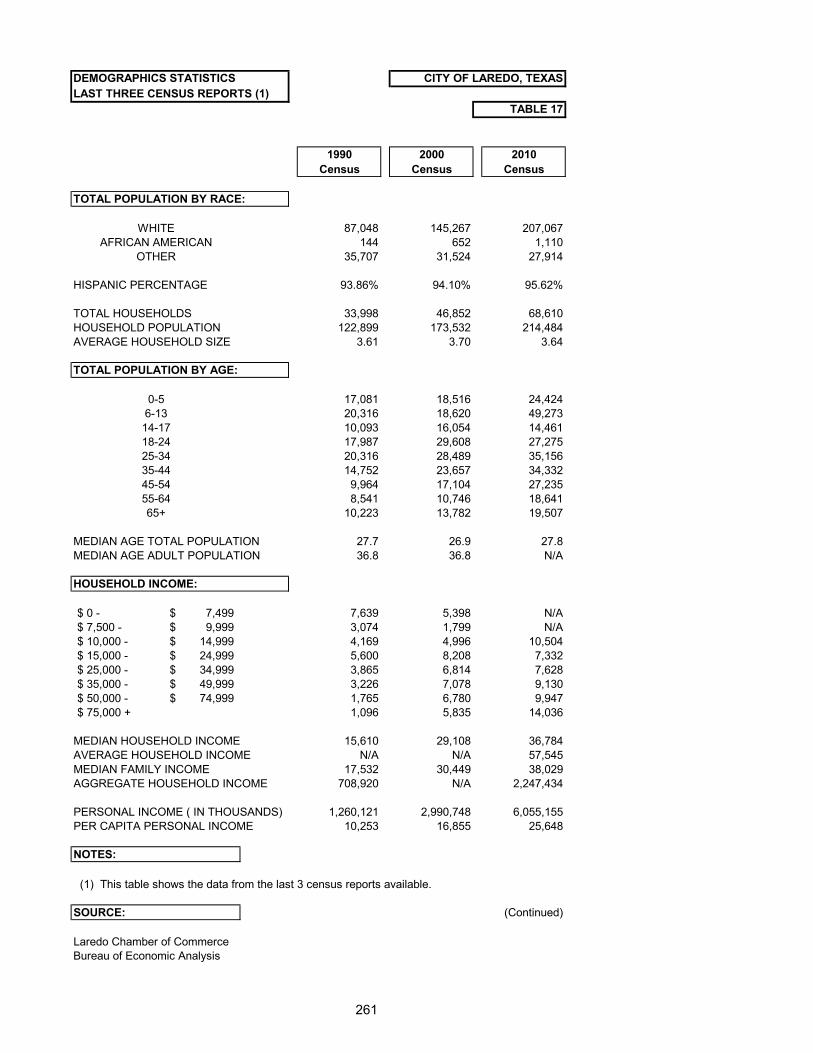
DEMOGRAPHICS STATISTICSLAST THREE CENSUS REPORTS (1)
1990 2000 2010Census Census Census
TOTAL POPULATION BY RACE:
87,048 145,267 207,067144 652 1,110
35,707 31,524 27,914
HISPANIC PERCENTAGE 93.86% 94.10% 95.62%
TOTAL HOUSEHOLDS 33,998 46,852 68,610HOUSEHOLD POPULATION 122,899 173,532 214,484AVERAGE HOUSEHOLD SIZE 3.61 3.70 3.64
TOTAL POPULATION BY AGE:
17,081 18,516 24,42420,316 18,620 49,27310,093 16,054 14,46117,987 29,608 27,27520,316 28,489 35,15614,752 23,657 34,3329,964 17,104 27,2358,541 10,746 18,641
10,223 13,782 19,507
MEDIAN AGE TOTAL POPULATION 27.7 26.9 27.8MEDIAN AGE ADULT POPULATION 36.8 36.8 N/A
HOUSEHOLD INCOME:
$ 0 - 7,499$ 7,639 5,398 N/A$ 7,500 - 9,999$ 3,074 1,799 N/A$ 10,000 - 14,999$ 4,169 4,996 10,504$ 15,000 - 24,999$ 5,600 8,208 7,332$ 25,000 - 34,999$ 3,865 6,814 7,628$ 35,000 - 49,999$ 3,226 7,078 9,130$ 50,000 - 74,999$ 1,765 6,780 9,947$ 75,000 + 1,096 5,835 14,036
MEDIAN HOUSEHOLD INCOME 15,610 29,108 36,784AVERAGE HOUSEHOLD INCOME N/A N/A 57,545MEDIAN FAMILY INCOME 17,532 30,449 38,029AGGREGATE HOUSEHOLD INCOME 708,920 N/A 2,247,434
PERSONAL INCOME ( IN THOUSANDS) 1,260,121 2,990,748 6,055,155PER CAPITA PERSONAL INCOME 10,253 16,855 25,648
NOTES:
(1) This table shows the data from the last 3 census reports available.
SOURCE: (Continued)
Laredo Chamber of CommerceBureau of Economic Analysis
CITY OF LAREDO, TEXAS
TABLE 17
45-5455-6465+
WHITEAFRICAN AMERICAN
OTHER
0-56-1314-1718-2425-3435-44
261
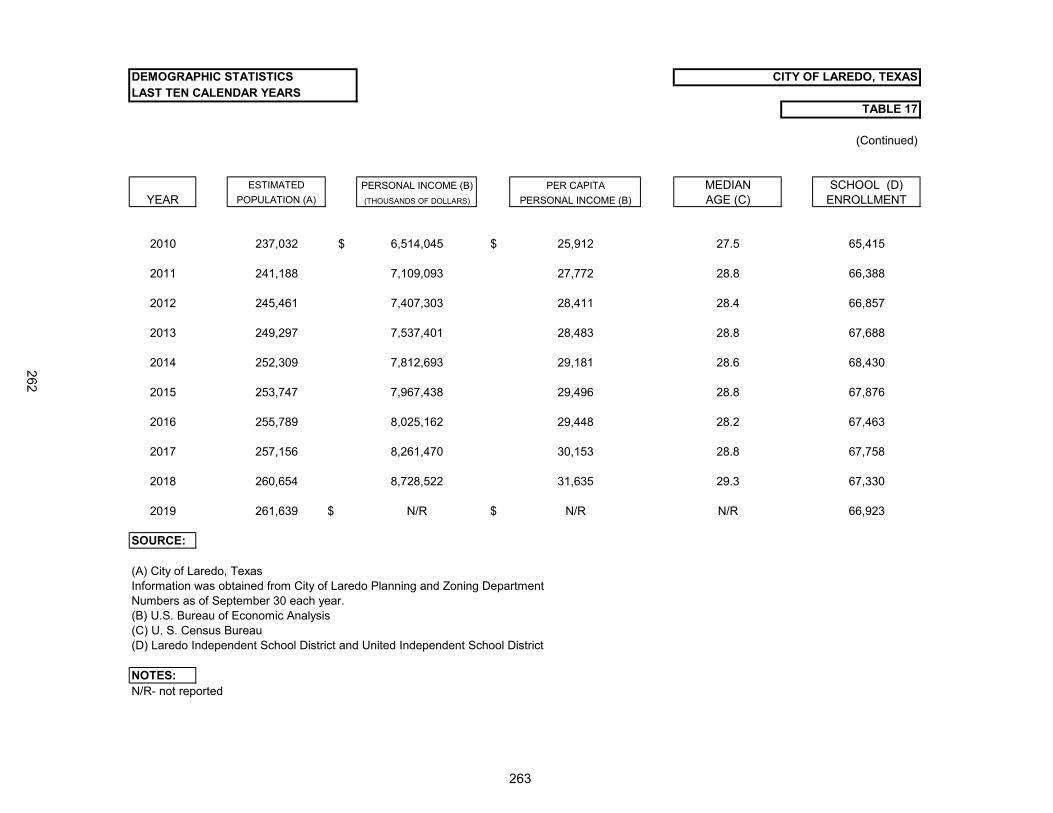
DEMOGRAPHIC STATISTICSLAST TEN CALENDAR YEARS
(Continued)
ESTIMATED PERSONAL INCOME (B) PER CAPITA MEDIAN SCHOOL (D)YEAR POPULATION (A) (THOUSANDS OF DOLLARS) PERSONAL INCOME (B) AGE (C) ENROLLMENT
2010 237,032 $ 6,514,045 $ 25,912 27.5 65,415
2011 241,188 7,109,093 27,772 28.8 66,388
2012 245,461 7,407,303 28,411 28.4 66,857
2013 249,297 7,537,401 28,483 28.8 67,688
2014 252,309 7,812,693 29,181 28.6 68,430
2015 253,747 7,967,438 29,496 28.8 67,876
2016 255,789 8,025,162 29,448 28.2 67,463
2017 257,156 8,261,470 30,153 28.8 67,758
2018 260,654 8,728,522 31,635 29.3 67,330
2019 261,639 $ N/R $ N/R N/R 66,923
SOURCE:
(A) City of Laredo, TexasInformation was obtained from City of Laredo Planning and Zoning DepartmentNumbers as of September 30 each year.(B) U.S. Bureau of Economic Analysis(C) U. S. Census Bureau(D) Laredo Independent School District and United Independent School District
NOTES:N/R- not reported
CITY OF LAREDO, TEXAS
TABLE 17
262
263
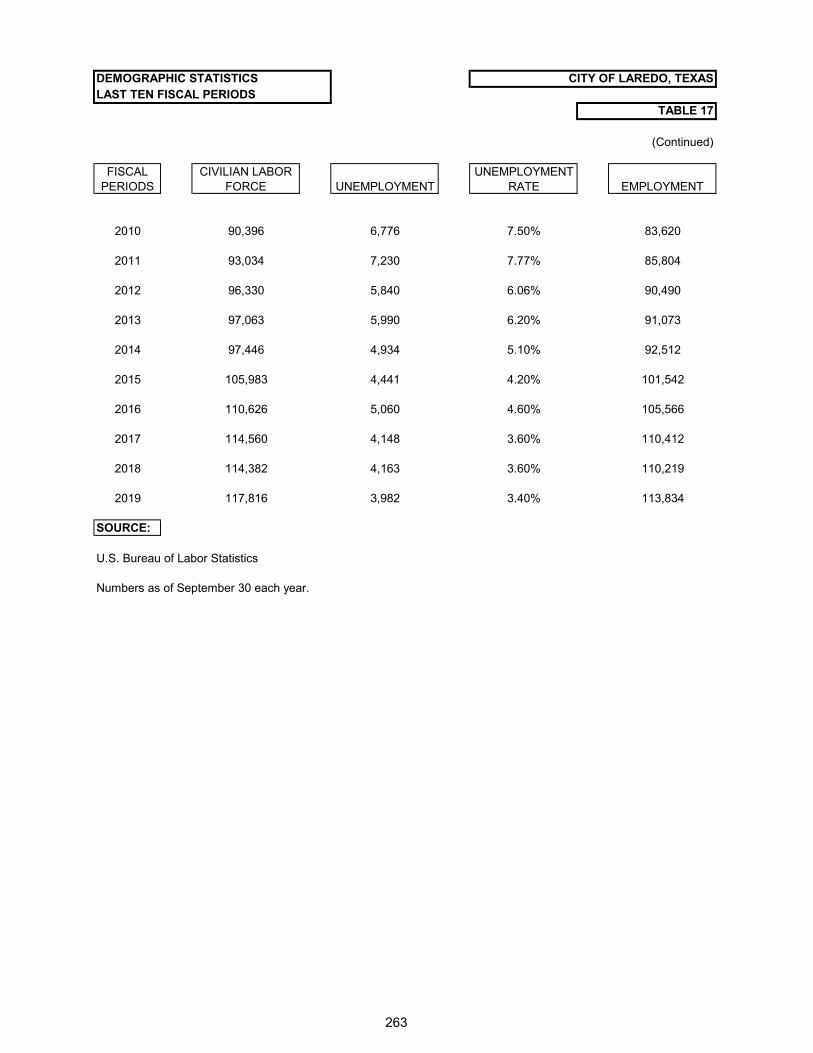
DEMOGRAPHIC STATISTICSLAST TEN FISCAL PERIODS
(Continued)
FISCAL CIVILIAN LABOR UNEMPLOYMENTPERIODS FORCE UNEMPLOYMENT RATE EMPLOYMENT
2010 90,396 6,776 7.50% 83,620
2011 93,034 7,230 7.77% 85,804
2012 96,330 5,840 6.06% 90,490
2013 97,063 5,990 6.20% 91,073
2014 97,446 4,934 5.10% 92,512
2015 105,983 4,441 4.20% 101,542
2016 110,626 5,060 4.60% 105,566
2017 114,560 4,148 3.60% 110,412
2018 114,382 4,163 3.60% 110,219
2019 117,816 3,982 3.40% 113,834
SOURCE:
U.S. Bureau of Labor Statistics
Numbers as of September 30 each year.
CITY OF LAREDO, TEXAS
TABLE 17
263
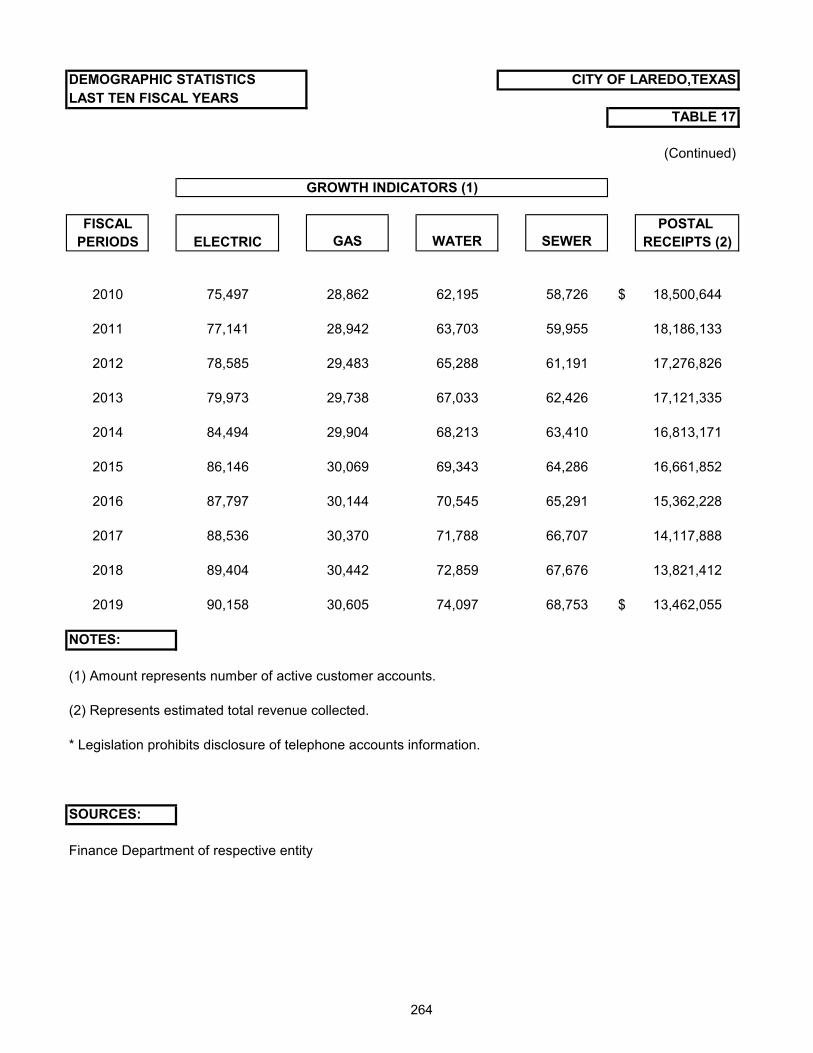
(Continued)
FISCAL POSTAL PERIODS ELECTRIC GAS WATER SEWER RECEIPTS (2)
2010 75,497 28,862 62,195 58,726 $ 18,500,644
2011 77,141 28,942 63,703 59,955 18,186,133
2012 78,585 29,483 65,288 61,191 17,276,826
2013 79,973 29,738 67,033 62,426 17,121,335
2014 84,494 29,904 68,213 63,410 16,813,171
2015 86,146 30,069 69,343 64,286 16,661,852
2016 87,797 30,144 70,545 65,291 15,362,228
2017 88,536 30,370 71,788 66,707 14,117,888
2018 89,404 30,442 72,859 67,676 13,821,412
2019 90,158 30,605 74,097 68,753 $ 13,462,055
NOTES:
(1) Amount represents number of active customer accounts.
(2) Represents estimated total revenue collected.
* Legislation prohibits disclosure of telephone accounts information.
SOURCES:
Finance Department of respective entity
DEMOGRAPHIC STATISTICSLAST TEN FISCAL YEARS
GROWTH INDICATORS (1)
CITY OF LAREDO,TEXAS
TABLE 17
264
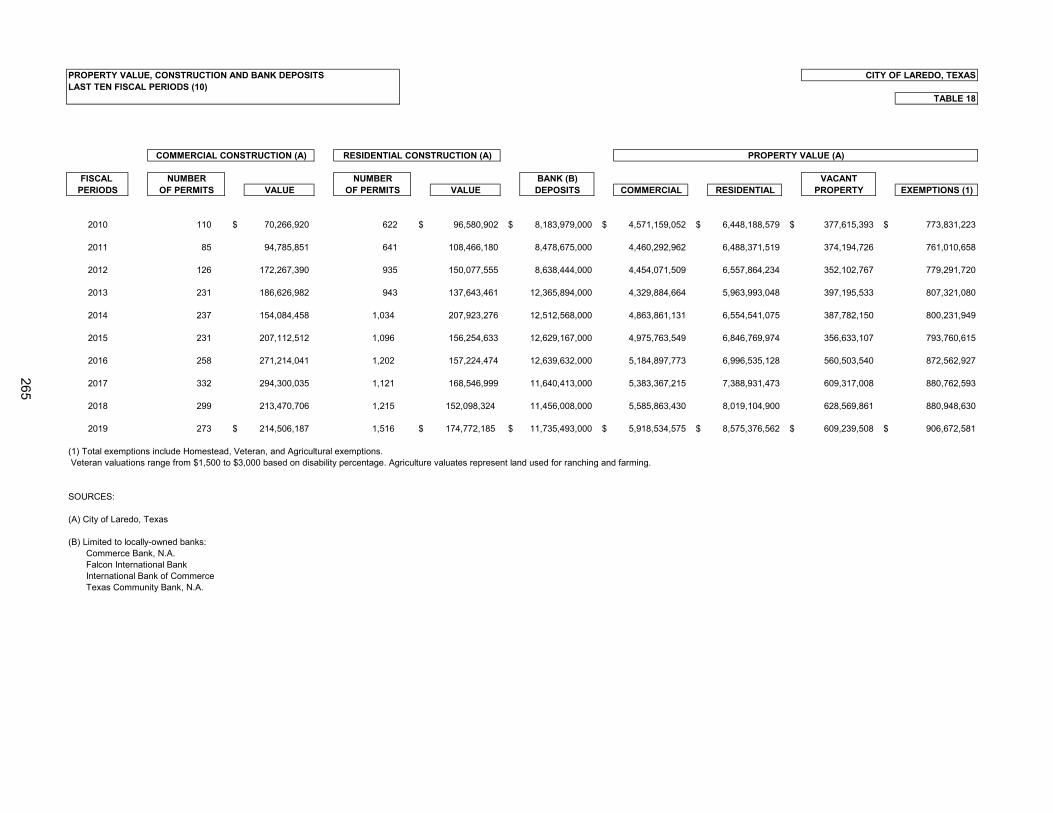
PROPERTY VALUE, CONSTRUCTION AND BANK DEPOSITSLAST TEN FISCAL PERIODS (10)
TABLE 18
FISCAL BANK (B) VACANTPERIODS VALUE VALUE DEPOSITS COMMERCIAL RESIDENTIAL PROPERTY EXEMPTIONS (1)
2010 110 $ 70,266,920 622 $ 96,580,902 $ 8,183,979,000 $ 4,571,159,052 $ 6,448,188,579 $ 377,615,393 $ 773,831,223
2011 85 94,785,851 641 108,466,180 8,478,675,000 4,460,292,962 6,488,371,519 374,194,726 761,010,658
2012 126 172,267,390 935 150,077,555 8,638,444,000 4,454,071,509 6,557,864,234 352,102,767 779,291,720
2013 231 186,626,982 943 137,643,461 12,365,894,000 4,329,884,664 5,963,993,048 397,195,533 807,321,080
2014 237 154,084,458 1,034 207,923,276 12,512,568,000 4,863,861,131 6,554,541,075 387,782,150 800,231,949
2015 231 207,112,512 1,096 156,254,633 12,629,167,000 4,975,763,549 6,846,769,974 356,633,107 793,760,615
2016 258 271,214,041 1,202 157,224,474 12,639,632,000 5,184,897,773 6,996,535,128 560,503,540 872,562,927
2017 332 294,300,035 1,121 168,546,999 11,640,413,000 5,383,367,215 7,388,931,473 609,317,008 880,762,593
2018 299 213,470,706 1,215 152,098,324 11,456,008,000 5,585,863,430 8,019,104,900 628,569,861 880,948,630
2019 273 $ 214,506,187 1,516 $ 174,772,185 $ 11,735,493,000 $ 5,918,534,575 $ 8,575,376,562 $ 609,239,508 $ 906,672,581
(1) Total exemptions include Homestead, Veteran, and Agricultural exemptions. Veteran valuations range from $1,500 to $3,000 based on disability percentage. Agriculture valuates represent land used for ranching and farming.
SOURCES:
(A) City of Laredo, Texas
(B) Limited to locally-owned banks: Commerce Bank, N.A. Falcon International Bank International Bank of Commerce Texas Community Bank, N.A.
COMMERCIAL CONSTRUCTION (A) RESIDENTIAL CONSTRUCTION (A) PROPERTY VALUE (A)
CITY OF LAREDO, TEXAS
NUMBEROF PERMITS
NUMBEROF PERMITS
265
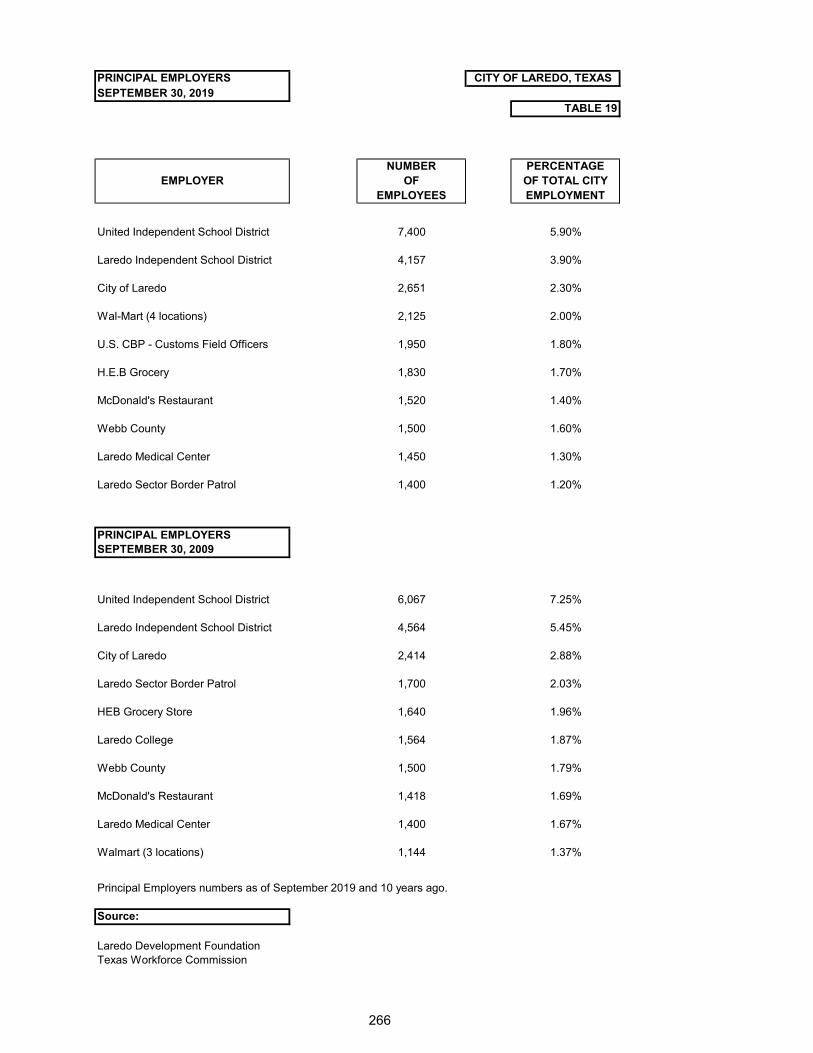
PRINCIPAL EMPLOYERSSEPTEMBER 30, 2019
TABLE 19
NUMBER PERCENTAGEEMPLOYER OF OF TOTAL CITY
EMPLOYEES EMPLOYMENT
United Independent School District 7,400 5.90%
Laredo Independent School District 4,157 3.90%
City of Laredo 2,651 2.30%
Wal-Mart (4 locations) 2,125 2.00%
U.S. CBP - Customs Field Officers 1,950 1.80%
H.E.B Grocery 1,830 1.70%
McDonald's Restaurant 1,520 1.40%
Webb County 1,500 1.60%
Laredo Medical Center 1,450 1.30%
Laredo Sector Border Patrol 1,400 1.20%
PRINCIPAL EMPLOYERSSEPTEMBER 30, 2009
United Independent School District 6,067 7.25%
Laredo Independent School District 4,564 5.45%
City of Laredo 2,414 2.88%
Laredo Sector Border Patrol 1,700 2.03%
HEB Grocery Store 1,640 1.96%
Laredo College 1,564 1.87%
Webb County 1,500 1.79%
McDonald's Restaurant 1,418 1.69%
Laredo Medical Center 1,400 1.67%
Walmart (3 locations) 1,144 1.37%
Principal Employers numbers as of September 2019 and 10 years ago.
Source:
Laredo Development FoundationTexas Workforce Commission
CITY OF LAREDO, TEXAS
266
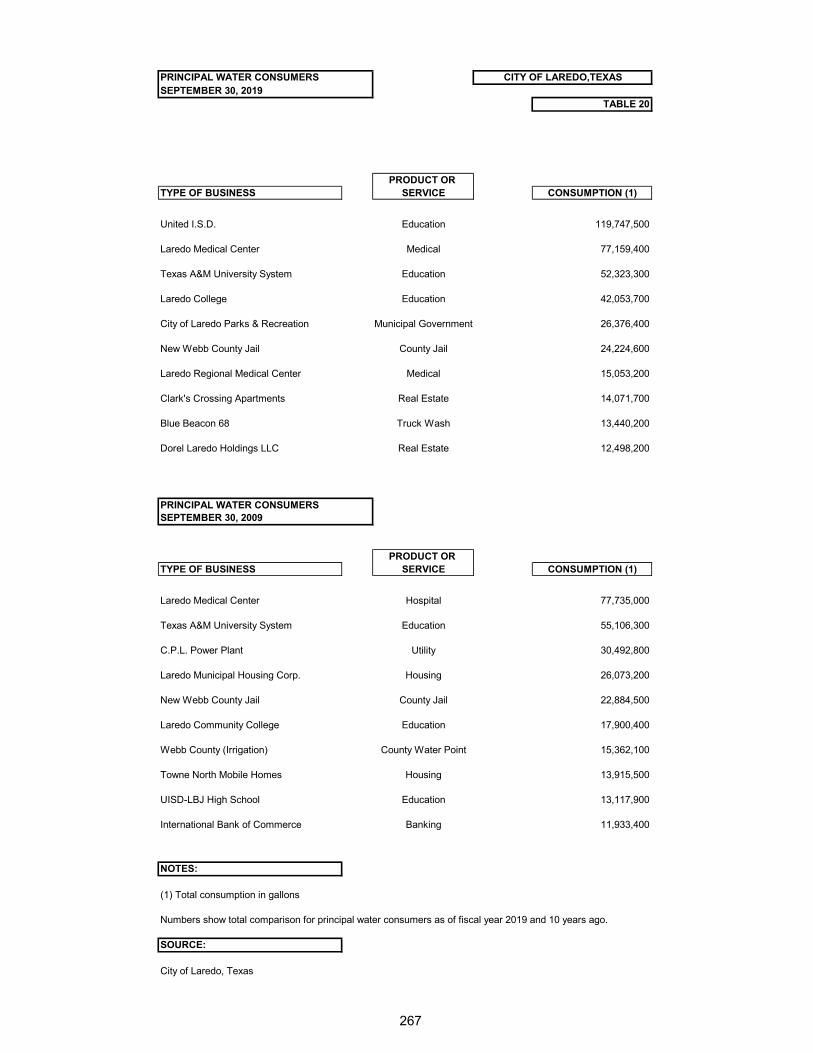
PRINCIPAL WATER CONSUMERSSEPTEMBER 30, 2019
TABLE 20
PRODUCT OR TYPE OF BUSINESS SERVICE CONSUMPTION (1)
United I.S.D. Education 119,747,500
Laredo Medical Center Medical 77,159,400
Texas A&M University System Education 52,323,300
Laredo College Education 42,053,700
City of Laredo Parks & Recreation Municipal Government 26,376,400
New Webb County Jail County Jail 24,224,600
Laredo Regional Medical Center Medical 15,053,200
Clark's Crossing Apartments Real Estate 14,071,700
Blue Beacon 68 Truck Wash 13,440,200
Dorel Laredo Holdings LLC Real Estate 12,498,200
PRINCIPAL WATER CONSUMERSSEPTEMBER 30, 2009
PRODUCT OR TYPE OF BUSINESS SERVICE CONSUMPTION (1)
Laredo Medical Center Hospital 77,735,000
Texas A&M University System Education 55,106,300
C.P.L. Power Plant Utility 30,492,800
Laredo Municipal Housing Corp. Housing 26,073,200
New Webb County Jail County Jail 22,884,500
Laredo Community College Education 17,900,400
Webb County (Irrigation) County Water Point 15,362,100
Towne North Mobile Homes Housing 13,915,500
UISD-LBJ High School Education 13,117,900
International Bank of Commerce Banking 11,933,400
NOTES:
(1) Total consumption in gallons
Numbers show total comparison for principal water consumers as of fiscal year 2019 and 10 years ago.
SOURCE:
City of Laredo, Texas
CITY OF LAREDO,TEXAS
267
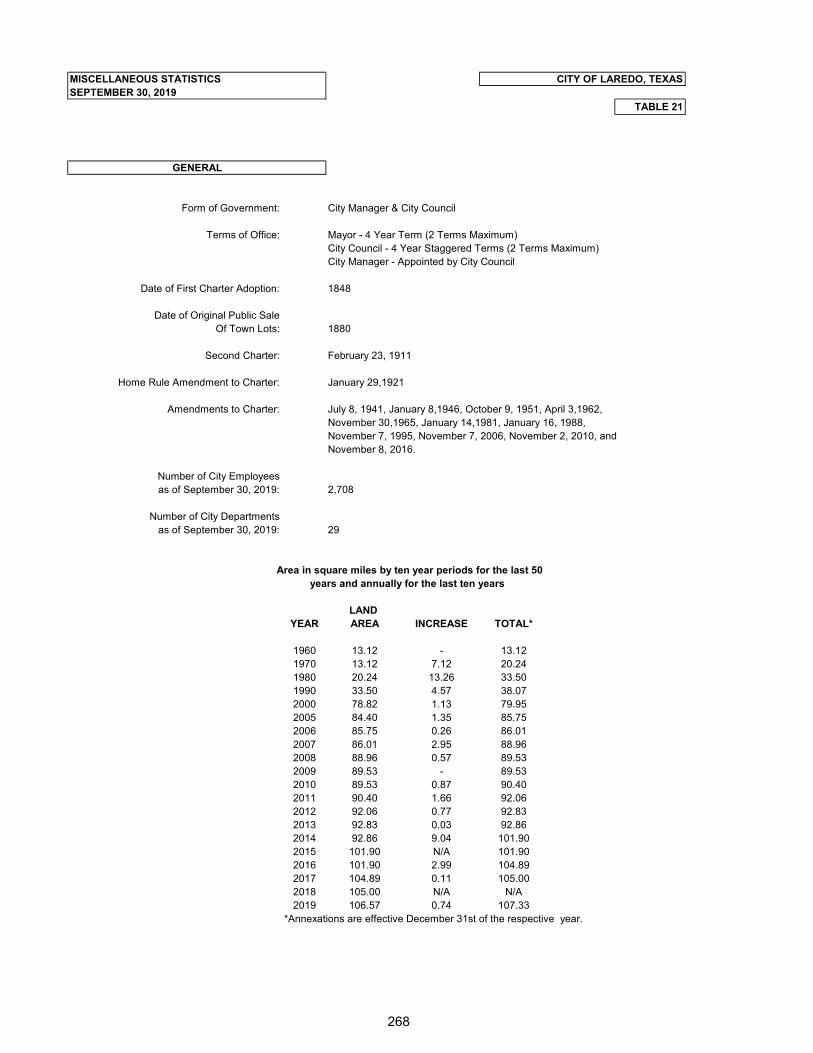
TABLE 21
Form of Government: City Manager & City Council
Terms of Office: Mayor - 4 Year Term (2 Terms Maximum)City Council - 4 Year Staggered Terms (2 Terms Maximum)City Manager - Appointed by City Council
Date of First Charter Adoption: 1848
Date of Original Public SaleOf Town Lots: 1880
Second Charter: February 23, 1911
Home Rule Amendment to Charter: January 29,1921
Amendments to Charter: July 8, 1941, January 8,1946, October 9, 1951, April 3,1962,November 30,1965, January 14,1981, January 16, 1988,November 7, 1995, November 7, 2006, November 2, 2010, andNovember 8, 2016.
Number of City Employeesas of September 30, 2019: 2,708
Number of City Departmentsas of September 30, 2019: 29
Area in square miles by ten year periods for the last 50 years and annually for the last ten years
LAND YEAR AREA INCREASE TOTAL*
1960 13.12 - 13.121970 13.12 7.12 20.241980 20.24 13.26 33.501990 33.50 4.57 38.072000 78.82 1.13 79.952005 84.40 1.35 85.752006 85.75 0.26 86.012007 86.01 2.95 88.962008 88.96 0.57 89.532009 89.53 - 89.532010 89.53 0.87 90.402011 90.40 1.66 92.062012 92.06 0.77 92.832013 92.83 0.03 92.862014 92.86 9.04 101.902015 101.90 N/A 101.902016 101.90 2.99 104.892017 104.89 0.11 105.002018 105.00 N/A N/A2019 106.57 0.74 107.33
*Annexations are effective December 31st of the respective year.
MISCELLANEOUS STATISTICSSEPTEMBER 30, 2019
CITY OF LAREDO, TEXAS
GENERAL
268
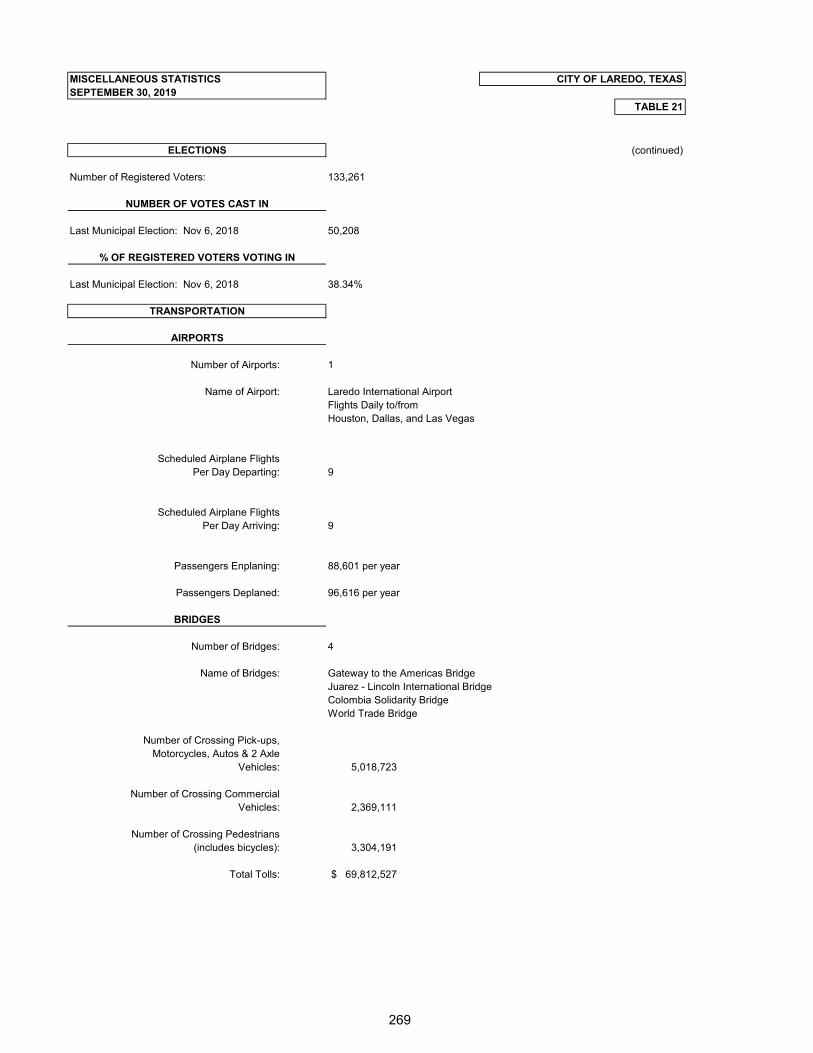
TABLE 21
MISCELLANEOUS STATISTICSSEPTEMBER 30, 2019
CITY OF LAREDO, TEXAS
(continued)
Number of Registered Voters: 133,261
Last Municipal Election: Nov 6, 2018 50,208
Last Municipal Election: Nov 6, 2018 38.34%
Number of Airports: 1
Name of Airport: Laredo International AirportFlights Daily to/fromHouston, Dallas, and Las Vegas
Scheduled Airplane FlightsPer Day Departing: 9
Scheduled Airplane FlightsPer Day Arriving: 9
Passengers Enplaning: 88,601 per year
Passengers Deplaned: 96,616 per year
Number of Bridges: 4
Name of Bridges: Gateway to the Americas BridgeJuarez - Lincoln International BridgeColombia Solidarity BridgeWorld Trade Bridge
Number of Crossing Pick-ups,Motorcycles, Autos & 2 Axle
Vehicles: 5,018,723
Number of Crossing CommercialVehicles: 2,369,111
Number of Crossing Pedestrians(includes bicycles): 3,304,191
Total Tolls: 69,812,527$
ELECTIONS
NUMBER OF VOTES CAST IN
% OF REGISTERED VOTERS VOTING IN
TRANSPORTATION
AIRPORTS
BRIDGES
269
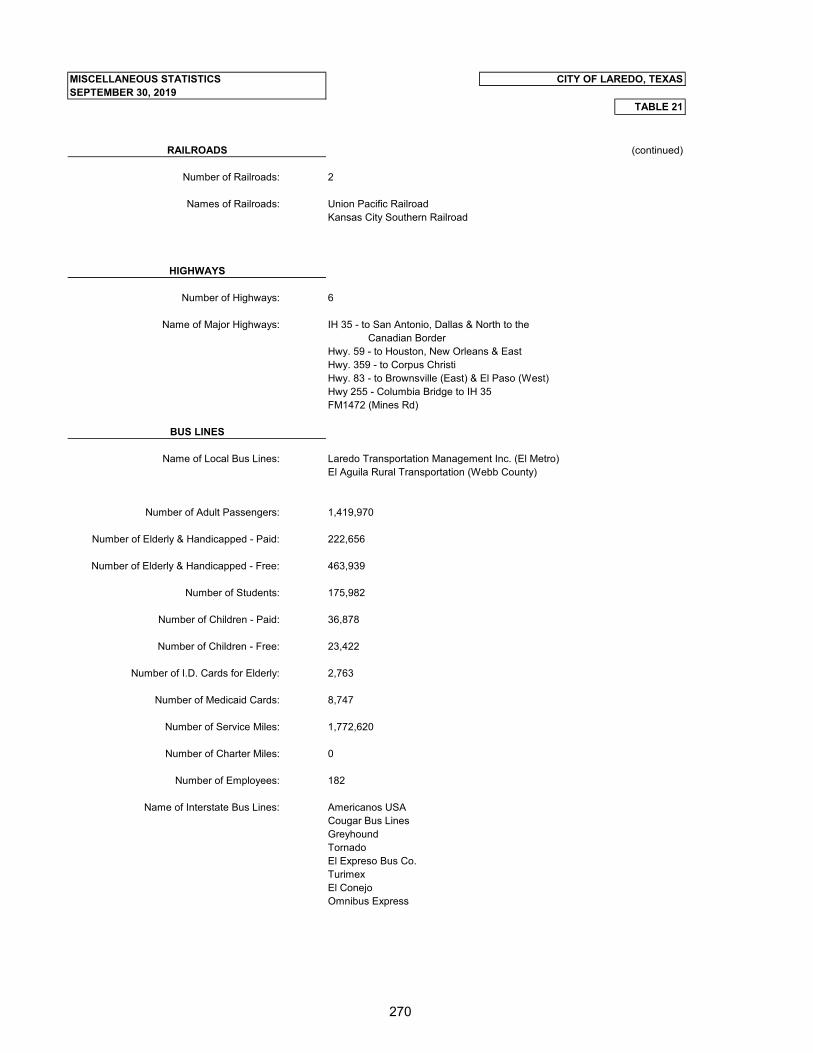
TABLE 21
MISCELLANEOUS STATISTICSSEPTEMBER 30, 2019
CITY OF LAREDO, TEXAS
(continued)
Number of Railroads: 2
Names of Railroads: Union Pacific RailroadKansas City Southern Railroad
Number of Highways: 6
Name of Major Highways: IH 35 - to San Antonio, Dallas & North to the Canadian BorderHwy. 59 - to Houston, New Orleans & EastHwy. 359 - to Corpus ChristiHwy. 83 - to Brownsville (East) & El Paso (West)Hwy 255 - Columbia Bridge to IH 35FM1472 (Mines Rd)
Name of Local Bus Lines: Laredo Transportation Management Inc. (El Metro)El Aguila Rural Transportation (Webb County)
Number of Adult Passengers: 1,419,970
Number of Elderly & Handicapped - Paid: 222,656
Number of Elderly & Handicapped - Free: 463,939
Number of Students: 175,982
Number of Children - Paid: 36,878
Number of Children - Free: 23,422
Number of I.D. Cards for Elderly: 2,763
Number of Medicaid Cards: 8,747
Number of Service Miles: 1,772,620
Number of Charter Miles: 0
Number of Employees: 182
Name of Interstate Bus Lines: Americanos USACougar Bus LinesGreyhoundTornadoEl Expreso Bus Co.TurimexEl ConejoOmnibus Express
RAILROADS
HIGHWAYS
BUS LINES
270
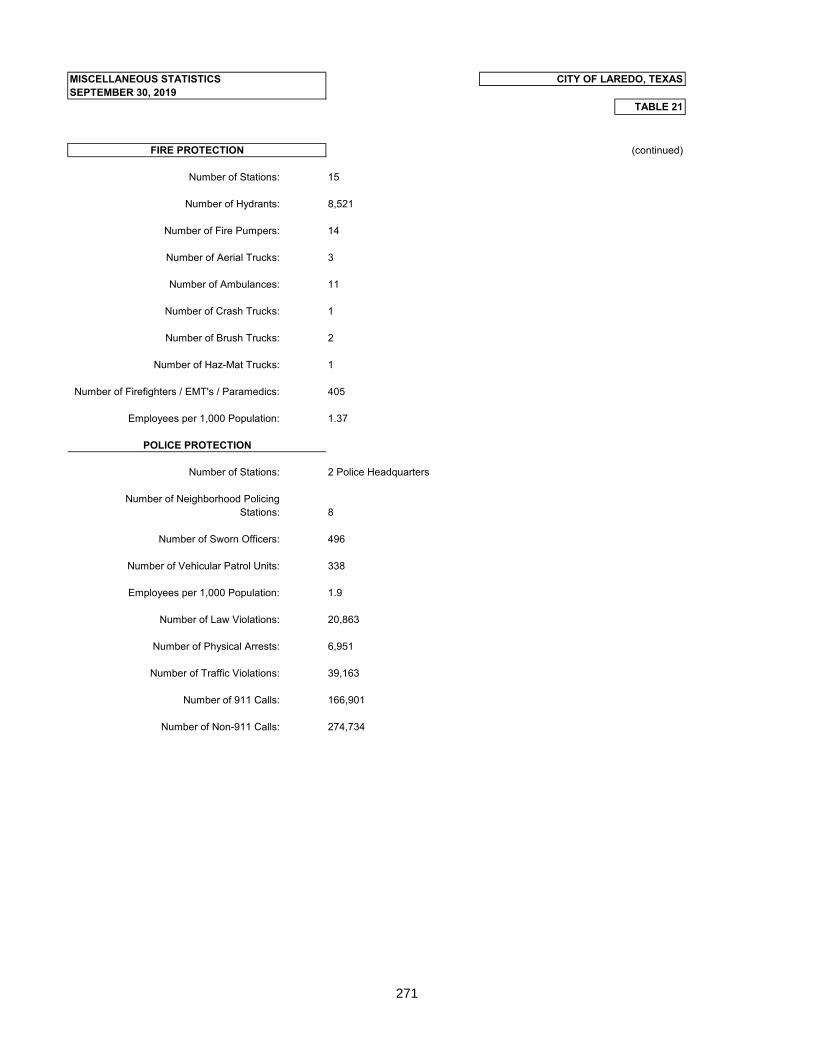
TABLE 21
MISCELLANEOUS STATISTICSSEPTEMBER 30, 2019
CITY OF LAREDO, TEXAS
(continued)
Number of Stations: 15
Number of Hydrants: 8,521
Number of Fire Pumpers: 14
Number of Aerial Trucks: 3
Number of Ambulances: 11
Number of Crash Trucks: 1
Number of Brush Trucks: 2
Number of Haz-Mat Trucks: 1
Number of Firefighters / EMT's / Paramedics: 405
Employees per 1,000 Population: 1.37
Number of Stations: 2 Police Headquarters
Number of Neighborhood PolicingStations: 8
Number of Sworn Officers: 496
Number of Vehicular Patrol Units: 338
Employees per 1,000 Population: 1.9
Number of Law Violations: 20,863
Number of Physical Arrests: 6,951
Number of Traffic Violations: 39,163
Number of 911 Calls: 166,901
Number of Non-911 Calls: 274,734
FIRE PROTECTION
POLICE PROTECTION
271
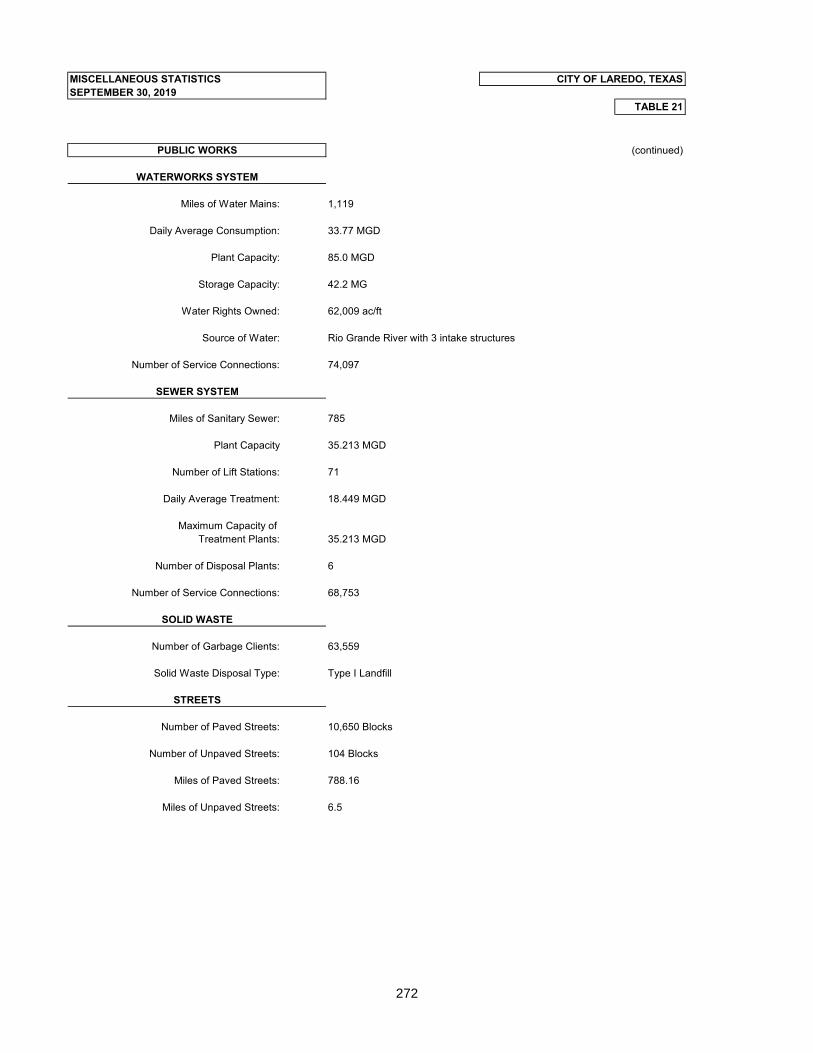
TABLE 21
MISCELLANEOUS STATISTICSSEPTEMBER 30, 2019
CITY OF LAREDO, TEXAS
(continued)
Miles of Water Mains: 1,119
Daily Average Consumption: 33.77 MGD
Plant Capacity: 85.0 MGD
Storage Capacity: 42.2 MG
Water Rights Owned: 62,009 ac/ft
Source of Water: Rio Grande River with 3 intake structures
Number of Service Connections: 74,097
Miles of Sanitary Sewer: 785
Plant Capacity 35.213 MGD
Number of Lift Stations: 71
Daily Average Treatment: 18.449 MGD
Maximum Capacity of Treatment Plants: 35.213 MGD
Number of Disposal Plants: 6
Number of Service Connections: 68,753
Number of Garbage Clients: 63,559
Solid Waste Disposal Type: Type I Landfill
Number of Paved Streets: 10,650 Blocks
Number of Unpaved Streets: 104 Blocks
Miles of Paved Streets: 788.16
Miles of Unpaved Streets: 6.5
WATERWORKS SYSTEM
PUBLIC WORKS
SEWER SYSTEM
SOLID WASTE
STREETS
272
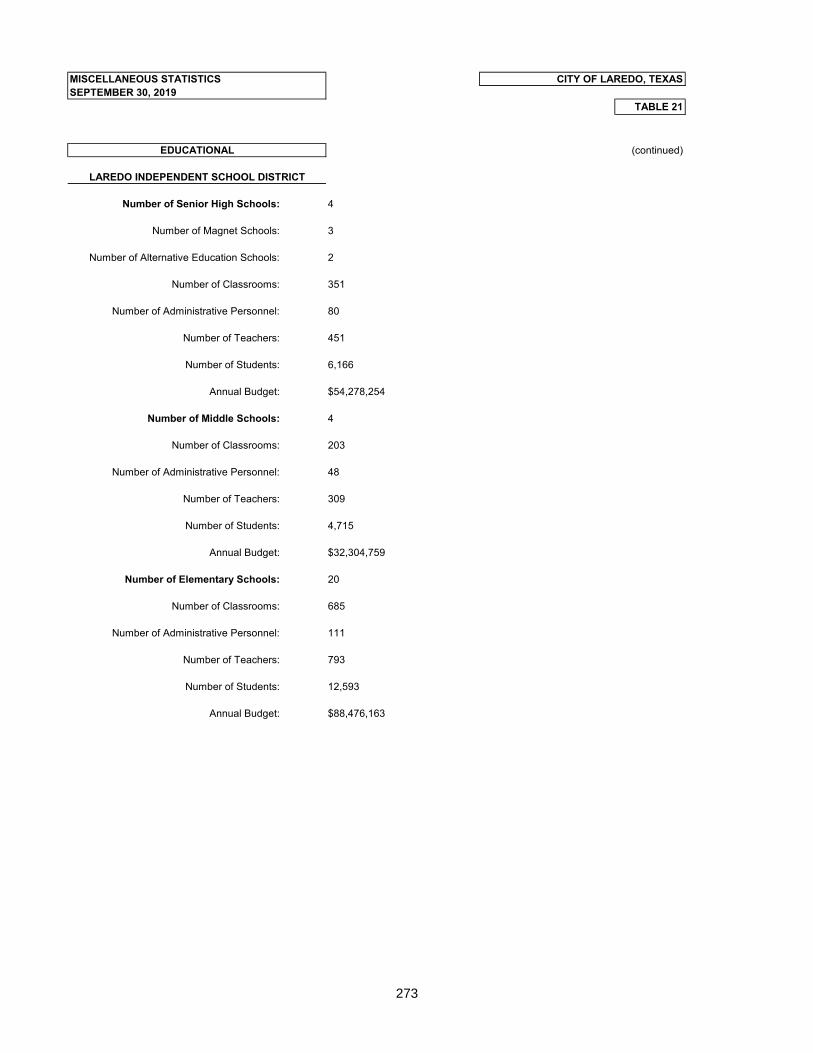
TABLE 21
MISCELLANEOUS STATISTICSSEPTEMBER 30, 2019
CITY OF LAREDO, TEXAS
(continued)
Number of Senior High Schools: 4
Number of Magnet Schools: 3
Number of Alternative Education Schools: 2
Number of Classrooms: 351
Number of Administrative Personnel: 80
Number of Teachers: 451
Number of Students: 6,166
Annual Budget: $54,278,254
Number of Middle Schools: 4
Number of Classrooms: 203
Number of Administrative Personnel: 48
Number of Teachers: 309
Number of Students: 4,715
Annual Budget: $32,304,759
Number of Elementary Schools: 20
Number of Classrooms: 685
Number of Administrative Personnel: 111
Number of Teachers: 793
Number of Students: 12,593
Annual Budget: $88,476,163
LAREDO INDEPENDENT SCHOOL DISTRICT
EDUCATIONAL
273
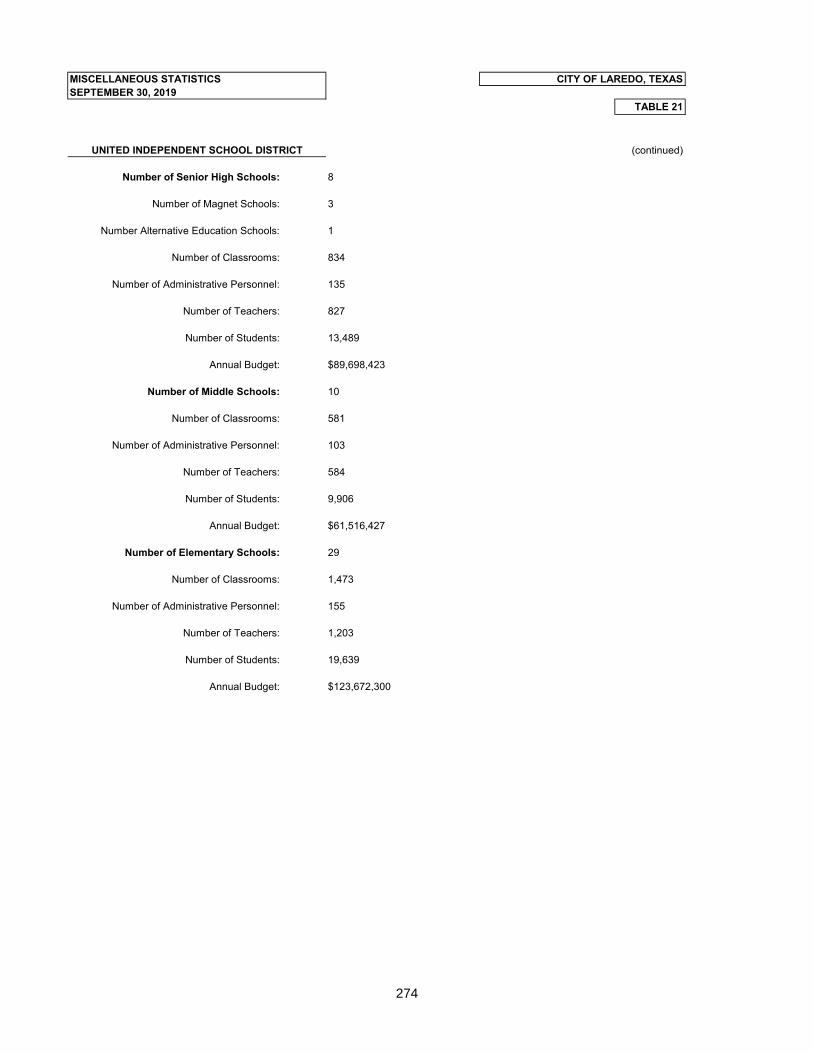
TABLE 21
MISCELLANEOUS STATISTICSSEPTEMBER 30, 2019
CITY OF LAREDO, TEXAS
(continued)
Number of Senior High Schools: 8
Number of Magnet Schools: 3
Number Alternative Education Schools: 1
Number of Classrooms: 834
Number of Administrative Personnel: 135
Number of Teachers: 827
Number of Students: 13,489
Annual Budget: $89,698,423
Number of Middle Schools: 10
Number of Classrooms: 581
Number of Administrative Personnel: 103
Number of Teachers: 584
Number of Students: 9,906
Annual Budget: $61,516,427
Number of Elementary Schools: 29
Number of Classrooms: 1,473
Number of Administrative Personnel: 155
Number of Teachers: 1,203
Number of Students: 19,639
Annual Budget: $123,672,300
UNITED INDEPENDENT SCHOOL DISTRICT
274
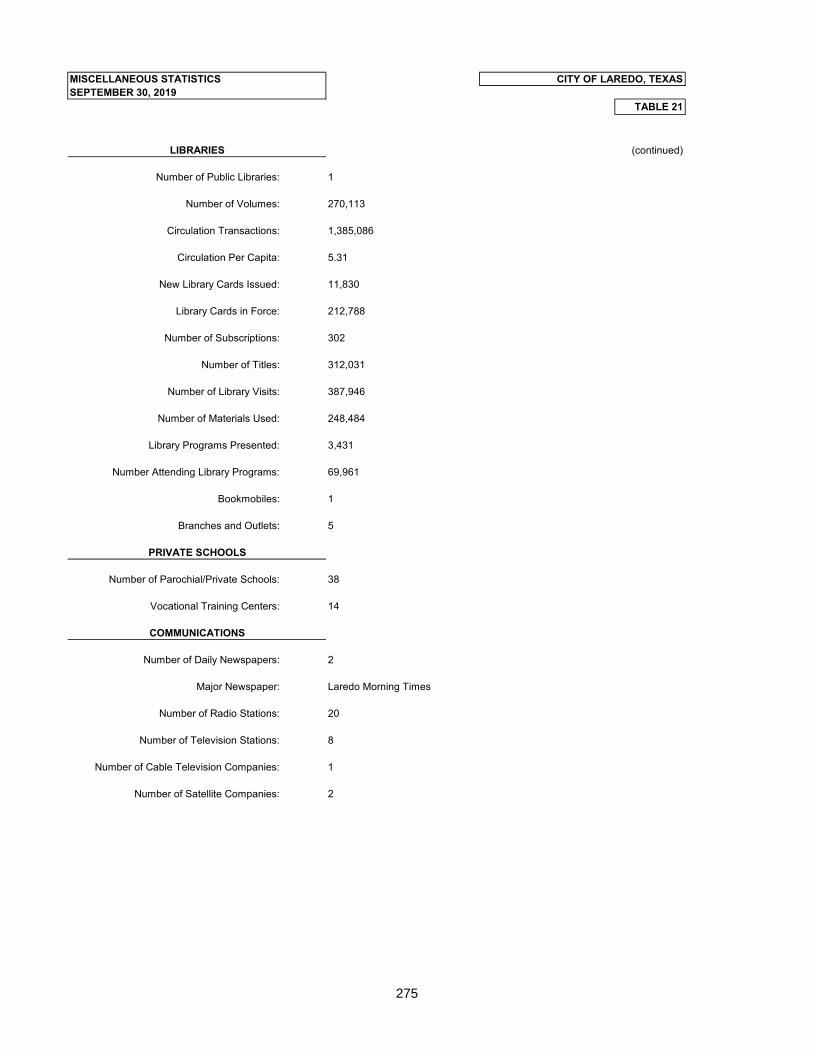
TABLE 21
MISCELLANEOUS STATISTICSSEPTEMBER 30, 2019
CITY OF LAREDO, TEXAS
(continued)
Number of Public Libraries: 1
Number of Volumes: 270,113
Circulation Transactions: 1,385,086
Circulation Per Capita: 5.31
New Library Cards Issued: 11,830
Library Cards in Force: 212,788
Number of Subscriptions: 302
Number of Titles: 312,031
Number of Library Visits: 387,946
Number of Materials Used: 248,484
Library Programs Presented: 3,431
Number Attending Library Programs: 69,961
Bookmobiles: 1
Branches and Outlets: 5
Number of Parochial/Private Schools: 38
Vocational Training Centers: 14
Number of Daily Newspapers: 2
Major Newspaper: Laredo Morning Times
Number of Radio Stations: 20
Number of Television Stations: 8
Number of Cable Television Companies: 1
Number of Satellite Companies: 2
LIBRARIES
PRIVATE SCHOOLS
COMMUNICATIONS
275
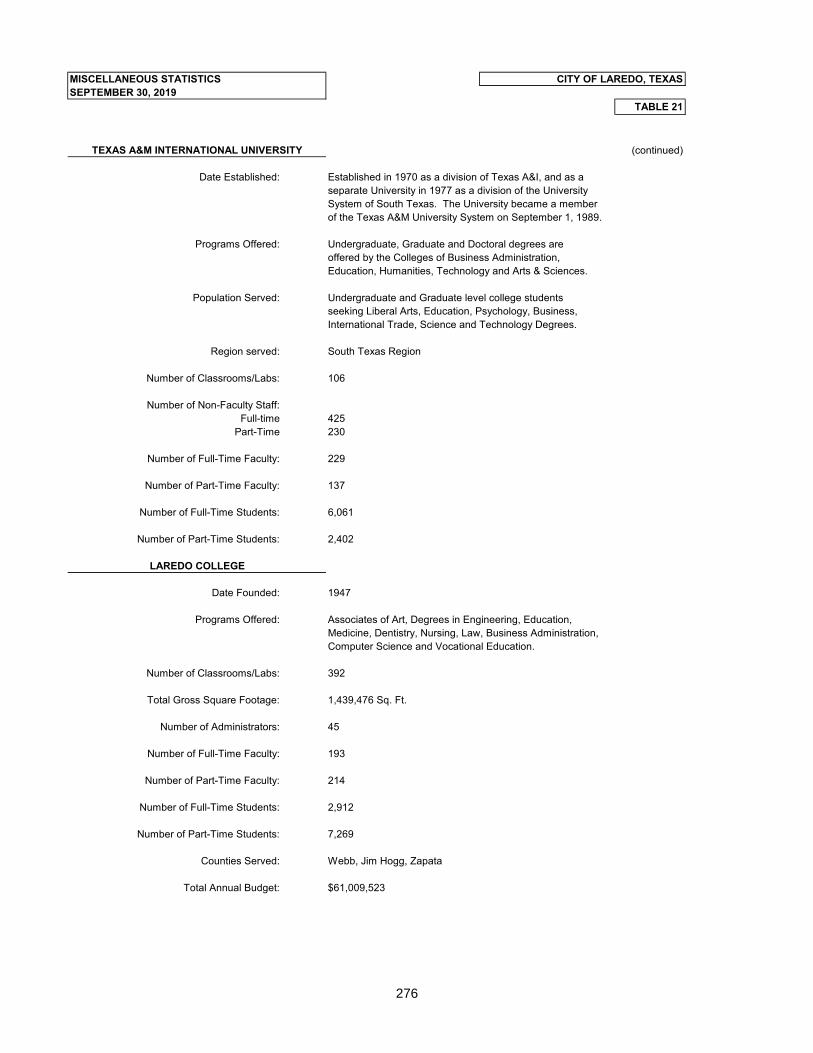
TABLE 21
MISCELLANEOUS STATISTICSSEPTEMBER 30, 2019
CITY OF LAREDO, TEXAS
(continued)
Date Established: Established in 1970 as a division of Texas A&I, and as aseparate University in 1977 as a division of the UniversitySystem of South Texas. The University became a memberof the Texas A&M University System on September 1, 1989.
Programs Offered: Undergraduate, Graduate and Doctoral degrees areoffered by the Colleges of Business Administration,Education, Humanities, Technology and Arts & Sciences.
Population Served: Undergraduate and Graduate level college studentsseeking Liberal Arts, Education, Psychology, Business,International Trade, Science and Technology Degrees.
Region served: South Texas Region
Number of Classrooms/Labs: 106
Number of Non-Faculty Staff:Full-time 425
Part-Time 230
Number of Full-Time Faculty: 229
Number of Part-Time Faculty: 137
Number of Full-Time Students: 6,061
Number of Part-Time Students: 2,402
Date Founded: 1947
Programs Offered: Associates of Art, Degrees in Engineering, Education, Medicine, Dentistry, Nursing, Law, Business Administration,Computer Science and Vocational Education.
Number of Classrooms/Labs: 392
Total Gross Square Footage: 1,439,476 Sq. Ft.
Number of Administrators: 45
Number of Full-Time Faculty: 193
Number of Part-Time Faculty: 214
Number of Full-Time Students: 2,912
Number of Part-Time Students: 7,269
Counties Served: Webb, Jim Hogg, Zapata
Total Annual Budget: $61,009,523
TEXAS A&M INTERNATIONAL UNIVERSITY
LAREDO COLLEGE
276
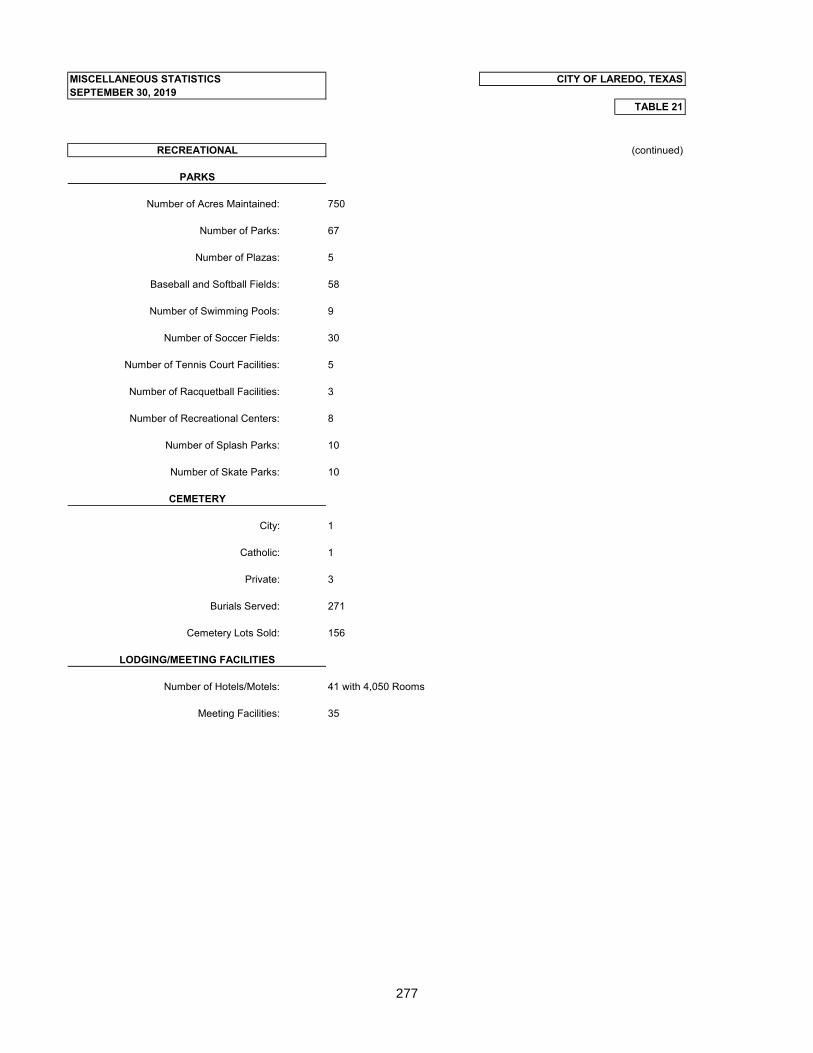
TABLE 21
MISCELLANEOUS STATISTICSSEPTEMBER 30, 2019
CITY OF LAREDO, TEXAS
(continued)
Number of Acres Maintained: 750
Number of Parks: 67
Number of Plazas: 5
Baseball and Softball Fields: 58
Number of Swimming Pools: 9
Number of Soccer Fields: 30
Number of Tennis Court Facilities: 5
Number of Racquetball Facilities: 3
Number of Recreational Centers: 8
Number of Splash Parks: 10
Number of Skate Parks: 10
City: 1
Catholic: 1
Private: 3
Burials Served: 271
Cemetery Lots Sold: 156
Number of Hotels/Motels: 41 with 4,050 Rooms
Meeting Facilities: 35
PARKS
RECREATIONAL
CEMETERY
LODGING/MEETING FACILITIES
277
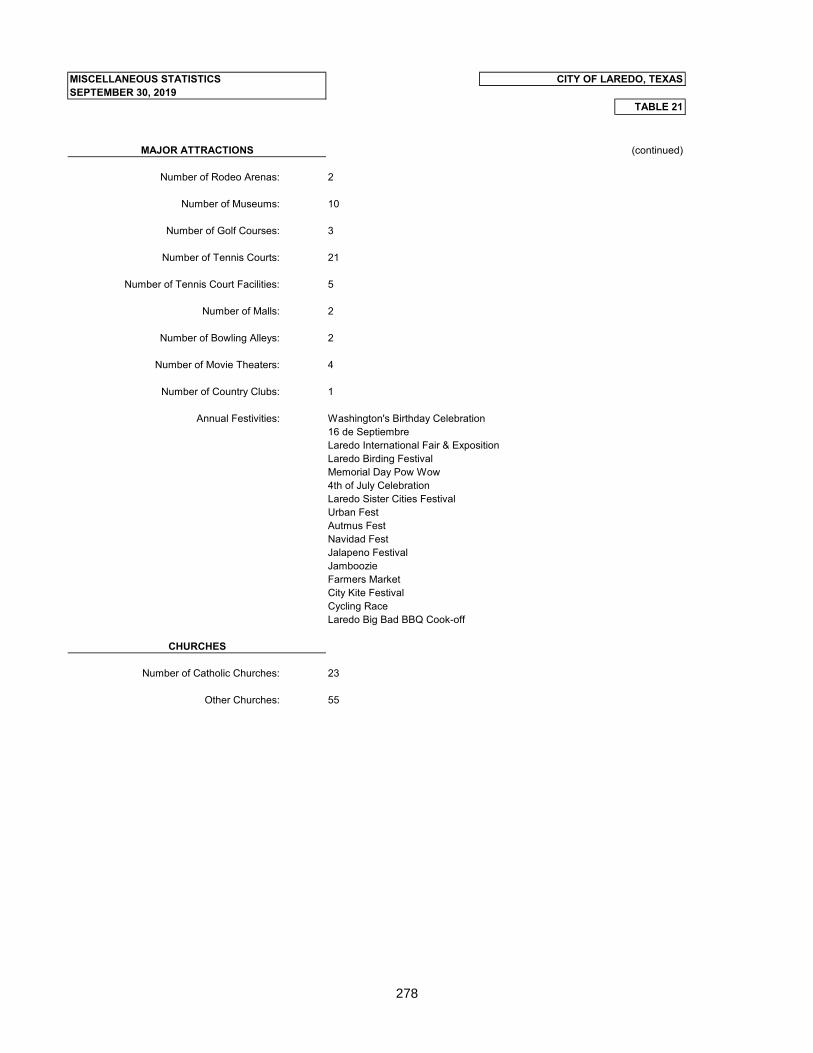
TABLE 21
MISCELLANEOUS STATISTICSSEPTEMBER 30, 2019
CITY OF LAREDO, TEXAS
(continued)
Number of Rodeo Arenas: 2
Number of Museums: 10
Number of Golf Courses: 3
Number of Tennis Courts: 21
Number of Tennis Court Facilities: 5
Number of Malls: 2
Number of Bowling Alleys: 2
Number of Movie Theaters: 4
Number of Country Clubs: 1
Annual Festivities: Washington's Birthday Celebration16 de SeptiembreLaredo International Fair & ExpositionLaredo Birding FestivalMemorial Day Pow Wow4th of July CelebrationLaredo Sister Cities FestivalUrban FestAutmus FestNavidad FestJalapeno FestivalJamboozieFarmers MarketCity Kite FestivalCycling RaceLaredo Big Bad BBQ Cook-off
Number of Catholic Churches: 23
Other Churches: 55
MAJOR ATTRACTIONS
CHURCHES
278
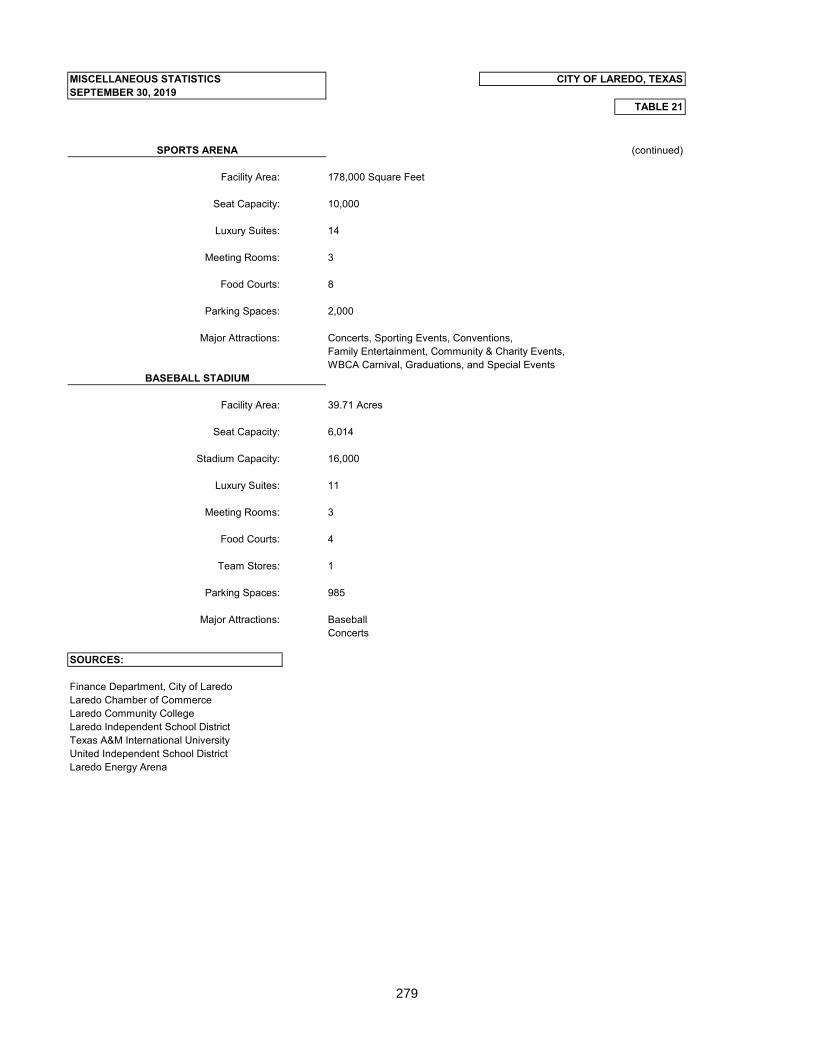
TABLE 21
MISCELLANEOUS STATISTICSSEPTEMBER 30, 2019
CITY OF LAREDO, TEXAS
(continued)
Facility Area: 178,000 Square Feet
Seat Capacity: 10,000
Luxury Suites: 14
Meeting Rooms: 3
Food Courts: 8
Parking Spaces: 2,000
Major Attractions: Concerts, Sporting Events, Conventions,Family Entertainment, Community & Charity Events,WBCA Carnival, Graduations, and Special Events
Facility Area: 39.71 Acres
Seat Capacity: 6,014
Stadium Capacity: 16,000
Luxury Suites: 11
Meeting Rooms: 3
Food Courts: 4
Team Stores: 1
Parking Spaces: 985
Major Attractions: BaseballConcerts
SOURCES:
Finance Department, City of LaredoLaredo Chamber of CommerceLaredo Community CollegeLaredo Independent School DistrictTexas A&M International UniversityUnited Independent School DistrictLaredo Energy Arena
BASEBALL STADIUM
SPORTS ARENA
279
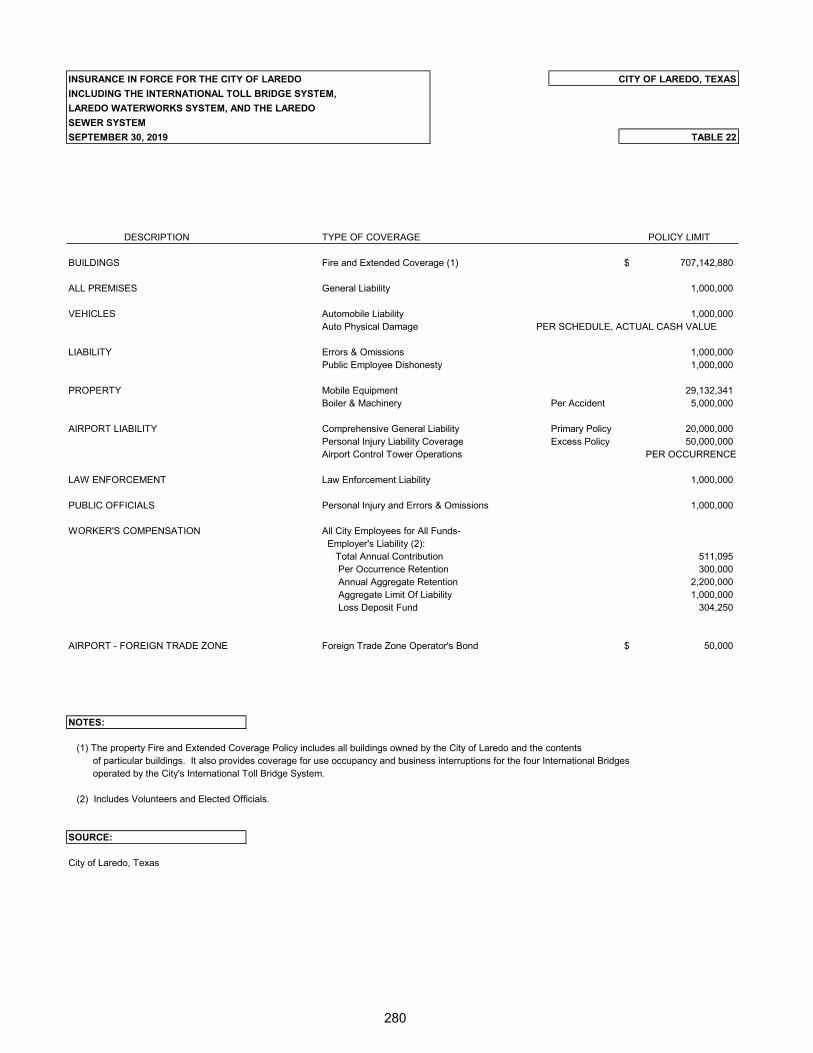
INSURANCE IN FORCE FOR THE CITY OF LAREDO
TABLE 22
DESCRIPTION TYPE OF COVERAGE POLICY LIMIT
BUILDINGS Fire and Extended Coverage (1) 707,142,880$
ALL PREMISES General Liability 1,000,000
VEHICLES Automobile Liability 1,000,000 Auto Physical Damage PER SCHEDULE, ACTUAL CASH VALUE
LIABILITY Errors & Omissions 1,000,000 Public Employee Dishonesty 1,000,000
PROPERTY Mobile Equipment 29,132,341 Boiler & Machinery Per Accident 5,000,000
AIRPORT LIABILITY Comprehensive General Liability Primary Policy 20,000,000 Personal Injury Liability Coverage Excess Policy 50,000,000 Airport Control Tower Operations PER OCCURRENCE
LAW ENFORCEMENT Law Enforcement Liability 1,000,000
PUBLIC OFFICIALS Personal Injury and Errors & Omissions 1,000,000
WORKER'S COMPENSATION All City Employees for All Funds- Employer's Liability (2):
Total Annual Contribution 511,095 Per Occurrence Retention 300,000 Annual Aggregate Retention 2,200,000 Aggregate Limit Of Liability 1,000,000 Loss Deposit Fund 304,250
AIRPORT - FOREIGN TRADE ZONE Foreign Trade Zone Operator's Bond 50,000$
NOTES:
(1) The property Fire and Extended Coverage Policy includes all buildings owned by the City of Laredo and the contents of particular buildings. It also provides coverage for use occupancy and business interruptions for the four International Bridges operated by the City's International Toll Bridge System.
(2) Includes Volunteers and Elected Officials.
SOURCE:
City of Laredo, Texas
INCLUDING THE INTERNATIONAL TOLL BRIDGE SYSTEM,LAREDO WATERWORKS SYSTEM, AND THE LAREDOSEWER SYSTEMSEPTEMBER 30, 2019
CITY OF LAREDO, TEXAS
280
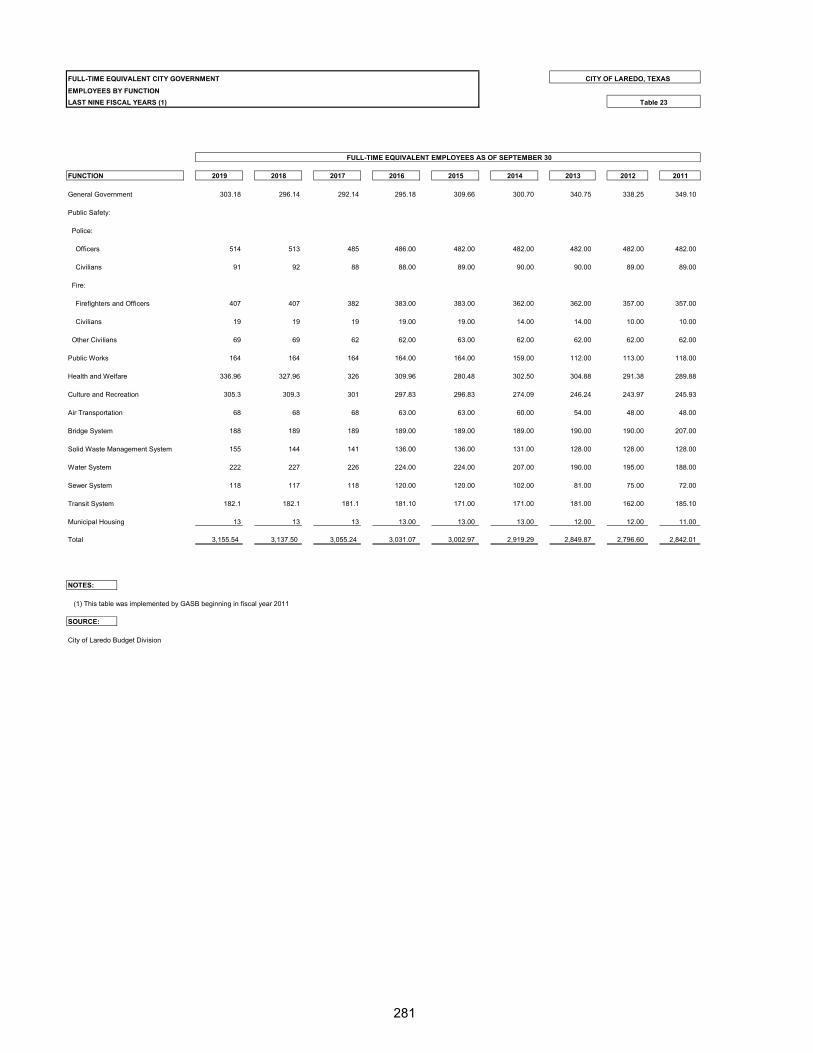
FULL-TIME EQUIVALENT CITY GOVERNMENT CITY OF LAREDO, TEXASEMPLOYEES BY FUNCTIONLAST NINE FISCAL YEARS (1)
2019 2018 2017 2016 2015 2014 2013 2012 2011
General Government 303.18 296.14 292.14 295.18 309.66 300.70 340.75 338.25 349.10
Public Safety:
Police:
Officers 514 513 485 486.00 482.00 482.00 482.00 482.00 482.00
Civilians 91 92 88 88.00 89.00 90.00 90.00 89.00 89.00
Fire:
Firefighters and Officers 407 407 382 383.00 383.00 362.00 362.00 357.00 357.00
Civilians 19 19 19 19.00 19.00 14.00 14.00 10.00 10.00
Other Civilians 69 69 62 62.00 63.00 62.00 62.00 62.00 62.00
Public Works 164 164 164 164.00 164.00 159.00 112.00 113.00 118.00
Health and Welfare 336.96 327.96 326 309.96 280.48 302.50 304.88 291.38 289.88
Culture and Recreation 305.3 309.3 301 297.83 296.83 274.09 246.24 243.97 245.93
Air Transportation 68 68 68 63.00 63.00 60.00 54.00 48.00 48.00
Bridge System 188 189 189 189.00 189.00 189.00 190.00 190.00 207.00
Solid Waste Management System 155 144 141 136.00 136.00 131.00 128.00 128.00 128.00
Water System 222 227 226 224.00 224.00 207.00 190.00 195.00 188.00
Sewer System 118 117 118 120.00 120.00 102.00 81.00 75.00 72.00
Transit System 182.1 182.1 181.1 181.10 171.00 171.00 181.00 162.00 185.10
Municipal Housing 13 13 13 13.00 13.00 13.00 12.00 12.00 11.00
Total 3,155.54 3,137.50 3,055.24 3,031.07 3,002.97 2,919.29 2,849.87 2,796.60 2,842.01
NOTES:
(1) This table was implemented by GASB beginning in fiscal year 2011
SOURCE:
City of Laredo Budget Division
FUNCTION
FULL-TIME EQUIVALENT EMPLOYEES AS OF SEPTEMBER 30
Table 23
281
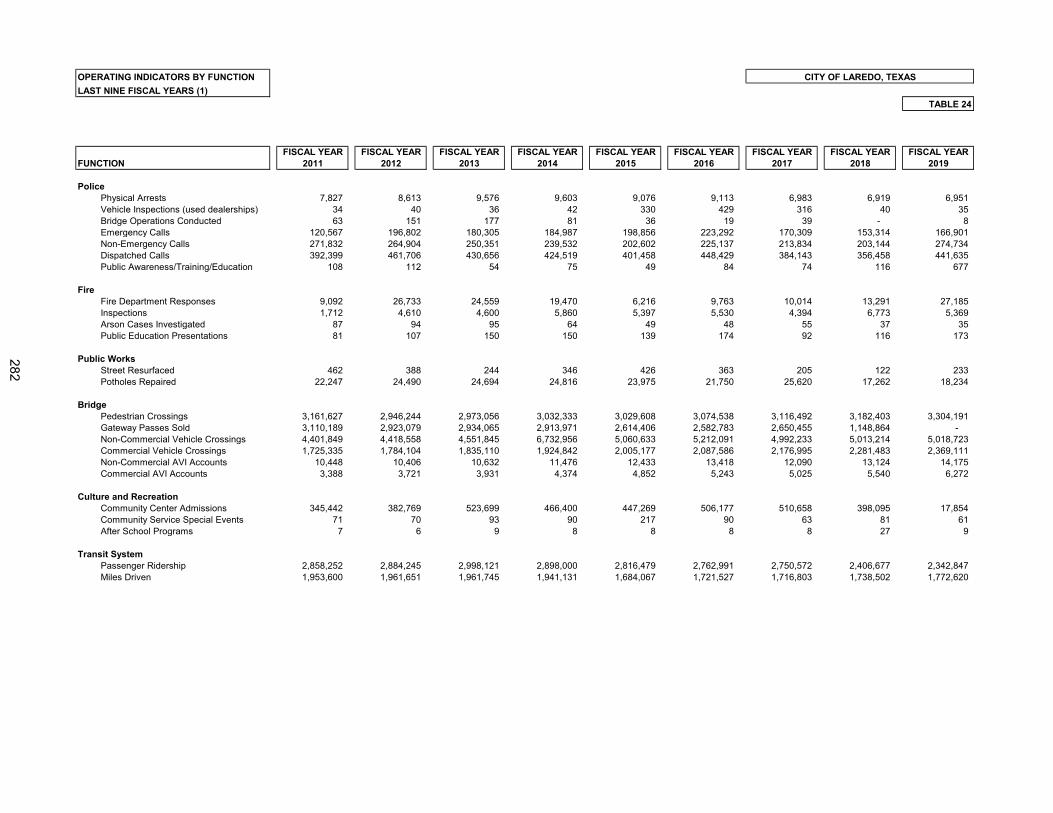
OPERATING INDICATORS BY FUNCTIONLAST NINE FISCAL YEARS (1)
TABLE 24
FISCAL YEAR FISCAL YEAR FISCAL YEAR FISCAL YEAR FISCAL YEAR FISCAL YEAR FISCAL YEAR FISCAL YEAR FISCAL YEARFUNCTION 2011 2012 2013 2014 2015 2016 2017 2018 2019
Police Physical Arrests 7,827 8,613 9,576 9,603 9,076 9,113 6,983 6,919 6,951 Vehicle Inspections (used dealerships) 34 40 36 42 330 429 316 40 35 Bridge Operations Conducted 63 151 177 81 36 19 39 - 8 Emergency Calls 120,567 196,802 180,305 184,987 198,856 223,292 170,309 153,314 166,901 Non-Emergency Calls 271,832 264,904 250,351 239,532 202,602 225,137 213,834 203,144 274,734 Dispatched Calls 392,399 461,706 430,656 424,519 401,458 448,429 384,143 356,458 441,635 Public Awareness/Training/Education 108 112 54 75 49 84 74 116 677
Fire Fire Department Responses 9,092 26,733 24,559 19,470 6,216 9,763 10,014 13,291 27,185 Inspections 1,712 4,610 4,600 5,860 5,397 5,530 4,394 6,773 5,369 Arson Cases Investigated 87 94 95 64 49 48 55 37 35 Public Education Presentations 81 107 150 150 139 174 92 116 173
Public Works Street Resurfaced 462 388 244 346 426 363 205 122 233 Potholes Repaired 22,247 24,490 24,694 24,816 23,975 21,750 25,620 17,262 18,234
Bridge Pedestrian Crossings 3,161,627 2,946,244 2,973,056 3,032,333 3,029,608 3,074,538 3,116,492 3,182,403 3,304,191 Gateway Passes Sold 3,110,189 2,923,079 2,934,065 2,913,971 2,614,406 2,582,783 2,650,455 1,148,864 - Non-Commercial Vehicle Crossings 4,401,849 4,418,558 4,551,845 6,732,956 5,060,633 5,212,091 4,992,233 5,013,214 5,018,723 Commercial Vehicle Crossings 1,725,335 1,784,104 1,835,110 1,924,842 2,005,177 2,087,586 2,176,995 2,281,483 2,369,111 Non-Commercial AVI Accounts 10,448 10,406 10,632 11,476 12,433 13,418 12,090 13,124 14,175 Commercial AVI Accounts 3,388 3,721 3,931 4,374 4,852 5,243 5,025 5,540 6,272
Culture and Recreation Community Center Admissions 345,442 382,769 523,699 466,400 447,269 506,177 510,658 398,095 17,854 Community Service Special Events 71 70 93 90 217 90 63 81 61 After School Programs 7 6 9 8 8 8 8 27 9
Transit System Passenger Ridership 2,858,252 2,884,245 2,998,121 2,898,000 2,816,479 2,762,991 2,750,572 2,406,677 2,342,847 Miles Driven 1,953,600 1,961,651 1,961,745 1,941,131 1,684,067 1,721,527 1,716,803 1,738,502 1,772,620
CITY OF LAREDO, TEXAS
282
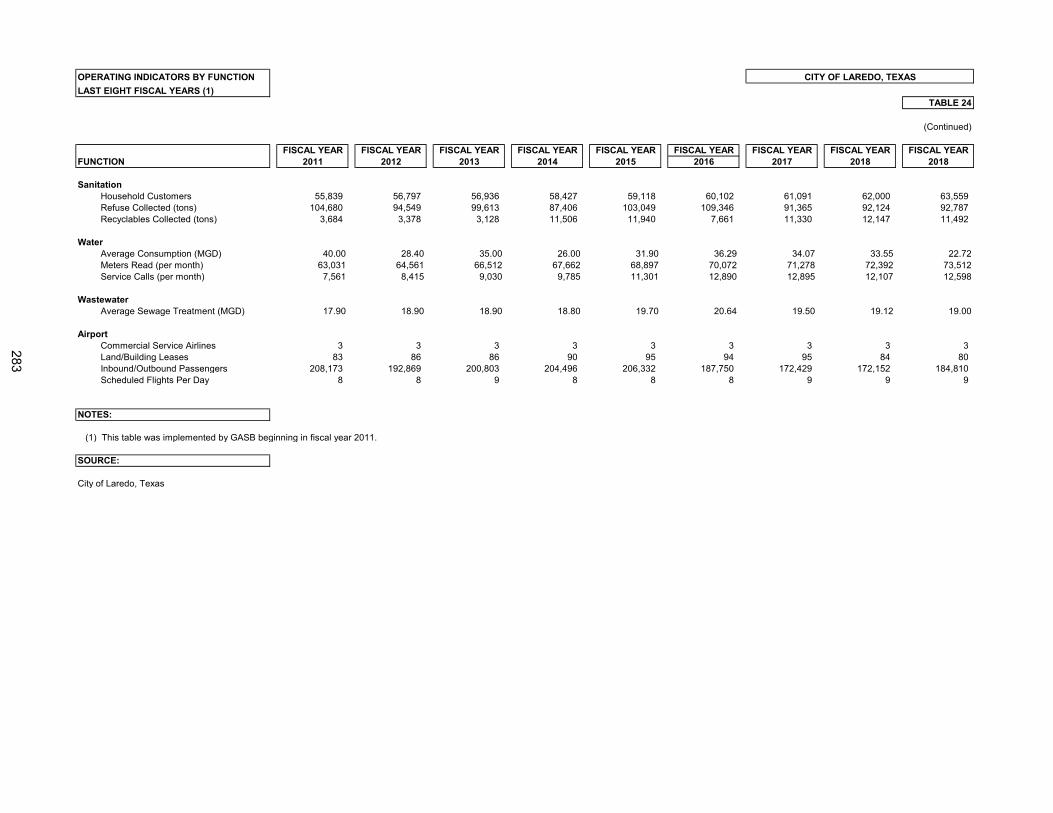
OPERATING INDICATORS BY FUNCTIONLAST EIGHT FISCAL YEARS (1)
TABLE 24
(Continued)
FISCAL YEAR FISCAL YEAR FISCAL YEAR FISCAL YEAR FISCAL YEAR FISCAL YEAR FISCAL YEAR FISCAL YEAR FISCAL YEARFUNCTION 2011 2012 2013 2014 2015 2016 2017 2018 2018
Sanitation Household Customers 55,839 56,797 56,936 58,427 59,118 60,102 61,091 62,000 63,559 Refuse Collected (tons) 104,680 94,549 99,613 87,406 103,049 109,346 91,365 92,124 92,787 Recyclables Collected (tons) 3,684 3,378 3,128 11,506 11,940 7,661 11,330 12,147 11,492
Water Average Consumption (MGD) 40.00 28.40 35.00 26.00 31.90 36.29 34.07 33.55 22.72 Meters Read (per month) 63,031 64,561 66,512 67,662 68,897 70,072 71,278 72,392 73,512 Service Calls (per month) 7,561 8,415 9,030 9,785 11,301 12,890 12,895 12,107 12,598
Wastewater Average Sewage Treatment (MGD) 17.90 18.90 18.90 18.80 19.70 20.64 19.50 19.12 19.00
Airport Commercial Service Airlines 3 3 3 3 3 3 3 3 3 Land/Building Leases 83 86 86 90 95 94 95 84 80 Inbound/Outbound Passengers 208,173 192,869 200,803 204,496 206,332 187,750 172,429 172,152 184,810 Scheduled Flights Per Day 8 8 9 8 8 8 9 9 9
NOTES:
(1) This table was implemented by GASB beginning in fiscal year 2011.
SOURCE:
City of Laredo, Texas
CITY OF LAREDO, TEXAS
283
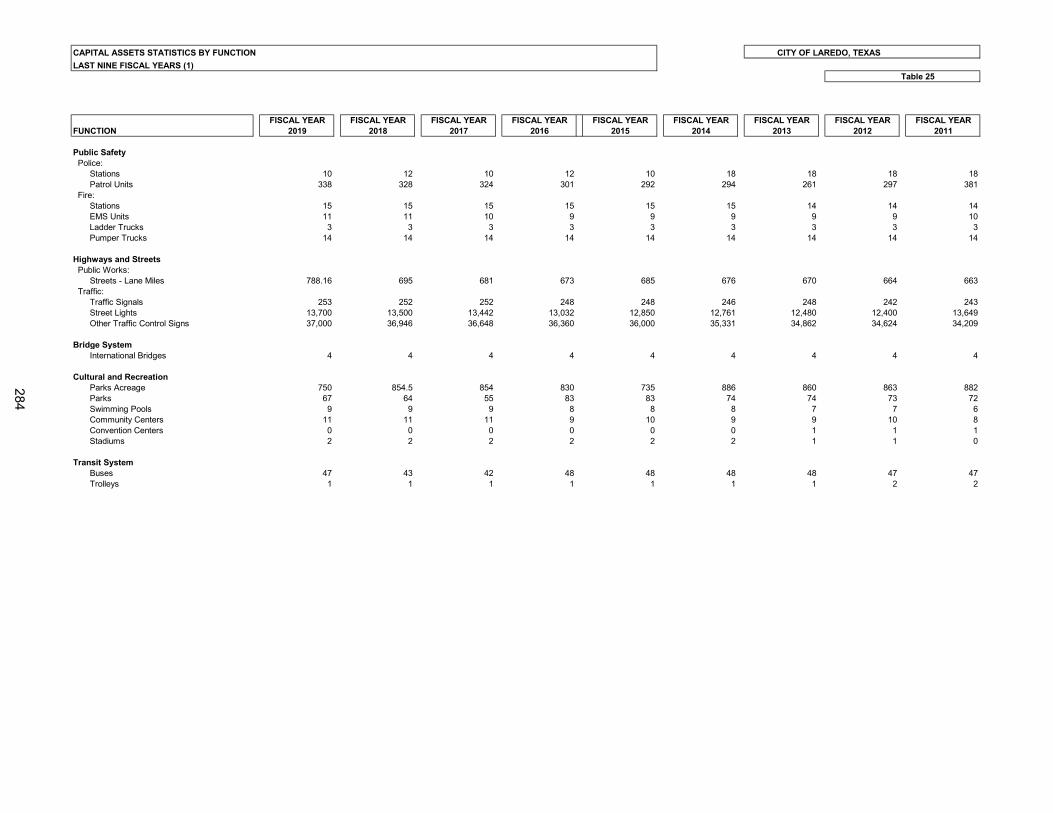
CAPITAL ASSETS STATISTICS BY FUNCTION CITY OF LAREDO, TEXASLAST NINE FISCAL YEARS (1)
Table 25
FISCAL YEAR FISCAL YEAR FISCAL YEAR FISCAL YEAR FISCAL YEAR FISCAL YEAR FISCAL YEAR FISCAL YEAR FISCAL YEARFUNCTION 2019 2018 2017 2016 2015 2014 2013 2012 2011
Public Safety Police: Stations 10 12 10 12 10 18 18 18 18 Patrol Units 338 328 324 301 292 294 261 297 381 Fire: Stations 15 15 15 15 15 15 14 14 14 EMS Units 11 11 10 9 9 9 9 9 10 Ladder Trucks 3 3 3 3 3 3 3 3 3 Pumper Trucks 14 14 14 14 14 14 14 14 14
Highways and Streets Public Works: Streets - Lane Miles 788.16 695 681 673 685 676 670 664 663 Traffic: Traffic Signals 253 252 252 248 248 246 248 242 243 Street Lights 13,700 13,500 13,442 13,032 12,850 12,761 12,480 12,400 13,649 Other Traffic Control Signs 37,000 36,946 36,648 36,360 36,000 35,331 34,862 34,624 34,209
Bridge System International Bridges 4 4 4 4 4 4 4 4 4
Cultural and Recreation Parks Acreage 750 854.5 854 830 735 886 860 863 882 Parks 67 64 55 83 83 74 74 73 72 Swimming Pools 9 9 9 8 8 8 7 7 6 Community Centers 11 11 11 9 10 9 9 10 8 Convention Centers 0 0 0 0 0 0 1 1 1 Stadiums 2 2 2 2 2 2 1 1 0
Transit System Buses 47 43 42 48 48 48 48 47 47 Trolleys 1 1 1 1 1 1 1 2 2
284
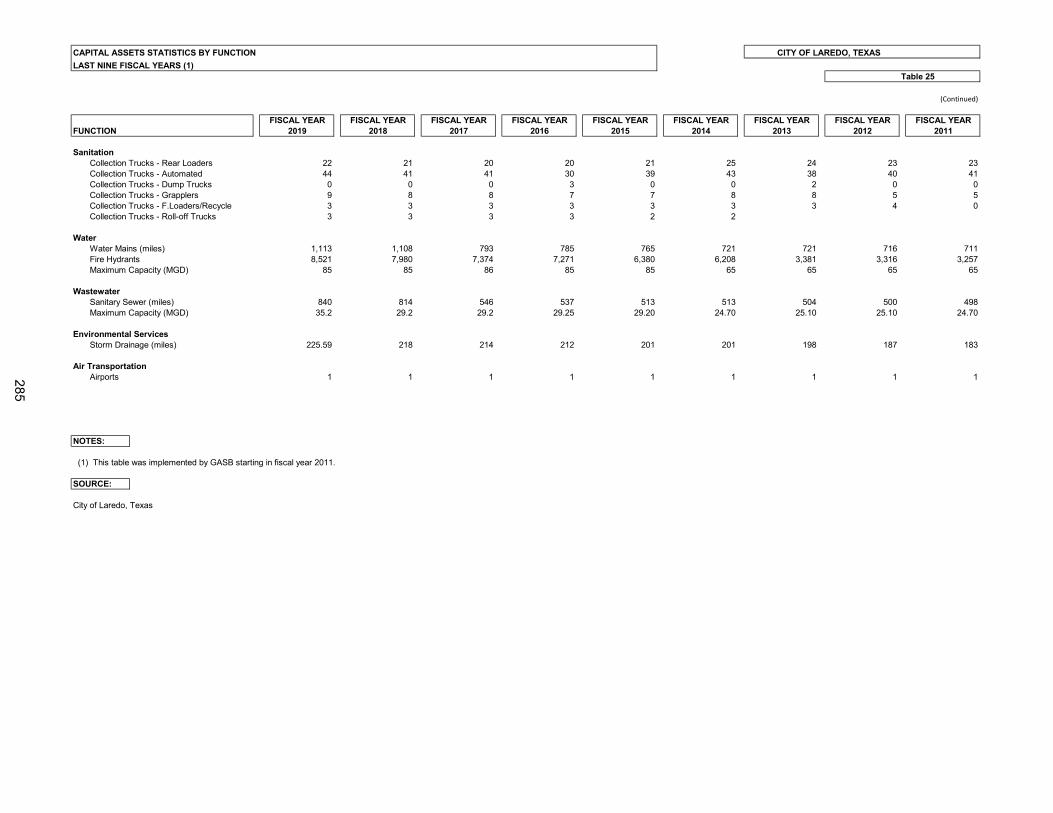
CAPITAL ASSETS STATISTICS BY FUNCTION CITY OF LAREDO, TEXASLAST NINE FISCAL YEARS (1)
Table 25
(Continued)
FISCAL YEAR FISCAL YEAR FISCAL YEAR FISCAL YEAR FISCAL YEAR FISCAL YEAR FISCAL YEAR FISCAL YEAR FISCAL YEARFUNCTION 2019 2018 2017 2016 2015 2014 2013 2012 2011
Sanitation Collection Trucks - Rear Loaders 22 21 20 20 21 25 24 23 23 Collection Trucks - Automated 44 41 41 30 39 43 38 40 41 Collection Trucks - Dump Trucks 0 0 0 3 0 0 2 0 0 Collection Trucks - Grapplers 9 8 8 7 7 8 8 5 5 Collection Trucks - F.Loaders/Recycle 3 3 3 3 3 3 3 4 0 Collection Trucks - Roll-off Trucks 3 3 3 3 2 2
Water Water Mains (miles) 1,113 1,108 793 785 765 721 721 716 711 Fire Hydrants 8,521 7,980 7,374 7,271 6,380 6,208 3,381 3,316 3,257 Maximum Capacity (MGD) 85 85 86 85 85 65 65 65 65
Wastewater Sanitary Sewer (miles) 840 814 546 537 513 513 504 500 498 Maximum Capacity (MGD) 35.2 29.2 29.2 29.25 29.20 24.70 25.10 25.10 24.70
Environmental Services Storm Drainage (miles) 225.59 218 214 212 201 201 198 187 183
Air Transportation Airports 1 1 1 1 1 1 1 1 1
NOTES:
(1) This table was implemented by GASB starting in fiscal year 2011.
SOURCE:
City of Laredo, Texas
285

This page intentionally left blank
286
CONTINUING DISCLOSURES INFORMATION
287
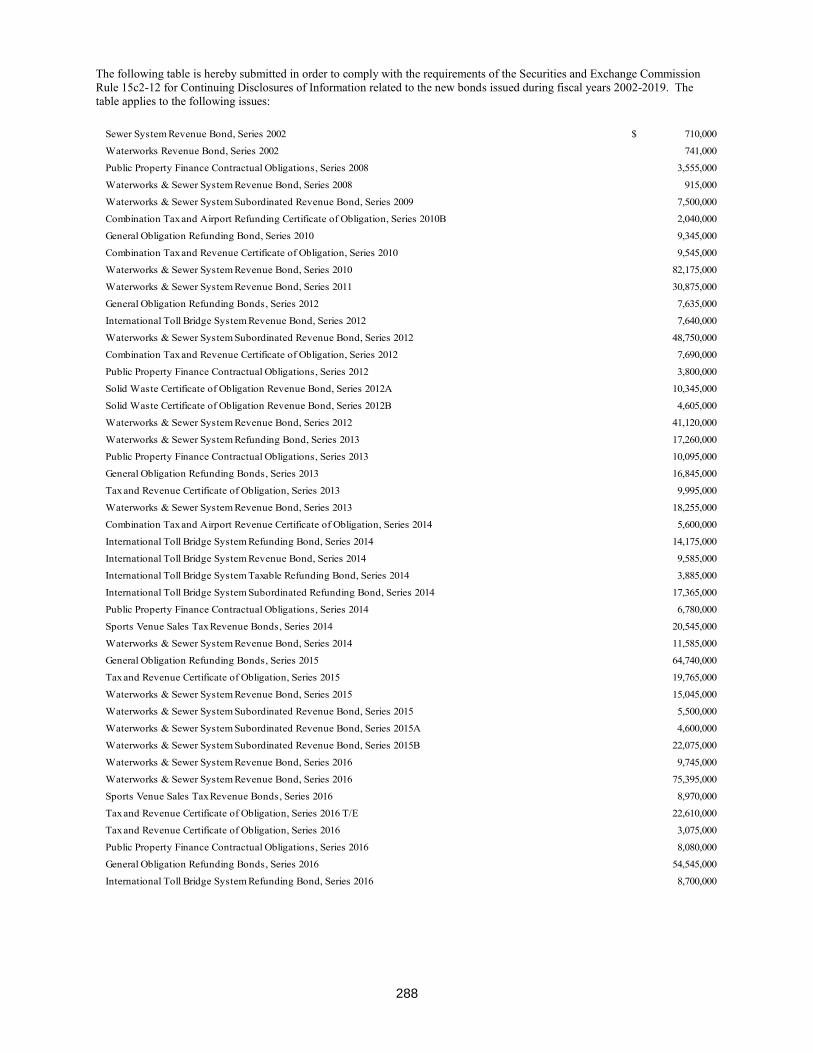
The following table is hereby submitted in order to comply with the requirements of the Securities and Exchange Commission Rule 15c2-12 for Continuing Disclosures of Information related to the new bonds issued during fiscal years 2002-2019. The table applies to the following issues:
Sewer System Revenue Bond, Series 2002 $ 710,000
Waterworks Revenue Bond, Series 2002 741,000
Public Property Finance Contractual Obligations, Series 2008 3,555,000
Waterworks & Sewer System Revenue Bond, Series 2008 915,000
Waterworks & Sewer System Subordinated Revenue Bond, Series 2009 7,500,000
Combination Tax and Airport Refunding Certificate of Obligation, Series 2010B 2,040,000
General Obligation Refunding Bond, Series 2010 9,345,000
Combination Tax and Revenue Certificate of Obligation, Series 2010 9,545,000
Waterworks & Sewer System Revenue Bond, Series 2010 82,175,000
Waterworks & Sewer System Revenue Bond, Series 2011 30,875,000
General Obligation Refunding Bonds, Series 2012 7,635,000
International Toll Bridge System Revenue Bond, Series 2012 7,640,000
Waterworks & Sewer System Subordinated Revenue Bond, Series 2012 48,750,000
Combination Tax and Revenue Certificate of Obligation, Series 2012 7,690,000
Public Property Finance Contractual Obligations, Series 2012 3,800,000
Solid Waste Certificate of Obligation Revenue Bond, Series 2012A 10,345,000
Solid Waste Certificate of Obligation Revenue Bond, Series 2012B 4,605,000
Waterworks & Sewer System Revenue Bond, Series 2012 41,120,000
Waterworks & Sewer System Refunding Bond, Series 2013 17,260,000
Public Property Finance Contractual Obligations, Series 2013 10,095,000
General Obligation Refunding Bonds, Series 2013 16,845,000
Tax and Revenue Certificate of Obligation, Series 2013 9,995,000
Waterworks & Sewer System Revenue Bond, Series 2013 18,255,000
Combination Tax and Airport Revenue Certificate of Obligation, Series 2014 5,600,000
International Toll Bridge System Refunding Bond, Series 2014 14,175,000
International Toll Bridge System Revenue Bond, Series 2014 9,585,000
International Toll Bridge System Taxable Refunding Bond, Series 2014 3,885,000
International Toll Bridge System Subordinated Refunding Bond, Series 2014 17,365,000
Public Property Finance Contractual Obligations, Series 2014 6,780,000
Sports Venue Sales Tax Revenue Bonds, Series 2014 20,545,000
Waterworks & Sewer System Revenue Bond, Series 2014 11,585,000
General Obligation Refunding Bonds, Series 2015 64,740,000
Tax and Revenue Certificate of Obligation, Series 2015 19,765,000
Waterworks & Sewer System Revenue Bond, Series 2015 15,045,000
Waterworks & Sewer System Subordinated Revenue Bond, Series 2015 5,500,000
Waterworks & Sewer System Subordinated Revenue Bond, Series 2015A 4,600,000
Waterworks & Sewer System Subordinated Revenue Bond, Series 2015B 22,075,000
Waterworks & Sewer System Revenue Bond, Series 2016 9,745,000
Waterworks & Sewer System Revenue Bond, Series 2016 75,395,000
Sports Venue Sales Tax Revenue Bonds, Series 2016 8,970,000
Tax and Revenue Certificate of Obligation, Series 2016 T/E 22,610,000
Tax and Revenue Certificate of Obligation, Series 2016 3,075,000
Public Property Finance Contractual Obligations, Series 2016 8,080,000
General Obligation Refunding Bonds, Series 2016 54,545,000
International Toll Bridge System Refunding Bond, Series 2016 8,700,000
288
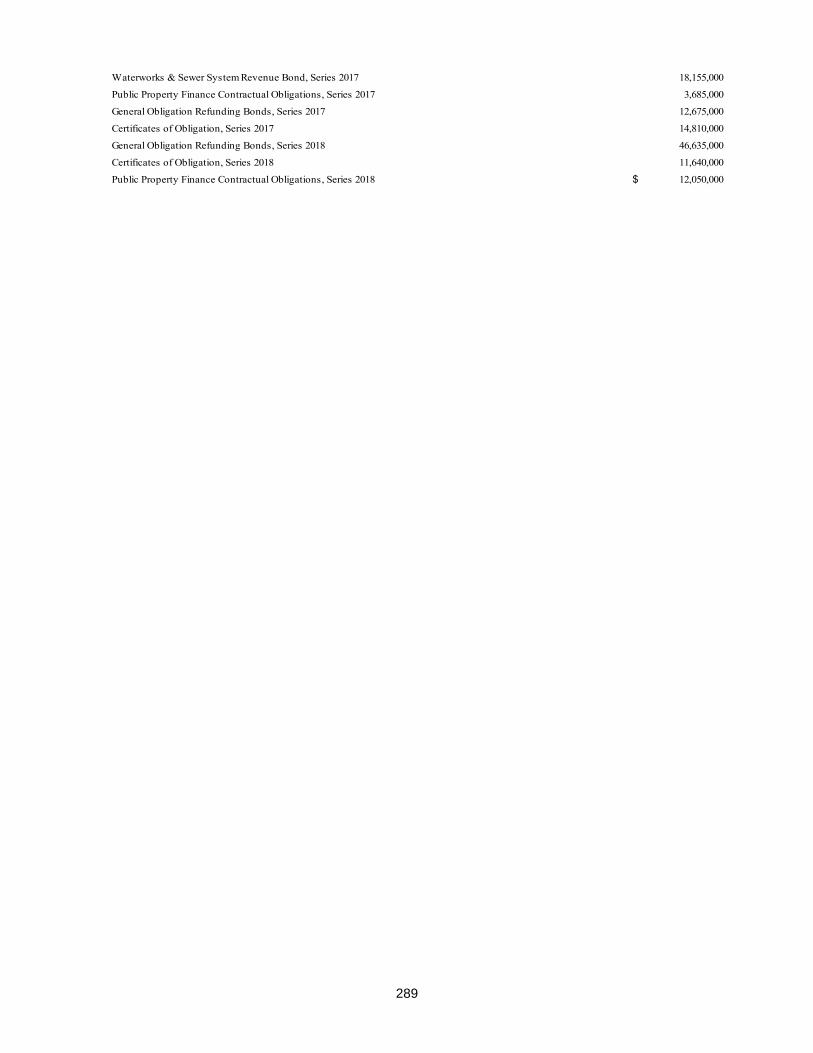
Waterworks & Sewer System Revenue Bond, Series 2017 18,155,000
Public Property Finance Contractual Obligations, Series 2017 3,685,000
General Obligation Refunding Bonds, Series 2017 12,675,000
Certificates of Obligation, Series 2017 14,810,000
General Obligation Refunding Bonds, Series 2018 46,635,000
Certificates of Obligation, Series 2018 11,640,000
Public Property Finance Contractual Obligations, Series 2018 $ 12,050,000
289
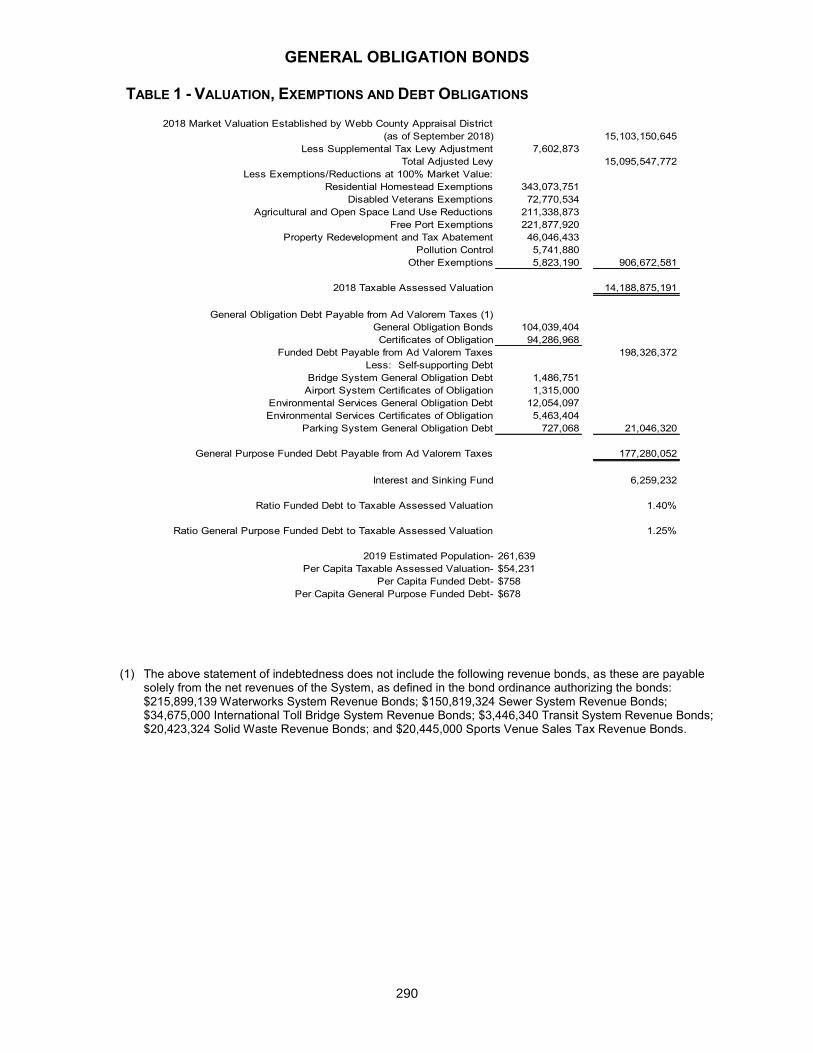
GENERAL OBLIGATION BONDS
TABLE 1 - VALUATION, EXEMPTIONS AND DEBT OBLIGATIONS
(1) The above statement of indebtedness does not include the following revenue bonds, as these are payable
solely from the net revenues of the System, as defined in the bond ordinance authorizing the bonds: $215,899,139 Waterworks System Revenue Bonds; $150,819,324 Sewer System Revenue Bonds; $34,675,000 International Toll Bridge System Revenue Bonds; $3,446,340 Transit System Revenue Bonds; $20,423,324 Solid Waste Revenue Bonds; and $20,445,000 Sports Venue Sales Tax Revenue Bonds.
2018 Market Valuation Established by Webb County Appraisal District(as of September 2018) 15,103,150,645
Less Supplemental Tax Levy Adjustment 7,602,873Total Adjusted Levy 15,095,547,772
Less Exemptions/Reductions at 100% Market Value:Residential Homestead Exemptions 343,073,751
Disabled Veterans Exemptions 72,770,534Agricultural and Open Space Land Use Reductions 211,338,873
Free Port Exemptions 221,877,920Property Redevelopment and Tax Abatement 46,046,433
Pollution Control 5,741,880Other Exemptions 5,823,190 906,672,581
2018 Taxable Assessed Valuation 14,188,875,191
General Obligation Debt Payable from Ad Valorem Taxes (1)General Obligation Bonds 104,039,404Certificates of Obligation 94,286,968
Funded Debt Payable from Ad Valorem Taxes 198,326,372Less: Self-supporting Debt
Bridge System General Obligation Debt 1,486,751Airport System Certificates of Obligation 1,315,000
Environmental Services General Obligation Debt 12,054,097Environmental Services Certificates of Obligation 5,463,404
Parking System General Obligation Debt 727,068 21,046,320
General Purpose Funded Debt Payable from Ad Valorem Taxes 177,280,052
Interest and Sinking Fund 6,259,232
Ratio Funded Debt to Taxable Assessed Valuation 1.40%
Ratio General Purpose Funded Debt to Taxable Assessed Valuation 1.25%
2019 Estimated Population- 261,639Per Capita Taxable Assessed Valuation- $54,231
Per Capita Funded Debt- $758Per Capita General Purpose Funded Debt- $678
290
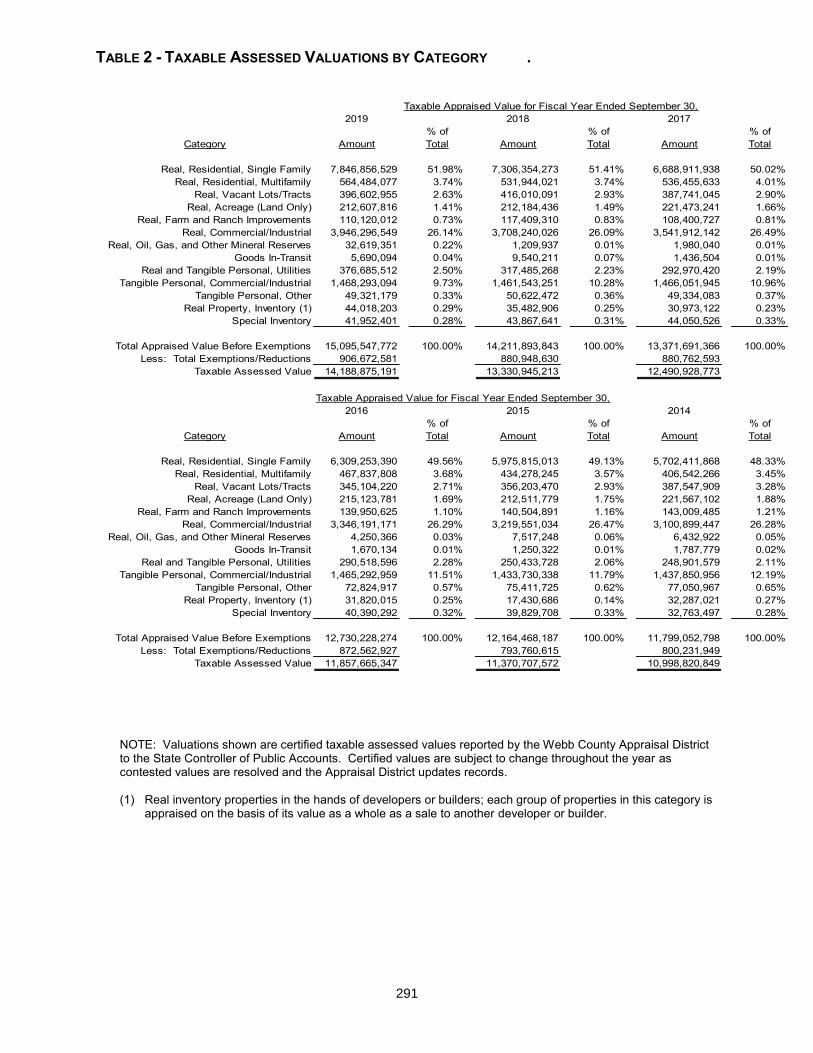
TABLE 2 - TAXABLE ASSESSED VALUATIONS BY CATEGORY .
NOTE: Valuations shown are certified taxable assessed values reported by the Webb County Appraisal District to the State Controller of Public Accounts. Certified values are subject to change throughout the year as contested values are resolved and the Appraisal District updates records. (1) Real inventory properties in the hands of developers or builders; each group of properties in this category is
appraised on the basis of its value as a whole as a sale to another developer or builder.
2019 2018 2017% of % of % of
Category Amount Total Amount Total Amount Total
Real, Residential, Single Family 7,846,856,529 51.98% 7,306,354,273 51.41% 6,688,911,938 50.02%Real, Residential, Multifamily 564,484,077 3.74% 531,944,021 3.74% 536,455,633 4.01%
Real, Vacant Lots/Tracts 396,602,955 2.63% 416,010,091 2.93% 387,741,045 2.90%Real, Acreage (Land Only) 212,607,816 1.41% 212,184,436 1.49% 221,473,241 1.66%
Real, Farm and Ranch Improvements 110,120,012 0.73% 117,409,310 0.83% 108,400,727 0.81%Real, Commercial/Industrial 3,946,296,549 26.14% 3,708,240,026 26.09% 3,541,912,142 26.49%
Real, Oil, Gas, and Other Mineral Reserves 32,619,351 0.22% 1,209,937 0.01% 1,980,040 0.01%Goods In-Transit 5,690,094 0.04% 9,540,211 0.07% 1,436,504 0.01%
Real and Tangible Personal, Utilities 376,685,512 2.50% 317,485,268 2.23% 292,970,420 2.19%Tangible Personal, Commercial/Industrial 1,468,293,094 9.73% 1,461,543,251 10.28% 1,466,051,945 10.96%
Tangible Personal, Other 49,321,179 0.33% 50,622,472 0.36% 49,334,083 0.37%Real Property, Inventory (1) 44,018,203 0.29% 35,482,906 0.25% 30,973,122 0.23%
Special Inventory 41,952,401 0.28% 43,867,641 0.31% 44,050,526 0.33%
Total Appraised Value Before Exemptions 15,095,547,772 100.00% 14,211,893,843 100.00% 13,371,691,366 100.00%Less: Total Exemptions/Reductions 906,672,581 880,948,630 880,762,593
Taxable Assessed Value 14,188,875,191 13,330,945,213 12,490,928,773
Taxable Appraised Value for Fiscal Year Ended September 30,2016 2015 2014
% of % of % ofCategory Amount Total Amount Total Amount Total
Real, Residential, Single Family 6,309,253,390 49.56% 5,975,815,013 49.13% 5,702,411,868 48.33%Real, Residential, Multifamily 467,837,808 3.68% 434,278,245 3.57% 406,542,266 3.45%
Real, Vacant Lots/Tracts 345,104,220 2.71% 356,203,470 2.93% 387,547,909 3.28%Real, Acreage (Land Only) 215,123,781 1.69% 212,511,779 1.75% 221,567,102 1.88%
Real, Farm and Ranch Improvements 139,950,625 1.10% 140,504,891 1.16% 143,009,485 1.21%Real, Commercial/Industrial 3,346,191,171 26.29% 3,219,551,034 26.47% 3,100,899,447 26.28%
Real, Oil, Gas, and Other Mineral Reserves 4,250,366 0.03% 7,517,248 0.06% 6,432,922 0.05%Goods In-Transit 1,670,134 0.01% 1,250,322 0.01% 1,787,779 0.02%
Real and Tangible Personal, Utilities 290,518,596 2.28% 250,433,728 2.06% 248,901,579 2.11%Tangible Personal, Commercial/Industrial 1,465,292,959 11.51% 1,433,730,338 11.79% 1,437,850,956 12.19%
Tangible Personal, Other 72,824,917 0.57% 75,411,725 0.62% 77,050,967 0.65%Real Property, Inventory (1) 31,820,015 0.25% 17,430,686 0.14% 32,287,021 0.27%
Special Inventory 40,390,292 0.32% 39,829,708 0.33% 32,763,497 0.28%
Total Appraised Value Before Exemptions 12,730,228,274 100.00% 12,164,468,187 100.00% 11,799,052,798 100.00%Less: Total Exemptions/Reductions 872,562,927 793,760,615 800,231,949
Taxable Assessed Value 11,857,665,347 11,370,707,572 10,998,820,849
Taxable Appraised Value for Fiscal Year Ended September 30,
291
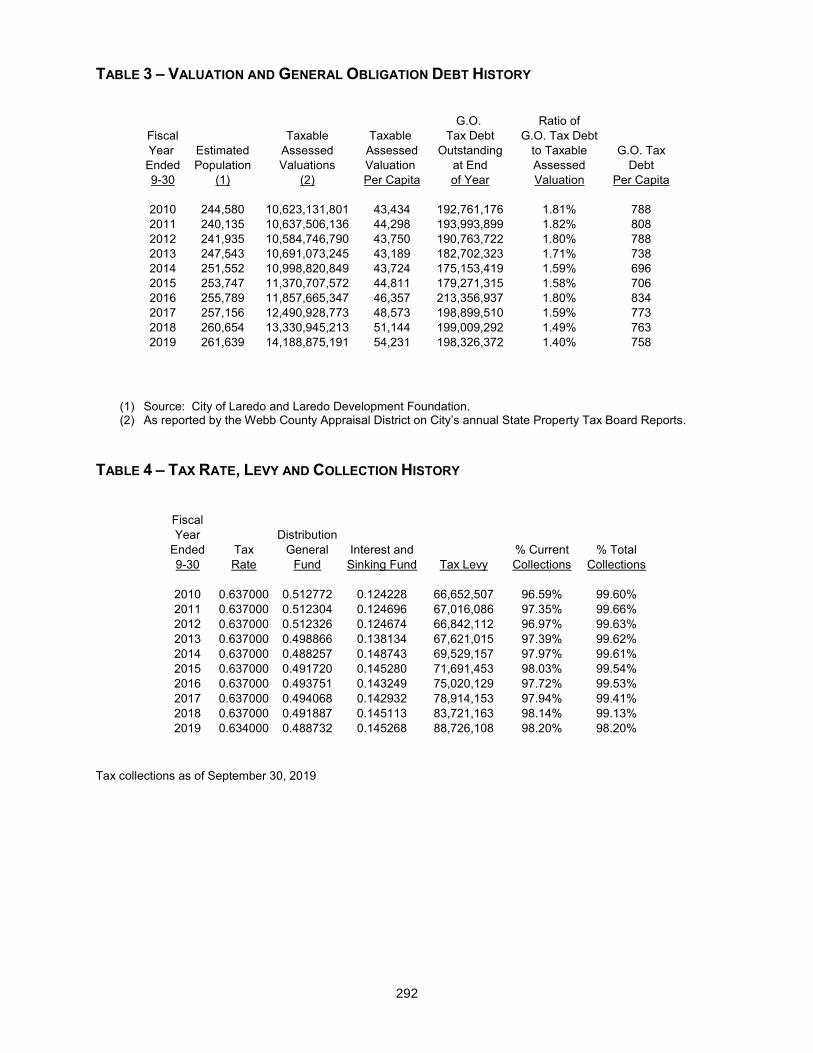
TABLE 3 – VALUATION AND GENERAL OBLIGATION DEBT HISTORY
G.O. Ratio ofFiscal Taxable Taxable Tax Debt G.O. Tax DebtYear Estimated Assessed Assessed Outstanding to Taxable G.O. TaxEnded Population Valuations Valuation at End Assessed Debt9-30 (1) (2) Per Capita of Year Valuation Per Capita
2010 244,580 10,623,131,801 43,434 192,761,176 1.81% 7882011 240,135 10,637,506,136 44,298 193,993,899 1.82% 8082012 241,935 10,584,746,790 43,750 190,763,722 1.80% 7882013 247,543 10,691,073,245 43,189 182,702,323 1.71% 7382014 251,552 10,998,820,849 43,724 175,153,419 1.59% 6962015 253,747 11,370,707,572 44,811 179,271,315 1.58% 7062016 255,789 11,857,665,347 46,357 213,356,937 1.80% 8342017 257,156 12,490,928,773 48,573 198,899,510 1.59% 7732018 260,654 13,330,945,213 51,144 199,009,292 1.49% 7632019 261,639 14,188,875,191 54,231 198,326,372 1.40% 758
(1) Source: City of Laredo and Laredo Development Foundation. (2) As reported by the Webb County Appraisal District on City’s annual State Property Tax Board Reports.
TABLE 4 – TAX RATE, LEVY AND COLLECTION HISTORY
FiscalYear Distribution
Ended Tax General Interest and % Current % Total9-30 Rate Fund Sinking Fund Tax Levy Collections Collections
2010 0.637000 0.512772 0.124228 66,652,507 96.59% 99.60%2011 0.637000 0.512304 0.124696 67,016,086 97.35% 99.66%2012 0.637000 0.512326 0.124674 66,842,112 96.97% 99.63%2013 0.637000 0.498866 0.138134 67,621,015 97.39% 99.62%2014 0.637000 0.488257 0.148743 69,529,157 97.97% 99.61%2015 0.637000 0.491720 0.145280 71,691,453 98.03% 99.54%2016 0.637000 0.493751 0.143249 75,020,129 97.72% 99.53%2017 0.637000 0.494068 0.142932 78,914,153 97.94% 99.41%2018 0.637000 0.491887 0.145113 83,721,163 98.14% 99.13%2019 0.634000 0.488732 0.145268 88,726,108 98.20% 98.20%
Tax collections as of September 30, 2019
292
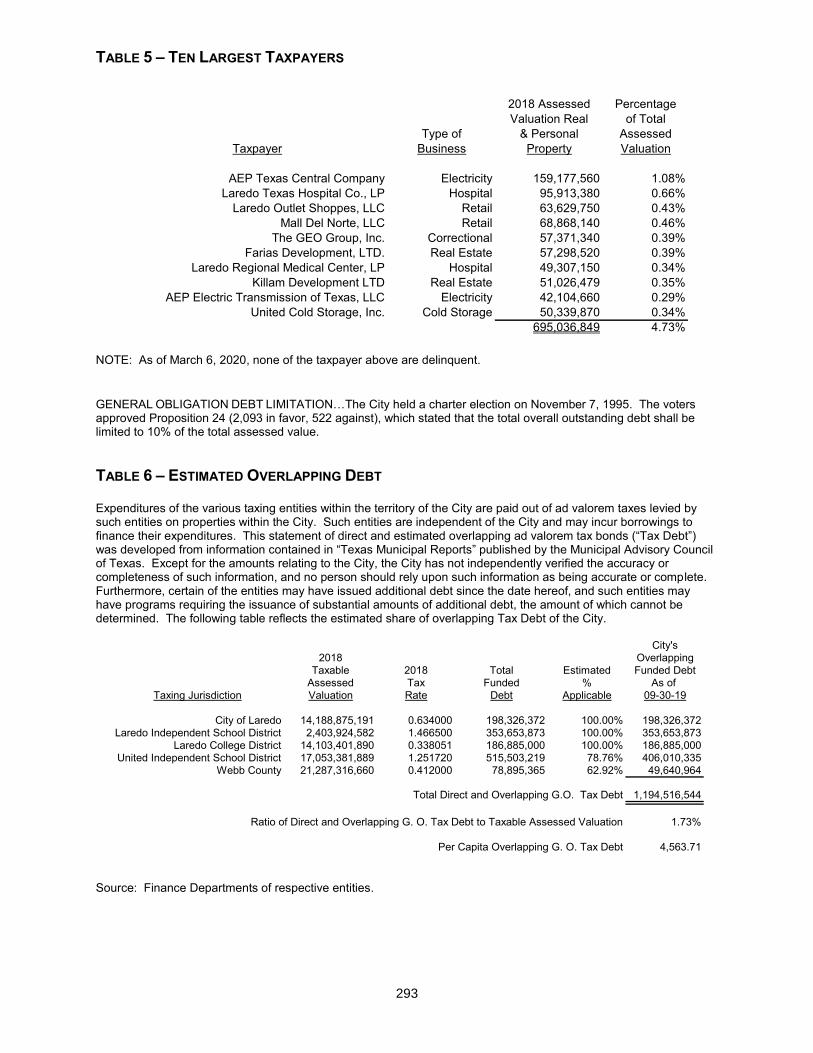
TABLE 5 – TEN LARGEST TAXPAYERS
2018 Assessed PercentageValuation Real of Total
Type of & Personal AssessedTaxpayer Business Property Valuation
AEP Texas Central Company Electricity 159,177,560 1.08%Laredo Texas Hospital Co., LP Hospital 95,913,380 0.66%
Laredo Outlet Shoppes, LLC Retail 63,629,750 0.43%Mall Del Norte, LLC Retail 68,868,140 0.46%
The GEO Group, Inc. Correctional 57,371,340 0.39%Farias Development, LTD. Real Estate 57,298,520 0.39%
Laredo Regional Medical Center, LP Hospital 49,307,150 0.34%Killam Development LTD Real Estate 51,026,479 0.35%
AEP Electric Transmission of Texas, LLC Electricity 42,104,660 0.29%United Cold Storage, Inc. Cold Storage 50,339,870 0.34%
695,036,849 4.73%
NOTE: As of March 6, 2020, none of the taxpayer above are delinquent. GENERAL OBLIGATION DEBT LIMITATION…The City held a charter election on November 7, 1995. The voters approved Proposition 24 (2,093 in favor, 522 against), which stated that the total overall outstanding debt shall be limited to 10% of the total assessed value. TABLE 6 – ESTIMATED OVERLAPPING DEBT Expenditures of the various taxing entities within the territory of the City are paid out of ad valorem taxes levied by such entities on properties within the City. Such entities are independent of the City and may incur borrowings to finance their expenditures. This statement of direct and estimated overlapping ad valorem tax bonds (“Tax Debt”) was developed from information contained in “Texas Municipal Reports” published by the Municipal Advisory Council of Texas. Except for the amounts relating to the City, the City has not independently verified the accuracy or completeness of such information, and no person should rely upon such information as being accurate or complete. Furthermore, certain of the entities may have issued additional debt since the date hereof, and such entities may have programs requiring the issuance of substantial amounts of additional debt, the amount of which cannot be determined. The following table reflects the estimated share of overlapping Tax Debt of the City.
City's2018 Overlapping
Taxable 2018 Total Estimated Funded DebtAssessed Tax Funded % As of
Taxing Jurisdiction Valuation Rate Debt Applicable 09-30-19
City of Laredo 14,188,875,191 0.634000 198,326,372 100.00% 198,326,372Laredo Independent School District 2,403,924,582 1.466500 353,653,873 100.00% 353,653,873
Laredo College District 14,103,401,890 0.338051 186,885,000 100.00% 186,885,000United Independent School District 17,053,381,889 1.251720 515,503,219 78.76% 406,010,335
Webb County 21,287,316,660 0.412000 78,895,365 62.92% 49,640,964
Total Direct and Overlapping G.O. Tax Debt 1,194,516,544
Ratio of Direct and Overlapping G. O. Tax Debt to Taxable Assessed Valuation 1.73%
Per Capita Overlapping G. O. Tax Debt 4,563.71
Source: Finance Departments of respective entities.
293
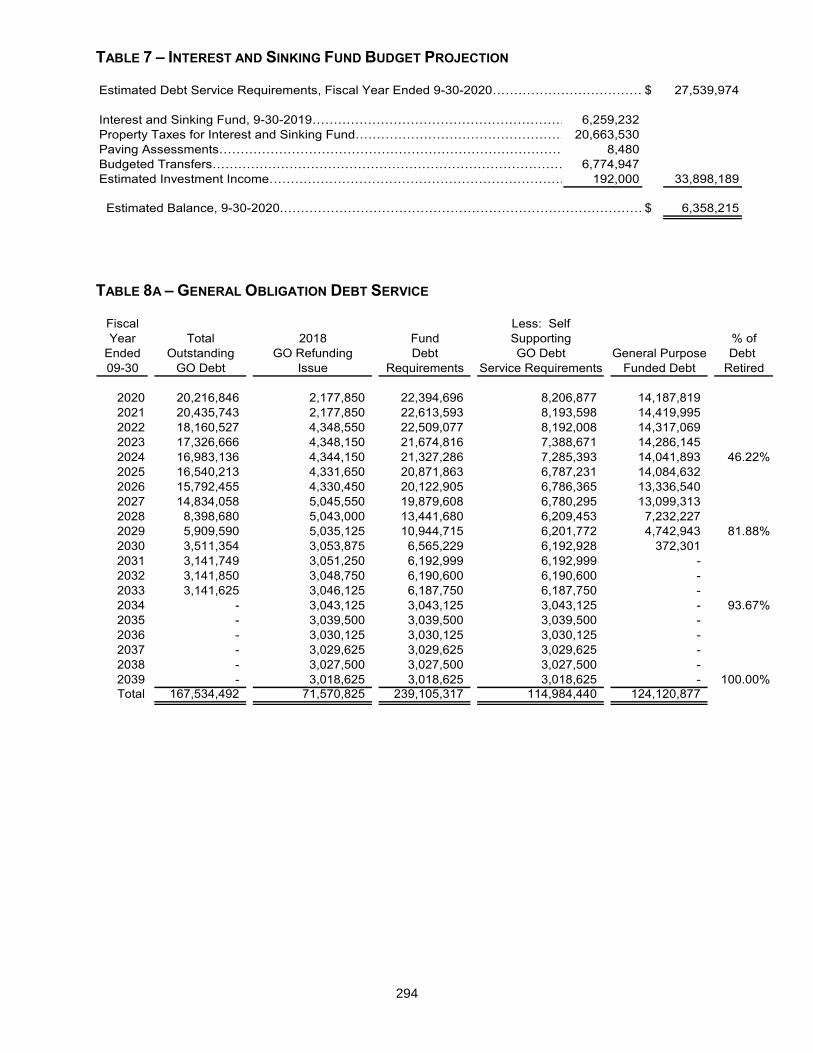
TABLE 7 – INTEREST AND SINKING FUND BUDGET PROJECTION Estimated Debt Service Requirements, Fiscal Year Ended 9-30-2020………………………………….$ 27,539,974
Interest and Sinking Fund, 9-30-2019…………………………………………………………6,259,232Property Taxes for Interest and Sinking Fund…………………………………………………20,663,530Paving Assessments……………………………………………………………………………. 8,480Budgeted Transfers………………………………………………………………………………6,774,947Estimated Investment Income…………………………………………………………………..192,000 33,898,189
Estimated Balance, 9-30-2020.…………………………………………………………………………….$ 6,358,215
TABLE 8A – GENERAL OBLIGATION DEBT SERVICE
Fiscal Less: SelfYear Total 2018 Fund Supporting % of
Ended Outstanding GO Refunding Debt GO Debt General Purpose Debt 09-30 GO Debt Issue Requirements Service Requirements Funded Debt Retired
2020 20,216,846 2,177,850 22,394,696 8,206,877 14,187,819 2021 20,435,743 2,177,850 22,613,593 8,193,598 14,419,995 2022 18,160,527 4,348,550 22,509,077 8,192,008 14,317,069 2023 17,326,666 4,348,150 21,674,816 7,388,671 14,286,145 2024 16,983,136 4,344,150 21,327,286 7,285,393 14,041,893 46.22%2025 16,540,213 4,331,650 20,871,863 6,787,231 14,084,632 2026 15,792,455 4,330,450 20,122,905 6,786,365 13,336,540 2027 14,834,058 5,045,550 19,879,608 6,780,295 13,099,313 2028 8,398,680 5,043,000 13,441,680 6,209,453 7,232,227 2029 5,909,590 5,035,125 10,944,715 6,201,772 4,742,943 81.88%2030 3,511,354 3,053,875 6,565,229 6,192,928 372,301 2031 3,141,749 3,051,250 6,192,999 6,192,999 - 2032 3,141,850 3,048,750 6,190,600 6,190,600 - 2033 3,141,625 3,046,125 6,187,750 6,187,750 - 2034 - 3,043,125 3,043,125 3,043,125 - 93.67%2035 - 3,039,500 3,039,500 3,039,500 - 2036 - 3,030,125 3,030,125 3,030,125 - 2037 - 3,029,625 3,029,625 3,029,625 - 2038 - 3,027,500 3,027,500 3,027,500 - 2039 - 3,018,625 3,018,625 3,018,625 - 100.00%Total 167,534,492 71,570,825 239,105,317 114,984,440 124,120,877
294
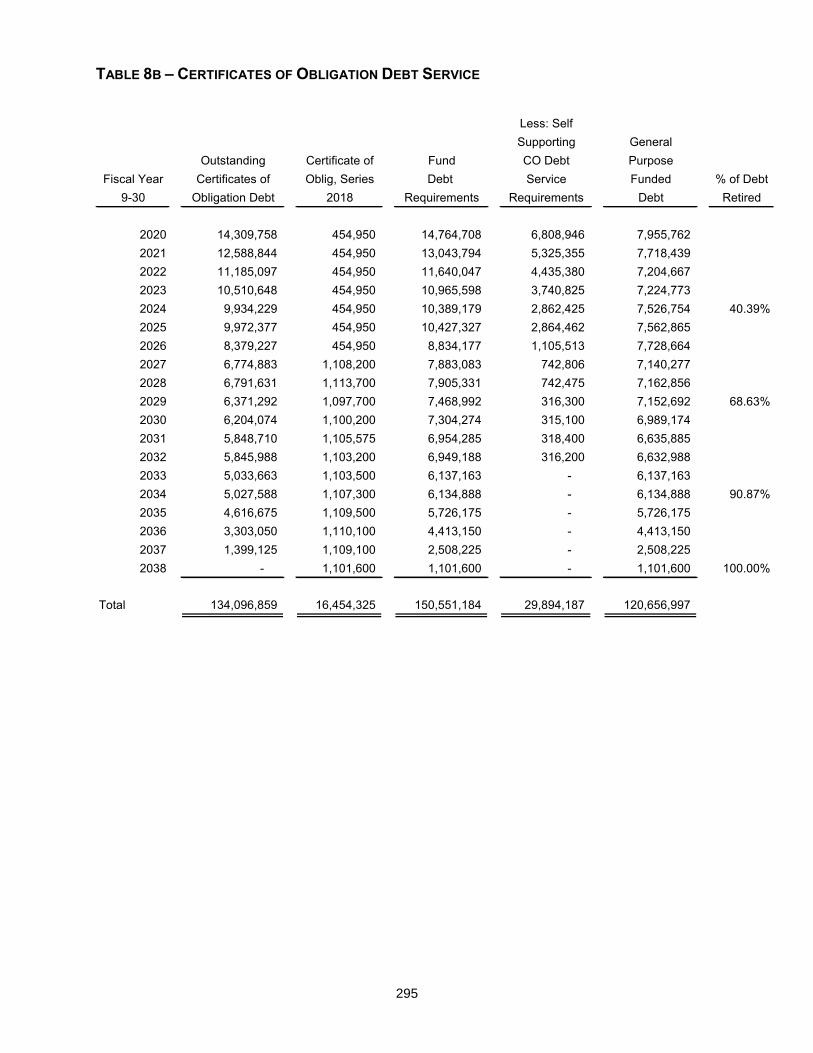
TABLE 8B – CERTIFICATES OF OBLIGATION DEBT SERVICE
Less: SelfSupporting General
Outstanding Certificate of Fund CO Debt PurposeFiscal Year Certificates of Oblig, Series Debt Service Funded % of Debt
9-30 Obligation Debt 2018 Requirements Requirements Debt Retired
2020 14,309,758 454,950 14,764,708 6,808,946 7,955,762 2021 12,588,844 454,950 13,043,794 5,325,355 7,718,439 2022 11,185,097 454,950 11,640,047 4,435,380 7,204,667 2023 10,510,648 454,950 10,965,598 3,740,825 7,224,773 2024 9,934,229 454,950 10,389,179 2,862,425 7,526,754 40.39%2025 9,972,377 454,950 10,427,327 2,864,462 7,562,865 2026 8,379,227 454,950 8,834,177 1,105,513 7,728,664 2027 6,774,883 1,108,200 7,883,083 742,806 7,140,277 2028 6,791,631 1,113,700 7,905,331 742,475 7,162,856 2029 6,371,292 1,097,700 7,468,992 316,300 7,152,692 68.63%2030 6,204,074 1,100,200 7,304,274 315,100 6,989,174 2031 5,848,710 1,105,575 6,954,285 318,400 6,635,885 2032 5,845,988 1,103,200 6,949,188 316,200 6,632,988 2033 5,033,663 1,103,500 6,137,163 - 6,137,163 2034 5,027,588 1,107,300 6,134,888 - 6,134,888 90.87%2035 4,616,675 1,109,500 5,726,175 - 5,726,175 2036 3,303,050 1,110,100 4,413,150 - 4,413,150 2037 1,399,125 1,109,100 2,508,225 - 2,508,225 2038 - 1,101,600 1,101,600 - 1,101,600 100.00%
Total 134,096,859 16,454,325 150,551,184 29,894,187 120,656,997
295
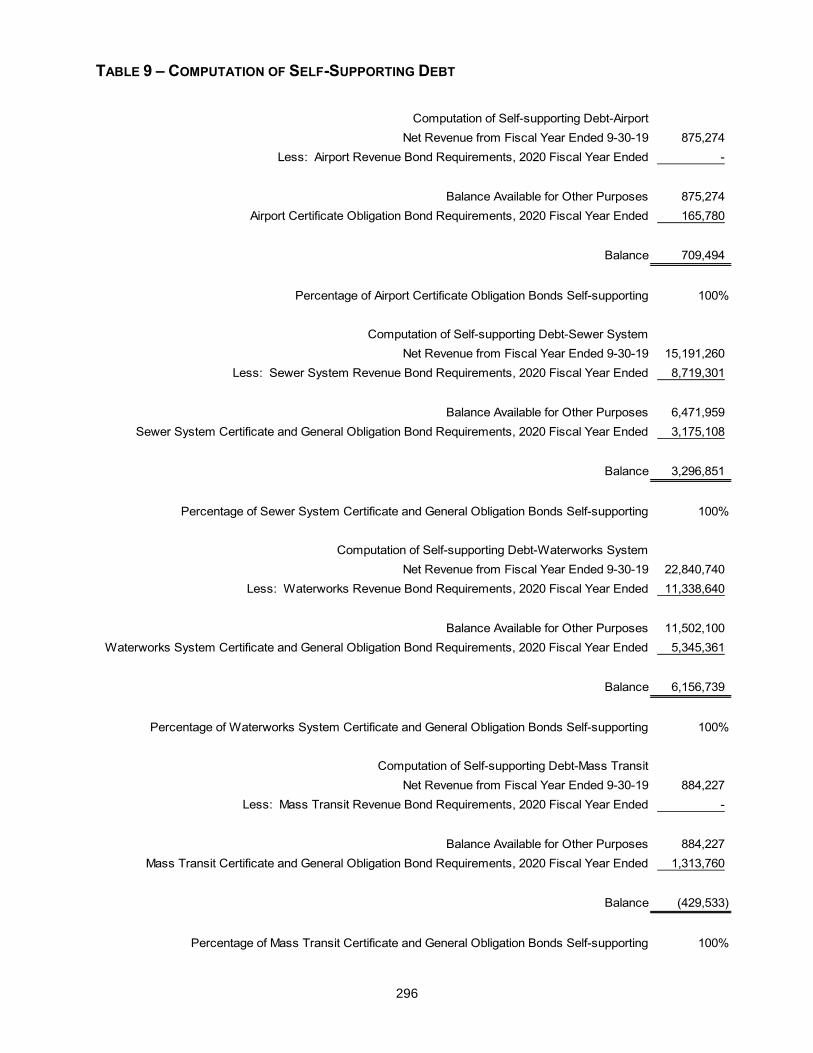
TABLE 9 – COMPUTATION OF SELF-SUPPORTING DEBT
Computation of Self-supporting Debt-AirportNet Revenue from Fiscal Year Ended 9-30-19 875,274
Less: Airport Revenue Bond Requirements, 2020 Fiscal Year Ended -
Balance Available for Other Purposes 875,274 Airport Certificate Obligation Bond Requirements, 2020 Fiscal Year Ended 165,780
Balance 709,494
Percentage of Airport Certificate Obligation Bonds Self-supporting 100%
Computation of Self-supporting Debt-Sewer SystemNet Revenue from Fiscal Year Ended 9-30-19 15,191,260
Less: Sewer System Revenue Bond Requirements, 2020 Fiscal Year Ended 8,719,301
Balance Available for Other Purposes 6,471,959 Sewer System Certificate and General Obligation Bond Requirements, 2020 Fiscal Year Ended 3,175,108
Balance 3,296,851
Percentage of Sewer System Certificate and General Obligation Bonds Self-supporting 100%
Computation of Self-supporting Debt-Waterworks SystemNet Revenue from Fiscal Year Ended 9-30-19 22,840,740
Less: Waterworks Revenue Bond Requirements, 2020 Fiscal Year Ended 11,338,640
Balance Available for Other Purposes 11,502,100 Waterworks System Certificate and General Obligation Bond Requirements, 2020 Fiscal Year Ended 5,345,361
Balance 6,156,739
Percentage of Waterworks System Certificate and General Obligation Bonds Self-supporting 100%
Computation of Self-supporting Debt-Mass TransitNet Revenue from Fiscal Year Ended 9-30-19 884,227
Less: Mass Transit Revenue Bond Requirements, 2020 Fiscal Year Ended -
Balance Available for Other Purposes 884,227 Mass Transit Certificate and General Obligation Bond Requirements, 2020 Fiscal Year Ended 1,313,760
Balance (429,533)
Percentage of Mass Transit Certificate and General Obligation Bonds Self-supporting 100%
296
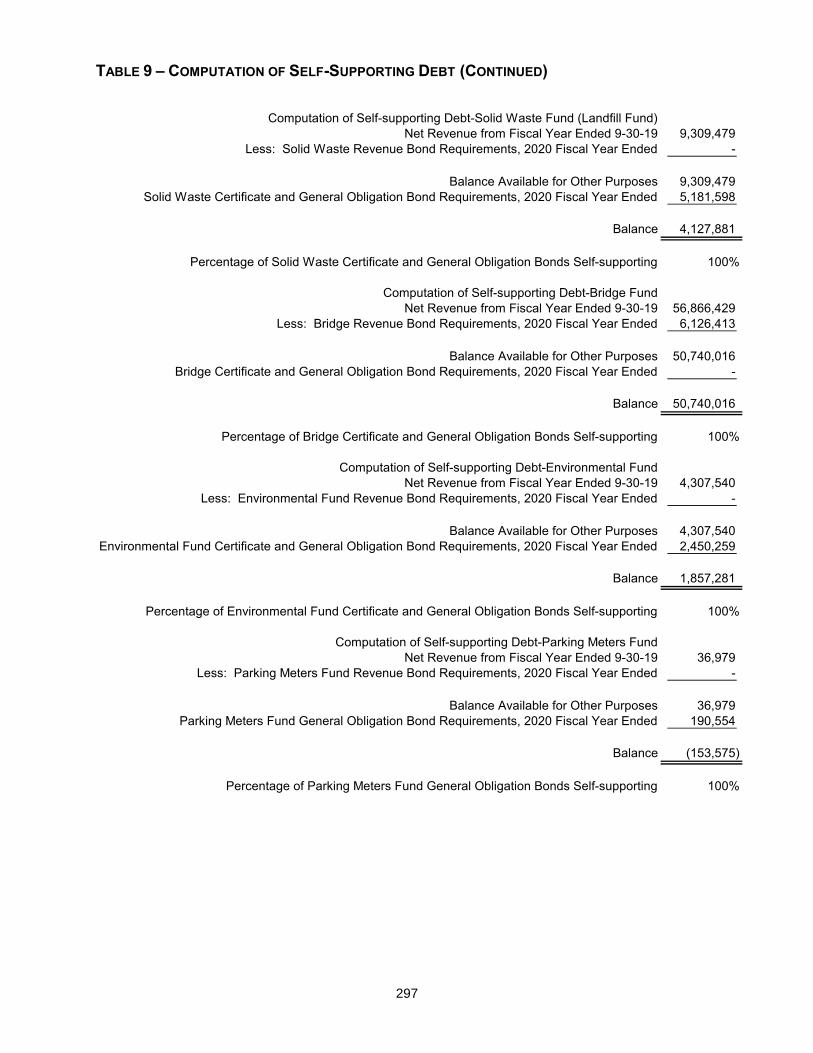
TABLE 9 – COMPUTATION OF SELF-SUPPORTING DEBT (CONTINUED)
Computation of Self-supporting Debt-Solid Waste Fund (Landfill Fund)Net Revenue from Fiscal Year Ended 9-30-19 9,309,479
Less: Solid Waste Revenue Bond Requirements, 2020 Fiscal Year Ended -
Balance Available for Other Purposes 9,309,479 Solid Waste Certificate and General Obligation Bond Requirements, 2020 Fiscal Year Ended 5,181,598
Balance 4,127,881
Percentage of Solid Waste Certificate and General Obligation Bonds Self-supporting 100%
Computation of Self-supporting Debt-Bridge FundNet Revenue from Fiscal Year Ended 9-30-19 56,866,429
Less: Bridge Revenue Bond Requirements, 2020 Fiscal Year Ended 6,126,413
Balance Available for Other Purposes 50,740,016 Bridge Certificate and General Obligation Bond Requirements, 2020 Fiscal Year Ended -
Balance 50,740,016
Percentage of Bridge Certificate and General Obligation Bonds Self-supporting 100%
Computation of Self-supporting Debt-Environmental FundNet Revenue from Fiscal Year Ended 9-30-19 4,307,540
Less: Environmental Fund Revenue Bond Requirements, 2020 Fiscal Year Ended -
Balance Available for Other Purposes 4,307,540 Environmental Fund Certificate and General Obligation Bond Requirements, 2020 Fiscal Year Ended 2,450,259
Balance 1,857,281
Percentage of Environmental Fund Certificate and General Obligation Bonds Self-supporting 100%
Computation of Self-supporting Debt-Parking Meters FundNet Revenue from Fiscal Year Ended 9-30-19 36,979
Less: Parking Meters Fund Revenue Bond Requirements, 2020 Fiscal Year Ended -
Balance Available for Other Purposes 36,979 Parking Meters Fund General Obligation Bond Requirements, 2020 Fiscal Year Ended 190,554
Balance (153,575)
Percentage of Parking Meters Fund General Obligation Bonds Self-supporting 100%
297
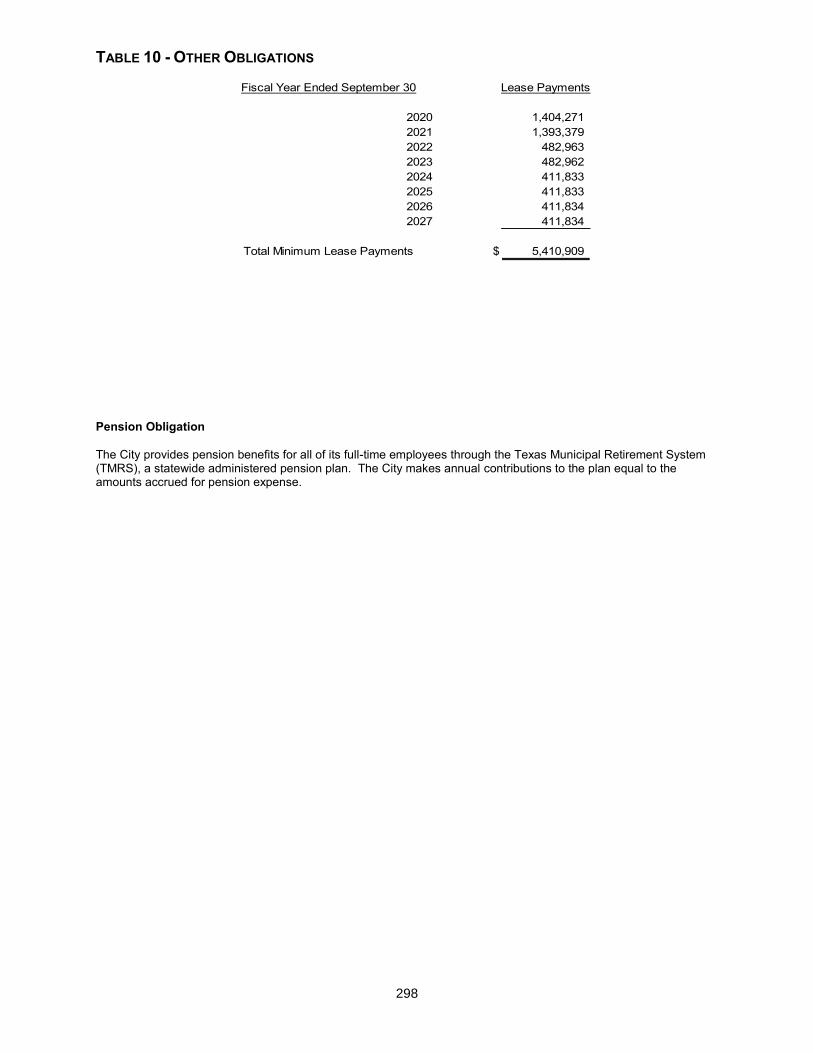
TABLE 10 - OTHER OBLIGATIONS
Pension Obligation The City provides pension benefits for all of its full-time employees through the Texas Municipal Retirement System (TMRS), a statewide administered pension plan. The City makes annual contributions to the plan equal to the amounts accrued for pension expense.
Fiscal Year Ended September 30 Lease Payments
2020 1,404,271 2021 1,393,379 2022 482,963 2023 482,962 2024 411,833 2025 411,833 2026 411,834 2027 411,834
Total Minimum Lease Payments $ 5,410,909
298
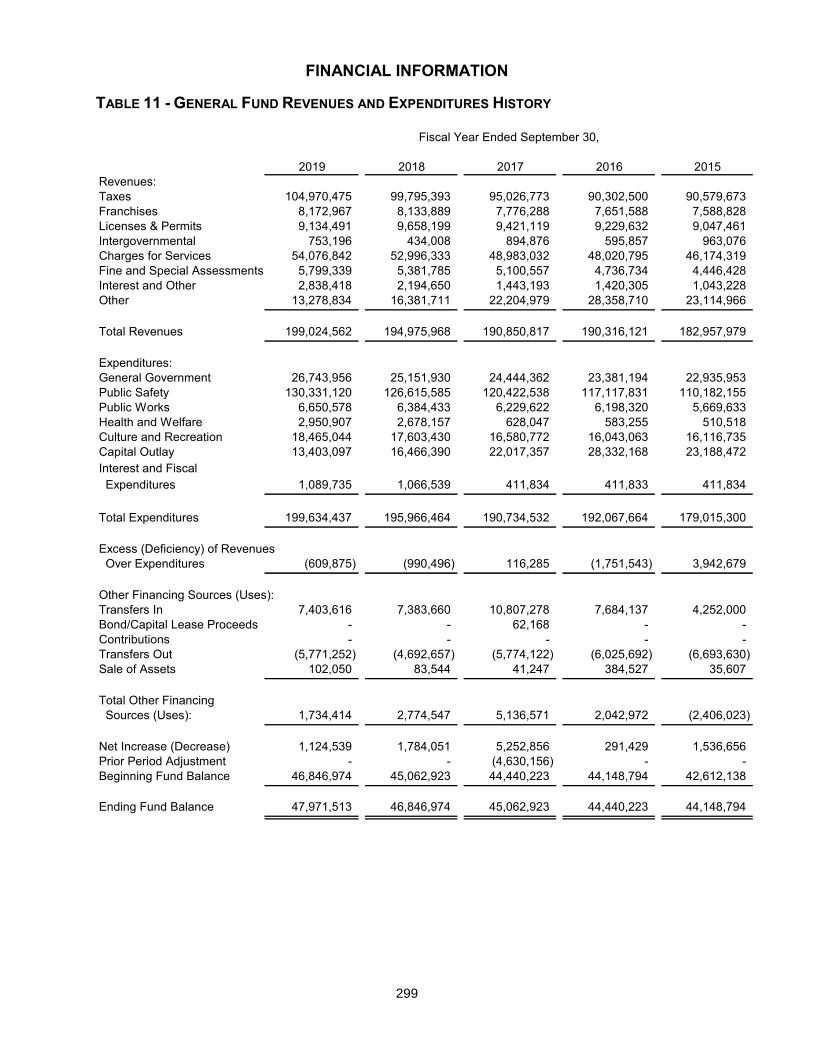
FINANCIAL INFORMATION
TABLE 11 - GENERAL FUND REVENUES AND EXPENDITURES HISTORY
2019 2018 2017 2016 2015Revenues:Taxes 104,970,475 99,795,393 95,026,773 90,302,500 90,579,673 Franchises 8,172,967 8,133,889 7,776,288 7,651,588 7,588,828 Licenses & Permits 9,134,491 9,658,199 9,421,119 9,229,632 9,047,461 Intergovernmental 753,196 434,008 894,876 595,857 963,076 Charges for Services 54,076,842 52,996,333 48,983,032 48,020,795 46,174,319 Fine and Special Assessments 5,799,339 5,381,785 5,100,557 4,736,734 4,446,428 Interest and Other 2,838,418 2,194,650 1,443,193 1,420,305 1,043,228 Other 13,278,834 16,381,711 22,204,979 28,358,710 23,114,966
Total Revenues 199,024,562 194,975,968 190,850,817 190,316,121 182,957,979
Expenditures:General Government 26,743,956 25,151,930 24,444,362 23,381,194 22,935,953 Public Safety 130,331,120 126,615,585 120,422,538 117,117,831 110,182,155 Public Works 6,650,578 6,384,433 6,229,622 6,198,320 5,669,633 Health and Welfare 2,950,907 2,678,157 628,047 583,255 510,518 Culture and Recreation 18,465,044 17,603,430 16,580,772 16,043,063 16,116,735 Capital Outlay 13,403,097 16,466,390 22,017,357 28,332,168 23,188,472 Interest and Fiscal Expenditures 1,089,735 1,066,539 411,834 411,833 411,834
Total Expenditures 199,634,437 195,966,464 190,734,532 192,067,664 179,015,300
Excess (Deficiency) of Revenues Over Expenditures (609,875) (990,496) 116,285 (1,751,543) 3,942,679
Other Financing Sources (Uses):Transfers In 7,403,616 7,383,660 10,807,278 7,684,137 4,252,000 Bond/Capital Lease Proceeds - - 62,168 - - Contributions - - - - - Transfers Out (5,771,252) (4,692,657) (5,774,122) (6,025,692) (6,693,630) Sale of Assets 102,050 83,544 41,247 384,527 35,607
Total Other Financing Sources (Uses): 1,734,414 2,774,547 5,136,571 2,042,972 (2,406,023)
Net Increase (Decrease) 1,124,539 1,784,051 5,252,856 291,429 1,536,656 Prior Period Adjustment - - (4,630,156) - - Beginning Fund Balance 46,846,974 45,062,923 44,440,223 44,148,794 42,612,138
Ending Fund Balance 47,971,513 46,846,974 45,062,923 44,440,223 44,148,794
Fiscal Year Ended September 30,
299
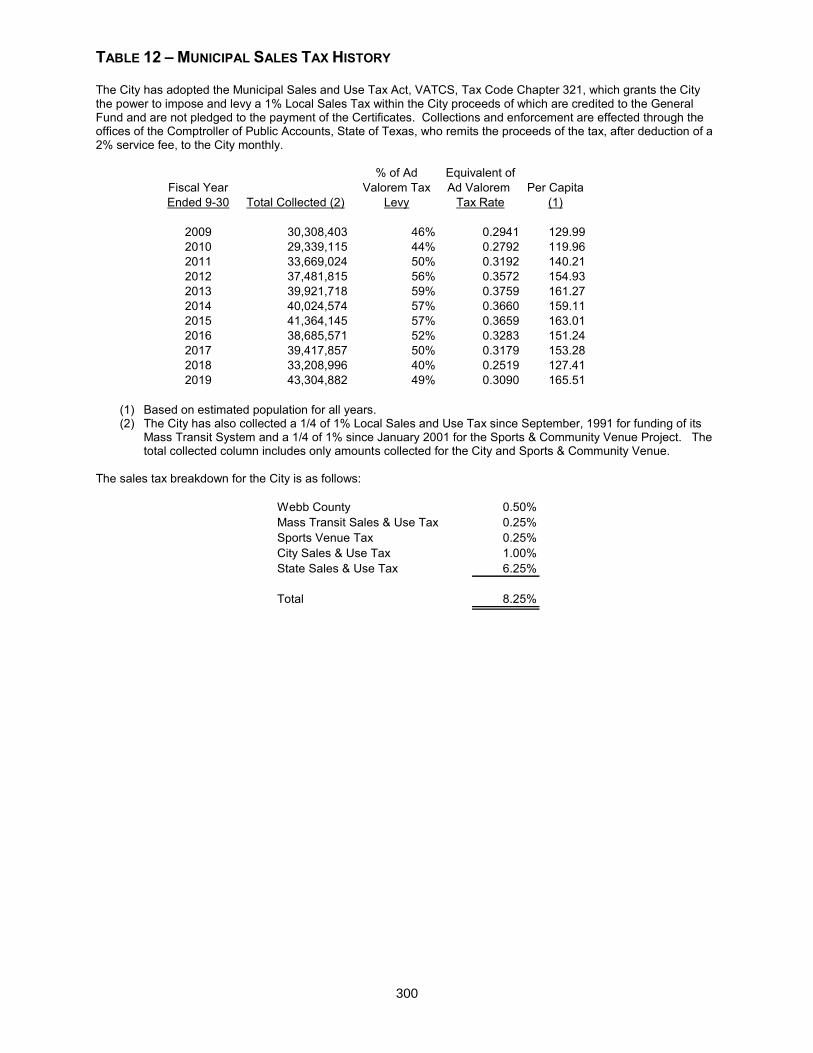
TABLE 12 – MUNICIPAL SALES TAX HISTORY The City has adopted the Municipal Sales and Use Tax Act, VATCS, Tax Code Chapter 321, which grants the City the power to impose and levy a 1% Local Sales Tax within the City proceeds of which are credited to the General Fund and are not pledged to the payment of the Certificates. Collections and enforcement are effected through the offices of the Comptroller of Public Accounts, State of Texas, who remits the proceeds of the tax, after deduction of a 2% service fee, to the City monthly.
% of Ad Equivalent ofFiscal Year Valorem Tax Ad Valorem Per CapitaEnded 9-30 Total Collected (2) Levy Tax Rate (1)
2009 30,308,403 46% 0.2941 129.992010 29,339,115 44% 0.2792 119.962011 33,669,024 50% 0.3192 140.212012 37,481,815 56% 0.3572 154.932013 39,921,718 59% 0.3759 161.272014 40,024,574 57% 0.3660 159.112015 41,364,145 57% 0.3659 163.012016 38,685,571 52% 0.3283 151.242017 39,417,857 50% 0.3179 153.282018 33,208,996 40% 0.2519 127.412019 43,304,882 49% 0.3090 165.51
(1) Based on estimated population for all years. (2) The City has also collected a 1/4 of 1% Local Sales and Use Tax since September, 1991 for funding of its
Mass Transit System and a 1/4 of 1% since January 2001 for the Sports & Community Venue Project. The total collected column includes only amounts collected for the City and Sports & Community Venue.
The sales tax breakdown for the City is as follows:
Webb County 0.50%Mass Transit Sales & Use Tax 0.25%Sports Venue Tax 0.25%City Sales & Use Tax 1.00%State Sales & Use Tax 6.25%
Total 8.25%
300
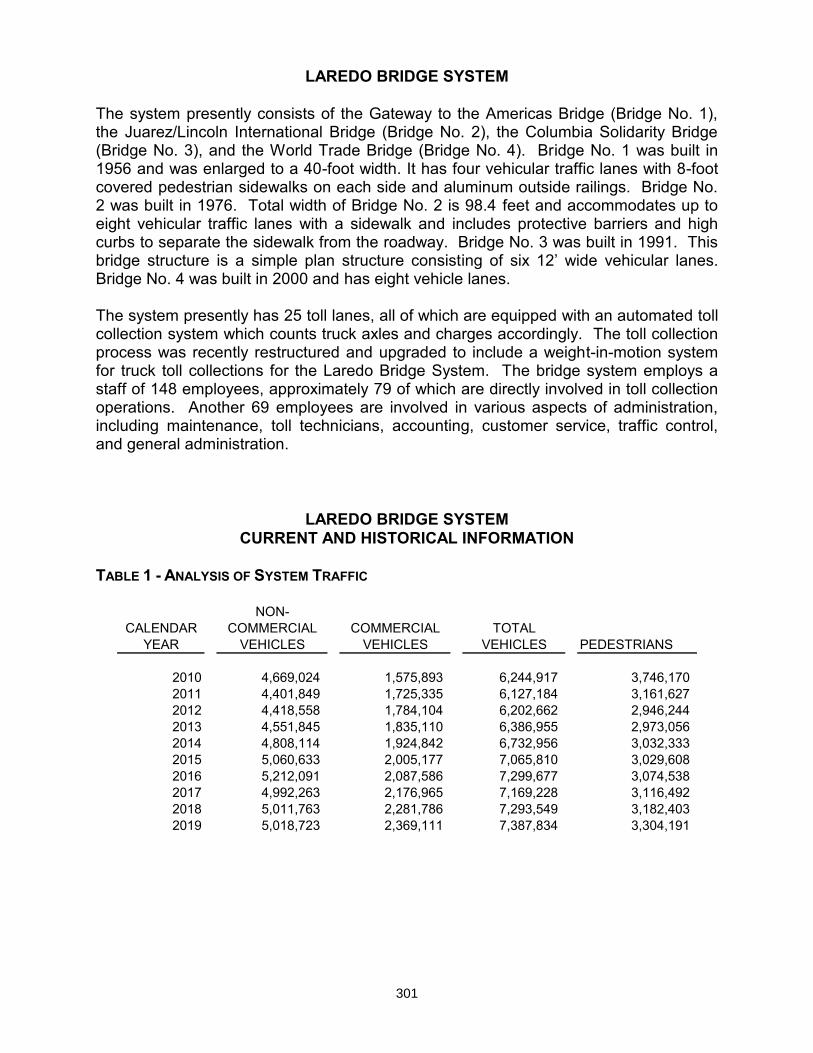
LAREDO BRIDGE SYSTEM
The system presently consists of the Gateway to the Americas Bridge (Bridge No. 1), the Juarez/Lincoln International Bridge (Bridge No. 2), the Columbia Solidarity Bridge (Bridge No. 3), and the World Trade Bridge (Bridge No. 4). Bridge No. 1 was built in 1956 and was enlarged to a 40-foot width. It has four vehicular traffic lanes with 8-foot covered pedestrian sidewalks on each side and aluminum outside railings. Bridge No. 2 was built in 1976. Total width of Bridge No. 2 is 98.4 feet and accommodates up to eight vehicular traffic lanes with a sidewalk and includes protective barriers and high curbs to separate the sidewalk from the roadway. Bridge No. 3 was built in 1991. This bridge structure is a simple plan structure consisting of six 12’ wide vehicular lanes. Bridge No. 4 was built in 2000 and has eight vehicle lanes. The system presently has 25 toll lanes, all of which are equipped with an automated toll collection system which counts truck axles and charges accordingly. The toll collection process was recently restructured and upgraded to include a weight-in-motion system for truck toll collections for the Laredo Bridge System. The bridge system employs a staff of 148 employees, approximately 79 of which are directly involved in toll collection operations. Another 69 employees are involved in various aspects of administration, including maintenance, toll technicians, accounting, customer service, traffic control, and general administration.
LAREDO BRIDGE SYSTEM CURRENT AND HISTORICAL INFORMATION
TABLE 1 - ANALYSIS OF SYSTEM TRAFFIC
NON-CALENDAR COMMERCIAL COMMERCIAL TOTAL
YEAR VEHICLES VEHICLES VEHICLES PEDESTRIANS
2010 4,669,024 1,575,893 6,244,917 3,746,170 2011 4,401,849 1,725,335 6,127,184 3,161,627 2012 4,418,558 1,784,104 6,202,662 2,946,244 2013 4,551,845 1,835,110 6,386,955 2,973,056 2014 4,808,114 1,924,842 6,732,956 3,032,333 2015 5,060,633 2,005,177 7,065,810 3,029,608 2016 5,212,091 2,087,586 7,299,677 3,074,538 2017 4,992,263 2,176,965 7,169,228 3,116,492 2018 5,011,763 2,281,786 7,293,549 3,182,403 2019 5,018,723 2,369,111 7,387,834 3,304,191
301
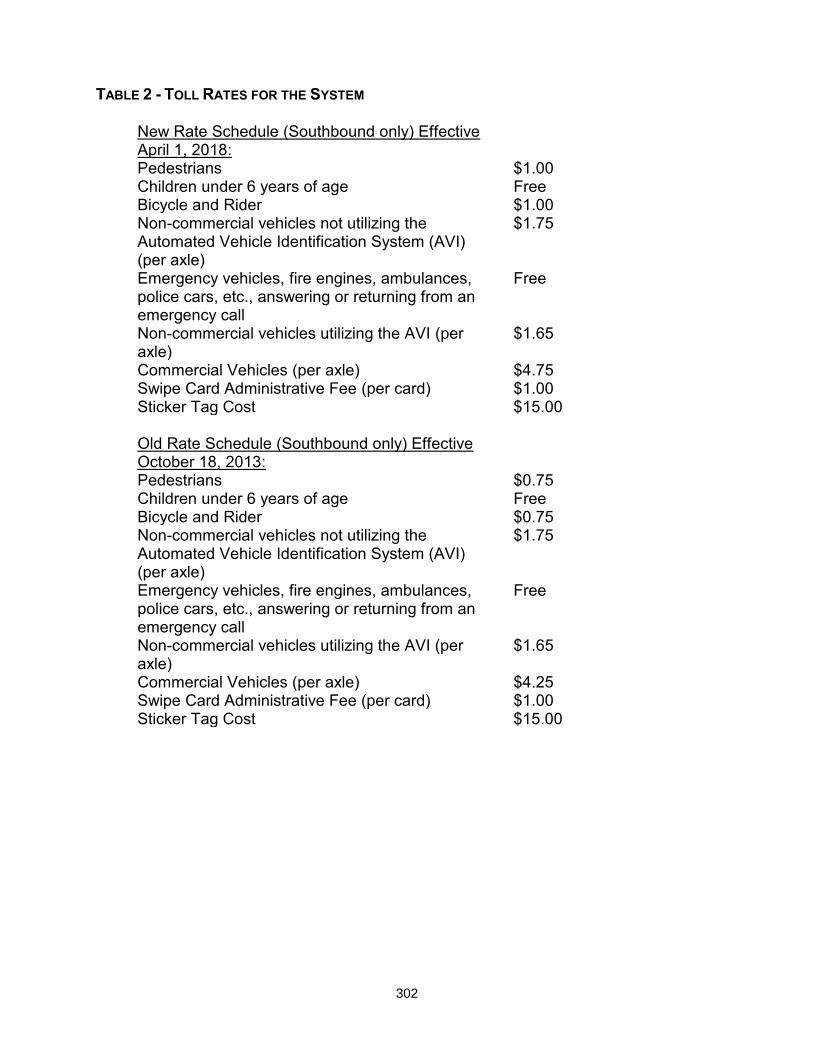
TABLE 2 - TOLL RATES FOR THE SYSTEM
New Rate Schedule (Southbound only) Effective April 1, 2018: Pedestrians $1.00 Children under 6 years of age Free Bicycle and Rider $1.00 Non-commercial vehicles not utilizing the Automated Vehicle Identification System (AVI) (per axle)
$1.75
Emergency vehicles, fire engines, ambulances, police cars, etc., answering or returning from an emergency call
Free
Non-commercial vehicles utilizing the AVI (per axle)
$1.65
Commercial Vehicles (per axle) $4.75 Swipe Card Administrative Fee (per card) $1.00 Sticker Tag Cost $15.00 Old Rate Schedule (Southbound only) Effective October 18, 2013: Pedestrians $0.75 Children under 6 years of age Free Bicycle and Rider $0.75 Non-commercial vehicles not utilizing the Automated Vehicle Identification System (AVI) (per axle)
$1.75
Emergency vehicles, fire engines, ambulances, police cars, etc., answering or returning from an emergency call
Free
Non-commercial vehicles utilizing the AVI (per axle)
$1.65
Commercial Vehicles (per axle) $4.25 Swipe Card Administrative Fee (per card) $1.00 Sticker Tag Cost $15.00
302
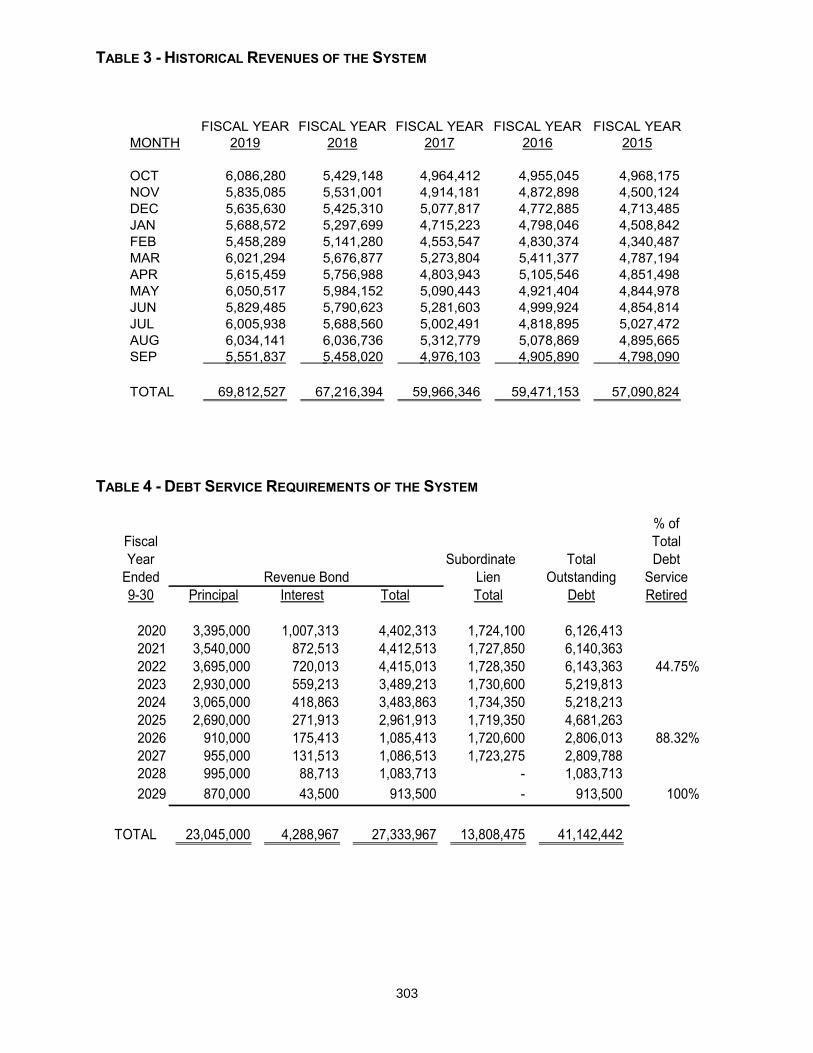
TABLE 3 - HISTORICAL REVENUES OF THE SYSTEM
FISCAL YEAR FISCAL YEAR FISCAL YEAR FISCAL YEAR FISCAL YEARMONTH 2019 2018 2017 2016 2015
OCT 6,086,280 5,429,148 4,964,412 4,955,045 4,968,175 NOV 5,835,085 5,531,001 4,914,181 4,872,898 4,500,124 DEC 5,635,630 5,425,310 5,077,817 4,772,885 4,713,485 JAN 5,688,572 5,297,699 4,715,223 4,798,046 4,508,842 FEB 5,458,289 5,141,280 4,553,547 4,830,374 4,340,487 MAR 6,021,294 5,676,877 5,273,804 5,411,377 4,787,194 APR 5,615,459 5,756,988 4,803,943 5,105,546 4,851,498 MAY 6,050,517 5,984,152 5,090,443 4,921,404 4,844,978 JUN 5,829,485 5,790,623 5,281,603 4,999,924 4,854,814 JUL 6,005,938 5,688,560 5,002,491 4,818,895 5,027,472 AUG 6,034,141 6,036,736 5,312,779 5,078,869 4,895,665 SEP 5,551,837 5,458,020 4,976,103 4,905,890 4,798,090
TOTAL 69,812,527 67,216,394 59,966,346 59,471,153 57,090,824
TABLE 4 - DEBT SERVICE REQUIREMENTS OF THE SYSTEM
% ofFiscal TotalYear Subordinate Total Debt
Ended Lien Outstanding Service9-30 Principal Interest Total Total Debt Retired
2020 3,395,000 1,007,313 4,402,313 1,724,100 6,126,413 2021 3,540,000 872,513 4,412,513 1,727,850 6,140,363 2022 3,695,000 720,013 4,415,013 1,728,350 6,143,363 44.75%2023 2,930,000 559,213 3,489,213 1,730,600 5,219,813 2024 3,065,000 418,863 3,483,863 1,734,350 5,218,213 2025 2,690,000 271,913 2,961,913 1,719,350 4,681,263 2026 910,000 175,413 1,085,413 1,720,600 2,806,013 88.32%2027 955,000 131,513 1,086,513 1,723,275 2,809,788 2028 995,000 88,713 1,083,713 - 1,083,713 2029 870,000 43,500 913,500 - 913,500 100%
TOTAL 23,045,000 4,288,967 27,333,967 13,808,475 41,142,442
Revenue Bond
303
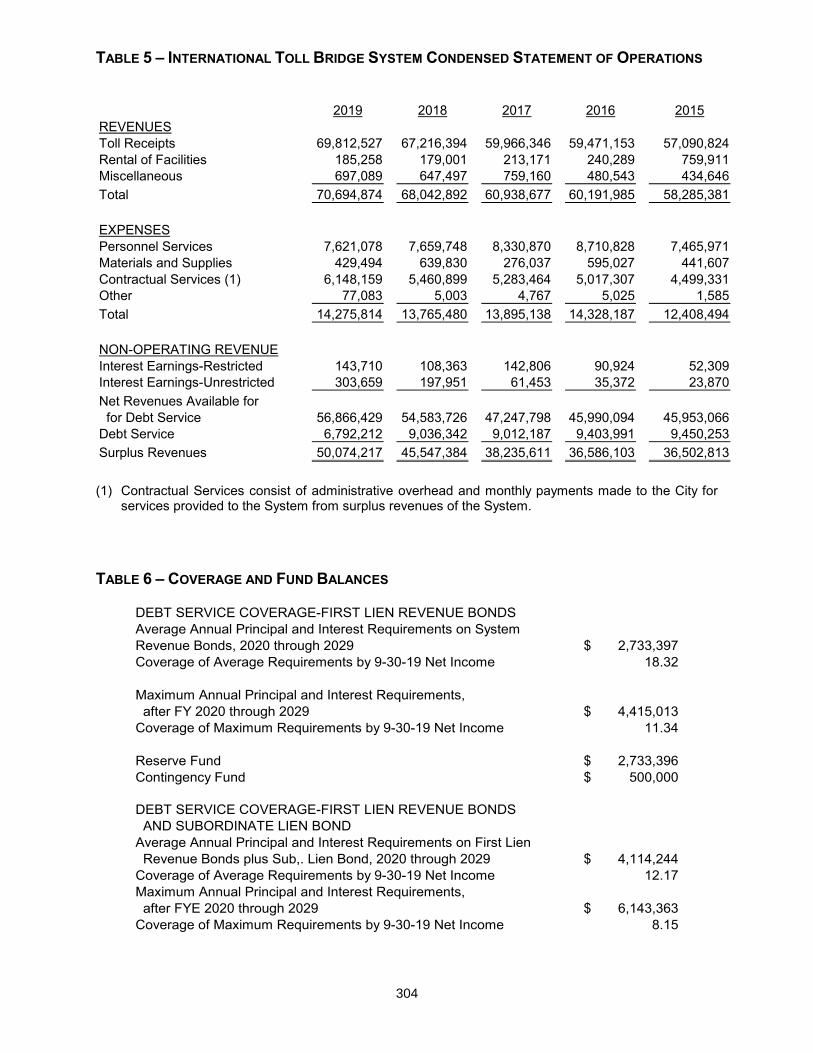
TABLE 5 – INTERNATIONAL TOLL BRIDGE SYSTEM CONDENSED STATEMENT OF OPERATIONS
2019 2018 2017 2016 2015REVENUESToll Receipts 69,812,527 67,216,394 59,966,346 59,471,153 57,090,824 Rental of Facilities 185,258 179,001 213,171 240,289 759,911 Miscellaneous 697,089 647,497 759,160 480,543 434,646 Total 70,694,874 68,042,892 60,938,677 60,191,985 58,285,381
EXPENSESPersonnel Services 7,621,078 7,659,748 8,330,870 8,710,828 7,465,971 Materials and Supplies 429,494 639,830 276,037 595,027 441,607 Contractual Services (1) 6,148,159 5,460,899 5,283,464 5,017,307 4,499,331 Other 77,083 5,003 4,767 5,025 1,585 Total 14,275,814 13,765,480 13,895,138 14,328,187 12,408,494
NON-OPERATING REVENUEInterest Earnings-Restricted 143,710 108,363 142,806 90,924 52,309 Interest Earnings-Unrestricted 303,659 197,951 61,453 35,372 23,870 Net Revenues Available for for Debt Service 56,866,429 54,583,726 47,247,798 45,990,094 45,953,066 Debt Service 6,792,212 9,036,342 9,012,187 9,403,991 9,450,253 Surplus Revenues 50,074,217 45,547,384 38,235,611 36,586,103 36,502,813
(1) Contractual Services consist of administrative overhead and monthly payments made to the City for
services provided to the System from surplus revenues of the System. TABLE 6 – COVERAGE AND FUND BALANCES
DEBT SERVICE COVERAGE-FIRST LIEN REVENUE BONDSAverage Annual Principal and Interest Requirements on SystemRevenue Bonds, 2020 through 2029 $ 2,733,397Coverage of Average Requirements by 9-30-19 Net Income 18.32
Maximum Annual Principal and Interest Requirements, after FY 2020 through 2029 $ 4,415,013Coverage of Maximum Requirements by 9-30-19 Net Income 11.34
Reserve Fund $ 2,733,396Contingency Fund $ 500,000
DEBT SERVICE COVERAGE-FIRST LIEN REVENUE BONDS AND SUBORDINATE LIEN BONDAverage Annual Principal and Interest Requirements on First Lien Revenue Bonds plus Sub,. Lien Bond, 2020 through 2029 $ 4,114,244Coverage of Average Requirements by 9-30-19 Net Income 12.17Maximum Annual Principal and Interest Requirements, after FYE 2020 through 2029 $ 6,143,363Coverage of Maximum Requirements by 9-30-19 Net Income 8.15
304
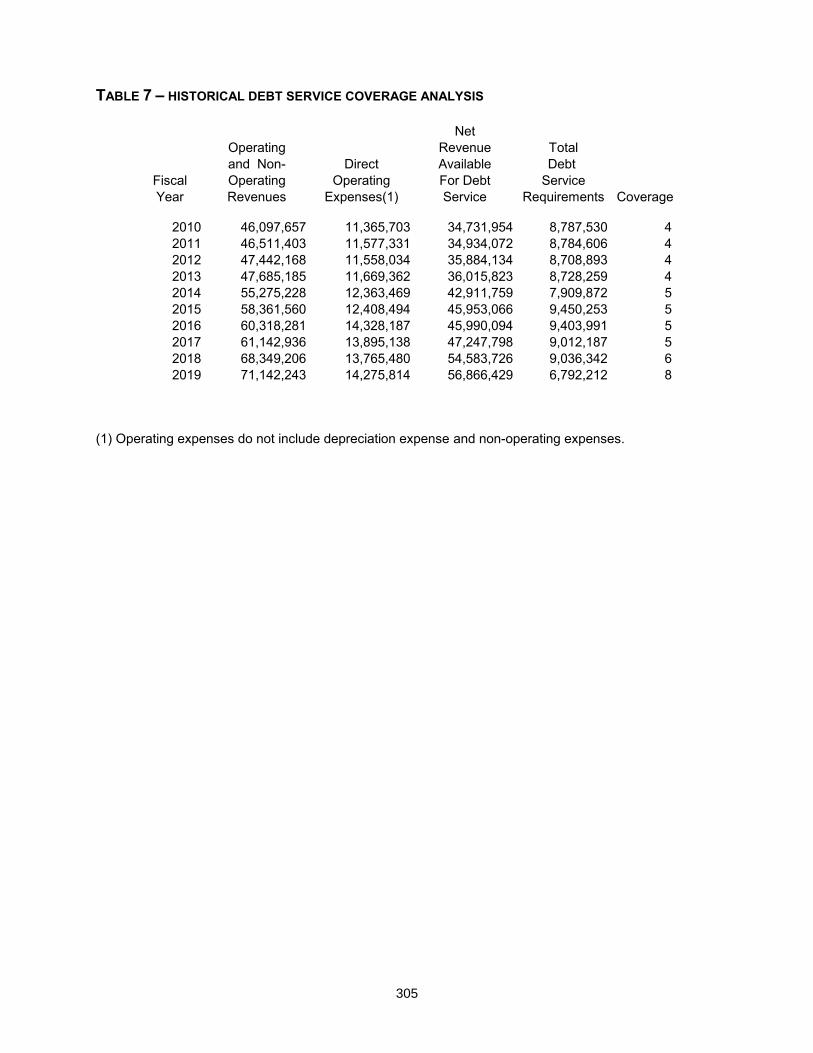
TABLE 7 – HISTORICAL DEBT SERVICE COVERAGE ANALYSIS
NetOperating Revenue Totaland Non- Direct Available Debt
Fiscal Operating Operating For Debt ServiceYear Revenues Expenses(1) Service Requirements Coverage
2010 46,097,657 11,365,703 34,731,954 8,787,530 4 2011 46,511,403 11,577,331 34,934,072 8,784,606 4 2012 47,442,168 11,558,034 35,884,134 8,708,893 4 2013 47,685,185 11,669,362 36,015,823 8,728,259 4 2014 55,275,228 12,363,469 42,911,759 7,909,872 5 2015 58,361,560 12,408,494 45,953,066 9,450,253 5 2016 60,318,281 14,328,187 45,990,094 9,403,991 5 2017 61,142,936 13,895,138 47,247,798 9,012,187 5 2018 68,349,206 13,765,480 54,583,726 9,036,342 6 2019 71,142,243 14,275,814 56,866,429 6,792,212 8
(1) Operating expenses do not include depreciation expense and non-operating expenses.
305
LAREDO INTERNATIONAL AIRPORT DISCLOSURES The City of Laredo International Airport (LRD) encompasses approximately 1,700 acres of which 900 acres are dedicated to aviation for passenger and air cargo terminals, runways, taxiways and aprons, and 800 acres are dedicated for industrial, commercial, retail, institutional, and recreational. The Airport is currently being served by the following scheduled airlines: American Airlines to Dallas/Fort Worth, United Express to Houston Bush Intercontinental, Allegiant Air to Las Vegas, Nevada and seasonally to Orlando, Florida. On average, and the airlines have in total ten (10) daily scheduled round trip flights. A top priority for the Airport is the re-instatement of direct air service to Mexico City and Guadalajara, Mexico. Furthermore, our passenger terminal also houses a full service restaurant, ATM, four car rental companies, Federal Inspection Facility with U.S. Customs (CBP) 24/7 services, and Transportation Security Administration. The airport passenger terminal is master planned to expand from the original three gates with four passenger-boarding bridges. The passenger capacity for the terminal is 600 passengers per hour and the Federal Inspection Station has capacity for 300 passengers per hour. Two (2) scheduled cargo operators and twenty-two (22) charter air cargo companies are currently serving the Airport. Major scheduled service air cargo operators include Federal Express, and UPS Supply Chain Solutions. In terms of all-air cargo activity in 2018, LRD ranking improved to 41st – a 15% increase from previous year. Laredo International Airport is ranked 6th in Texas for Air Cargo. The Laredo International Airport is unique in that it is the only place outside the Republic of Mexico to have an operation of Mexican Customs to pre-inspection Mexico bound air cargo. Whereas, other countries may have passenger pre-clearance, LRD is the only airport worldwide with a cargo pre-inspection. Air cargo shipments to Mexico are expedited, this being an attraction to the Auto Manufacturing, Auto Parts, Electronics / Electrical and Aerospace industries who rely on “just-in-time” delivery of inventory. In April 2014, LRD completed an update of Laredo’s Airport Noise Compatibility Study. Residents within the approved Airport Noise Contours are eligible to participate in the City’s voluntary noise abatement program. This program consists of the following options:
Offer to acquire the fee simple interest, or Offer to soundproof, if feasible, the residential structure in exchange for an aviation easement, or Offer to acquire the aviation easement.
The estimated cost of the airport noise abatement program for the next eight to ten years is $48.0 million, of which the Federal Aviation Administration (FAA), under the current program, would fund 90% of the program cost. Currently, the Laredo International Airport is in the process of conducting a new Noise Compatibility Study to determine if contours have changed. Study funded 90% from FAA and 10% local match. Projects for 2019 include, but not limited to, Cargo Apron Phase 11 & 12 construction, Cargo Apron Phase 13 Design, and FAR Part 150 Noise Abatement Program. Subject to Federal Aviation Administration (FAA) and Congressional funding; projects planned over the next years involve:
Rehabilitate Cargo Apron Phase 14: Project CY2020 Construct Taxiways T1 and T2: Project CY2021 Construct Taxiways T4, H1, and H2: Project CY 2022 Construct Taxiways T3 and T5: Project CY2023
306
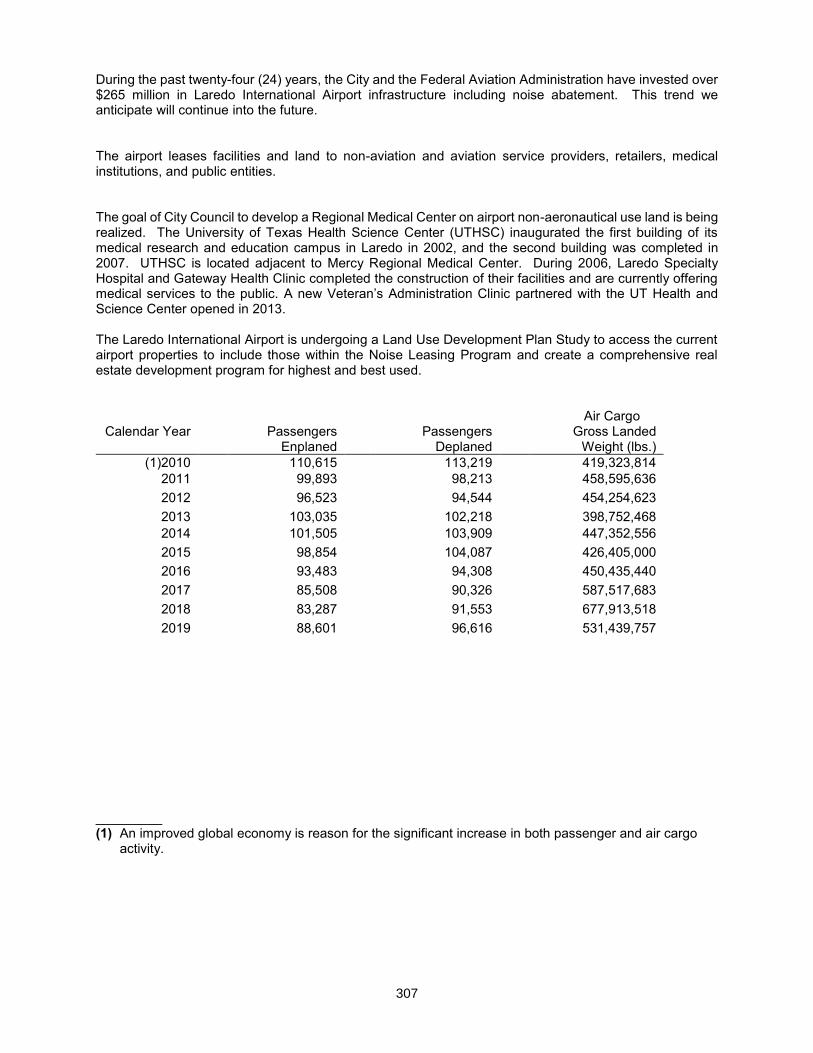
During the past twenty-four (24) years, the City and the Federal Aviation Administration have invested over $265 million in Laredo International Airport infrastructure including noise abatement. This trend we anticipate will continue into the future. The airport leases facilities and land to non-aviation and aviation service providers, retailers, medical institutions, and public entities. The goal of City Council to develop a Regional Medical Center on airport non-aeronautical use land is being realized. The University of Texas Health Science Center (UTHSC) inaugurated the first building of its medical research and education campus in Laredo in 2002, and the second building was completed in 2007. UTHSC is located adjacent to Mercy Regional Medical Center. During 2006, Laredo Specialty Hospital and Gateway Health Clinic completed the construction of their facilities and are currently offering medical services to the public. A new Veteran’s Administration Clinic partnered with the UT Health and Science Center opened in 2013. The Laredo International Airport is undergoing a Land Use Development Plan Study to access the current airport properties to include those within the Noise Leasing Program and create a comprehensive real estate development program for highest and best used.
Air Cargo
_________ (1) An improved global economy is reason for the significant increase in both passenger and air cargo
activity.
Calendar Year Passengers Enplaned
Passengers Deplaned
Gross Landed Weight (lbs.)
(1)2010 110,615 113,219 419,323,814 2011 99,893 98,213 458,595,636 2012 96,523 94,544 454,254,623 2013 103,035 102,218 398,752,468 2014 101,505 103,909 447,352,556 2015 98,854 104,087 426,405,000 2016 93,483 94,308 450,435,440 2017 85,508 90,326 587,517,683 2018 83,287 91,553 677,913,518 2019 88,601 96,616 531,439,757
307
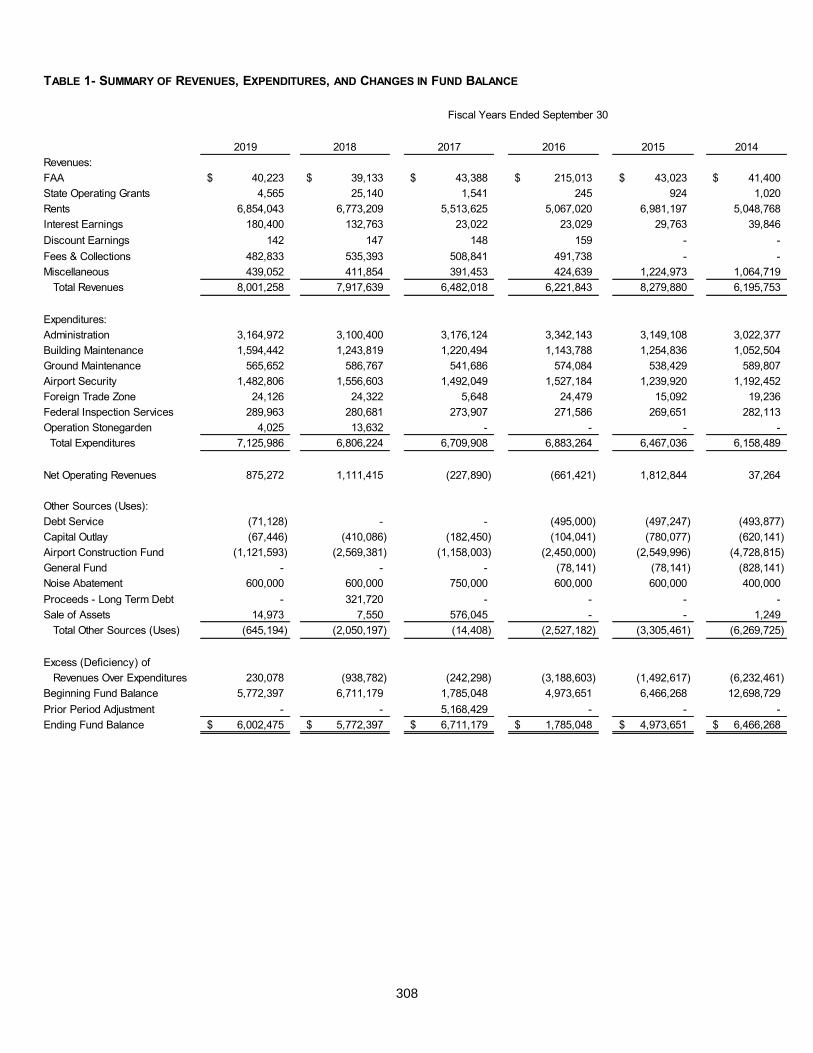
TABLE 1- SUMMARY OF REVENUES, EXPENDITURES, AND CHANGES IN FUND BALANCE
2019 2018 2017 2016 2015 2014Revenues:FAA 40,223$ 39,133$ 43,388$ 215,013$ 43,023$ 41,400$ State Operating Grants 4,565 25,140 1,541 245 924 1,020 Rents 6,854,043 6,773,209 5,513,625 5,067,020 6,981,197 5,048,768 Interest Earnings 180,400 132,763 23,022 23,029 29,763 39,846 Discount Earnings 142 147 148 159 - - Fees & Collections 482,833 535,393 508,841 491,738 - - Miscellaneous 439,052 411,854 391,453 424,639 1,224,973 1,064,719 Total Revenues 8,001,258 7,917,639 6,482,018 6,221,843 8,279,880 6,195,753
Expenditures:Administration 3,164,972 3,100,400 3,176,124 3,342,143 3,149,108 3,022,377 Building Maintenance 1,594,442 1,243,819 1,220,494 1,143,788 1,254,836 1,052,504 Ground Maintenance 565,652 586,767 541,686 574,084 538,429 589,807 Airport Security 1,482,806 1,556,603 1,492,049 1,527,184 1,239,920 1,192,452 Foreign Trade Zone 24,126 24,322 5,648 24,479 15,092 19,236 Federal Inspection Services 289,963 280,681 273,907 271,586 269,651 282,113 Operation Stonegarden 4,025 13,632 - - - - Total Expenditures 7,125,986 6,806,224 6,709,908 6,883,264 6,467,036 6,158,489
Net Operating Revenues 875,272 1,111,415 (227,890) (661,421) 1,812,844 37,264
Other Sources (Uses):Debt Service (71,128) - - (495,000) (497,247) (493,877) Capital Outlay (67,446) (410,086) (182,450) (104,041) (780,077) (620,141) Airport Construction Fund (1,121,593) (2,569,381) (1,158,003) (2,450,000) (2,549,996) (4,728,815) General Fund - - - (78,141) (78,141) (828,141) Noise Abatement 600,000 600,000 750,000 600,000 600,000 400,000 Proceeds - Long Term Debt - 321,720 - - - - Sale of Assets 14,973 7,550 576,045 - - 1,249 Total Other Sources (Uses) (645,194) (2,050,197) (14,408) (2,527,182) (3,305,461) (6,269,725)
Excess (Deficiency) of Revenues Over Expenditures 230,078 (938,782) (242,298) (3,188,603) (1,492,617) (6,232,461) Beginning Fund Balance 5,772,397 6,711,179 1,785,048 4,973,651 6,466,268 12,698,729 Prior Period Adjustment - - 5,168,429 - - - Ending Fund Balance 6,002,475$ 5,772,397$ 6,711,179$ 1,785,048$ 4,973,651$ 6,466,268$
Fiscal Years Ended September 30
308
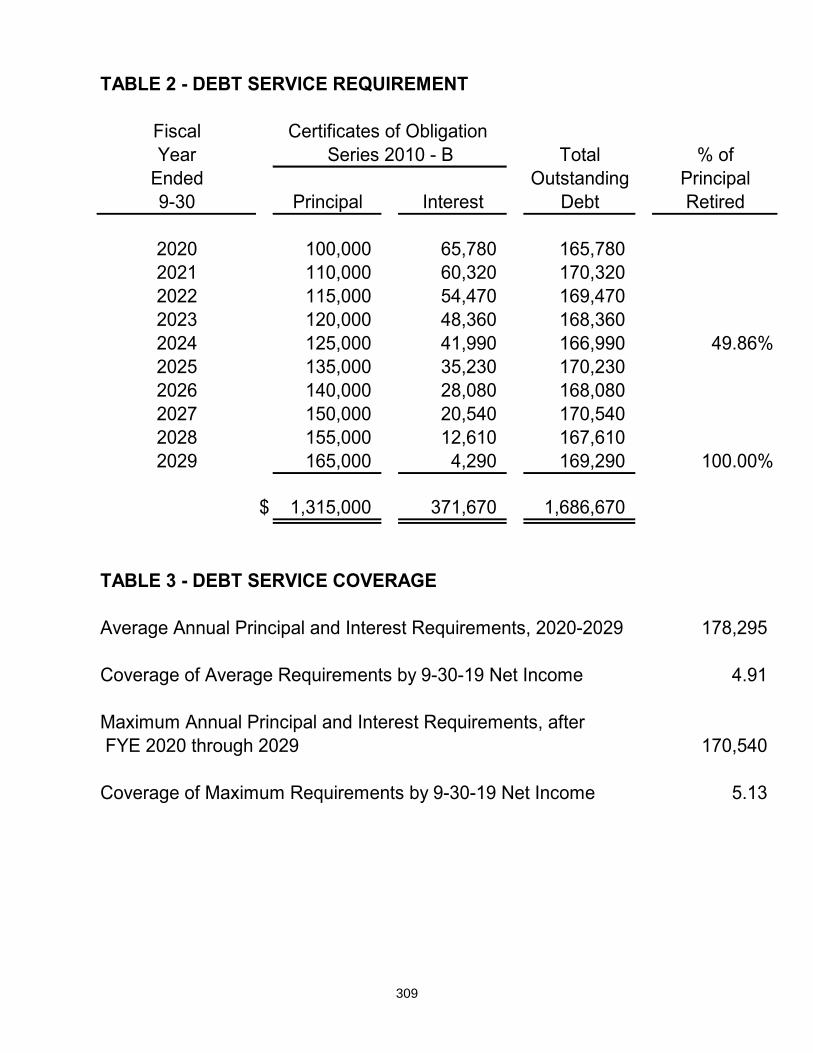
TABLE 2 - DEBT SERVICE REQUIREMENT
FiscalYear Total % of
Ended Outstanding Principal9-30 Principal Interest Debt Retired
2020 100,000 65,780 165,780 2021 110,000 60,320 170,320 2022 115,000 54,470 169,470 2023 120,000 48,360 168,360 2024 125,000 41,990 166,990 49.86%2025 135,000 35,230 170,230 2026 140,000 28,080 168,080 2027 150,000 20,540 170,540 2028 155,000 12,610 167,610 2029 165,000 4,290 169,290 100.00%
$ 1,315,000 371,670 1,686,670
TABLE 3 - DEBT SERVICE COVERAGE
Average Annual Principal and Interest Requirements, 2020-2029 178,295
Coverage of Average Requirements by 9-30-19 Net Income 4.91
Maximum Annual Principal and Interest Requirements, after FYE 2020 through 2029 170,540
Coverage of Maximum Requirements by 9-30-19 Net Income 5.13
Series 2010 - BCertificates of Obligation
309

THE 2019 UTILITY SYSTEM WATER SUPPLY The City of Laredo uses surface water from the Rio Grande River as its source of raw water. The two plants in the City of Laredo are the Jefferson Water Treatment Plant 65 MGD and El Pico Water Treatment Plant 20 MGD for a combined capacity of 85 MGD. The average daily consumption during fiscal year 2019 was approximately 33.77 million gallons per day and peak demand for fiscal year 2019 was 53.43 million gallons per day. Connections to the water system as of September 30, 2019 were 74,097. The monthly average of meters read is 73,512. The average number of service calls per month is 12,598 for a FY 2018-19 total of 151,181. Currently, the system consists of approximately 1,119 miles of transmission and distribution lines and 8,120 fire hydrants. The City of Laredo owns approximately 62,009 acre-feet of municipal water rights. The Jefferson Water Treatment Plant has two separate river intakes, two separate river pump structures and related multiple pump units. The lower treatment plant was closed down in 2013. The electrical system includes an underground electrical power distribution system, including three electrical buildings housing motor control centers. The Supervisory Control and Date Acquisition (SCADA) system combined with magnetic flow meters and motors operated valves allow increased precision in chemical addition for reduced operating costs. The traveling water screens, flocculators, re-lift pumps and five clarifiers provide more reliable hydraulic capacity. Twelve gravity filters allow the facility to respond to wide variations in river water turbidity. The two high service pump stations and three clear wells provide a uniform water system pressure. The actual process and electrical system enhance the reliability of the treatment process. El Pico Water Treatment Plant was put into operation on April 2015. El Pico Water Treatment Plant consists of raw water intake followed by the raw water pump station, rapid mix, flocculation, sedimentation, filtration, filter building, backwash pumping, backwash equalization, backwash clarifier, intermediate pumping, clearwell, high service pump station, sludge thickener, sludge holding tank, sludge dewatering, dewatering building, chemical building, chemical feed and bulk storage, administration building, effluent transmission main, electrical and instrumentation, including the SCADA control. In 1957, the City of Laredo entered into an agreement with Webb County to use Lake Casa Blanca Reservoir as off-channel storage for emergency use. This reservoir has an impoundment capacity of 77,800 acre feet at top of the dam, 58,600 acre feet at maximum pool, (PMF – Probable Maximum Feet) of which 20,000 acre feet are reserved for emergency use. This agreement is still in effect. WASTEWATER SYSTEM The City of Laredo owns and operates six wastewater treatment plants, which have a combined total design capacity of 35.213 million gallons per day ("MGD"). The pounds of Biochemical Oxygen demand (BOD) treated is 12,480,626 by all six wastewater treatment plants and a Total Bio-Solids disposal cost of $878,302. The Sewer System includes approximately 785 miles of sewer lines and 71 lift stations. The average daily treatment is 18.449 MGD with 68,753 connections as of September 30, 2019. 310
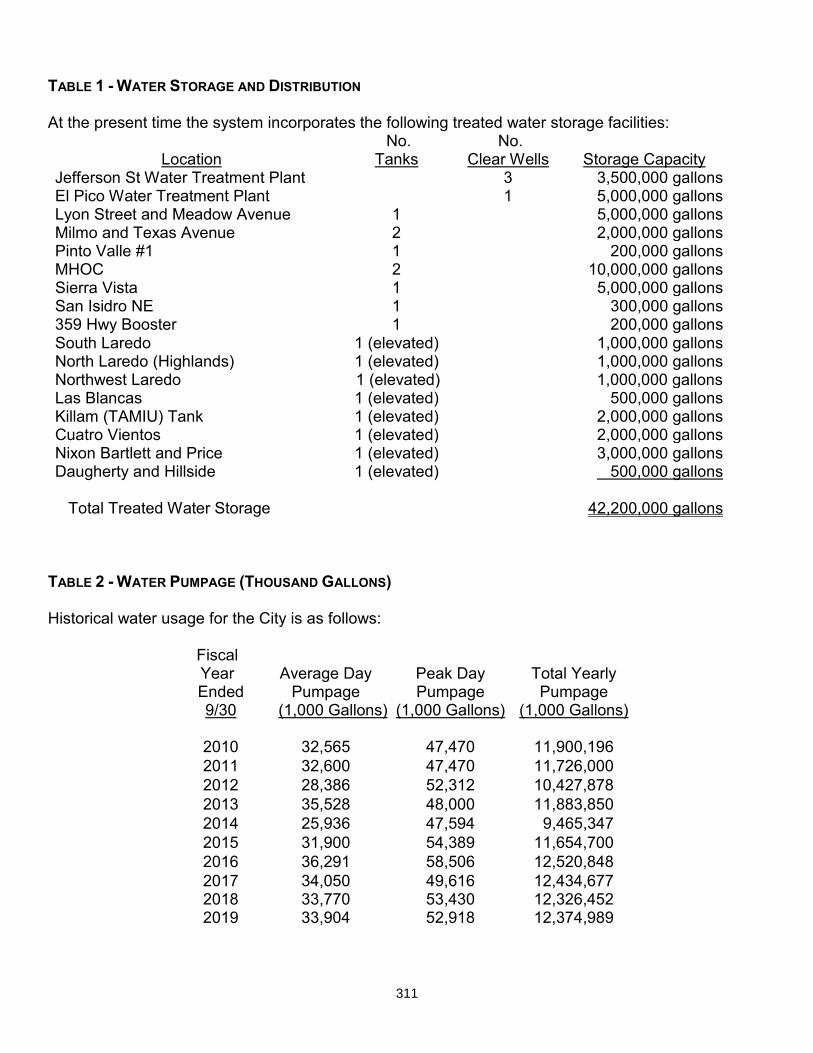
TABLE 1 - WATER STORAGE AND DISTRIBUTION At the present time the system incorporates the following treated water storage facilities:
Location
No. Tanks
No. Clear Wells
Storage Capacity
Jefferson St Water Treatment Plant El Pico Water Treatment Plant
3 1
3,500,000 gallons 5,000,000 gallons
Lyon Street and Meadow Avenue 1 5,000,000 gallons Milmo and Texas Avenue 2 2,000,000 gallons Pinto Valle #1 1 200,000 gallons MHOC 2 10,000,000 gallons Sierra Vista 1 5,000,000 gallons San Isidro NE 1 300,000 gallons 359 Hwy Booster 1 200,000 gallons South Laredo 1 (elevated) 1,000,000 gallons North Laredo (Highlands) 1 (elevated) 1,000,000 gallons Northwest Laredo 1 (elevated) 1,000,000 gallons Las Blancas 1 (elevated) 500,000 gallons Killam (TAMIU) Tank 1 (elevated) 2,000,000 gallons Cuatro Vientos 1 (elevated) 2,000,000 gallons Nixon Bartlett and Price Daugherty and Hillside
1 (elevated) 1 (elevated)
3,000,000 gallons 500,000 gallons
Total Treated Water Storage 42,200,000 gallons
TABLE 2 - WATER PUMPAGE (THOUSAND GALLONS) Historical water usage for the City is as follows:
Fiscal Year Ended 9/30
Average Day Pumpage
(1,000 Gallons)
Peak Day Pumpage
(1,000 Gallons)
Total Yearly Pumpage
(1,000 Gallons)
2010 32,565 47,470 11,900,196 2011 32,600 47,470 11,726,000 2012 28,386 52,312 10,427,878 2013 35,528 48,000 11,883,850 2014 25,936 47,594 9,465,347 2015 31,900 54,389 11,654,700 2016 36,291 58,506 12,520,848 2017 2018 2019
34,050 33,770 33,904
49,616 53,430 52,918
12,434,677 12,326,452 12,374,989
311
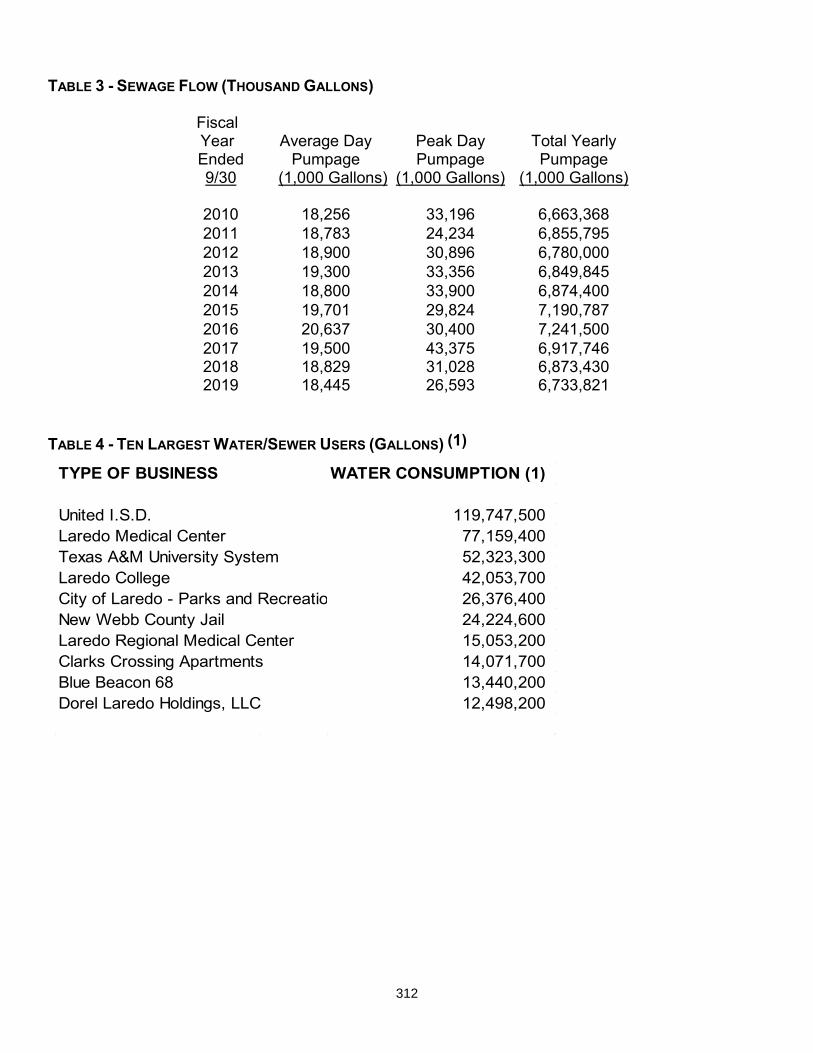
TABLE 3 - SEWAGE FLOW (THOUSAND GALLONS)
Fiscal Year Ended 9/30
Average Day Pumpage
(1,000 Gallons)
Peak Day Pumpage
(1,000 Gallons)
Total Yearly Pumpage
(1,000 Gallons)
2010 18,256 33,196 6,663,368 2011 18,783 24,234 6,855,795 2012 18,900 30,896 6,780,000 2013 19,300 33,356 6,849,845 2014 18,800 33,900 6,874,400 2015 19,701 29,824 7,190,787 2016 20,637 30,400 7,241,500 2017 2018 2019
19,500 18,829 18,445
43,375 31,028 26,593
6,917,746 6,873,430 6,733,821
TABLE 4 - TEN LARGEST WATER/SEWER USERS (GALLONS) (1)
TYPE OF BUSINESS WATER CONSUMPTION (1)
United I.S.D. 119,747,500 Laredo Medical Center 77,159,400 Texas A&M University System 52,323,300 Laredo College 42,053,700 City of Laredo - Parks and Recreation 26,376,400 New Webb County Jail 24,224,600 Laredo Regional Medical Center 15,053,200 Clarks Crossing Apartments 14,071,700 Blue Beacon 68 13,440,200 Dorel Laredo Holdings, LLC 12,498,200
312
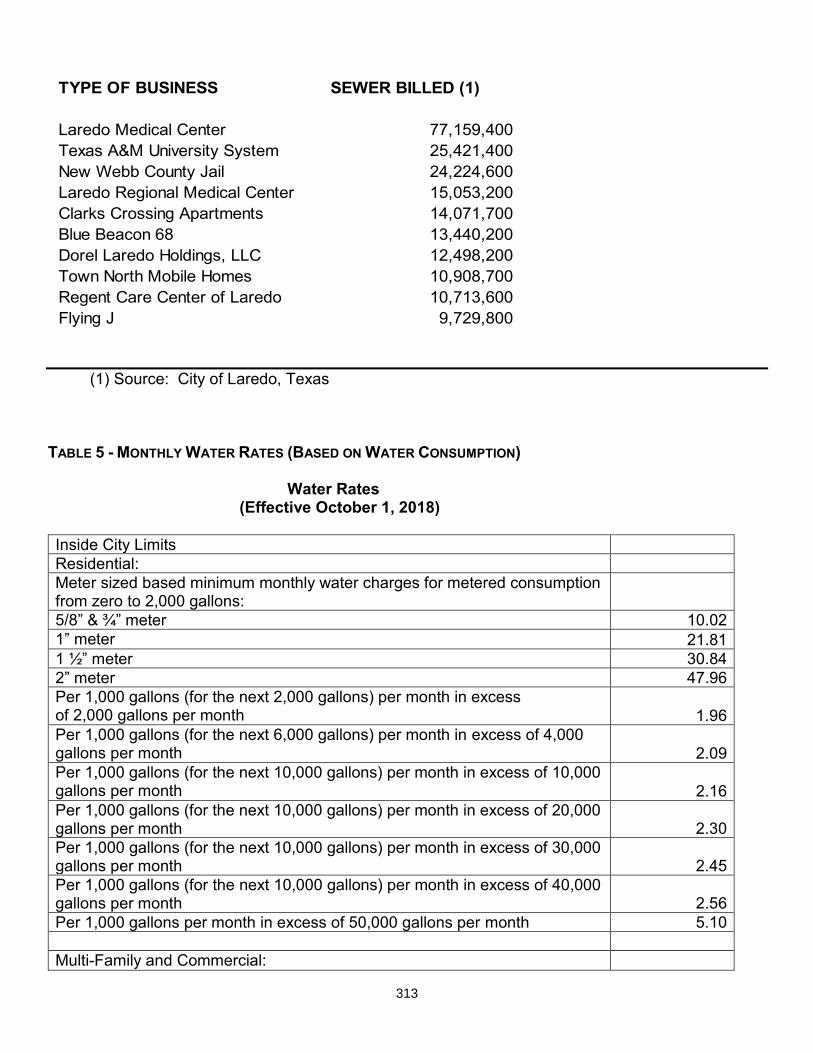
TYPE OF BUSINESS SEWER BILLED (1)
Laredo Medical Center 77,159,400 Texas A&M University System 25,421,400 New Webb County Jail 24,224,600 Laredo Regional Medical Center 15,053,200 Clarks Crossing Apartments 14,071,700 Blue Beacon 68 13,440,200 Dorel Laredo Holdings, LLC 12,498,200 Town North Mobile Homes 10,908,700 Regent Care Center of Laredo 10,713,600 Flying J 9,729,800
n
(1) Source: City of Laredo, Texas
TABLE 5 - MONTHLY WATER RATES (BASED ON WATER CONSUMPTION)
Water Rates (Effective October 1, 2018)
Inside City Limits Residential: Meter sized based minimum monthly water charges for metered consumption from zero to 2,000 gallons: 5/8” & ¾” meter 10.02 1” meter 21.81 1 ½” meter 30.84 2” meter 47.96 Per 1,000 gallons (for the next 2,000 gallons) per month in excess of 2,000 gallons per month 1.96 Per 1,000 gallons (for the next 6,000 gallons) per month in excess of 4,000 gallons per month 2.09 Per 1,000 gallons (for the next 10,000 gallons) per month in excess of 10,000 gallons per month 2.16 Per 1,000 gallons (for the next 10,000 gallons) per month in excess of 20,000 gallons per month 2.30 Per 1,000 gallons (for the next 10,000 gallons) per month in excess of 30,000 gallons per month 2.45 Per 1,000 gallons (for the next 10,000 gallons) per month in excess of 40,000 gallons per month 2.56 Per 1,000 gallons per month in excess of 50,000 gallons per month 5.10 Multi-Family and Commercial:
313
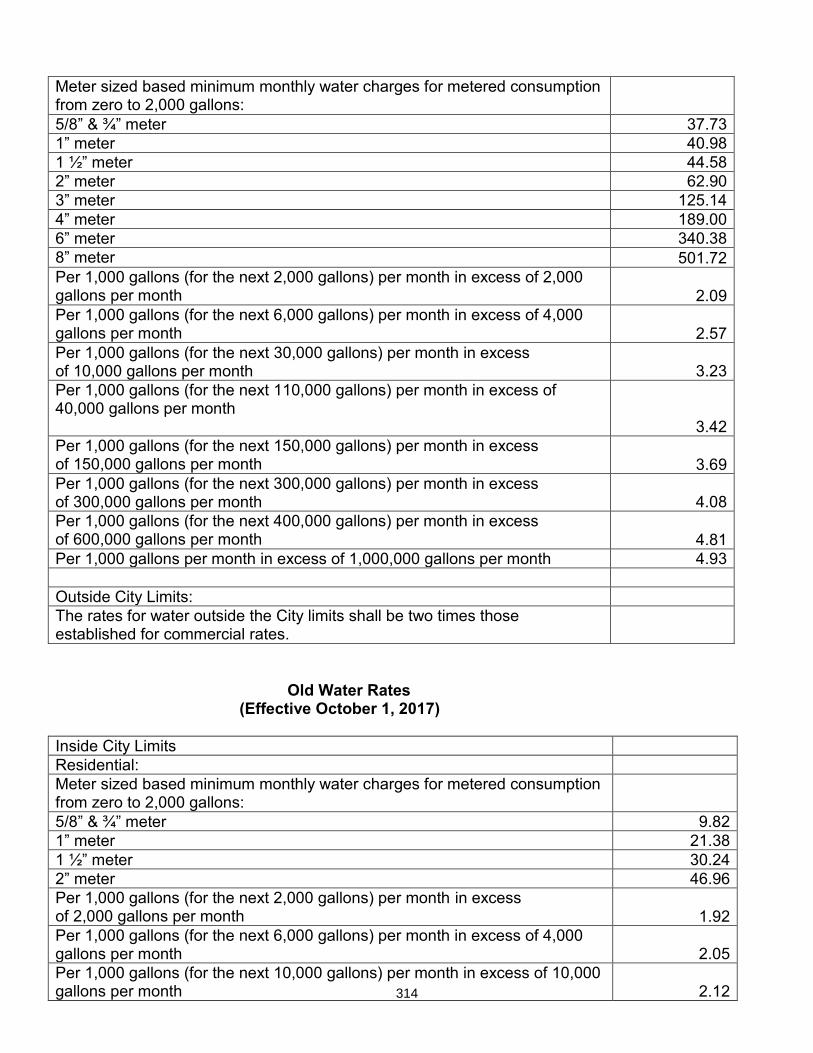
Meter sized based minimum monthly water charges for metered consumption from zero to 2,000 gallons: 5/8” & ¾” meter 37.73 1” meter 40.98 1 ½” meter 44.58 2” meter 62.90 3” meter 125.14 4” meter 189.00 6” meter 340.38 8” meter 501.72 Per 1,000 gallons (for the next 2,000 gallons) per month in excess of 2,000 gallons per month 2.09 Per 1,000 gallons (for the next 6,000 gallons) per month in excess of 4,000 gallons per month 2.57 Per 1,000 gallons (for the next 30,000 gallons) per month in excess of 10,000 gallons per month 3.23 Per 1,000 gallons (for the next 110,000 gallons) per month in excess of 40,000 gallons per month 3.42 Per 1,000 gallons (for the next 150,000 gallons) per month in excess of 150,000 gallons per month 3.69 Per 1,000 gallons (for the next 300,000 gallons) per month in excess of 300,000 gallons per month 4.08 Per 1,000 gallons (for the next 400,000 gallons) per month in excess of 600,000 gallons per month 4.81 Per 1,000 gallons per month in excess of 1,000,000 gallons per month 4.93 Outside City Limits: The rates for water outside the City limits shall be two times those established for commercial rates.
Old Water Rates (Effective October 1, 2017)
Inside City Limits Residential: Meter sized based minimum monthly water charges for metered consumption from zero to 2,000 gallons: 5/8” & ¾” meter 9.82 1” meter 21.38 1 ½” meter 30.24 2” meter 46.96 Per 1,000 gallons (for the next 2,000 gallons) per month in excess of 2,000 gallons per month 1.92 Per 1,000 gallons (for the next 6,000 gallons) per month in excess of 4,000 gallons per month 2.05 Per 1,000 gallons (for the next 10,000 gallons) per month in excess of 10,000 gallons per month 2.12 314
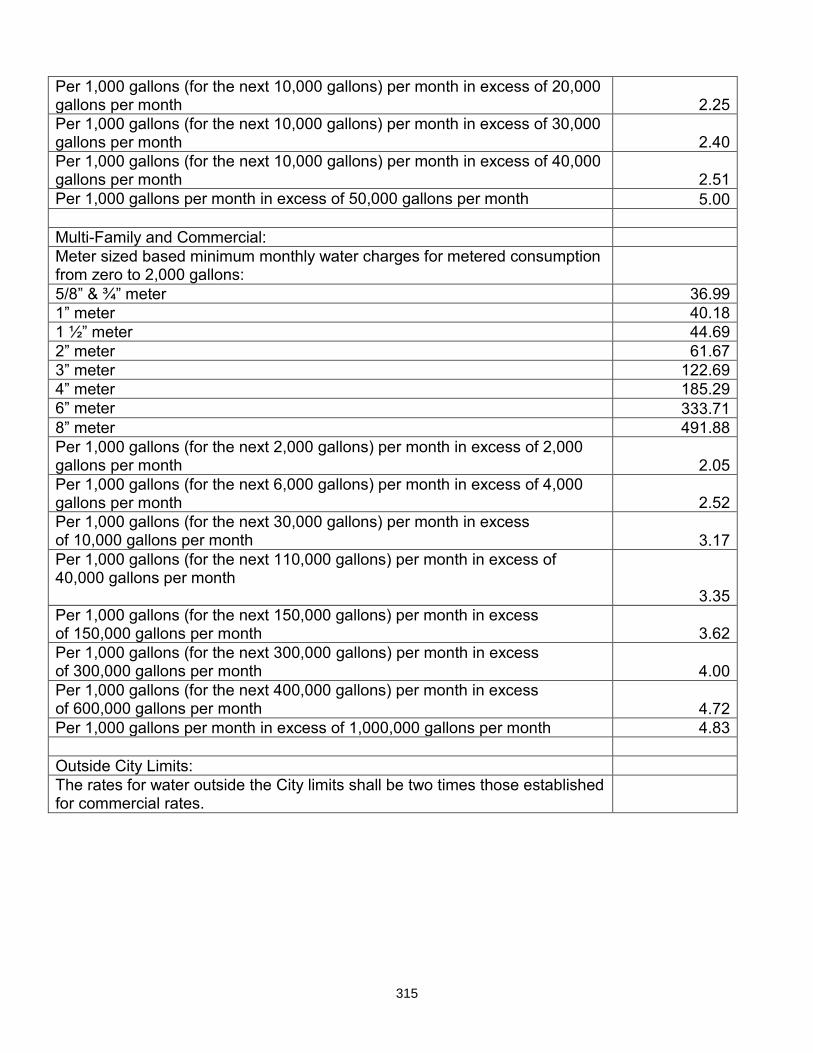
Per 1,000 gallons (for the next 10,000 gallons) per month in excess of 20,000 gallons per month 2.25 Per 1,000 gallons (for the next 10,000 gallons) per month in excess of 30,000 gallons per month 2.40 Per 1,000 gallons (for the next 10,000 gallons) per month in excess of 40,000 gallons per month 2.51 Per 1,000 gallons per month in excess of 50,000 gallons per month 5.00 Multi-Family and Commercial: Meter sized based minimum monthly water charges for metered consumption from zero to 2,000 gallons: 5/8” & ¾” meter 36.99 1” meter 40.18 1 ½” meter 44.69 2” meter 61.67 3” meter 122.69 4” meter 185.29 6” meter 333.71 8” meter 491.88 Per 1,000 gallons (for the next 2,000 gallons) per month in excess of 2,000 gallons per month 2.05 Per 1,000 gallons (for the next 6,000 gallons) per month in excess of 4,000 gallons per month 2.52 Per 1,000 gallons (for the next 30,000 gallons) per month in excess of 10,000 gallons per month 3.17 Per 1,000 gallons (for the next 110,000 gallons) per month in excess of 40,000 gallons per month 3.35 Per 1,000 gallons (for the next 150,000 gallons) per month in excess of 150,000 gallons per month 3.62 Per 1,000 gallons (for the next 300,000 gallons) per month in excess of 300,000 gallons per month 4.00 Per 1,000 gallons (for the next 400,000 gallons) per month in excess of 600,000 gallons per month 4.72 Per 1,000 gallons per month in excess of 1,000,000 gallons per month 4.83 Outside City Limits: The rates for water outside the City limits shall be two times those established for commercial rates.
315
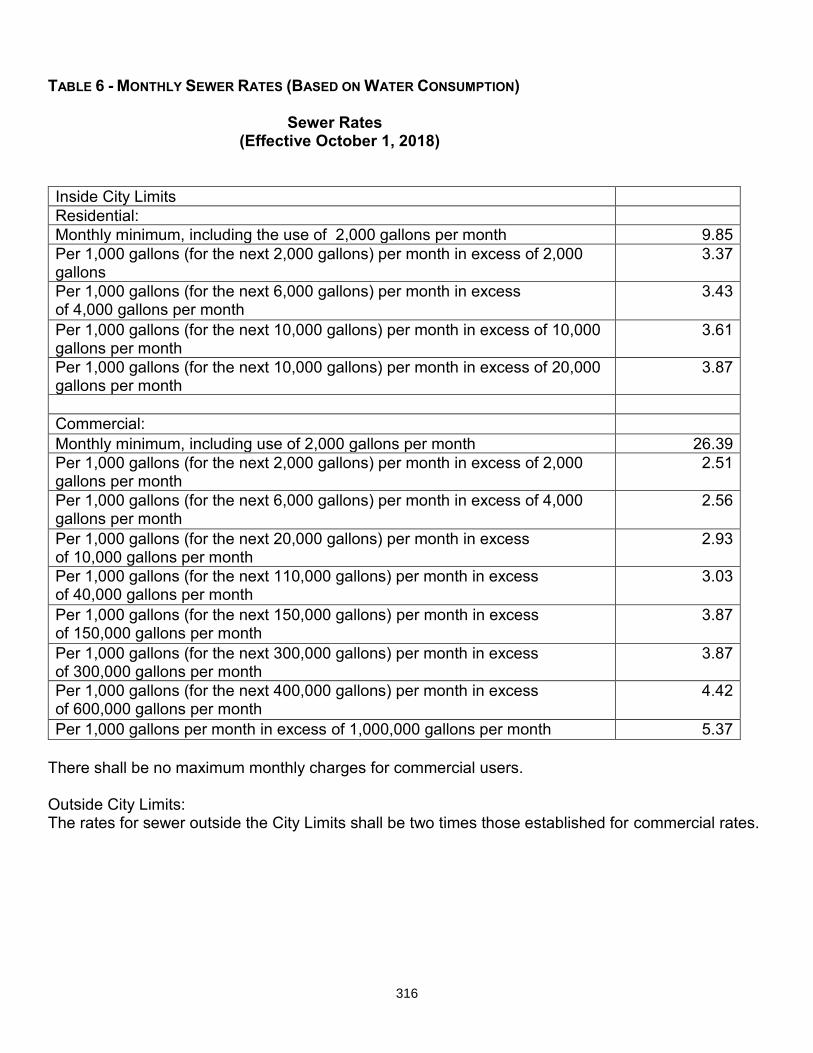
TABLE 6 - MONTHLY SEWER RATES (BASED ON WATER CONSUMPTION)
Sewer Rates (Effective October 1, 2018)
Inside City Limits Residential: Monthly minimum, including the use of 2,000 gallons per month 9.85 Per 1,000 gallons (for the next 2,000 gallons) per month in excess of 2,000 gallons
3.37
Per 1,000 gallons (for the next 6,000 gallons) per month in excess of 4,000 gallons per month
3.43
Per 1,000 gallons (for the next 10,000 gallons) per month in excess of 10,000 gallons per month
3.61
Per 1,000 gallons (for the next 10,000 gallons) per month in excess of 20,000 gallons per month
3.87
Commercial: Monthly minimum, including use of 2,000 gallons per month 26.39 Per 1,000 gallons (for the next 2,000 gallons) per month in excess of 2,000 gallons per month
2.51
Per 1,000 gallons (for the next 6,000 gallons) per month in excess of 4,000 gallons per month
2.56
Per 1,000 gallons (for the next 20,000 gallons) per month in excess of 10,000 gallons per month
2.93
Per 1,000 gallons (for the next 110,000 gallons) per month in excess of 40,000 gallons per month
3.03
Per 1,000 gallons (for the next 150,000 gallons) per month in excess of 150,000 gallons per month
3.87
Per 1,000 gallons (for the next 300,000 gallons) per month in excess of 300,000 gallons per month
3.87
Per 1,000 gallons (for the next 400,000 gallons) per month in excess of 600,000 gallons per month
4.42
Per 1,000 gallons per month in excess of 1,000,000 gallons per month 5.37 There shall be no maximum monthly charges for commercial users. Outside City Limits: The rates for sewer outside the City Limits shall be two times those established for commercial rates. 316
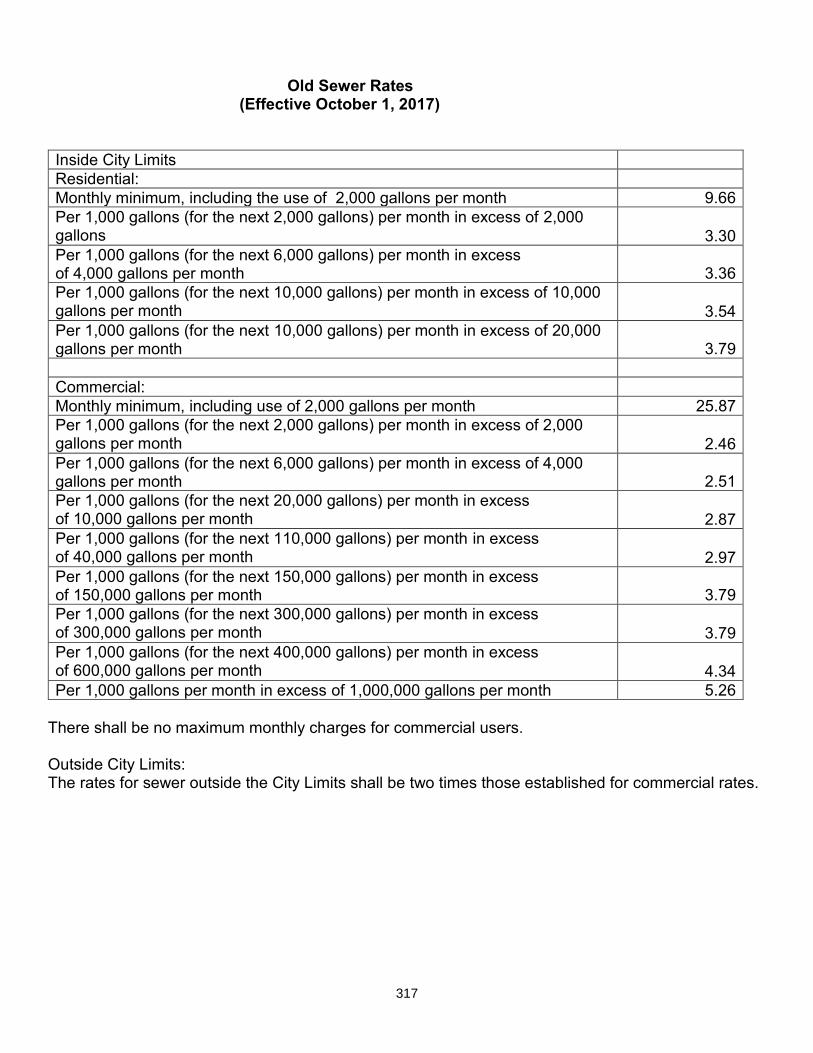
Old Sewer Rates (Effective October 1, 2017)
Inside City Limits Residential: Monthly minimum, including the use of 2,000 gallons per month 9.66 Per 1,000 gallons (for the next 2,000 gallons) per month in excess of 2,000 gallons 3.30 Per 1,000 gallons (for the next 6,000 gallons) per month in excess of 4,000 gallons per month 3.36 Per 1,000 gallons (for the next 10,000 gallons) per month in excess of 10,000 gallons per month 3.54 Per 1,000 gallons (for the next 10,000 gallons) per month in excess of 20,000 gallons per month 3.79 Commercial: Monthly minimum, including use of 2,000 gallons per month 25.87 Per 1,000 gallons (for the next 2,000 gallons) per month in excess of 2,000 gallons per month 2.46 Per 1,000 gallons (for the next 6,000 gallons) per month in excess of 4,000 gallons per month 2.51 Per 1,000 gallons (for the next 20,000 gallons) per month in excess of 10,000 gallons per month 2.87 Per 1,000 gallons (for the next 110,000 gallons) per month in excess of 40,000 gallons per month 2.97 Per 1,000 gallons (for the next 150,000 gallons) per month in excess of 150,000 gallons per month 3.79 Per 1,000 gallons (for the next 300,000 gallons) per month in excess of 300,000 gallons per month 3.79 Per 1,000 gallons (for the next 400,000 gallons) per month in excess of 600,000 gallons per month 4.34 Per 1,000 gallons per month in excess of 1,000,000 gallons per month 5.26
There shall be no maximum monthly charges for commercial users. Outside City Limits: The rates for sewer outside the City Limits shall be two times those established for commercial rates. 317
WATER CONSERVATION PROGRAM
The Utilities Department Water Conservation Program is designed to provide practices, techniques, and technologies that help reduce the consumption of water, reduce the loss or waste of water, improve efficiency in the use of water, and increase the recycling and reuse of water for the ultimate purpose of making available a water supply for future or alternative uses. The Water Conservation Program operates to implement and enforce the Water Conservation and Drought Contingency Ordinance. The program is divided into two sections; enforcement and public education. For enforcement, there were a total of 113 warnings issued and 9 citations. For public education, there were 19 events that included hosting proclamations, groundbreaking ceremonies, ribbon cutting ceremonies, career day events, and other City/civic events.
As part of the City’s water conservation efforts, the Utilities Department manages the WaterSense High Efficiency Toilet (HET) Rebate Program, which is designed to encourage water customers to replace old water wasting toilets with new high efficiency toilets that carry the WaterSense label. For each toilet replaced (maximum 2 per household per year, if more than two toilets in home), the City of Laredo Utilities Department provides the water customer with a standard one-hundred dollar ($100) rebate, which is applied as a credit to the participant water account. Each installation of toilet is verified by water conservation inspectors as a condition of the rebate approval, and the old water wasting toilet(s) are destroyed (tank only) by the participating customer. The old water wasting toilets are reported to the Solid Waste Department and are scheduled for collection at each participant’s address to betransported to the City of Laredo Landfill. During fiscal year 2018-2019, there were a total of 89 approved toilet rebates applied to customer accounts. A total of 3 vehicle car wash permits were issued during this fiscal year.
318
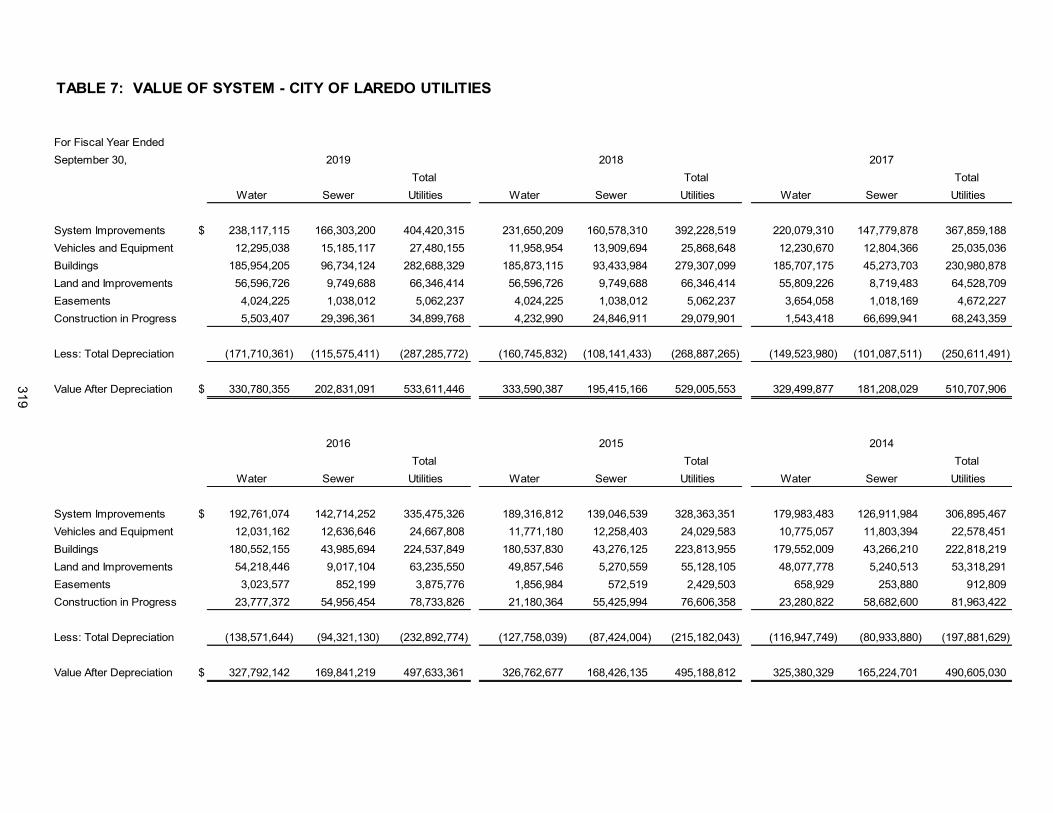
TABLE 7: VALUE OF SYSTEM - CITY OF LAREDO UTILITIES
For Fiscal Year EndedSeptember 30, 2019 2018 2017
Total Total Total Water Sewer Utilities Water Sewer Utilities Water Sewer Utilities
System Improvements $ 238,117,115 166,303,200 404,420,315 231,650,209 160,578,310 392,228,519 220,079,310 147,779,878 367,859,188 Vehicles and Equipment 12,295,038 15,185,117 27,480,155 11,958,954 13,909,694 25,868,648 12,230,670 12,804,366 25,035,036 Buildings 185,954,205 96,734,124 282,688,329 185,873,115 93,433,984 279,307,099 185,707,175 45,273,703 230,980,878 Land and Improvements 56,596,726 9,749,688 66,346,414 56,596,726 9,749,688 66,346,414 55,809,226 8,719,483 64,528,709 Easements 4,024,225 1,038,012 5,062,237 4,024,225 1,038,012 5,062,237 3,654,058 1,018,169 4,672,227 Construction in Progress 5,503,407 29,396,361 34,899,768 4,232,990 24,846,911 29,079,901 1,543,418 66,699,941 68,243,359
Less: Total Depreciation (171,710,361) (115,575,411) (287,285,772) (160,745,832) (108,141,433) (268,887,265) (149,523,980) (101,087,511) (250,611,491)
Value After Depreciation $ 330,780,355 202,831,091 533,611,446 333,590,387 195,415,166 529,005,553 329,499,877 181,208,029 510,707,906
2016 2015 2014Total Total Total
Water Sewer Utilities Water Sewer Utilities Water Sewer Utilities
System Improvements $ 192,761,074 142,714,252 335,475,326 189,316,812 139,046,539 328,363,351 179,983,483 126,911,984 306,895,467 Vehicles and Equipment 12,031,162 12,636,646 24,667,808 11,771,180 12,258,403 24,029,583 10,775,057 11,803,394 22,578,451 Buildings 180,552,155 43,985,694 224,537,849 180,537,830 43,276,125 223,813,955 179,552,009 43,266,210 222,818,219 Land and Improvements 54,218,446 9,017,104 63,235,550 49,857,546 5,270,559 55,128,105 48,077,778 5,240,513 53,318,291 Easements 3,023,577 852,199 3,875,776 1,856,984 572,519 2,429,503 658,929 253,880 912,809 Construction in Progress 23,777,372 54,956,454 78,733,826 21,180,364 55,425,994 76,606,358 23,280,822 58,682,600 81,963,422
Less: Total Depreciation (138,571,644) (94,321,130) (232,892,774) (127,758,039) (87,424,004) (215,182,043) (116,947,749) (80,933,880) (197,881,629)
Value After Depreciation $ 327,792,142 169,841,219 497,633,361 326,762,677 168,426,135 495,188,812 325,380,329 165,224,701 490,605,030
319

TABLE 8: CITY'S EQUITY IN UTILITY SYSTEM
For Fiscal Year EndedSeptember 30, 2019 2018 2017
Total Total Total Water Sewer Utilities Water Sewer Utilities Water Sewer Utilities
Resources:Net System Value $ 330,780,355 202,831,091 533,611,446 333,590,387 195,415,166 529,005,553 329,499,877 181,208,029 510,707,906 Cash and Investments 71,259,027 68,564,644 139,823,671 67,614,459 76,860,849 144,475,308 69,423,048 68,566,862 137,989,910 Other Sources 30,150,522 10,443,565 40,594,087 23,057,501 8,514,823 31,572,324 19,634,858 8,667,894 28,302,752 Total Resources 432,189,904 281,839,300 714,029,204 424,262,347 280,790,838 705,053,185 418,557,783 258,442,785 677,000,568
Obligations:Bonds Payable 234,286,228 158,122,220 392,408,448 240,611,024 162,958,724 403,569,748 245,008,424 148,911,953 393,920,377 Less: Bond Funds (12,098,738) (10,084,746) (22,183,484) (12,104,558) (10,109,539) (22,214,097) (29,904,668) (8,936,524) (38,841,192)
222,187,490 148,037,474 370,224,964 228,506,466 152,849,185 381,355,651 215,103,756 139,975,429 355,079,185 Other Obligations 44,933,705 20,296,795 65,230,500 39,273,583 20,712,989 59,986,572 58,225,699 19,493,465 77,719,164 Total Obligations 267,121,195 168,334,269 435,455,464 267,780,049 173,562,174 441,342,223 273,329,455 159,468,894 432,798,349
City's Equity in System $ 165,068,709 113,505,031 278,573,740 156,482,298 107,228,664 263,710,962 145,228,328 98,973,891 244,202,219
Percentage City's Equity In System 38.19% 40.27% 39.01% 36.88% 38.19% 37.40% 34.70% 38.30% 36.07%
For Fiscal Year EndedSeptember 30, 2016 2015 2014
Total Total Total Water Sewer Utilities Water Sewer Utilities Water Sewer Utilities
Resources:Net System Value $ 327,792,142 169,841,219 497,633,361 326,762,677 168,426,135 495,188,812 325,380,329 165,224,701 490,605,030 Cash and Investments 72,421,282 79,700,362 152,121,644 71,561,005 69,663,599 141,224,604 71,965,756 71,424,687 143,390,443 Other Sources 21,273,458 9,234,460 30,507,918 11,178,167 6,895,648 18,073,815 8,170,889 5,278,605 13,449,494 Total Resources 421,486,882 258,776,041 680,262,923 409,501,849 244,985,382 654,487,231 405,516,974 241,927,993 647,444,967
Obligations:Bonds Payable 252,728,946 155,384,654 408,113,600 232,162,040 136,431,409 368,593,449 221,870,994 130,825,233 352,696,227 Less: Bond Funds (29,748,964) (8,988,269) (38,737,233) (12,187,063) (7,953,603) (20,140,666) (13,886,950) (8,924,685) (22,811,635)
222,979,982 146,396,385 369,376,367 219,974,977 128,477,806 348,452,783 207,984,044 121,900,548 329,884,592 Other Obligations 59,301,285 18,739,204 78,040,489 44,035,449 18,713,553 62,749,002 30,236,743 14,810,857 45,047,600 Total Obligations 282,281,267 165,135,589 447,416,856 264,010,426 147,191,359 411,201,785 238,220,787 136,711,405 374,932,192
City's Equity in System $ 139,205,615 93,640,452 232,846,067 145,491,423 97,794,023 243,285,446 167,296,187 105,216,588 272,512,775
Percentage City's Equity In System 33.03% 36.19% 34.23% 35.53% 39.92% 37.17% 41.26% 43.49% 42.09%
320
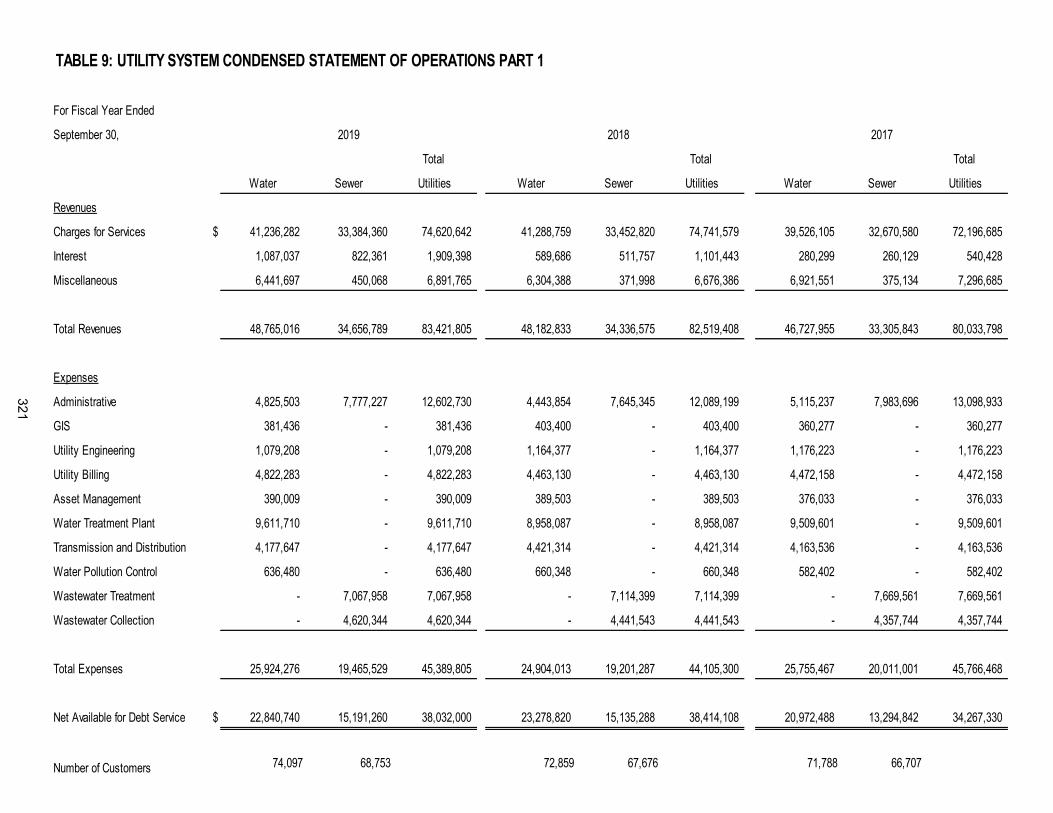
TABLE 9: UTILITY SYSTEM CONDENSED STATEMENT OF OPERATIONS PART 1
For Fiscal Year Ended
September 30, 2019 2018 2017
Total Total Total
Water Sewer Utilities Water Sewer Utilities Water Sewer Utilities
Revenues
Charges for Services $ 41,236,282 33,384,360 74,620,642 41,288,759 33,452,820 74,741,579 39,526,105 32,670,580 72,196,685
Interest 1,087,037 822,361 1,909,398 589,686 511,757 1,101,443 280,299 260,129 540,428
Miscellaneous 6,441,697 450,068 6,891,765 6,304,388 371,998 6,676,386 6,921,551 375,134 7,296,685
Total Revenues 48,765,016 34,656,789 83,421,805 48,182,833 34,336,575 82,519,408 46,727,955 33,305,843 80,033,798
Expenses
Administrative 4,825,503 7,777,227 12,602,730 4,443,854 7,645,345 12,089,199 5,115,237 7,983,696 13,098,933
GIS 381,436 - 381,436 403,400 - 403,400 360,277 - 360,277
Utility Engineering 1,079,208 - 1,079,208 1,164,377 - 1,164,377 1,176,223 - 1,176,223
Utility Billing 4,822,283 - 4,822,283 4,463,130 - 4,463,130 4,472,158 - 4,472,158
Asset Management 390,009 - 390,009 389,503 - 389,503 376,033 - 376,033
Water Treatment Plant 9,611,710 - 9,611,710 8,958,087 - 8,958,087 9,509,601 - 9,509,601
Transmission and Distribution 4,177,647 - 4,177,647 4,421,314 - 4,421,314 4,163,536 - 4,163,536
Water Pollution Control 636,480 - 636,480 660,348 - 660,348 582,402 - 582,402
Wastewater Treatment - 7,067,958 7,067,958 - 7,114,399 7,114,399 - 7,669,561 7,669,561
Wastewater Collection - 4,620,344 4,620,344 - 4,441,543 4,441,543 - 4,357,744 4,357,744
Total Expenses 25,924,276 19,465,529 45,389,805 24,904,013 19,201,287 44,105,300 25,755,467 20,011,001 45,766,468
Net Available for Debt Service $ 22,840,740 15,191,260 38,032,000 23,278,820 15,135,288 38,414,108 20,972,488 13,294,842 34,267,330
Number of Customers 74,097 68,753 72,859 67,676 71,788 66,707
321
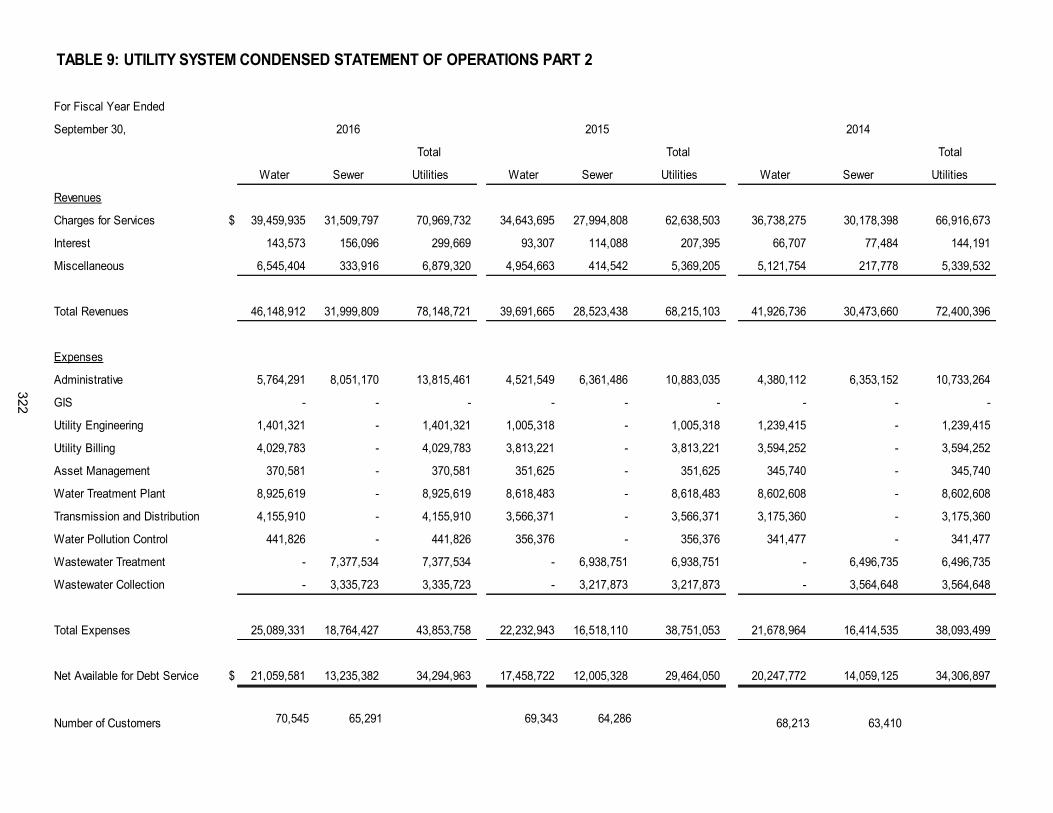
TABLE 9: UTILITY SYSTEM CONDENSED STATEMENT OF OPERATIONS PART 2
For Fiscal Year Ended
September 30, 2016 2015 2014
Total Total Total
Water Sewer Utilities Water Sewer Utilities Water Sewer Utilities
Revenues
Charges for Services $ 39,459,935 31,509,797 70,969,732 34,643,695 27,994,808 62,638,503 36,738,275 30,178,398 66,916,673
Interest 143,573 156,096 299,669 93,307 114,088 207,395 66,707 77,484 144,191
Miscellaneous 6,545,404 333,916 6,879,320 4,954,663 414,542 5,369,205 5,121,754 217,778 5,339,532
Total Revenues 46,148,912 31,999,809 78,148,721 39,691,665 28,523,438 68,215,103 41,926,736 30,473,660 72,400,396
Expenses
Administrative 5,764,291 8,051,170 13,815,461 4,521,549 6,361,486 10,883,035 4,380,112 6,353,152 10,733,264
GIS - - - - - - - - -
Utility Engineering 1,401,321 - 1,401,321 1,005,318 - 1,005,318 1,239,415 - 1,239,415
Utility Billing 4,029,783 - 4,029,783 3,813,221 - 3,813,221 3,594,252 - 3,594,252
Asset Management 370,581 - 370,581 351,625 - 351,625 345,740 - 345,740
Water Treatment Plant 8,925,619 - 8,925,619 8,618,483 - 8,618,483 8,602,608 - 8,602,608
Transmission and Distribution 4,155,910 - 4,155,910 3,566,371 - 3,566,371 3,175,360 - 3,175,360
Water Pollution Control 441,826 - 441,826 356,376 - 356,376 341,477 - 341,477
Wastewater Treatment - 7,377,534 7,377,534 - 6,938,751 6,938,751 - 6,496,735 6,496,735
Wastewater Collection - 3,335,723 3,335,723 - 3,217,873 3,217,873 - 3,564,648 3,564,648
Total Expenses 25,089,331 18,764,427 43,853,758 22,232,943 16,518,110 38,751,053 21,678,964 16,414,535 38,093,499
Net Available for Debt Service $ 21,059,581 13,235,382 34,294,963 17,458,722 12,005,328 29,464,050 20,247,772 14,059,125 34,306,897
Number of Customers 70,545 65,291 69,343 64,286 68,213 63,410
322
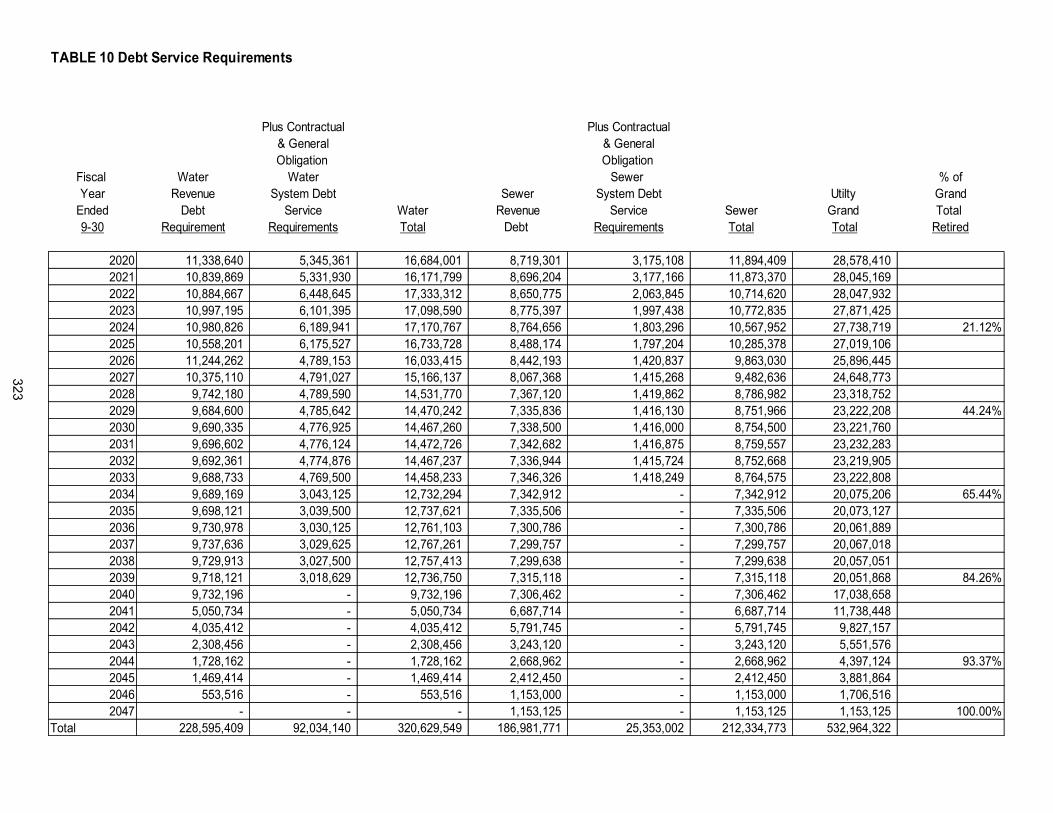
TABLE 10 Debt Service Requirements
Plus Contractual Plus Contractual& General & GeneralObligation Obligation
Fiscal Water Water Sewer % ofYear Revenue System Debt Sewer System Debt Utilty Grand
Ended Debt Service Water Revenue Service Sewer Grand Total 9-30 Requirement Requirements Total Debt Requirements Total Total Retired
2020 11,338,640 5,345,361 16,684,001 8,719,301 3,175,108 11,894,409 28,578,410 2021 10,839,869 5,331,930 16,171,799 8,696,204 3,177,166 11,873,370 28,045,169 2022 10,884,667 6,448,645 17,333,312 8,650,775 2,063,845 10,714,620 28,047,932 2023 10,997,195 6,101,395 17,098,590 8,775,397 1,997,438 10,772,835 27,871,425 2024 10,980,826 6,189,941 17,170,767 8,764,656 1,803,296 10,567,952 27,738,719 21.12%2025 10,558,201 6,175,527 16,733,728 8,488,174 1,797,204 10,285,378 27,019,106 2026 11,244,262 4,789,153 16,033,415 8,442,193 1,420,837 9,863,030 25,896,445 2027 10,375,110 4,791,027 15,166,137 8,067,368 1,415,268 9,482,636 24,648,773 2028 9,742,180 4,789,590 14,531,770 7,367,120 1,419,862 8,786,982 23,318,752 2029 9,684,600 4,785,642 14,470,242 7,335,836 1,416,130 8,751,966 23,222,208 44.24%2030 9,690,335 4,776,925 14,467,260 7,338,500 1,416,000 8,754,500 23,221,760 2031 9,696,602 4,776,124 14,472,726 7,342,682 1,416,875 8,759,557 23,232,283 2032 9,692,361 4,774,876 14,467,237 7,336,944 1,415,724 8,752,668 23,219,905 2033 9,688,733 4,769,500 14,458,233 7,346,326 1,418,249 8,764,575 23,222,808 2034 9,689,169 3,043,125 12,732,294 7,342,912 - 7,342,912 20,075,206 65.44%2035 9,698,121 3,039,500 12,737,621 7,335,506 - 7,335,506 20,073,127 2036 9,730,978 3,030,125 12,761,103 7,300,786 - 7,300,786 20,061,889 2037 9,737,636 3,029,625 12,767,261 7,299,757 - 7,299,757 20,067,018 2038 9,729,913 3,027,500 12,757,413 7,299,638 - 7,299,638 20,057,051 2039 9,718,121 3,018,629 12,736,750 7,315,118 - 7,315,118 20,051,868 84.26%2040 9,732,196 - 9,732,196 7,306,462 - 7,306,462 17,038,658 2041 5,050,734 - 5,050,734 6,687,714 - 6,687,714 11,738,448 2042 4,035,412 - 4,035,412 5,791,745 - 5,791,745 9,827,157 2043 2,308,456 - 2,308,456 3,243,120 - 3,243,120 5,551,576 2044 1,728,162 - 1,728,162 2,668,962 - 2,668,962 4,397,124 93.37%2045 1,469,414 - 1,469,414 2,412,450 - 2,412,450 3,881,864 2046 553,516 - 553,516 1,153,000 - 1,153,000 1,706,516 2047 - - - 1,153,125 - 1,153,125 1,153,125 100.00%
Total 228,595,409 92,034,140 320,629,549 186,981,771 25,353,002 212,334,773 532,964,322
323
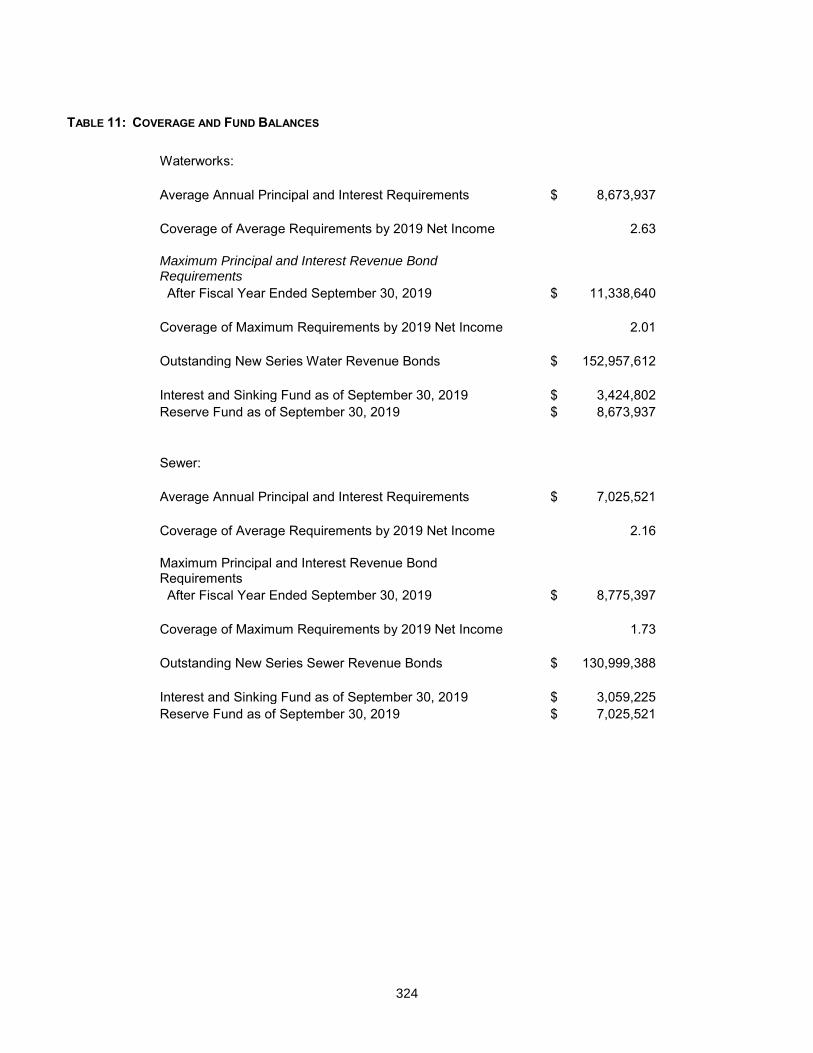
TABLE 11: COVERAGE AND FUND BALANCES
Waterworks:
Average Annual Principal and Interest Requirements $ 8,673,937
Coverage of Average Requirements by 2019 Net Income 2.63
Maximum Principal and Interest Revenue Bond Requirements
After Fiscal Year Ended September 30, 2019 $ 11,338,640
Coverage of Maximum Requirements by 2019 Net Income 2.01
Outstanding New Series Water Revenue Bonds $ 152,957,612
Interest and Sinking Fund as of September 30, 2019 $ 3,424,802 Reserve Fund as of September 30, 2019 $ 8,673,937
Sewer:
Average Annual Principal and Interest Requirements $ 7,025,521
Coverage of Average Requirements by 2019 Net Income 2.16
Maximum Principal and Interest Revenue Bond Requirements After Fiscal Year Ended September 30, 2019 $ 8,775,397
Coverage of Maximum Requirements by 2019 Net Income 1.73
Outstanding New Series Sewer Revenue Bonds $ 130,999,388
Interest and Sinking Fund as of September 30, 2019 $ 3,059,225 Reserve Fund as of September 30, 2019 $ 7,025,521
324
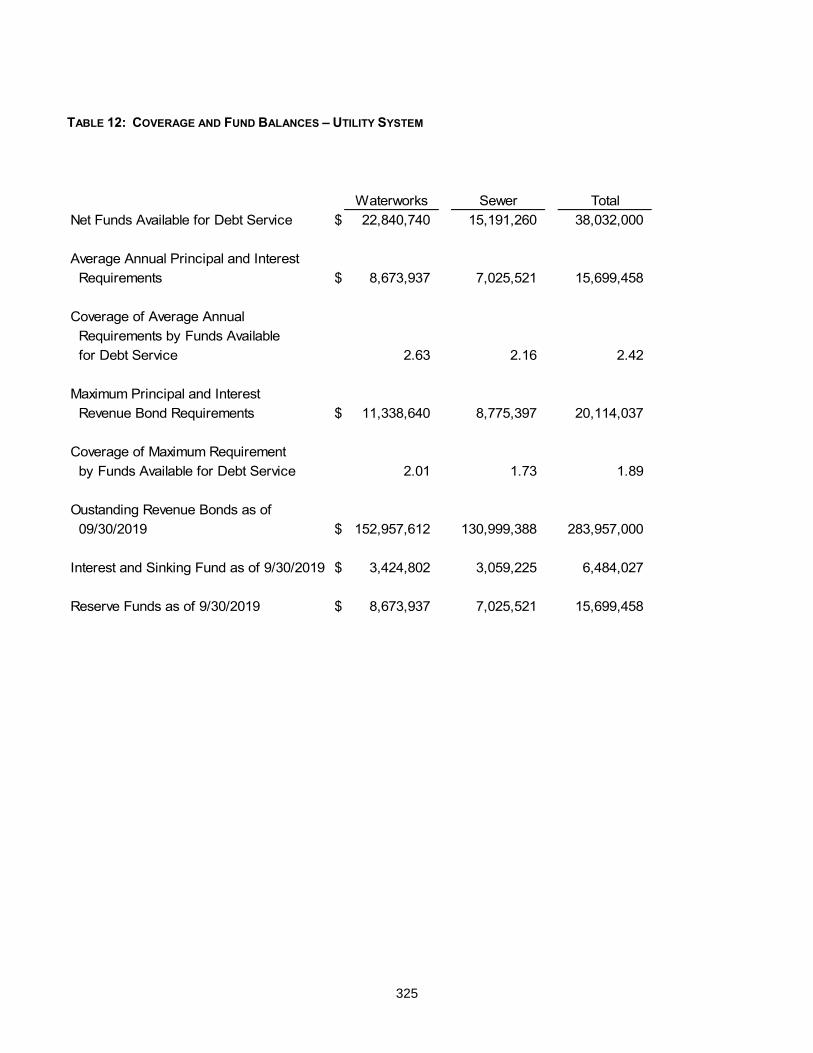
TABLE 12: COVERAGE AND FUND BALANCES – UTILITY SYSTEM
Waterworks Sewer TotalNet Funds Available for Debt Service $ 22,840,740 15,191,260 38,032,000
Average Annual Principal and Interest Requirements $ 8,673,937 7,025,521 15,699,458
Coverage of Average Annual Requirements by Funds Available for Debt Service 2.63 2.16 2.42
Maximum Principal and Interest Revenue Bond Requirements $ 11,338,640 8,775,397 20,114,037
Coverage of Maximum Requirement by Funds Available for Debt Service 2.01 1.73 1.89
Oustanding Revenue Bonds as of 09/30/2019 $ 152,957,612 130,999,388 283,957,000
Interest and Sinking Fund as of 9/30/2019 $ 3,424,802 3,059,225 6,484,027
Reserve Funds as of 9/30/2019 $ 8,673,937 7,025,521 15,699,458
325
SPORTS VENUE SALES TAX REVENUE BONDS
SAMES AUTO ARENA The City of Laredo, Texas issued the Sports Venue Sales Tax Revenue Improvement and Refunding Bonds, Series 2005, to acquire and construct additional parking facilities for the Sames Auto Arena, to achieve a debt service savings by partially refunding outstanding Sports Venue Tax Revenue Bonds, Series 2001, used to construct a sports venue project for a multipurpose entertainment arena and related infrastructure, and to pay for the issuance costs of the Bonds. The principal and interest due on the Sports Venue Tax Revenue Bonds, Series 2005, are to be paid on the scheduled interest payment dates from funds deposited with an escrow agent until discharged. The bonds constitute special and limited obligations of the City and are payable solely from, and secured solely by a first lien on and pledge of the Sales Tax Revenues, as approved by the citizens on a special election on August 12, 2000. The Sales Tax Revenues consist of the gross receipts from ¼ of 1% sales and use tax collected within the boundaries of the City. The bonds were issued pursuant to the provisions of (i) Chapter 334 of the Texas Local Government code, as amended (the “Act”), and (ii) an authorizing ordinance (the “Ordinance”) adopted by the City Council of the City on May 23, 2001. The bonds are payable solely from, and secured solely by, a first lien on and pledge of the Sales Tax Revenues as provided in the Ordinance and not from any other revenues, properties or income of the City. Neither the State of Texas nor any political corporation, subdivision, or agency of the State other than the City will be obligated to pay the bonds or the interest thereon, and neither the faith and credit nor the taxing power of the State or any political corporation, subdivision, or agency thereof is pledged to the payment of principal of or interest on the bonds. The construction of the arena was completed by September 2002 under the name Laredo Entertainment Center. This enormous entertainment center provides inexpensive world class entertainment for the whole family such as concerts, rodeos, circuses, civic events, sporting events, and more. After the construction was completed, approximately 220 new jobs were created for the operation of the facility. Furthermore, contracts were awarded to local businesses whose products are required for the Arena’s daily operations. The 178,000 square foot, $36.5 million facility opened in October 2002. It has a 10,000 seating capacity and over 2,000 parking spaces. On March 18, 2010, the City of Laredo changed the Laredo Entertainment Center name to Laredo Energy Arena after signing a four year naming rights agreement with Laredo Energy, with options for extension. With the City of Laredo’s approval on July 1st, 2018, the arena signed a five year contract with the oldest local dealership Sames Auto Group. The now Sames Auto Arena continued to host more than 130 events that include concerts, sporting events, entertainment shows, assemblies, family shows, festivals, carnivals, graduations and other special events. Major concerts included top artists Maluma, Gloria Trevi with Karol G, DJ Snoopadelic, 90s Pop Tour, Los Angeles Azules and George Lopez. Other major entertainment and special events included Monster X, Disney On Ice, Harlem Globetrotters, local shool and college graduations, International Sisters Cities Festival, Holiday Skate Days, two carnivals, the WBCA Commander’s Reception, the Society of Martha Washington Colonial Pageant and Ball and many more. 326
UNITRADE STADIUM The City of Laredo, Texas issued the Sports Venue Sales Tax Revenue, Taxable Series 2011, for the purpose of acquiring, constructing and equipping a baseball stadium (Laredo Ballpark) and related infrastructure and to pay costs of issuance. The Laredo Ballpark was approved by the voters of the City at an election held on November 4, 2008 as a related venue project to a previously approved and constructed multi-purpose entertainment arena. The Laredo Ballpark has over 3,940 seats, which includes ten suites, a party suite, club seating and fixed general admission seating. Grass berm areas will accommodate an additional 1,700 spectators and picnic tables another 370 visitors. Restrooms, typical fan amenities and cooking concession stands are distributed throughout the 10 acre ballpark. A club with bar, press box, team offices, clubhouses, and maintenance areas are included. The remaining 29 acres of the site is utilized for parking approximately 985 vehicles, with an area for future parking expansion; the City has spent approximately $21 million on construction costs for this project. The City of Laredo, Texas approved a naming rights contract on March 19, 2018 with Unitrade for a period of two years. The City has entered a lease agreement with 2L4L, LLC for hosting Laredo Tecos baseball events. Such lease agreement is for a five-year term starting March 1, 2018 and ending October 31, of each lease term year. Since March 1, 2018, the UniTrade Stadium has been serving as the Laredo home stadium for the Tecolotes “Tecos” Baseball team. The stadium is also home to many other special events.
327
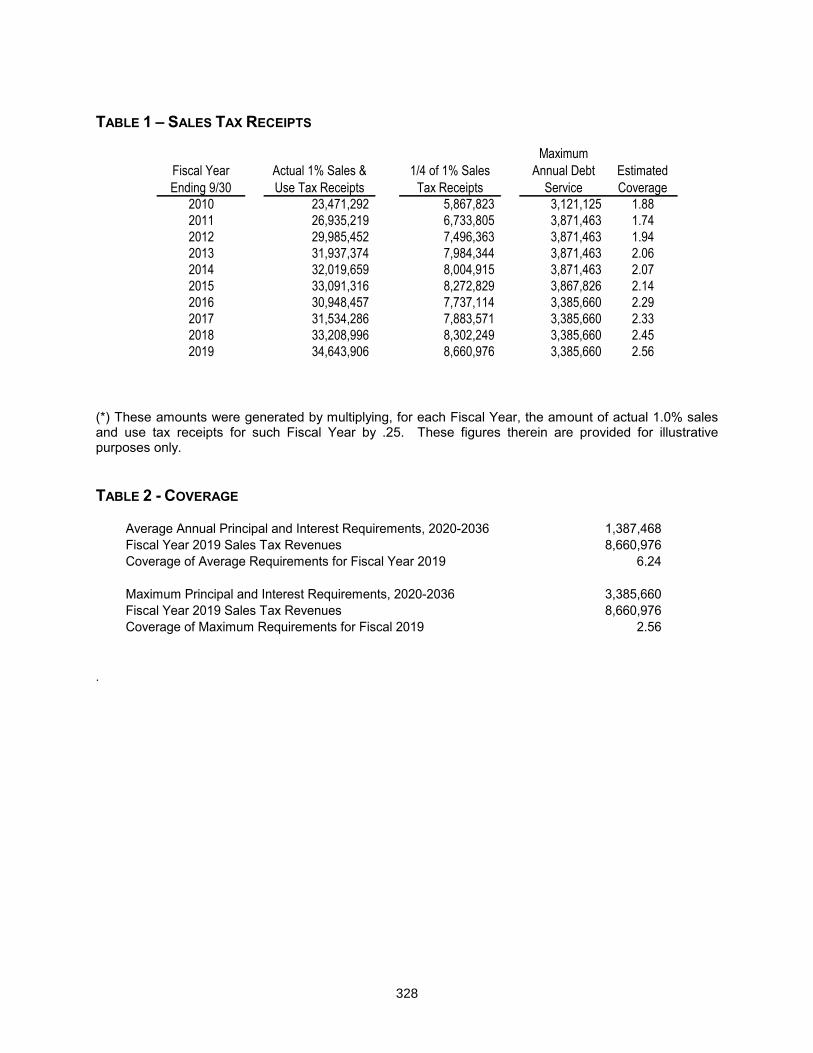
TABLE 1 – SALES TAX RECEIPTS
Fiscal Year Ending 9/30
Actual 1% Sales & Use Tax Receipts
1/4 of 1% Sales Tax Receipts
Maximum Annual Debt
ServiceEstimated Coverage
2010 23,471,292 5,867,823 3,121,125 1.882011 26,935,219 6,733,805 3,871,463 1.742012 29,985,452 7,496,363 3,871,463 1.942013 31,937,374 7,984,344 3,871,463 2.062014 32,019,659 8,004,915 3,871,463 2.072015 33,091,316 8,272,829 3,867,826 2.142016 30,948,457 7,737,114 3,385,660 2.292017 31,534,286 7,883,571 3,385,660 2.332018 33,208,996 8,302,249 3,385,660 2.452019 34,643,906 8,660,976 3,385,660 2.56
(*) These amounts were generated by multiplying, for each Fiscal Year, the amount of actual 1.0% sales and use tax receipts for such Fiscal Year by .25. These figures therein are provided for illustrative purposes only. TABLE 2 - COVERAGE
Average Annual Principal and Interest Requirements, 2020-2036 1,387,468 Fiscal Year 2019 Sales Tax Revenues 8,660,976 Coverage of Average Requirements for Fiscal Year 2019 6.24
Maximum Principal and Interest Requirements, 2020-2036 3,385,660 Fiscal Year 2019 Sales Tax Revenues 8,660,976 Coverage of Maximum Requirements for Fiscal 2019 2.56
.
328
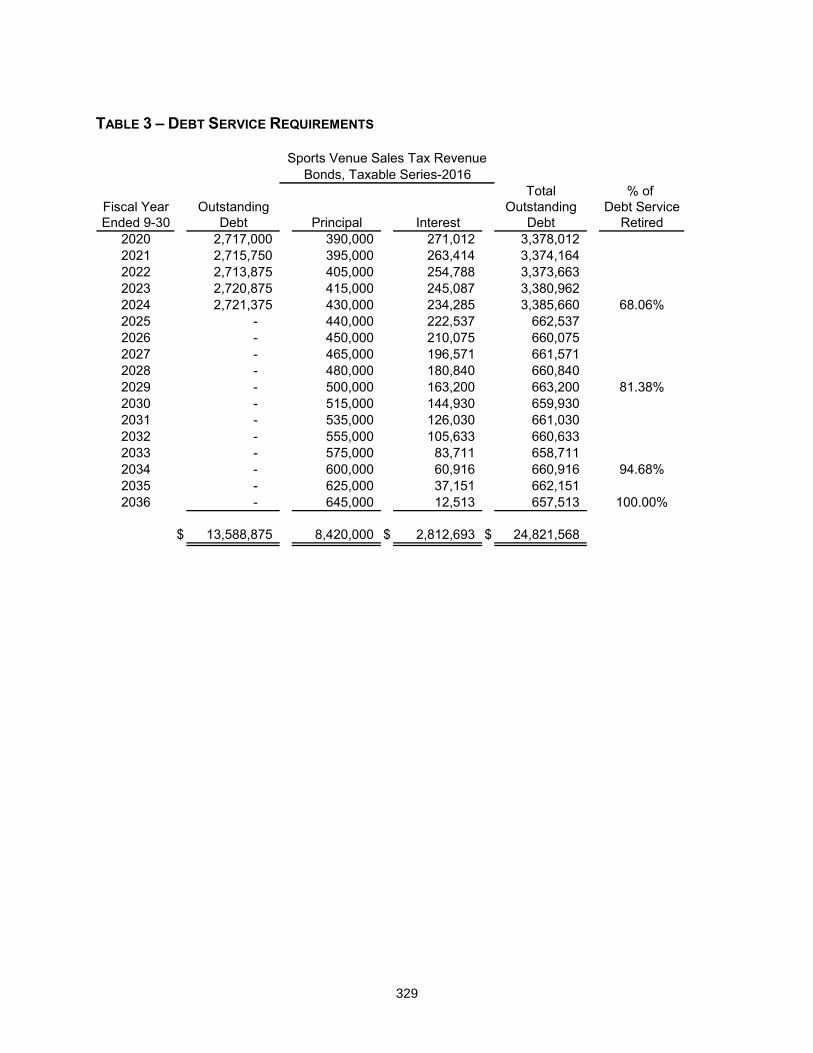
TABLE 3 – DEBT SERVICE REQUIREMENTS
Total % of Fiscal Year Outstanding Outstanding Debt ServiceEnded 9-30 Debt Principal Interest Debt Retired
2020 2,717,000 390,000 271,012 3,378,012 2021 2,715,750 395,000 263,414 3,374,164 2022 2,713,875 405,000 254,788 3,373,663 2023 2,720,875 415,000 245,087 3,380,962 2024 2,721,375 430,000 234,285 3,385,660 68.06%2025 - 440,000 222,537 662,537 2026 - 450,000 210,075 660,075 2027 - 465,000 196,571 661,571 2028 - 480,000 180,840 660,840 2029 - 500,000 163,200 663,200 81.38%2030 - 515,000 144,930 659,930 2031 - 535,000 126,030 661,030 2032 - 555,000 105,633 660,633 2033 - 575,000 83,711 658,711 2034 - 600,000 60,916 660,916 94.68%2035 - 625,000 37,151 662,151 2036 - 645,000 12,513 657,513 100.00%
$ 13,588,875 8,420,000 $ 2,812,693 $ 24,821,568
Bonds, Taxable Series-2016Sports Venue Sales Tax Revenue
329

This page intentionally left blank
330

SINGLE AUDIT
331
332
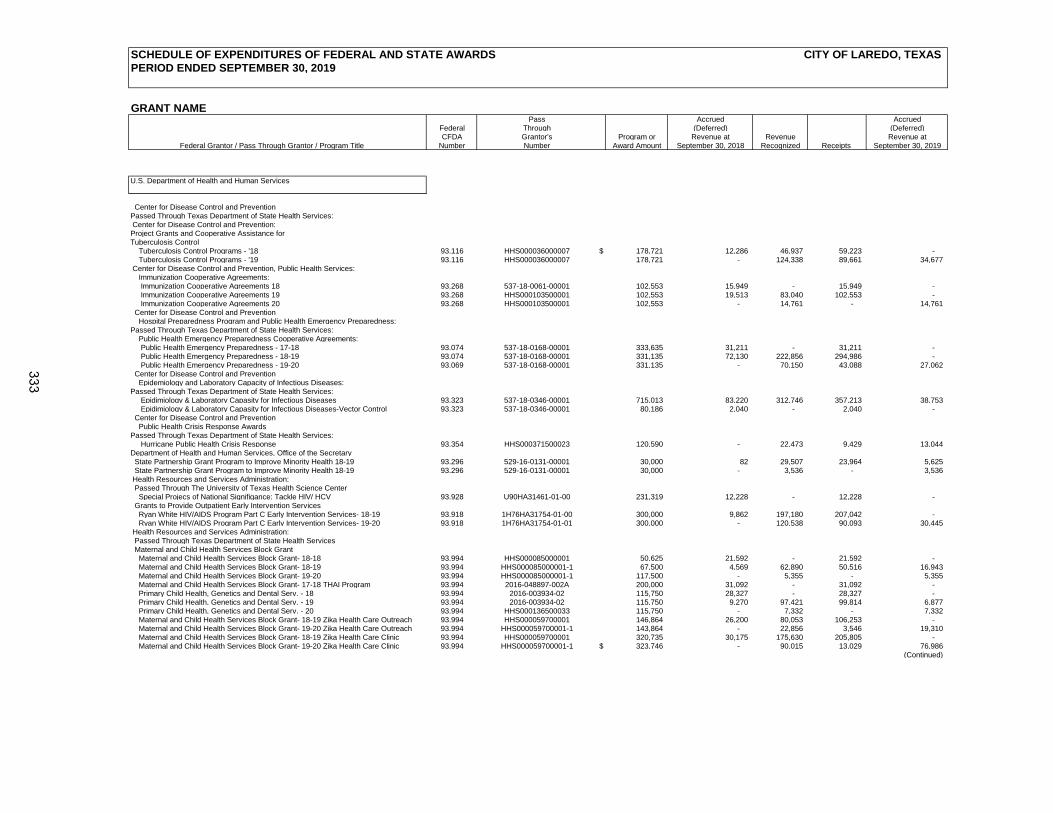
SCHEDULE OF EXPENDITURES OF FEDERAL AND STATE AWARDS CITY OF LAREDO, TEXAS
PERIOD ENDED SEPTEMBER 30, 2019
GRANT NAMEPass Accrued Accrued
Federal Through (Deferred) (Deferred)CFDA Grantor's Program or Revenue at Revenue Revenue at
Federal Grantor / Pass Through Grantor / Program Title Number Number Award Amount September 30, 2018 Recognized Receipts September 30, 2019
U.S. Department of Health and Human Services
Center for Disease Control and PreventionPassed Through Texas Department of State Health Services: Center for Disease Control and Prevention:Project Grants and Cooperative Assistance forTuberculosis Control
Tuberculosis Control Programs - '18 93.116 HHS000036000007 $ 178,721 12,286 46,937 59,223 - Tuberculosis Control Programs - '19 93.116 HHS000036000007 178,721 - 124,338 89,661 34,677
Center for Disease Control and Prevention, Public Health Services: Immunization Cooperative Agreements: Immunization Cooperative Agreements 18 93.268 537-18-0061-00001 102,553 15,949 - 15,949 - Immunization Cooperative Agreements 19 93.268 HHS000103500001 102,553 19,513 83,040 102,553 - Immunization Cooperative Agreements 20 93.268 HHS000103500001 102,553 - 14,761 - 14,761
Center for Disease Control and Prevention Hospital Preparedness Program and Public Health Emergency Preparedness:
Passed Through Texas Department of State Health Services: Public Health Emergency Preparedness Cooperative Agreements: Public Health Emergency Preparedness - 17-18 93.074 537-18-0168-00001 333,635 31,211 - 31,211 - Public Health Emergency Preparedness - 18-19 93.074 537-18-0168-00001 331,135 72,130 222,856 294,986 - Public Health Emergency Preparedness - 19-20 93.069 537-18-0168-00001 331,135 - 70,150 43,088 27,062
Center for Disease Control and Prevention Epidemiology and Laboratory Capacity of Infectious Diseases:
Passed Through Texas Department of State Health Services: Epidimiology & Laboratory Capasity for Infectious Diseases 93.323 537-18-0346-00001 715,013 83,220 312,746 357,213 38,753 Epidimiology & Laboratory Capasity for Infectious Diseases-Vector Control 93.323 537-18-0346-00001 80,186 2,040 - 2,040 -
Center for Disease Control and Prevention Public Health Crisis Response AwardsPassed Through Texas Department of State Health Services:
Hurricane Public Health Crisis Response 93.354 HHS000371500023 120,590 - 22,473 9,429 13,044 Department of Health and Human Services, Office of the Secretary State Partnership Grant Program to Improve Minority Health 18-19 93.296 529-16-0131-00001 30,000 82 29,507 23,964 5,625 State Partnership Grant Program to Improve Minority Health 18-19 93.296 529-16-0131-00001 30,000 - 3,536 - 3,536 Health Resources and Services Administration: Passed Through The University of Texas Health Science Center
Special Projecs of National Signifigance: Tackle HIV/ HCV 93.928 U90HA31461-01-00 231,319 12,228 - 12,228 - Grants to Provide Outpatient Early Intervention Services
Ryan White HIV/AIDS Program Part C Early Intervention Services- 18-19 93.918 1H76HA31754-01-00 300,000 9,862 197,180 207,042 - Ryan White HIV/AIDS Program Part C Early Intervention Services- 19-20 93.918 1H76HA31754-01-01 300,000 - 120,538 90,093 30,445
Health Resources and Services Administration: Passed Through Texas Department of State Health Services Maternal and Child Health Services Block Grant
Maternal and Child Health Services Block Grant- 18-18 93.994 HHS000085000001 50,625 21,592 - 21,592 - Maternal and Child Health Services Block Grant- 18-19 93.994 HHS000085000001-1 67,500 4,569 62,890 50,516 16,943
Maternal and Child Health Services Block Grant- 19-20 93.994 HHS000085000001-1 117,500 - 5,355 - 5,355 Maternal and Child Health Services Block Grant- 17-18 THAI Program 93.994 2016-048897-002A 200,000 31,092 - 31,092 - Primary Child Health, Genetics and Dental Serv. - 18 93.994 2016-003934-02 115,750 28,327 - 28,327 - Primary Child Health, Genetics and Dental Serv. - 19 93.994 2016-003934-02 115,750 9,270 97,421 99,814 6,877 Primary Child Health, Genetics and Dental Serv. - 20 93.994 HHS000136500033 115,750 - 7,332 - 7,332 Maternal and Child Health Services Block Grant- 18-19 Zika Health Care Outreach 93.994 HHS000059700001 146,864 26,200 80,053 106,253 - Maternal and Child Health Services Block Grant- 19-20 Zika Health Care Outreach 93.994 HHS000059700001-1 143,864 - 22,856 3,546 19,310 Maternal and Child Health Services Block Grant- 18-19 Zika Health Care Clinic 93.994 HHS000059700001 320,735 30,175 175,630 205,805 - Maternal and Child Health Services Block Grant- 19-20 Zika Health Care Clinic 93.994 HHS000059700001-1 $ 323,746 - 90,015 13,029 76,986
(Continued)
333
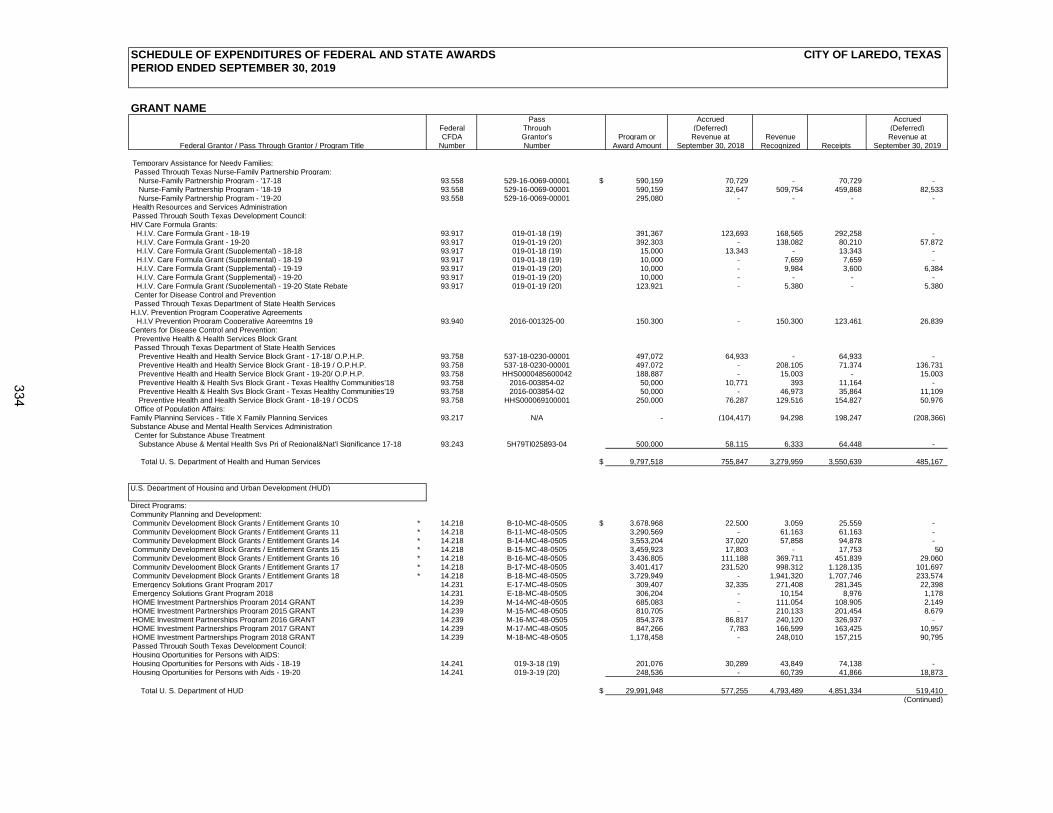
SCHEDULE OF EXPENDITURES OF FEDERAL AND STATE AWARDS CITY OF LAREDO, TEXAS
PERIOD ENDED SEPTEMBER 30, 2019
GRANT NAMEPass Accrued Accrued
Federal Through (Deferred) (Deferred)CFDA Grantor's Program or Revenue at Revenue Revenue at
Federal Grantor / Pass Through Grantor / Program Title Number Number Award Amount September 30, 2018 Recognized Receipts September 30, 2019
Temporary Assistance for Needy Families: Passed Through Texas Nurse-Family Partnership Program:
Nurse-Family Partnership Program - '17-18 93.558 529-16-0069-00001 $ 590,159 70,729 - 70,729 - Nurse-Family Partnership Program - '18-19 93.558 529-16-0069-00001 590,159 32,647 509,754 459,868 82,533 Nurse-Family Partnership Program - '19-20 93.558 529-16-0069-00001 295,080 - - - -
Health Resources and Services Administration Passed Through South Texas Development Council:HIV Care Formula Grants:
H.I.V. Care Formula Grant - 18-19 93.917 019-01-18 (19) 391,367 123,693 168,565 292,258 - H.I.V. Care Formula Grant - 19-20 93.917 019-01-19 (20) 392,303 - 138,082 80,210 57,872 H.I.V. Care Formula Grant (Supplemental) - 18-18 93.917 019-01-18 (19) 15,000 13,343 - 13,343 - H.I.V. Care Formula Grant (Supplemental) - 18-19 93.917 019-01-18 (19) 10,000 - 7,659 7,659 - H.I.V. Care Formula Grant (Supplemental) - 19-19 93.917 019-01-19 (20) 10,000 - 9,984 3,600 6,384 H.I.V. Care Formula Grant (Supplemental) - 19-20 93.917 019-01-19 (20) 10,000 - - - -
H.I.V. Care Formula Grant (Supplemental) - 19-20 State Rebate 93.917 019-01-19 (20) 123,921 - 5,380 - 5,380 Center for Disease Control and Prevention Passed Through Texas Department of State Health ServicesH.I.V. Prevention Program Cooperative Agreements
H.I.V Prevention Program Cooperative Agreemtns 19 93.940 2016-001325-00 150,300 - 150,300 123,461 26,839 Centers for Disease Control and Prevention: Preventive Health & Health Services Block Grant Passed Through Texas Department of State Health Services
Preventive Health and Health Service Block Grant - 17-18/ O.P.H.P. 93.758 537-18-0230-00001 497,072 64,933 - 64,933 - Preventive Health and Health Service Block Grant - 18-19 / O.P.H.P. 93.758 537-18-0230-00001 497,072 - 208,105 71,374 136,731 Preventive Health and Health Service Block Grant - 19-20/ O.P.H.P. 93.758 HHS0000485600042 188,887 - 15,003 - 15,003 Preventive Health & Health Svs Block Grant - Texas Healthy Communities'18 93.758 2016-003854-02 50,000 10,771 393 11,164 - Preventive Health & Health Svs Block Grant - Texas Healthy Communities'19 93.758 2016-003854-02 50,000 - 46,973 35,864 11,109 Preventive Health and Health Service Block Grant - 18-19 / OCDS 93.758 HHS000069100001 250,000 76,287 129,516 154,827 50,976
Office of Population Affairs:Family Planning Services - Title X Family Planning Services 93.217 N/A - (104,417) 94,298 198,247 (208,366) Substance Abuse and Mental Health Services Administration Center for Substance Abuse Treatment
Substance Abuse & Mental Health Svs Prj of Regional&Nat'l Significance 17-18 93.243 5H79TI025893-04 500,000 58,115 6,333 64,448 -
Total U. S. Department of Health and Human Services $ 9,797,518 755,847 3,279,959 3,550,639 485,167
U.S. Department of Housing and Urban Development (HUD)
Direct Programs:Community Planning and Development: Community Development Block Grants / Entitlement Grants 10 * 14.218 B-10-MC-48-0505 $ 3,678,968 22,500 3,059 25,559 - Community Development Block Grants / Entitlement Grants 11 * 14.218 B-11-MC-48-0505 3,290,569 - 61,163 61,163 - Community Development Block Grants / Entitlement Grants 14 * 14.218 B-14-MC-48-0505 3,553,204 37,020 57,858 94,878 - Community Development Block Grants / Entitlement Grants 15 * 14.218 B-15-MC-48-0505 3,459,923 17,803 - 17,753 50 Community Development Block Grants / Entitlement Grants 16 * 14.218 B-16-MC-48-0505 3,436,805 111,188 369,711 451,839 29,060 Community Development Block Grants / Entitlement Grants 17 * 14.218 B-17-MC-48-0505 3,401,417 231,520 998,312 1,128,135 101,697 Community Development Block Grants / Entitlement Grants 18 * 14.218 B-18-MC-48-0505 3,729,949 - 1,941,320 1,707,746 233,574 Emergency Solutions Grant Program 2017 14.231 E-17-MC-48-0505 309,407 32,335 271,408 281,345 22,398 Emergency Solutions Grant Program 2018 14.231 E-18-MC-48-0505 306,204 - 10,154 8,976 1,178 HOME Investment Partnerships Program 2014 GRANT 14.239 M-14-MC-48-0505 685,083 - 111,054 108,905 2,149 HOME Investment Partnerships Program 2015 GRANT 14.239 M-15-MC-48-0505 810,705 - 210,133 201,454 8,679 HOME Investment Partnerships Program 2016 GRANT 14.239 M-16-MC-48-0505 854,378 86,817 240,120 326,937 - HOME Investment Partnerships Program 2017 GRANT 14.239 M-17-MC-48-0505 847,266 7,783 166,599 163,425 10,957 HOME Investment Partnerships Program 2018 GRANT 14.239 M-18-MC-48-0505 1,178,458 - 248,010 157,215 90,795 Passed Through South Texas Development Council: Housing Oportunities for Persons with AIDS: Housing Oportunities for Persons with Aids - 18-19 14.241 019-3-18 (19) 201,076 30,289 43,849 74,138 - Housing Oportunities for Persons with Aids - 19-20 14.241 019-3-19 (20) 248,536 - 60,739 41,866 18,873
Total U. S. Department of HUD $ 29,991,948 577,255 4,793,489 4,851,334 519,410 (Continued)
334
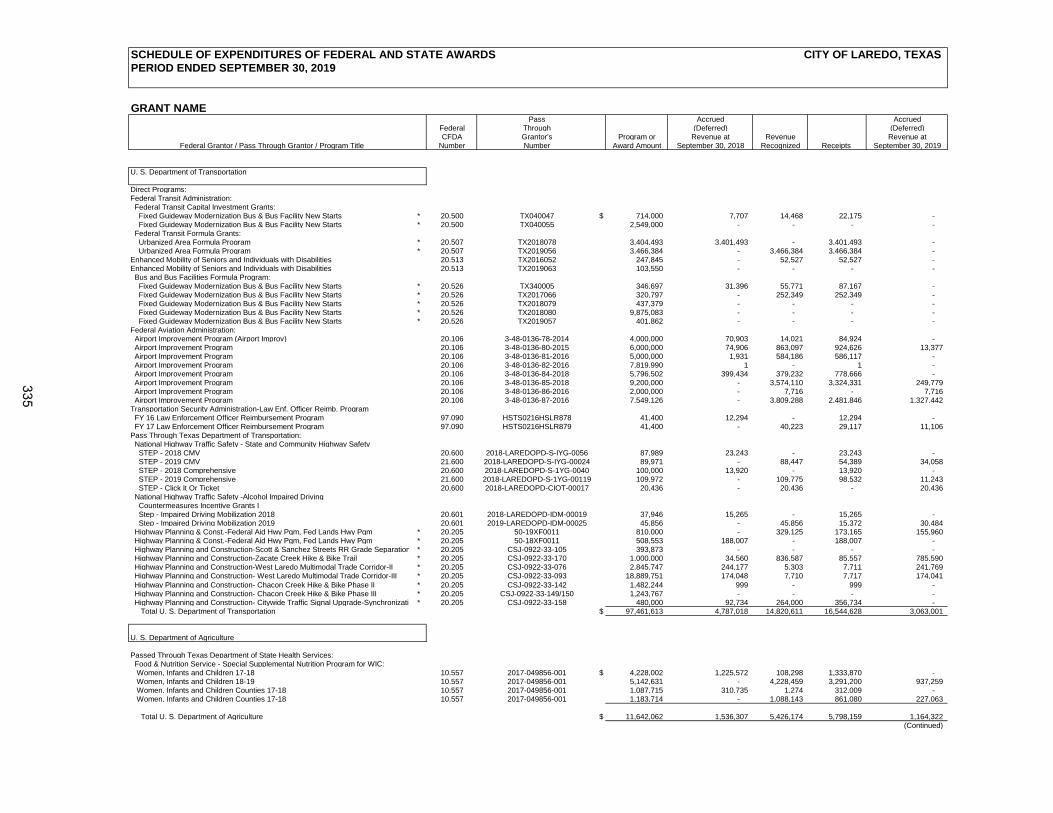
SCHEDULE OF EXPENDITURES OF FEDERAL AND STATE AWARDS CITY OF LAREDO, TEXAS
PERIOD ENDED SEPTEMBER 30, 2019
GRANT NAMEPass Accrued Accrued
Federal Through (Deferred) (Deferred)CFDA Grantor's Program or Revenue at Revenue Revenue at
Federal Grantor / Pass Through Grantor / Program Title Number Number Award Amount September 30, 2018 Recognized Receipts September 30, 2019
U. S. Department of Transportation
Direct Programs:Federal Transit Administration: Federal Transit Capital Investment Grants:
Fixed Guideway Modernization Bus & Bus Facility New Starts * 20.500 TX040047 $ 714,000 7,707 14,468 22,175 - Fixed Guideway Modernization Bus & Bus Facility New Starts * 20.500 TX040055 2,549,000 - - - -
Federal Transit Formula Grants: Urbanized Area Formula Program * 20.507 TX2018078 3,404,493 3,401,493 - 3,401,493 - Urbanized Area Formula Program * 20.507 TX2019056 3,466,384 - 3,466,384 3,466,384 -
Enhanced Mobility of Seniors and Individuals with Disabilities 20.513 TX2016052 247,845 - 52,527 52,527 - Enhanced Mobility of Seniors and Individuals with Disabilities 20.513 TX2019063 103,550 - - - - Bus and Bus Facilities Formula Program: Fixed Guideway Modernization Bus & Bus Facility New Starts * 20.526 TX340005 346,697 31,396 55,771 87,167 -
Fixed Guideway Modernization Bus & Bus Facility New Starts * 20.526 TX2017066 320,797 - 252,349 252,349 - Fixed Guideway Modernization Bus & Bus Facility New Starts * 20.526 TX2018079 437,379 - - - - Fixed Guideway Modernization Bus & Bus Facility New Starts * 20.526 TX2018080 9,875,083 - - - - Fixed Guideway Modernization Bus & Bus Facility New Starts * 20.526 TX2019057 401,862 - - - -
Federal Aviation Administration: Airport Improvement Program (Airport Improv) 20.106 3-48-0136-78-2014 4,000,000 70,903 14,021 84,924 - Airport Improvement Program 20.106 3-48-0136-80-2015 6,000,000 74,906 863,097 924,626 13,377 Airport Improvement Program 20.106 3-48-0136-81-2016 5,000,000 1,931 584,186 586,117 - Airport Improvement Program 20.106 3-48-0136-82-2016 7,819,990 1 - 1 - Airport Improvement Program 20.106 3-48-0136-84-2018 5,796,502 399,434 379,232 778,666 - Airport Improvement Program 20.106 3-48-0136-85-2018 9,200,000 - 3,574,110 3,324,331 249,779 Airport Improvement Program 20.106 3-48-0136-86-2016 2,000,000 - 7,716 - 7,716 Airport Improvement Program 20.106 3-48-0136-87-2016 7,549,126 - 3,809,288 2,481,846 1,327,442 Transportation Security Administration-Law Enf. Officer Reimb. Program FY 16 Law Enforcement Officer Reimbursement Program 97.090 HSTS0216HSLR878 41,400 12,294 - 12,294 - FY 17 Law Enforcement Officer Reimbursement Program 97.090 HSTS0216HSLR879 41,400 - 40,223 29,117 11,106 Pass Through Texas Department of Transportation: National Highway Traffic Safety - State and Community Highway Safety
STEP - 2018 CMV 20.600 2018-LAREDOPD-S-IYG-0056 87,989 23,243 - 23,243 - STEP - 2019 CMV 21.600 2018-LAREDOPD-S-IYG-00024 89,971 - 88,447 54,389 34,058 STEP - 2018 Comprehensive 20.600 2018-LAREDOPD-S-1YG-0040 100,000 13,920 - 13,920 - STEP - 2019 Comprehensive 21.600 2018-LAREDOPD-S-1YG-00119 109,972 - 109,775 98,532 11,243 STEP - Click It Or Ticket 20.600 2018-LAREDOPD-CIOT-00017 20,436 - 20,436 - 20,436
National Highway Traffic Safety -Alcohol Impaired Driving Countermeasures Incentive Grants I Step - Impaired Driving Mobilization 2018 20.601 2018-LAREDOPD-IDM-00019 37,946 15,265 - 15,265 - Step - Impaired Driving Mobilization 2019 20.601 2019-LAREDOPD-IDM-00025 45,856 - 45,856 15,372 30,484
Highway Planning & Const.-Federal Aid Hwy Pgm, Fed Lands Hwy Pgm * 20.205 50-19XF0011 810,000 - 329,125 173,165 155,960 Highway Planning & Const.-Federal Aid Hwy Pgm, Fed Lands Hwy Pgm * 20.205 50-18XF0011 508,553 188,007 - 188,007 - Highway Planning and Construction-Scott & Sanchez Streets RR Grade Separation * 20.205 CSJ-0922-33-105 393,873 - - - - Highway Planning and Construction-Zacate Creek Hike & Bike Trail * 20.205 CSJ-0922-33-170 1,000,000 34,560 836,587 85,557 785,590 Highway Planning and Construction-West Laredo Multimodal Trade Corridor-II * 20.205 CSJ-0922-33-076 2,845,747 244,177 5,303 7,711 241,769 Highway Planning and Construction- West Laredo Multimodal Trade Corridor-III * 20.205 CSJ-0922-33-093 18,889,751 174,048 7,710 7,717 174,041 Highway Planning and Construction- Chacon Creek Hike & Bike Phase II * 20.205 CSJ-0922-33-142 1,482,244 999 - 999 - Highway Planning and Construction- Chacon Creek Hike & Bike Phase III * 20.205 CSJ-0922-33-149/150 1,243,767 - - - - Highway Planning and Construction- Citywide Traffic Signal Upgrade-Synchronization* 20.205 CSJ-0922-33-158 480,000 92,734 264,000 356,734 -
Total U. S. Department of Transportation $ 97,461,613 4,787,018 14,820,611 16,544,628 3,063,001
U. S. Department of Agriculture
Passed Through Texas Department of State Health Services: Food & Nutrition Service - Special Supplemental Nutrition Program for WIC:
Women, Infants and Children 17-18 10.557 2017-049856-001 $ 4,228,002 1,225,572 108,298 1,333,870 - Women, Infants and Children 18-19 10.557 2017-049856-001 5,142,631 - 4,228,459 3,291,200 937,259 Women, Infants and Children Counties 17-18 10.557 2017-049856-001 1,087,715 310,735 1,274 312,009 - Women, Infants and Children Counties 17-18 10.557 2017-049856-001 1,183,714 - 1,088,143 861,080 227,063
Total U. S. Department of Agriculture $ 11,642,062 1,536,307 5,426,174 5,798,159 1,164,322 (Continued)
335
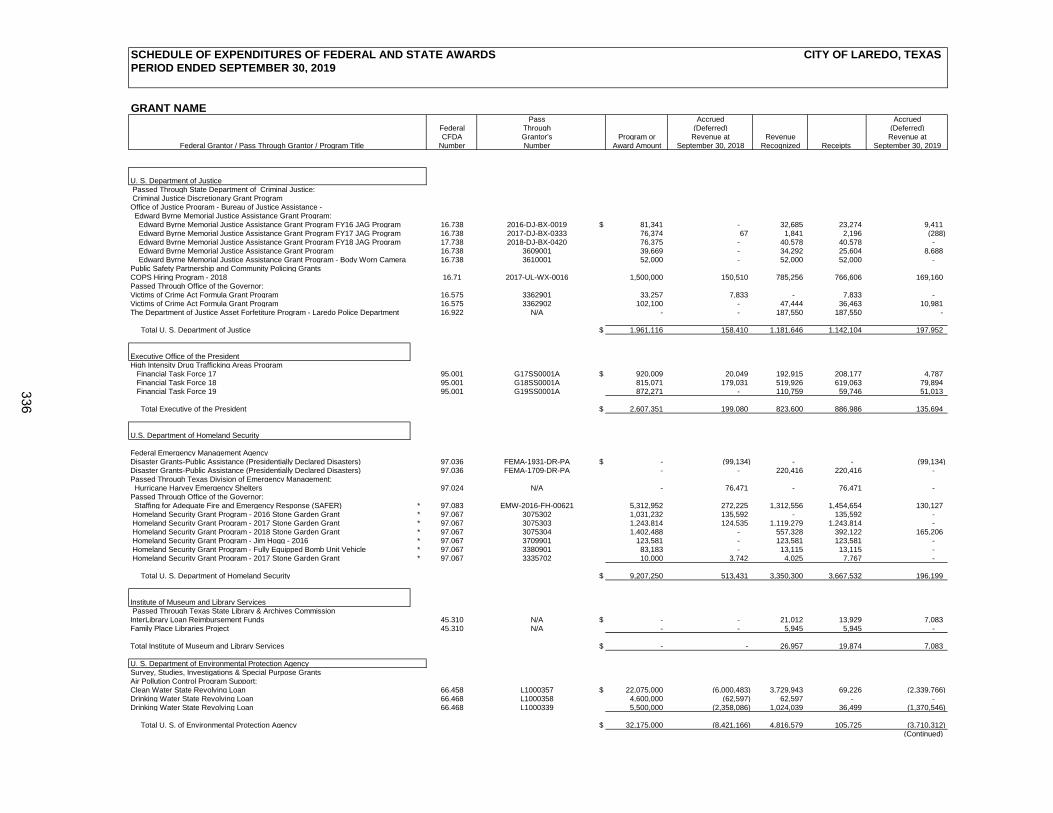
SCHEDULE OF EXPENDITURES OF FEDERAL AND STATE AWARDS CITY OF LAREDO, TEXAS
PERIOD ENDED SEPTEMBER 30, 2019
GRANT NAMEPass Accrued Accrued
Federal Through (Deferred) (Deferred)CFDA Grantor's Program or Revenue at Revenue Revenue at
Federal Grantor / Pass Through Grantor / Program Title Number Number Award Amount September 30, 2018 Recognized Receipts September 30, 2019
U. S. Department of Justice Passed Through State Department of Criminal Justice: Criminal Justice Discretionary Grant ProgramOffice of Justice Program - Bureau of Justice Assistance - Edward Byrne Memorial Justice Assistance Grant Program:
Edward Byrne Memorial Justice Assistance Grant Program FY16 JAG Program 16.738 2016-DJ-BX-0019 $ 81,341 - 32,685 23,274 9,411 Edward Byrne Memorial Justice Assistance Grant Program FY17 JAG Program 16.738 2017-DJ-BX-0333 76,374 67 1,841 2,196 (288) Edward Byrne Memorial Justice Assistance Grant Program FY18 JAG Program 17.738 2018-DJ-BX-0420 76,375 - 40,578 40,578 - Edward Byrne Memorial Justice Assistance Grant Program 16.738 3609001 39,669 - 34,292 25,604 8,688 Edward Byrne Memorial Justice Assistance Grant Program - Body Worn Camera 16.738 3610001 52,000 - 52,000 52,000 -
Public Safety Partnership and Community Policing GrantsCOPS Hiring Program - 2018 16.71 2017-UL-WX-0016 1,500,000 150,510 785,256 766,606 169,160 Passed Through Office of the Governor:Victims of Crime Act Formula Grant Program 16.575 3362901 33,257 7,833 - 7,833 - Victims of Crime Act Formula Grant Program 16.575 3362902 102,100 - 47,444 36,463 10,981 The Department of Justice Asset Forfetiture Program - Laredo Police Department 16.922 N/A - - 187,550 187,550 -
Total U. S. Department of Justice $ 1,961,116 158,410 1,181,646 1,142,104 197,952
Executive Office of the PresidentHigh Intensity Drug Trafficking Areas Program
Financial Task Force 17 95.001 G17SS0001A $ 920,009 20,049 192,915 208,177 4,787 Financial Task Force 18 95.001 G18SS0001A 815,071 179,031 519,926 619,063 79,894 Financial Task Force 19 95.001 G19SS0001A 872,271 - 110,759 59,746 51,013
Total Executive of the President $ 2,607,351 199,080 823,600 886,986 135,694
U.S. Department of Homeland Security
Federal Emergency Management AgencyDisaster Grants-Public Assistance (Presidentially Declared Disasters) 97.036 FEMA-1931-DR-PA $ - (99,134) - - (99,134) Disaster Grants-Public Assistance (Presidentially Declared Disasters) 97.036 FEMA-1709-DR-PA - - 220,416 220,416 - Passed Through Texas Division of Emergency Management: Hurricane Harvey Emergency Shelters 97.024 N/A - 76,471 - 76,471 - Passed Through Office of the Governor: Staffing for Adequate Fire and Emergency Response (SAFER) * 97.083 EMW-2016-FH-00621 5,312,952 272,225 1,312,556 1,454,654 130,127 Homeland Security Grant Program - 2016 Stone Garden Grant * 97.067 3075302 1,031,232 135,592 - 135,592 - Homeland Security Grant Program - 2017 Stone Garden Grant * 97.067 3075303 1,243,814 124,535 1,119,279 1,243,814 - Homeland Security Grant Program - 2018 Stone Garden Grant * 97.067 3075304 1,402,488 - 557,328 392,122 165,206 Homeland Security Grant Program - Jim Hogg - 2016 * 97.067 3709901 123,581 - 123,581 123,581 - Homeland Security Grant Program - Fully Equipped Bomb Unit Vehicle * 97.067 3380901 83,183 - 13,115 13,115 - Homeland Security Grant Program - 2017 Stone Garden Grant * 97.067 3335702 10,000 3,742 4,025 7,767 -
Total U. S. Department of Homeland Security $ 9,207,250 513,431 3,350,300 3,667,532 196,199
Institute of Museum and Library Services Passed Through Texas State Library & Archives CommissionInterLibrary Loan Reimbursement Funds 45.310 N/A $ - - 21,012 13,929 7,083 Family Place Libraries Project 45.310 N/A - - 5,945 5,945 -
Total Institute of Museum and Library Services $ - - 26,957 19,874 7,083
U. S. Department of Environmental Protection AgencySurvey, Studies, Investigations & Special Purpose GrantsAir Pollution Control Program Support:Clean Water State Revolving Loan 66.458 L1000357 $ 22,075,000 (6,000,483) 3,729,943 69,226 (2,339,766) Drinking Water State Revolving Loan 66.468 L1000358 4,600,000 (62,597) 62,597 - - Drinking Water State Revolving Loan 66.468 L1000339 5,500,000 (2,358,086) 1,024,039 36,499 (1,370,546)
Total U. S. of Environmental Protection Agency $ 32,175,000 (8,421,166) 4,816,579 105,725 (3,710,312) (Continued)
336
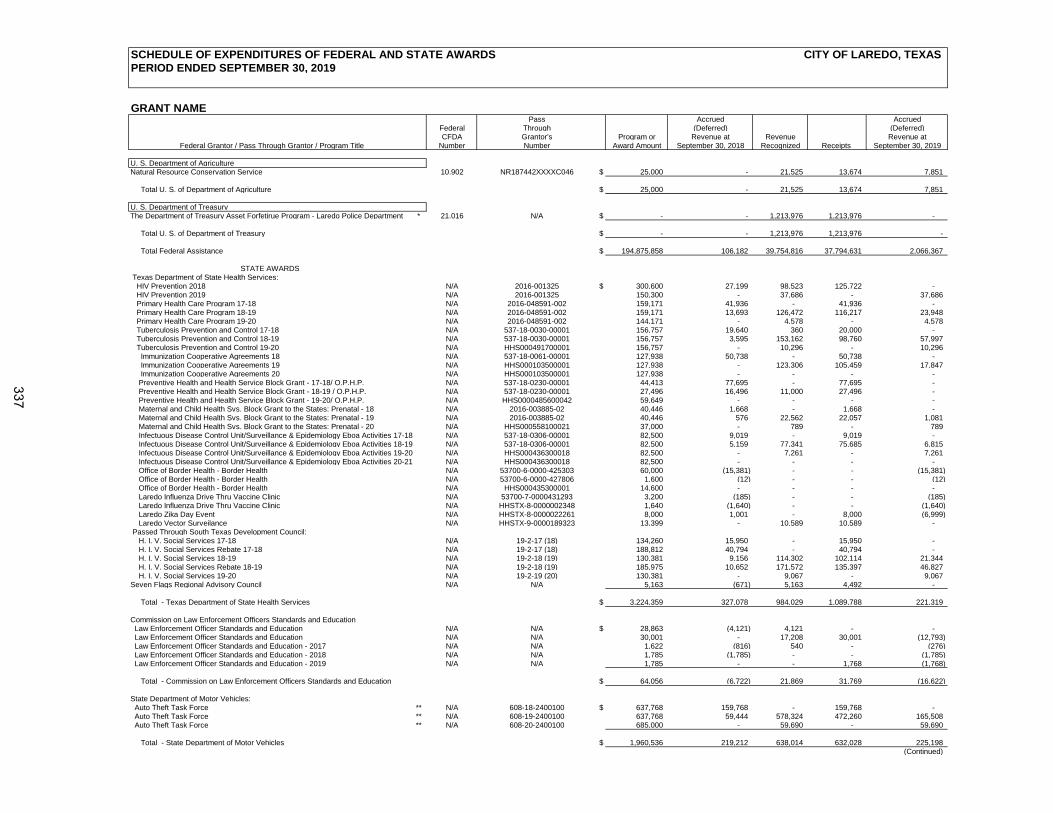
SCHEDULE OF EXPENDITURES OF FEDERAL AND STATE AWARDS CITY OF LAREDO, TEXAS
PERIOD ENDED SEPTEMBER 30, 2019
GRANT NAMEPass Accrued Accrued
Federal Through (Deferred) (Deferred)CFDA Grantor's Program or Revenue at Revenue Revenue at
Federal Grantor / Pass Through Grantor / Program Title Number Number Award Amount September 30, 2018 Recognized Receipts September 30, 2019
U. S. Department of AgricultureNatural Resource Conservation Service 10.902 NR187442XXXXC046 $ 25,000 - 21,525 13,674 7,851
Total U. S. of Department of Agriculture $ 25,000 - 21,525 13,674 7,851
U. S. Department of TreasuryThe Department of Treasury Asset Forfetirue Program - Laredo Police Department * 21.016 N/A $ - - 1,213,976 1,213,976 -
Total U. S. of Department of Treasury $ - - 1,213,976 1,213,976 -
Total Federal Assistance $ 194,875,858 106,182 39,754,816 37,794,631 2,066,367
STATE AWARDS Texas Department of State Health Services: HIV Prevention 2018 N/A 2016-001325 $ 300,600 27,199 98,523 125,722 -
HIV Prevention 2019 N/A 2016-001325 150,300 - 37,686 - 37,686 Primary Health Care Program 17-18 N/A 2016-048591-002 159,171 41,936 - 41,936 - Primary Health Care Program 18-19 N/A 2016-048591-002 159,171 13,693 126,472 116,217 23,948 Primary Health Care Program 19-20 N/A 2016-048591-002 144,171 - 4,578 - 4,578 Tuberculosis Prevention and Control 17-18 N/A 537-18-0030-00001 156,757 19,640 360 20,000 - Tuberculosis Prevention and Control 18-19 N/A 537-18-0030-00001 156,757 3,595 153,162 98,760 57,997 Tuberculosis Prevention and Control 19-20 N/A HHS000491700001 156,757 - 10,296 - 10,296 Immunization Cooperative Agreements 18 N/A 537-18-0061-00001 127,938 50,738 - 50,738 - Immunization Cooperative Agreements 19 N/A HHS000103500001 127,938 - 123,306 105,459 17,847 Immunization Cooperative Agreements 20 N/A HHS000103500001 127,938 - - - - Preventive Health and Health Service Block Grant - 17-18/ O.P.H.P. N/A 537-18-0230-00001 44,413 77,695 - 77,695 - Preventive Health and Health Service Block Grant - 18-19 / O.P.H.P. N/A 537-18-0230-00001 27,496 16,496 11,000 27,496 - Preventive Health and Health Service Block Grant - 19-20/ O.P.H.P. N/A HHS0000485600042 59,649 - - - - Maternal and Child Health Svs. Block Grant to the States: Prenatal - 18 N/A 2016-003885-02 40,446 1,668 - 1,668 - Maternal and Child Health Svs. Block Grant to the States: Prenatal - 19 N/A 2016-003885-02 40,446 576 22,562 22,057 1,081
Maternal and Child Health Svs. Block Grant to the States: Prenatal - 20 N/A HHS000558100021 37,000 - 789 - 789 Infectuous Disease Control Unit/Surveillance & Epidemiology Eboa Activities 17-18 N/A 537-18-0306-00001 82,500 9,019 - 9,019 - Infectuous Disease Control Unit/Surveillance & Epidemiology Eboa Activities 18-19 N/A 537-18-0306-00001 82,500 5,159 77,341 75,685 6,815 Infectuous Disease Control Unit/Surveillance & Epidemiology Eboa Activities 19-20 N/A HHS000436300018 82,500 - 7,261 - 7,261 Infectuous Disease Control Unit/Surveillance & Epidemiology Eboa Activities 20-21 N/A HHS000436300018 82,500 - - - - Office of Border Health - Border Health N/A 53700-6-0000-425303 60,000 (15,381) - - (15,381) Office of Border Health - Border Health N/A 53700-6-0000-427806 1,600 (12) - - (12) Office of Border Health - Border Health N/A HHS000435300001 14,600 - - - - Laredo Influenza Drive Thru Vaccine Clinic N/A 53700-7-0000431293 3,200 (185) - - (185) Laredo Influenza Drive Thru Vaccine Clinic N/A HHSTX-8-0000002348 1,640 (1,640) - - (1,640) Laredo Zika Day Event N/A HHSTX-8-0000022261 8,000 1,001 - 8,000 (6,999) Laredo Vector Surveilance N/A HHSTX-9-0000189323 13,399 - 10,589 10,589 -
Passed Through South Texas Development Council: H. I. V. Social Services 17-18 N/A 19-2-17 (18) 134,260 15,950 - 15,950 - H. I. V. Social Services Rebate 17-18 N/A 19-2-17 (18) 188,812 40,794 - 40,794 - H. I. V. Social Services 18-19 N/A 19-2-18 (19) 130,381 9,156 114,302 102,114 21,344
H. I. V. Social Services Rebate 18-19 N/A 19-2-18 (19) 185,975 10,652 171,572 135,397 46,827 H. I. V. Social Services 19-20 N/A 19-2-19 (20) 130,381 - 9,067 - 9,067
Seven Flags Regional Advisory Council N/A N/A 5,163 (671) 5,163 4,492 -
Total - Texas Department of State Health Services $ 3,224,359 327,078 984,029 1,089,788 221,319
Commission on Law Enforcement Officers Standards and Education Law Enforcement Officer Standards and Education N/A N/A $ 28,863 (4,121) 4,121 - - Law Enforcement Officer Standards and Education N/A N/A 30,001 - 17,208 30,001 (12,793) Law Enforcement Officer Standards and Education - 2017 N/A N/A 1,622 (816) 540 - (276) Law Enforcement Officer Standards and Education - 2018 N/A N/A 1,785 (1,785) - - (1,785) Law Enforcement Officer Standards and Education - 2019 N/A N/A 1,785 - - 1,768 (1,768)
Total - Commission on Law Enforcement Officers Standards and Education $ 64,056 (6,722) 21,869 31,769 (16,622)
State Department of Motor Vehicles: Auto Theft Task Force ** N/A 608-18-2400100 $ 637,768 159,768 - 159,768 - Auto Theft Task Force ** N/A 608-19-2400100 637,768 59,444 578,324 472,260 165,508 Auto Theft Task Force ** N/A 608-20-2400100 685,000 - 59,690 - 59,690
Total - State Department of Motor Vehicles $ 1,960,536 219,212 638,014 632,028 225,198 (Continued)
337
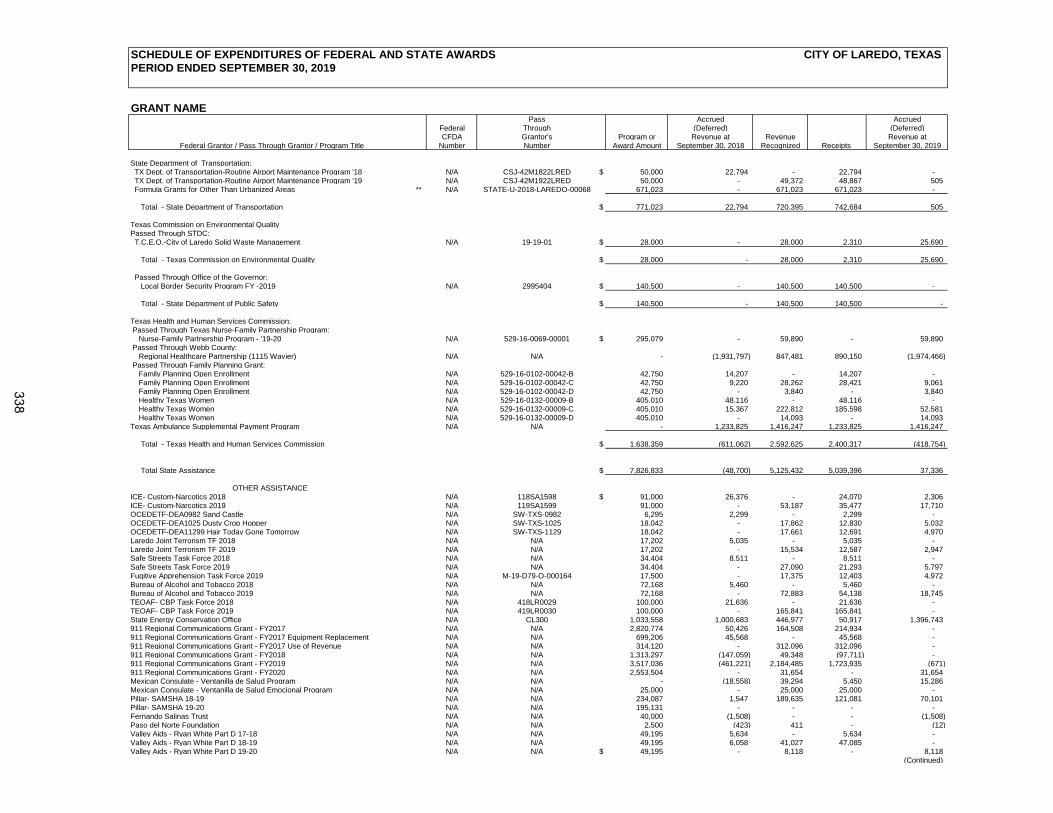
SCHEDULE OF EXPENDITURES OF FEDERAL AND STATE AWARDS CITY OF LAREDO, TEXAS
PERIOD ENDED SEPTEMBER 30, 2019
GRANT NAMEPass Accrued Accrued
Federal Through (Deferred) (Deferred)CFDA Grantor's Program or Revenue at Revenue Revenue at
Federal Grantor / Pass Through Grantor / Program Title Number Number Award Amount September 30, 2018 Recognized Receipts September 30, 2019
State Department of Transportation: TX Dept. of Transportation-Routine Airport Maintenance Program '18 N/A CSJ-42M1822LRED $ 50,000 22,794 - 22,794 - TX Dept. of Transportation-Routine Airport Maintenance Program '19 N/A CSJ-42M1922LRED 50,000 - 49,372 48,867 505 Formula Grants for Other Than Urbanized Areas ** N/A STATE-U-2018-LAREDO-00068 671,023 - 671,023 671,023 -
Total - State Department of Transportation $ 771,023 22,794 720,395 742,684 505
Texas Commission on Environmental QualityPassed Through STDC: T.C.E.Q.-City of Laredo Solid Waste Management N/A 19-19-01 $ 28,000 - 28,000 2,310 25,690
Total - Texas Commission on Environmental Quality $ 28,000 - 28,000 2,310 25,690
Passed Through Office of the Governor: Local Border Security Program FY -2019 N/A 2995404 $ 140,500 - 140,500 140,500 -
Total - State Department of Public Safety $ 140,500 - 140,500 140,500 -
Texas Health and Human Services Commission: Passed Through Texas Nurse-Family Partnership Program:
Nurse-Family Partnership Program - '19-20 N/A 529-16-0069-00001 $ 295,079 - 59,890 - 59,890 Passed Through Webb County:
Regional Healthcare Partnership (1115 Wavier) N/A N/A - (1,931,797) 847,481 890,150 (1,974,466) Passed Through Family Planning Grant:
Family Planning Open Enrollment N/A 529-16-0102-00042-B 42,750 14,207 - 14,207 - Family Planning Open Enrollment N/A 529-16-0102-00042-C 42,750 9,220 28,262 28,421 9,061 Family Planning Open Enrollment N/A 529-16-0102-00042-D 42,750 - 3,840 - 3,840 Healthy Texas Women N/A 529-16-0132-00009-B 405,010 48,116 - 48,116 - Healthy Texas Women N/A 529-16-0132-00009-C 405,010 15,367 222,812 185,598 52,581 Healthy Texas Women N/A 529-16-0132-00009-D 405,010 - 14,093 - 14,093
Texas Ambulance Supplemental Payment Program N/A N/A - 1,233,825 1,416,247 1,233,825 1,416,247
Total - Texas Health and Human Services Commission $ 1,638,359 (611,062) 2,592,625 2,400,317 (418,754)
Total State Assistance $ 7,826,833 (48,700) 5,125,432 5,039,396 37,336
OTHER ASSISTANCEICE- Custom-Narcotics 2018 N/A 118SA1598 $ 91,000 26,376 - 24,070 2,306 ICE- Custom-Narcotics 2019 N/A 119SA1599 91,000 - 53,187 35,477 17,710 OCEDETF-DEA0982 Sand Castle N/A SW-TXS-0982 6,295 2,299 - 2,299 - OCEDETF-DEA1025 Dusty Crop Hopper N/A SW-TXS-1025 18,042 - 17,862 12,830 5,032 OCEDETF-DEA11299 Hair Today Gone Tomorrow N/A SW-TXS-1129 18,042 - 17,661 12,691 4,970 Laredo Joint Terrorism TF 2018 N/A N/A 17,202 5,035 - 5,035 - Laredo Joint Terrorism TF 2019 N/A N/A 17,202 - 15,534 12,587 2,947 Safe Streets Task Force 2018 N/A N/A 34,404 8,511 - 8,511 - Safe Streets Task Force 2019 N/A N/A 34,404 - 27,090 21,293 5,797 Fugitive Apprehension Task Force 2019 N/A M-19-D79-O-000164 17,500 - 17,375 12,403 4,972 Bureau of Alcohol and Tobacco 2018 N/A N/A 72,168 5,460 - 5,460 - Bureau of Alcohol and Tobacco 2019 N/A N/A 72,168 - 72,883 54,138 18,745 TEOAF- CBP Task Force 2018 N/A 418LR0029 100,000 21,636 - 21,636 - TEOAF- CBP Task Force 2019 N/A 419LR0030 100,000 - 165,841 165,841 - State Energy Conservation Office N/A CL300 1,033,558 1,000,683 446,977 50,917 1,396,743 911 Regional Communications Grant - FY2017 N/A N/A 2,820,774 50,426 164,508 214,934 - 911 Regional Communications Grant - FY2017 Equipment Replacement N/A N/A 699,206 45,568 - 45,568 - 911 Regional Communications Grant - FY2017 Use of Revenue N/A N/A 314,120 - 312,096 312,096 - 911 Regional Communications Grant - FY2018 N/A N/A 1,313,297 (147,059) 49,348 (97,711) - 911 Regional Communications Grant - FY2019 N/A N/A 3,517,036 (461,221) 2,184,485 1,723,935 (671) 911 Regional Communications Grant - FY2020 N/A N/A 2,553,504 - 31,654 - 31,654 Mexican Consulate - Ventanilla de Salud Program N/A N/A - (18,558) 39,294 5,450 15,286 Mexican Consulate - Ventanilla de Salud Emocional Program N/A N/A 25,000 - 25,000 25,000 - Pillar- SAMSHA 18-19 N/A N/A 234,087 1,547 189,635 121,081 70,101 Pillar- SAMSHA 19-20 N/A N/A 195,131 - - - - Fernando Salinas Trust N/A N/A 40,000 (1,508) - - (1,508) Paso del Norte Foundation N/A N/A 2,500 (423) 411 - (12) Valley Aids - Ryan White Part D 17-18 N/A N/A 49,195 5,634 - 5,634 - Valley Aids - Ryan White Part D 18-19 N/A N/A 49,195 6,058 41,027 47,085 - Valley Aids - Ryan White Part D 19-20 N/A N/A $ 49,195 - 8,118 - 8,118
(Continued)
338
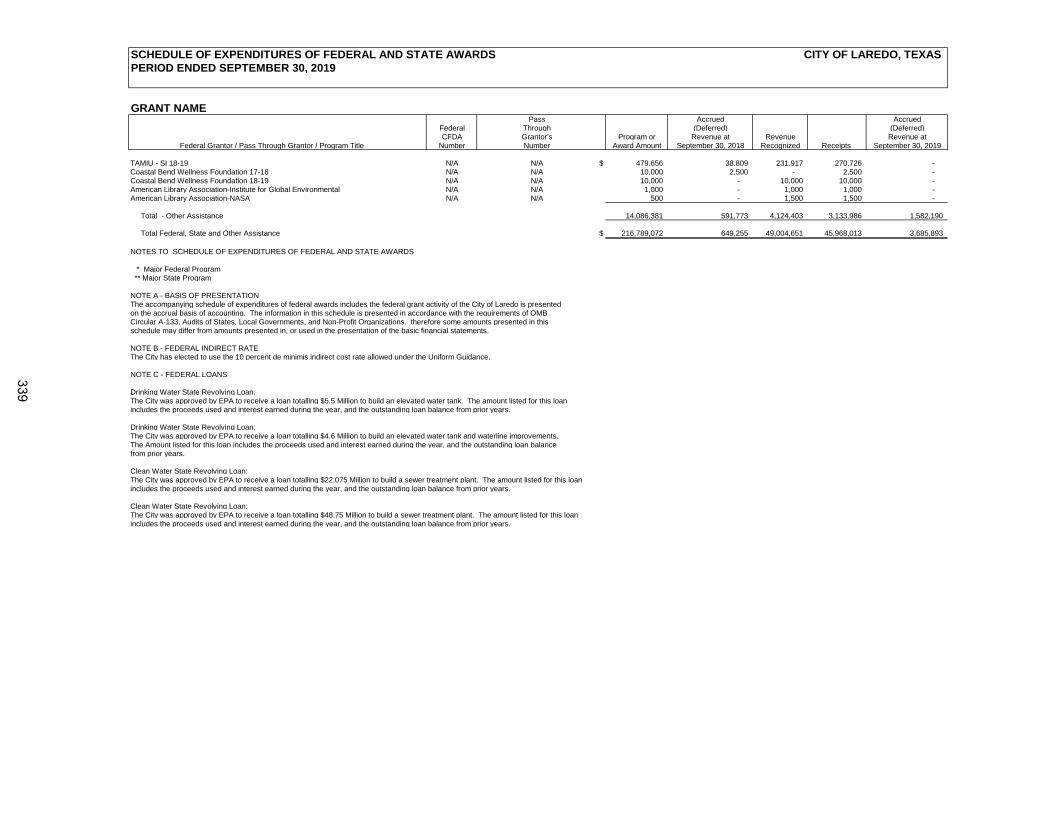
SCHEDULE OF EXPENDITURES OF FEDERAL AND STATE AWARDS CITY OF LAREDO, TEXAS
PERIOD ENDED SEPTEMBER 30, 2019
GRANT NAMEPass Accrued Accrued
Federal Through (Deferred) (Deferred)CFDA Grantor's Program or Revenue at Revenue Revenue at
Federal Grantor / Pass Through Grantor / Program Title Number Number Award Amount September 30, 2018 Recognized Receipts September 30, 2019
TAMIU - SI 18-19 N/A N/A $ 479,656 38,809 231,917 270,726 - Coastal Bend Wellness Foundation 17-18 N/A N/A 10,000 2,500 - 2,500 - Coastal Bend Wellness Foundation 18-19 N/A N/A 10,000 - 10,000 10,000 - American Library Association-Institute for Global Environmental N/A N/A 1,000 - 1,000 1,000 - American Library Association-NASA N/A N/A 500 - 1,500 1,500 -
Total - Other Assistance 14,086,381 591,773 4,124,403 3,133,986 1,582,190
Total Federal, State and Other Assistance $ 216,789,072 649,255 49,004,651 45,968,013 3,685,893
NOTES TO SCHEDULE OF EXPENDITURES OF FEDERAL AND STATE AWARDS
* Major Federal Program ** Major State Program
NOTE A - BASIS OF PRESENTATIONThe accompanying schedule of expenditures of federal awards includes the federal grant activity of the City of Laredo is presentedon the accrual basis of accounting. The information in this schedule is presented in accordance with the requirements of OMBCircular A-133, Audits of States, Local Governments, and Non-Profit Organizations. therefore some amounts presented in thisschedule may differ from amounts presented in, or used in the presentation of the basic financial statements.
NOTE B - FEDERAL INDIRECT RATEThe City has elected to use the 10 percent de minimis indirect cost rate allowed under the Uniform Guidance.
NOTE C - FEDERAL LOANS
Drinking Water State Revolving Loan:The City was approved by EPA to receive a loan totalling $5.5 Million to build an elevated water tank. The amount listed for this loanincludes the proceeds used and interest earned during the year, and the outstanding loan balance from prior years.
Drinking Water State Revolving Loan:The City was approved by EPA to receive a loan totalling $4.6 Million to build an elevated water tank and waterline improvements.The Amount listed for this loan includes the proceeds used and interest earned during the year, and the outstanding loan balancefrom prior years.
Clean Water State Revolving Loan:The City was approved by EPA to receive a loan totalling $22.075 Million to build a sewer treatment plant. The amount listed for this loanincludes the proceeds used and interest earned during the year, and the outstanding loan balance from prior years.
Clean Water State Revolving Loan:The City was approved by EPA to receive a loan totalling $48.75 Million to build a sewer treatment plant. The amount listed for this loanincludes the proceeds used and interest earned during the year, and the outstanding loan balance from prior years.
339
340
341
City of Laredo, Texas
Federal Schedule of Findings and Questioned Costs Year Ended September 30, 2019
Section I - Summary of Auditors’ Results Financial Statements Type of auditors’ report issued: Unqualified Internal control over financial reporting: Material weakness(es) identified? yes X no Significant deficiencies identified that are not considered to be material weaknesses? yes X none reported Noncompliance material to financial statements noted? yes X no Federal Awards Internal Control over major programs: Material weakness(es) identified? yes X no Significant deficiencies identified that are not considered to be material weaknesses? yes X none reported Type of auditors’ report issued on compliance for major programs: Unqualified Any audit findings disclosed that are required to be reported in accordance with 2 CFR 200.516(a)? yes X no Identification of major programs: CFDA Number(s) Name of Federal Program or Cluster 14.218 Community Development Block Grants 20.205 Highway Planning and Construction Transit Cluster 20.500 Fixed Guideway Modernization Bus & Bus Facility New Starts 20.507 Urbanized Area Program 20.526 Fixed Guideway Modernization Bus & Bus Facility New Starts 21.016 The Department of Treasury Asset Forfeiture Program 97.067 Homeland Security Grant Program 97.083 Staffing for Adequate Fire and Emergency Response (SAFER) Dollar threshold used to distinguish between Type A and Type B programs: $1,192,644 Auditee qualified as low-risk auditee? X yes no 342
City of Laredo, Texas Federal Schedule of Findings and Questioned Costs
Year Ended September 30, 2019
Section II - Financial Statement Findings
None.
Section III - Federal Award Findings and Questioned Costs
None.
343
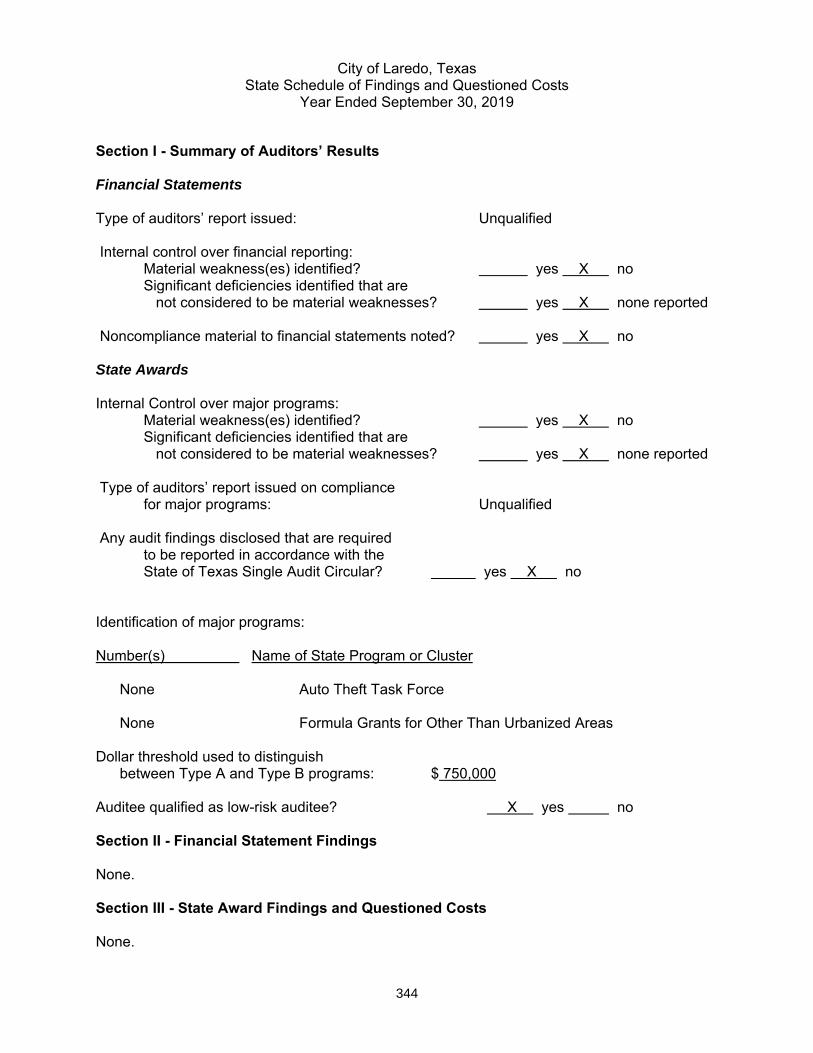
City of Laredo, Texas
State Schedule of Findings and Questioned Costs Year Ended September 30, 2019
Section I - Summary of Auditors’ Results Financial Statements Type of auditors’ report issued: Unqualified Internal control over financial reporting: Material weakness(es) identified? yes X no Significant deficiencies identified that are not considered to be material weaknesses? yes X none reported Noncompliance material to financial statements noted? yes X no State Awards Internal Control over major programs: Material weakness(es) identified? yes X no Significant deficiencies identified that are not considered to be material weaknesses? yes X none reported Type of auditors’ report issued on compliance for major programs: Unqualified Any audit findings disclosed that are required to be reported in accordance with the State of Texas Single Audit Circular? yes X no Identification of major programs: Number(s) Name of State Program or Cluster None Auto Theft Task Force None Formula Grants for Other Than Urbanized Areas Dollar threshold used to distinguish between Type A and Type B programs: $ 750,000 Auditee qualified as low-risk auditee? X yes no Section II - Financial Statement Findings None.
Section III - State Award Findings and Questioned Costs None.
344
City of Laredo, Texas Federal Summary Schedule of Prior Audit Findings
Year Ended September 30, 2019
Summary of Prior Audit Findings
Federal Award Findings and Questioned Costs
None.
345
City of Laredo, Texas State Summary Schedule of Prior Audit Findings
Year Ended September 30, 2019 Summary of Prior Audit Findings State Award Findings and Questioned Costs None.
346