city of los angeles neighborhood parks - rand.org ... our recommendations for future directions are...
TRANSCRIPT

C O R P O R A T I O N
Research Report
City of Los Angeles Neighborhood ParksResearch Findings and Policy Implications (2003–2015)
Deborah A. Cohen, Kathryn Pitkin Derose, Bing Han, Stephanie Williamson,
Terry Marsh, Laura Raaen
Limited Print and Electronic Distribution Rights
This document and trademark(s) contained herein are protected by law. This representation of RAND intellectual property is provided for noncommercial use only. Unauthorized posting of this publication online is prohibited. Permission is given to duplicate this document for personal use only, as long as it is unaltered and complete. Permission is required from RAND to reproduce, or reuse in another form, any of its research documents for commercial use. For information on reprint and linking permissions, please visit www.rand.org/pubs/permissions.html.
The RAND Corporation is a research organization that develops solutions to public policy challenges to help make communities throughout the world safer and more secure, healthier and more prosperous. RAND is nonprofit, nonpartisan, and committed to the public interest.
RAND’s publications do not necessarily reflect the opinions of its research clients and sponsors.
Support RANDMake a tax-deductible charitable contribution at
www.rand.org/giving/contribute
www.rand.org
For more information on this publication, visit www.rand.org/t/rr1573
Published by the RAND Corporation, Santa Monica, Calif.
© Copyright 2016 RAND Corporation
R® is a registered trademark.

iii
Preface
This report summarizes research by the RAND Corporation on how well neighborhood parks in Los Angeles supported physical activity between 2003 and 2015. The report will be of interest to Los Angeles residents and city officials (and residents of other large U.S. cities), public health officials, and park administrators.
We received support from the National Institutes of Health and the Robert Wood Johnson Foundation. In order to conduct this research, we partnered with the City of Los Angeles Department of Recreation and Parks, as well as with AltaMed Health Services, the City Parks Alliance, and the Trust for Public Land.
This research was conducted in RAND Health, a division of the RAND Corporation. A profile of RAND Health, abstracts of its publications, and ordering information can be found at www.rand.org/health.

iv
Table of Contents
Preface ........................................................................................................................................... iiiFigures ............................................................................................................................................. vTables ........................................................................................................................................... viiSummary ...................................................................................................................................... viii1. Introduction ................................................................................................................................. 1
Description of Methods to Study Los Angeles Parks ............................................................................... 1Summary of Park Observations (Use and Characteristics of Users) ......................................................... 3
Los Angeles Neighborhood Parks Contribute Substantially to Population Physical Activity .............. 3Characteristics of Park Users ................................................................................................................ 4
Summary of Park Surveys ....................................................................................................................... 102. Comparison of Los Angeles Parks to Parks Across the United States ...................................... 18
City of Los Angeles Parks: Limited Resources, but Extensive Assets ................................................... 18The National Study of Neighborhood Parks ........................................................................................... 18
3. Recommendations for the Future .............................................................................................. 20Appendix A. Lessons and Insights from Specific Studies ............................................................ 22Appendix B. Parks Included in RAND Studies ............................................................................. 26Appendix C. The National Study of Neighborhood Parks: Preliminary 2014 National-Level
Estimates .................................................................................................................................. 29List of Related Publications ........................................................................................................... 42
v
Figures
Figure 1.1. Sample Park Map .......................................................................................................... 2Figure 1.2. Parks Studied in the City of Los Angeles ..................................................................... 3Figure 1.3. Moderate-to-Vigorous Physical Activity in Neighborhood Parks, by Size .................. 4Figure 1.4. Use of Los Angeles City Parks, by Gender .................................................................. 5Figure 1.5. Use of Los Angeles City Parks, by Age ........................................................................ 6Figure 1.6. Use of Los Angeles City Parks, by Race/Ethnicity ...................................................... 6Figure 1.7. Observed Activity Level in Parks ................................................................................. 7Figure 1.8. Male Park Use, by Age Group and Activity Level ....................................................... 7Figure 1.9. Female Park Use, by Age Group and Activity Level ................................................... 8Figure 1.10. Average Observed Park Use, by Period of Day .......................................................... 8Figure 1.11. Number of People in Parks on Weekdays Compared to Weekends (2008–2015) ...... 9Figure 1.12. Average Energy Expended in Moderate-to-Vigorous Physical Activity,
by Facility Type (measured in metabolic equivalents [METs]) .............................................. 9Figure 1.13. How Often Residents and Park Users Visit Neighborhood Parks ............................ 11Figure 1.14. How Long Residents and Park Users Stay in Neighborhood Parks ......................... 11Figure 1.15. Percentage of Residents and Park Users Who Knew Park Staff ............................... 12Figure 1.16. Staff Grades Given by Residents and Park Users Who Knew Park Staff ................. 12Figure 1.17. Perceived Park Safety ............................................................................................... 13Figure 1.18. Exercise Rates for Residents and Park Users ............................................................ 13Figure 1.19. Exercise Venues ........................................................................................................ 14Figure 1.20. How Residents and Park Users Get to Parks ............................................................ 14Figure 1.21. Estimated Distance to Park from Park Users’ Residences ........................................ 15Figure 1.22. Information Source for Park Programs and Events .................................................. 16Figure 1.23. Usual Park Activities, Residents ............................................................................... 16Figure 1.24. Usual Park Activities, Park Users ............................................................................. 17Figure C.1. Study Cities in the National Study of Neighborhood Parks ....................................... 31Figure C.2. Average Weekly Park Use, by U.S. Region (person × hours/week) .......................... 34Figure C.3. Average Weekly Park Use, by Population Size (person × hours/week) .................... 34Figure C.4. Average Weekly Park Use, by Gender (person × hours/week) .................................. 35Figure C.5. Average Weekly Park Use, by Age Group (person × hours/week) ............................ 35Figure C.6. More People Are Sedentary Than Active ................................................................... 36Figure C.7. Physical Activity Levels, by Age Group .................................................................... 36Figure C.8. Average Daily Park Use, by Time Period of Day (person × hours/period of
a day) ..................................................................................................................................... 37Figure C.9. Average Daily Park Use, by Day of Week (person × hours/day) .............................. 37

vi
Figure C.10. Weekly Park Use, by Local Population Density (person × hours/week) ................. 38Figure C.11. Weekly Park Use, by Local Household Poverty (person × hours/week) ................. 38Figure C.12. Weekly Park Use, by Acreage (person × hours/week) ............................................. 39Figure C.13. Park Use per Acre, by Park Size .............................................................................. 39Figure C.14. Observed Supervised Activities by Population Density(based on 12 visits to
each park) .............................................................................................................................. 40Figure C.15. Observed Supervised Activities, by Park Size (based on 12 visits to each park) ... 40Figure C.16. Observed Supervised Activities, by Region (based on 12 visits to each park) ....... 41Figure C.17. Percentage of Parks with Specific Conditions Observed on at Least One Day ....... 41

vii
Tables
Table 1.1. Comparison of Los Angeles City Population and Park Users Population ..................... 5Table 2.1. Park Resources and Assets, Selected U.S. Cities ......................................................... 18Table 2.2. Comparison of Los Angeles Parks to Parks Across the United States ......................... 19Table C.1. U.S. Cities in the National Study of Neighborhood Parks Sample ............................. 30Table C.2. Sampling of Neighborhood Parks in the National Study of Neighborhood Parks ...... 32Table C.3. Park Observation Schedule .......................................................................................... 33

viii
Summary
This report summarizes more than a decade of research on how well neighborhood parks in Los Angeles support physical activity. Between 2003 and 2015, with funding primarily from the National Institutes of Health, researchers at the RAND Corporation studied 83 parks in the city of Los Angeles, conducting thousands of observations and fielding nearly 28,000 surveys of park users and local residents. Our recommendations for future directions are based on this work.
Los Angeles has a wealth of assets in public parks and an excellent climate that encourages people to spend time outdoors. Parks are venues that not only support physical activity but are also places where people can go to relax, socialize, or just spend time in a natural setting and soak up some sunshine. Compared with many cities across the country, Los Angeles city parks are used more frequently, and they have more facilities, amenities, and organized activities. In any given neighborhood, about half of all residents said that they used the parks, most of them routinely. When they visited a park, they reported staying for one or two hours. Parks are also the top venue that people choose for engaging in routine exercise. The majority of residents, including residents of low-income, high-crime neighborhoods, consider their neighborhood parks safe or very safe. We also found that parks get more use when they are larger, when they have more facilities, when they offer more planned activities and events, and when their services and activities are marketed to the public.
While there is frequent activity in city parks, there is room for improvement. Parks are underutilized by girls and teenage girls, and they are especially underutilized by seniors. Overall, nearly half of all Los Angeles city residents living within 1 mile of a park did not use that park. Most did not know about the activities that were offered, and the majority of residents and more than a third of park users did not know the park’s staff.
Our top three recommendations are as follows:
• The city of Los Angeles should devote a larger proportion of its budget to city parks. Park spending per capita in Los Angeles is currently less than half of the per capita amounts that are spent by New York, Seattle, and San Francisco. Although the city is already doing a lot with very few resources, parks and park use would likely improve if there were more funding to support outreach, programs, and capital improvements.
• More resources should be devoted to outreach and marketing. Many residents and park users do not know park staff and do not find out about park programs and events, so parks are often underutilized, and many programs are undersubscribed. A marketing team needs to take advantage of all types of media to effectively promote park activities.
• A tracking system should be instituted so that park administrators can assess the impact of their efforts to improve programming outreach and facilities. This information will be useful to guide future decisions on programming, outreach, and capital improvements.

ix
The City of Los Angeles Department of Recreation and Parks has a strong infrastructure but could benefit from additional investments in programming, outreach, and capital improvements. A tracking system could be useful for evaluating new efforts, as well as to provide evidence of the extensive use of city parks.

1
1. Introduction
Over the past 13 years, between 2003 and 2015, RAND staff have conducted research on neighborhood parks with a primary focus on the city of Los Angeles. The work was motivated by our interests in studying and promoting health and well-being, with an emphasis on physical activity. Public parks are open spaces available to all, regardless of income, place of residence, or personal characteristics, and are settings designed for physical activity, which is critical for growth and development among children and maintaining health among adults.
Our studies have all been designed to understand how parks might facilitate greater levels of physical activity among local populations. To that end, we have systematically counted park users and recorded their activities, as well as park conditions, facilities, and management practices, to understand how these factors interact. In addition to our work in Los Angeles, we have expanded our studies to 29 cities across the country. Although the United States has a very large infrastructure of parks, which could serve local residents as places to engage in physical activity, most Americans are too sedentary and fail to achieve the recommended amounts of moderate-to-vigorous physical activity. Our goal is to determine how park systems can help families live healthier and more active lives.
Description of Methods to Study Los Angeles Parks
We developed a systematic method of direct observation based on a technique that was initially developed to observe children at recess during the school day (System for Observing Play and Leisure Activity in Youth [SOPLAY]). Working with Thomas McKenzie, the creator of SOPLAY, we developed the System for Observing Parks and Recreation in Communities (SOPARC), which enables us to characterize all park users by gender, age group, activity level, and race/ethnicity. Over the years, we continued to refine our approach to maximize the information collected. We made a special effort to assess activity level and distinguish between sedentary, moderate, and vigorous physical activity. Moderate-to-vigorous physical activity is the most important type of physical activity for maintaining or improving health and well-being. Recently, we have collected physical activity–level information together with age group information to assess whether children, teens, adults, or seniors are engaged in moderate and vigorous physical activity in different areas of neighborhood parks.
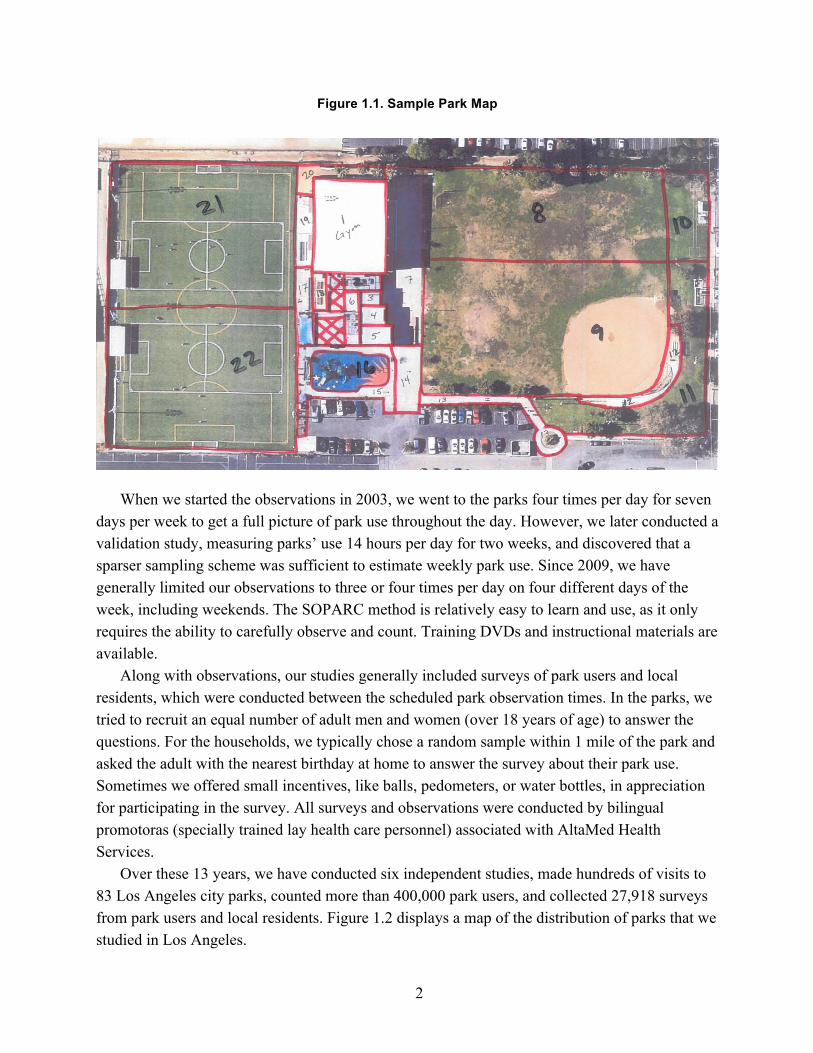
The method entails mapping a park, dividing it into target areas, and then rotating through the park and counting all park users in each target area (see Figure 1.1). At the same time, we documented conditions related to the target area and recorded the kinds of activities in which park users were engaged. Rotating through a park generally takes less than an hour and can be very quick, especially when parks are empty. Larger parks that are busy can be very challenging.
2
Figure 1.1. Sample Park Map
When we started the observations in 2003, we went to the parks four times per day for seven days per week to get a full picture of park use throughout the day. However, we later conducted a validation study, measuring parks’ use 14 hours per day for two weeks, and discovered that a sparser sampling scheme was sufficient to estimate weekly park use. Since 2009, we have generally limited our observations to three or four times per day on four different days of the week, including weekends. The SOPARC method is relatively easy to learn and use, as it only requires the ability to carefully observe and count. Training DVDs and instructional materials are available.
Along with observations, our studies generally included surveys of park users and local residents, which were conducted between the scheduled park observation times. In the parks, we tried to recruit an equal number of adult men and women (over 18 years of age) to answer the questions. For the households, we typically chose a random sample within 1 mile of the park and asked the adult with the nearest birthday at home to answer the survey about their park use. Sometimes we offered small incentives, like balls, pedometers, or water bottles, in appreciation for participating in the survey. All surveys and observations were conducted by bilingual promotoras (specially trained lay health care personnel) associated with AltaMed Health Services.
Over these 13 years, we have conducted six independent studies, made hundreds of visits to 83 Los Angeles city parks, counted more than 400,000 park users, and collected 27,918 surveys from park users and local residents. Figure 1.2 displays a map of the distribution of parks that we studied in Los Angeles.

3
Figure 1.2. Parks Studied in the City of Los Angeles
Summary of Park Observations (Use and Characteristics of Users)
Los Angeles Neighborhood Parks Contribute Substantially to Population Physical Activity
Between 2003 and 2015, we studied 83 Los Angeles city parks, primarily focusing on parks with recreation centers and parks larger than 2 acres. We noted that use of neighborhood parks varies considerably from neighborhood to neighborhood. Los Angeles’ 222 neighborhood parks, between 2 and 20 acres, constitute slightly less than half of all parks serving its nearly 4 million residents. (Other parks that we did not include were very large parks over 20 acres, like Griffith Park, or small pocket parks, specialty parks, or plazas.) During a single week, the neighborhood park system receives approximately 660,000 visits from 404,000 visitors. For these 222 neighborhood parks, we estimated an average of 1.1 million hours of neighborhood park use during a week under clement weather conditions, among which, about one-third, or 378,000 hours, are spent in moderate-to-vigorous physical activity (MVPA). During one week, the

4
average park measuring 10 acres with 40,000 local residents in a 1-mile radius accrues 5,301 hours of use, with 35 percent (1,850 hours) spent in MVPA and 12 percent (635 hours) spent in vigorous physical activity (VPA).
As much as a 10.7-fold difference in weekly MVPA hours was estimated across study parks (see Figure 1.3), which means that there are many small parks (less than a few acres) that attract as many or more users than parks that are larger than 10 acres. Parks’ main contribution to population-level MVPA is for males, teenagers, and residents living within a half mile. Neighborhood parks contribute substantially to population MVPA. The contribution may depend less on size and facilities than on “demand goods”—programming and activities—that draw users to a park.
Figure 1.3. Moderate-to-Vigorous Physical Activity in Neighborhood Parks, by Size
Characteristics of Park Users
Parks are not used equally by all Los Angeles residents.
• Males use parks more than females.• Males are more vigorously active in parks than females.• Children and teens are more likely to use parks than adults and seniors.• Seniors use parks the least, representing only 4 percent of park users, although they
comprise 16 percent of the population.
5
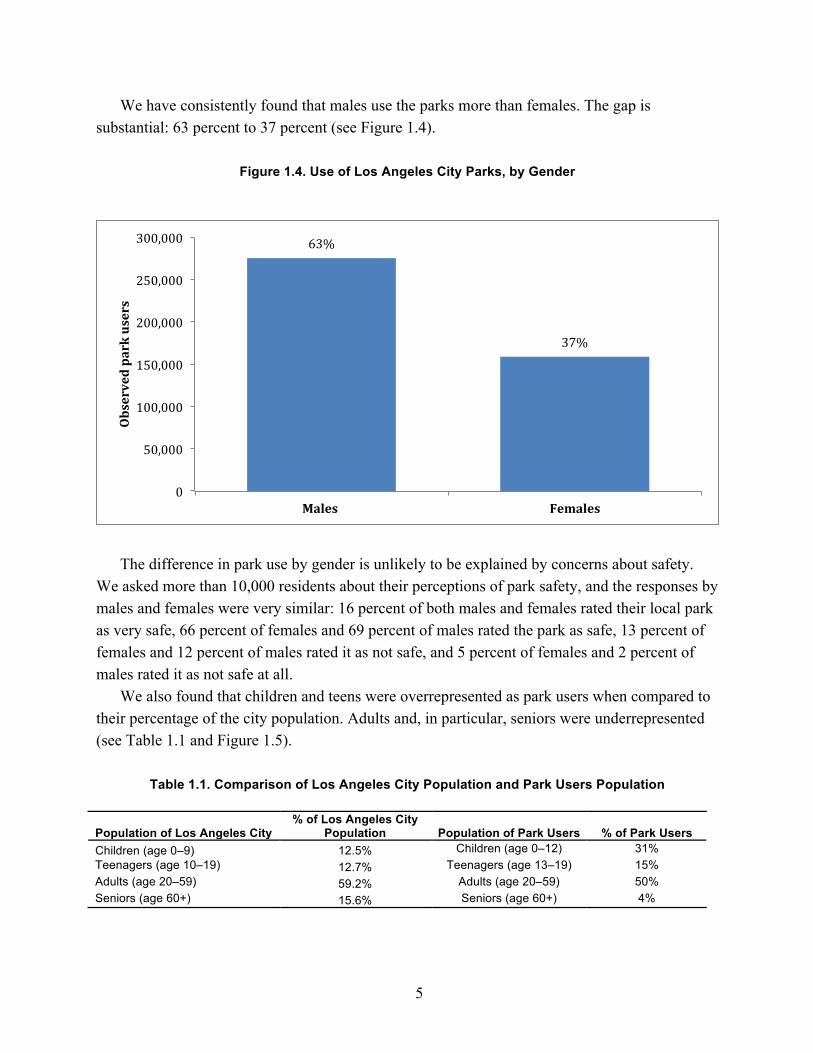
We have consistently found that males use the parks more than females. The gap is substantial: 63 percent to 37 percent (see Figure 1.4).
Figure 1.4. Use of Los Angeles City Parks, by Gender
The difference in park use by gender is unlikely to be explained by concerns about safety.
We asked more than 10,000 residents about their perceptions of park safety, and the responses by males and females were very similar: 16 percent of both males and females rated their local park as very safe, 66 percent of females and 69 percent of males rated the park as safe, 13 percent of females and 12 percent of males rated it as not safe, and 5 percent of females and 2 percent of males rated it as not safe at all.
We also found that children and teens were overrepresented as park users when compared to their percentage of the city population. Adults and, in particular, seniors were underrepresented (see Table 1.1 and Figure 1.5).
Table 1.1. Comparison of Los Angeles City Population and Park Users Population
Population of Los Angeles City % of Los Angeles City
Population Population of Park Users % of Park Users Children (age 0–9) 12.5% Children (age 0–12) 31% Teenagers (age 10–19) 12.7% Teenagers (age 13–19) 15% Adults (age 20–59) 59.2% Adults (age 20–59) 50% Seniors (age 60+) 15.6% Seniors (age 60+) 4%
63%
37%
0
50,000
100,000
150,000
200,000
250,000
300,000
Males Females
Observedparkusers

6
Figure 1.5. Use of Los Angeles City Parks, by Age
There was a relatively high percentage of Latinos using Los Angeles parks; however, our
observations were more likely to include parks in largely Latino neighborhoods (see Figure 1.6).
Figure 1.6. Use of Los Angeles City Parks, by Race/Ethnicity
31%
15%
50%
4%
0
50,000
100,000
150,000
200,000
250,000
Children Teenagers Adults Seniors
Observedparkusers
66%
12%15%
6%
0
50,000
100,000
150,000
200,000
250,000
300,000
350,000
Latino Black White Other
Observedparkusers

7
Most people were sedentary once they were in the park (see Figure 1.7). Children, teens, and males tended to be engaged in more moderate-to-vigorous activity than adults, seniors, and females (see Figure 1.8).
Figure 1.7. Observed Activity Level in Parks
Figure 1.8. Male Park Use, by Age Group and Activity Level
66%
22%
12%
0
50,000
100,000
150,000
200,000
250,000
300,000
350,000
Sedentary Moderate Vigorous
Observedparkusers
-
10,000
20,000
30,000
40,000
Children
Teenagers
Adults
Seniors
Children
Teenagers
Adults
Seniors
Children
Teenagers
Adults
Seniors
Sedentary Moderate Vigorous
Males
Observedparkusers

8
In addition to using the parks less than males, female park users were less likely to engage in moderate and vigorous physical activity than males (see Figure 1.9).
Figure 1.9. Female Park Use, by Age Group and Activity Level
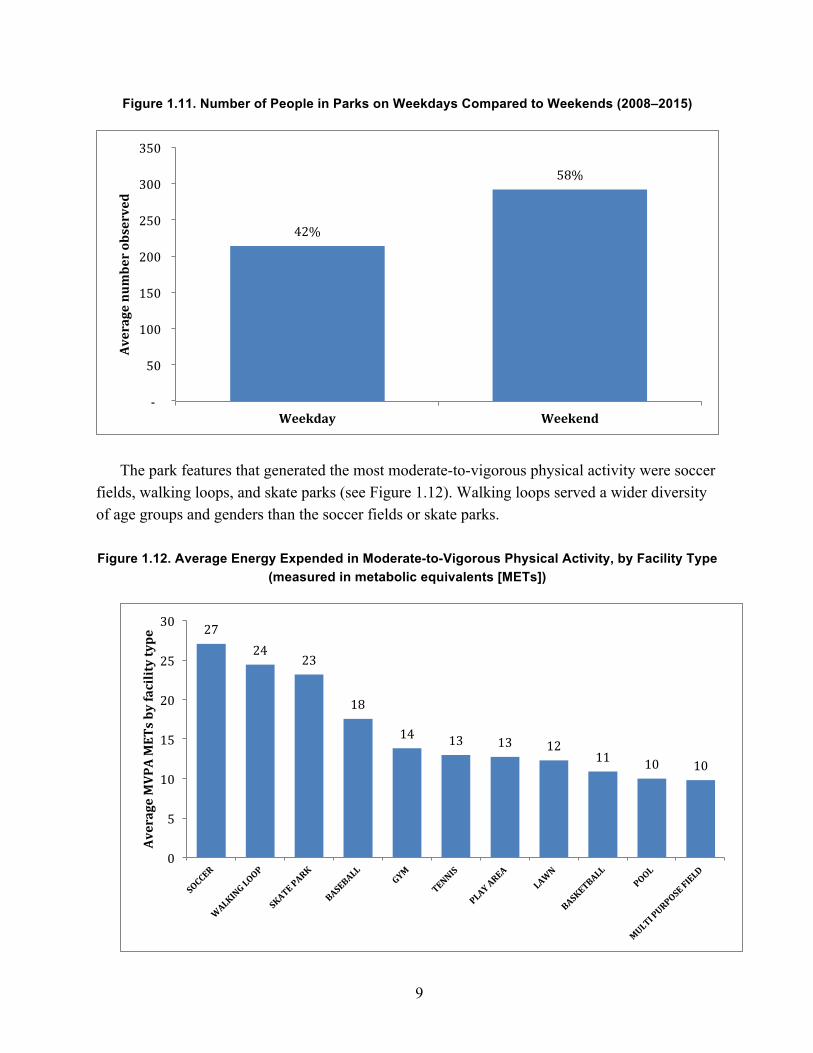
We also found that parks were busier in the afternoons and on the weekends (see Figures
1.10 and 1.11).
Figure 1.10. Average Observed Park Use, by Period of Day
-
10,000
20,000
30,000
40,000Children
Teenagers
Adults
Seniors
Children
Teenagers
Adults
Seniors
Children
Teenagers
Adults
Seniors
Sedentary Moderate Vigorous
Females
Observedparkusers
22%
43%
35%
-
20
40
60
80
100
120
140
160
BeforeNoon Noonto5PM 5PMandafter
Averagenumberobserved
9
Figure 1.11. Number of People in Parks on Weekdays Compared to Weekends (2008–2015)
The park features that generated the most moderate-to-vigorous physical activity were soccer
fields, walking loops, and skate parks (see Figure 1.12). Walking loops served a wider diversity of age groups and genders than the soccer fields or skate parks.
Figure 1.12. Average Energy Expended in Moderate-to-Vigorous Physical Activity, by Facility Type (measured in metabolic equivalents [METs])
42%
58%
-
50
100
150
200
250
300
350
Weekday Weekend
Averagenumberobserved
2724
23
18
14 13 13 1211 10 10
0
5
10
15
20
25
30
AverageMVPAMETsbyfacilitytype

10
Soccer fields and walking loops facilitated the most MVPA in parks, yet these are not very common facilities. Of the 83 parks studied in Los Angeles, 23 percent had a soccer field, 35 percent had a walking loop, 16 percent had a skate park, 82 percent had a baseball field, 89 percent had a gymnasium, 49 percent had tennis courts, 99 percent had a play area, 100 percent had a lawn, 88 percent had basketball courts, and 29 percent had a pool. 11 percent had multipurpose fields.
Parks are used less in lower-income neighborhoods. We found that for every additional 10 percent of households in poverty, there was a 34-percent decline in the number of park users observed and a 37-percent decline in energy expenditure (measured in METs) in the park. However, the relationship between poverty and park use and energy expenditure was reduced when considering the modifiable factors, including the staff, the number of facilities, and the number of organized/supervised activities, as well as when accounting for areas of the parks that were accessible or inaccessible during the measurement periods. When low-income parks had the same number of staff and number of accessible facilities, then the impact of an additional 10-percent of households in poverty was associated with a reduction in park use of 21 percent and a reduction in METs expended of 22 percent.
• Factors correlated with lower park use were fewer part-time staff, fewer programs, and fewer organized and supervised activities.
• People used the park less if they spent more time watching electronic media, if they did not know park staff, and if they perceived their health to be lower.
• Perceptions of lack of safety in the park had a small association with reduced park use among residents, but not among park users
Summary of Park Surveys We collected surveys from park users and residents of households near the park. Because
these two groups are likely to be different, we report the results of their surveys separately. Park users may be local residents, but they also may have traveled far to go to the parks.
Many residents reported using their neighborhood parks often, and those who used local parks used them a lot, but nearly half of all residents never used them at all. Most people surveyed while in the park were frequent visitors. (See Figure 1.13.)

11
Figure 1.13. How Often Residents and Park Users Visit Neighborhood Parks
NOTE: 1 percent of park users we surveyed said that they never used the parks, even though they were in the park during the interview.
Visits to neighborhood parks typically lasted 1–2 hours (Figure 1.14).
Figure 1.14. How Long Residents and Park Users Stay in Neighborhood Parks
31
20
49
81
18
10102030405060708090100
Onceaweekormore Lessthanonceaweek Never
Percentage
Residents ParkUsers
7
21
45
23
4 05
19
45
24
61
0
10
20
30
40
50
60
70
80
90
100
0-30minutes 31-60 1-2hrs 2-3hrs 3-5hrs 5+hrs
Percentage
Residents ParkUsers

12
Although park users were more likely than residents to know park staff, more than one-third of park users did not know the park staff (Figure 1.15).
Figure 1.15. Percentage of Residents and Park Users Who Knew Park Staff
If survey respondents reported knowing the park staff, they were likely to rate park staff
performance highly, with 94 percent providing ratings of “A” or “B” (Figure 1.16).
Figure 1.16. Staff Grades Given by Residents and Park Users Who Knew Park Staff
55
45
35
65
0
10
20
30
40
50
60
70
80
90
100
Doesnotknowparkstaff Knowsparkstaff
Percentage
Residents ParkUsers
65
28
51 0
69
25
51 0
0
10
20
30
40
50
60
70
80
90
100
A B C D F
Percentage
Residents ParkUsers

13
Over 80 percent of residents and park users surveyed considered their neighborhood parks safe or very safe. In low-income neighborhoods, 79 percent of residents rated their local park as safe or very safe; 86 percent of park users in low-income neighborhoods rated their local park as safe or very safe (Figure 1.17).
Figure 1.17. Perceived Park Safety
Up to 40 percent of Los Angeles city residents living within 1 mile of a neighborhood park
said that they did not engage in exercise during their leisure time (Figure 1.18).
Figure 1.18. Exercise Rates for Residents and Park Users
16
67
134
24
65
101
0102030405060708090100
Verysafe Safe Notverysafe Notsafeatall
Percentage
Residents ParkUsers
40
60
31
69
0
10
20
30
40
50
60
70
80
90
100
Doesnotusuallyexercise Usuallyexercises
Percentage
Residents ParkUsers

14
For those who did exercise, parks were the most common venue chosen (Figure 1.19).
Figure 1.19. Exercise Venues
Approximately half of both residents and park users said that they had driven to the park,
while more than 40 percent had walked there (Figure 1.20).
Figure 1.20. How Residents and Park Users Get to Parks
3828
15 145
66
157 11
20102030405060708090100
Park Home PrivateHealthClub
Street/Sidewalk Other
Percentage
Residents ParkUsers
43
4
52
1 0
45
3
51
1 00102030405060708090100
Walk Bike Car BusorPublicTrans.
Other
Percentage
Residents ParkUsers

15
Most park users lived within a mile of the park, although 18 percent had traveled more than a mile to visit neighborhood parks. Parks in high-income neighborhoods attracted more visitors from farther distances (Figure 1.21).
Figure 1.21. Estimated Distance to Park from Park Users’ Residences
Most residents and park users did not know about activities and events occurring in the park. Those who did know about park activities mainly relied on information already in the park, such as banners and flyers. There was limited use of electronic communications and social media by residents and park users to gain information about activities and events occurring in the park (Figure 1.22).
3427
21 18
0
10
20
30
40
50
60
70
80
90
100
Lessthan1/4mile 1/4to1/2mile 1/2to1mile Morethan1mile
Percentage

16
Figure 1.22. Information Source for Park Programs and Events
NOTE: RAP = Recreation and Parks.
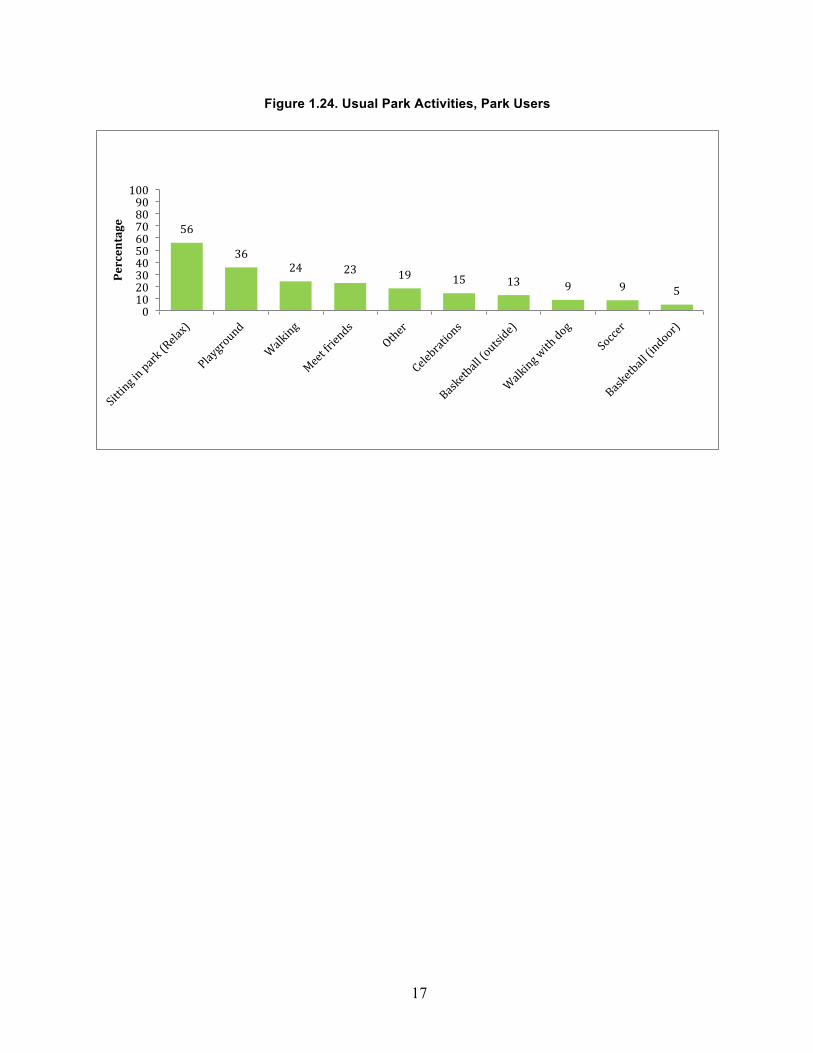
Both residents and park users said that their primary activity in the park was simply sitting or relaxing. Use of the playground was the second most common activity in the park, while walking was the third (Figures 1.23 and 1.24).
Figure 1.23. Usual Park Activities, Residents
0 10 20 30 40 50 60 70 80 90 100
DonotfindoutWordofMouth
BannersFlyersatpark
FromparkofficeMessage/bulletinboard
Flyersfromchild'sschool Park/RAPwebsite
OtherMailingEmail
ParkUsers Residents
51
29 2923 21
13 13 13 8 6
0102030405060708090100
Percentage
17
Figure 1.24. Usual Park Activities, Park Users
56
3624 23 19 15 13 9 9 5
0102030405060708090100
Percentage

18
2. Comparison of Los Angeles Parks to Parks Across the United States
City of Los Angeles Parks: Limited Resources, but Extensive Assets
According to the Trust for Public Land,1 park land comprises about 13.2 percent of the city of Los Angeles, and 55 percent of the population lives within half a mile of a park. The city of Los Angeles devotes $94 per capita to park spending, which is considerably less than similar cities (see Table 2.1). However, Los Angeles does quite a lot with the limited resources available.
Table 2.1. Park Resources and Assets, Selected U.S. Cities
Spending per Capita, FY 2016
% of Population Living Within 1/2 Mile of a Park
Acres of Land per 1,000 Residents
Number of Park Employees per
10,000 Residents
Los Angeles $94 55% 9.9 3.5 San Francisco $241 99% 6.7 9.1
Oakland $137 85% 14.7 6.3
San Diego $118 77% 32.9 5.5
Sacramento $135 78% 11.5 5.2
New York City $205 97% 4.7 6.3
Chicago $173 92% 4.6 10.9
Portland $172 85% 23.4 7.9
Seattle $281 93% 9.9 13.1
SOURCE: The Trust for Public Land, 2016 City Park Facts, Washington, D.C., April 2016; and the Trust for Public Land, “2016 City Park Facts—Spending and Staffing Data,” 2016.
The National Study of Neighborhood Parks We are in the midst of conducting the National Study of Neighborhood Parks, which includes
174 parks in 25 cities across the United States. Los Angeles is one of the randomly selected cities included in this study. For this study, we randomly selected a sample of 16 neighborhood parks in Los Angeles. The preliminary findings from this national study are included in Appendix C.
1 The Trust for Public Land, 2016 City Park Facts, Washington, D.C., April 2016.

19
Table 2.2 compares these 16 Los Angeles city parks to the averages of parks in other megacities (including Los Angeles) with a population over 1,000,000 and in medium and small cities in the United States. We measured accessibility (whether a park facility was open and available for use), usability (whether a facility was operable and could be used as intended), and vacancy (whether the facility was vacant, meaning that there were no users taking advantage of the space or equipment available).
Los Angeles compares favorably with most other cities. Los Angeles city parks are slightly larger, have more facilities in them, are better used, and have more supervised activities. However, Los Angeles city parks have more facilities that are likely to be inaccessible or locked, and there are also more homeless persons, litter, and graffiti in the parks.
Table 2.2. Comparison of Los Angeles Parks to Parks Across the United States
Los Angeles
Megacity (Population
Over 1,000,000)
Medium City (Population Between
200,000 and 1,000,000)
Small City (Population
Under 200,000) 3 Cities 11 Cities 11 Cities (n = 16 parks) (n = 46 parks) (n = 78 parks) (n = 50 parks) Average population density (1 mile)
39,694 52,302 17,017 9,430
Average park size (acres) 10.18 9.36 8.69 8.58 Average number of types of facilities
11 9 7 6
Average number of park users (during one hour) 100 75 20 12
Average number of supervised activities (during one hour)
3.98 2.15 2.37 0.65
Average accessibility rate (during one hour)
93.61% 96.28% 97.92% 99.95%
Average usability rate (during one hour)
99.83% 98.89% 98.84% 98.39%
Average vacancy rate (during one hour; includes fields, courts, play areas, pools, and gyms)
52.87% 59.70% 77.79% 80.37%
% of parks with observed homeless persons
87.5% 43.5% 32.1% 6.0%
% of parks with moderate to a lot of litter*
66.7% 54.3% 48.2% 50.0%
% of parks with moderate to a lot of graffiti
60.0% 17.7% 12.3% 5.3%
* We found that litter in parks was associated with higher levels of park use. It is likely that litter is a consequence of higher levels of park use in Los Angeles.

20
3. Recommendations for the Future
1. Seek additional funding. The level of funding for Los Angeles city parks is well below that of comparable cities and is only average for the United States. Efforts can include appeals to taxpayers, private nonprofits, and philanthropists. Funding is needed to expand programming, services, facilities, and capital improvements—all of which are needed to adequately serve residents.
2. Increase marketing and outreach for all parks and improve customer service. Because both residents and park users have difficulty finding out about park programs and events, additional marketing and outreach efforts are needed. Additional park staff training may help increase outreach. It may be useful to encourage staff to walk around the premises, introduce themselves to park users, and get to know the community better.
3. Develop and implement a routine tracking system. Routine surveillance would help staff assess park use and monitor effectiveness of park efforts. Currently, park managers have no way to track park use. Adopting a method to determine which programs and features facilitate park use and which are not utilized can inform future investments.
4. Experiment with a variety of different programs to activate park use. Because we noted an association between programming and park use, we expect that offering additional programs could increase park attendance and increase levels of physical activity. However, low-income parks represent a special challenge, and more resources and innovative ideas may be required to stimulate more park use in these neighborhoods.
5. Make greater use of social media and email. Few park users or residents reported receiving communications about the parks through these venues, which have otherwise been effective to broaden outreach.
6. Target females and seniors. Females of all ages are underrepresented in parks, as are seniors. Efforts should be made to identify which programs and facilities would potentially attract more members of these groups to parks. Parks might need more attractive seating areas to accommodate people whose exercise is mainly walking to the park but who need a place to rest before leaving. Few females and seniors reported participating in organized sports. More attention could be paid to offering and publicizing sports that may attract these groups, such as pickleball (an easy-to-learn paddle sport).

21
7. Consider adding walking paths to every park. Our studies indicate that people are more active in parks with walking paths than in those that lack them. Walking paths are a relatively low-cost amenity that attracts users who want to be active.
8. Make all park areas accessible. Many fields are locked when not in use but could be used by groups when these areas have not been reserved.

22
Appendix A. Lessons and Insights from Specific Studies
Below we describe eight studies that RAND researchers have conducted about parks and physical activity and the lessons learned. Study 1. What is the impact of renovations from Proposition K funding (a ballot measure dedicating $25 million per year for 25 years to improve local parks)? (conducted 2003–2008)
We measured park use before and after renovations were completed in five parks by comparing them with five similar parks that did not undergo renovations in 2003–2008. The renovations included new gyms, a new senior center, and a new skate park. We also studied how parks might contribute to health and physical activity.
• The renovations were associated with increases in perceptions of safety but were not associated with increased park use for all parks studied, except for the skate parks. In fact, park use declined after the renovations. Reasons included the following:
− curtailment in hours that facilities were open − reductions in the amount of programming and supervised activities − replacement facilities that did not have unique features or support new activities.
• People who lived closer to parks were more likely to visit the parks and also more likely to exercise.
• Mental health was significantly related to residential distance from parks, with the highest scores among residents within short walking distance from the park (400m) and decreasing significantly over the next distances.
• Making improvements to facilities alone will not always guarantee increased use. • Programming, staffing, fees, hours of operation, marketing, outreach, and a host of other
human factors must be considered. • Skate parks did increase park use and attracted primarily young males.
Study 2. Validation of Measurement Tools (conducted 2007–2011)
We studied 30 parks in five cities across the United States to understand how well the measurement methods reflected park use.
• Only 12 to 16 hourly measurements per week were sufficient to estimate weekly park use.
• Self-reports of park use were relatively accurate in assessing whether people actually visited a park.
• Physical activity among participants was higher on days that they visited parks than on days when they did not visit. Park visitors were likely to get as much physical activity

23
traveling to the park as they did while they were in the park. Adults were largely sedentary while they visited a park.
Study 3. Assessment of Fitness Zones (conducted 2008–2010; funded by Active Living Research, Robert Wood Johnson Foundation)
We evaluated the impact of outdoor exercise equipment (Fitness Zones [FZs]) in 12 parks serving diverse populations. We used SOPARC to assess use and estimate energy expenditure prior to and twice after FZ installation.
• Park use increased more in FZ parks than in the ten control parks that did not get equipment, but the difference was not statistically significant.
• However, self-reports of being a new park user increased more in FZ parks. • Estimated energy expenditure in FZ parks was higher at both follow-ups than at baseline. • Installing FZs appears to be cost-effective (10.5 cents/MET increase). • FZs were most successful in parks in densely populated areas with limited facilities. • Longer-term follow-up measures are needed to determine whether the early increases in
physical activity associated with the FZ installations were sustained.
Study 4. Assessment of Pocket Parks (conducted 2006–2009)
We evaluated the use of three new pocket parks (less than 1 acre) in low-income neighborhoods.
• Overall, pocket park use compared favorably in promoting moderate-to-vigorous physical activity with that of existing playground space in nearby parks.
• Pocket parks were cost-effective, at $0.73/MET hour gained. • Pocket park visitors walked an average of 0.25 miles to get to a park. • Pocket parks, when perceived as attractive and safe destinations, may increase physical
activity by encouraging families with children to walk there. • Additional strategies and programs may be needed to encourage more residents to use
these parks.
Study 5. Community-Based Participatory Research (conducted 2009–2013, funded by the National Heart, Blood, and Lung Institute)
This intervention included assessing park use, obtaining feedback from park users and community residents, training park staff on outreach and marketing, and giving each intervention park $4,000 to increase park-based physical activity. There were three study groups: one that included the park advisory board (PAB), one that included only the park director (PD), and a comparison group that did not get any funding or training.
• Relative to control parks where physical activity declined, physical activity increased in both the PD-only and PAB/PD parks, generating an estimated average of 600 more visits per week per park and 1,830 more MET hours of physical activity per week per park.

24
• Both residents and park users in the intervention groups reported increased frequency of exercise.
• No differences were noted between the PD-only and PAB/PD study groups. • Providing park directors and PABs with training on outreach and marketing, feedback on
park users, and modest funds increased the amount of physical activity observed in parks. • The effect was primarily seen in higher-income parks. • Parks were used less in high-poverty areas compared to parks in medium- and low-
poverty areas, even after accounting for differences in size, staffing, and programming. • The strongest correlates of park use were the number of part-time staff, the number of
supervised and organized programs, and knowing the park staff. • Perceptions of safety were not relevant to park use among those interviewed in the park,
but safety had a small relationship with reported frequency of park use among local residents.
• Among park users, time spent watching electronic media was negatively correlated with the frequency of visiting parks.
Racial/Ethnic Differences
• There were few differences among racial/ethnic groups in terms of their frequency of having visited the park in the past seven days.
• However, there were numerous differences in how the groups used the park and their levels of physical activity:
− Blacks and English-speaking Latinos were less likely than whites to report being physically active, exercising in the park, and exercising outside the park.
− Spanish-speaking Latinos were equally likely as whites to report exercising in parks but less likely to report exercising outside the park and more likely to report using the parks for social interactions.
− Asians/Pacific Islanders (PI)/others were more likely than whites to report visiting the park in the past seven days and more likely to report using the parks for social interactions.
• Urban parks appear to be an important resource for physical activity and socialization, in particular among Spanish-speaking Latino and Asian/PI groups.
Study 6. Can Free Classes or a Frequent User Program Attract More Park Users in Low-Income-Area Parks? (conducted 2013–2017)
Low-income-area parks present special challenges. Although they have many similar facilities to higher-income area parks, the neighborhoods have higher rates of crime.
• Concerns about safety and perceived threats have been considered responsible for lower use of parks in high-poverty neighborhoods. To quantify the role of perceived threats on park use, we systematically observed 48 parks and surveyed park users and household residents in low-income neighborhoods in the city of Los Angeles.
• Across all parks, the majority of both park users and local residents perceived parks as safe or very safe. We noted apparently homeless individuals during nearly half of all

25
observations but very few instances of fighting, intimidating groups, smoking, and intoxication.
• The presence of homeless individuals was associated with higher numbers of park users. • The presence of intoxicated persons was associated with lower numbers of park users. • Overall, the strongest predictors of increased park use were the presence of organized and
supervised activities. • However, after offering free classes and an incentive program to visit the park, overall
park use did not change. Study 7. What Is the Impact of a Free Exercise Program in a Park?
The kinesiology program at California State University Northridge decided to offer free fitness classes in public parks. We evaluated the impact of these free classes on park use.
• The classes substantially increased moderate-to-vigorous physical activities, particularly for female park users.
• However, when classes were not offered, there were no differences in park-based physical activity across parks.
• Active programming can increase park-based moderate-to-vigorous physical activity, but without programming, many people may lack the motivation to exercise on their own.
• Creating a partnership between parks and kinesiology programs is a promising health promotion model. Replicating this type of program could yield important health dividends.
Study 8. Comprehensive Park Renovations (conducted 2009–2015, funded by Active Living Research, Robert Wood Johnson Foundation)
This study evaluated change in park use and physical activity levels among five parks that were fully renovated in the San Francisco area.
• Compared with parks that had not yet been renovated, the improved parks saw more than a doubling in the number of visitors and a substantial increase in energy expended in the parks.
• Increased park use was pronounced in adults and children but was not seen in teens and seniors.
• Park renovations were associated with a significantly increased perception of park safety.

26
Appendix B. Parks Included in RAND Studies
109th Street Recreation Center 48th Street Park (now known as Dixon Park) Algin Sutton Recreation Center Alpine Recreation Center Baldwin Hills Recreation Center Banning Recreation Center Barrington Recreation Center Bellevue Recreation Center Boyle Heights Sports Center Central Park Recreation Center Cheviot Hills Recreation Center Costello Recreation Center Culver Slauson Recreation Center David M. Gonzales Recreation Center Delano Recreation Center Denker Recreation Center Eagle Rock Recreation Center El Sereno Recreation Center Elysian Valley Recreation Center Encino Community Center Evergreen Recreation Center Fernangeles Recreation Center Fred Roberts Recreation Center Gilbert W. Lindsay Community Center Glassell Park Recreation Center Granada Hills Recreation Center Green Meadows Recreation Center Harvard Recreation Center Hazard Recreation Center Highland Park Recreation Center Hollenbeck Recreation Center Hollywood Recreation Center Hoover Recreation Center Hubert H. Humphrey Recreation Center Lafayette Recreation Center

27
Lake Street Community Center Lanark Recreation Center Lemon Grove Recreation Center Lincoln Heights Recreation Center Lincoln Park Recreation Center Loren Miller Recreation Center Martin J. Bogdanovich Recreation Center Martin Luther King Jr. Therapeutic Recreation Center Mason Recreation Center Montecito Heights Recreation Center Mount Carmel Recreation Center Normandie Recreation Center North Hollywood Recreation Center Palisades Recreation Center Palms Recreation Center Panorama Recreation Center Pecan Recreation Center Poinsettia Recreation Center Queen Anne Recreation Center Ramon D. Garcia Msgr. Recreation Center Rancho Cienega Ritchie Valens Recreation Center Rose Hill Recreation Center Rosecrans Recreation Center Ross Snyder Recreation Center Rustic Canyon Park Saint Andrews Recreation Center Seoul International Park Sepulveda Recreation Center Shatto Recreation Center Silverlake Recreation Center Slauson Multipurpose Center South Park Recreation Center State Street Recreation Center Stoner Recreation Center Studio City Recreation Center Sun Valley Recreation Center Sylmar Park Recreation Center Tarzana Recreation Center

28
Toberman Recreation Center Trinity Recreation Center Valley Plaza Recreation Center Van Ness Recreation Center Vineyard Recreation Center Wabash Recreation Center Wilmington Recreation Center Winnetka Recreation Center Yosemite Recreation Center

29
Appendix C. The National Study of Neighborhood Parks: Preliminary 2014 National-Level Estimates
Introduction
Supported by funding from the National Institutes of Health, the RAND Corporation, in partnership with the City Parks Alliance2 and the Trust for Public Land,3 is conducting the first national study of neighborhood parks. During the spring and summer of 2014, trained field staff visited 174 neighborhood parks (each between 3 and 20 acres) in 25 jurisdictions and observed park use and conditions. This appendix describes our procedures and initial findings with respect to how neighborhood parks are generally used across the United States.
The Park Sample To choose a representative sample of U.S. cities with a population of at least 100,000, we
identified 289 cities meeting that criterion from the 2010 U.S. Census. After stratifying these cities by population (1 million or greater, 200,000–999,999, and 100,000–199,999) and geographic region (West, Northeast, Midwest, and South), we randomly selected 25 cities to study intensively (see Table C.1 and Figure C.1). All 50 states were in the sampling frame, and by chance all sampled cities were in the 48 continental states. Our complete study sampled 174 neighborhood parks from 25 cities nationwide.
In each of the 25 cities, we enumerated all of the parks from about 3 to 20 acres, using either lists that were directly supplied to us by the local parks and recreation department or lists that were available on the department’s website. We excluded parks meeting the following criteria:
• parks located in a census tract with no or very few residents (airport, prison, military base, hospital, industry facility, etc.)
• pocket parks (smaller than 2 acres) • regional parks (larger than 23 acres) • parks used by schools during business hours • parks serving special purposes only (parkways, boxing gyms, etc.). While our preference was to select parks between 3 and 20 acres, when cities did not have a
large sample of parks in that range, we included parks slightly outside the range. Thus, in eight cities we included ten parks smaller than 3 acres (between 2.2 and 2.9 acres), and in five cities we included five parks larger than 20 acres (between 20.1 and 23 acres). 2 The City Parks Alliance is a national network of urban park and recreation leaders working to increase investment in our nation’s urban parks. 3 The Trust for Public Land is a national organization working to improve park access across the United States.

30
Table C.1. U.S. Cities in the National Study of Neighborhood Parks Sample
U.S. Census Region
City Population (2010 Census)
# of Total Cities
Available # of Cities Sampled Cities Sampled
Nationwide Megacities 1 million or more 9 3
Dallas, Tex. Los Angeles, Calif.
New York, N.Y.
West
200,000–999,999 39 3 Albuquerque, N.M.
Fresno, Calif. San Francisco, Calif.
100,000–199,999 73 3 Pueblo, Colo.
Victorville, Calif. Westminster, Colo.
Northeast 200,000–999,999 6 2 Buffalo, N.Y.
Pittsburgh, Penn.
100,000–199,999 17 2 Manchester, N.H. Yonkers, N.Y.
South
200,000–999,999 40 3
Jacksonville, Fla. Louisville/Jefferson County metro
government (balance), Ky. Winston-Salem, N.C.
100,000–199,999 57 3 Columbus, Ga. Gainesville, Fla.
Waco, Tex.
Midwest
200,000–999,999 17 3 St. Louis, Mo. Lincoln, Neb.
Cleveland, Ohio
100,000–199,999 31 3 Flint, Mich.
Kansas City, Kan. Topeka, Kan.
Total 289 25

31
Figure C.1. Study Cities in the National Study of Neighborhood Parks
Table C.2 summarizes the sampling process of the parks. In each city, we randomly sampled approximately 10 percent of eligible parks. We selected them from a wide range of types of areas in the cities and restricted the selection process such that our sample did not include parks in close proximity (less than a mile) from each other. In addition, half of the parks were chosen from neighborhoods above the median household poverty level and half from below the median household poverty level.

32
Table C.2. Sampling of Neighborhood Parks in the National Study of Neighborhood Parks
Cities Sampled
# of Eligible Neighborhood Parks
(3–20 acres) # of Parks Sampled Albuquerque, N.M. 94 10 Buffalo, N.Y. 41 6 Cleveland, Ohio 57 8 Columbus, Ga. 23 6 Dallas, Tex. 149 14 Flint, Mich. 25 4 Fresno, Calif. 46 6 Gainesville, Fla. 8 2 Jacksonville, Fla. 90 10 Kansas City, Kan. 25 4 Lincoln, Neb. 46 6 Los Angeles, Calif. 147 16 Louisville/Jefferson County metro government (balance), Ky. 46 6 Manchester, N.H. 28 4 New York, N.Y. 148 16 Pittsburgh, Penn. 62 8 Pueblo, Colo. 32 6 San Francisco, Calif. 73 8 St. Louis, Mo. 47 6 Topeka, Kan. 43 6 Victorville, Calif. 14 4 Waco, Tex. 19 4 Westminster, Colo. 42 6 Winston-Salem, N.C. 29 4 Yonkers, N.Y. 28 4 Total 1,362 174

33
Park Use Estimates We mapped all 174 parks and divided each one into distinct target areas. These were
numbered and visited consecutively, so that observations were made in the same order each time the park was observed. We observed each park on 12 occasions—three times per day on two weekdays (Tuesday and Thursday) and on Saturday and Sunday (see Table C.3). We observed only during clement weather. If it rained, the visit was rescheduled to the next clement week, maintaining the day of the week constant (e.g., if it rained on a Tuesday, the team observed the following Tuesday).
Table C.3. Park Observation Schedule
Tuesday Thursday Saturday Sunday 8 a.m. 12 p.m. 9 a.m. 11 a.m. 11 a.m. 3 p.m. 12 p.m. 2 p.m. 2 p.m. 6 p.m. 3 p.m. 5 p.m.
Using a validated scanning technique (SOPARC), observers systematically recorded each
park area user by gender, age group (child, teen, adult, or senior), physical activity level (sedentary, moderate, or vigorous), and apparent race/ethnicity (see Figures C.2 through C.17).
Our estimates of park use are based on the assumption that a park was, on average, usable 11 hours per day (between 8 a.m. and 7 p.m.), seven days per week. Estimates were produced using standard survey methods. All estimates are subject to change in future revisions as refinements are made.
The estimates of park use were calculated in person-hours. Because we only observed snapshots of use, we cannot tell whether the same people or different people were in the park from hour to hour. For example, we would count one person who stayed three hours at the park as three person-hours, the same as if three people stayed in the park for one hour.
Park Conditions: We noted park conditions, including the presence of graffiti and litter, apparently homeless persons, food vendors, dogs off leash, and whether the noise in the park was uncomfortably loud or annoying. To some extent, the ratings of noise, graffiti, and litter were subjective, although we did provide guidance to field staff as to how to rate these conditions. Figure C.17 shows the percentage of parks that had any of these conditions on at least one of the four days that the parks were observed.

34
All population estimates are based on the 2010 U.S. Census. Poverty estimates are based on the 2010 Current Population Survey.
Figure C.2. Average Weekly Park Use, by U.S. Region (person × hours/week)
Figure C.3. Average Weekly Park Use, by Population Size (person × hours/week)
2,1612,301
954788
1,533
0
500
1,000
1,500
2,000
2,500
West Northeast South Midwest National
Averagenumberofweeklyparkusers
Censusregion
1,2051,392
3,180
0
500
1,000
1,500
2,000
2,500
3,000
3,500
100,000to199,999
200,000to<1million
≥1million
Averagenumberof
weeklyparkusers
Totalcitypopulation
This chart shows that parks have greater use in the West and Northeast than in the South and Midwest. However, this disparity is largely accounted for by differences in population and population density, as shown in Figures C.3 and C.10. The average neighborhood park receives visits from about 1,533 persons per week.

35
Figure C.4. Average Weekly Park Use, by Gender (person × hours/week)
Figure C.5. Average Weekly Park Use, by Age Group (person × hours/week)
875
659
0
100
200
300
400
500
600
700
800
900
1000
Males Females
Meannumberofweeklyparkusers
Gender
588
204
674
64
0
100
200
300
400
500
600
700
800
Children Teenagers Adults Seniors
Averagenum
berofweeklyparkusers
Agegroup
U.S. Population
Park Users
Males 49% 57% Females 51% 43%
U.S. Population
Park Users
Children 20% 38% Teens 7% 13% Adults 55% 44% Seniors 18% 4%
This chart shows that there were more males observed in parks than females, even though approximately half of the general population is male.
Children and teens comprise only 27 percent of the U.S. population, yet they represent 51 percent of all park users. Seniors over age 60 are the most underrepresented, comprising 4 percent of all park users when they represent 18 percent of the total population.

36
Figure C.6. More People Are Sedentary Than Active
Figure C.7. Physical Activity Levels, by Age Group
929
604
0
100
200
300
400
500
600
700
800
900
1,000
Sedentary ModeratetoVigorous
Meannumberofweeklyparkusers
Physicalactivitylevel
(61%)
(39%)
301
109
475
44
287
95
200
20
0
50
100
150
200
250
300
350
400
450
500
Children Teenagers Adults Seniors
Weeklyparkuse
Agegroups
Sedentary
Moderatetovigorous

37
Figure C.8. Average Daily Park Use, by Time Period of Day (person × hours/period of a day)*
* The a.m. period covers five hours, while the p.m. period covers six hours.
Figure C.9. Average Daily Park Use, by Day of Week (person × hours/day)
76
148
0
20
40
60
80
100
120
140
160
AM(8:00amto12:59pm) PM(1:00pmto7:00pm)
Meannumberofweeklyparkusers
Periodoftheday
(66%)
(34%)
179
320
0
50
100
150
200
250
300
350
Weekday Weekend
Meannumberofweeklyparkusers

38
Figure C.10. Weekly Park Use, by Local Population Density (person × hours/week)
Figure C.11. Weekly Park Use, by Local Household Poverty (person × hours/week)
6871,140
1,647
3,563
5,727
0
1000
2000
3000
4000
5000
6000
7000
<1,000 1,000to3,499 3,500to6,9997,000to14,999 ≥15,000
Meannumberofweeklyparkusers
Populationwithinahalf-mileradiusaroundpark
1,545
2,040
1,285
1,064
0
500
1000
1500
2000
2500
<10 10to19 20to29 ≥30
Meannumberofweeklyparkusers
%ofhouseholdsinpovertywithinahalf-mileradiusaroundpark
39
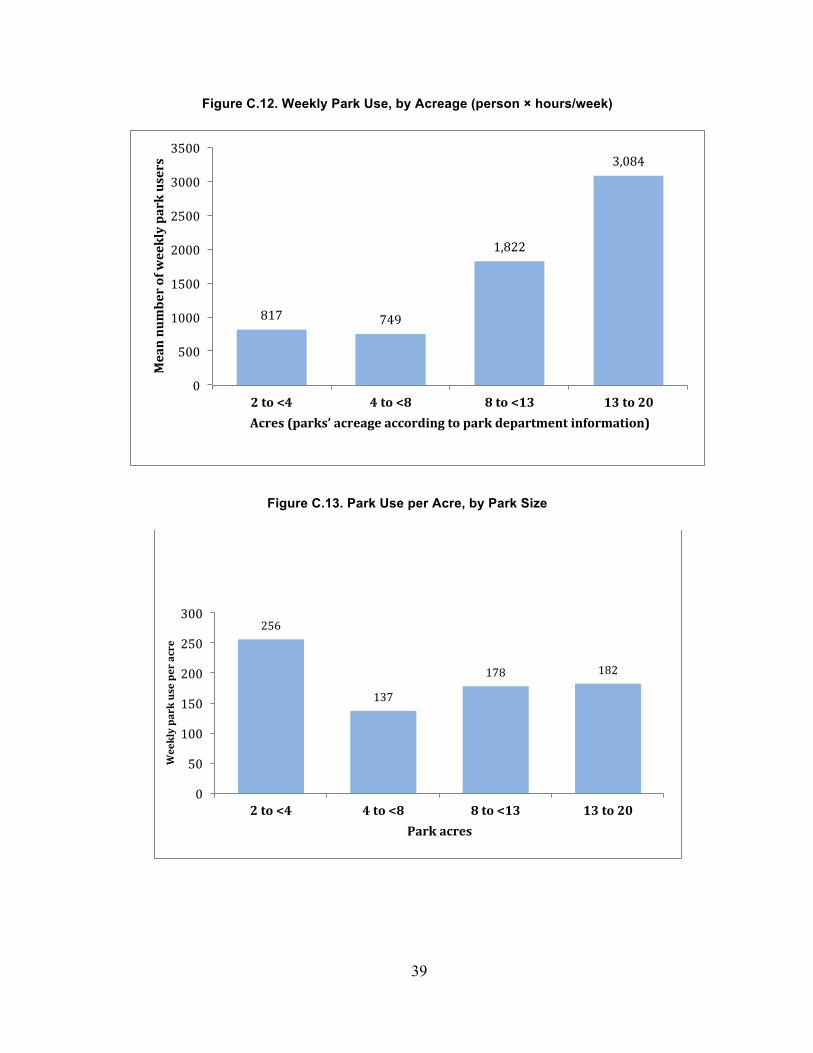
Figure C.12. Weekly Park Use, by Acreage (person × hours/week)
Figure C.13. Park Use per Acre, by Park Size
817 749
1,822
3,084
0
500
1000
1500
2000
2500
3000
3500
2to<4 4to<8 8to<13 13to20
Meannumberofweeklyparkusers
Acres(parks’acreageaccordingtoparkdepartmentinformation)
256
137
178 182
0
50
100
150
200
250
300
2to<4 4to<8 8to<13 13to20
Weeklyparkuseperacre
Parkacres
40
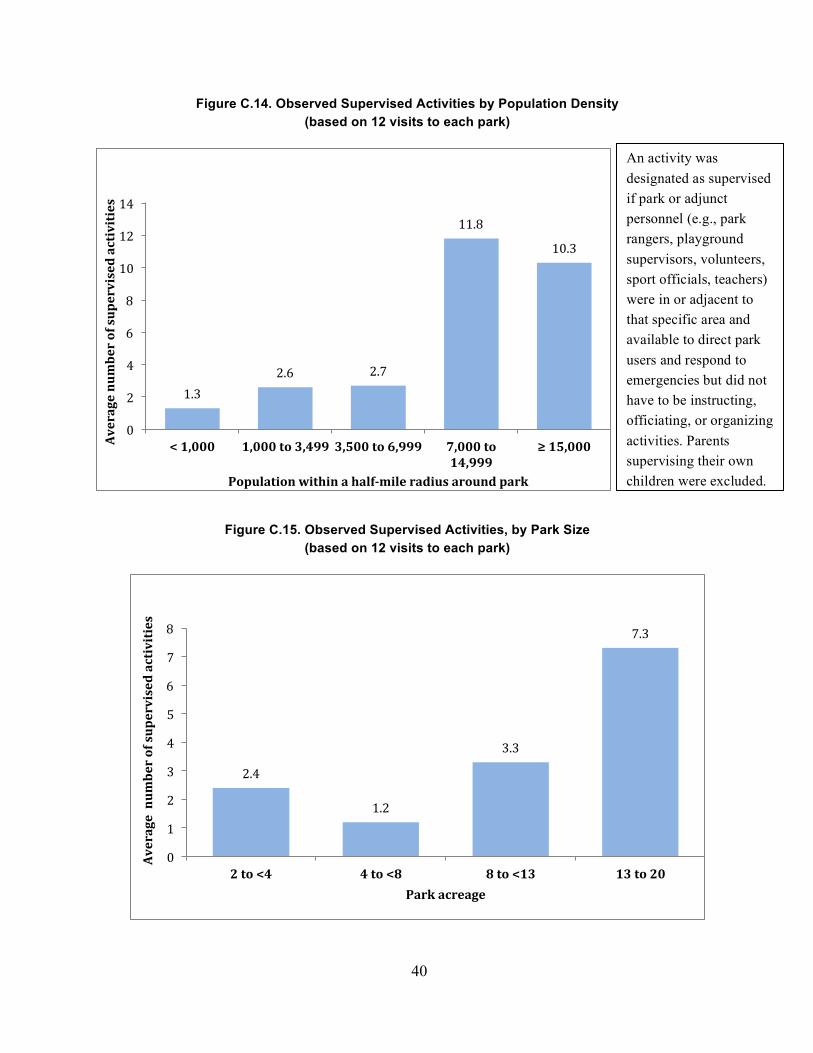
Figure C.14. Observed Supervised Activities by Population Density(based on 12 visits to each park)
Figure C.15. Observed Supervised Activities, by Park Size (based on 12 visits to each park)
1.32.6 2.7
11.8
10.3
0
2
4
6
8
10
12
14
<1,000 1,000to3,499 3,500to6,999 7,000to14,999
≥15,000Averagenumberofsupervisedactivities
Populationwithinahalf-mileradiusaroundpark
2.4
1.2
3.3
7.3
0
1
2
3
4
5
6
7
8
2to<4 4to<8 8to<13 13to20
Averagenum
berofsupervisedactivities
Parkacreage
An activity was designated as supervised if park or adjunct personnel (e.g., park rangers, playground supervisors, volunteers, sport officials, teachers) were in or adjacent to that specific area and available to direct park users and respond to emergencies but did not have to be instructing, officiating, or organizing activities. Parents supervising their own children were excluded.

41
Figure C.16. Observed Supervised Activities, by Region (based on 12 visits to each park)
Figure C.17. Percentage of Parks with Specific Conditions Observed on at Least One Day
4.7
3.9
1.8
2.6
3.3
00.51
1.52
2.53
3.54
4.55
West Northeast South Midwest National
Averagenumberofsupervisedactivities
Censusregion
2.1%7.5%
19.8% 22.9%32.0%
59.5%
0%
10%
20%
30%
40%
50%
60%
70%
80%
90%
100%
Uncomfortablynoisy
ModeratetoalotofgrafGiti
Anyhomeless Foodvendorsinpark
Moderatetoalotoflitter
Dogsoffleash
Percentageofparkswithcondition
observedatleastonce

42
List of Related Publications
Cohen DA, Golinelli D, Williamson S, Sehgal A, Marsh T, McKenzie TL. Effects of park improvements on park use and physical activity: policy and programming implications. American Journal of Preventive Medicine. 2009;37(6):475-80.
Cohen DA, Han B, Derose KP, Williamson S, Marsh T, McKenzie TL. Physical activity in parks: a randomized controlled trial using community engagement. American Journal of Preventive Medicine. 2013;45(5):590-7.
Cohen DA, Han B, Derose K, Williamson S, Marsh T, Raaen L, McKenzie TL. The paradox of parks in low-income areas: park use and perceived threats. Environment and Behavior. 2016;48(1):230-45.
Cohen DA, Han B, Derose K, Williamson S, Marsh T, Rudick J, McKenzie TL. Neighborhood poverty, park use, and park-based physical activity in a Southern California city. Social Science & Medicine. 2012;75(12):2317-25.
Cohen DA, Han B, Isacoff J, Shulaker B, Williamson S, Marsh T, McKenzie TL, Weir M, Bhatia R. Impact of park renovations on park use and park-based physical activity. Journal of Physical Activity & Health. 2015;12(2):289-95.
Cohen DA, Han B, Nagel C, Harnik P, McKenzie TL, Evenson K, Marsh T, Williamson S, Vaughan C, Katta S. The first national study of neighborhood parks: implications for physical activity. American Journal of Preventive Medicine. 2016; epub ahead of print.
Cohen DA, Lapham S, Evenson KR, Williamson S, Golinelli D, Ward P, Hillier A, McKenzie TL. Use of neighborhood parks: does socioeconomic status matter? A four-city study. Public Health. 2013;127(4):325-32.
Cohen DA, Marsh T, Williamson S, Derose K, Martinez H, Setodji C, McKenzie T. Parks and physical activity: why are some parks used more than others? Preventive Medicine. 2010;50(Suppl 1):S9-12.
Cohen DA, Marsh T, Williamson S, Golinelli D, McKenzie TL. Impact and cost-effectiveness of family Fitness Zones: a natural experiment in urban public parks. Health & Place. 2012;18:39-45.
Cohen DA, Marsh T, Williamson S, Han B, Derose KP, Golinelli D, McKenzie TL. The potential for pocket parks to increase physical activity. American Journal of Health Promotion. 2014;28(3 Suppl):S19-26.

43
Cohen DA, McKenzie TL, Sehgal A, Williamson S, Golinelli D, Lurie N. Contribution of public parks to physical activity. American Journal of Public Health. 2007;97(3):509-14.
Cohen DA, Sehgal A, Williamson S, Marsh T, Golinelli D, McKenzie TL. New recreational facilities for the young and the old in Los Angeles: policy and programming implications. Journal of Public Health Policy. 2009;30(Suppl 1):S248-63.
Cohen DA, Setodji C, Evenson KR, Ward P, Lapham S, Hillier A, McKenzie TL. How much observation is enough? Refining the administration of SOPARC. Journal of Physical Activity & Health. 2011;8(8):1117-23.
Derose KP, Han B, Williamson S, Cohen D. Racial-ethnic variation in park use and physical activity in the city of Los Angeles. Journal of Urban Health. 2015;92(6):1011-23.
Derose KP, Marsh T, Mariscal M, Pina-Cortez S, Cohen DA. Involving community stakeholders to increase park use and physical activity. Preventive Medicine. 2014;64C:14-9.
Evenson KR, Shay E, Williamson S, Cohen DA. Use of dog parks and the contribution to physical activity for their owners. Research Quarterly for Exercise and Sport. 2016;87(2):165-73.
Evenson KR, Wen F, Golinelli D, Rodriguez DA, Cohen DA. Measurement properties of a park use questionnaire. Environment and Behavior. 2012;1-22.
Evenson KR, Wen F, Hillier A, Cohen DA. Assessing the contribution of parks to physical activity using GPS and accelerometry. Medicine and Science in Sports and Exercise. 2013;45(10):1981-7.
Han B, Cohen DA, Derose KP, Marsh T, Williamson S, Loy S. Effectiveness of a free exercise program in a neighborhood park. Preventive Medicine Reports. 2015;2:255-8.
Han B, Cohen DA, Derose KP, Marsh T, Williamson S, Raaen L. How much neighborhood parks contribute to local residents’ physical activity in the City of Los Angeles: a meta-analysis. Preventive Medicine. 2014;69(Suppl 1):S106-10.
Han B, Cohen D, McKenzie TL. Quantifying the contribution of neighborhood parks to physical activity. Preventive Medicine. 2013;57(5):483-7.
Lapham S, Cohen D, Han B, Williamson S, Evenson K, McKenzie T, Hillier A, Ward P. How important is perception of safety to park use? A four-city survey. Urban Studies. 2015;1-13.
Marsh T, Derose KP, Cohen DA. Exploring park director roles in promoting community physical activity. Journal of Physical Activity & Health. 2012;9(5):731-8.
Shulaker BD, Isacoff JW, Cohen DA, Marsh T, Wier M, Bhatia R. Partnerships for parks and physical activity. American Journal of Health Promotion. 2014;28(3 Suppl):S97-9

44
Sturm R, Cohen D. Proximity to urban parks and mental health. Journal of Mental Health Policy and Economics. 2014;17:19-24.
Ward P, McKenzie TL, Cohen D, Evenson KR, Golinelli D, Hillier A, Lapham SC, Williamson S. Physical activity surveillance in parks using direct observation. Preventing Chronic Disease. 2014;11:130147.