city of portland 21st annual community survey results
TRANSCRIPT

CITY OF PORTLAND
21st ANNUAL COMMUNITY SURVEY RESULTS
December 2011
LaVonne Griffi n-ValadeCity Auditor
Drummond KahnDirector of Audit Services
Jennifer ScottSenior Management Auditor
Bob MacKayManagement Auditor
Offi ce of the City Auditor Portland, Oregon
Production / Design
Robert CowanPublic Information Coordinator
CITY OF PORTLAND
21st ANNUAL COMMUNITY SURVEY RESULTS
December 2011
LaVonne Griffi n-ValadeCity Auditor
Drummond KahnDirector of Audit Services
Jennifer ScottSenior Management Auditor
Bob MacKayManagement Auditor
Offi ce of the City Auditor Portland, Oregon
Winner of 2012 Gold Hermes Creative Award
for Publication Design Overall
CITY OF PORTLANDOffi ce of City Auditor LaVonne Griffi n-Valade
Audit Services DivisionDrummond Kahn, Director
1221 S.W. 4th Avenue, Room 310, Portland, Oregon 97204phone: (503) 823-4005
web: www.portlandoregon.gov/auditor/auditservices
December 6, 2011
TO: Mayor Sam Adams Commissioner Nick Fish Commissioner Amanda Fritz Commissioner Randy Leonard Commissioner Dan Saltzman Portland Development Commission
SUBJECT: City of Portland 21st Annual Community Survey Results (Report #409)
This report presents the results of our 21st annual Community Survey. During July and August, we asked Portlanders about their views on a variety of City services, and thousands of residents responded. In addition to reporting on citywide data, we report survey data specifi c to each of Portland’s seven neighborhood coalitions.
Most Portlanders we surveyed felt positively about their city and their neighborhoods. While the majority of residents viewed some City services, such as Parks and Recreation, Water, Police, 911, and Fire and Emergency Response as very good or good in 2011, other services received less positive ratings. Residents reported less favorable ratings of the City’s street maintenance, sewer and storm drainage services, housing and nuisance inspection services, and planning for future land use. Less than half of residents rated the overall job of City government positively – a six percentage point decrease from fi ve years ago. Most residents we surveyed had not participated in a community project or public meeting during the last 12 months, and the majority of residents felt either neutral or negatively about their opportunities to infl uence government decisions.
We sent the survey to 10,150 randomly-selected households, and 38 percent were returned. We calculated the citywide survey accuracy to be ± 1.6 percent, while accuracy by neighborhood coalition ranged from ± 4.0 to ± 4.7 percent. In comparing the demographic information provided by survey respondents to 2010 Census data, we found that our survey respondents are older and more educated than the population as a whole. We also found that females are over-represented and minorities are under-represented among those who returned our survey.
This report provides the public and policy makers with valuable information regarding resident satisfaction with City services. We encourage Council and bureau managers to study diff erences in community perceptions and to consider ways to improve services based on these results. We want to thank the thousands of Portlanders who took the time to complete and return the survey.
LAVONNE GRIFFIN-VALADE Audit Team: Drummond KahnCity Auditor Jennifer Scott Bob MacKay
LAVONNE GRIFFIN-VALADE


Table of Contents
Summary . . . . . . . . . . . . . . . . . . . . . . . . . . . . . . . . . . . . . . . . . . . . . . . . . . . . . . . . . . . . . . . .1
Survey Highlights . . . . . . . . . . . . . . . . . . . . . . . . . . . . . . . . . . . . . . . . . . . . . . . . . . . . . 5
Public Safety . . . . . . . . . . . . . . . . . . . . . . . . . . . . . . . . . . . . . . . . . . . . . . . . . . . . . . . . 6
Public Utilities . . . . . . . . . . . . . . . . . . . . . . . . . . . . . . . . . . . . . . . . . . . . . . . . . . . . . . 8
Transportation . . . . . . . . . . . . . . . . . . . . . . . . . . . . . . . . . . . . . . . . . . . . . . . . . . . . 10
Parks and Recreation . . . . . . . . . . . . . . . . . . . . . . . . . . . . . . . . . . . . . . . . . . . . . 12
Community Development . . . . . . . . . . . . . . . . . . . . . . . . . . . . . . . . . . . . . . . 14
Survey Methodology . . . . . . . . . . . . . . . . . . . . . . . . . . . . . . . . . . . . . . . . . . . . . . . . 17
Survey Data . . . . . . . . . . . . . . . . . . . . . . . . . . . . . . . . . . . . . . . . . . . . . . . . . . . . . . . . . . . 21
Public Safety . . . . . . . . . . . . . . . . . . . . . . . . . . . . . . . . . . . . . . . . . . . . . . . . . . . . . . . 22
Public Utilities . . . . . . . . . . . . . . . . . . . . . . . . . . . . . . . . . . . . . . . . . . . . . . . . . . . . . 25
Transportation . . . . . . . . . . . . . . . . . . . . . . . . . . . . . . . . . . . . . . . . . . . . . . . . . . . . 27
Parks and Recreation . . . . . . . . . . . . . . . . . . . . . . . . . . . . . . . . . . . . . . . . . . . . . 29
Community Development . . . . . . . . . . . . . . . . . . . . . . . . . . . . . . . . . . . . . . . 32
Overall Government . . . . . . . . . . . . . . . . . . . . . . . . . . . . . . . . . . . . . . . . . . . . . . 38
Demographics . . . . . . . . . . . . . . . . . . . . . . . . . . . . . . . . . . . . . . . . . . . . . . . . . . . . 42
2010 Community Survey Form . . . . . . . . . . . . . . . . . . . . . . . . . . . . . . . . . . . . 45


SU
MM
AR
Y

2
Summary
For the 21st year, the City Auditor conducted a survey of Portlanders to gather residents’ opinions on City services. We sent 10,150 surveys to randomly selected residents in order to collect and report resident opinions in each of Portland’s seven neighborhood coalition areas, and for the city overall. We only report percentage point changes that are statistically signifi cant.
We anticipate that this report will be of interest to the public, to City Council, and to City managers, and that it will be useful to residents in tracking the City’s progress in many important civic areas.
Portlanders have opinions about City government services from police and fi re to community development, parks, water, and streets. These opinions, and changes in these opinions over time, can be studied by City managers and reviewed by elected offi cials to fi nd areas for improvement as well as to identify programs with high public satisfaction.
Overall, most Portlanders love their city and their neighborhoods, but gave mixed ratings to many City services, and lower ratings to the overall job City government is doing.
Citywide, 78 percent of residents felt positively about city livability and 86 percent felt positively about their neighborhood’s livability.
Residents rated City government’s overall job lower. Five years ago, 55 percent of residents rated City government’s overall job as very good or good, compared with 49 percent of residents in 2011.
Ratings of the City’s job in making downtown a good place for recreation, shopping, working and living dropped from 69 percent in 2008 to 58 percent in 2011.
Rating of overall City government
job in providing services
(percent very good or good)
0%
50%
100%
2007 2009 2011

3
Resident feelings of nighttime safety varied by neighborhood coalition. Citywide, residents reported feeling safer at night in their neighborhoods and parks than they did in 2007.
Satisfaction with public safety services remained positive, although ratings of police services dropped. 59 percent of residents felt positively about police services in 2011, a six percentage point decrease from 2007. 76 percent of residents felt positively about 9-1-1 services, and 87 percent gave fi re and emergency services positive ratings.
Ratings of police services varied by neighborhood coalition, from a high of 67 percent in the East coalition to a low of 53 percent in the North coalition. The change was most notable in the North coalition, where residents’ positive ratings of police services dropped 13 percentage points from 2007.
Rating of safety in neighborhood
at night as very safe or safe
(and fi ve-year change)
64%(+7)
52%
32%
48%
71%
76%
63%(+11)
Rating of police service quality as
very good or good
(and fi ve-year change)
57%
57%(-8)
67%
53%(-13)
61%
61%(-8)
55%
Satisfaction with City parks and recreation services was high, with 85 percent of residents rating parks as very good or good, and 77 percent rating recreation services highly.
In 2011, 41 percent of residents visited a City park near their home either daily or weekly. The highest rate of park visits – 57 percent – was in the Northwest/Downtown coalition, while the lowest rate – 20 percent – was in the East coalition.

4
Summary
Few residents participated in community projects or public meetings. In 2011, 61 percent of residents reported that they did not participate in a community project or attend a public meeting in the last 12 months. When asked about their opportunities to infl uence government decisions, 41 percent of residents felt neutral and 33 percent felt negatively.
Of the residents who reported owning a business in 2011, 49 percent felt that Portland was a very good or good place to do business.
Ratings of water service quality in 2011 remained positive (71 percent very good or good), but less than half of residents rated sewer and storm drainage service quality positively (46 percent and 41 percent, respectively).
In 2011, 78 percent of residents felt positively about garbage and recycling service quality. When evaluating the cost of the service, however, about half of residents felt positively.
Resident ratings of street maintenance declined in the past fi ve years. 35 percent of residents in 2011 rated street maintenance as very good or good, compared to 40 percent in 2007.
The majority of residents (63 percent) drove alone to work in 2011, while 12 percent took public transit. Considering all trips (commuting and non-commuting), two-thirds of residents (67 percent) drove alone, with 7 percent taking public transit.
This report contains sections reporting survey results on these important City service areas: Public Safety, Public Utilities, Transportation, Parks and Recreation, and Community Development. In addition, we include a section explaining how we conducted the community survey and prepared this report. Complete survey data begin on page 21.
Primary means of transportation
Commute onlyAll trips
0% 50% 100%
Other
Walk
Bike
Carpool
Public transit
Drive alone

SU
RV
EY
HIG
HL
IGH
TS

6
OVERVIEW
TRENDS Overall satisfaction with public safety services remained positive in 2011. 59 percent of residents felt positively about police services in 2011, about a six percentage point decrease from 2007. In 2011, 87 percent of residents rated fi re and emergency services as very good or good, a four percentage point decrease from fi ve years ago. 76 percent of residents felt positively about 9-1-1 services.
Ratings of police services vary by neighborhood coalition. In 2011, 67 percent of East coalition residents rated police services as very good or good, and 53 percent of residents of the North coalition rated it positively. The fi ve-year change in police rating was most notable in the North coalition, where residents’ positive rating of police services dropped 13 percentage points from 2007.
Overall resident ratings of Public Safety services
(percent very good or good)
2007 2008 2009 2010 2011
Police 64% 66% 70% 60% 59%
Fire & Emergency
Services 91% 91% 91% 87% 87%
9-1-1 76% 80% 84% 80% 76%
Overall satisfaction with fi re and emergency, police, and 9-1-1 services remained positive in 2011. Residents felt safer at night in their neighborhoods and parks in 2011 than they did fi ve years ago. Residents reported being as prepared for a disaster in 2011 as they were the year before.
Public Safety
Rating of police service quality as
very good or good
(and fi ve-year change)
57%
57%(-8)
67%
53%(-13)
61%
61%(-8)
55%

7
Rating of safety in neighborhood
at night as very safe or safe
(and fi ve-year change)
64%(+7)
52%
32%
48%
71%
76%
63%(+11)
In 2011, residents reported feeling about as safe in their neighborhoods, parks, and downtown during the day as they did in 2007. In 2011, 90 percent of residents felt safe in their neighborhood during the day, 80 percent felt safe in their closest park, and 68 percent felt safe downtown.
Citywide, residents reported feeling safer at night in their neighborhoods and parks than they did in 2007, although ratings of nighttime safety downtown remained the same. Resident ratings of nighttime safety vary widely by coalition. 76 percent of residents in the Southwest coalition felt safe in their neighborhood at night, while 32 percent of residents in the East felt safe. Residents in Inner Northeast and Southeast reported feeling safer in their neighborhoods and parks at night than they did fi ve years ago.
Residents reported being as prepared for a disaster in 2011 as they were the year before. 72 percent of residents reported that if a disaster were to occur, they have enough supplies to take care of their household for three days to one week, while 18 percent reported they have enough supplies for up to one month. Only 11 percent of residents reported having either no supplies or one day of supplies.
In 2011, 33 percent of residents rated both the Police Bureau’s and the Auditor’s Independent Police Review’s eff orts to regulate police conduct positively. While the majority of residents felt neutral about the Independent Police Review’s eff orts, resident feelings about the Police Bureau’s eff orts were almost equally split between positive, neutral, and negative.
Rating of safety during day
(percent very good or good)ParkNeighborhood Downtown
0%
50%
100%
2007 2009 2011

8
Rating of overall water service
quality as very good or good
73%
69%
64%
68%
78%
72%
74%
OVERVIEW
TRENDS Resident ratings of City public utility services were mixed in 2011. While 71 percent of residents rated overall water service quality as very good or good, less than half of residents rated sewer and storm drainage services positively (46 and 41 percent, respectively).
Resident ratings of the quality of water service varied by coalition. There was less variation in coalitions' rating of sewer and storm drainage services.
Resident ratings of Public Utility services
(percent very good or good)
2007 2008 2009 2010 2011
Water 74% 79% 80% 77% 71%
Sewer 53% 57% 55% 48% 46%
Storm drainage 45% 49% 48% 42% 41%
Resident satisfaction with overall water service quality remained positive in 2011. However, less than half of residents had positive opinions of overall City sewer and storm drainage services. The quality of garbage and recycling services was rated highly in 2011, but the cost of garbage and recycling services was not.
Public Utilities

9
In 2011, less than half of residents felt positively about how well City sewer and storm drainage systems protected streams and rivers. This rating was an increase of 15 percentage points from 2007, when 29 percent of residents felt that sewer and storm drainage systems were very good or good at protecting local streams and rivers.
Citywide, 84 percent of residents felt positively about tap water, a 7 percentage point increase since 2007. 2011 ratings of tap water varied by neighborhood coalition, but were relatively unchanged from fi ve years ago.
In 2011, 78 percent of residents felt positively about garbage and recycling service quality. However, when evaluating the cost of the service, about half of residents felt positively. Resident perception of garbage and recycling service quality and cost has been relatively steady from prior years.
Rating of how well sewers and
drainage systems protect rivers
(percent very good or good)
0%
50%
100%
2007 2009 2011
Rating of garbage/recycling
(percent very good or good)
0%
50%
100%
2007 2009 2011
Quality
Cost
Rating of tap water
(percent very good or good)
0%
50%
100%
2007 2009 2011

10
OVERVIEW Resident ratings of street maintenance, street smoothness, speeding vehicles and traffi c fl ow during peak hours all declined in the past fi ve years. During the same time frame, residents reported feeling more positive about street cleanliness. The majority of residents continued to drive alone in 2011.
Transportation
TRENDS In 2011, 35 percent of residents citywide rated City street maintenance services positively, a fi ve percentage point decline from 2007. Ratings were lower and the fi ve year change even more pronounced in most neighborhood coalitions.
Street lighting ratings remained relatively consistent over fi ve years, with 57 percent of residents feeling positive about the quality of the City’s street lighting services in 2011.
Residents rated traffi c fl ow on major streets during peak hours less positively than fi ve years ago. In 2011, 21 percent of residents reported feeling very good or good about congestion on major streets during peak traffi c hours, compared to 24 percent in 2007. Less positive ratings were also seen in three coalitions – North, Inner Northeast, and Central Northeast.
Resident ratings of Transportation services
(percent very good or good)
2007 2008 2009 2010 2011
Street maintenance 40% 41% 39% 38% 35%
Street lighting 59% 61% 61% 60% 57%
Rating of city street maintenance
as very good or good (and fi ve-year change)
35%
33%(-9)
32%(-10)
43%
31%
38%(-7)
33%(-6)

11
Considering neighborhood streets, residents reported increased satisfaction with street cleanliness, from 61 percent in 2007 to 64 percent in 2011. Residents felt less positively about street smoothness than they did fi ve years ago. In 2011, 49 percent of residents felt positively about street smoothness in their neighborhoods, compared to 55 percent in 2007. Many neighborhood coalitions also reported declines in satisfaction. For example, North residents' ratings of street smoothness declined by 12 percentage points from 2007. The other coalitions reporting declines were Central Northeast, Inner Northeast, and Southeast.
2011 ratings of both pedestrian and cyclist safety on neighborhood streets showed no change from 2007. However, residents gave less favorable ratings of vehicles speeding through neighborhood streets in 2011 compared to 2007 (35 percent and 45 percent, respectively). This negative trend was mirrored in every coalition.
Rating of speeding vehicles on
neighborhood streets as very
good or good (and fi ve-year change)
38%(-8)
31%(-11)
26%(-14)
27%(-19)
44%(-10)
40%(-10)
34%(-10)
In 2011, the majority of residents citywide (63 percent) indicated they drove to work alone, while 12 percent took public transit. Seven percent of residents commuted to work by bike, with six percent each either walking or traveling in a carpool. When considering all trips (shopping, errands, work, etc.), 67 percent drove alone, with seven percent taking public transit.
The percentage of residents who reported driving alone to work varied among the coalitions. In 2011, residents in the East and Southwest coalitions had the highest rates (72 and 73 percent respectively) and the Northwest/Downtown coalition the lowest, with only 49 percent driving alone.
Primary means of transportation
Commute onlyAll trips
0% 50% 100%
Other
Walk
Bike
Carpool
Public transit
Drive alone

12
OVERVIEW
TRENDS Resident satisfaction with City Parks and Recreation services remained relatively steady from prior years. In 2011, 85 percent of residents felt very good or good about parks, and 77 percent felt positively about recreation services.
Residents rated the quality of park grounds and facilities near their homes positively in 2011. 69 percent of residents reported feeling positively about the condition of facilities in City parks near their homes, a seven percentage point change from 2007. 84 percent of residents rated the quality of parks’ grounds near their homes positively.
Northwest/Downtown coalition residents had the most positive ratings of both parks’ grounds (88 percent) and facilities (76 percent). Residents in the East coalition had the least positive ratings of grounds and facilities (75 percent and 59 percent, respectively).
Resident ratings of Parks and Recreation services (percent very good or good)
2007 2008 2009 2010 2011
Parks 82% 86% 86% 86% 85%
Recreation 74% 75% 77% 76% 77%
In 2011, most residents rated the overall quality of both City parks and City recreation services positively. Over a third of residents reported visiting a City park near their home either daily or weekly during the last 12 months. Similarly, about a third reported household participation in a Portland Parks and Recreation activity during that time. Most residents continue to feel positively about the aff ordability, variety, and instructional quality of City recreation programs. East coalition residents reported fewer visits to City parks near their homes, less participation in recreation activities, and lower satisfaction with services than all other coalitions.
Parks and Recreation
Rating of neighborhood park
qualities as very good or good
Grounds Facilities
0%
50%
100%
2007 2009 2011

13
North coalition residents, however, reported an increase of nine percentage points from 60 percent in 2007 to 69 percent for 2011 in rating the quality of facilities in their neighborhood parks.
In 2011, 41 percent of residents citywide reported visiting a City park near their home either daily or weekly. The highest rate of park visits – 57 percent – was reported by residents in the Northwest/Downtown coalition; the lowest, at 20 percent, was reported by residents in the East.
Households participating in a
City recreation activity
(last 12 months)
34%
31%
22%
38%
26%
37%
37%
In 2011, 33 percent of residents indicated that someone in their household participated in a Portland Parks and Recreation activity in the last 12 months. North coalition residents had the highest percentage, with 38 percent reporting participation, while East coalition had the lowest, with 22 percent participating in a Parks and Recreation activity in the last 12 months.
Resident ratings of the aff ordability and variety of recreation programs remained largely steady from prior years. Resident ratings of the quality of instruction, coaching, and leadership in City recreation programs increased from 60 percent in 2007 to 64 percent in 2011. Residents whose household participated in a recreation activity had more positive feelings about the aff ordability, variety, and quality of instruction than residents whose households had no participation.
41%
36%
20%
45%
57%
43%
44%
Households reporting daily or
weekly visits to city park near
home (last 12 months)

14
OVERVIEW
TRENDS In 2011, resident views of neighborhood livability improved from fi ve years ago, while views of city livability remained relatively unchanged. Citywide, 86 percent and 78 percent of residents felt positively about their neighborhood and the city’s livability, respectively. In 2011, 58 percent of residents felt positively about downtown as a good place for recreation, shopping, working and living, down from 69 percent in 2008.
Citywide, resident feelings on neighborhood distance to transit, access to services, and on-street parking were relatively steady since 2007, while ratings of neighborhood proximity to parks improved. Opinions on factors that contribute to livable neighborhoods varied widely by coalition in 2011. Some of these factors include closeness to parks, distance to public transit and on-street parking.
Resident ratings of livability
(percent very good or good)
2007 2008 2009 2010 2011
City livability 79% 82% 83% 81% 78%
Neighborhood
livability 82% 86% 88% 87% 86%
Resident ratings of neighborhood livability and neighborhood housing aff ordability improved since 2007, while ratings of city livability remained steady. Over half of residents felt commercial development completed in the last 12 months enhanced the attractiveness of their neighborhood and their access to services, but ratings varied greatly by neighborhood coalition. Nearly half of residents who reported owning a business felt that Portland was a very good or good place to do business.
Community Development
Neighborhood livability factors (percent very good or good)
Close to Close to On-street parks transit Parking
Central NE 78% 87% 71%East 69% 73% 50%Inner NE 89% 94% 75%North 87% 86% 65%NW/Downtown 90% 82% 42%Southeast 87% 93% 71%Southwest 87% 77% 52%

15
Resident ratings of housing aff ordability improved since 2007, while ratings of the physical condition of housing remained the same. 44 percent of residents rated neighborhood housing aff ordability positively in 2011, up from 40 percent in 2007. 64 percent of residents felt positively about the physical condition of housing in neighborhoods in 2011. Three coalitions’ rating of housing aff ordability improved since 2007.
Though residents reported less commercial development in their neighborhoods than fi ve years ago, over half rated the impact positively in 2011. 66 percent of residents felt new commercial development improved the attractiveness of their neighborhood and 51 percent felt it improved access to services.
61 percent of residents rated the attractiveness of residential devel-opment positively in 2011. 43 percent felt that completed development improved their neighborhood as a place to live.
In 2011, 61 percent of residents reported not being involved in a community project or attending a public meeting in the last 12 months. 41 percent of residents felt neutral and 33 percent felt negatively about their opportunities to infl uence government decisions.
In 2011, 29 and 23 percent of residents citywide felt positively about the quality of City housing inspection and nuisance inspection services, respectively. 40 percent of residents felt positively about planning for future land use, but responses varied greatly by coalition.
49 percent of residents who reported owning a business felt that Portland was a very good or good place to do business in 2011.
Rating of planning for future land
use as very good or good
43%
39%
19%
37%
47%
41%
50%
Rating of housing aff ordability as
very good or good
(and fi ve-year change)
43%(+7)
47%
51%
51%
46%(+12%)
35%37%
(+9%)

16

SU
RV
EY
ME
TH
OD
OL
OG
Y
18
The City Auditor's Community Survey was conducted for the 21st year in July and August 2011. Questions on the survey request residents’ perceptions of satisfaction with services the City of Portland provides. The results are intended to inform the public as well as to help City leaders better manage City services.
The survey was mailed to randomly selected addresses, with a letter from the City Auditor explaining the purpose of the survey and how to complete it. Survey responses are anonymous.
Response rate
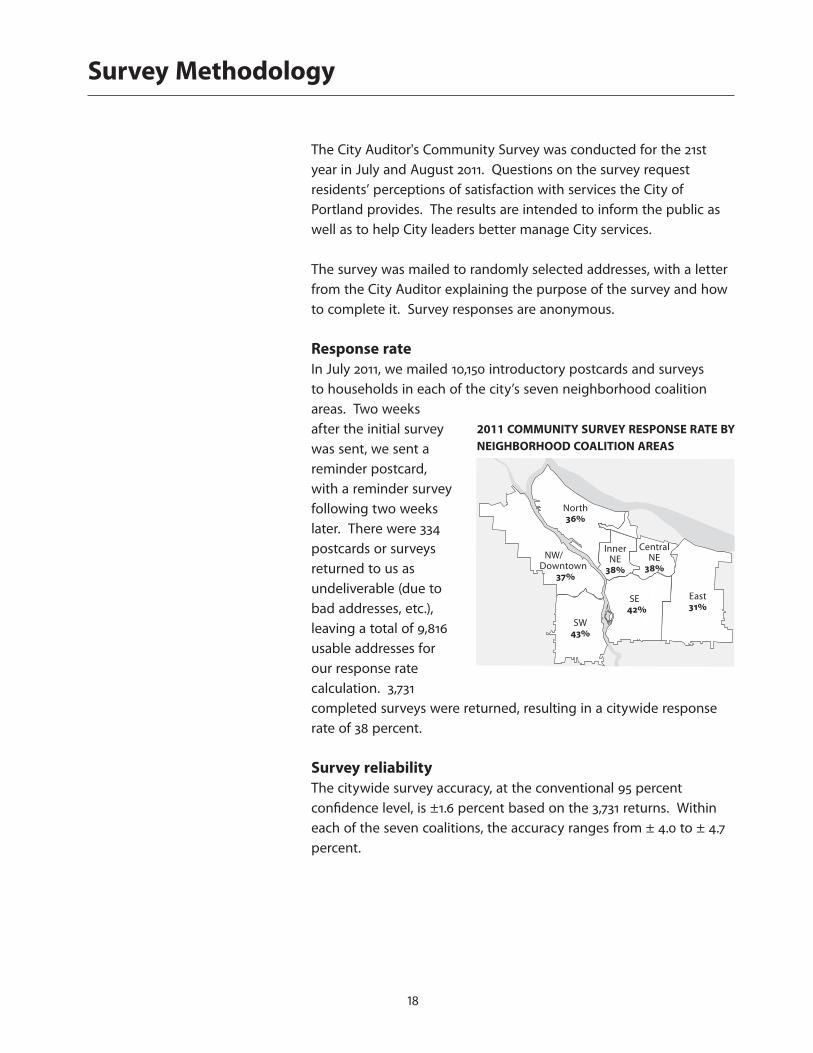
In July 2011, we mailed 10,150 introductory postcards and surveys to households in each of the city’s seven neighborhood coalition areas. Two weeks after the initial survey was sent, we sent a reminder postcard, with a reminder survey following two weeks later. There were 334 postcards or surveys returned to us as undeliverable (due to bad addresses, etc.), leaving a total of 9,816 usable addresses for our response rate calculation. 3,731 completed surveys were returned, resulting in a citywide response rate of 38 percent.
Survey reliability
The citywide survey accuracy, at the conventional 95 percent confi dence level, is ±1.6 percent based on the 3,731 returns. Within each of the seven coalitions, the accuracy ranges from ± 4.0 to ± 4.7 percent.
Survey Methodology
2011 COMMUNITY SURVEY RESPONSE RATE BY
NEIGHBORHOOD COALITION AREAS
North36%
Inner NE
38%
Central NE
38%
NW/ Downtown 37%
SW43%
SE42%
East31%
19
Representativeness of respondents
We compared demographic information supplied by the respondents to 2010 Census data in order to assess how closely our sample matched offi cial census demographics. On a citywide level, our survey respondents are older and more educated than the population as a whole. We found that females are over-represented and minorities are under-represented.
Survey analysis
In conducting this audit, we reviewed data from the 2011 Auditor’s Community Survey and four years of prior survey data. We reviewed positive, neutral, and negative ratings, and largely focused our analysis on the change in positive ratings, except where warranted.
We reviewed the data by the City service areas of Public Safety, Public Utilities, Transportation, Parks and Recreation, and Community Development. This analysis included reviewing the fi ve-year changes in citywide fi gures, as well as by coalition. In some cases, fi ve-year changes were not available due to adjustments in how questions were worded or because the question had been in the survey for less than fi ve years.
We calculated statistical signifi cance, based on a 95 percent confi dence level, for anything noted as a change. This was to determine if a change was real, and not due to chance in the sample selection. Any percentage point changes we report are those where the change was statistically signifi cant.
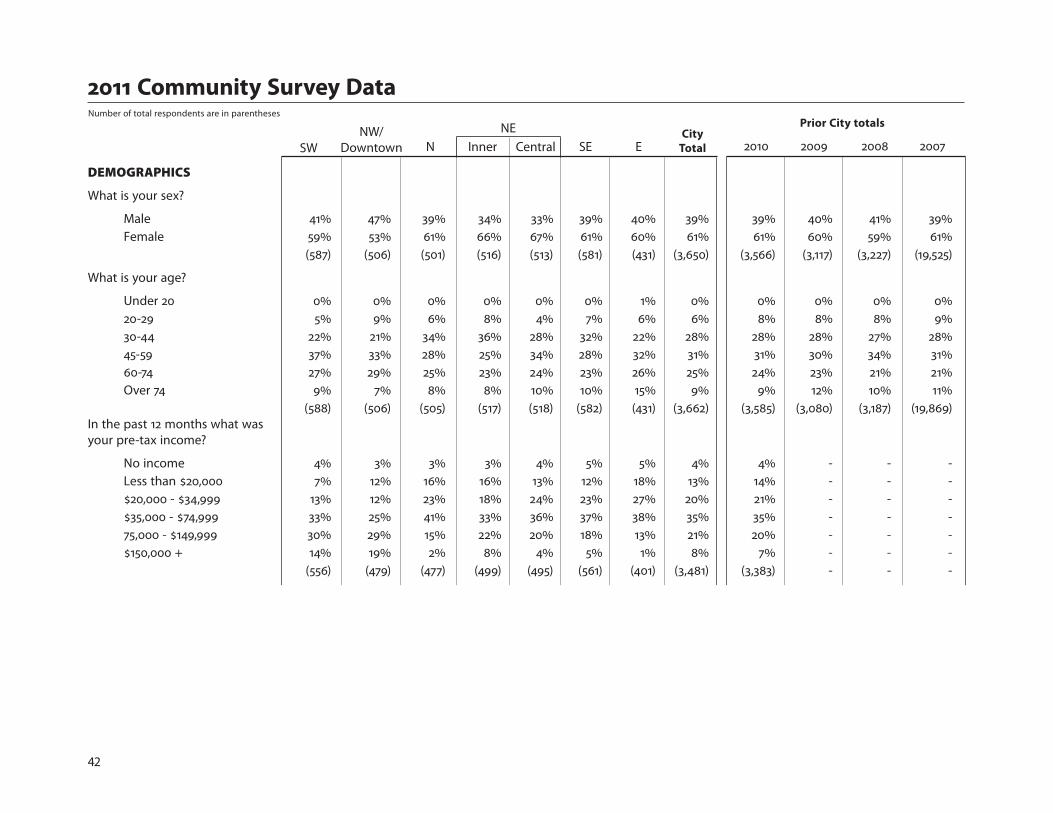
In the table of survey results, the number of total respondents to each question is shown in parentheses. Due to rounding, percentages may not add to 100, and coalition totals may not add to the City total.
Survey comments The 2011 City Auditor’s Community Survey was sent to a random sample of 10,150 city residents. To help keep respondent identities anonymous, the City Auditor’s Offi ce designed the survey without a specifi c section for written comments. However, respondents wrote 577 comments on the survey form. More than half of the comments addressed overall government and community development issues.
20
Comments or complaints?
Residents with comments, concerns or complaints are encouraged to contact City of Portland bureaus directly. For bureau contact information, please see the City of Portland’s website at www.portlandoregon.gov, or call the City and County Information and Referral line at (503) 823-4000.
In addition, the City Auditor’s Offi ce of the Ombudsman can assist the public with complaints or concerns about City agencies.
The Ombudsman’s Offi ce can be contacted at (503) 823-0144. The Ombudsman’s e-mail address is: [email protected]. Their website is www.portlandoregon.gov/auditor/ombudsman. Audit standards
We conducted this performance audit in accordance with generally accepted government auditing standards. These standards require that we plan and perform the audit to obtain suffi cient, appropriate evidence to provide a reasonable basis for our fi ndings and conclusions based on our audit objectives. We believe that the evidence obtained provides a reasonable basis for our fi ndings and conclusions based on our audit objectives.
Survey Methodology

SURVEY DATA
2011 Community Survey Data
22
City
TotalENNW/
Downtown
Prior City totals
Inner Central SESW 2009 2008 20072010NE
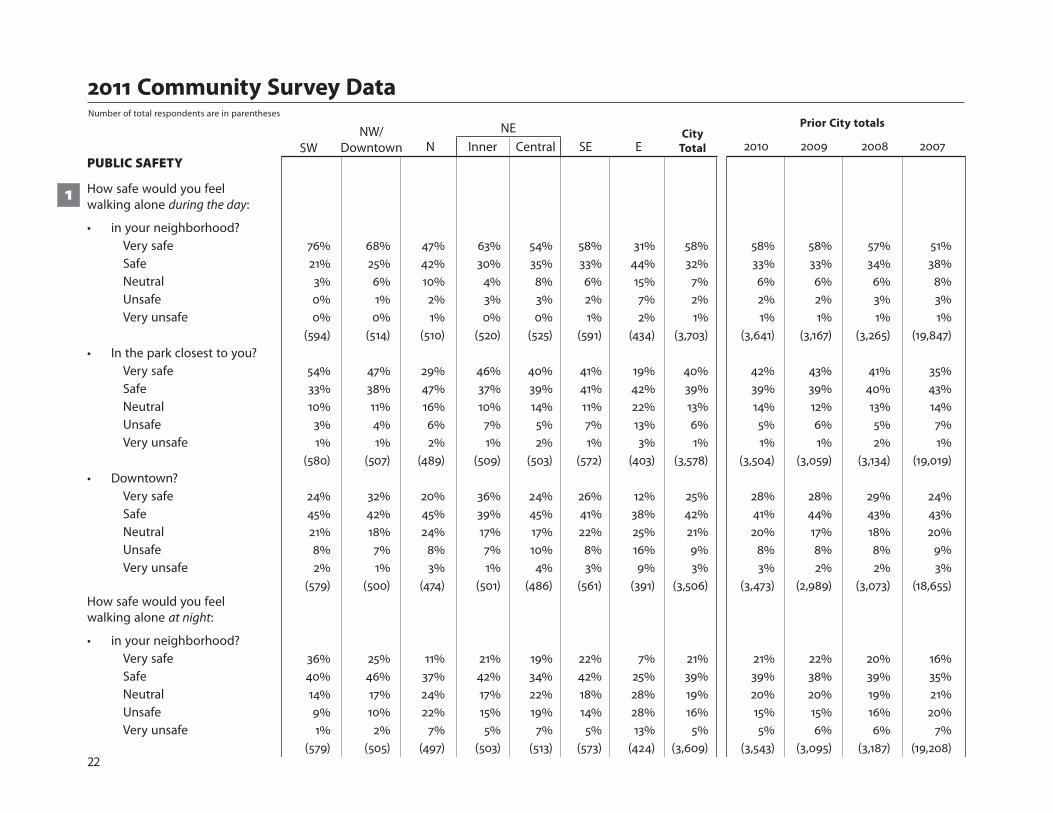
Number of total respondents are in parentheses
PUBLIC SAFETY
How safe would you feel walking alone during the day:
• in your neighborhood? Very safe 76% 68% 47% 63% 54% 58% 31% 58% 58% 58% 57% 51% Safe 21% 25% 42% 30% 35% 33% 44% 32% 33% 33% 34% 38% Neutral 3% 6% 10% 4% 8% 6% 15% 7% 6% 6% 6% 8% Unsafe 0% 1% 2% 3% 3% 2% 7% 2% 2% 2% 3% 3% Very unsafe 0% 0% 1% 0% 0% 1% 2% 1% 1% 1% 1% 1% (594) (514) (510) (520) (525) (591) (434) (3,703) (3,641) (3,167) (3,265) (19,847)• In the park closest to you? Very safe 54% 47% 29% 46% 40% 41% 19% 40% 42% 43% 41% 35% Safe 33% 38% 47% 37% 39% 41% 42% 39% 39% 39% 40% 43% Neutral 10% 11% 16% 10% 14% 11% 22% 13% 14% 12% 13% 14% Unsafe 3% 4% 6% 7% 5% 7% 13% 6% 5% 6% 5% 7% Very unsafe 1% 1% 2% 1% 2% 1% 3% 1% 1% 1% 2% 1% (580) (507) (489) (509) (503) (572) (403) (3,578) (3,504) (3,059) (3,134) (19,019)• Downtown? Very safe 24% 32% 20% 36% 24% 26% 12% 25% 28% 28% 29% 24% Safe 45% 42% 45% 39% 45% 41% 38% 42% 41% 44% 43% 43% Neutral 21% 18% 24% 17% 17% 22% 25% 21% 20% 17% 18% 20% Unsafe 8% 7% 8% 7% 10% 8% 16% 9% 8% 8% 8% 9% Very unsafe 2% 1% 3% 1% 4% 3% 9% 3% 3% 2% 2% 3% (579) (500) (474) (501) (486) (561) (391) (3,506) (3,473) (2,989) (3,073) (18,655)How safe would you feel walking alone at night:
• in your neighborhood? Very safe 36% 25% 11% 21% 19% 22% 7% 21% 21% 22% 20% 16% Safe 40% 46% 37% 42% 34% 42% 25% 39% 39% 38% 39% 35% Neutral 14% 17% 24% 17% 22% 18% 28% 19% 20% 20% 19% 21% Unsafe 9% 10% 22% 15% 19% 14% 28% 16% 15% 15% 16% 20% Very unsafe 1% 2% 7% 5% 7% 5% 13% 5% 5% 6% 6% 7% (579) (505) (497) (503) (513) (573) (424) (3,609) (3,543) (3,095) (3,187) (19,208)
1
2011 Community Survey Data
23
City
TotalENNW/
Downtown
Prior City totals
Inner Central SESW 2009 2008 20072010NE
Number of total respondents are in parentheses
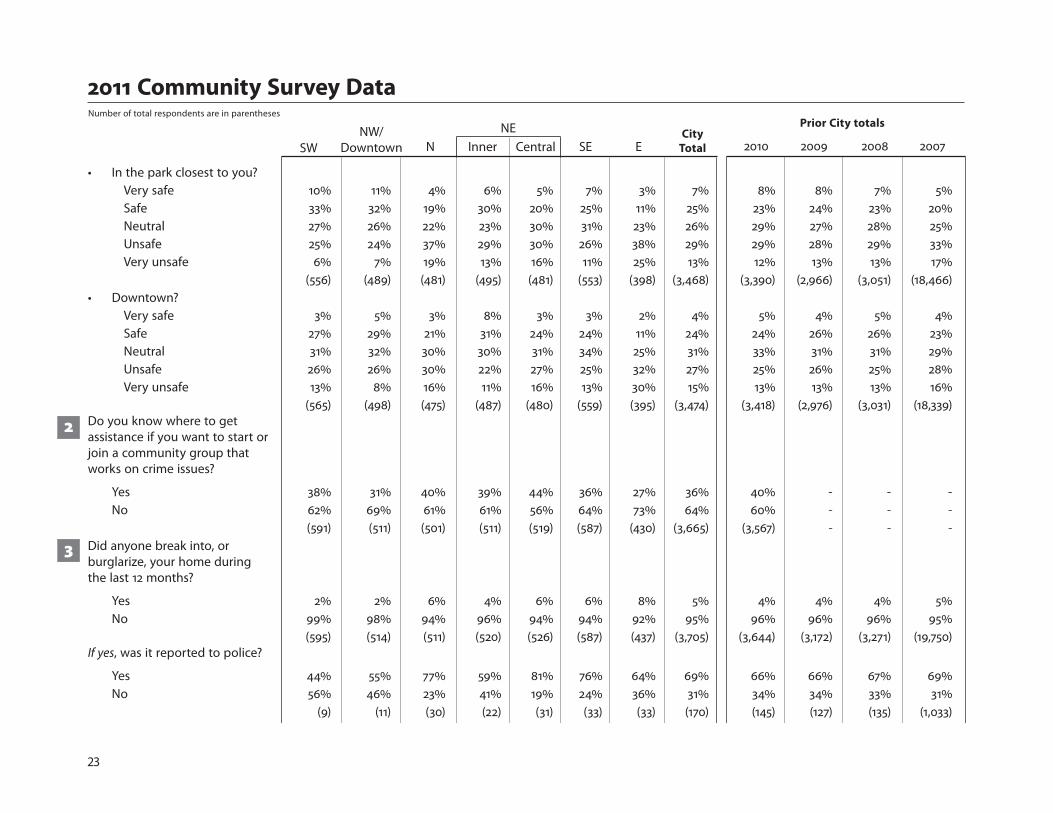
• In the park closest to you? Very safe 10% 11% 4% 6% 5% 7% 3% 7% 8% 8% 7% 5% Safe 33% 32% 19% 30% 20% 25% 11% 25% 23% 24% 23% 20% Neutral 27% 26% 22% 23% 30% 31% 23% 26% 29% 27% 28% 25% Unsafe 25% 24% 37% 29% 30% 26% 38% 29% 29% 28% 29% 33% Very unsafe 6% 7% 19% 13% 16% 11% 25% 13% 12% 13% 13% 17% (556) (489) (481) (495) (481) (553) (398) (3,468) (3,390) (2,966) (3,051) (18,466)• Downtown? Very safe 3% 5% 3% 8% 3% 3% 2% 4% 5% 4% 5% 4% Safe 27% 29% 21% 31% 24% 24% 11% 24% 24% 26% 26% 23% Neutral 31% 32% 30% 30% 31% 34% 25% 31% 33% 31% 31% 29% Unsafe 26% 26% 30% 22% 27% 25% 32% 27% 25% 26% 25% 28% Very unsafe 13% 8% 16% 11% 16% 13% 30% 15% 13% 13% 13% 16% (565) (498) (475) (487) (480) (559) (395) (3,474) (3,418) (2,976) (3,031) (18,339)Do you know where to get assistance if you want to start or join a community group that works on crime issues?
Yes 38% 31% 40% 39% 44% 36% 27% 36% 40% - - - No 62% 69% 61% 61% 56% 64% 73% 64% 60% - - - (591) (511) (501) (511) (519) (587) (430) (3,665) (3,567) - - -Did anyone break into, or burglarize, your home duringthe last 12 months?
Yes 2% 2% 6% 4% 6% 6% 8% 5% 4% 4% 4% 5% No 99% 98% 94% 96% 94% 94% 92% 95% 96% 96% 96% 95% (595) (514) (511) (520) (526) (587) (437) (3,705) (3,644) (3,172) (3,271) (19,750)If yes, was it reported to police?
Yes 44% 55% 77% 59% 81% 76% 64% 69% 66% 66% 67% 69% No 56% 46% 23% 41% 19% 24% 36% 31% 34% 34% 33% 31% (9) (11) (30) (22) (31) (33) (33) (170) (145) (127) (135) (1,033)
2
3
2011 Community Survey Data
24
City
TotalENNW/
Downtown
Prior City totals
Inner Central SESW 2009 2008 20072010NE
Number of total respondents are in parentheses
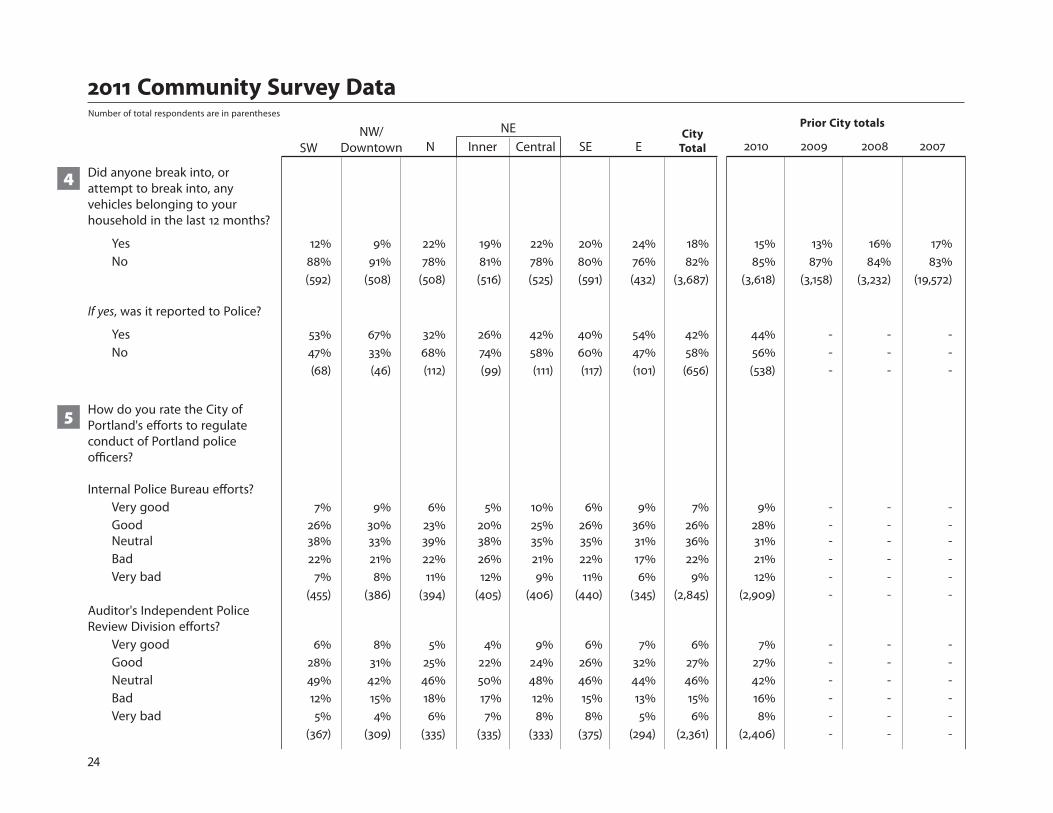
Did anyone break into, or attempt to break into, any vehicles belonging to your household in the last 12 months?
Yes 12% 9% 22% 19% 22% 20% 24% 18% 15% 13% 16% 17% No 88% 91% 78% 81% 78% 80% 76% 82% 85% 87% 84% 83% (592) (508) (508) (516) (525) (591) (432) (3,687) (3,618) (3,158) (3,232) (19,572)
If yes, was it reported to Police?
Yes 53% 67% 32% 26% 42% 40% 54% 42% 44% - - - No 47% 33% 68% 74% 58% 60% 47% 58% 56% - - - (68) (46) (112) (99) (111) (117) (101) (656) (538) - - -
How do you rate the City ofPortland's eff orts to regulate conduct of Portland policeoffi cers?
Internal Police Bureau eff orts? Very good 7% 9% 6% 5% 10% 6% 9% 7% 9% - - - Good 26% 30% 23% 20% 25% 26% 36% 26% 28% - - -
Neutral 38% 33% 39% 38% 35% 35% 31% 36% 31% - - - Bad 22% 21% 22% 26% 21% 22% 17% 22% 21% - - - Very bad 7% 8% 11% 12% 9% 11% 6% 9% 12% - - - (455) (386) (394) (405) (406) (440) (345) (2,845) (2,909) - - -Auditor's Independent PoliceReview Division eff orts? Very good 6% 8% 5% 4% 9% 6% 7% 6% 7% - - - Good 28% 31% 25% 22% 24% 26% 32% 27% 27% - - - Neutral 49% 42% 46% 50% 48% 46% 44% 46% 42% - - - Bad 12% 15% 18% 17% 12% 15% 13% 15% 16% - - - Very bad 5% 4% 6% 7% 8% 8% 5% 6% 8% - - - (367) (309) (335) (335) (333) (375) (294) (2,361) (2,406) - - -
4
5
2011 Community Survey Data
25
City
TotalENNW/
Downtown
Prior City totals
Inner Central SESW 2009 2008 20072010NE
Number of total respondents are in parentheses
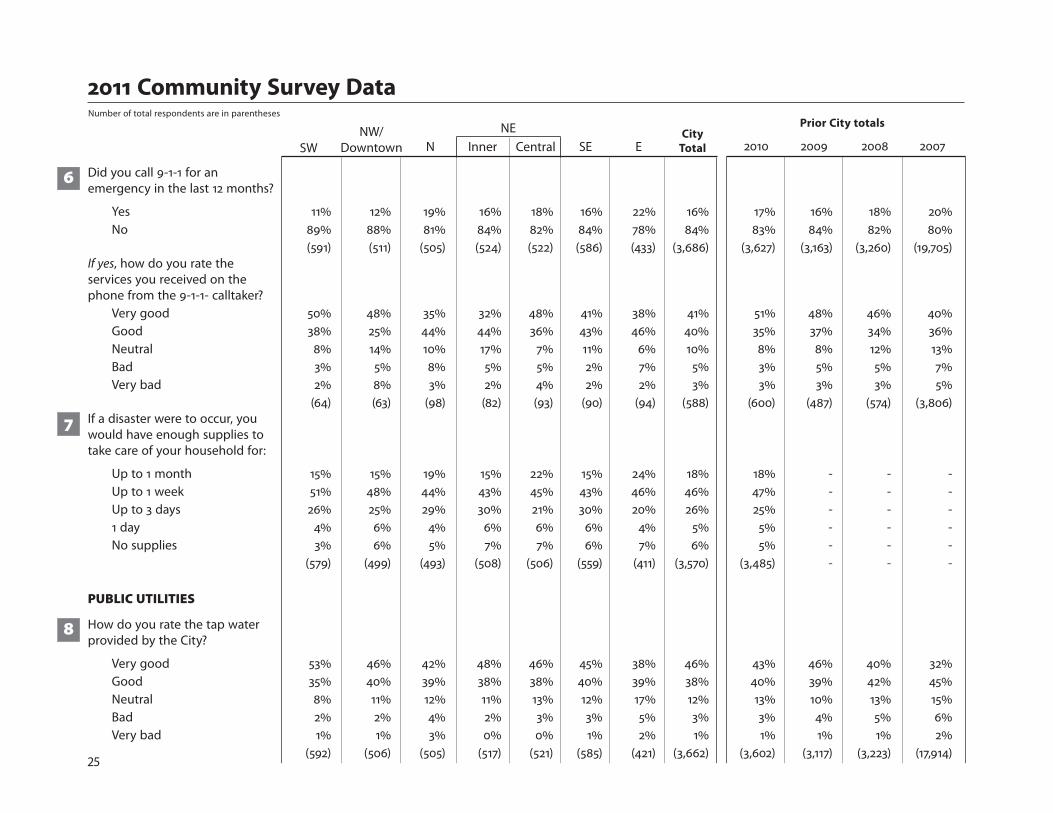
Did you call 9-1-1 for an emergency in the last 12 months?
Yes 11% 12% 19% 16% 18% 16% 22% 16% 17% 16% 18% 20% No 89% 88% 81% 84% 82% 84% 78% 84% 83% 84% 82% 80% (591) (511) (505) (524) (522) (586) (433) (3,686) (3,627) (3,163) (3,260) (19,705)If yes, how do you rate the services you received on thephone from the 9-1-1- calltaker? Very good 50% 48% 35% 32% 48% 41% 38% 41% 51% 48% 46% 40% Good 38% 25% 44% 44% 36% 43% 46% 40% 35% 37% 34% 36% Neutral 8% 14% 10% 17% 7% 11% 6% 10% 8% 8% 12% 13% Bad 3% 5% 8% 5% 5% 2% 7% 5% 3% 5% 5% 7% Very bad 2% 8% 3% 2% 4% 2% 2% 3% 3% 3% 3% 5% (64) (63) (98) (82) (93) (90) (94) (588) (600) (487) (574) (3,806)If a disaster were to occur, you would have enough supplies to take care of your household for:
Up to 1 month 15% 15% 19% 15% 22% 15% 24% 18% 18% - - - Up to 1 week 51% 48% 44% 43% 45% 43% 46% 46% 47% - - - Up to 3 days 26% 25% 29% 30% 21% 30% 20% 26% 25% - - - 1 day 4% 6% 4% 6% 6% 6% 4% 5% 5% - - - No supplies 3% 6% 5% 7% 7% 6% 7% 6% 5% - - - (579) (499) (493) (508) (506) (559) (411) (3,570) (3,485) - - -
PUBLIC UTILITIES
How do you rate the tap waterprovided by the City?
Very good 53% 46% 42% 48% 46% 45% 38% 46% 43% 46% 40% 32% Good 35% 40% 39% 38% 38% 40% 39% 38% 40% 39% 42% 45% Neutral 8% 11% 12% 11% 13% 12% 17% 12% 13% 10% 13% 15% Bad 2% 2% 4% 2% 3% 3% 5% 3% 3% 4% 5% 6% Very bad 1% 1% 3% 0% 0% 1% 2% 1% 1% 1% 1% 2% (592) (506) (505) (517) (521) (585) (421) (3,662) (3,602) (3,117) (3,223) (17,914)
7
8
6

2011 Community Survey Data
26
City
TotalENNW/
Downtown
Prior City totals
Inner Central SESW 2009 2008 20072010NE
Number of total respondents are in parentheses
How well do you think thesewer and storm drainage systems protect water quality inour local streams and rivers?
Very good 9% 9% 6% 6% 7% 7% 7% 7% 7% 6% 6% 4% Good 36% 37% 35% 39% 38% 39% 38% 37% 35% 36% 30% 25% Neutral 32% 30% 33% 33% 33% 34% 33% 33% 32% 31% 30% 32% Bad 18% 18% 20% 17% 18% 15% 16% 17% 19% 21% 25% 27% Very bad 5% 6% 7% 5% 5% 5% 6% 6% 6% 6% 10% 12% (507) (421) (445) (432) (445) (500) (374) (3,138) (3,087) (2,335) (2,557) (14,891)
How do you rate garbage/recycling service on:
• Cost?
Very good 9% 15% 10% 16% 12% 10% 9% 11% 12% 11% 9% 9% Good 36% 40% 41% 40% 36% 39% 31% 38% 37% 38% 36% 39% Neutral 32% 30% 32% 28% 31% 34% 30% 31% 31% 31% 34% 34% Bad 18% 11% 13% 14% 15% 13% 22% 15% 15% 15% 16% 14% Very bad 6% 3% 5% 3% 5% 4% 8% 5% 5% 4% 5% 4% (561) (428) (480) (489) (498) (536) (403) (3,407) (3,347) (2,875) (2,889) (17,261)• Quality?
Very good 28% 27% 25% 30% 30% 24% 21% 27% 28% 29% - - Good 52% 50% 53% 51% 47% 54% 51% 51% 49% 51% - - Neutral 16% 21% 16% 16% 19% 19% 21% 18% 17% 15% - - Bad 4% 1% 4% 3% 2% 2% 5% 3% 4% 4% - - Very bad 0% 1% 2% 0% 1% 1% 2% 1% 2% 1% - - (560) (444) (479) (493) (493) (557) (404) (3,444) (3,448) (3,005) - -
9
10

2011 Community Survey Data
27
City
TotalENNW/
Downtown
Prior City totals
Inner Central SESW 2009 2008 20072010NE
Number of total respondents are in parentheses
TRANSPORTATION
How do you rate traffi c fl ow(congestion) on major streetsand thoroughfares, excludingfreeways?
• During peak traffi c hours, 7-9 AM, and 3:30 - 6 PM
Very good 0% 2% 2% 2% 2% 2% 2% 2% 2% 2% 2% 2% Good 20% 21% 18% 20% 20% 20% 18% 20% 21% 23% 21% 22%
Neutral 33% 29% 23% 29% 28% 26% 24% 28% 28% 30% 29% 27% Bad 37% 40% 39% 38% 41% 40% 42% 39% 37% 34% 36% 36% Very bad 10% 9% 18% 12% 9% 13% 15% 12% 13% 10% 12% 13% (585) (485) (499) (499) (499) (566) (421) (3,569) (3,521) (3,035) (3,138) (19,254)• During off peak traffi c hours
Very good 23% 21% 14% 19% 17% 17% 14% 18% 20% 21% 19% 18% Good 55% 54% 50% 51% 54% 54% 48% 52% 50% 51% 53% 51% Neutral 16% 17% 23% 19% 21% 19% 25% 20% 21% 19% 19% 20% Bad 4% 7% 10% 8% 7% 8% 11% 8% 8% 7% 7% 9% Very bad 2% 1% 3% 3% 1% 2% 2% 2% 2% 2% 2% 2% (591) (487) (500) (500) (499) (568) (415) (3,574) (3,532) (3,041) (3,153) (18,792)
In the past 7 days, what was primary form of transportation?
• To get to/from work:
Drive alone 73% 49% 63% 55% 67% 61% 72% 63% 62% - - - Carpool 7% 4% 8% 7% 7% 6% 7% 6% 7% - - -
Public transit 9% 17% 12% 13% 11% 12% 10% 12% 12% - - - Walk 2% 21% 4% 5% 3% 4% 3% 6% 6% - - - Bike 4% 4% 8% 14% 6% 10% 3% 7% 7% - - - Other 5% 6% 7% 6% 6% 7% 6% 6% 7% - - - (508) (449) (458) (456) (448) (517) (359) (3,207) (3,161) - - -
11
12

2011 Community Survey Data
28
City
TotalENNW/
Downtown
Prior City totals
Inner Central SESW 2009 2008 20072010NE
Number of total respondents are in parentheses
• For all trips - shopping, errands, work:
Drive alone 82% 50% 66% 61% 71% 64% 77% 67% 66% - - - Carpool 12% 10% 15% 12% 15% 13% 13% 13% 14% - - - Public transit 3% 15% 7% 7% 4% 7% 5% 7% 6% - - - Walk 2% 22% 5% 7% 4% 8% 1% 7% 7% - - - Bike 1% 2% 5% 11% 4% 7% 1% 5% 4% - - - Other 1% 1% 3% 2% 2% 1% 3% 2% 3% - - - (578) (494) (496) (503) (507) (575) (424) (3,591) (3,534) - - -
How do you rate streets in your neighborhood on:
• Smoothness?
Very good 10% 13% 8% 8% 6% 6% 11% 9% 9% 9% 10% 10% Good 38% 42% 37% 44% 39% 40% 42% 40% 42% 41% 43% 45% Neutral 18% 20% 25% 25% 27% 26% 24% 23% 22% 23% 22% 23% Bad 22% 19% 21% 19% 20% 20% 18% 20% 19% 19% 19% 15% Very bad 13% 6% 9% 4% 8% 8% 6% 8% 7% 7% 6% 6% (591) (510) (506) (517) (521) (584) (434) (3,678) (3,613) (3,133) (3,234) (19,710)• Cleanliness? Very good 19% 19% 10% 12% 11% 11% 12% 13% 13% 12% 13% 12% Good 53% 54% 45% 52% 50% 56% 44% 51% 52% 51% 52% 50% Neutral 20% 15% 28% 24% 26% 21% 25% 23% 23% 23% 22% 23% Bad 6% 10% 14% 10% 9% 10% 16% 11% 9% 11% 10% 12% Very bad 3% 1% 3% 2% 4% 2% 4% 3% 3% 3% 3% 4% (591) (513) (507) (518) (520) (583) (435) (3,682) (3,612) (3,143) (3,236) (19,531)
13

2011 Community Survey Data
29
City
TotalENNW/
Downtown
Prior City totals
Inner Central SESW 2009 2008 20072010NE
Number of total respondents are in parentheses
• Speeding vehicles? Very good 6% 6% 4% 5% 3% 5% 4% 5% 5% 4% 5% - Good 34% 38% 23% 29% 28% 33% 22% 30% 31% 29% 26% - Neutral 26% 27% 32% 31% 30% 31% 28% 29% 30% 30% 29% - Bad 27% 22% 28% 27% 29% 23% 30% 26% 25% 27% 29% - Very bad 6% 7% 13% 9% 11% 8% 16% 10% 10% 10% 11% - (591) (512) (506) (514) (522) (579) (430) (3,669) (3,604) (3,120) (3,223) -• Safety of pedestrians? Very good 8% 12% 9% 13% 8% 12% 7% 10% 10% 9% 8% 9% Good 33% 42% 44% 50% 48% 51% 35% 43% 45% 45% 43% 44% Neutral 23% 23% 29% 24% 24% 21% 29% 25% 25% 23% 26% 23% Bad 27% 17% 13% 10% 14% 13% 19% 16% 14% 16% 18% 17% Very bad 10% 6% 6% 3% 6% 4% 10% 7% 6% 7% 6% 8% (593) (513) (504) (513) (517) (579) (430) (3,664) (3,589) (3,119) (3,222) (19,463)• Safety of bicyclists? Very good 6% 10% 10% 10% 8% 10% 7% 9% 9% 7% 7% 7% Good 28% 39% 41% 46% 44% 46% 35% 40% 41% 41% 38% 40% Neutral 33% 26% 32% 29% 31% 28% 33% 30% 30% 29% 32% 27% Bad 24% 19% 13% 12% 13% 13% 17% 16% 14% 17% 18% 19% Very bad 8% 6% 6% 3% 5% 3% 8% 6% 6% 7% 6% 8% (572) (485) (494) (507) (497) (562) (407) (3,539) (3,480) (3,022) (3,113) (18,657)PARKS & RECREATION
In the past 12 months, howmany times did you:
• Visit any City park?
Daily 9% 16% 12% 12% 7% 9% 5% 10% 10% - - - Weekly 35% 38% 33% 35% 32% 33% 15% 32% 28% - - - Monthly 17% 18% 14% 16% 17% 17% 13% 16% 15% - - - A few times 32% 22% 30% 27% 29% 30% 39% 30% 34% - - - Never 8% 7% 12% 11% 15% 11% 28% 13% 14% - - - (587) (508) (500) (515) (521) (586) (426) (3,658) (3,589) - - -
14

2011 Community Survey Data
30
City
TotalENNW/
Downtown
Prior City totals
Inner Central SESW 2009 2008 20072010NE
Number of total respondents are in parentheses
• Visit a City park near your home?
Daily 10% 19% 13% 12% 9% 10% 4% 11% 11% - - - Weekly 33% 38% 32% 32% 27% 31% 16% 30% 27% - - - Monthly 15% 15% 13% 15% 16% 16% 11% 15% 13% - - - A few times 30% 19% 30% 28% 30% 28% 38% 29% 33% - - - Never 12% 9% 13% 13% 18% 15% 31% 15% 17% - - -
(577) (496) (499) (512) (515) (581) (414) (3,609) (3,544) - - -How do you rate the quality of the parks near your home in the following categories?
• Well-maintained grounds
Very Good 32% 38% 31% 33% 25% 28% 21% 30% 32% 32% 29% 26% Good 55% 50% 53% 53% 57% 58% 54% 54% 54% 54% 56% 55% Neutral 12% 9% 12% 11% 15% 12% 21% 13% 12% 12% 12% 15% Bad 1% 3% 3% 3% 3% 1% 3% 2% 2% 2% 3% 3% Very bad 1% 0% 1% 0% 1% 1% 0% 1% 0% 1% 1% 1% (567) (499) (486) (496) (490) (552) (364) (3,469) (3,406) (3,013) (3,043) (18,059)
• Well-maintained facilities
Very Good 27% 28% 20% 17% 16% 19% 15% 21% 22% 20% 19% 17% Good 47% 48% 48% 49% 48% 51% 44% 48% 46% 46% 45% 45% Neutral 22% 19% 22% 25% 28% 25% 34% 25% 25% 26% 28% 28% Bad 3% 4% 8% 7% 7% 4% 6% 6% 6% 6% 7% 8% Very bad 1% 0% 1% 1% 2% 1% 1% 1% 1% 2% 2% 2% (536) (453) (443) (451) (444) (501) (327) (3,168) (3,082) (2,762) (2,764) (16,475)In the past 12 months, did anyone in your household participate in a Portland Parks and Recreation activity?
Yes 37% 26% 38% 37% 31% 34% 22% 33% 31% - - - No 63% 74% 62% 64% 69% 66% 78% 68% 69% - - - (583) (510) (504) (515) (513) (583) (428) (3,651) (3,569) - - -
15
16
2011 Community Survey Data
31
City
TotalENNW/
Downtown
Prior City totals
Inner Central SESW 2009 2008 20072010NE
Number of total respondents are in parentheses
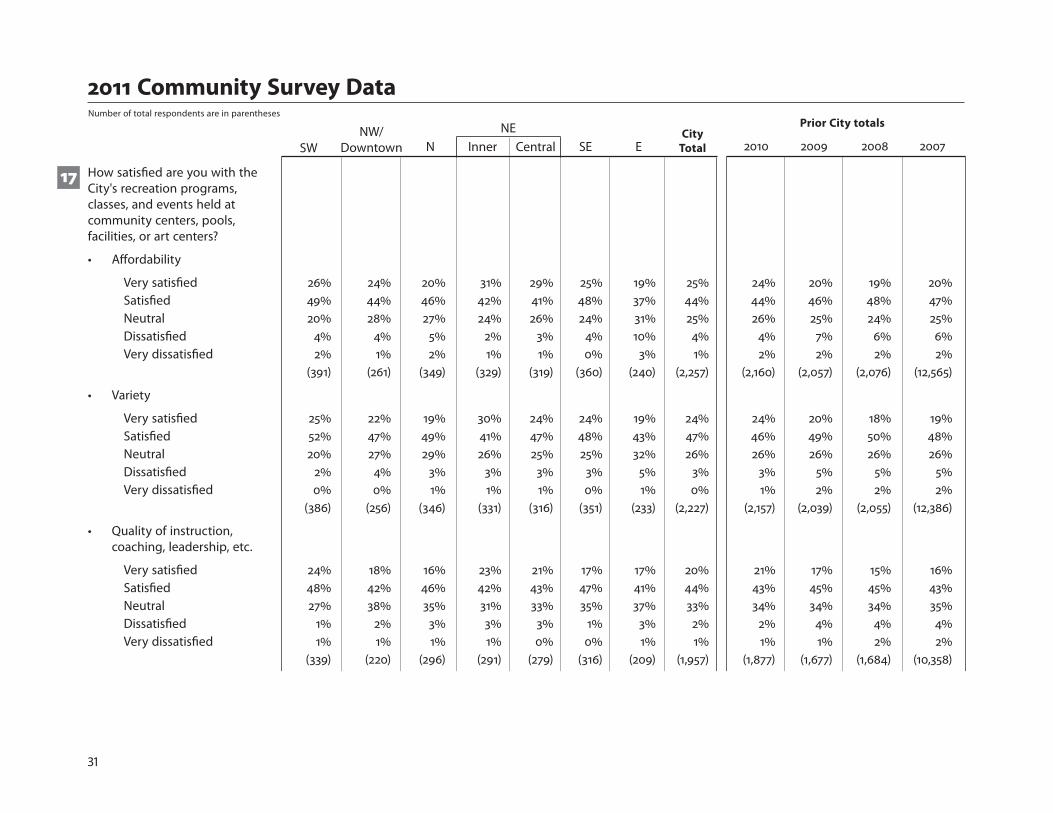
How satisfi ed are you with the City's recreation programs, classes, and events held at community centers, pools, facilities, or art centers?
• Aff ordability
Very satisfi ed 26% 24% 20% 31% 29% 25% 19% 25% 24% 20% 19% 20% Satisfi ed 49% 44% 46% 42% 41% 48% 37% 44% 44% 46% 48% 47% Neutral 20% 28% 27% 24% 26% 24% 31% 25% 26% 25% 24% 25% Dissatisfi ed 4% 4% 5% 2% 3% 4% 10% 4% 4% 7% 6% 6% Very dissatisfi ed 2% 1% 2% 1% 1% 0% 3% 1% 2% 2% 2% 2% (391) (261) (349) (329) (319) (360) (240) (2,257) (2,160) (2,057) (2,076) (12,565)
• Variety
Very satisfi ed 25% 22% 19% 30% 24% 24% 19% 24% 24% 20% 18% 19% Satisfi ed 52% 47% 49% 41% 47% 48% 43% 47% 46% 49% 50% 48% Neutral 20% 27% 29% 26% 25% 25% 32% 26% 26% 26% 26% 26% Dissatisfi ed 2% 4% 3% 3% 3% 3% 5% 3% 3% 5% 5% 5% Very dissatisfi ed 0% 0% 1% 1% 1% 0% 1% 0% 1% 2% 2% 2% (386) (256) (346) (331) (316) (351) (233) (2,227) (2,157) (2,039) (2,055) (12,386)
• Quality of instruction, coaching, leadership, etc.
Very satisfi ed 24% 18% 16% 23% 21% 17% 17% 20% 21% 17% 15% 16% Satisfi ed 48% 42% 46% 42% 43% 47% 41% 44% 43% 45% 45% 43% Neutral 27% 38% 35% 31% 33% 35% 37% 33% 34% 34% 34% 35% Dissatisfi ed 1% 2% 3% 3% 3% 1% 3% 2% 2% 4% 4% 4% Very dissatisfi ed 1% 1% 1% 1% 0% 0% 1% 1% 1% 1% 2% 2% (339) (220) (296) (291) (279) (316) (209) (1,957) (1,877) (1,677) (1,684) (10,358)
17

2011 Community Survey Data
32
City
TotalENNW/
Downtown
Prior City totals
Inner Central SESW 2009 2008 20072010NE
Number of total respondents are in parentheses
COMMUNITY DEVELOPMENT
Has a new commercial development been completed in, or near, your neighborhood in the last 12 months?
Yes 19% 36% 41% 50% 26% 42% 21% 34% 33% - - - No 82% 64% 59% 50% 74% 58% 79% 66% 67% - - - (572) (484) (485) (493) (489) (539) (398) (3,473) (3,425) - - -
If yes, how do you rate it on the following:
• Attractiveness
Very good 28% 18% 21% 23% 28% 22% 23% 23% 22% - - - Good 44% 51% 33% 50% 38% 47% 37% 44% 46% - - - Neutral 22% 23% 30% 18% 22% 20% 28% 23% 23% - - - Bad 5% 6% 11% 6% 7% 7% 9% 7% 7% - - - Very bad 1% 2% 5% 3% 6% 4% 4% 4% 3% - - - (102) (172) (196) (243) (125) (223) (82) (1,146) (1,101) - - -• Improvement in your access to services & shopping
Very good 16% 11% 17% 20% 26% 16% 13% 17% 16% - - - Good 30% 32% 30% 38% 36% 33% 32% 33% 35% - - - Neutral 40% 46% 37% 33% 21% 41% 41% 37% 38% - - - Bad 13% 8% 10% 5% 12% 6% 9% 8% 7% - - - Very bad 1% 3% 6% 4% 7% 4% 5% 4% 4% - - - (94) (158) (190) (237) (121) (216) (76) (1,095) (1,053) - - -
18

2011 Community Survey Data
33
City
TotalENNW/
Downtown
Prior City totals
Inner Central SESW 2009 2008 20072010NE
Number of total respondents are in parentheses
Has a new residentialdevelopment been completed in, or near, your neighborhood in the last 12 months?
Yes 21% 34% 42% 49% 23% 30% 21% 31% 35% - - - No 80% 66% 58% 51% 77% 70% 79% 69% 65% - - - (576) (484) (492) (499) (497) (550) (407) (3,518) (3,448) - - -
If yes, how do you rate it on the following:
• Attractiveness
Very good 31% 22% 14% 13% 15% 25% 13% 19% 22% - - - Good 35% 48% 44% 45% 47% 38% 36% 43% 39% - - - Neutral 25% 22% 24% 23% 19% 19% 29% 23% 24% - - - Bad 7% 7% 11% 12% 13% 12% 18% 11% 11% - - - Very bad 3% 2% 6% 8% 5% 6% 5% 5% 5% - - - (116) (162) (202) (240) (112) (163) (84) (1,080) (1,195) - - -• Improvement to your neighborhood as a place to live
Very good 22% 16% 12% 10% 15% 15% 8% 14% 17% - - - Good 25% 36% 27% 31% 26% 31% 20% 29% 31% - - - Neutral 31% 33% 37% 40% 42% 36% 28% 36% 33% - - - Bad 21% 13% 15% 12% 11% 10% 19% 14% 12% - - - Very bad 2% 3% 9% 7% 6% 8% 26% 8% 7% - - - (114) (160) (185) (223) (106) (157) (80) (1,026) (1,153) - - -
19
2011 Community Survey Data
34
City
TotalENNW/
Downtown
Prior City totals
Inner Central SESW 2009 2008 20072010NE
Number of total respondents are in parentheses
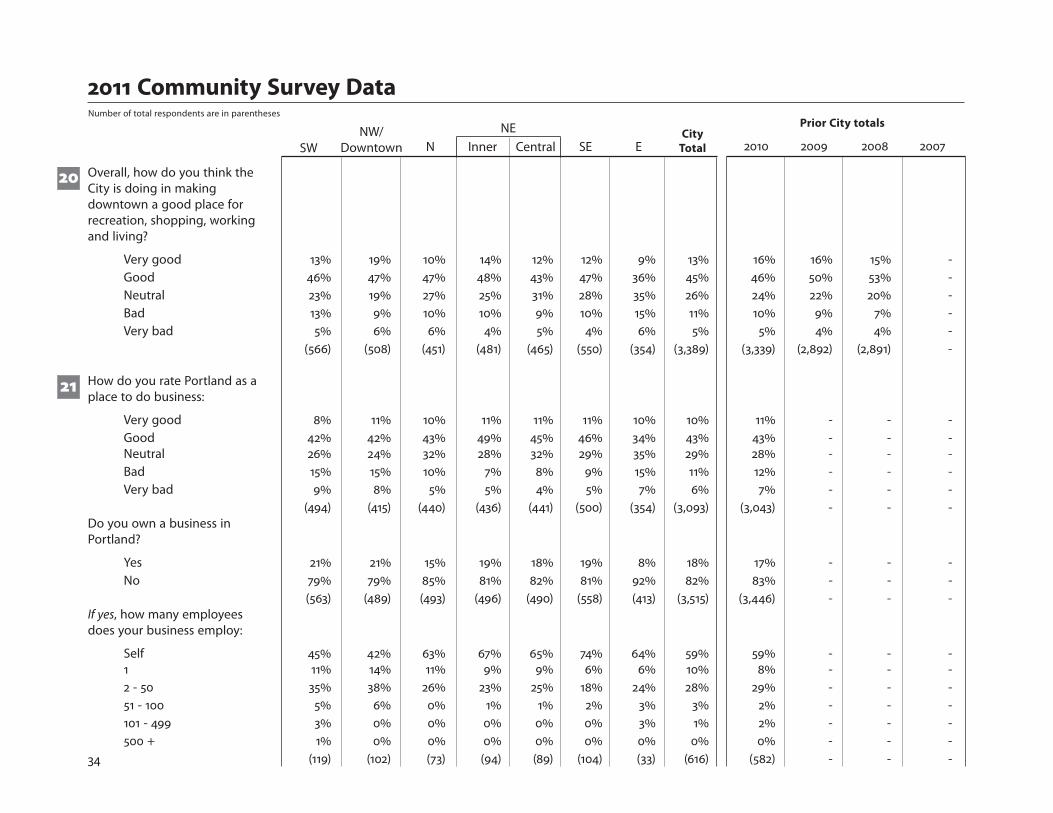
Overall, how do you think theCity is doing in makingdowntown a good place forrecreation, shopping, workingand living?
Very good 13% 19% 10% 14% 12% 12% 9% 13% 16% 16% 15% - Good 46% 47% 47% 48% 43% 47% 36% 45% 46% 50% 53% - Neutral 23% 19% 27% 25% 31% 28% 35% 26% 24% 22% 20% - Bad 13% 9% 10% 10% 9% 10% 15% 11% 10% 9% 7% - Very bad 5% 6% 6% 4% 5% 4% 6% 5% 5% 4% 4% - (566) (508) (451) (481) (465) (550) (354) (3,389) (3,339) (2,892) (2,891) -
How do you rate Portland as a place to do business:
Very good 8% 11% 10% 11% 11% 11% 10% 10% 11% - - - Good 42% 42% 43% 49% 45% 46% 34% 43% 43% - - -
Neutral 26% 24% 32% 28% 32% 29% 35% 29% 28% - - - Bad 15% 15% 10% 7% 8% 9% 15% 11% 12% - - - Very bad 9% 8% 5% 5% 4% 5% 7% 6% 7% - - - (494) (415) (440) (436) (441) (500) (354) (3,093) (3,043) - - -Do you own a business in Portland?
Yes 21% 21% 15% 19% 18% 19% 8% 18% 17% - - - No 79% 79% 85% 81% 82% 81% 92% 82% 83% - - - (563) (489) (493) (496) (490) (558) (413) (3,515) (3,446) - - -If yes, how many employees does your business employ:
Self 45% 42% 63% 67% 65% 74% 64% 59% 59% - - - 1 11% 14% 11% 9% 9% 6% 6% 10% 8% - - -
2 - 50 35% 38% 26% 23% 25% 18% 24% 28% 29% - - - 51 - 100 5% 6% 0% 1% 1% 2% 3% 3% 2% - - - 101 - 499 3% 0% 0% 0% 0% 0% 3% 1% 2% - - - 500 + 1% 0% 0% 0% 0% 0% 0% 0% 0% - - - (119) (102) (73) (94) (89) (104) (33) (616) (582) - - -
20
21

2011 Community Survey Data
35
City
TotalENNW/
Downtown
Prior City totals
Inner Central SESW 2009 2008 20072010NE
Number of total respondents are in parentheses
How do you rate your neighbhorhood on:
• Housing aff ordability?
Very good 5% 4% 7% 3% 5% 5% 6% 5% 5% 6% 5% 5% Good 40% 31% 44% 34% 43% 38% 45% 39% 41% 39% 34% 35% Neutral 32% 35% 34% 34% 34% 34% 32% 34% 32% 30% 30% 31% Bad 19% 26% 12% 25% 16% 20% 13% 19% 18% 22% 24% 23% Very bad 4% 4% 3% 4% 2% 4% 4% 4% 3% 4% 6% 7% (569) (498) (490) (496) (502) (564) (387) (3,521) (3,436) (2,980) (3,096) (18,842)
• Physical condition of housing?
Very good 16% 28% 6% 17% 11% 11% 6% 14% 14% 13% 13% 13% Good 63% 53% 43% 51% 51% 50% 40% 50% 53% 55% 55% 52% Neutral 18% 15% 39% 26% 31% 30% 33% 27% 26% 24% 24% 26% Bad 3% 2% 11% 6% 7% 9% 17% 8% 7% 7% 7% 8% Very bad 0% 0% 2% 1% 1% 1% 3% 1% 1% 1% 1% 1% (587) (508) (499) (516) (514) (573) (414) (3,626) (3,554) (3,085) (3,186) (19,588)
• Closeness of parks or open spaces?
Very good 35% 47% 30% 36% 28% 31% 17% 33% 35% 31% 29% 29% Good 52% 43% 57% 53% 51% 55% 52% 52% 50% 53% 54% 51% Neutral 10% 8% 10% 9% 15% 12% 22% 12% 11% 11% 12% 13% Bad 2% 2% 2% 2% 5% 1% 7% 3% 3% 4% 4% 5% Very bad 1% 0% 1% 0% 1% 0% 2% 1% 1% 1% 1% 1% (587) (507) (505) (516) (510) (579) (413) (3,632) (3,556) (3,071) (3,180) (19,559)
22

2011 Community Survey Data
36
City
TotalENNW/
Downtown
Prior City totals
Inner Central SESW 2009 2008 20072010NE
Number of total respondents are in parentheses
• Walking distance to public transit?
Very good 37% 56% 41% 55% 44% 53% 28% 45% 46% 46% 43% 43% Good 40% 26% 45% 39% 44% 40% 46% 40% 41% 41% 44% 43% Neutral 10% 6% 9% 5% 11% 6% 16% 9% 7% 7% 7% 8% Bad 9% 8% 4% 1% 2% 2% 8% 5% 4% 4% 4% 4% Very bad 4% 5% 1% 0% 1% 0% 2% 2% 2% 2% 2% 2% (585) (506) (507) (516) (513) (579) (421) (3,642) (3,592) (3,106) (3,201) (19,602)
• Access to shopping and other services?
Very good 20% 44% 22% 42% 29% 33% 15% 30% 31% 30% 27% 28% Good 44% 36% 45% 44% 46% 50% 47% 45% 45% 44% 47% 47% Neutral 24% 11% 21% 11% 18% 13% 24% 17% 16% 17% 17% 16% Bad 9% 7% 10% 2% 6% 4% 11% 7% 6% 8% 7% 6% Very bad 2% 2% 3% 1% 1% 1% 2% 2% 2% 2% 2% 2% (590) (508) (502) (521) (509) (581) (422) (3,647) (3,593) (3,120) (3,212) (19,683)
• On-street parking?
Very good 17% 13% 19% 30% 26% 21% 11% 20% 21% 20% 17% 19% Good 35% 29% 46% 45% 45% 50% 40% 42% 43% 41% 44% 43% Neutral 25% 25% 17% 15% 17% 18% 29% 21% 18% 19% 21% 19% Bad 16% 22% 13% 8% 10% 10% 14% 13% 13% 13% 14% 13% Very bad 7% 11% 5% 2% 2% 2% 7% 5% 6% 7% 6% 6% (585) (484) (497) (517) (509) (576) (417) (3,599) (3,532) (3,050) (3,158) (19,259)

2011 Community Survey Data
37
City
TotalENNW/
Downtown
Prior City totals
Inner Central SESW 2009 2008 20072010NE
Number of total respondents are in parentheses
OVERALL, how do you rate thelivability of:
• Your neighborhood?
Very good 50% 56% 28% 50% 38% 42% 18% 41% 42% 41% 38% 33% Good 45% 34% 55% 42% 45% 47% 48% 45% 45% 47% 48% 48% Neutral 5% 7% 12% 5% 12% 7% 22% 9% 10% 9% 11% 13% Bad 1% 2% 4% 2% 4% 3% 10% 4% 2% 2% 3% 4% Very bad 0% 1% 1% 0% 1% 1% 2% 1% 1% 1% 1% 1% (596) (508) (501) (520) (518) (582) (433) (3,673) (3,611) (3,130) (3,219) (19,726)• The City as a whole?
Very good 27% 36% 22% 39% 26% 29% 12% 28% 30% 31% 31% 28% Good 53% 47% 51% 48% 52% 53% 49% 51% 50% 52% 51% 51% Neutral 15% 13% 21% 10% 17% 14% 30% 17% 15% 13% 14% 15% Bad 4% 3% 3% 3% 4% 3% 7% 4% 3% 3% 3% 5% Very bad 1% 1% 2% 1% 1% 1% 3% 1% 1% 1% 1% 1% (580) (499) (495) (512) (504) (571) (418) (3,594) (3,524) (3,029) (3,127) (19,225)In the past 12 months, how oftenhave you been involved in acommunity project or attendeda public meeting?
More than 10 times 3% 4% 5% 6% 3% 3% 2% 4% 3% 2% - - 6 to 10 times 3% 2% 2% 3% 3% 5% 2% 3% 2% 2% - - 3 to 5 times 8% 8% 8% 9% 6% 5% 5% 7% 7% 6% - - Once or twice 27% 29% 29% 27% 26% 23% 19% 26% 26% 26% - - Never 59% 57% 56% 56% 63% 64% 73% 61% 63% 63% - - (581) (491) (484) (506) (496) (568) (418) (3,559) (3,502) (3,075) - -
24
23

2011 Community Survey Data
38
City
TotalENNW/
Downtown
Prior City totals
Inner Central SESW 2009 2008 20072010NE
Number of total respondents are in parentheses
OVERALL GOVERNMENT
OVERALL, how do you rate City government's job in providing services?
Very good 5% 6% 3% 6% 4% 5% 3% 4% 5% 7% 9% 7% Good 43% 50% 43% 52% 43% 43% 34% 44% 47% 55% 52% 48%
Neutral 38% 31% 42% 31% 38% 38% 42% 37% 35% 28% 29% 31% Bad 10% 9% 9% 8% 11% 9% 15% 10% 9% 7% 8% 10% Very bad 4% 4% 3% 2% 5% 5% 6% 4% 4% 3% 3% 4% (532) (436) (448) (466) (457) (519) (365) (3,237) (3,208) (2,893) (2,795) (18,374)
OVERALL, how do you rate the quality of each of the followingCity services?
• Police
Very good 12% 13% 12% 7% 12% 11% 14% 12% 14% 14% 13% 13% Good 49% 48% 41% 48% 45% 46% 53% 47% 46% 57% 53% 51%
Neutral 28% 24% 32% 30% 32% 30% 21% 29% 25% 21% 24% 24% Bad 8% 12% 9% 13% 9% 10% 9% 10% 10% 7% 8% 8% Very bad 2% 3% 6% 2% 3% 3% 3% 3% 4% 2% 2% 3% (534) (454) (479) (477) (482) (537) (417) (3,394) (3,351) (2,807) (2,873) (18,314)
• Fire & Emergency Services
Very good 32% 32% 30% 27% 33% 28% 32% 30% 34% 34% 32% 33% Good 54% 55% 54% 60% 56% 59% 55% 56% 53% 58% 59% 58% Neutral 13% 12% 15% 13% 11% 12% 13% 13% 13% 8% 9% 9% Bad 1% 1% 1% 1% 0% 1% 0% 1% 0% 0% 5% 1% Very bad 0% 0% 1% 0% 0% 0% 0% 0% 0% 0% 0% 0% (486) (396) (441) (419) (429) (487) (369) (3,068) (3,038) (2,577) (2,664) (16,260)
25
26
2011 Community Survey Data
39
City
TotalENNW/
Downtown
Prior City totals
Inner Central SESW 2009 2008 20072010NE
Number of total respondents are in parentheses
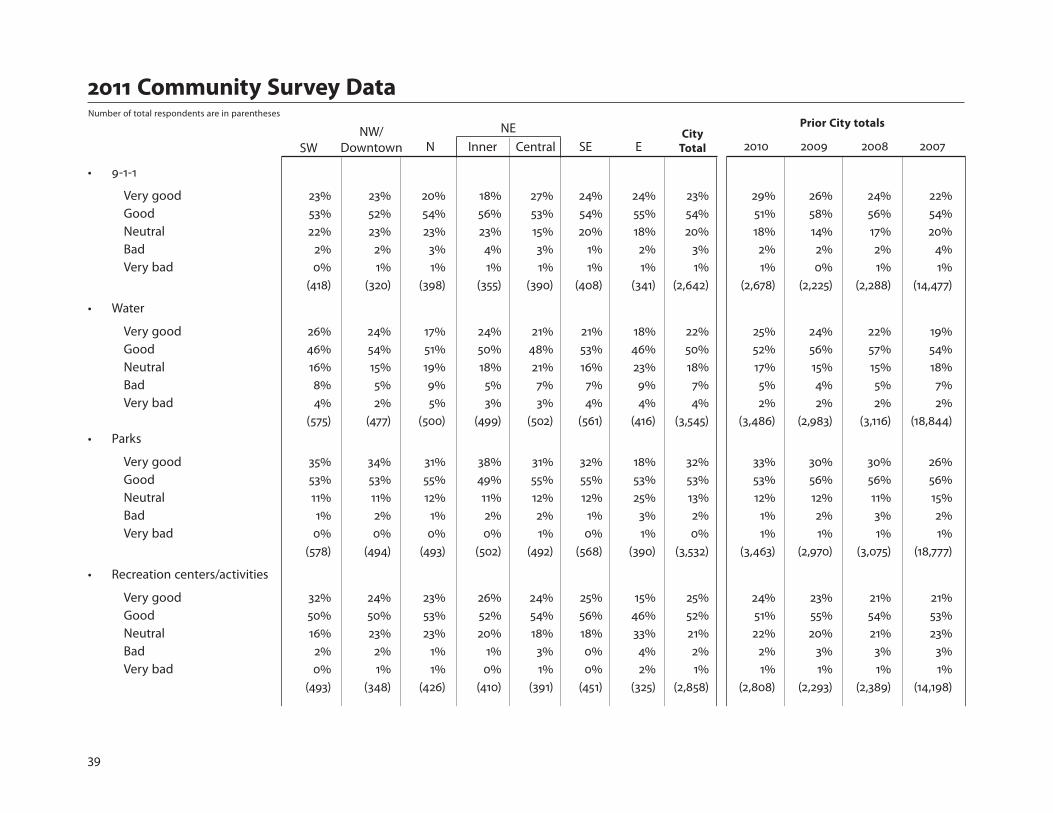
• 9-1-1
Very good 23% 23% 20% 18% 27% 24% 24% 23% 29% 26% 24% 22% Good 53% 52% 54% 56% 53% 54% 55% 54% 51% 58% 56% 54% Neutral 22% 23% 23% 23% 15% 20% 18% 20% 18% 14% 17% 20% Bad 2% 2% 3% 4% 3% 1% 2% 3% 2% 2% 2% 4% Very bad 0% 1% 1% 1% 1% 1% 1% 1% 1% 0% 1% 1% (418) (320) (398) (355) (390) (408) (341) (2,642) (2,678) (2,225) (2,288) (14,477)
• Water
Very good 26% 24% 17% 24% 21% 21% 18% 22% 25% 24% 22% 19% Good 46% 54% 51% 50% 48% 53% 46% 50% 52% 56% 57% 54% Neutral 16% 15% 19% 18% 21% 16% 23% 18% 17% 15% 15% 18% Bad 8% 5% 9% 5% 7% 7% 9% 7% 5% 4% 5% 7% Very bad 4% 2% 5% 3% 3% 4% 4% 4% 2% 2% 2% 2% (575) (477) (500) (499) (502) (561) (416) (3,545) (3,486) (2,983) (3,116) (18,844)• Parks
Very good 35% 34% 31% 38% 31% 32% 18% 32% 33% 30% 30% 26% Good 53% 53% 55% 49% 55% 55% 53% 53% 53% 56% 56% 56% Neutral 11% 11% 12% 11% 12% 12% 25% 13% 12% 12% 11% 15% Bad 1% 2% 1% 2% 2% 1% 3% 2% 1% 2% 3% 2% Very bad 0% 0% 0% 0% 1% 0% 1% 0% 1% 1% 1% 1% (578) (494) (493) (502) (492) (568) (390) (3,532) (3,463) (2,970) (3,075) (18,777)
• Recreation centers/activities
Very good 32% 24% 23% 26% 24% 25% 15% 25% 24% 23% 21% 21% Good 50% 50% 53% 52% 54% 56% 46% 52% 51% 55% 54% 53% Neutral 16% 23% 23% 20% 18% 18% 33% 21% 22% 20% 21% 23% Bad 2% 2% 1% 1% 3% 0% 4% 2% 2% 3% 3% 3% Very bad 0% 1% 1% 0% 1% 0% 2% 1% 1% 1% 1% 1% (493) (348) (426) (410) (391) (451) (325) (2,858) (2,808) (2,293) (2,389) (14,198)

2011 Community Survey Data
40
City
TotalENNW/
Downtown
Prior City totals
Inner Central SESW 2009 2008 20072010NE
Number of total respondents are in parentheses
• Sewers
Very good 8% 10% 7% 6% 6% 6% 8% 7% 8% 9% 10% 8% Good 39% 41% 39% 41% 38% 40% 37% 39% 41% 46% 47% 45%
Neutral 33% 29% 36% 36% 36% 34% 33% 34% 35% 31% 27% 30% Bad 15% 16% 14% 13% 14% 14% 16% 15% 13% 11% 13% 13% Very bad 6% 4% 4% 5% 6% 5% 6% 5% 4% 3% 3% 4% (518) (398) (454) (440) (460) (514) (393) (3,191) (3,173) (2,672) (2,851) (17,281)
• Storm drainage
Very good 6% 6% 7% 4% 7% 4% 6% 6% 7% 8% 8% 6% Good 34% 37% 35% 39% 37% 35% 29% 35% 35% 40% 41% 39% Neutral 35% 31% 37% 36% 33% 37% 36% 35% 35% 32% 29% 31% Bad 18% 21% 16% 17% 18% 17% 21% 18% 18% 17% 17% 19% Very bad 6% 5% 5% 5% 5% 6% 8% 6% 5% 4% 5% 6% (532) (422) (459) (456) (475) (525) (396) (3,279) (3,232) (2,736) (2,868) (17,559)
• Street maintenance
Very good 4% 7% 4% 4% 4% 3% 4% 4% 5% 5% 5% 5% Good 27% 36% 29% 34% 29% 32% 30% 31% 33% 34% 36% 35% Neutral 32% 29% 35% 35% 32% 34% 32% 33% 32% 32% 31% 32% Bad 25% 21% 26% 23% 26% 21% 26% 24% 22% 21% 20% 20% Very bad 13% 8% 6% 5% 10% 10% 9% 9% 7% 8% 8% 8% (583) (496) (501) (511) (507) (562) (419) (3,594) (3,530) (3,046) (3,148) (19,351)
• Street lighting
Very good 6% 11% 5% 6% 7% 7% 8% 7% 9% 8% 8% 8% Good 47% 53% 49% 54% 49% 49% 47% 50% 51% 52% 53% 51% Neutral 34% 27% 33% 30% 31% 32% 32% 31% 29% 28% 28% 28% Bad 10% 7% 10% 10% 11% 10% 10% 10% 9% 9% 9% 10% Very bad 3% 1% 3% 1% 1% 3% 3% 2% 2% 3% 2% 3% (573) (488) (501) (507) (508) (569) (420) (3,580) (3,524) (3,031) (3,173) (19,485)

2011 Community Survey Data
41
City
TotalENNW/
Downtown
Prior City totals
Inner Central SESW 2009 2008 20072010NE
Number of total respondents are in parentheses
• Housing inspections
Very good 6% 8% 4% 3% 6% 4% 5% 5% 5% - - - Good 22% 29% 24% 30% 20% 28% 17% 24% 26% - - - Neutral 63% 49% 52% 49% 57% 54% 54% 54% 55% - - - Bad 6% 8% 14% 14% 9% 8% 18% 11% 9% - - - Very bad 3% 6% 6% 5% 9% 6% 7% 6% 5% - - - (277) (223) (270) (267) (257) (282) (222) (1,808) (1,785) - - -
• Nuisance inspections
Very good 5% 3% 3% 3% 5% 4% 5% 4% 4% - - - Good 16% 24% 16% 23% 16% 22% 16% 19% 21% - - - Neutral 63% 46% 43% 47% 53% 47% 47% 49% 50% - - - Bad 10% 14% 25% 19% 15% 17% 23% 18% 17% - - - Very bad 7% 13% 13% 8% 12% 9% 10% 10% 9% - - - (230) (209) (272) (254) (250) (289) (232) (1,748) (1,770) - - -
• Planning for future land use
Very good 7% 11% 6% 11% 8% 8% 3% 8% 8% 7% 9% 7% Good 34% 36% 31% 39% 31% 35% 16% 32% 32% 36% 36% 32% Neutral 40% 34% 42% 34% 42% 37% 46% 39% 40% 34% 33% 34% Bad 11% 14% 14% 11% 11% 15% 21% 14% 13% 15% 13% 17% Very bad 8% 5% 7% 6% 7% 6% 14% 7% 7% 8% 8% 11% (385) (330) (351) (341) (337) (373) (240) (2,370) (2,376) (2,084) (2,259) (15,513)
• Opportunities to infl uence government decisions
Very good 5% 5% 2% 7% 4% 5% 4% 4% 4% 5% - - Good 22% 29% 24% 27% 20% 23% 10% 22% 24% 27% - - Neutral 40% 39% 39% 42% 44% 39% 43% 41% 42% 39% - - Bad 18% 14% 22% 14% 18% 17% 22% 18% 17% 17% - - Very bad 15% 13% 14% 11% 15% 16% 21% 15% 13% 13% - - (396) (334) (349) (337) (365) (385) (268) (2,447) (2,483) (2,115) - -
2011 Community Survey Data
42
City
TotalENNW/
Downtown
Prior City totals
Inner Central SESW 2009 2008 20072010NE
Number of total respondents are in parentheses
DEMOGRAPHICS
What is your sex?
Male 41% 47% 39% 34% 33% 39% 40% 39% 39% 40% 41% 39% Female 59% 53% 61% 66% 67% 61% 60% 61% 61% 60% 59% 61% (587) (506) (501) (516) (513) (581) (431) (3,650) (3,566) (3,117) (3,227) (19,525)
What is your age?
Under 20 0% 0% 0% 0% 0% 0% 1% 0% 0% 0% 0% 0% 20-29 5% 9% 6% 8% 4% 7% 6% 6% 8% 8% 8% 9% 30-44 22% 21% 34% 36% 28% 32% 22% 28% 28% 28% 27% 28% 45-59 37% 33% 28% 25% 34% 28% 32% 31% 31% 30% 34% 31% 60-74 27% 29% 25% 23% 24% 23% 26% 25% 24% 23% 21% 21% Over 74 9% 7% 8% 8% 10% 10% 15% 9% 9% 12% 10% 11% (588) (506) (505) (517) (518) (582) (431) (3,662) (3,585) (3,080) (3,187) (19,869)In the past 12 months what wasyour pre-tax income?
No income 4% 3% 3% 3% 4% 5% 5% 4% 4% - - - Less than $20,000 7% 12% 16% 16% 13% 12% 18% 13% 14% - - - $20,000 - $34,999 13% 12% 23% 18% 24% 23% 27% 20% 21% - - - $35,000 - $74,999 33% 25% 41% 33% 36% 37% 38% 35% 35% - - - 75,000 - $149,999 30% 29% 15% 22% 20% 18% 13% 21% 20% - - - $150,000 + 14% 19% 2% 8% 4% 5% 1% 8% 7% - - - (556) (479) (477) (499) (495) (561) (401) (3,481) (3,383) - - -

2011 Community Survey Data
43
City
TotalENNW/
Downtown
Prior City totals
Inner Central SESW 2009 2008 20072010NE
Number of total respondents are in parentheses
Which of these is closest todescribing your ethnicbackground?
Caucasian/White 90% 89% 85% 79% 87% 88% 82% 86% 86% 86% 85% 87% African American/Black 0% 1% 7% 10% 3% 1% 2% 3% 3% 3% 4% 3% Asian or Pacifi c Islander 5% 6% 3% 3% 5% 5% 9% 5% 5% 5% 5% 5% Native American/Indian 0% 0% 1% 1% 1% 0% 1% 1% 1% 1% 1% 1% Hispanic/Latino 1% 1% 3% 3% 2% 2% 3% 2% 2% 2% 2% 2% Other 3% 4% 3% 4% 2% 4% 3% 3% 3% 4% 4% 4% (580) (498) (495) (505) (514) (572) (426) (3,605) (3,530) (3,069) (3,194) (19,659)
How much education have youcompleted?
Elementary school 0% 1% 1% 1% 1% 1% 2% 1% 1% 0% 1% 0% Some high school 1% 0% 2% 1% 4% 2% 4% 2% 2% 2% 3% 2% High school grad 4% 3% 15% 7% 12% 13% 22% 11% 11% 11% 10% 10% Some college 18% 16% 28% 21% 29% 24% 37% 24% 26% 26% 26% 32% College grad or more 77% 80% 55% 70% 55% 61% 36% 63% 61% 62% 62% 56% (592) (506) (506) (520) (521) (583) (429) (3,672) (3,593) (3,134) (3,223) (19,895)
NOTES:1) The survey accuracy of 2011 City Total fi gures is +/- 1.6 percent.2) The survey accuracy in any of the coalitions for 2011 ranges from +/- 4.0 to +/- 4.7 percent.3) Total number of respondents shown in parentheses.4) Percents may not add to 100 due to rounding.5) Coalition totals may not add to City Total.

2011 Community Survey Data
44
City
TotalENNW/
Downtown
Prior City totals
Inner Central SESW 2009 2008 20072010NE
Number of total respondents are in parentheses

SU
RV
EY
FO
RM

For each question, darken the one bubble that best fi ts your opinion, like this: , with a black or blue pen if possible.
PUB
LIC
SA
FETY
TRA
NSP
OR
T.PU
BLI
C U
TILI
TIES
2011 Portland Community Survey
YES NO 2. Do you know where to get assistance if you want to start or join a community group that works on crime issues?
YES NO
YES NO
3. Did anyone break into, or burglarize, your home during the last 12 months?
If yes: Was it reported to the police?
4. Did anyone break into, or attempt to break into, any vehicles belonging to your household in the last 12 months?
If yes: Was it reported to the police?
YES NO
YES NO
7. If a disaster were to occur, you would have enough supplies to take care of your household for:
NO SUPPLIES1 DAYUP TO 3
DAYSUP TO 1 WEEK
UP TO 1 MONTH
DON’TKNOW
9. How well do you think the sewer and storm drainage systems protect water quality in our local streams and rivers?
VERY GOOD GOOD NEUTRAL BAD VERY BADDON’TKNOW
8. How do you rate the tap water provided by the City?
VERY GOOD GOOD NEUTRAL BAD VERY BADDON’TKNOW
If yes: How do you rate the services you received on the phone from the 9-1-1 calltaker?
6. Did you call 9-1-1 for an emergency in the last 12 months? YES NO
VERY GOOD GOOD NEUTRAL BAD VERY BADDON’TKNOW
1. How safe would you feel walking alone during the day: • in your neighborhood? • in the park closest to you?
• downtown?
How safe would you feel walking alone at night: • in your neighborhood? • in the park closest to you? • downtown?
VERY SAFE SAFE NEUTRAL UNSAFE VERY UNSAFEDON’TKNOW
5. How do you rate the City of Portland's efforts to regulate conduct of Portland police offi cers: • Internal Police Bureau efforts? • Auditor's Independent Police Review Division efforts?
VERY GOOD GOOD NEUTRAL BAD VERY BADDON’TKNOW
10. How do you rate garbage/recycling service: • cost? • quality?
VERY GOOD GOOD NEUTRAL BAD VERY BADDON’TKNOW
11. How do you rate traffi c fl ow (congestion) on major streets and thoroughfares, excluding freeways: • during peak traffi c hours, that is 7-9 a.m. and 3:30 - 6:00 p.m.? • during off-peak traffi c hours?
VERY GOOD GOOD NEUTRAL BAD VERY BADDON’TKNOW
TRA
NSPO
RTATIO
NPA
RK
S & R
ECR
EATION
CO
MM
UN
ITY DEVELO
PMEN
T
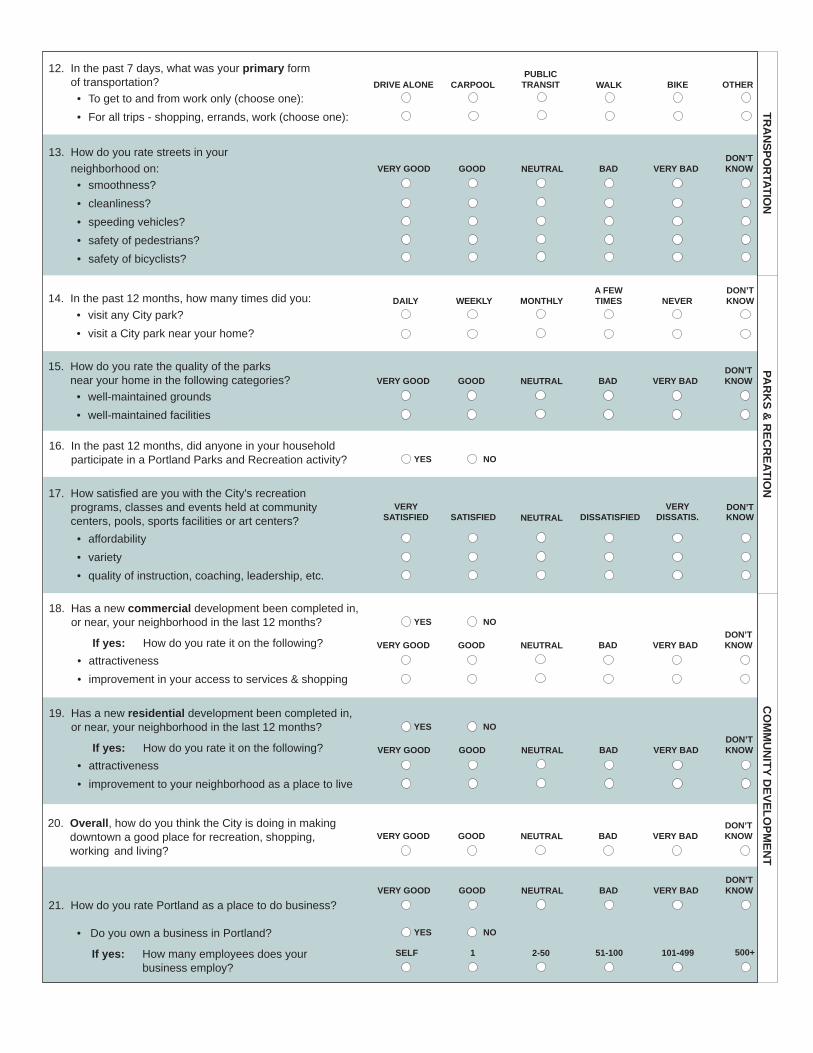
12. In the past 7 days, what was your primary form of transportation? • To get to and from work only (choose one): • For all trips - shopping, errands, work (choose one):
DRIVE ALONEPUBLIC
TRANSIT BIKE OTHERCARPOOL WALK
13. How do you rate streets in your neighborhood on: • smoothness? • cleanliness? • speeding vehicles? • safety of pedestrians? • safety of bicyclists?
VERY GOOD GOOD NEUTRAL BAD VERY BADDON’TKNOW
15. How do you rate the quality of the parks near your home in the following categories? • well-maintained grounds • well-maintained facilities
VERY GOOD GOOD NEUTRAL BAD VERY BADDON’TKNOW
14. In the past 12 months, how many times did you: • visit any City park? • visit a City park near your home?
A FEW TIMESDAILY MONTHLYWEEKLY
DON’TKNOWNEVER
18. Has a new commercial development been completed in, or near, your neighborhood in the last 12 months?
If yes: How do you rate it on the following? • attractiveness • improvement in your access to services & shopping
YES NO
VERY GOOD GOOD NEUTRAL BAD VERY BADDON’TKNOW
19. Has a new residential development been completed in, or near, your neighborhood in the last 12 months?
If yes: How do you rate it on the following? • attractiveness • improvement to your neighborhood as a place to live
YES NO
VERY GOOD GOOD NEUTRAL BAD VERY BADDON’TKNOW
16. In the past 12 months, did anyone in your household participate in a Portland Parks and Recreation activity? YES NO
21. How do you rate Portland as a place to do business?
• Do you own a business in Portland?
If yes: How many employees does your business employ?
VERY GOOD GOOD NEUTRAL BAD VERY BADDON’TKNOW
YES NO
SELF 1 2-50 51-100 101-499 500+
20. Overall, how do you think the City is doing in making downtown a good place for recreation, shopping, working and living?
VERY GOOD GOOD NEUTRAL BAD VERY BADDON’TKNOW
17. How satisfi ed are you with the City's recreation programs, classes and events held at community centers, pools, sports facilities or art centers? • affordability • variety • quality of instruction, coaching, leadership, etc.
VERY SATISFIED SATISFIED DISSATISFIED
DON’TKNOWNEUTRAL
VERY DISSATIS.

OVE
RA
LL G
OVE
RN
MEN
TC
OM
MU
NIT
Y D
EVEL
OPM
ENT
DEM
OG
RA
PHIC
S
Your survey is anonymous. The following questions are included only to help us know how well our results represent all residents.
What is your sex? Male Female
Which of these is closest to describing your ethnic background?
Caucasian/White Asian or Pacifi c Islander Hisp./Latino
African-American/Black Native American/Indian Other
How much education have you completed? Elementary High school graduate
Some high school Some college
College grador more
End of survey – THANK YOU VERY MUCH!
23. Overall, how do you rate the livability of: • your neighborhood? • the City as a whole?
VERY GOOD GOOD NEUTRAL BAD VERY BADDON’TKNOW
25. Overall, how do you rate City government's job in providing services?
VERY GOOD GOOD NEUTRAL BAD VERY BADDON’TKNOW
24. In the past 12 months, how often have you been involved in a community project or attended a public meeting?
DON’TKNOW
MORE THAN 10 TIMES
6 TO 10 TIMES
3 TO 5 TIMES
ONCE OR TWICE NEVER
What is your age? Under 20 45-59 60-74 Over 7430-4420-29
22. How do you rate your neighborhood on:
• housing affordability? • physical condition of housing? • closeness of parks or open spaces? • walking distance to public transit? • access to shopping and other services? • on-street parking?
VERY GOOD GOOD NEUTRAL BAD VERY BADDON’TKNOW
26. Overall, how do you rate the quality of each of the following City services?
• Police
• Fire & Emergency Services
• 9-1-1
• Water
• Parks
• Recreation centers/activities
• Sewers
• Storm drainage
• Street maintenance
• Street lighting
• Housing inspections
• Nuisance inspections
• Planning for future land use
• Opportunities to infl uence government decisions
VERY GOOD GOOD NEUTRAL BAD VERY BADDON’TKNOW
In the past 12 months what was your pre-tax income?
No income $20,000 - $34,999 $75,000 - $149,000
Less than $20,000 $35,000 - $74,999 $150,000 or more


This report is intended to promote the best possible management of public resources. This and other audit reports produced by the Audit Services Division are available for view-ing on the web at: www.portlandoregon.gov/auditor/auditservices. Printed copies can be obtained by contacting the Audit Services Division.
Audit Services Division
Offi ce of the City Auditor
1221 SW 4th Avenue, Room 310
Portland, Oregon 97204
503-823-4005
www.portlandoregon.gov/auditor/auditservices
City of Portland 21st Annual Community Survey Results (Report #409, December 2011)
Audit Team: Jennifer Scott, Bob MacKay
LaVonne Griffi n-Valade, City AuditorDrummond Kahn, Director of Audit Services
Other recent audit reports:
Span of Control: Although numbers are reported, bureaus lack organizational structure goals (#397, August 2011)
Portland’s Fiscal Sustainability and Financial Condition: Actions now can reduce risk of future problems (#399, July 2011)
Portland Center for the Performing Arts: Outsourced management good for the City, but agreements and oversight need improvement (#393, June 2011)