city of rowlett, texas
TRANSCRIPT
City of Rowlett, Texas
300 S. Orange Avenue, Suite 1170Orlando, FL 32801(407) 648-2208(407) 648-1323 fax
PFM Asset Management LLCOne Keystone Plaza, Suite 300North Front & Market StreetsHarrisburg, PA 17101-2044717-232-2723 • 717-233-6073 fax
Investment Performance ReviewQuarter Ended March 31, 2015
Investment AdvisorsSteven Alexander, CTP, CGFO, CPPT, Managing DirectorD. Scott Stitcher, CFA, Senior Managing ConsultantRichard Pengelly, CFA, CTP, Senior Managing ConsultantGregg Manjerovic, CFA, Portfolio ManagerRebecca Geyer, CTP, Senior Analyst
City of Rowlett, Texas Investment Report - Quarter Ended March 31, 2015
Table of ContentsTab I.
A. Market Review
Tab II.B. Portfolio Summary of All AccountsC. Pooled FundsD. Long Term Pooled FundE. Asset Allocation Chart as of March 31, 2015F. Investment Officer's Certification
Tab III. January 31, 2015 PFM Month-End StatementFebruary 28, 2015 PFM Month-End StatementMarch 31, 2015 PFM Month-End Statement(statements are available online at www.pfm.com)
Tab IV. January 31, 2015 TexPool Month End StatementsFebruary 28, 2015 TexPool Month End StatementsMarch 31, 2015 TexPool Month End Statements
This material is based on information obtained from sources generally believed to be reliable and available to the public, however PFM Asset Management LLC cannot guarantee its accuracy, completeness or suitability. This material is for general information purposes only and is not intended to provide specific advice or recommendation. The information contained in this report is not an offer to purchase or sell any securities.
Table of Contents Section i
City of Rowlett, Texas Investment Report - Quarter Ended March 31, 2015
TAB I
City of Rowlett, Texas Investment Report – Quarter Ended March 31, 2015
PFM Asset Management LLC Section A-1
Summary
For the first quarter of 2015, accommodative global central bankpolicies were a major driver of financial markets. The European CentralBank (ECB) initiated an asset purchase program similar to the FederalReserve’s (Fed’s) quantitative easing (QE) policies that concluded lastyear, and the Federal Open Market Committee (FOMC) seemed torelax its stance on tightening monetary policy in the near future.
U.S. Treasuries experienced their longest period of quarterly gainssince 1998. The 10‐year Treasury yield fell for the fifth consecutivequarter.
After a brief period of recovery, oil prices headed toward the lowerend of recent ranges.
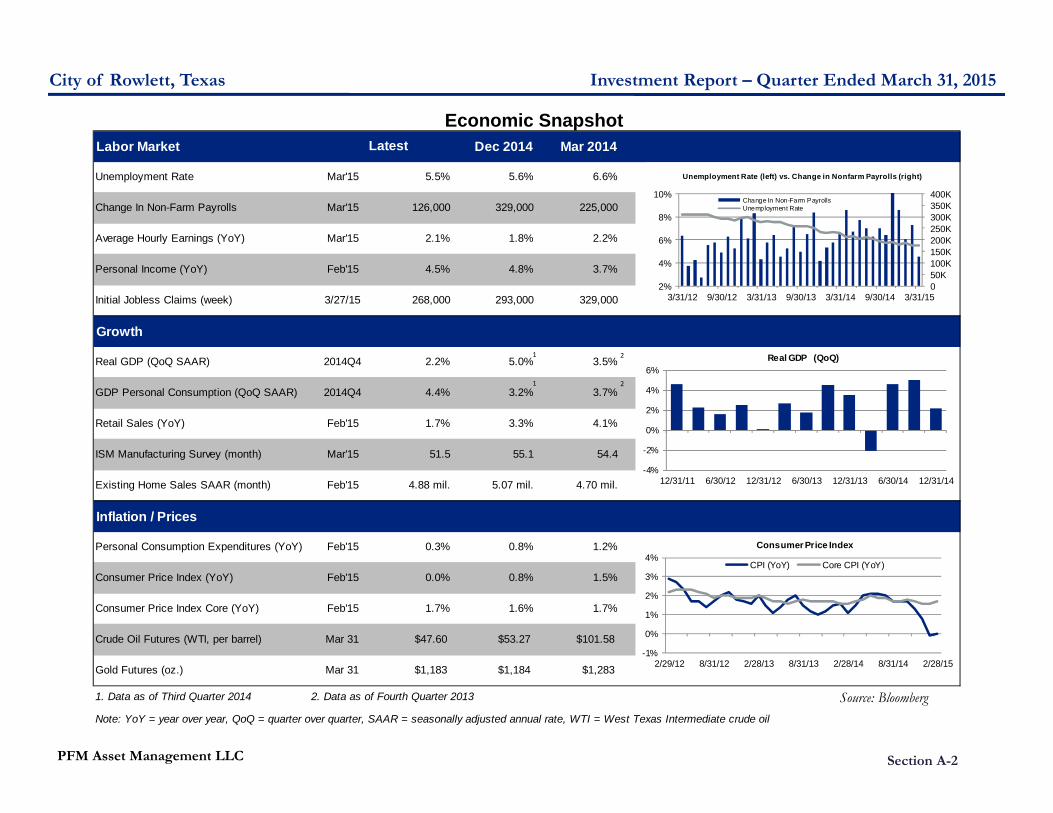
Economic Snapshot
For the fourth quarter of 2014, gross domestic product (GDP) grew at apace of 2.2%. The components of the GDP report showed thathousehold spending rose to a nine‐year high and that an increase inexports was offset by growth in inventories, which were weaker thanpreviously expected.
The U.S. labor market continued to improve, as the unemploymentrate fell from 5.6% in December to 5.5% in March, marking its lowestpoint since mid‐ 2008.
Consumer confidence for the first quarter reached its highest levelsince the second quarter of 2007, as lower gasoline prices and anincrease in personal income helped generate higher amounts ofdisposable income. However, consumers slowed the pace of theirspending for the quarter, as retail sales fell for the months ofDecember, January, and February.
New‐home sales rose nearly 8% in February, marking their highestlevel since early 2008 and serving as a bright spot in a mixed bag ofrecent housing‐market data.
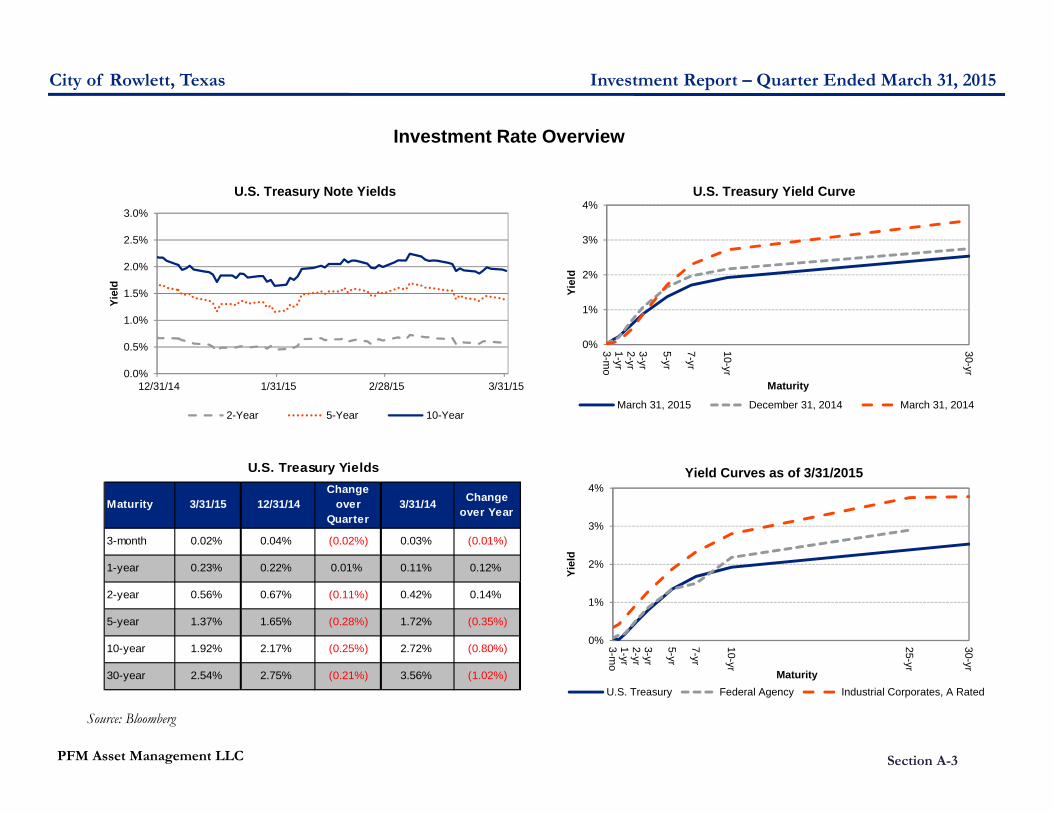
Interest Rates
At its March meeting, the FOMC removed the word “patient” fromits previous statement, indicating that the current target range forthe federal funds rate will be appropriate until the FOMC is“reasonably confident” that inflation is moving toward its 2%objective. The statement also implied that economic growth hasbeen somewhat weaker than it was earlier in the year.
A Reuters poll released at the end of March showed that 17 of 21primary dealers expect the first interest rate hike to occur inSeptember at the earliest, with only four dealers expecting thefirst hike to occur in June.
Sector Performance
Driven by a Treasury market rally, fixed‐income marketperformance was generally positive for the quarter. Returns weredependent on both maturity and sector.
The yield curve flattened modestly over the quarter as longermaturities declined further than shorter maturities. This marketmovement and its positive impact on longer durations combinedto provide performance in excess of initial yields.
Agency spreads for short and intermediate maturities widenedmodestly during the quarter. Accordingly, the sector’sperformance was largely in line with comparable‐maturityTreasuries.
Corporate securities slightly outperformed government‐relatedoptions with similar maturities, as they were aided by excessincome and a relatively unchanged yield spread relationship.
While still generating positive performance, mortgage‐backed andasset‐backed securities trailed other high‐quality investmentoptions for the quarter.
Yields on money market‐related securities remained at theelevated levels to which they rose at the end of 2014, makingthem attractive options for short‐maturity investment needs.
City of Rowlett, Texas Investment Report – Quarter Ended March 31, 2015
PFM Asset Management LLC Section A-2
Source: Bloomberg
Economic SnapshotLabor Market Dec 2014 Mar 2014
Unemployment Rate Mar'15 5.5% 5.6% 6.6%
Change In Non-Farm Payrolls Mar'15 126,000 329,000 225,000
Average Hourly Earnings (YoY) Mar'15 2.1% 1.8% 2.2%
Personal Income (YoY) Feb'15 4.5% 4.8% 3.7%
Initial Jobless Claims (week) 3/27/15 268,000 293,000 329,000
Growth
Real GDP (QoQ SAAR) 2014Q4 2.2% 5.0% 3.5%
GDP Personal Consumption (QoQ SAAR) 2014Q4 4.4% 3.2% 3.7%
Retail Sales (YoY) Feb'15 1.7% 3.3% 4.1%
ISM Manufacturing Survey (month) Mar'15 51.5 55.1 54.4
Existing Home Sales SAAR (month) Feb'15 4.88 mil. 5.07 mil. 4.70 mil.
Inflation / Prices
Personal Consumption Expenditures (YoY) Feb'15 0.3% 0.8% 1.2%
Consumer Price Index (YoY) Feb'15 0.0% 0.8% 1.5%
Consumer Price Index Core (YoY) Feb'15 1.7% 1.6% 1.7%
Crude Oil Futures (WTI, per barrel) Mar 31 $47.60 $53.27 $101.58
Gold Futures (oz.) Mar 31 $1,183 $1,184 $1,283
1. Data as of Third Quarter 2014 2. Data as of Fourth Quarter 2013
Note: YoY = year over year, QoQ = quarter over quarter, SAAR = seasonally adjusted annual rate, WTI = West Texas Intermediate crude oil
Latest
050K100K150K200K250K300K350K400K
2%
4%
6%
8%
10%
3/31/12 9/30/12 3/31/13 9/30/13 3/31/14 9/30/14 3/31/15
Unemployment Rate (left) vs. Change in Nonfarm Payrolls (right)
Change In Non-Farm PayrollsUnemployment Rate
-4%
-2%
0%
2%
4%
6%
12/31/11 6/30/12 12/31/12 6/30/13 12/31/13 6/30/14 12/31/14
Real GDP (QoQ)
-1%
0%
1%
2%
3%
4%
2/29/12 8/31/12 2/28/13 8/31/13 2/28/14 8/31/14 2/28/15
Consumer Price Index
CPI (YoY) Core CPI (YoY)
2
2
1
1
City of Rowlett, Texas Investment Report – Quarter Ended March 31, 2015
PFM Asset Management LLC Section A-3
Source: Bloomberg
Investment Rate Overview
0.0%
0.5%
1.0%
1.5%
2.0%
2.5%
3.0%
12/31/14 1/31/15 2/28/15 3/31/15
Yiel
d
U.S. Treasury Note Yields
2-Year 5-Year 10-Year
0%
1%
2%
3%
4%
3-mo
1-yr2-yr3-yr
5-yr
7-yr
10-yr
30-yr
Yiel
d
Maturity
U.S. Treasury Yield Curve
March 31, 2015 December 31, 2014 March 31, 2014
0%
1%
2%
3%
4%
3-mo
1-yr2-yr3-yr
5-yr
7-yr
10-yr
25-yr
30-yr
Yiel
d
Maturity
Yield Curves as of 3/31/2015
U.S. Treasury Federal Agency Industrial Corporates, A Rated
Maturity 3/31/15 12/31/14Change
over Quarter
3/31/14 Change over Year
3-month 0.02% 0.04% (0.02%) 0.03% (0.01%)
1-year 0.23% 0.22% 0.01% 0.11% 0.12%
2-year 0.56% 0.67% (0.11%) 0.42% 0.14%
5-year 1.37% 1.65% (0.28%) 1.72% (0.35%)
10-year 1.92% 2.17% (0.25%) 2.72% (0.80%)
30-year 2.54% 2.75% (0.21%) 3.56% (1.02%)
U.S. Treasury Yields
City of Rowlett, Texas Investment Report – Quarter Ended March 31, 2015
PFM Asset Management LLC Section A-4
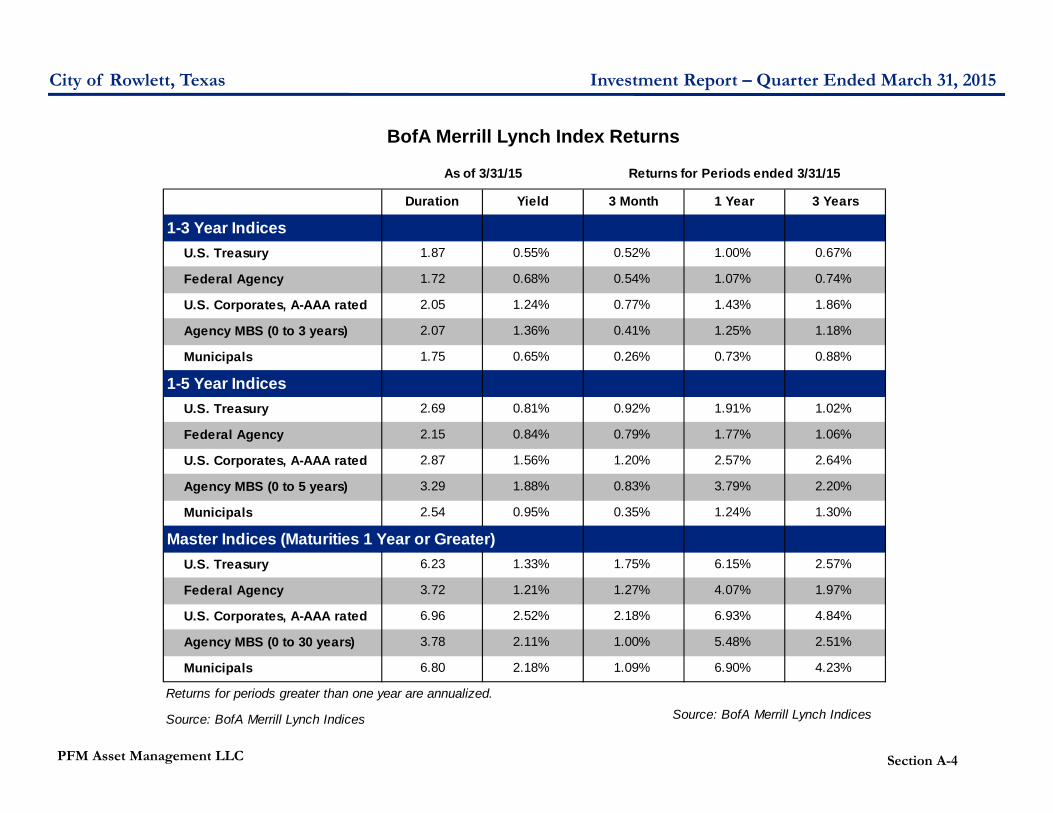
BofA Merrill Lynch Index Returns
Source: BofA Merrill Lynch Indices
Duration Yield 3 Month 1 Year 3 Years
1-3 Year IndicesU.S. Treasury 1.87 0.55% 0.52% 1.00% 0.67%
Federal Agency 1.72 0.68% 0.54% 1.07% 0.74%
U.S. Corporates, A-AAA rated 2.05 1.24% 0.77% 1.43% 1.86%
Agency MBS (0 to 3 years) 2.07 1.36% 0.41% 1.25% 1.18%
Municipals 1.75 0.65% 0.26% 0.73% 0.88%
1-5 Year IndicesU.S. Treasury 2.69 0.81% 0.92% 1.91% 1.02%
Federal Agency 2.15 0.84% 0.79% 1.77% 1.06%
U.S. Corporates, A-AAA rated 2.87 1.56% 1.20% 2.57% 2.64%
Agency MBS (0 to 5 years) 3.29 1.88% 0.83% 3.79% 2.20%
Municipals 2.54 0.95% 0.35% 1.24% 1.30%
Master Indices (Maturities 1 Year or Greater)U.S. Treasury 6.23 1.33% 1.75% 6.15% 2.57%
Federal Agency 3.72 1.21% 1.27% 4.07% 1.97%
U.S. Corporates, A-AAA rated 6.96 2.52% 2.18% 6.93% 4.84%
Agency MBS (0 to 30 years) 3.78 2.11% 1.00% 5.48% 2.51%
Municipals 6.80 2.18% 1.09% 6.90% 4.23%
Returns for periods greater than one year are annualized.
Source: BofA Merrill Lynch Indices
Returns for Periods ended 3/31/15As of 3/31/15
City of Rowlett, Texas Investment Report – Quarter Ended March 31, 2015
PFM Asset Management LLC Section A-5
Disclosures
The views expressed within this material constitute the perspective and judgment of PFM Asset Management LLC (PFMAM) at the time of distributionand are subject to change. Information is obtained from sources generally believed to be reliable and available to the public; however, PFMAMcannot guarantee its accuracy, completeness, or suitability. This material is for general information purposes only and is not intended to providespecific advice or recommendation. The information contained in this report is not an offer to purchase or sell any securities.
Further distribution is not permitted without prior written consent.

City of Rowlett, Texas Investment Report - Quarter Ended March 31, 2015
TAB II
City of Rowlett, Texas Investment Report - Quarter Ended March 31, 2015
Executive Summary
PORTFOLIO STRATEGY
The City’s Pooled Funds and Long Term Pooled Fund Portfolios are of high credit quality and invested in TexPool, U.S. Treasury, Federal Agency, and high quality commercial paper securities.
The portfolio’s duration was 80% of the benchmark’s duration and is the primary reason for underperformance compared to the benchmark. Part of the strategy behind the shorter duration was to ensure liquidity was available if the City needed to draw on the portfolio again and protect market value as interest rates rise. PFM will continue to manage the portfolio with safety and liquidity in mind as interest rates rise. The Long Term Pooled Fund Portfolio’s quarterly total return performance of 0.38%, underperformed the benchmark performance of 0.52% by 0.14%.
The Pooled Funds Portfolio continues to provide the City with favorable yield relative to the benchmark. At quarter end, the portfolio had a Yield to Maturity at Cost of 0.27%, exceeding the Yield of its benchmark the TexPool by 22 basis points (0.22%).
Macroeconomic conditions in the U.S. moderated throughout the quarter evidenced by lackluster economic data, Greek inspired geopolitical uncertainty, and a FOMC that indicated a tendency for lower rates throughout the period. The market reacted with a Treasury rally that sent yields across the curve generally lower; the impact being greater on longer maturities which continued to reflect persistently low inflation expectations.
The FOMC has indicated a strong focus on their inflation mandate by removing its “patient” guidance in favor of a need to be “reasonably confident that inflation will move back to its two percent objective.” This emphasis on what continues to be stubbornly low inflation, combined with the FOMC’s more conservative projections for the future trajectory of the federal funds rate, formulates our market view that rates will remain in their current range in the coming months. With this expectation, we will maintain portfolio durations closer to their respective benchmarks in an effort to maximize investment income.
We expect volatility to continue throughout the quarter; particularly around the announcement of key economic releases as market participants digest the impact not only on the timing of an initial FOMC rate hike, but also on the pace and rate of subsequent hikes as well. In a potentially turbulent market environment, we will respect well defined trading ranges; adding duration when rates are elevated, and remaining patient when rates are restrained. Additionally, we will stress security selection, exposure to non-government sectors, and yield curve placement, as we believe those factors will be the primary drivers of performance.
PFM will continue to navigate the market environment with a keen focus on relative value sector analysis, prudent duration management, and efficient yield curve placement. While producing strong investment returns remains a priority, it is secondary to maintaining safety and liquidity, particularly in the current environment where we expect yields to trend higher.
PFM Asset Management LLC Section B - 1
City of Rowlett, Texas Investment Report - Quarter Ended March 31, 2015
Summary Portfolio Statistics
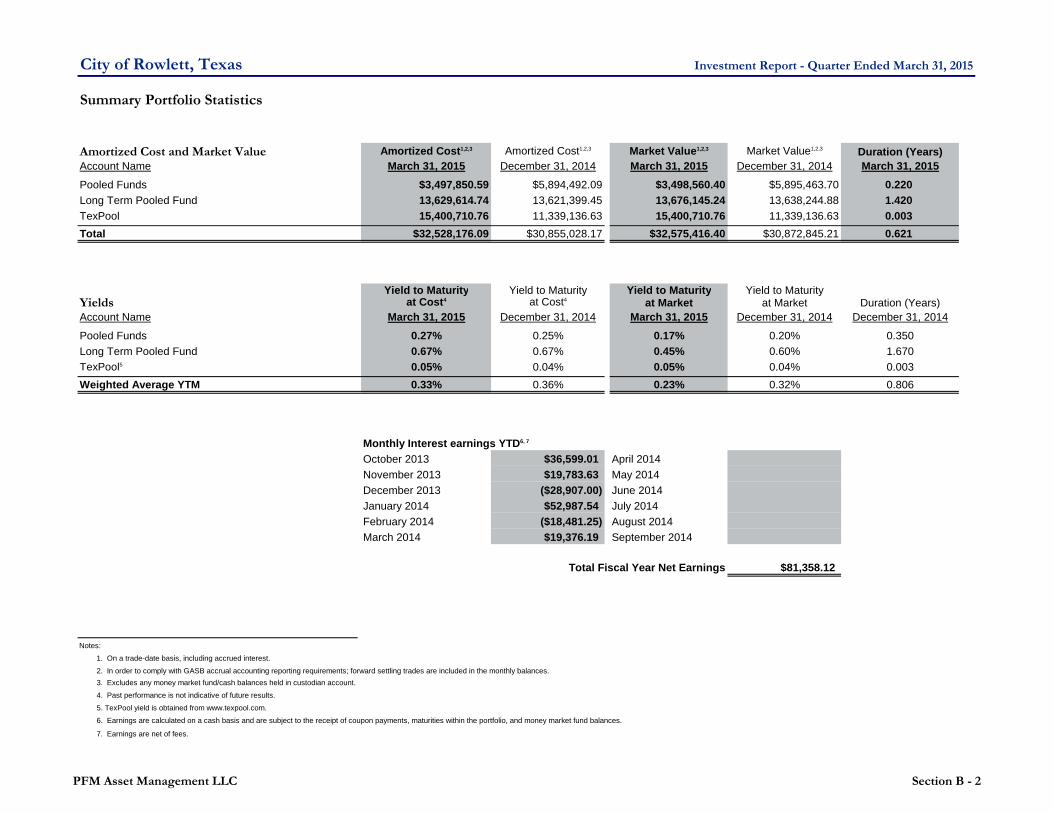
Amortized Cost and Market Value Amortized Cost1,2,3 Amortized Cost1,2,3 Market Value1,2,3 Market Value1,2,3 Duration (Years)Account Name March 31, 2015 December 31, 2014 March 31, 2015 December 31, 2014 March 31, 2015Pooled Funds $3,497,850.59 $5,894,492.09 $3,498,560.40 $5,895,463.70 0.220 Long Term Pooled Fund 13,629,614.74 13,621,399.45 13,676,145.24 13,638,244.88 1.420 TexPool 15,400,710.76 11,339,136.63 15,400,710.76 11,339,136.63 0.003 Total $32,528,176.09 $30,855,028.17 $32,575,416.40 $30,872,845.21 0.621
Yield to Maturity Yield to Maturity Yield to Maturity Yield to MaturityYields at Cost4 at Cost4 at Market at Market Duration (Years)Account Name March 31, 2015 December 31, 2014 March 31, 2015 December 31, 2014 December 31, 2014
Pooled Funds 0.27% 0.25% 0.17% 0.20% 0.350Long Term Pooled Fund 0.67% 0.67% 0.45% 0.60% 1.670TexPool5 0.05% 0.04% 0.05% 0.04% 0.003Weighted Average YTM 0.33% 0.36% 0.23% 0.32% 0.806
Monthly Interest earnings YTD6, 7
October 2013 $36,599.01 April 2014November 2013 $19,783.63 May 2014December 2013 ($28,907.00) June 2014January 2014 $52,987.54 July 2014February 2014 ($18,481.25) August 2014March 2014 $19,376.19 September 2014
Total Fiscal Year Net Earnings $81,358.12
Notes:
1. On a trade-date basis, including accrued interest.
2. In order to comply with GASB accrual accounting reporting requirements; forward settling trades are included in the monthly balances.3. Excludes any money market fund/cash balances held in custodian account.
4. Past performance is not indicative of future results.
5. TexPool yield is obtained from www.texpool.com.
6. Earnings are calculated on a cash basis and are subject to the receipt of coupon payments, maturities within the portfolio, and money market fund balances.
7. Earnings are net of fees.
PFM Asset Management LLC Section B - 2
City of Rowlett, Texas Investment Report - Quarter Ended March 31, 2015
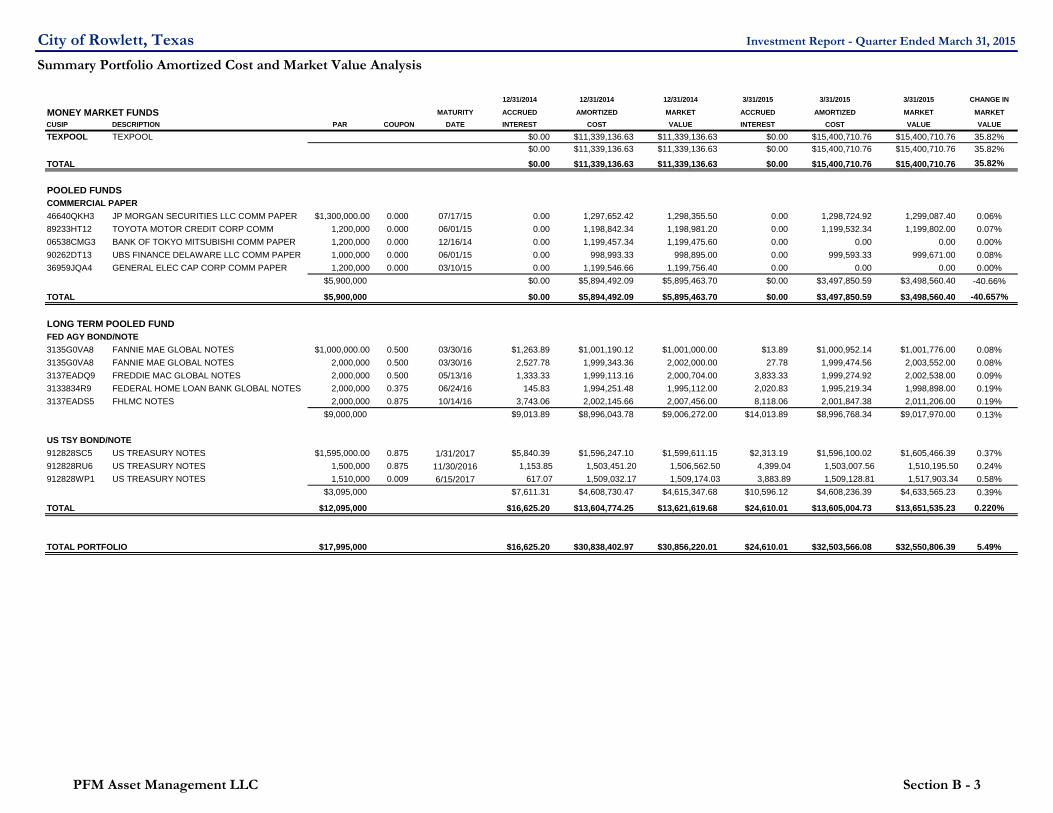
Summary Portfolio Amortized Cost and Market Value Analysis
12/31/2014 12/31/2014 12/31/2014 3/31/2015 3/31/2015 3/31/2015 CHANGE IN
MONEY MARKET FUNDS MATURITY ACCRUED AMORTIZED MARKET ACCRUED AMORTIZED MARKET MARKETCUSIP DESCRIPTION PAR COUPON DATE INTEREST COST VALUE INTEREST COST VALUE VALUE
TEXPOOL TEXPOOL $0.00 $11,339,136.63 $11,339,136.63 $0.00 $15,400,710.76 $15,400,710.76 35.82%$0.00 $11,339,136.63 $11,339,136.63 $0.00 $15,400,710.76 $15,400,710.76 35.82%
TOTAL $0.00 $11,339,136.63 $11,339,136.63 $0.00 $15,400,710.76 $15,400,710.76 35.82%
POOLED FUNDSCOMMERCIAL PAPER46640QKH3 JP MORGAN SECURITIES LLC COMM PAPER $1,300,000.00 0.000 07/17/15 0.00 1,297,652.42 1,298,355.50 0.00 1,298,724.92 1,299,087.40 0.06%89233HT12 TOYOTA MOTOR CREDIT CORP COMM 1,200,000 0.000 06/01/15 0.00 1,198,842.34 1,198,981.20 0.00 1,199,532.34 1,199,802.00 0.07%06538CMG3 BANK OF TOKYO MITSUBISHI COMM PAPER 1,200,000 0.000 12/16/14 0.00 1,199,457.34 1,199,475.60 0.00 0.00 0.00 0.00%90262DT13 UBS FINANCE DELAWARE LLC COMM PAPER 1,000,000 0.000 06/01/15 0.00 998,993.33 998,895.00 0.00 999,593.33 999,671.00 0.08%36959JQA4 GENERAL ELEC CAP CORP COMM PAPER 1,200,000 0.000 03/10/15 0.00 1,199,546.66 1,199,756.40 0.00 0.00 0.00 0.00%
$5,900,000 $0.00 $5,894,492.09 $5,895,463.70 $0.00 $3,497,850.59 $3,498,560.40 -40.66%
TOTAL $5,900,000 $0.00 $5,894,492.09 $5,895,463.70 $0.00 $3,497,850.59 $3,498,560.40 -40.657%
LONG TERM POOLED FUNDFED AGY BOND/NOTE3135G0VA8 FANNIE MAE GLOBAL NOTES $1,000,000.00 0.500 03/30/16 $1,263.89 $1,001,190.12 $1,001,000.00 $13.89 $1,000,952.14 $1,001,776.00 0.08%3135G0VA8 FANNIE MAE GLOBAL NOTES 2,000,000 0.500 03/30/16 2,527.78 1,999,343.36 2,002,000.00 27.78 1,999,474.56 2,003,552.00 0.08%3137EADQ9 FREDDIE MAC GLOBAL NOTES 2,000,000 0.500 05/13/16 1,333.33 1,999,113.16 2,000,704.00 3,833.33 1,999,274.92 2,002,538.00 0.09%3133834R9 FEDERAL HOME LOAN BANK GLOBAL NOTES 2,000,000 0.375 06/24/16 145.83 1,994,251.48 1,995,112.00 2,020.83 1,995,219.34 1,998,898.00 0.19%3137EADS5 FHLMC NOTES 2,000,000 0.875 10/14/16 3,743.06 2,002,145.66 2,007,456.00 8,118.06 2,001,847.38 2,011,206.00 0.19%
$9,000,000 $9,013.89 $8,996,043.78 $9,006,272.00 $14,013.89 $8,996,768.34 $9,017,970.00 0.13%
US TSY BOND/NOTE912828SC5 US TREASURY NOTES $1,595,000.00 0.875 1/31/2017 $5,840.39 $1,596,247.10 $1,599,611.15 $2,313.19 $1,596,100.02 $1,605,466.39 0.37%912828RU6 US TREASURY NOTES 1,500,000 0.875 11/30/2016 1,153.85 1,503,451.20 1,506,562.50 4,399.04 1,503,007.56 1,510,195.50 0.24%912828WP1 US TREASURY NOTES 1,510,000 0.009 6/15/2017 617.07 1,509,032.17 1,509,174.03 3,883.89 1,509,128.81 1,517,903.34 0.58%
$3,095,000 $7,611.31 $4,608,730.47 $4,615,347.68 $10,596.12 $4,608,236.39 $4,633,565.23 0.39%
TOTAL $12,095,000 $16,625.20 $13,604,774.25 $13,621,619.68 $24,610.01 $13,605,004.73 $13,651,535.23 0.220%
TOTAL PORTFOLIO $17,995,000 $16,625.20 $30,838,402.97 $30,856,220.01 $24,610.01 $32,503,566.08 $32,550,806.39 5.49%
PFM Asset Management LLC Section B - 3

City of Rowlett, Texas Investment Report - Quarter Ended March 31, 2015
Summary Portfolio Composition and Credit Quality Characteristics
Security Type1 March 31, 2015 % of Portfolio December 31, 2014 % of Portfolio
U.S. Treasuries $4,644,161.35 14.3% $4,622,958.99 4.4%
Federal Agencies 9,031,983.89 27.7% 9,015,285.89 49.1%
Commercial Paper 3,498,560.40 10.7% 5,895,463.70 0.0%
Certificates of Deposit 0.00 0.0% 0.00 0.0%
Bankers Acceptances 0.00 0.0% 0.00 0.0%
Repurchase Agreements 0.00 0.0% 0.00 0.0%
Municipal Obligations 0.00 0.0% 0.00 0.0%
Corporate Notes/Bonds 0.00 0.0% 0.00 0.0%
Mortgage Backed 0.00 0.00% 0.00 0.0%
TexPool 15,400,710.76 47.3% 11,339,136.63 46.5%
Totals $32,575,416.40 100.0% $30,872,845.21 100.0%
Notes:
1. End of quarter trade-date market values of portfolio holdings, including accrued interest.
2. Credit rating of securities held in portfolio, exclusive of money market fund/LGIP. Standard & Poor's is the source of the credit ratings.
U.S. Treasuries
14.26%
Federal Agency
Obligations27.73%
Commercial Paper
10.74%
TexPool47.28%
Portfolio Compositionas of 03/31/15
AA+41.98%
A-1+ (Short-term)3.68%
A-1 (Short-term)7.06%
TexPool47.28%
Credit Quality Distribution² as of 03/31/15
PFM Asset Management LLC Section B - 4
City of Rowlett, Texas Investment Report - Quarter Ended March 31, 2015
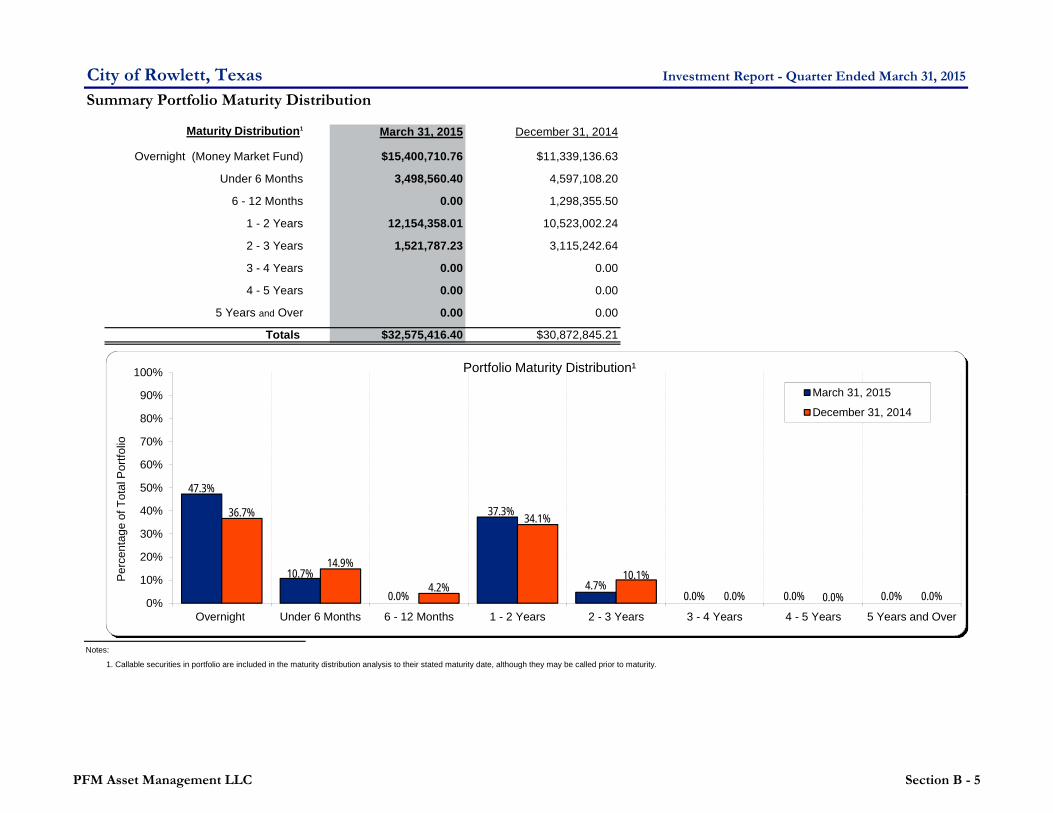
Summary Portfolio Maturity Distribution
Maturity Distribution1 March 31, 2015 December 31, 2014
Overnight (Money Market Fund) $15,400,710.76 $11,339,136.63
Under 6 Months 3,498,560.40 4,597,108.20
6 - 12 Months 0.00 1,298,355.50
1 - 2 Years 12,154,358.01 10,523,002.24
2 - 3 Years 1,521,787.23 3,115,242.64
3 - 4 Years 0.00 0.00
4 - 5 Years 0.00 0.00
5 Years and Over 0.00 0.00
Totals $32,575,416.40 $30,872,845.21
Notes:
1. Callable securities in portfolio are included in the maturity distribution analysis to their stated maturity date, although they may be called prior to maturity.
47.3%
10.7%
0.0%
37.3%
4.7%0.0% 0.0% 0.0%
36.7%
14.9%
4.2%
34.1%
10.1%
0.0% 0.0% 0.0%0%
10%
20%
30%
40%
50%
60%
70%
80%
90%
100%
Overnight Under 6 Months 6 - 12 Months 1 - 2 Years 2 - 3 Years 3 - 4 Years 4 - 5 Years 5 Years and Over
Per
cent
age
of T
otal
Por
tfolio
Portfolio Maturity Distribution¹
March 31, 2015
December 31, 2014
PFM Asset Management LLC Section B - 5
City of Rowlett, Texas Investment Report - Quarter Ended March 31, 2015
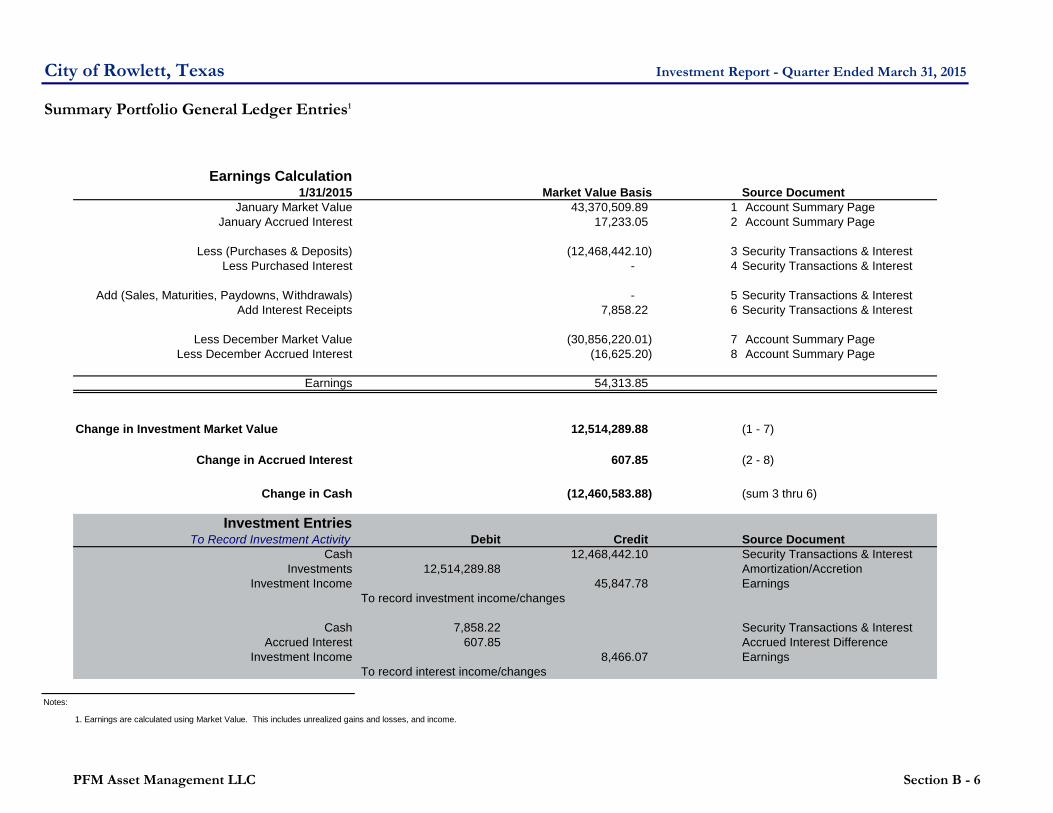
Summary Portfolio General Ledger Entries1
Earnings Calculation1/31/2015 Market Value Basis Source Document
January Market Value 43,370,509.89 1 Account Summary PageJanuary Accrued Interest 17,233.05 2 Account Summary Page
Less (Purchases & Deposits) (12,468,442.10) 3 Security Transactions & InterestLess Purchased Interest - 4 Security Transactions & Interest
Add (Sales, Maturities, Paydowns, Withdrawals) - 5 Security Transactions & InterestAdd Interest Receipts 7,858.22 6 Security Transactions & Interest
Less December Market Value (30,856,220.01) 7 Account Summary PageLess December Accrued Interest (16,625.20) 8 Account Summary Page
Earnings 54,313.85
Change in Investment Market Value 12,514,289.88 (1 - 7)
Change in Accrued Interest 607.85 (2 - 8)
Change in Cash (12,460,583.88) (sum 3 thru 6)
Investment EntriesTo Record Investment Activity Debit Credit Source Document
Cash 12,468,442.10 Security Transactions & InterestInvestments 12,514,289.88 Amortization/Accretion
Investment Income 45,847.78 EarningsTo record investment income/changes
Cash 7,858.22 Security Transactions & InterestAccrued Interest 607.85 Accrued Interest Difference
Investment Income 8,466.07 EarningsTo record interest income/changes
Notes:
1. Earnings are calculated using Market Value. This includes unrealized gains and losses, and income.
PFM Asset Management LLC Section B - 6

City of Rowlett, Texas Investment Report - Quarter Ended March 31, 2015
Summary Portfolio General Ledger Entries1
Earnings Calculation2/28/2015 Market Value Basis Source Document
February Market Value 34,540,652.79 1 Account Summary PageFebruary Accrued Interest 24,505.15 2 Account Summary Page
Less (Purchases & Deposits) (1,798,256.61) 3 Security Transactions & InterestLess Purchased Interest - 4 Security Transactions & Interest
Add (Sales, Maturities, Paydowns, Withdrawals) 10,603,781.99 5 Security Transactions & InterestAdd Interest Receipts 656.54 6 Security Transactions & Interest
Less January Market Value (43,371,389.98) 7 Account Summary PageLess January Accrued Interest (17,233.05) 8 Account Summary Page
Earnings (17,283.17)
Change in Investment Market Value -8,830,737.19 (1 - 7)
Change in Accrued Interest 7,272.10 (2 - 8)
Change in Cash 8,806,181.92 (sum 3 thru 6)
Investment EntriesTo Record Investment Activity Debit Credit Source Document
Cash 8,805,525.38 Security Transactions & InterestInvestments 8,830,737.19 Amortization/Accretion
Investment Income 25,211.81 EarningsTo record investment income/changes
Cash 656.54 Security Transactions & InterestAccrued Interest 7,272.10 Accrued Interest Difference
Investment Income 7,928.64 EarningsTo record interest income/changes
Notes:
1. Earnings are calculated using Market Value. This includes unrealized gains and losses, and income.
PFM Asset Management LLC Section B - 7

City of Rowlett, Texas Investment Report - Quarter Ended March 31, 2015
Summary Portfolio General Ledger Entries1
Earnings Calculation3/31/2015 Market Value Basis Source Document
March Market Value 32,550,184.30 1 Account Summary PageMarch Accrued Interest 24,610.01 2 Account Summary Page
Less (Purchases & Deposits) (396,498.69) 3 Security Transactions & InterestLess Purchased Interest - 4 Security Transactions & Interest
Add (Sales, Maturities, Paydowns, Withdrawals) 2,400,000.00 5 Security Transactions & InterestAdd Interest Receipts 8,122.09 6 Security Transactions & Interest
Less February Market Value (34,541,309.33) 7 Account Summary PageLess February Accrued Interest (24,505.15) 8 Account Summary Page
Earnings 20,603.23
Change in Investment Market Value (1,991,125.03) (1 - 7)
Change in Accrued Interest 104.86 (2 - 8)
Change in Cash 2,011,623.40 (sum 3 thru 6)
Investment EntriesTo Record Investment Activity Debit Credit Source Document
Cash 2,003,501.31 Security Transactions & InterestInvestments 1,991,125.03 Amortization/Accretion
Investment Income 12,376.28 EarningsTo record investment income/changes
Cash 8,122.09 Security Transactions & InterestAccrued Interest 104.86 Accrued Interest Difference
Investment Income 8,226.95 EarningsTo record interest income/changes
Notes:
1. Earnings are calculated using Market Value. This includes unrealized gains and losses, and income.
PFM Asset Management LLC Section B - 8
City of Rowlett, Texas Investment Report - Quarter Ended March 31, 2015
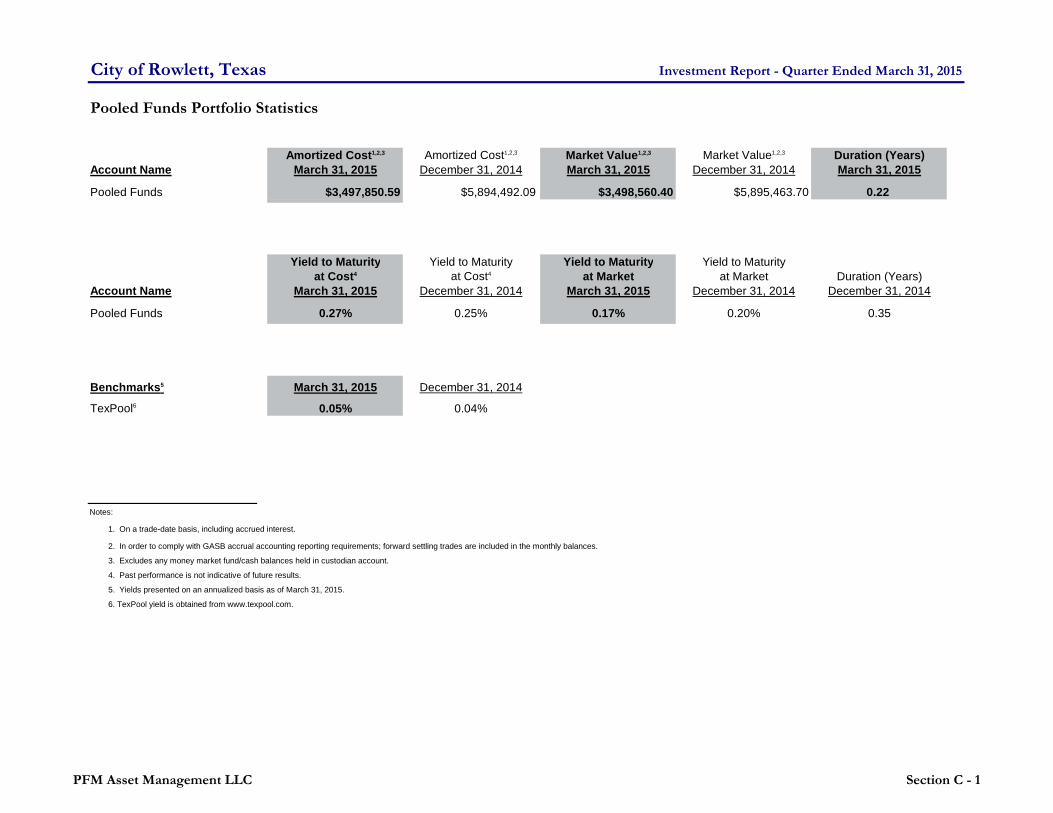
Pooled Funds Portfolio Statistics
Amortized Cost1,2,3 Amortized Cost1,2,3 Market Value1,2,3 Market Value1,2,3 Duration (Years)Account Name March 31, 2015 December 31, 2014 March 31, 2015 December 31, 2014 March 31, 2015
Pooled Funds $3,497,850.59 $5,894,492.09 $3,498,560.40 $5,895,463.70 0.22
Yield to Maturity Yield to Maturity Yield to Maturity Yield to Maturityat Cost4 at Cost4 at Market at Market Duration (Years)
Account Name March 31, 2015 December 31, 2014 March 31, 2015 December 31, 2014 December 31, 2014
Pooled Funds 0.27% 0.25% 0.17% 0.20% 0.35
Benchmarks5 March 31, 2015 December 31, 2014
TexPool6 0.05% 0.04%
Notes:
1. On a trade-date basis, including accrued interest.
2. In order to comply with GASB accrual accounting reporting requirements; forward settling trades are included in the monthly balances.
3. Excludes any money market fund/cash balances held in custodian account.
4. Past performance is not indicative of future results.
5. Yields presented on an annualized basis as of March 31, 2015.
6. TexPool yield is obtained from www.texpool.com.
PFM Asset Management LLC Section C - 1
City of Rowlett, Texas Investment Report - Quarter Ended March 31, 2015
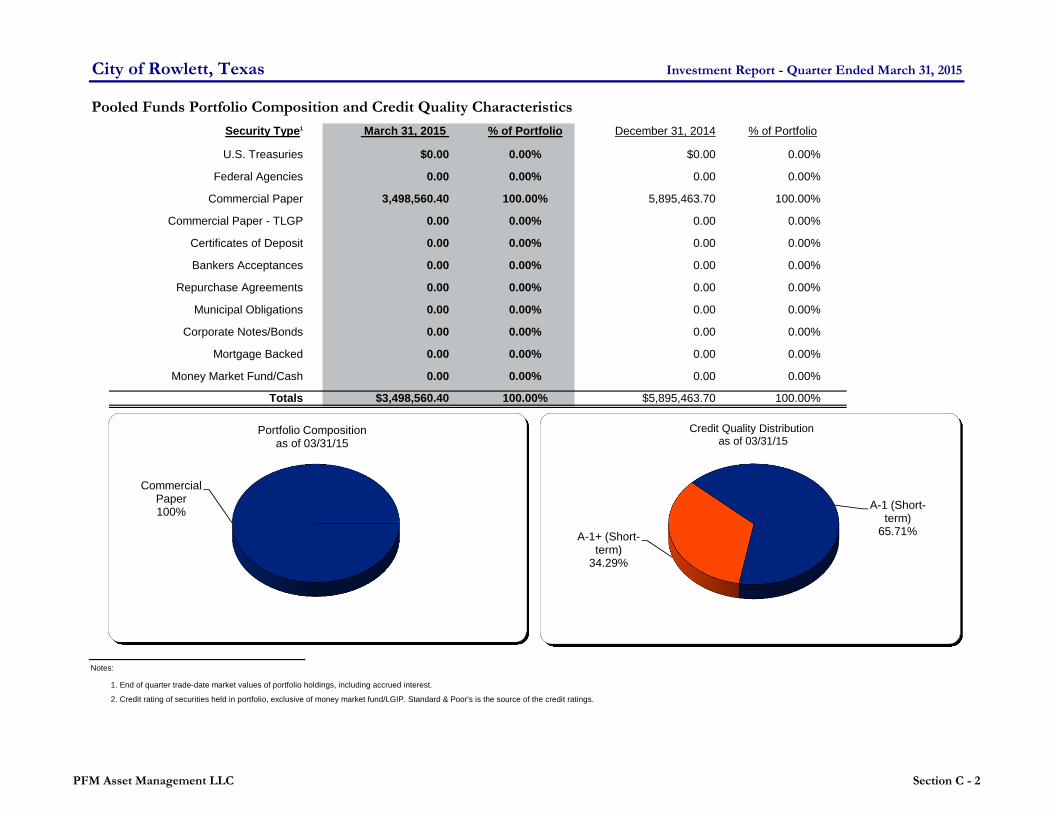
Pooled Funds Portfolio Composition and Credit Quality Characteristics
Security Type1 March 31, 2015 % of Portfolio December 31, 2014 % of Portfolio Permitted by Policy
U.S. Treasuries $0.00 0.00% $0.00 0.00% 100%
Federal Agencies 0.00 0.00% 0.00 0.00% 100%
Commercial Paper 3,498,560.40 100.00% 5,895,463.70 100.00% 15% / 30%
Commercial Paper - TLGP 0.00 0.00% 0.00 0.00%
Certificates of Deposit 0.00 0.00% 0.00 0.00% 30%
Bankers Acceptances 0.00 0.00% 0.00 0.00% 40%
Repurchase Agreements 0.00 0.00% 0.00 0.00% 100%
Municipal Obligations 0.00 0.00% 0.00 0.00% 100%
Corporate Notes/Bonds 0.00 0.00% 0.00 0.00% 30%
Mortgage Backed 0.00 0.00% 0.00 0.00% 20%
Money Market Fund/Cash 0.00 0.00% 0.00 0.00% 20% / $30 Million
Totals $3,498,560.40 100.00% $5,895,463.70 100.00%
Notes:
1. End of quarter trade-date market values of portfolio holdings, including accrued interest.
2. Credit rating of securities held in portfolio, exclusive of money market fund/LGIP. Standard & Poor's is the source of the credit ratings.
Commercial Paper100%
Portfolio Composition as of 03/31/15
A-1+ (Short-term)
34.29%
A-1 (Short-term)
65.71%
Credit Quality Distributionas of 03/31/15
PFM Asset Management LLC Section C - 2
City of Rowlett, Texas Investment Report - Quarter Ended March 31, 2015
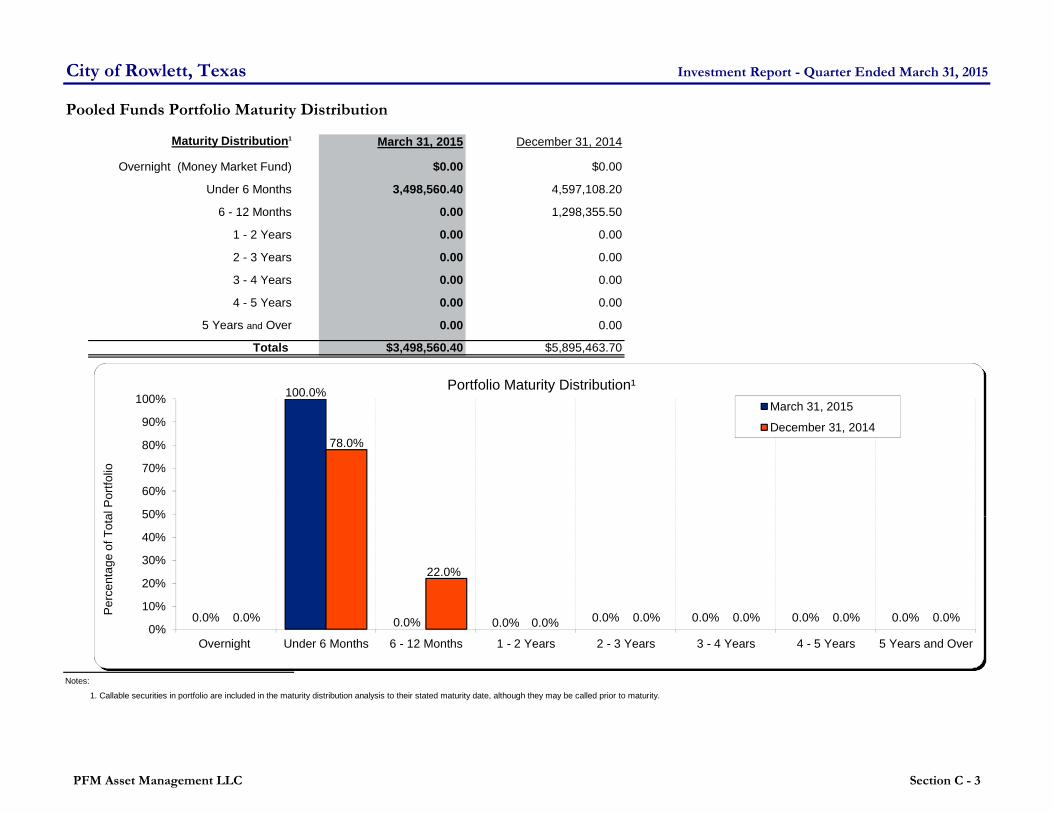
Pooled Funds Portfolio Maturity Distribution
Maturity Distribution1 March 31, 2015 December 31, 2014
Overnight (Money Market Fund) $0.00 $0.00
Under 6 Months 3,498,560.40 4,597,108.20
6 - 12 Months 0.00 1,298,355.50
1 - 2 Years 0.00 0.00
2 - 3 Years 0.00 0.00
3 - 4 Years 0.00 0.00
4 - 5 Years 0.00 0.00
5 Years and Over 0.00 0.00
Totals $3,498,560.40 $5,895,463.70
Notes:
1. Callable securities in portfolio are included in the maturity distribution analysis to their stated maturity date, although they may be called prior to maturity.
0.0%
100.0%
0.0% 0.0% 0.0% 0.0% 0.0% 0.0%0.0%
78.0%
22.0%
0.0% 0.0% 0.0% 0.0% 0.0%0%
10%
20%
30%
40%
50%
60%
70%
80%
90%
100%
Overnight Under 6 Months 6 - 12 Months 1 - 2 Years 2 - 3 Years 3 - 4 Years 4 - 5 Years 5 Years and Over
Per
cent
age
of T
otal
Por
tfolio
Portfolio Maturity Distribution¹March 31, 2015
December 31, 2014
PFM Asset Management LLC Section C - 3

City of Rowlett, Texas Investment Report - Quarter Ended March 31, 2015
Long Term Pooled Fund Portfolio Performance
Total Portfolio Value1 March 31, 2015 December 31, 2014Market Value $13,676,145.24 $13,638,244.88Amortized Cost $13,629,614.74 $13,621,399.45
Quarterly Return Last Last Last Last Since InceptionTotal Return2,3,4,5 March 31, 2015 12 Months 2 Years 5 Years 7 Years June 30, 2006Long Term Pooled Fund 0.38% 0.89% 0.65% 0.94% 1.50% 2.59%Merrill Lynch 1-3 Year U.S. Treasury Note Index 0.52% 1.00% 0.69% 1.02% 1.44% 2.65%
Effective Duration(Years)4,5 March 31, 2015 December 31, 2014 Yields March 31, 2015 December 31, 2014Long Term Pooled Fund 1.43 1.67 Yield at Market 0.45% 0.60%Merrill Lynch 1-3 Year U.S. Treasury Note Index 1.79 1.82 Yield at Cost 0.67% 0.67%Portfolio Duration % of Benchmark Duration 80% 92%
Notes:
1. In order to comply with GASB accrual accounting reporting requirements; forward settling trades are included in the monthly balances. End of quarter trade-date market values of portfolio holdings, including accrued interest.
4. Merrill Lynch Indices provided by Bloomberg Financial Markets.
5. Excludes money market fund/cash in performance and duration computations.
2. Performance on trade date basis, gross (i.e., before fees), is in accordance with The CFA Institute’s Global Investment Performance Standards (GIPS). Quarterly returns are presented on an unannualized basis. Returns presented for 12 months or longer are presented on an annual basis. Past performance is not indicative of future results.
3. Since Inception the benchmark has been the Merrill Lynch 1-3 Year U.S. Treasury Note.
0.38%
0.52%
0.00%
0.25%
0.50%
0.75%
1.00 1.50 2.00 2.50
Ret
urn
Effective Duration (Years)
Quarter Total Return Comparison Quarter Ended March 31, 2015
ML 1-3 Year U.S. Treasury Note Index
Long Term Pooled
2.59% 2.65%
2.00%
2.50%
3.00%
3.50%
1.00 1.50 2.00 2.50
Ret
urn
Effective Duration (Years)
Since Inception Total Return Comparison Quarter Ended March 31, 2015
ML 1-3 Year U.S. Treasury Note IndexLong Term Pooled
PFM Asset Management LLC Section D - 1
City of Rowlett, Texas Investment Report - Quarter Ended March 31, 2015
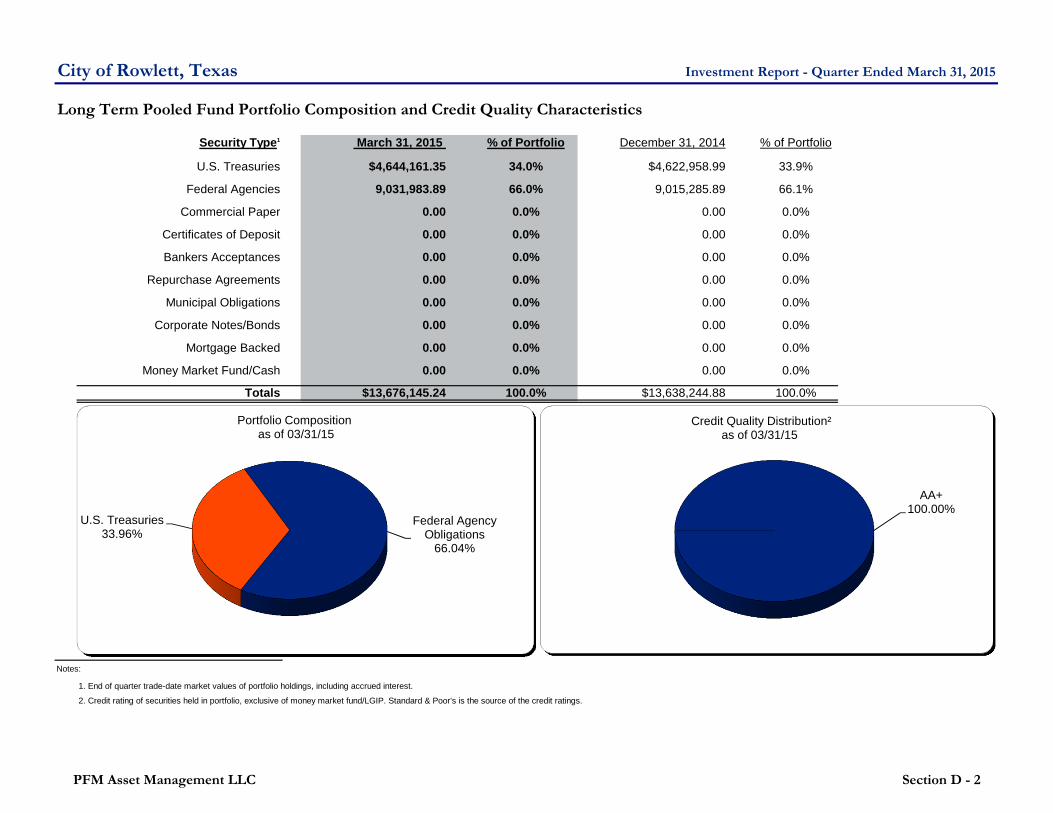
Long Term Pooled Fund Portfolio Composition and Credit Quality Characteristics
Security Type1 March 31, 2015 % of Portfolio December 31, 2014 % of Portfolio
U.S. Treasuries $4,644,161.35 34.0% $4,622,958.99 33.9%
Federal Agencies 9,031,983.89 66.0% 9,015,285.89 66.1%
Commercial Paper 0.00 0.0% 0.00 0.0%
Certificates of Deposit 0.00 0.0% 0.00 0.0%
Bankers Acceptances 0.00 0.0% 0.00 0.0%
Repurchase Agreements 0.00 0.0% 0.00 0.0%
Municipal Obligations 0.00 0.0% 0.00 0.0%
Corporate Notes/Bonds 0.00 0.0% 0.00 0.0%
Mortgage Backed 0.00 0.0% 0.00 0.0%
Money Market Fund/Cash 0.00 0.0% 0.00 0.0%
Totals $13,676,145.24 100.0% $13,638,244.88 100.0%
Notes:
1. End of quarter trade-date market values of portfolio holdings, including accrued interest.
2. Credit rating of securities held in portfolio, exclusive of money market fund/LGIP. Standard & Poor's is the source of the credit ratings.
U.S. Treasuries33.96%
Federal Agency Obligations
66.04%
Portfolio Compositionas of 03/31/15
AA+100.00%
Credit Quality Distribution² as of 03/31/15
PFM Asset Management LLC Section D - 2
City of Rowlett, Texas Investment Report - Quarter Ended March 31, 2015
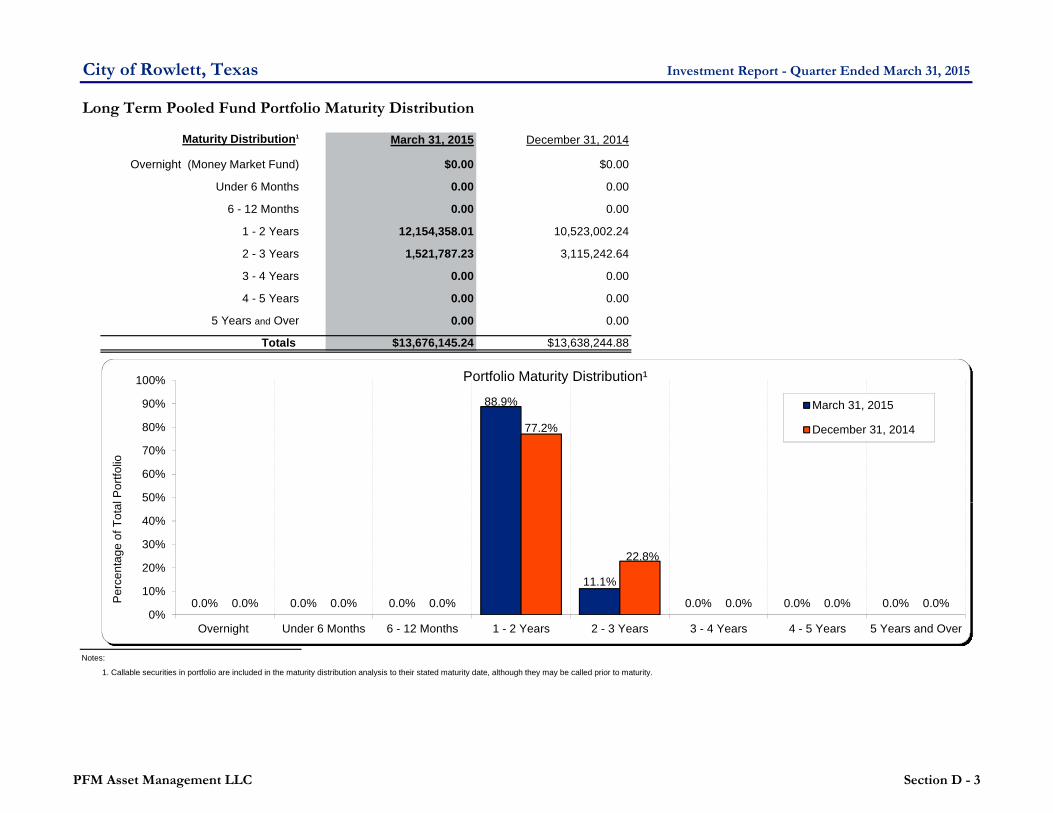
Long Term Pooled Fund Portfolio Maturity Distribution
Maturity Distribution1 March 31, 2015 December 31, 2014
Overnight (Money Market Fund) $0.00 $0.00
Under 6 Months 0.00 0.00
6 - 12 Months 0.00 0.00
1 - 2 Years 12,154,358.01 10,523,002.24
2 - 3 Years 1,521,787.23 3,115,242.64
3 - 4 Years 0.00 0.00
4 - 5 Years 0.00 0.00
5 Years and Over 0.00 0.00
Totals $13,676,145.24 $13,638,244.88
Notes:
1. Callable securities in portfolio are included in the maturity distribution analysis to their stated maturity date, although they may be called prior to maturity.
0.0% 0.0% 0.0%
88.9%
11.1%
0.0% 0.0% 0.0%0.0% 0.0% 0.0%
77.2%
22.8%
0.0% 0.0% 0.0%0%
10%
20%
30%
40%
50%
60%
70%
80%
90%
100%
Overnight Under 6 Months 6 - 12 Months 1 - 2 Years 2 - 3 Years 3 - 4 Years 4 - 5 Years 5 Years and Over
Per
cent
age
of T
otal
Por
tfolio
Portfolio Maturity Distribution¹
March 31, 2015
December 31, 2014
PFM Asset Management LLC Section D - 3
City of Rowlett, Texas Investment Report - Quarter Ended March 31, 2015
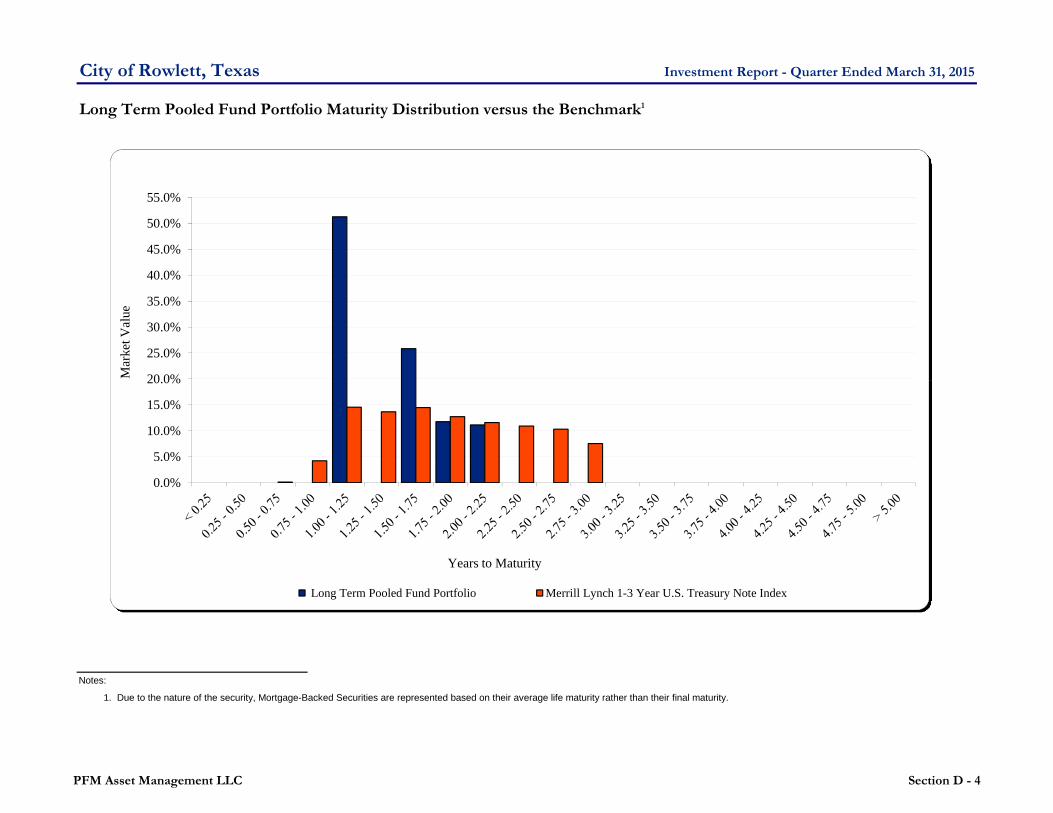
Long Term Pooled Fund Portfolio Maturity Distribution versus the Benchmark1
Notes:
1. Due to the nature of the security, Mortgage-Backed Securities are represented based on their average life maturity rather than their final maturity.
0.0%
5.0%
10.0%
15.0%
20.0%
25.0%
30.0%
35.0%
40.0%
45.0%
50.0%
55.0%
Mar
ket V
alue
Years to Maturity
Long Term Pooled Fund Portfolio Merrill Lynch 1-3 Year U.S. Treasury Note Index
PFM Asset Management LLC Section D - 4

City of Rowlett, Texas Asset Allocation as of March 31, 2015*
Security Type1Amortized Cost
(Includes Interest)Allocation
Percentage NotesPermitted by Policy
In Compliance
TexStar - Local Government Investment Pool - 0.00% 100% YESTexPool - Local Government Investment Pool 15,400,710.76 47.35% 100% YESUnited States Treasury Securities 4,618,832.51 14.20% 100% YESUnited States Government Agency Securities - 0.00% 100% YESFederal Instrumentalities 9,010,782.23 27.70% 2 100% YESMortgage-Backed Securities - 0.00% 2,3 20% YESCertificates of Deposit - 0.00% 20% YESRepurchase Agreements - 0.00% 20% YESCommercial Paper 3,497,850.59 10.75% 25% YESCorporate Notes TLGP - FDIC Insured - 0.00% 50% YESBankers' Acceptances - 0.00% 25% YESState and/or Local Government Debt - 0.00% 25% YESFixed Income Money Market Mutual Funds - 0.00% 50% YESNotes:1. End of month trade-date amortized cost of portfolio holdings, including accrued interest. 2. The combined total of Federal Instrumentalities and Mortgage Backed Securities can not be more than 100%. The combined total as of March 31, 2015 is 27.70%.
© PFM Asset Management LLC E-1
3. The Investment Policy does allow for Government and Federal Agency mortgage backed securities (MBS'). Which is limited to GNMA, FHLMC, and FNMA mortgage backed securities. GNMA securities have the full faith and credit of the United States Treasury. As of September 6, 2008, FHLMC and FNMA have been under conservatorship with the United States Treasury. PFM has imposed an internal maximum allocation limit of 20% in MBS'. PFM will notify the City prior to adding MBS' to the portfolio.purchase. PFM purchased a Toyota Commercial Paper on March 7, 2014. We confirmed with the City the current balance at TexPool was $18.8 million. This was enough to purchase the Toyota Commercial Paper in compliance with the Investment Policy. The TexPool balance dropped down to $17.2 million by the end of March. This pushed the Toyota Commercial Paper over the permitted limit.
TexPool ‐ Local Government
Investment Pool50.14%
United States Treasury Securities14.20%
Federal Instrumentalities
27.70%
Commercial Paper 10.75%
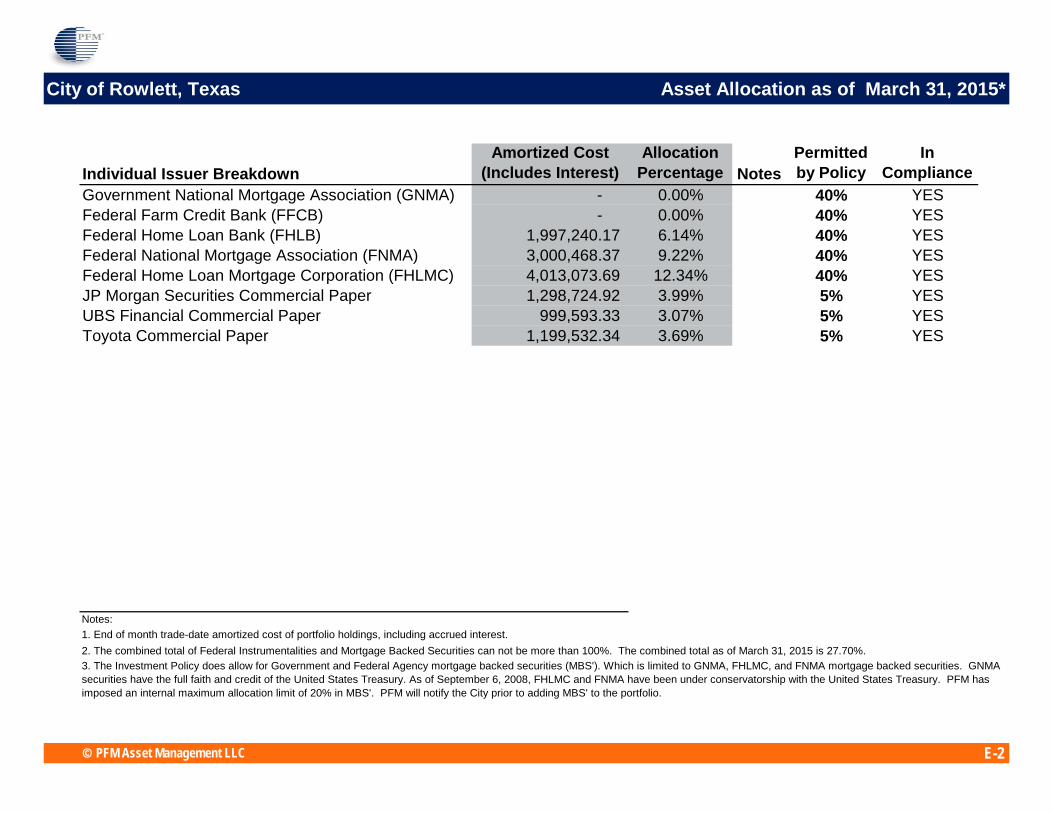
City of Rowlett, Texas Asset Allocation as of March 31, 2015*
Individual Issuer BreakdownAmortized Cost
(Includes Interest)Allocation
Percentage NotesPermitted by Policy
In Compliance
Government National Mortgage Association (GNMA) - 0.00% 40% YESFederal Farm Credit Bank (FFCB) - 0.00% 40% YESFederal Home Loan Bank (FHLB) 1,997,240.17 6.14% 40% YESFederal National Mortgage Association (FNMA) 3,000,468.37 9.22% 40% YESFederal Home Loan Mortgage Corporation (FHLMC) 4,013,073.69 12.34% 40% YESJP Morgan Securities Commercial Paper 1,298,724.92 3.99% 5% YESUBS Financial Commercial Paper 999,593.33 3.07% 5% YESToyota Commercial Paper 1,199,532.34 3.69% 5% YES
Notes:1. End of month trade-date amortized cost of portfolio holdings, including accrued interest. 2. The combined total of Federal Instrumentalities and Mortgage Backed Securities can not be more than 100%. The combined total as of March 31, 2015 is 27.70%.
© PFM Asset Management LLC E-2
3. The Investment Policy does allow for Government and Federal Agency mortgage backed securities (MBS'). Which is limited to GNMA, FHLMC, and FNMA mortgage backed securities. GNMA securities have the full faith and credit of the United States Treasury. As of September 6, 2008, FHLMC and FNMA have been under conservatorship with the United States Treasury. PFM has imposed an internal maximum allocation limit of 20% in MBS'. PFM will notify the City prior to adding MBS' to the portfolio.
City of Rowlett, Texas Investment Report - Quarter Ended March 31, 2015
Investment Officer's Certification
Alan Guard, Chief Financial Officer
Wendy Badgett, Assistant Finance Director
This report is prepared for City of Rowlett (the “City”) in accordance with Chapter 2256 of the Public FundsInvestment Act (“PFIA”). Section 2256.023(a) of the PFIA states that “Not less than quarterly, the investmentofficer shall prepare and submit to the governing body of the entity a written report of the investment transactionsfor all funds covered by this chapter for the preceding reporting period.” This report which coversthe month ended March 31, 2015, is signed by the City’s investment officers and includes the disclosuresrequired in the PFIA.
The investment portfolio complied with the PFIA and the City’s approved Investment Policy and Strategythroughout the month. All investment transactions made in the City’s portfolio during this month were made onbehalf of the City and were made in full compliance with the PFIA and the City’s approved Investment Policy.
PFM Asset Management LLC Section F - 1
City of Rowlett, Texas Investment Report - Quarter Ended March 31, 2015
TAB III

City of Rowlett, Texas Investment Report - Quarter Ended March 31, 2015
Insert Month End Statement here to complete the report.
In consideration of the safety and security of our client’ssensitive information, PFM Asset Management’scompliance department does not allow the inclusion ofmonth end statements in any electronic communicationincluding this version of the quarterly performance report.
Statements are available online at www.pfm.com loginand click on the link to “Monthly Statements” on the leftside of the screen.
The most current statements are always available to theclient online, however they can only be accessed with thedesignated username and password.
City of Rowlett, Texas Investment Report - Quarter Ended March 31, 2015
TAB IV