city of sacramento/media/corporate/files/dou/... · dan sherry – cip water engineering brett...
TRANSCRIPT

CITY OF SACRAMENTO CAPITAL IMPROVEMENT PROGRAMMING GUIDE
Elected Officials
KEVIN JOHNSON Mayor
ANGELIQUE ASHBY
Council District 1
SANDY SHEEDY Council District 2
STEVE COHN
Council District 3
ROBERT KING FONG Council District 4
JAY SCHENIRER Council District 5
KEVIN McCARTY Council District 6
DARRELL FONG Council District 7
BONNIE PANNELL
Council District 8
City Manager’s Office
JOHN F. SHIREY City Manager
JOHN DANGBERG
Assistant City Manager
Department of Utilities
DAVE BRENT Director
Technical Working Group
BILL BUSATH – Interim Engineering Services Manager BILL EDGAR - Consultant
RICK MATSUO – Asset Management DAN SHERRY – CIP Water Engineering
BRETT GRANT – CIP Wastewater & Drainage Engineering

TABLE OF CONTENTS Section I: Introduction ...................................................................................................................... 4
A. Department Overview .......................................................................................................... 5
B. Department Services ............................................................................................................ 6
B.1 Water Utility ............................................................................................................... 6
B.2 Wastewater Utility ...................................................................................................... 7
B.3 Storm Drainage Utility ................................................................................................ 7
C. Department Structure and Functions .................................................................................... 8
Section II: Approach and Methodology ......................................................................................... 10
A. Asset Management Approach ............................................................................................. 10
B. Capital Improvement Program Drivers ............................................................................... 11
B.1 Design Life / Best Replacement Practices ................................................................. 11
B.2 Regulatory / Legislation Compliance ........................................................................ 12
B.3 System Improvement ................................................................................................ 14
C. 30, 5, & 3-Year Strategy .................................................................................................... 15
D. Research and Development ................................................................................................ 16
E. Funding .............................................................................................................................. 17
E.1 Funding Strategy ....................................................................................................... 17
E.2 Funding Sources ....................................................................................................... 19
Section III: Asset Ranking and Prioritization ............................................................................... 22
A. Major Asset Type By Utility ............................................................................................... 22
B. Capital Project Categories .................................................................................................. 22
C. Asset Scoring, Ranking, and Prioritization ......................................................................... 22
C.1 Water Utility ............................................................................................................. 27
C.2 Wastewater Utility .................................................................................................... 31
C.3 Storm Drainage Utility .............................................................................................. 45
Section IV: Implications/Future Direction .................................................................................... 41
A. Department Services .......................................................................................................... 42
Section V: Financial Plan / Rates ................................................................................................... 46
A. Financial Policies ................................................................................................................ 46
B. Revenue Requirements ........................................................................................................ 48
C. Conclusions ........................................................................................................................ 53

Appendix A: Water ............................................................................................................................
A.1 30-year Capital Investment Plan .............................................................................................
A.2 5-year Capital Improvement Program .....................................................................................
Project Profiles .......................................................................................................................
A.3 Project Priority Lists ..............................................................................................................
Appendix B: Wastewater ...................................................................................................................
B.1 30-year Capital Investment Plan .............................................................................................
B.2 5-year Capital Improvement Program .....................................................................................
Project Profiles .......................................................................................................................
B.3 Project Priority Lists ..............................................................................................................
Appendix C: Storm Drainage ............................................................................................................
C.1 30-year Capital Investment Plan .............................................................................................
C.2 5-year Capital Improvement Program .....................................................................................
Project Profiles .......................................................................................................................
C.3 Project Priority Lists ..............................................................................................................
Appendix D: Documents Incorporated By Reference ......................................................................
D.1 Utility Rate Study – FCS Group .............................................................................................
D.2 Sacramento River and E.A. Fairbairn Water Treatment Plant Capacity Optimization, Remaining Life, and Reliability Improvement Study – Carollo Engineers .............................
D.3 Water Infrastructure Condition Assessment & Criticality Methodology Project: Review Water Meter Retrofit Program – CH2MHILL ........................................................................
D.4 Pipe Assessment and Certification Program - National Association of Sewer Service Companies (NASSCO) ...........................................................................................................
D.5 Hydraulic Capacity Testing of Cast Iron Water Mains – DOU Engineering ...........................
D.6 CIP Prioritization System – DOU Engineering .......................................................................
D.7 Asset Management: Criticality Assessment – CH2MHILL ...................................................
D.8 Leveraging GIS to Forecast Infrastructure Capital Funding Needs – Brown and Caldwell ....
D.9 Integrated Technology Master Plan ........................................................................................
SECTION I: INTRODUCTION The purpose of this guide is to explain the processes, methodologies and funding sources used in developing the Capital Improvement Programs (CIP) for the Department of Utilities’ (DOU) water, wastewater, and storm drainage utilities. This document provides an overview of the water, wastewater, and storm drainage utilities operations and functions; explanations of the criteria used to rank projects; descriptions of the various types of capital improvement projects; project rankings for each utility; and project profiles for planned capital projects. Finally, this Guide presents both a long-term and short-term investment strategy (30-year – 5-year – 3-year strategy) for incrementally improving the utility infrastructure of the City. This Capital Improvement Programming Guide is built on the foundation of the City of Sacramento’s Department of Utilities’ efforts dating back several years and is documented in succeeding sections. The Programming Guide is supported by data, analyses, and findings from other previously prepared reports such as:
1. Utility Rate Study, dated May 2012, completed by the FCS Group.
2. Condition Assessment of the SRWTP and the EAFTP, dated February 2009, completed by Carollo Engineers.
3. Water Infrastructure Condition Assessment & Criticality Methodology Project: Review Water Meter Retrofit Program, dated May 2012, completed by CH2MHILL.
4. Pipe Assessment and Certification Program - National Association of Sewer Service Companies (NASSCO).
5. Hydraulic Capacity Testing of Cast Iron Water Mains completed by DOU Engineering.
6. CIP Prioritization System – DOU Engineering. 7. Asset Management Criticality Assessment,
dated May 2005, completed by CH2MHILL. 8. Leveraging GIS to Forecast Infrastructure Capital Funding Needs, dated 2004, completed by
Brown and Caldwell. 9. Integrated Technology Master Plan, completed by Westin, dated 2005.
These documents have been incorporated by reference in this Capital Improvement Programming Guide. CIPs are projects undertaken by DOU that are generally not recurring and result in the rehabilitation, and/or improvement of existing capital assets or the construction or acquisition of new capital assets. Utility managers have a "stewardship" duty to maintain capital assets under their control. In developing its multi-year CIPs for each utility, DOU assesses the condition of assets and the effect, or consequences of asset failure. As described within this document, DOU has established capital planning processes through its asset management program for assessing condition of asset and infrastructure needs. In doing so, DOU reviews areas such as:
DEPARTMENT OF UTILITIES
MISSION
To provide high quality, cost effective, reliable water, wastewater, and drainage services in an environmentally sustainable manner.
VISION
To be recognized as a leader in the utility industry
VALUES
Dedication Ethical Behavior Financial Responsibility Public Safety Diversity Environmental Stewardship

What is the current state of the utility’s assets? What are the required sustained levels of service? Which assets are critical to sustained performance? What are the utility’s best “minimum life-cycle-cost” CIP and O&M strategies? What is the utility’s best long-term financing strategy? Moreover, DOU’s philosophy focuses on the benefits of investment, as well as its costs, and takes a comprehensive view of the entire portfolio of infrastructure resources. Objective, fact-based tools and techniques are systematically applied to determine how best to deploy available resources in order to manage the inevitable trade-off between delivering agreed services sustainably at an acceptable level of risk and cost, increasing system demands, aging infrastructure, and limited resources. Overall, this document provides information on DOU’s approach to managing the City’s utility related capital assets with the goal of minimizing the total cost of owning and operating the systems over time, while also delivering the desired levels of service.
A. DEPARTMENT OVERVIEW DOU provides and maintains water, wastewater, and storm drainage services and facilities. These services and facilities are provided for its customers, the ratepayers of the City of Sacramento (City), and are in place to safeguard the health and safety of the public, protect the environment, contribute to economic development, and improve the quality of life in the City. DOU works in conjunction with other City departments, Sacramento County, regional, state and federal agencies in the operation, maintenance, rehabilitation and improvement of the City’s utility infrastructure. These include developing long-range financing plan to evaluate funding alternatives for forecasted development, improvements and replacement for water, wastewater, and storm drainage systems. The major service areas of DOU include:
Water – DOU water system provides high quality, reliable drinking water. Wastewater – The wastewater utility operates and maintains the City’s wastewater collection system
that transports wastewater to Sacramento Regional County Sanitation District. Storm Drainage – Through this service, DOU provides maintenance and operation of the storm
drainage system, including storm drains, detention basins, pipes, pumps, canals and levees. This service also includes working with regional partners to ensure the safety of residents during a flood.
Customer Service – DOU assists customers with service requests, reporting problems and taking payments by telephone, mail or online.
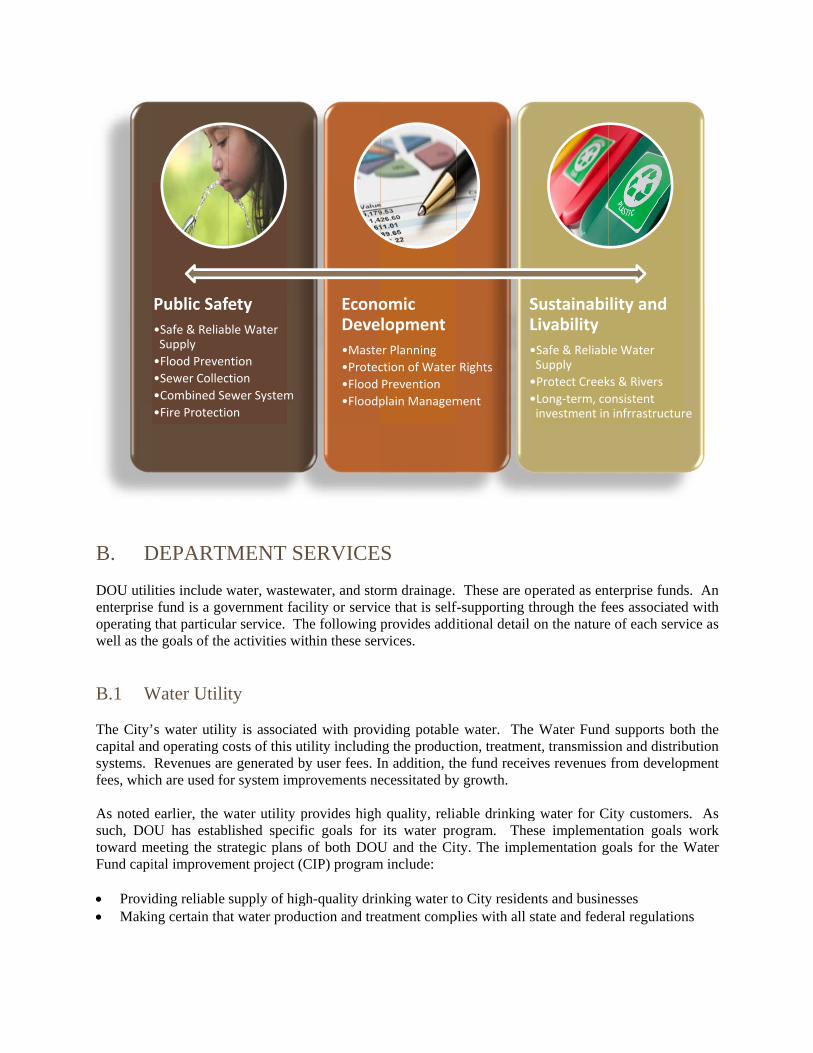
In providing its services, DOU follows core values that include public safety, economic development, and sustainability and livability.
B. D
DOU utilienterpriseoperating well as th
B.1 W The City’capital ansystems. fees, whic As noted such, DOtoward mFund capi Provi Makin
DEPARTM
ities include we fund is a go
that particulae goals of the
Water Utilit
’s water utilitd operating cRevenues are
ch are used fo
earlier, the wOU has estabmeeting the str
ital improvem
ding reliable ng certain tha
Public Saf
•Safe & ReliabSupply
•Flood Preven
•Sewer Collec
•Combined Se
•Fire Protectio
MENT SE
water, wastewvernment facar service. The activities wi
ty
ty is associateosts of this ute generated bor system imp
water utility plished specifrategic plans
ment project (C
supply of higat water produ
fety
ble Water
ntion
ction
ewer System
on
ERVICE
water, and stocility or serviche following ithin these ser
ed with provtility includin
by user fees. Iprovements ne
provides highfic goals for
of both DOUCIP) program
gh-quality drinuction and tre
EconoDeve
•Maste
•Protec
•Flood
•Floodp
S
orm drainage. ce that is selfprovides addirvices.
iding potableng the productIn addition, thecessitated by
h quality, reliaits water pro
U and the Citm include:
nking water toeatment comp
omic lopment
er Planning
ction of Water
Prevention
plain Managem
These are opf-supporting titional detail
e water. Thetion, treatmenhe fund receivy growth.
able drinkingogram. Thety. The imple
o City residenplies with all s
Rights
ment
SL
•
•
•
perated as enthrough the feon the nature
e Water Fundnt, transmissives revenues
g water for Cese implemenementation g
nts and businstate and fede
SustainabiLivability
•Safe & ReliabSupply
•Protect Creek
•Long‐term, coinvestment in
nterprise fundsees associatede of each serv
d supports boon and distribfrom develop
City customersntation goals goals for the W
esses eral regulation
lity and
le Water
ks & Rivers
onsistent n infrrastructur
s. An d with vice as
th the bution pment
s. As work
Water
ns
re
Ensuring that expansion of water treatment plant capacity, storage and distribution systems meets present/future needs and conforms to City’s General Plan
Upgrading or replacing existing water treatment, storage and distribution systems in conformance with water system master plans
Increasing reliability and reducing maintenance costs by upgrading or replacing inadequate or deteriorated systems
B.2 Wastewater Utility The City’s wastewater utility provides for the maintenance and the repair and replacement of facilities for collecting, conveying and pumping sanitary and combined wastewater to the wastewater interceptor of the Sacramento Regional County Sanitation District. User fees finance both operating costs and capital improvements to the existing system. A combined wastewater system impact fee funds development related improvements to the combined system. Similar to the water utility, DOU has established specific goals for its wastewater program. These implementation goals work toward meeting the strategic plans of both DOU and the City. The implementation goals for the Wastewater Fund CIP program include: Providing safe, reliable collection and conveyance of wastewater Making certain that wastewater collection and conveyance systems comply with all state/federal
regulations Ensuring that expansion and extension of wastewater collection and pumping systems conform to the
City’s General Plan Upgrading or replacing existing wastewater collection and pumping systems in conformance with
wastewater system master plans Increasing reliability and reducing maintenance costs by upgrading or replacing inadequate or
deteriorating systems
B.3 Storm Drainage Utility The City’s storm drainage utility provides for the operations, maintenance, repair, and rehabilitation of the storm drainage system, which consists of a collection system and drainage pump stations, ditches, channels, and secondary levees. These activities are primarily funded by drainage fees from property owners and developers within the City. The State Constitution (Proposition 218) now requires that drainage fee rate adjustments receive property owner approval by a mail-in ballot process conducted by the City. In this regard, the City is now conducting a storm drainage rate study and will be making recommendations to the City Council regarding rate adjustments for storm drainage fees at a later date. As with the other “wet fund” utilities, DOU has established specific goals for its drainage program. These implementation goals work toward meeting the strategic plans of both DOU and the City. The implementation goals for the Storm Drainage Fund CIP program include: Providing safe, reliable collection and conveyance of stormwater runoff. Making certain that the storm drainage collection system comply with all state and federal
regulations.

EnsurGener
Upgrastorm
C. D DOU is goperating of busines
Business The “Busservice ar
A D M M
Engineer The “Engservices u
Ef
ring that exparal Plan ading or repla
m drainage ma
DEPARTM
generally strudivisions (or
ss services, fi
s Services
iness Servicere to:
Assist divisionDevelop enterMaintain timeMaintain time
ring Service
gineering Servunits, and ensu
ffectively and
•Complianc•Develop anProjects
•Fiscal Sup•Budget
ansion of sto
acing existingaster plans.
MENT S
uctured to pror functional areld services,
Fig
es” division p
ns with delivrprise fund raely and accurely customer
es
vices” divisioures complian
d efficiently m
cend Deliver
pport
rm drainage
g storm draina
TRUCTU
ovide servicereas) related tengineering s
gure 1: Inte
provides fisca
very of servicates and longate customercall wait tim
on provides nce with state
manage capit
BusineServic
EngineeriServic
collection an
age collection
URE AND
es based on mto DOU’s “wservices, and p
ernal Funct
al support and
ces within app-term financi
r billing. mes.
engineering se and federal r
tal projects.
ess ces
Field Servic
Plant Servic
ing ces
nd pumping s
n and pumpin
D FUNCT
major functiowet funds”. T
plant services
tion Areas
d customer se
proved operaing strategies
support for cregulations. K
•
•
ces
ces
systems conf
ng systems in
TIONS
onal areas. TThese divisions.
ervice for DO
ating budget.s.
capital projecKey levels of
•Operations &Maintenance
•Water Quali
•OperationsMaintenan
•WaterConservati
forms to the C
conformance
There are founs include the
OU. Key lev
cts, plant andf service are to
& eity
s & nce
ion
City’s
e with
ur (4) areas
vels of
d field o:

Plan long-range growth and maintenance of City infrastructure. Review private development projects to assure consistency with City standards and
compliance with federal, state and local codes. Manage and oversee compliance with regulatory programs.
Field Services The “Field Services” division operates and maintains the water distribution system and wastewater and drainage collection systems, as well as associated ditches and levees. Key levels of service are to:
Provide reliable services to our customers. Provide timely emergency and non-emergency (water, wastewater and drainage service)
response during business hours and/or after hours. Plant Services The “Plant Services” division operates and maintains facilities for water production, wastewater and drainage pumping, and wet weather combined wastewater treatment. Key levels of service are to:
Provide reliable water, wastewater, and drainage services to our customers. Maintain electrical and mechanical systems for water, wastewater, and drainage pump
stations, wells, reservoirs and treatment plants. Ensure drinking water regulatory compliance.
SECTION II: APPROACH AND METHODOLOGY
A. ASSET MANAGEMENT APPROACH Capital Improvement Projects (CIPs) are projects undertaken by DOU that are generally not recurring and result in the rehabilitation, replacement and/or improvement of an existing capital asset, or construction or acquisition of a new capital asset. CIPs are typically site specific and have a defined budget and completion date. In developing multi-year CIP programs for each utility, DOU assesses the condition of assets and the long-term viability of their use in meeting the performance and quality standards required and expected for providing ongoing, uninterruptable service to its customers. Utility systems are capital intensive and require ongoing maintenance, repair, and replacement to sustain the integrity of the infrastructure. A significant portion of the City’s water, wastewater and storm drainage infrastructure used to supply and maintain these services, including many of the critical pipelines, pump stations, treatment plants, reservoirs, and wells, are approaching, or already passed, their designed life span. While catastrophic failures of critical infrastructure have been few, the condition of the aging infrastructure is such that breakdowns, which would cause wide-ranging impacts, are becoming more and more likely. Even without major failures, maintenance costs are increasing and the levels of service City customers and ratepayers expect are becoming more difficult to meet due to the poor and aging condition of the infrastructure as well as regulatory mandates. To address this issue, DOU has been working, through its asset management program to refine a CIP process to repair, replace, or rehabilitate aging infrastructure in a timely, cost-effective manner. This refined approach systematically incorporates infrastructure criticality; condition assessment; life cycle costing; and prioritized replacement timetables. The approach includes the following steps:
Identifying City-owned assets (i.e., taking inventory of all water, sewer and drainage assets; collecting data; and storing information on a geographic information system (GIS) database).
Assigning a level of relative criticality to these assets Evaluating where applicable the condition of these assets to identify those nearing failure Determining how and when assets are likely to fail, based on collected data Prioritizing rehabilitation projects based on anticipated failure rate or potential impact of failure
The CIPs generated involve upgrades to or replacement of existing facilities and additions or extensions of existing facilities in response to ongoing development which is compatible with the City’s General Plan. This approach enables the City to prioritize its R&R efforts, and to maintain higher service levels while efficiently using its limited resources to achieve its performance goals. Much of DOU’s asset management strategy focuses on core framework areas that provide the foundation for many asset management best practices. These areas include: current state of assets, level of service, critical assets, minimum life cycle costs, and long-term funding strategy. Several asset management best practices related to the areas are listed below:
Preparing an asset inventory and system map Developing a condition assessment and rating system
Assessing remaining useful life by consulting projected-useful-life information Determining asset values and replacement costs Understanding current and anticipated regulatory requirements Using level of service standards to track system performance over time Listing assets according to how critical they are to system operations Determining the likelihood of failure Analyzing failure risk and consequences Moving from reactive maintenance to predictive maintenance Knowing the costs and benefits of rehabilitation versus replacement Looking at lifecycle costs, especially for critical assets Deploying resources based on asset conditions Analyzing the causes of asset failure to develop specific response plans
There are several benefits of asset management. The benefits achieved through our asset management practice include, but are not limited to, the following:
Better operational decision making Greater ability to plan and pay for future repairs and replacements Increased knowledge of the location of the assets Increased knowledge of what assets are critical to the utility and which ones aren’t More efficient operation CIP projects that meet the true needs of the system Improved relationships with governing authorities, ratepayers, and other stakeholders Prolonging asset life and aiding in rehabilitate/repair/replacement decisions through efficient and
focused operations and maintenance Setting rates based on sound operational and financial planning Budgeting focused on activities critical to sustained performance Meeting service expectations and regulatory requirements
B. CAPITAL IMPROVEMENT PROGRAM DRIVERS
B.1 Design Life / Best Replacement Practices In 2009 the American Society of Civil Engineers (ASCE) rated the condition of the Nation’s infrastructure. The tables in Section III of this document delineate the design life of different components of the water and wastewater systems. It is DOU’s goal, based on these design lives, to replace the City’s water and wastewater infrastructure every 100 years. This means that 1% of the system, on average, would be replaced each year. The term used to describe this replacement strategy is “Best Practices” or “Infrastructure Sustainability. Section V contains a more robust discussion of this concept. Water Utility The City’s water treatment and delivery systems includes treatment plants, reservoirs, underground pipe systems and groundwater wells. The replacement value of the system is about $3.3 billion. The average useful life of the system is 15-95 years depending on the asset. This means that conservatively, the entire system must be rehabilitated or replaced, on average, every 100 years. In order to do this, approximately 1% of the value, or $33 million, must be spent, on average, every year. Currently, about $5 million is

being spent annually for a replacement rate of about 400 years. The intent of the City’s 30 year capital plan includes ramping up capital rehabilitation spending to sustainable levels over a 5 to 10 year period. Wastewater Utility The City’s wastewater conveyance system has two main components; the separated system, which handles only the conveyance of wastewater and the combined system, which handles wastewater and storm drainage. The systems include pipe systems, pump stations, underground storage facilities and primary treatment facilities the replacement value of which is about $2.2 billion. The average useful life of these system components is about 15-90 years depending on the asset, meaning that, conservatively, the entire wastewater system must be rehabilitated or replaced, on average, every 100 years. In order to do this, approximately 1% of the value, or about $22 million, must be spent, on average, every year on rehab and replacement of the system. We are currently spending about $3.5 million per year for a replacement rate of about 650 years. Storm Drainage Utility The City’s drainage system conveys storm drainage and non-storm drainage to the local creeks and rivers. The system includes pipes, channels, ditches, pump stations, levees, and detention basins. The replacement value of these assets is about $1.0 billion. The average useful life of these system components is about 100 years (this includes the pipe, channel and storage systems which have a life expectancy of 100 to 150 years and the pumping facilities, which have a 15-70 year life expectancy). This means that the entire system must be replaced, on average, every 100 years. In order to do this, approximately 1.0% of the value, or about $10 million, must be spent, on average, every year on replacement of the system. We are currently spending about $2 million per year for a replacement rate of 500 years. The system is unique among drainage systems in that about 95% of the drainage conveyed must be pumped into local creeks and rivers. There are about 100 of these drainage pump stations. This makes the system very expensive to maintain and very susceptible to flooding from pump failure and system deficiencies. However, as pointed out in the introduction a storm drainage rate study containing recommendations is currently being prepared.
B.2 Regulatory / Legislation Compliance The City’s water, wastewater and storm drainage systems are operated in accordance with a host of federal, state and local public health and environmental regulations and standards. These mandates continue to evolve and become more stringent. Regulatory projects are typically mandated and the consequences of non-compliance can be severe (i.e., administrative penalties, building moratoriums, public health advisories, flood insurance restrictions, etc.). Therefore regulatory requirements are considered highest-priority projects for the City. In the water and wastewater utilities, these regulations drive most of the CIP program, and operations and maintenance activities. Some of the key regulatory and legislative drivers are discussed below. Water Utility Title 22 of the California Code of Regulations These regulations requirements developed by the Department of Health Services define requirements for drinking water standards, homeland security, and water conservation.

AB 2572 This legislation enacted January 1 2006 and requires the installation of water meters on all existing non-metered water taps by 2025. For the City this means that approximately 140,000 meters need to be installed by 2025. As there are many older distribution mains in backyard easements, this program also includes moving all backyard mains to the front public right of way (street). The total cost of this program is estimated to be $350 million. Only $40 to $50 million of this work has currently been done leaving a significant portion to be done in the next 12 years. The City will be ramping up spending on this program to appropriate levels to be able to comply with the legislative mandate. Failure to do so would put the City out of compliance and jeopardize our water rights and our ability to get state and federal grant funding. Wastewater Utility National Pollutant Discharge Elimination System (NPDES) Permit The City is subject to an NPDES permit, which regulates the operation of the City’s combined wastewater (Combined) system. The goal of this permit is to minimize outflows from the system (into a street for instance) and overflows (CSOs) from the system. The main requirement of the permit that drives the capital program is a requirement mandating the City to spend $10 million per year on improvements to the Combined system. The City is developing projects and budgeting money to comply with this requirement. State of California Waste Discharge Requirements (WDR) Permit for Wastewater systems This permit regulates the operation of the City’s separate wastewater system and has as its goal the elimination of sanitary sewer overflows (SSOs). A sanitary sewer overflow is when wasterwater comes out of the system into a street or yard. This is usually caused by pipe blockage, failure or lack of capacity. Permit requirements that affect the capital program are:
Provisions that mandate periodic assessments of the system. Requirements that mandate the replacement of failed infrastructure in a timely manner Conditions requiring the timely scheduled replacement of the entire system due to the life
cycle of the infrastructure
The City is in the process of systematically assessing the condition of the separate wastewater infrastructure. Money is being budgeted for the repair and rehabilitation of failed pipe and the systematic scheduled replacement of the system (see sub-section A of this section) Master Interagency Agreement The Master Interagency Agreement between the City and the Sacramento Regional County Sanitation District requires that the City reduce infiltration and inflow into the sewer system, as high wet weather flows use up capacity in the District’s interceptors and treatment plants. More focused planning efforts have recently been initiated to address infiltration and inflow, especially in low-lying areas close to the Sacramento River. These planning efforts include flow monitoring during the rainy season as well as the summer and fall and a visual inspection of manholes. The planning studies will culminate with recommendations for system improvements that will reduce infiltration and inflow. Storm Drainage Utility National Pollutant Discharge Elimination System (NPDES) Permit

The City is subject to an NPDES permit, which regulates the operation of the City’s combined wastewater (Combined) system. The goal of this permit is to minimize outflows from the system (into a street for instance) and overflows (CSOs) from the system (into the Sacramento River). The main requirement of the permit that drives the capital program is a requirement mandating the City to spend $10 million per year on improvements to the Combined system. The City is developing projects and budgeting money to comply with this requirement. National Flood Insurance Program (NFIP) DOU is the City’s designated Floodplain Manager. DOU is responsible for compliance with the National Flood Insurance Program (NFIP), which is crucial as it allows property owners within the City to obtain reduced cost flood insurance. Compliance efforts include: (1) filing letters of map revision to the Federal Emergency Management Agency (FEMA) when new flood control projects come online; (2) updating flood evacuation maps; (3) ensuring that appropriate development standards are in place and implemented; and (4) providing public information and outreach. While not a driver, the NFIP requirements do influence the drainage capital program.
B.3 System Improvement There are two main categories of improvements to the utility infrastructure systems in the City;
1. Improvements needed to facilitate development 2. Improvement needed to address current deficiencies in the system.
An example of the first is a new transmission main to allow the City to deliver drinking water to a new residential development. An example of the second is an improvement to increase pressures to meet fire flow requirements. The first type of improvement is normally funded by development impact fees, the second type is normally funded from utility rate fees. This program guide addresses mostly the second type of improvements
Water Utility Improvements to the system to meet levels of service is not a key driver for the Water CIP program, but when there is a CIP to replace or rehabilitate aging or failed infrastructure and analysis is included to assure that the rehabilitated infrastructure meets levels of service including fire flow requirements. Wastewater Utility As with the water utility, improvements to the system to meet levels of service is not a key driver for the wastewater CIP program, but when there is a CIP to replace or rehabilitate aging or failed infrastructure and analysis is included to assure that the rehabilitated infrastructure meets levels of service including system capacity requirements. Storm Drainage Utility Outside of the rehabilitation of the electrical and pump component of the drainage pump stations, unlike the water and wastewater utilities, improvements to the system to meet levels of service are the main drivers in the storm drainage utility CIP program.

In 1993 City Council adopted levels of service for the City’s drainage system. These levels of service included:
1. Stormwater from a 10 year storm event (an event which has a 10% chance of occurring each year) shall not rise above the top of the curb in the street (streets will be passable in a 10 year storm) and;
2. Stormwater from an 100 year storm event (an event with a 1% chance of occurring each year) shall be below the level of the first floor. This assures that there will be no structural damage in a 100 year storm event
In order to determine the required improvements, a drainage basin master planning effort has been ongoing since the mid 1990s. To date, approximately 40% of the drainage basins have been master planned. These master plans include a hydraulic assessment of the basin to determine any deficiencies and the development of improvement alternatives to meet levels of service. Extrapolating these master plans throughout the entire system results in about $350 million in drainage upgrade projects that are needed to meet levels of service. The Department is proposing to ramp up spending on drainage system improvements to levels that would allow the bulk of these improvements to be completed in the 30 year planning horizon. Condition assessment is also beginning in the drainage system, but the system is much younger and in less need of rehabilitation.
C. 30, 5, & 3-YEAR STRATEGY As mentioned in the introduction, this Capital Improvement Programming Guide has proposed both a long-term and short-term investment strategy (30-year, 5-year, 3-year) for incrementally improving the City’s utility infrastructure. First, a 30-year Capital Investment Program has been developed which has three primary components – a component mandated by regulation, legislation and/or other requirements, a Water and Wastewater Infrastructure Investment Program based on industry best practices for system replacement and an improvement program to meet levels of service. The three primary goals of the 30-year Program are to fully comply with regulatory, legislative, and other requirements, to accelerate system infrastructure replacement to the “Best Practices” level and, where necessary, to improve systems where they do not meet current levels of service. This is a long-term planning tool to focus on an optimal program that, over time, invests in the City’s water and wastewater capital and regulatory programs at levels that sustain the health and integrity of the systems and guarantee continued reliable and high quality service the citizens of Sacramento have come to expect. It is, in fact, a target or a long-term goal for incrementally keeping pace with the need to invest in the City’s critical infrastructure. Second, in order to meet the immediate needs of the City’s water and wastewater infrastructure, and as part of the 30-year program, a specific 5-year CIP program for water, wastewater and drainage has been developed. As opposed to the more general 30-year Capital Investment Program, the 5-year CIP program identifies specific projects for funding. The water CIP include the mandated water meter retrofit program; water treatment plant rehabilitation; and, in an effort to phase in water infrastructure investment to achieve sustainable (best practices) levels, well rehabilitation, and pipe replacement in the distribution and transmission main systems.; The wastewater CIP include projects in both the separated and combined systems to comply with regulatory mandates and a phasing of a sustainable (best practices)pipeline replacement program. The drainage CIP includes system improvements to meet levels of service, rehab of pump stations and funding for the drainage share of projects in the combined system. The drainage CIP is contingent on future rate increases in the drainage rates. In addition to capital
investment, the Program includes continuity of existing production, maintenance and regulatory activities, as well as addressing new regulatory requirements that are performed as part of DOU’s production and maintenance activities. Third and finally, this Capital Improvement Programming Guide includes 3-year rate adjustments for both the water and wastewater utilities to implement the first 3-years of the 5-year CIP program. The rate adjustments are part of a comprehensive finance plan that uses a mix of bond and cash financing that allows the City to invest in its infrastructure and meet regulatory requirements while smoothing rate increases and avoiding rate spikes for utility customers. The long-term financing plan gradually builds up the cash funding portion and decreases the debt financing component to ultimately achieve a sustainable “pay-go” program. The bonds issues will be backed by the revenue generated by the approved 3-year water and wastewater rate increases and therefore will not risk General Fund resources. After FY2015/16, no additional rate increases would be needed to finance existing programs. However, this does not mean there would be no negative consequences if no rate increases are approved beyond FY2015/16, since this likely would result in noncompliance with regulatory requirements in future years which could result in costly fines, third party lawsuits and/or loss of local control among other things
D. RESEARCH AND DEVELOPMENT As part of DOU’s asset management program, which directly supports the CIP program, engineering research and development (R&D) is being conducted to evaluate promising innovative technologies that can reduce costs and improve the effectiveness of operation, maintenance, and replacement of aging and failing water, wastewater, and drainage systems. Asset management and CIP engineers continue to perform comprehensive reviews and evaluations of existing and emerging technologies specifically for rehabilitation/repair and condition assessment which are thoroughly selected and prepared for field pilot demonstration studies. While ongoing R&D efforts continue with the evaluation of current practices and the current state of art for rehabilitation/repair of infrastructure assets, DOU is reviewing the need for rational and common design approaches for rehabilitation systems, quality assurance/quality control procedures, acceptance testing during installation, and decision support of rehabilitation vs. replacement to name a few. As emerging technologies prove to be worthwhile candidates, pilot projects and field demonstrations are often conducted and evaluated. In many ways, the mixture of rehabilitation/repair technologies available today has shown real progress. However, it seems that the rate of system rehabilitation, repair, and upgrading is not adequate to keep pace with increasing needs, demands, and continually deteriorating systems. While the technologies being used today are generally effective, there is still considerable room for improvement in existing technologies and/or development of new technologies. Such improvements or new technologies offer the chance to make the investments in rehabilitation/repair more effective and extend the ability to fix larger portions of the systems with current funding levels. A considerable amount of R&D time is being spent on finding the best and most practical methods of assessing the existing condition of infrastructure assets, its remaining useful life, and asset value. Pressure to find methods is increasing in the wake of recent state regulatory mandates. As a result, DOU is expending considerable effort aimed at improving the methods used to assess the condition of infrastructure assets, particularly its water assets.
Water assets, being under pressure, do not lend themselves to conventional assessment techniques. Until now pipe age and material have acted as surrogates for actual pipe condition. Given the need to maximize the useful life of the water assets and to avoid replacing pipe prematurely, these surrogates are becoming less and less satisfactory. As a result, DOU is embarking on the following projects: C-Value Testing – The Water CIP section has developed an in-situ testing technique to assess the carrying capacity of distribution mains. C values or roughness coefficients were determined by hydrant to hydrant flow testing, which were then compared to the expected C values for new pipe in order to quantify the percentage reduction in flow capacity. The project tested 30 sections of cast iron pipe of varying ages and determined that, on average, flow capacity was reduces by 60% in the pipes tested. This is a significant finding because a pipe that is only able to carry 40% of its capacity is a failed pipe and needs to be rehabilitated or replaced. Failed and Replaced Pipe Forensics – DOU is in the process of forming a partnership with CSUS to do forensics testing on failed and replaced pipe. By this effort we are hoping to understand better the aging and failure mechanisms of water mains, which will help us to better assess condition and prioritize capital projects. In-Situ Condition Assessment – In the next two years, DOU plans to spend considerable resources to determine if there is a reliable and cost effective, non-destructive, method to assess the condition of water mains. DOU has already done pilot projects with assessment tools, but the results have been unreliable and unsatisfying. Through the upcoming effort DOU hopes to find the desired technology and/or methodology, or prove that none currently exists. As new technologies evolve and existing technologies improve, DOU’s ongoing effort to systematically research and develop necessary protocols to prolong asset life through rehabilitation/repair (i.e. pilot field demonstration projects) and condition assessment will enhance its asset management program by achieving efficiencies in utilizing emerging and proven technologies.
E. FUNDING As pointed in Section 1: Introduction, a key component of this Capital Improvement Programming Guide is not only to provide an explanation of the processes, approach, and methodology for selecting the planned projects, but also to explain and justify a viable funding plan for implementation. The following provides the explanation and rational for the adopted funding strategy and a description of the available funding sources.
E.1 Funding Strategy Water and Wastewater The Water and Wastewater Infrastructure Investment Program uses a mix of bond and cash financing that allows the City to invest in its infrastructure and meet regulatory requirements while smoothing rate increases and avoiding rate spikes for utility customers. While issuing bonds will increase the long-term cost of financing the City’s capital and regulatory programs, issuing bonds in the near term will mitigate the impact on water and wastewater rates and more equitably spread the benefits and costs of the infrastructure and regulatory investment to utility customers over a longer term. By smoothing rates, rate spikes are minimized from one year to the next. Cash flow and coverage

requirements are accounted for in future years, and rates are set so they are roughly equal from year to year to meet these requirements in future years. The long-term financing plan gradually builds up the cash funding portion and decreases the debt financing component to ultimately achieve a sustainable “pay-go” program. The following are key points to be considered when it deciding how much of the Capital Program can or should be financed through bonds. Cash funding of a capital program is most appropriate when the annual capital needs are
relatively flat from year-to-year and these needs are mostly capital replacements. Debt can be used to mitigate capital expenditure spikes as necessary. Debt should only be used to finance capital assets with long useful lives. Near- and long-term rate increases are balanced through an optimal mix of debt and cash
financing. Overreliance on debt causes bond coverage-driven future rate increases beyond the ongoing cash
needs of the utility. This methodology provides predictable rates for the utility’s customers and provides additional revenues in the near term intended to reduce future bond issuance amounts, ultimately lowering rates in the long run. The financing approach and methodology for the 3-year rate increase: Meets critical, near-term regulatory and capital needs, including the Water Treatment Plant
rehabilitation and the meter transition program Utilizes debt financing and defers debt service payments for 30 months (capitalized interest) Maximizes use of existing resources to the fullest extent in order to mitigate rate increases (re-
appropriates existing capital program and refunds existing capital projects) Establishes a sustainable program that meets bond requirements (reserves) The approved water and wastewater rate increases allow the Department to issue about $350 million in bonds to finance water and wastewater projects to implement the first three years of Program. The Department worked closely with the City Treasurer’s Office to develop bond financing assumptions and an issuance strategy designed to achieve a bond rating strong enough to market revenue bonds. The following bond financing assumptions were built into the long-term utilities finance plan for the Water and Wastewater Infrastructure Investment Program and are utilized for the first three years of the Program: Reserve requirements:
o An operating/liquidity reserve (fund balance) of 120 days worth of annual operating expenditures
o Rate stabilization reserve fund balance equivalent to 25% of annual debt Service
o Debt Service Reserve Fund level of 10% of the total issuance amount Bond Loan Terms:
o FY 2012/13 issuance – 5.25% interest rate o All issuances thereafter – 5.75% interest rate o All issuances assumed to have 30 months of capitalized interest. Capitalized interest costs are
included in the issuance amount o All issuances are assumed to be repaid in equal annual payments over 30 years
Debt coverage ratio: o 1.30 times the fund’s net operating income to debt ratio
Storm Drainage The funding strategy for storm drainage CIPs also proposes a mix of bond and cash financing that allows the City to invest in its infrastructure and meet regulatory requirements while smoothing rate increases and avoiding rate spikes for utility customers. As mentioned previously however, Proposition 218 requires that any increase in storm drainage rates be approved by the rate payers by a public vote. The current funding strategy includes: A study to determine the best rate structure and application methodology. This study is underway and
almost complete An internal and external information and education effort culminating hopefully, in council approval
for DOU to go to a public vote for a drainage rate increase followed by the public vote. The funding strategy is comprised of multiple funding sources. These funding sources are described in detail in the following section.
E.2 Funding Sources Capital projects are typically funded through user rates or connection fees, depending on the type of project. Although a majority of the projects are funded through user fees, grant and loan funding are becoming more mainstream through state and federal programs as additional funding sources. The following funds represent the major funding sources available for water, wastewater, and storm drainage projects. Water User Fees Water Fund revenues are derived from customer rates and fees, interest earnings, development fees, tap sales, and reimbursements from other entities for services provided. Water Fund revenues are structured to cover the costs of providing water service to its customers which include water treatment, plant maintenance, water distribution system repair and maintenance, water conservation and education programs, water quality monitoring, related engineering services, customer service and billing, the City-County Office of Metropolitan Water Planning, and capital improvements. Water Development Impact Fee Fund Water Development Impact Fee Revenues are generated from fees paid by developers and others whose projects add to the demand on the water production and delivery systems. Fees collected into the Water Development Impact Fund must be used on projects that mitigate the impact of additional demand for water production or water distribution including new water diversion, treatment, and storage and transmission mains (pipes larger than 12” in diameter). DOU adopted the following criteria for initiating a CIP project in the Water Development Impact Fee Fund. The project must: 1) Significantly improve existing facilities; and 2) Meet the demands of increased growth. Wastewater User Fees The Wastewater Enterprise Fund provides for the maintenance, repair, and replacement of facilities for

collecting, conveying, and pumping sanitary and combined sewage to the wastewater interceptors of the Sacramento Regional County Sanitation District. User rates and fees finance both operating costs and capital improvements. Wastewater fund revenues are generated from customer fees, interest earnings, and tap sales. Wastewater Development Impact Fee Fund Wastewater Development Impact Fee revenues are generated from fees paid by developers and others whose projects add to the demand on sanitary wastewater or combined wastewater collection systems. The Fund is used to mitigate impacts of development to the City’s separated and combined wastewater systems. DOU established the following goals for implementation of the Wastewater Development Impact Fee CIP. The goals are to 1) Ensure that expansion and extension of the wastewater collection and pumping systems conform to the City's General Plan; and 2) Upgrade or replace existing wastewater collection and pumping systems in conformance with wastewater system master plans. Storm Drainage User Fees The Storm Drainage Enterprise Fund supports the operations, maintenance, repair, and rehabilitation of the storm drainage system, including the combined wastewater system. Fund revenues are generated from customer rates, fees and interest earned. The effect of Proposition 218, which requires that drainage rate increases be approved by a vote of the property owners, and the ever-increasing cost of regulatory compliance continues to have a serious impact on the fund’s ability to pay for the capital improvement program such that the funding available for the CIP program has diminished to almost zero. This has also had a similar impact on the storm drainage funds ability to be appropriately used in funding CIP’s in the combined wastewater system. Debt Debt can be issued for investments in system infrastructure that provide capital assets. When debt is used for capital investment, the term of debt shall not exceed the reasonable useful life of the asset being acquired or constructed. The primary benefit of using debt to finance projects is that it allows utilities to spread a relatively large cost over multiple years. The specific terms (interest rate, length of repayment period, etc.) generally vary for different types of debt. In addition, certain kinds of debt can come with unique features such as deferred principal repayment. When an agency issues Certificates of Participation, it agrees to certain terms and conditions related to the repayment of those bonds, such as bond coverage. Bond coverage refers to the collection in revenues to meet all operating expenses and debt service obligations plus an additional multiple of that debt service. A minimum bond coverage ratio of 1.25 is common for rate revenue backed bonds, meaning that the agency would collect, at least, expenses plus 1.25 times debt service as a minimum legal level of revenues. Grants and Loans Grants and loans are typically designated for a specific purpose, such as correcting existing system deficiencies (to comply with state or federal regulations), installing meters, water conservation or encouraging development in rural areas.

By and large, grant awards typically require a local fund match amount and in most cases include a 50/50 cost share. In addition, grant funding most often requires some level of compliance and reporting.
SECT
PRIO
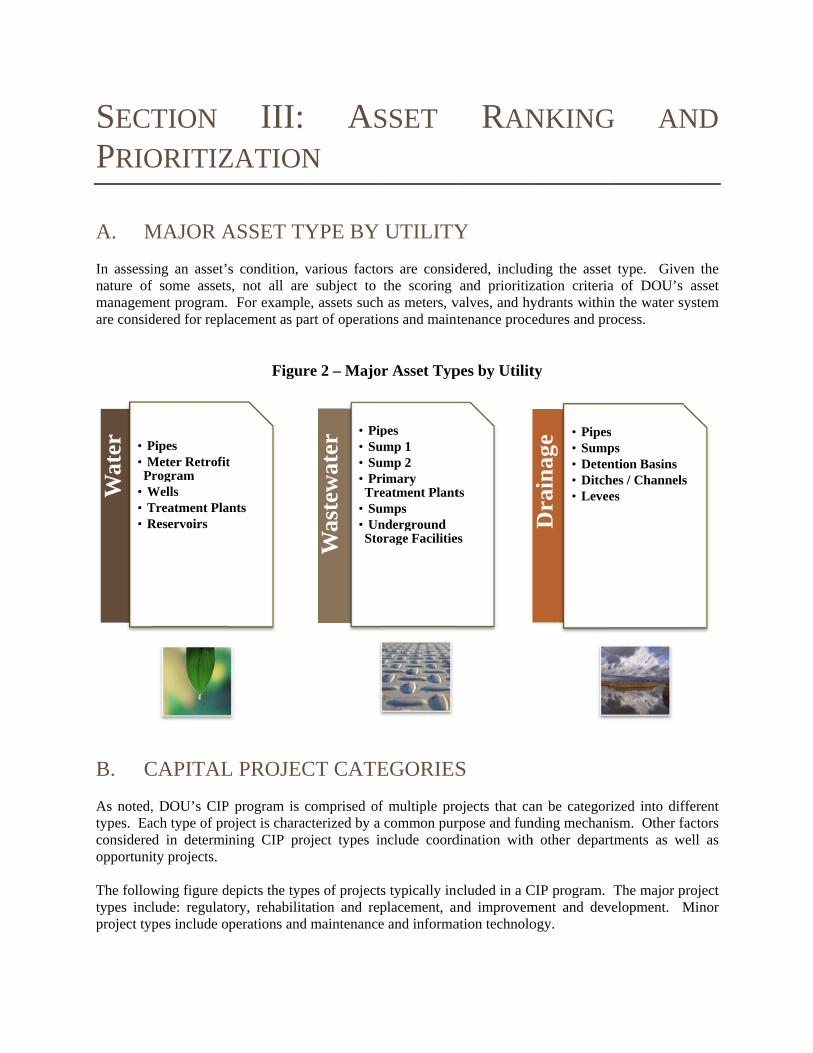
A. M In assessinature of managemare consid
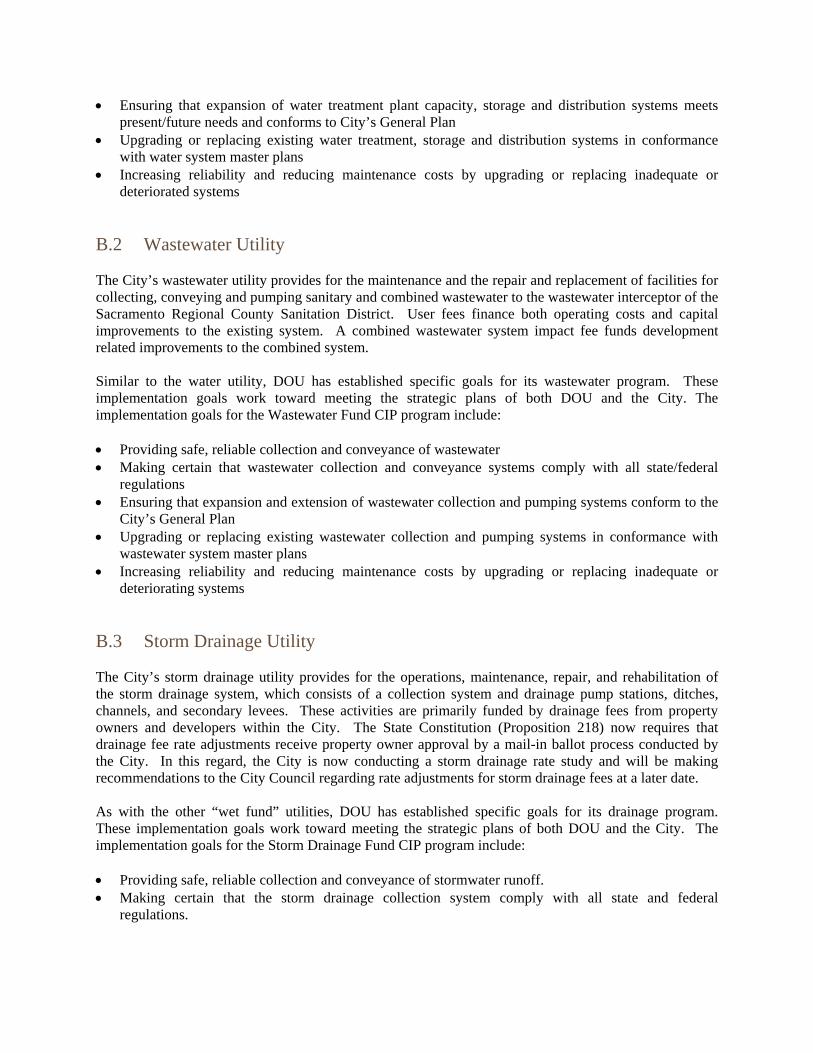
B. C As noted,types. Eaconsidereopportuni The followtypes inclproject typ
Wat
er • P• MPr
• W• T• R
TION
ORITIZ
MAJOR A
ing an asset’f some assets
ment program. dered for repl
CAPITAL
, DOU’s CIPach type of prd in determiity projects.
wing figure dlude: regulatopes include o
PipesMeter Retrofitrogram
WellsTreatment PlaReservoirs
III:ZATION
ASSET T
s condition, s, not all are For exampl
acement as pa
Figur
L PROJEC
P program is oject is charaining CIP pro
depicts the typory, rehabilitperations and
t
ants
AS
N
YPE BY
various factoe subject to e, assets suchart of operatio
re 2 – Majo
CT CATE
comprised ofacterized by a oject types i
pes of projecttation and repd maintenance
Was
tew
ater
• Pip• Su• Su• PrTre
• Su• UnSto
SSET
UTILITY
ors are considthe scoring
h as meters, vons and main
or Asset Typ
EGORIES
f multiple procommon pur
nclude coord
ts typically inplacement, ae and informa
pesump 1ump 2rimary eatment Plant
umpsnderground orage Facilitie
RAN
Y
dered, includand prioritiz
valves, and hyntenance proce
pes by Utilit
S
ojects that carpose and fundination with
ncluded in a Cand improvemation technolo
ts
es
NKING
ding the assetzation criteriaydrants withinedures and pr
ty
an be categornding mechanh other depar
CIP program. ment and devogy.
Dra
inag
e • Pipes• Sump• Deten• Ditch• Leve
G AN
t type. Givea of DOU’s n the water syrocess.
rized into difnism. Other fartments as w
The major pvelopment. M
spsntion Basinshes / Channelses
ND
en the asset
ystem
fferent factors
well as
project Minor
s

Regulato Simply plegislationmandate, improvemgoverning Rehabili Rehabilitthat has eaddress e R&R projfailure ancost-effec Improve Improvemdevelopmprotectionperformansystem).
ory
put, this typen. Examples
combined sments and prog the operatio
itation & Re
ation and reexceeded its uxisting needs
jects are evad consequenc
ctively focusin
ement & De
ment projectsment (e.g., cn to new devnce of the sTypically, th
F
e of project s of regulatosystem improojects in then of the separ
eplacement
placement (Ruseful life. Is and demand
aluated and pce of failure. ng on the mos
evelopment
s are definedconstruction velopment arsystem (e.g.,he latter type
Figure 3 – Ty
Major
meets a regory projects iovements, whe separated srated wastewa
R&R) projecIn most casesds in establis
prioritized ba This approacst important p
d as projectsof new wat
reas) or proj projects thaes of improv
Regulatory
Improvemen&
Developmen
Rehabilitatio&
Replacemen
ypes of CIP
gulatory requinclude meterhich complyystem, whichater system.
cts are desigs these projecshed areas of
sed mostly och is designeparts of the sy
s that either ter reservoirects that addat increase tvements are
y
nt
nt
on
nt
P Projects
M
uirement or r retrofits, w
y with the Nh reduce SS
gned to replacts result in n
f the commun
on assessmend to maximiz
ystem.
provide newrs that provdress system the capacity done in com
OpeMa
InfTe
Minor
is mandated which complyNPDES permOs as requir
ace or refurbnew infrastru
nity.
nt and rankinze the use of
w infrastructvide storage
deficienciesof the com
mbination wit
erations & intenance
formation echnology
by regulatioy witha legismit requiring red by the W
bish infrastruucture design
ng of likelihoDOU resourc
ture to serveand backup
s and improvmbined waste
th replaceme
on or slative
such WDRs
ucture ned to
ood of ces by
e new p fire ve the water ent of

older infrastructure. Improvement projects are generally identified and prioritized through master planning. Prioritization considers factors such as development potential, level of service deficiencies, and regulatory requirements. Funding for improvements are paid for by development impact fees, developers, wholesale customers, and/or grant funding. Operations & Maintenance A few projects are identified and funded on an annual basis to support routine operations and maintenance (O&M) activities. These smaller projects are developed as CIPs rather than as part of the operations and maintenance budget for several different reasons. For example, there may not be enough staff or equipment to perform the work, or a project may require special skills outside the area of staff expertise, or require equipment that is not available within DOU. Information Technology Information technology projects are based on the Integrated Technology Master Plan. This plan provides the guiding principles and basic road map for DOU’s technology vision and business priorities, including resources and expenditures that are required over the next five to seven years. Project priority is reviewed annually. Based on DOU’s wide-ranging needs, these projects are funded through the water, wastewater and drainage CIP budgets. They are considered mid- to high-priority.
Table 1 - Category Summary
Type Key Characteristics Prioritization Factors Weighting Factors
Regulatory Requirements
Regulatory and health standard compliance
Mandates and consequences
Always a high priority
Rehabilitation & Replacement (R&R)
Maintaining existing infrastructure
Asset management (likelihood of failure, consequence of failure)
Core service metrics Coordination with other departments Business opportunities Focus CIP
Improvement & Development
Provide new infrastructure or serve new developments Coordination with other departments Cost sharing Business opportunity
Master planning Development opportunities Timeliness
Frequently outweigh rehabilitation projects because of time-limited business or coordination opportunities May not need to be ranked if externally funded Focus CIP
Operations & Maintenance
Special smaller projects to support O&M
Crucial to daily operations and performance goals
Core service metrics Coordination with other departments
Information Technology
Technology needs for the next 5 to 7 years
Based on the Integrated Technology Master Plan
Mid to high priority
C. ASSET SCORING, RANKING, AND PRIORITIZATION In order to best plan its capital projects and to prioritize the need of such projects, DOU’s asset management program looks closely at each asset and assesses its current condition (likelihood of failure) where appropriate and its criticality (consequence of failure). Investment in assets (their construction, operation, maintenance, rehabilitation and renewal) is guided by the likelihood of failure and its consequence to the customer and regulatory compliance. In doing such a review, DOU assesses the condition and criticality of assets within each system.
There are two main components to the City’s asset ranking and prioritization strategy.
The systematic assessment of the condition of an asset; and, An evaluation of the consequences of failure of an asset, referred to as “criticality”.
Condition (Likelihood of Failure) Condition assessment usually involves some kind of visual inspection and scoring based upon predetermined criteria. In the drainage and wastewater systems this inspection is relatively straight forward and normally involves closed-circuit television (CCTV) inspection for pipes, and onsite visual inspection for assets like pump stations. In the water system, inspection of treatment plants, reservoirs and other like assets is also performed by onsite visual inspection. Underground water transmission and distribution pipe mains however are under pressure and do not lend themselves to remote visual inspection. As a result, the City is currently exploring various non-destructive technologies to assess the condition of the underground water infrastructure. In the meantime, pipe age, material and leak/maintenance data is used as a surrogate for actual pipe condition until more proven assessment methods are quantified. Condition assessment scoring is based on the following grading scale: 1 = “Excellent”
2 = “Good” 3 = ”Fair” 4 = “Poor” 5 = “Immediate Attention”
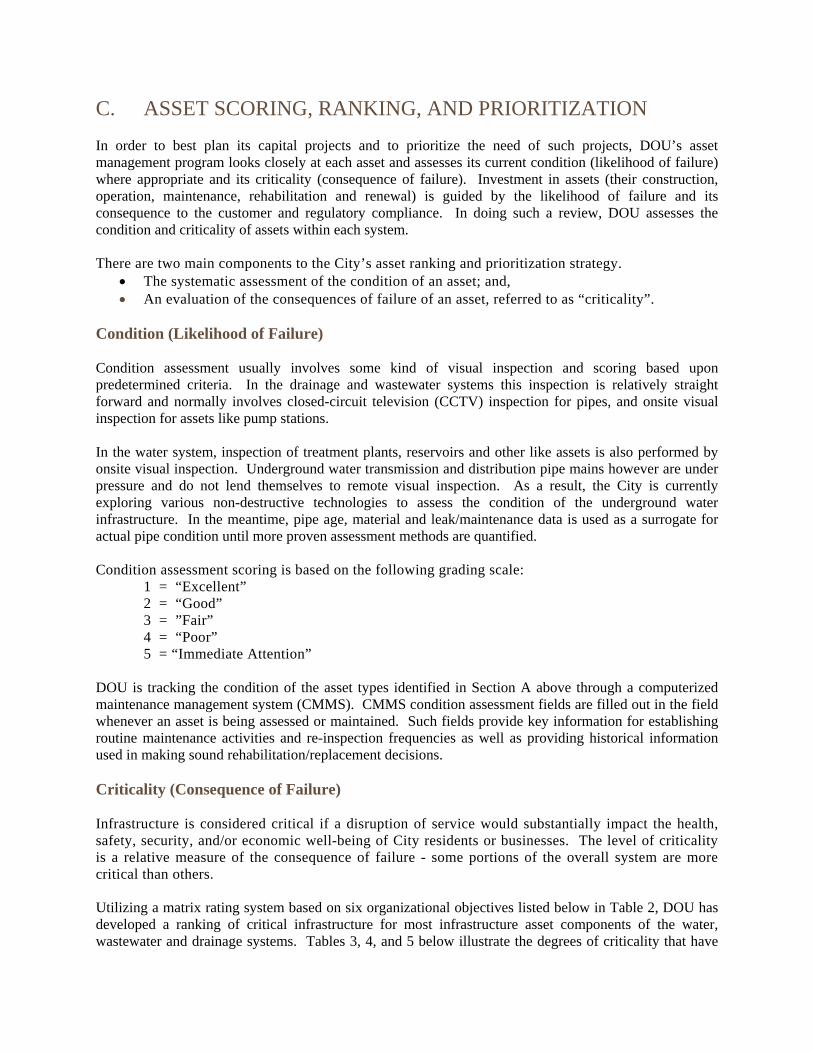
DOU is tracking the condition of the asset types identified in Section A above through a computerized maintenance management system (CMMS). CMMS condition assessment fields are filled out in the field whenever an asset is being assessed or maintained. Such fields provide key information for establishing routine maintenance activities and re-inspection frequencies as well as providing historical information used in making sound rehabilitation/replacement decisions. Criticality (Consequence of Failure) Infrastructure is considered critical if a disruption of service would substantially impact the health, safety, security, and/or economic well-being of City residents or businesses. The level of criticality is a relative measure of the consequence of failure - some portions of the overall system are more critical than others. Utilizing a matrix rating system based on six organizational objectives listed below in Table 2, DOU has developed a ranking of critical infrastructure for most infrastructure asset components of the water, wastewater and drainage systems. Tables 3, 4, and 5 below illustrate the degrees of criticality that have
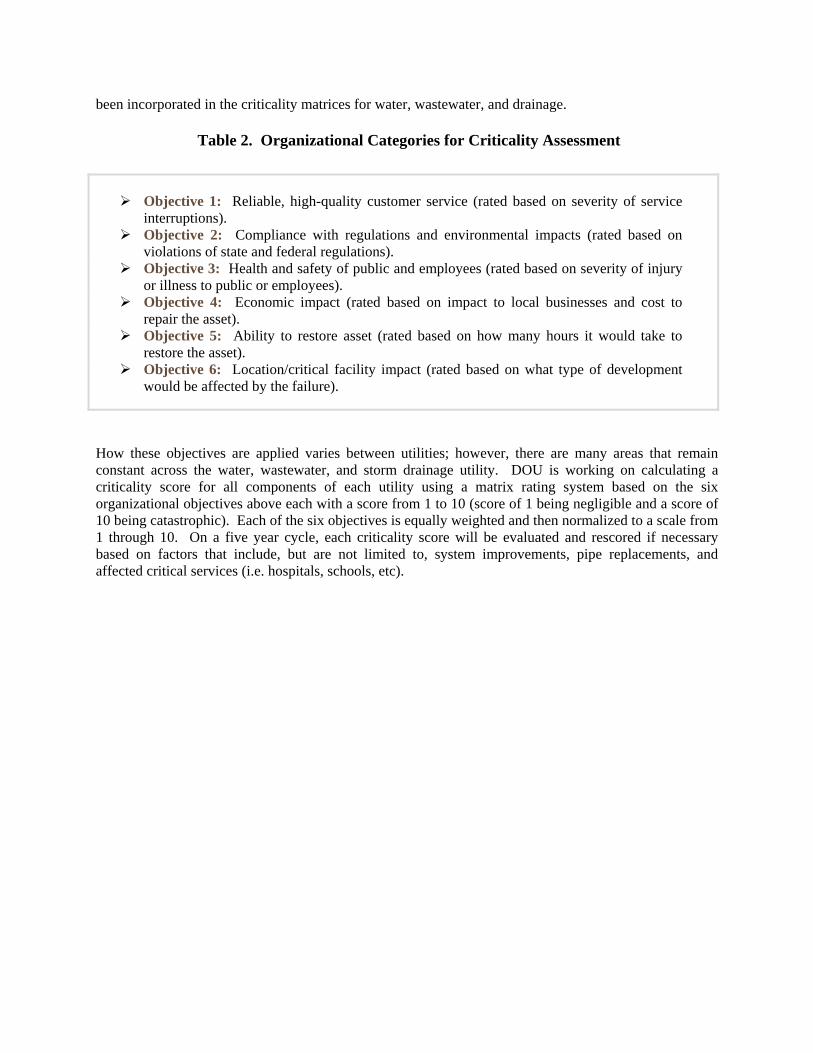
been incorporated in the criticality matrices for water, wastewater, and drainage.
Table 2. Organizational Categories for Criticality Assessment
Objective 1: Reliable, high-quality customer service (rated based on severity of service
interruptions). Objective 2: Compliance with regulations and environmental impacts (rated based on
violations of state and federal regulations). Objective 3: Health and safety of public and employees (rated based on severity of injury
or illness to public or employees). Objective 4: Economic impact (rated based on impact to local businesses and cost to
repair the asset). Objective 5: Ability to restore asset (rated based on how many hours it would take to
restore the asset). Objective 6: Location/critical facility impact (rated based on what type of development
would be affected by the failure).
How these objectives are applied varies between utilities; however, there are many areas that remain constant across the water, wastewater, and storm drainage utility. DOU is working on calculating a criticality score for all components of each utility using a matrix rating system based on the six organizational objectives above each with a score from 1 to 10 (score of 1 being negligible and a score of 10 being catastrophic). Each of the six objectives is equally weighted and then normalized to a scale from 1 through 10. On a five year cycle, each criticality score will be evaluated and rescored if necessary based on factors that include, but are not limited to, system improvements, pipe replacements, and affected critical services (i.e. hospitals, schools, etc).

Table 3 - Criticality Scoring Matrix for Water
SEVERITY LEVELS BY POSSIBLE IMPACT WATER
Organizational Objective
Negligible = 1 Moderate = 4 Critical = 7 Catastrophic = 10
1 Reliable, High Quality Customer Service
Pressure > 30 psi, isolated service interruptions; No effect on fire protection
Pressure 25-30 psi; several customers affected. Minimal effect on fire protection
Service interruption affecting several customers; pressure 20-25 psi; considerable impact on fire protection
Service interruption over widespread area affecting numerous customers, pressure <20 psi; and significantly impacting fire protection
2 Compliance With Regulations and Environmental Impact
Considered only a technical violation of permit or regs; no environmental impact
Violation must be reported but no enforcement action taken; violation of Tier 3 regulations
Violation brings strong warning from regulatory agency; violation of Tier 2 regulations
Significant non-compliance resulting in administrative or consent orders; violation of Tier 1 regulations
3 Health & Safety of the Public and Employees
No adverse health affect on the public or employees
Minor injury to public or employees; no illness among citizens
Severe injury or illness affecting a few citizens or employees
Any loss of life; severe injury or illness affecting numerous citizens or employees
4 Economic Impact (Community and Utility)
No economic impact on the businesses or the community; utility’s expense covered by budgeted contingency funds
Short-term economic impact on a few businesses; no adverse impact on economic vitality of community; utility’s expense covered by reallocating within existing budget
Short-term economic impact on several businesses; no adverse impact on economic vitality of community; significant expense by the utility, requiring budget modification or allocation of reserves
Long-term or area-wide economic impact on numerous businesses; adverse impact on economic vitality of community; major unplanned expense by the utility, requiring allocation of reserves or borrowing
5 Ability to Restore Asset to Design LOS
Asset restored in less than 4 hours not including disinfection
Asset restored 4 to 12 hours not including disinfection
Asset restored between 12 to 24 hours not including disinfection
Not able to restore asset for >24 hours
6 Location/Critical Facility Impact
No occupied areas; open space, streets
Area of few residences and commercial establishments
Residential areas; extensive commercial areas (malls); industrial complexes
High density residential (large apt complexes); schools, hospitals, and high profile buildings (e.g. Capitol); wholesale customers
* Tier 1 - Any time a situation occurs where there is the potential for human health to be immediately impacted. Tier 2 - Any time a water system provides water with levels of a contaminant that exceed federal or state standards or that hasn't been treated properly, but that doesn't pose an immediate risk to human health. Tier 3 - When a water system violates a drinking water standard that does not have a direct impact on human health

Table 4 - Criticality Scoring Matrix for Wastewater
SEVERITY LEVELS BY POSSIBLE IMPACT WASTEWATER
Organizational Objective
Negligible = 1 Moderate = 4 Critical = 7 Catastrophic = 10
1 Reliable, High Quality Customer Service
Wastewaters surcharged for a brief time; no overflow or back-ups; no noticeable odors beyond utility property
Brief period of overflow in non-populated area; no back-ups into buildings; brief odor affecting few people
Back-ups into several dwellings or over extensive areas outside of buildings, but with some lag time; noticeable odors many hundreds of feet away from facility
Extensive and immediate wastewater back-ups into many occupied dwellings; long duration overflows onto street in populated areas; intense odors for long periods affecting many people
2 Compliance With Regulations and Environmental Impact
Considered only a technical violation of permit or regulations; no environmental impact
Violation must be reported but no enforcement action taken; no environmental impact
Violation brings strong warning from regulatory agency; short-term environmental impact.
Significant non-compliance resulting in administrative or consent orders; long-term environmental impact
3 Health & Safety of the Public and Employees
No adverse health affect on the public or employees
Minor injury to public or employees; no illness among citizens
Severe injury or illness affecting a few citizens or employees
Any loss of life; severe injury or illness affecting numerous citizens or employees
4 Economic Impact (Community and Utility)
No economic impact on the businesses or the community; utility's expense covered by budgeted contingency funds
Short-term economic impact on a few businesses; no adverse impact on economic vitality of community; utility's expense covered by reallocating within existing budget
Short-term economic impact on several businesses; no adverse impact on economic vitality of community; significant expense by the utility, requiring budget modification or allocation of reserves
Long-term or area-wide economic impact on numerous businesses; adverse impact on economic vitality of community; major unplanned expense by the utility, requiring allocation of reserves or borrowing
5 Ability to Restore Asset to Design LOS
Less than 4 hours Service restored 4 hours to 24 hours
Service restored between 24 to 48 hours
Not able to restore service for >48 hours
6 Location/Critical Facility Impact
No occupied areas; open space, streets
Area of few residences and commercial establishments
Residential areas; extensive commercial areas (malls); industrial complexes
High density residential (large apt complexes); schools, hospitals, and high profile public buildings (Capitol)

Table 5 - Criticality Scoring Matrix for Drainage
SEVERITY LEVELSY POSSIBLE IMPACT DRAINAGE
Organizational Objective
Negligible = 1 Moderate = 4 Critical = 7 Catastrophic = 10
1 Reliable, High Quality Customer Service
No flooding of structures; minimal street flooding in 2-year storm.
Street flooding >6 inches in 10 year flood. No flooding of structures.
Structures flooding in <100 year storm in a small portion of the basin.
Structure flooding in <100 year storm throughout an extensive area.
2 Compliance With Regulations and Environmental Impact
Considered only a technical violation of permit or regulations; no environmental impact.
Violation must be reported but no enforcement action taken; no environmental impact
Violation brings strong warning from regulatory agency; short-term environmental impact.
Significant non-compliance resulting in administrative or consent orders; long-term environmental impact.
3 Health & Safety of the Public and Employees
No adverse safety impacts the public or employees.
Minor safety impact to public or employees; minor injury among citizens.
Severe safety hazard affecting a few citizens or employees; small area of sanitary wastewater system affected.
Any loss of life; severe safety hazard affecting numerous citizens or employees; widespread area of sanitary wastewaters affected.
4 Economic Impact (Community and Utility)
No economic impact on the businesses or the community; utility's expense covered by budgeted contingency funds.
Short-term economic impact on a few businesses; no adverse impact on economic vitality of community; utility's expense covered by reallocating within existing budget
Short-term economic impact on several businesses; no adverse impact on economic vitality of community; significant expense by the utility, requiring budget modification or allocation of reserves.
Long-term or area-wide economic impact on numerous businesses; adverse impact on economic vitality of community; major unplanned expense by the utility, requiring allocation of reserves or borrowing.
5 Ability to Restore Asset to Design LOS
Less than 4 hours. Service restored 4 hours to 24 hours.
Service restored between 24 to 48 hours.
Not able to restore service for >48 hours.
6 Location/Critical Facility Impact
No occupied areas; open space, streets.
Area of few residences and commercial establishments
Residential areas; extensive commercial areas (malls); industrial complexes.
High density residential (large apt complexes); schools, hospitals, and high profile public buildings (Capitol).

Scoring DOU has product oabove, coasset type
SCOR
C C T
Though thscoring mprocess th(4’s and 5such facto
/ Ranking M
adopted this f two quantit
ombined theyes. The risk e
RE (Asset Ris
Criticality RanCondition RanTotal Scoring R
he risk equatimethodology fhrough a cond5’s) received fors as condit
Methodolog
risk based apties: criticality
provide a ququation and m
sk) = (Critical
nge: 1 to 10 pnge: 1 to 5 poRange: 1 to 5
Table 6.
ion applies tofor wastewatedition based afrom NASSCtion, criticalit
y
pproach for ity and conditiuantifiable scmatrix are sho
lity: Consequ
points oints 50 points
Risk-Based
o most asset ter and storm dapproach that
CO’s Pipeline ty, and vulne
ts scoring meion. While ccoring outputown below.
uence of Failu
d Asset Prio
types for scodrainage pipet re-prioritizeAssessment C
erability. This
ethodology. Rcondition and t that helps ra
ure) x (Condi
ritization M
oring, rankinge infrastructures the initial lCertification s secondary r
Risk is genercriticality ha
ank and prio
ition: Likelih
Matrix
g, and prioritire includes a list based on Program (PAranking proc
rally defined ave been descritize a list o
hood of Failur
izing purposesecondary raits condition
ACP) that coness was purp
as the cribed of like
re)
es, the anking
score nsiders posely

designed to capture all failed assets including failed pipe segments that have a very low criticality score. Unfortunately, because the previously discussed risk based scoring methodology is weighted to favor criticality as the main rating factor, these non-critical failed segments never rank high enough on the CIP list compared to the more critical segments that have scored a good to excellent condition rating. As a result, the secondary process has been developed to specifically address and identify all failed assets and rank them accordingly.
C.1 Water Utility The City’s water treatment and distribution system is capable of processing about 255 million gallons of drinking water per day. The system includes pipelines, services, reservoirs, wells, and treatment plants. The entire system has a replacement value of about $3.3 billion and needs to be completely rehabilitated or replaced, on average, every 100 years. A significant portion of the utility’s infrastructure is at, or nearing the end, of its service life. As the infrastructure ages, it is becoming more difficult and expensive to maintain. DOU is systematically prioritizing and ranking its water infrastructure ensuring long-term sustainability of the water system as well as its ability to deliver the required level of services. The useful life of an asset can be estimated based on age, use and material, but many other factors related to environment and maintenance can affect the useful life of an asset. According to the EPA, it is not feasible to conduct a condition assessment of all water infrastructure. However, approximation tools can be used as a guide to estimate the useful life of asset types. Below is a useful life matrix developed by USEPA and the American Society of Civil Engineers (ASCE), which can serve as a tool for developing initial cost estimates and for long-range planning. Although the useful life of a component will vary according to the materials, environment, and maintenance, Table 7 below represents the industry’s best professional judgment as to the useful life of the components of a water system.
Table 7. Design Life of Water System Matrix Components
Years of design life
Reservoir and Dams 50-80 Treatment Plants – Concrete Structures 60-70 Treatment Plants – Mechanical and Electrical 15-25 Transmission Mains 65-95 Pumping Stations – Concrete Structures 60-70 Pumping Stations – Mechanical and Electrical 25 Distribution Mains 60-95 Source: US EPA Clean Water and Drinking Water Infrastructure Gap Analysis Report, September 2002 Pipes – Transmission Mains The transmission main system is considered more critical than the distribution system due to the larger impact on the overall system if a pipe were to fail.. To avoid any unplanned pipe replacement due to
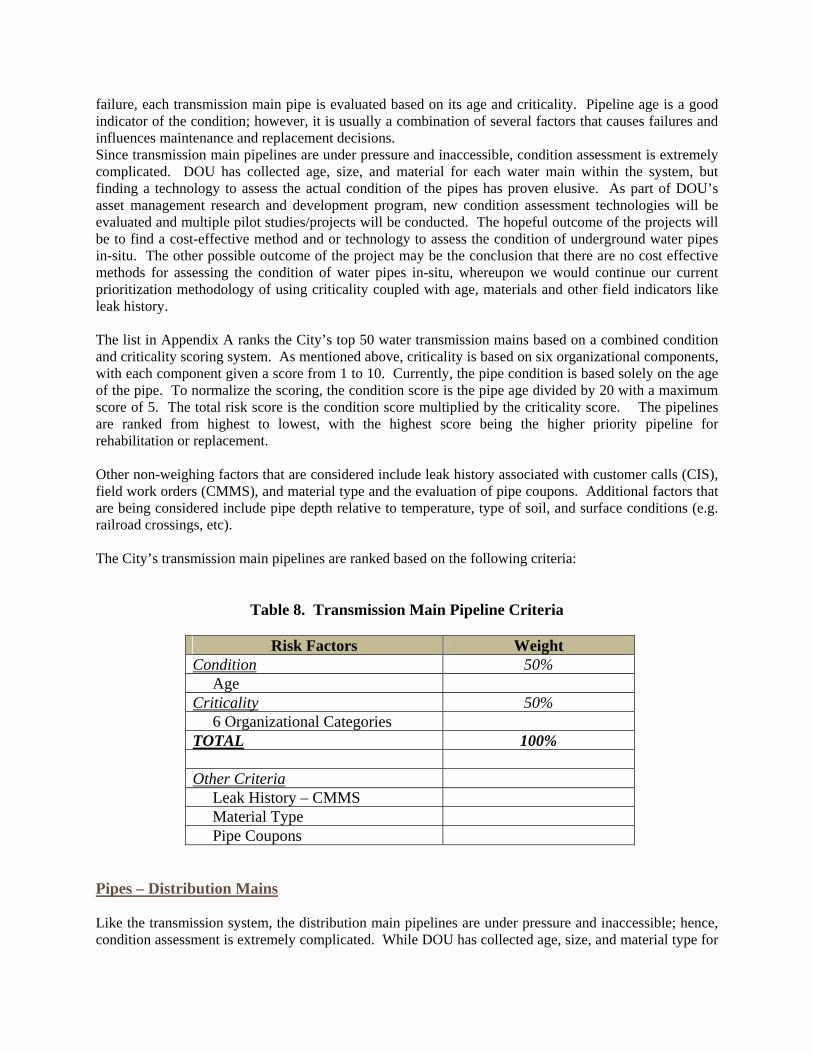
failure, each transmission main pipe is evaluated based on its age and criticality. Pipeline age is a good indicator of the condition; however, it is usually a combination of several factors that causes failures and influences maintenance and replacement decisions. Since transmission main pipelines are under pressure and inaccessible, condition assessment is extremely complicated. DOU has collected age, size, and material for each water main within the system, but finding a technology to assess the actual condition of the pipes has proven elusive. As part of DOU’s asset management research and development program, new condition assessment technologies will be evaluated and multiple pilot studies/projects will be conducted. The hopeful outcome of the projects will be to find a cost-effective method and or technology to assess the condition of underground water pipes in-situ. The other possible outcome of the project may be the conclusion that there are no cost effective methods for assessing the condition of water pipes in-situ, whereupon we would continue our current prioritization methodology of using criticality coupled with age, materials and other field indicators like leak history. The list in Appendix A ranks the City’s top 50 water transmission mains based on a combined condition and criticality scoring system. As mentioned above, criticality is based on six organizational components, with each component given a score from 1 to 10. Currently, the pipe condition is based solely on the age of the pipe. To normalize the scoring, the condition score is the pipe age divided by 20 with a maximum score of 5. The total risk score is the condition score multiplied by the criticality score. The pipelines are ranked from highest to lowest, with the highest score being the higher priority pipeline for rehabilitation or replacement. Other non-weighing factors that are considered include leak history associated with customer calls (CIS), field work orders (CMMS), and material type and the evaluation of pipe coupons. Additional factors that are being considered include pipe depth relative to temperature, type of soil, and surface conditions (e.g. railroad crossings, etc). The City’s transmission main pipelines are ranked based on the following criteria:
Table 8. Transmission Main Pipeline Criteria
Risk Factors Weight Condition 50% Age Criticality 50% 6 Organizational Categories TOTAL 100% Other Criteria Leak History – CMMS Material Type Pipe Coupons
Pipes – Distribution Mains Like the transmission system, the distribution main pipelines are under pressure and inaccessible; hence, condition assessment is extremely complicated. While DOU has collected age, size, and material type for

each water main within the system, a technology to assess the actual condition of the pipes has not yet been found. As part of DOU’s asset management research and development program, new condition assessment technologies will be evaluated in hopes of finding a way to cost effectively assess the condition of our pipelines. DOU is currently developing a new rehabilitation / replacement program to replace aging infrastructure that has exceeded its useful life based on a 100-year replacement cycle. Such factors being considered include age, material, leak history, and C-value testing along with the replacement of front yard mains within proposed water meter retrofit phases. DOU is coordinating the distribution pipe replacement program with the water meter retrofit program so that, to the extent possible, front yard distribution pipes that have met their end of useful life will be replaced in conjunction with the meter retrofits. Appendix A includes a list of distribution pipe replacement projects that fall within water meter retrofit program consisting of aged front yard distribution mains. Other factors considered in the prioritization process include leak history and pipe material. Meter Retrofit Program DOU is required by law to install water meters on all water service connections by January 1, 2025. DOU estimates that about 100,000 meters will be installed throughout the City to meet the requirements of this law. DOU will continue its present practice of abandoning backyard water mains and constructing new mains in the street when the mains require replacement on the lifecycle of the main, to provide for easier access to and maintenance of the main and associated facilities, with less disruption to City residents and their property. In areas where mains need to be relocated, water meters will be installed as part of the construction process. The remaining total cost for installation of water meters and moving of backyard mains is estimated to be $350 million, approximately $130 million to install meters in the sidewalks and approximately $220 million to abandon backyard mains and install new mains in the front of homes that require such work. Per the legislative mandate, this project is phased to be completed by 2025. Rates, fees and/or charges will be established by resolution of the City Council to fund the development and implementation of the phased meter installation program. The Capital Improvement Projects are developed for this program based on available funding as established by the City Council. Projects are prioritized based on three criteria established by the City Council which are spreading meter installation projects throughout the City, replacing aging water pipelines, and adding new meter installation projects that are adjacent to completed projects. A prioritized list of projects is included in Appendix A. Wells Although important to the City’s distribution system in some areas, the City’s well system has received little funding, maintenance, and oversight. In the past each well was operated until a mechanical failure occurred or water quality problems became apparent. Those wells critical to the distribution system were repaired or rehabilitated with limited success and put back into service. Wells that were not important to the distribution system were generally shut down.

In 2010, as a result of increasing regulatory and political pressure to minimize its withdrawals of surface water from the American and Sacramento Rivers, City policy changed from relying solely on surface water to a policy of conjunctive use. Conjunctive use is particularly important during drought years when surface water flows are below normal. The City’s goal is to be able to reliably produce 20 mgd from its wells. There are many criteria that are used to determine the value and condition of a well such as specific capacity, age, well efficiency, site characteristics, water quality, and type of construction. However, given the poor condition of the majority of wells, the City will focus initially on determining if wells critical to the distribution system can be rehabilitated to an acceptable level of performance. Once this is determined a more thorough program can be developed provided that adequate staffing and funding are available. A groundwater well’s hydraulic contribution to the distribution system is the most important criteria to determine the value of a well. Not all areas of the City’s distribution system can maintain adequate system pressure relying solely on surface water during times of peak demand. This is particularly true for the northeast area of the City north of the American River. Thus, wells serving these areas are essential to attaining year round satisfactory operation of the system. The majority of the twenty-seven wells currently operating are located in this region, with most over 40 years old. Since some areas of the City rely on nearby wells to provide adequate system pressure, the distribution system was modeled to determine which wells were most important to the system. From this analysis each well was given a value from one to three, one being very important. These results are provided in Appendix A. The top ten wells were chosen for further investigation to determine their current performance level and physical condition. Results from video observations and performance testing show that all ten wells are below accepted standards, and require below ground rehabilitation. In parallel with the below ground work, staff are designing improvements for new pumps, motors, chemical feed systems, electrical switchgear, and monitoring equipment where necessary at all sites that are successfully rehabilitated. The City will begin condition assessment on the next 10 top priority wells in 2012/13 while continuing rehabilitation on selected wells. Proposed funding for the program over the next three years is six million dollars. A normal life span for a well can range from 50 to 75 years depending on individual conditions at a well site. Generally, wells lose their productivity over time regardless of the effectiveness of rehabilitation. When a well does reach the point at which rehabilitation is not cost effective, a decision must be made whether or not a new well is needed. If a well was a good producer, had good water quality, is important to the distribution system, and is not threatened by any contaminant plumes it makes sense to locate a new well at the original site. Well sites meeting these criteria that do have adequate space for construction of a new well, a new water treatment system, or both are highly valued. Treatment Plants Due to the complexity of scoring, ranking and prioritizing the City’s water treatment plants, a consultant has performed a capacity optimization, remaining life, and reliability improvement study. In order to determine the remaining life, a thorough condition assessment evaluation was conducted at both the Sacramento River Water Treatment Plant (SRWTP) and E.A. Fairbairn Water Treatment Plant (EAFWTP). Condition assessments at SRWTP and EAFWTP were conducted in two phases. During each assessment phase the facilities/processes were assigned a condition score of 1 through 5. The condition ranking scale

used (Table 10) during the assessments was related to the percentage of the value an asset would need to be repaired or rehabilitated to its original operating condition. The ranking scale shown in Table 10 is a combination of industry standards and the City’s internal Condition Assessment/ Risk Analysis (CARA) program.
Table 10. Asset Condition Ranking Scale Capacity Optimization, Remaining Life, and Reliability Improvement Study
Ranking Description Percentage of
Asset Requiring Repair
1 Very Good Condition -Routine Maintenance 0% Maintenance needed to keep running
0%
2 Minor Defects - Routine Maintenance, minor 5% Maintenance needed to keep running
0-10%
3
Maintenance Required to Return to Accepted Level of Service - Routine Maintenance, moderate 10-20% Maintenance needed to keep running
10-20%
4 Requires Rehabilitation - Routine Maintenance, renewal 20-40% Maintenance needed to keep running
20-40%
5 Asset Unserviceable - Completely Failed, Unserviceable, >50% Maintenance needed to keep running
>50%
The CARA rankings do not utilize the exact same ranking descriptions, but are similar. For comparison, the CARA ranking definitions are shown in italics in the table. Those assets that scored a 4 or 5 were deemed to be in the poorest condition. Phase I was a general, overall condition assessment of the major facilities/processes at both plants based on City staff interviews and site visits. The major goal of Phase I was to broadly identify facilities/processes in poor overall condition with a ranking score of 4 or 5. Based on the condition ranking score each asset was assigned, an estimated remaining useful life was determined. The evaluated remaining useful life is the estimated remaining number of years until the physical failure of the asset and incorporates the current condition of the asset. The results from Phase I were then used to focus the Phase II condition assessment efforts. Phase II utilized the City’s CARA criteria and involved an in depth look at the components of each process to identify specific areas needing rehabilitation and/or replacement. The list in Appendix A contains a summary of the assets identified as being in the poorest condition and a brief description of the improvement projects recommended. Projects identified during the condition assessments were developed as improvement alternatives. The detailed results of the Phase I condition assessment can be obtained from the consultant’s TM No. 4 and Phase II in TM No. 5 (Appendix D Reference). The resulting construction project is under design.

Reservoirs (excluding water treatment plants) Currently, DOU does not have a scoring/ranking methodology in place for prioritizing its capital improvement projects for the eleven reservoirs. However, routine monthly preventative maintenance walk through inspections are conducted on the grounds and equipment as well as weekly inspections on levels, etc. Annual electrical maintenance inspections are conducted on motors, switchgear, and pumps. Additionally, each reservoir is inspected every three years and drained and cleaned every five years as recommended by American Water Works Association’s (AWWA) industry best practices. Although specific condition grading criteria has not been adopted, having an inspection program in place has enabled DOU to address and respond to immediate rehabilitation/replacement needs. Moreover, routine inspection assessments have resulted in numerous rehabilitation and replacement work including pipe replacement, internal reservoir lining, and structural work in recent past. DOU will be developing a scoring methodology, and routine and mandatory inspections will continue to be performed to assess the condition of the reservoirs to identify and prioritize rehabilitation and replacement needs.
C.2 Wastewater Utility The City of Sacramento has over 800 miles of pipeline that it operates and maintains that conveys wastewater to the Sacramento Regional County Sanitation District. The City’s wastewater system is very unique that it is only one of two Cities in California that has both a separated and combined wastewater system. A combined wastewater system collects sanitary sewage and stormwater runoff in a single pipe and includes capacity for primary treatment (solids settling, chlorination, and de-chlorination). Citywide, the combined and separated systems include approximately 255 and 572 miles of pipe, respectively. The City’s Combined Sewer System (CSS) is capable of processing about 500 million gallons of combined wastewater per day. The system includes conveyance, storage, pumping and treatment facilities and has a replacement value of about $1.4 Billion. The CIP program has two main drivers:
1. The NPDES permit which regulates the operation of the system and requires improvements outlined in the Long Term Control Plan (LTCP) and,
2. The Best Practices need to replace the system, on average, every 100 years As in water system, a useful life matrix tool can serve as a tool for developing initial cost estimates and for long-range planning. Although the useful life of a component will vary according to the materials, environment, and maintenance, matrices such as that shown in Table 11 below represent the industries best professional judgment and are used as a starting point for repair and replacement, strategic planning, and cost projections.
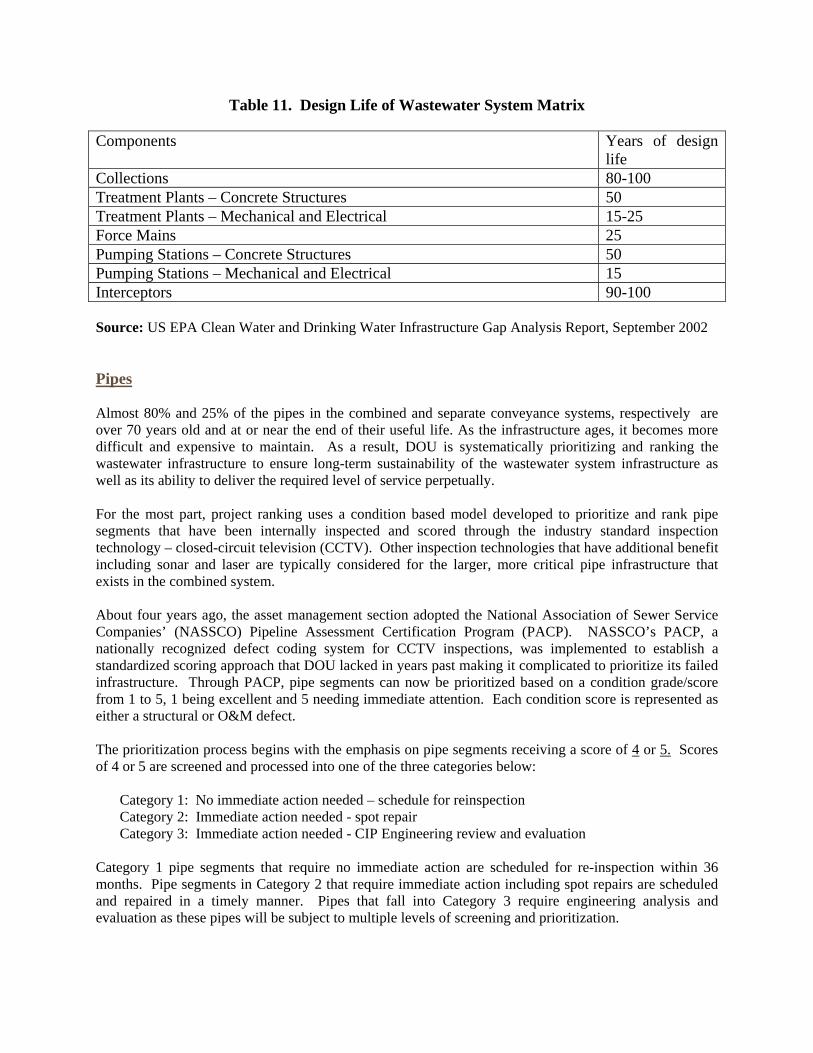
Table 11. Design Life of Wastewater System Matrix Components
Years of design life
Collections 80-100 Treatment Plants – Concrete Structures 50 Treatment Plants – Mechanical and Electrical 15-25 Force Mains 25 Pumping Stations – Concrete Structures 50 Pumping Stations – Mechanical and Electrical 15 Interceptors 90-100 Source: US EPA Clean Water and Drinking Water Infrastructure Gap Analysis Report, September 2002 Pipes Almost 80% and 25% of the pipes in the combined and separate conveyance systems, respectively are over 70 years old and at or near the end of their useful life. As the infrastructure ages, it becomes more difficult and expensive to maintain. As a result, DOU is systematically prioritizing and ranking the wastewater infrastructure to ensure long-term sustainability of the wastewater system infrastructure as well as its ability to deliver the required level of service perpetually. For the most part, project ranking uses a condition based model developed to prioritize and rank pipe segments that have been internally inspected and scored through the industry standard inspection technology – closed-circuit television (CCTV). Other inspection technologies that have additional benefit including sonar and laser are typically considered for the larger, more critical pipe infrastructure that exists in the combined system. About four years ago, the asset management section adopted the National Association of Sewer Service Companies’ (NASSCO) Pipeline Assessment Certification Program (PACP). NASSCO’s PACP, a nationally recognized defect coding system for CCTV inspections, was implemented to establish a standardized scoring approach that DOU lacked in years past making it complicated to prioritize its failed infrastructure. Through PACP, pipe segments can now be prioritized based on a condition grade/score from 1 to 5, 1 being excellent and 5 needing immediate attention. Each condition score is represented as either a structural or O&M defect. The prioritization process begins with the emphasis on pipe segments receiving a score of 4 or 5. Scores of 4 or 5 are screened and processed into one of the three categories below:
Category 1: No immediate action needed – schedule for reinspection Category 2: Immediate action needed - spot repair Category 3: Immediate action needed - CIP Engineering review and evaluation
Category 1 pipe segments that require no immediate action are scheduled for re-inspection within 36 months. Pipe segments in Category 2 that require immediate action including spot repairs are scheduled and repaired in a timely manner. Pipes that fall into Category 3 require engineering analysis and evaluation as these pipes will be subject to multiple levels of screening and prioritization.

Following the initial process above, the first step under Category 3 is to evaluate and determine the type of rehabilitation or replacement (R&R) work required. DOU has three R&R programs: pipe lining, pipe bursting, and pipe replacement. The decision as to which program a potential segment falls within can is mostly made based on engineering judgement using experience, evaluation and knowledge. For example: it may be effective from a cost and public relations standpoint to line a pipe through a residential backyard easement. However, if a portion of this pipe has collapsed or the pipe is hydraulically inadequate, it may be more practical and a better use of funds to burst or replace the pipe. The second step of the system is to prioritize and rank the potential pipe segments within each program. Since aspects of ranking pipe segments includes criteria that can be subjective, a method was developed that transfers subjective factors into a point system using a multi-level multiplication process based on three models – a defect model, a vulnerability model, and a criticality model. The method allows prioritization to be made based on a single model if, for example, defects are the priority issue, or in combination if the evaluator wishes to consider all the factors involved. The Defect Model assigns relative importance factors to each asset defect identified by NASSCO’s PACP. The Vulnerability Model and Criticality Model consist of a number of parameters that are selected and ranked subjectively based on engineering judgment, with consideration for DOU business policy. These two models help provide the answer to questions like “Which assets are costing the most to maintain and which assets may cost us most if a failure occurs?” The first level of the points system is to assign a weight that each model will contribute to the final score so that the total weights from all models equals 100%. The percent weight assigned to each model is shown in Table 11.
Table 11. Category 3 - Wastewater Pipeline Criteria
Model Weight (100%) Defect 50% PACP Defect Codes Vulnerability 30% SSO’s Inspection / CMMS Age Material Length Criticality 20% 6 Organizational Categories Other Criteria ** PACP Quick Rating Scores Sonar Laser Depth Surface conditions Type of Soil
** Criteria field has no weight factor associated with CIP prioritization. However, DOU is working to
incorporate each criterion into the defect and vulnerability categories

The second level of the points system is to identify parameters that generally characterize each model and then assign relative importance factors (from 1 to 10 max) that are used as multipliers or weighted factors to calculate the final CIP score as explained later. The third and final level of the points system is to identify categories that further define or describe each parameter and to assign rankings (1 to 10) to the categories. The categories are used as aids to standardize the assessments. Using engineering judgment, the most important parameter and category was assigned a 10, whereas a parameter and category that was judged to be “half as important” was assigned a 5 and so on. The selected parameters and categories for each model, along with their assigned importance factors and rankings, are summarized in Tables 12, 13, and 14.

Table 12. Defect Model Criteria DEFECT MODEL
Parameters Importance Factor
Category Ranking
Broken, Fractured and/or Cracked Asset
10
Collapsed pipe 10 Broken pipe with holes where soil or void is visible 9 Deformed pipe w/cracking ( >10% of pipe segment) 6 Deformed pipe w/cracking (=<10% of pipe segment) 5 Pipes exhibiting multiple cracks and/or factures (>10% of pipe segment)
4
Pipes exhibiting multiple cracks and/or factures (=<10% of pipe segment)
3
Deformed pipe (no cracking) 2 Isolated or occasional cracks and/or factures( >10% of pipe segment)
2
Isolated or occasional cracks and/or factures (=<10% of pipe segment)
1
Obstacles and Obstructions
6
Object protruding through wall 10 Object through connection/junction 8 Broken pipe or construction debris in invert 1 Object wedged in joint 1 Other 3
Root Intrusion 5
Heavy roots or root balls that obstruct >50% of flow area at joints (>10% of joints)
10
Heavy roots or root balls that obstruct >50% of flow area at joints (=<10% of joints)
8
Medium roots that obstruct 10% to 50% of flow area at joints (>10% of joints)
5
Medium roots that obstruct 10% to 50% of flow area at joints (=<10% of joints)
3
Fine roots at joints (>10% of Joints) 2 Fine roots at joints (=<10% of joints) 1
Infiltration/Inflow (I/I)
5
Gushing I/I 10 Running I/I 7 Dripping I/I 3 Weeping I/I 1
Grease and/or Debris Deposits
3
Grease deposits (>10% of pipe segment) 10 Fines, gravel or debris deposits (>10% of pipe segment) 5 Grease deposits (<10% of pipe segment) 3 Fines, gravel or debris deposits (<10% of pipe segment) 3 Rags or other deposits 1
Pipe Sags 4 Severe sag (camera submerged) 10 Medium sag (camera partially submerged) 5 Shallow sag (camera above water) 1
Offset and/or Separated Joints
3 Multiple offset or separated joints (>10% of joints) 10 Occasional offset/separated joints (=<10% of joints) 4 Isolated offset/separated joints 1
Corroded Asset 2
Concrete pipe where reinforcement is visible and projecting 10 Concrete pipe with projecting or missing aggregate 5 Concrete pipe with visible reinforcement (little or no steel corrosion) 4 Concrete pipe with viable aggregate and surface spalling 1

Table 13. Vulnerability Model Criteria VULNERABILITY MODEL
Parameters Importance Factor
Category Ranking
Upstream SSO or CSO Over Past 3 Years
10
11+ 10 6 – 10 9 4 – 5 8 2 – 3 7 1 5
Work Orders Over Past 3 Years
7
11+ 10 6 – 10 9 4 – 5 7 2 – 3 5 1 2
Scheduled Maintenance
6
Less Than 1 Month 10 1 to 6 Months 8 7 to 12 Months 6 13 to 24 Months 4 25+ Months 2
Pipe Age 6
81+ yrs 10 61 to 80 yrs 7 41 to 60 yrs 5 21 to 40 yrs 3 0 to 20 yrs 1
Pipe Material 4
VCP 10 PVC 5 Concrete 8 HDPE 5 Other Varies
Pipe Length 2
700+ ft 10 500 – 699 ft 8 300 – 499 ft 6 100 – 299 ft 4 0 – 99 ft 2

Table 14. Criticality Model Criteria CRITICALITY MODEL
Parameters Importance Factor
Category Ranking
Impact of SSO or CSO on Property
10
Catastrophic. Extensive and immediate sewer back-ups into many occupied dwellings. Long duration overflows onto streets in populated areas.
10
Critical. Back-ups into several dwellings or over extensive areas outside of buildings, but with some lag time.
7
Moderate. Brief period of overflow in non-populated area. No back-ups into buildings.
4
Negligible. Sewer surcharged for a brief time. No overflow or back-ups.
1
Environmental Regulation Impact
7
Catastrophic. Significant non-compliance resulting in administrative or consent orders. Long-term environmental impact
10
Critical. Violation brings strong warning from regulatory agency. Short-term environmental impact
7
Moderate. Violation must be reported but no enforcement action taken. No environmental impact
4
Negligible. Considered only a technical violation of permit or regulations. No environmental impact.
1
Health & Safety Impact
8
Catastrophic. Potential loss of life; severe injury or illness affecting numerous citizens.
10
Critical. Potentially severe injury or illness affecting a few citizens or employees.
7
Moderate. Potential minor injury to public. No illness among citizens.
4
Negligible. Potentially no adverse health affect on the public. 1
Economic Impact (Community and Utility)
7
Catastrophic. Long-term or area-wide economic impact on numerous businesses; adverse impact on economic vitality of community; major unplanned expense by the utility requiring allocation of reserves or borrowing.
10
Critical. Short-term economic impact on several businesses; no adverse impact on economic vitality of community; significant expense by the utility requiring budget modification or allocation of reserves.
7
Moderate. Short-term economic impact on a few businesses; no adverse impact on economic vitality of community; utility’s expense covered by reallocating within existing budget.
4
Negligible. No economic impact on the businesses or the community; utility’s expense covered by budgeted contingency funds.
1
Ability to Restore Asset to Design LOS
5
Catastrophic. Not able to restore service for >48 hrs. 10 Critical. Service restored between 24 to 48 hrs 7 Moderate. Service restored 4 to 24 hrs. 4 Negligible. Service restored in less than 4 hrs. 1
Critical Facility Impact
7
Catastrophic. High density residential (large apt. complexes); schools, hospitals, and high profile public buildings (i.e. capital).
10
Critical. Residential areas; extensive commercial areas (i.e. malls); industrial complexes.
7
Moderate. Area of few residences and commercial establishments. 4 Negligible. No occupied areas; open space, streets. 1

The CIP Score is calculated by the following equations:
Asset score from one model = Sumn [(Importance Factor) x (Category Ranking)] Where n = number of parameters selected for this model
Total CIP Score = Summ[(Asset score from each model) x (Weight of model)] Where m = number of models selected
Total normalized score = [(Total CIP score) / (Max score that can be obtained)] x 100 Max score = 383 The tables in Appendix B include the top ranked combined and separated wastewater pipes based on a combined condition, criticality, and vulnerability weight system. Sump 1, Sump 2 & Primary Treatment Plants (Combined System) Major combined system facilities such as Sump 1, Sump 2, Pioneer, and the Combined Wastewater Treatment Plant are crucial infrastructure assets. These highly critical facilities are essentially the backbone infrastructure that supports wastewater conveyance to the Sacramento Regional County Sanitation District (SRCSD). During heavy “wet” weather flows, each facility operates in coordination with one another depending on the maximum 60mgd flow sent to SRCSD. Hence, it is vital that all facilities are fully operational at any time of the year. Unlike sump facilities in the separated system that operate independently (basin), these four facilities are unique in that they operate collectively as one system. The priority list in Appendix B includes project rankings based on criticality of the facility’s process area. Once resources become available, DOU will work to complete the project priority list by including condition assessment scores for the various processes to determine the overall ranking score. For now, immediate rehabilitation and/or replacement needs are being captured through routine weekly inspections logged in Computerized Maintenance Management System (CMMS). Routine inspections have resulted in work that includes electrical switchgear upgrades, chemical feed upgrades, tank replacement, pump upgrades, and pipe replacement to name a few. Sumps (Separated System) DOU’s separated system collects sewerage in a separate pipe that is much different from the combined system. The separated system is comprised of multiple collection basins that mostly operate independently from one another. Basins that don’t operate independently are ones that directly flow into an adjacent basin. With over forty basins, a handful of the basins are gravity based and do not require any lifting of sewerage. These basins directly feed into the county’s interceptor pipe and is transported to SRCSD. These gravity basins do not require a sump station for that purpose. The remaining forty basins that require such lifting vary in capacity from as small as 3 horsepower up to 475 horsepower. Sump stations are prioritized and ranked under two categories: electrical and non-electrical. Electrical work typically includes switchgear, motor control centers, instrumentation, and lighting that are considered for replacement on a twenty-five year replacement schedule, a useful life much higher than US

EPA’s Gap Analysis Report of fifteen years. Though prioritization and ranking is largely based upon useful life, other factors including maintenance history is considered where applicable. This list can be found in Appendix B - Sump Stations Electrical. All other sump station work is prioritized and ranked based on criticality and condition criteria. To improve the level of detail, DOU is working to refine its prioritization and ranking methodology to include condition assessment scoring for individual assets within specific categories. For example, a sump having four motors with an average category score of 3 falls short of providing individual motor scores necessary to determine the condition for each of its motors. Ongoing inspections are being conducted on a weekly, monthly, and yearly basis. All work performed is being captured through CMMS. Routine inspections have resulted in work that includes electrical, pump impeller, and motor repair. Underground Storage Facilities Sump 77 Location: 42nd Street and R Street Capacity: approximately 1.5 MG In 1999, the City of Sacramento installed a 1.5 million gallons overflow basin running along R Street, parallel with the light rail, to prevent flooding in the area of 42nd and R streets. When storm conditions in the area exceed the capacity of the system, flows are routed via weir into Sump 77 for storage and later pumping back to Sump 2. When the storm is over and the system is back within its normal operating range, two 6 horsepower pumps (1350 gpm each, 1.9 mgd) convey water from cell 1 back into the combined system. This is done via a 10” force main, which pumps into a 48” pipeline to Sump 2. Sump 78 Location: 49th Street and V Street Capacity: approximately 3 MG The flood prevention project at the UC Davis Medical Center is designed to assist with high levels of combined sewer flows in the area north of 51st and V streets, as well as provide relief for the storm drain in the local UC Davis Medical Center area. Sump 78 was constructed and placed into service in 2000 and is designed to hold 3 million gallons. When storm conditions in the area exceed the capacity of the system, flows begin to be routed via weir level into Sump 78 for storage and later pumping back to Sump 2. When the storm is over and the system is back within its normal operating range, two 30 horsepower pumps (3325 gpm each, 4.8 mgd) convey water from cell 1 back into the combined system. This is done via a 16” force main, which pumps into a 57” pipeline to Sump 2. Broadway Inline Storage Location: Broadway from Santa Cruz Way to 58th Street, 44th Street from 8th Avenue to 13th Avenue, 46th and 47th Streets from 12th Avenue to 13th Avenue, Stockton Blvd from 10th Avenue to 13th Avenue, 53rd Street from Broadway to 12th Avenue, Tahoe Park from 8th Avenue to 10th Avenue, Capacity: XX MG Constructed in 2000

C.3 Storm Drainage Utility The drainage system includes stormwater and non-stormwater (irrigation runoff, dewatering, etc.). The system is unique, because most of the City is protected by levees, and hence, approximately 95% of the drainage must be pumped into a local creek or river. There are approximately 100 drainage pump stations in the City. Because of the pumps, the system is expensive to operate and maintain and is particularly vulnerable to flooding due to pump station failure. The entire system has a replacement value of about $1.0 billion and needs to be completely rehabilitated or replaced on an average of every 100-150 years (the conveyance systems have a longer expected life than the pump stations). The system includes pipelines, channels, ditches, pump stations, levees, and detention basins. Since the passage of Proposition 218 in 1996, drainage rates have remained unchanged and the storm drainage system has seen a significant drop in its capital improvement program. Rising operation and maintenance and regulatory compliance costs now consume almost all of the storm drainage fund revenues. Meanwhile, the storm drainage infrastructure continues to age. Without rate increases or other funding sources, little or no funding for capital improvement projects will be available, further impacting the system’s ability to provide the levels of service adopted by the City Council. To effectively and efficiently allocate drainage funding, the asset management section in conjunction with Field Services is systematically prioritizing and ranking the drainage system. Assuming that funding issues are eventually resolved, this approach will ensure the long-term sustainability of the drainage system infrastructure and its ability to deliver the required level of service perpetually.
Levels of Service In the mid 1990’s the City Council adopted 10 and 100 year levels of service for the drainage system as follows:
1. In a 10-year storm event (a storm which has a 10% chance of occurring each year) storm water should not rise higher than the street curb.
2. In a 100-year storm event (a storm which has a 1% chance of occurring each year) storm water should not damage any structures.
There are about 100 drainage basins in the City and only about 40% have drainage master plans completed. The drainage master plan studies the drainage infrastructure in a given basin, identifies system deficiencies and defines projects needed to meet the 10 and 100 year levels of service. Extrapolating from the basins that have been master planned to the whole system, there are about $350 million worth of projects that are needed to meet the 10 and 100 year levels of service. Pipes As with the water and wastewater infrastructure, the project ranking system includes a combination of pipe condition (likelihood of failure) and criticality (consequence of failure). The implementation of this prioritization of drainage projects is currently in a state of transition, as the focus of the drainage CIP program has been system improvements (See Section B - Improvements in this section). DOU is just beginning efforts to assess the condition and criticality of the drainage system. Having identified the pipes in the system, DOU is in the process of assessing the condition of different

representative categories of pipe to ascertain where assessment efforts would be best focused first. The categories include:
Large diameter concrete pipes, not normally submerged Small diameter concrete pipes, not normally submerged Large diameter concrete pipes, submerged Small diameter concrete pipes, submerged Non concrete pipes
By way of explanation, groundwater tables in parts of the City, like the Pocket and North Natomas areas are very high leaving the drainage pipes partially or completely submerged at certain times of the year. Once these initial assessments have been completed, DOU can prioritize the systematic assessment of the system starting with the categories that are found to be most vulnerable to aging. Sumps DOU’s drainage system is comprised of over 100 collection basins that mostly operate independently from one another. Basins that don’t operate independently are ones that directly flow into an adjacent basin. With over 100 different basins, 29 basins are gravity based and do not require any pumping of stormwater. These basins directly feed into nearby creeks or rivers or flow into channels pumped by other agencies like Reclamation District 1000 in North Natomas. These gravity basins do not require a city operated sump station. Sump stations are prioritized and ranked under two categories: electrical and non-electrical. Electrical work typically includes switchgear, motor control centers, instrumentation, and lighting that are considered for replacement on a twenty-five year replacement schedule, a useful life much higher than US EPA’s Gap Analysis Report of fifteen years. Though prioritization and ranking is largely based upon useful life, other factors including maintenance history is considered where applicable. This list can be found in Appendix C - Sump Stations Electrical. All other sump station work is prioritized and ranked based on criticality and condition criteria. To improve the level of detail, DOU is working to refine its prioritization and ranking methodology to include condition assessment scoring for individual assets within specific categories. For example, a sump having four motors with an average category score of 3 falls short of providing individual motor scores necessary to determine the condition for each of its motors. Ongoing inspections are being conducted on a weekly, monthly, and yearly basis. All work performed is being captured through CMMS. Routine inspections have resulted in work that includes electrical, pump impeller, and motor repair. Detention Basins By way of the drainage master planning process, over 90 detention basin locations have been identified within the City. To date, basins have been constructed on nearly three quarters of the identified sites. DOU is continuing to complete master plans for all drainage basins within the City, so it’s anticipated additional candidate basin sites will be identified.

Detention basins typically serve as storage facilities to reduce street/structure flooding and reduce the required pumping capacity in drainage sump stations. In essence, basins are wide holes in the ground that do not require pumping to fill with stormwater. Some City basins are dry multi-use facilities that offer park/recreation facilities like grassy soccer/softball/or open park fields the majority of the year, with only short periods of submergence during major rain events. Other basins are wet year round, but they typically contain lots of freeboard and adjacent open overbank areas that can serve to store peak flows just like the dry basins. Wet basins typically serve a secondary ‘water quality’ function. Water quality treatment is generally accomplished by long storage periods in the basins that serves to remove or reduce sediment and volatile organic compounds from the stormwater prior to discharge to a creek or river. Both basin types require continuous maintenance. The basins are typically landscaped to some degree, ranging from simple non-irrigated grass on the basin floor and side slopes, to fully irrigated ornamental bushes/trees/ and lawn areas. The basins typically have inlet/outlet structures that require maintenance, and wet basins often require different summertime/wintertime outlet weir level settings. Trash removal after storm events and annual mowing by DOU for fire suppression is the basic level of maintenance. More intense landscaping and recreation uses generally require a correspondingly higher level of maintenance. Wet basins require water quality monitoring and mosquito abatement activities, and DOU staff are tasked with adjusting the different outlet weir levels. Where there are identified benefits to specific neighborhoods, DOU has tried to establish homeowner maintenance districts that pay for some of the costs above the basic maintenance level. Although DOU considers the detention basins to be valuable assets, there’s no criticality or condition assessment formula applicable to them. As indicated, the basins are holes in the ground that should last indefinitely. Wet basins may eventually require dredging to remove accumulated sediments, but not any time soon. Landscaping is maintained as an operating expense (paid by homeowner association assessments where applicable). Since most of the basins are less than 15 years old, the inlet/outlet structures are still young compared to their anticipated 75-100 year service lives. DOU is in the process of developing condition assessment surveys that will facilitate prioritization of future inlet/outlet rehab or replacement CIPs. Ditches / Channels DOU continues to operate and maintain more than a half dozen manmade open drainage ditches and channels. These include the PG&E ditch (gunite lined); the John Still Ditch (earth lined); the Sears Ditch (gunite lined); the Brannan Ditch (unlined); the Executive Airport ditch (primarily earth lined); the South Pocket Drainage canal (gunite lined); the Sac State ditch (unlined); and the Willow Slough/South Sacramento Drainage Canal (partially gunite lined). These ditches when full contain water more than 3-feet in depth. The City’s drainage design standards no longer allow new drainage ditches with flows as deep as these to be planned or constructed, unless they are part of a larger landscaped amenity such as a park or greenbelt. Most of the ditches/channels that DOU maintains now as open conveyance facilities, date back to either old reclamation district channels from when existing neighborhoods were farming areas, or when new developments reclaimed land by realigning old streambeds into straighter facilities compatible with planned street alignments. The City’s Department of Transportation maintains shallow (typically less than 3’ deep) roadside ditches in those neighborhoods without curb & gutter facilities. Annual maintenance consists of trash and weed removal, and repair of the gunite or concrete type linings. Condition of the lining, which is intended primarily to halt erosion, is inspected annually as part of the
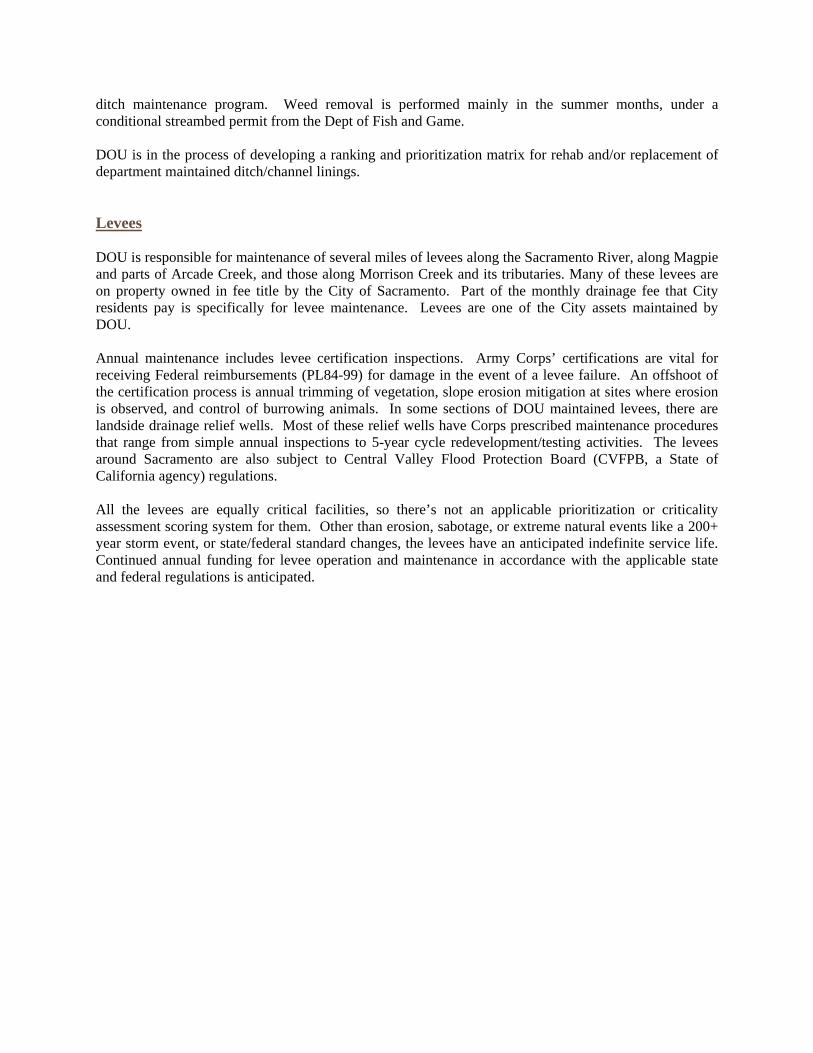
ditch maintenance program. Weed removal is performed mainly in the summer months, under a conditional streambed permit from the Dept of Fish and Game. DOU is in the process of developing a ranking and prioritization matrix for rehab and/or replacement of department maintained ditch/channel linings. Levees DOU is responsible for maintenance of several miles of levees along the Sacramento River, along Magpie and parts of Arcade Creek, and those along Morrison Creek and its tributaries. Many of these levees are on property owned in fee title by the City of Sacramento. Part of the monthly drainage fee that City residents pay is specifically for levee maintenance. Levees are one of the City assets maintained by DOU. Annual maintenance includes levee certification inspections. Army Corps’ certifications are vital for receiving Federal reimbursements (PL84-99) for damage in the event of a levee failure. An offshoot of the certification process is annual trimming of vegetation, slope erosion mitigation at sites where erosion is observed, and control of burrowing animals. In some sections of DOU maintained levees, there are landside drainage relief wells. Most of these relief wells have Corps prescribed maintenance procedures that range from simple annual inspections to 5-year cycle redevelopment/testing activities. The levees around Sacramento are also subject to Central Valley Flood Protection Board (CVFPB, a State of California agency) regulations. All the levees are equally critical facilities, so there’s not an applicable prioritization or criticality assessment scoring system for them. Other than erosion, sabotage, or extreme natural events like a 200+ year storm event, or state/federal standard changes, the levees have an anticipated indefinite service life. Continued annual funding for levee operation and maintenance in accordance with the applicable state and federal regulations is anticipated.

SECTION IV: SELECTED PROJECTS FOR FIVE
YEAR CAPITAL IMPROVEMENTS PROGRAM
AND IMPLICATIONS FOR FUTURE DIRECTION Now that a detailed description of the City of Sacramento’s Department of Utilities has been completed, a high level explanation of how the staff, the Utility Rate Advisory Committee, and the City Council went about the analysis and development of a strategy to improve the City’s utility infrastructure has been finished, and a description of how the various projects were scored, ranked, and prioritized has been done, this section will describe the final Capital Improvements Program that was selected and approved. In addition, this section will discuss the broader implications of the engineering and financial decisions that have been approved for the Department of Utilities (DOU) as well as the future directions of the department given these decisions.
A. SELECTED PROJECTS FOR FIVE YEAR CIP As mentioned in earlier sections of this Capital Improvement Programming Guide the City Council has now proposed a 30 year capital investment plan for utilities which will serve as a planning tool and a guide for the shorter term programs to ensure that are consistent and incrementally keeping pace with the need to invest in the City’s critical infrastructure. In addition, a specific five year capital improvement program has been proposed for each utility. Both the 30 year capital investment plan and the details of the specific five year capital improvement programs which include the project scores and rankings as well as the specific project profiles have been included in the respective appendices for each utility at the end of this programming guide. As mentioned before, this Capital Improvement Programming Guide presents both a long-term and short-term investment strategy (30-year – 3-year strategy) for incrementally improving the utility infrastructure of the City. The long-term strategy is the 30-year Capital Investment Plan which includes projects/programs mandated by legislation and/or regulations, improvements for replacement based upon industry best practices for system replacement, and improvements to meet required levels of service. The short-term strategy is the specific 5-year Capital Improvement Program for water, wastewater and drainage that has been developed to be implemented over the next five years. The City Council has now adopted a 3-year rate increase schedule for both water and wastewater in order to implement the first 3 years of the 5-year CIP. The rate schedule is part of a comprehensive finance plan that uses a mix of bond and cash financing to carry finance the short-term improvements while smoothing rate increases and avoiding rate spikes for the utility customers. However, in adopting the rate schedule the City Council directed the Department of Utilities to scale back the 5-year program to ensure that the 3-year rate schedule was self-contained and would fund the first 3 years of the CIP without any residual bond/cash obligations extending beyond the 3 year period of time. Therefore, the Department of Utilities was required to scale back the projects and programs by $8.2

million within the first 3 years of the CIP to match the revenues generated by the 3-year rate schedule without any carryover obligations into years 4 or 5. However, it is important to clarify that this document does not reflect a reduction in the recommended 5-year CIP or the 30-year Investment Plan. The projects/programs that were necessarily reduced to bring the 3-year projects/programs within the 3-year funding limitations were not cancelled, but were deferred to later years so that the total 5-year CIP and 30-year Investment Plan remain unchanged. The Utilities’ staff will attempt to seek additional grant funding and/or funding from other sources in order to fund the project/program reductions resulting from the adoption of the self-contained 3-year rate schedule. Water As mentioned above this programming guide has proposed a 30 capital investment plan and a specific five year capital improvement program for each utility. For the water utility the 30 year capital investment plan and the specific five year capital improvement program including detailed project scores and rankings as well as project profiles have been included in Appendix A: Water. For the reader’s benefit, we have summarized the five year capital improvement program for the water utility in the chart below:
FY 2012/13 FY 2013/14 FY 2014/15 FY 2015/16 FY 2016/17
Distribution/Transmission Mains
$ 2.4m $ 4.8m $ 1.9m $ 9.8m $ 29.8m
Meter Retrofit Program $ 13.9m $ 19.0m $ 24.1m $ 34.5m $ 34.5m
Treatment Plants $ 150.6m $ 1.1m $ 1.1m $ 18.6m $ 0.0m
Reservoirs $ .1m $ .1m $ .1m $ .1m $ .1m
Wells $ 3.0m $ 3.0m $ 1.0m $ 3.0m $ 2.0m
Misc $ 5.0m $ 4.3m $ 2.5m $ 4.9m $ 6.8m
Total $ 175.0m $ 32.3m $ 30.7m $ 70.9m $ 73.2m
Wastewater As mentioned above this programming guide has proposed a 30 capital investment plan and a specific five year capital improvement program for each utility. For the wastewater utility the 30 year capital investment plan and the specific five year capital improvement program including detailed project scores and rankings as well as project profiles have been included in Appendix B: Wastewater. For the reader’s benefit, we have summarized the five year capital improvement program for the wastewater utility in the chart below:

FY 2012/13 FY 2013/14 FY 2014/15 FY 2015/16 FY 2016/17
Combined/separated Pipes $ 8.0m $ 14.6m $ 4.5m $ 15.8m $ 25.7m
Sumps 1 & 2 $ .3m $ .3m $ .3m $ .3m $ .3m
Sumps $ .6m $ .6m $ .2m $ .2m $ .4m
Primary Treatment Plants $ .6m $ .5m $ .4m $ .4m $ .1m
Misc Regulatory $ .6m $ .4m $ .4m $ .4m $ .1m
Misc $ 1.8m $ 1.5m $ .9m $ 1.5m $ 1.9m
Total $ 11.9m $ 17.9m $ 6.7m $ 18.6m $ 28.5m
Note: Due to rounding, totals may not add up.
Storm Drainage As mentioned above this programming guide has proposed a 30 capital investment plan and a specific five year capital improvement program for each utility. For the storm drainage utility the 30 year capital investment plan and the specific five year capital improvement program including detailed project scores and rankings as well as project profiles have been included in Appendix C: Storm Drainage. For the reader’s benefit, we have summarized the five year capital improvement program for the storm drainage in the chart below:
FY
2012/13 FY
2013/14 FY
2014/15 FY
2015/16 FY 2016/17
Pipes $ 0.0m $ 0.0m $ 0.0m $ 0.0m $ 0.0m
Sumps $ 0.0m $ 0.0m $ 0.0m $ 0.0m $ 0.0m
Ditches/Channels $ 1.0m $ 0.0m $ 0.4m $ 0.0m $ 0.0m
Misc $ 1.4m $ 1.5m $ 1.1m $ 0.0m $ 0.0m
Total $ 2.4m $ 1.5m $ 1.5m $ 0.0m $ 0.0m

B. IMPLICATIONS FOR FUTURE DIRECTION In early 2011 the Department had a fundamental paradigm shift regarding the CIP program. This shift at least partly stemmed from several audits of the department, which stated that the Department’s financial position was weak, that our fund reserves were inadequate and that our Capital program was not sustainable. In the past, capital spending was driven largely by how much money was left over after the maintenance and operation budgets were funded and which projects absolutely had to be done. The capital focus went from, how much money do we have left to spend on capital improvements to, how much should we be spending on capital improvements and what projects should we be doing? Another way to characterize the shift is that we went from a largely reactive capital program to a proactive one. The answer to the question, “How much should we be spending on capital improvements?” had three main components, or drivers:
1. What capital improvements do we have to do (i.e. what is required by regulation or legislation)? 2. How much do we need to spend on critical repairs to the Sacramento River and Fairbairn Water
Treatment Plants? and, 3. What is the replacement value of our system and what is its life cycle, or how much do we need
to spend, on average, per year to sustain our system? The answer to the first two questions was relatively straight forward. The City is subject to litigation that requires the installation water meters on every water service by the year 2025. City also has various federal discharge permits managed by DOU that require certain levels of capital expenditure for compliance. Capital expenditures required to comply with one of the permits, namely the Wastewater Discharge Requirement (WDR) that governs the operation of the separated wastewater system, was further defined and accelerated by a consent decree stemming from litigation against the City by the California Sportfishing Protection Alliance. DOU was also already in the process of designing critical improvements to the water treatment plants. The answer to the third question involved estimating the replacement values of our water, wastewater and drainage system and determining the average useful life of the components of those systems. To determine the average useful life of the components of the system, DOU looked at the ASCE/EPA national infrastructure report cards and based on this and experience with the system, settled on a conservative replacement schedule for water and wastewater of 100 years. That is, annual capital expenditures need to be such that the systems are fully rehabilitated or replaced on average, every one hundred years. The formula for the annual expenditures needed to accomplish this is; system replacement cost, divided by the average useful life = annual expenditure needed to sustain the system. For instance, the estimated replacement value of our water system is $3.3 billion and the average useful life is 100 years. Using the formula, DOU should be spending an average of $33 million each year on rehabilitation to the water system. The term coined by DOU for these sustainable annual capital expenditures was “Best Practices” levels of expenditure. While doing these calculations, another fact became very apparent, which collaborated the audit finding; DOU’s capital expenditures are woefully inadequate to sustain our systems. The current rate of water capital expenditures will replace the system every 400 years and the current rate or wastewater capital expenditures with replace the system every 650 years. Over the past 3 years, DOU has been developing an asset management program to systematically identify the components of the utility systems, assess their condition, rate their criticality and rank them for targeted rehabilitation based on their condition and criticality. While not fully complete, this ranking
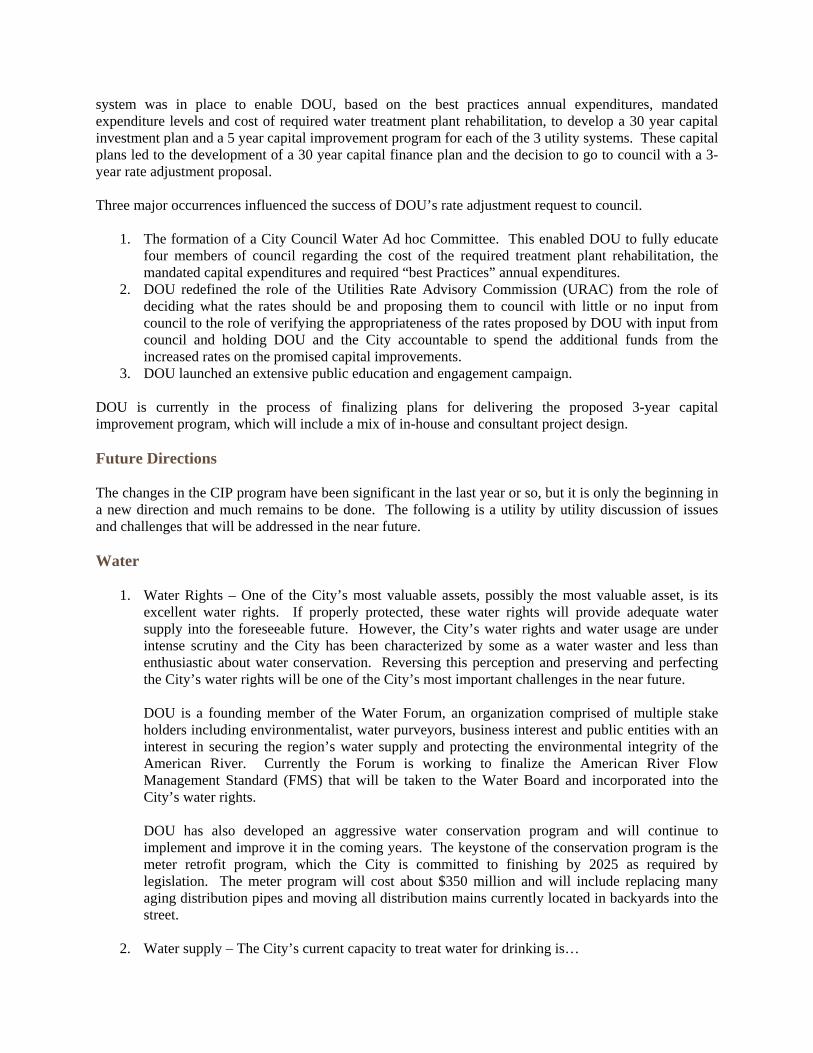
system was in place to enable DOU, based on the best practices annual expenditures, mandated expenditure levels and cost of required water treatment plant rehabilitation, to develop a 30 year capital investment plan and a 5 year capital improvement program for each of the 3 utility systems. These capital plans led to the development of a 30 year capital finance plan and the decision to go to council with a 3-year rate adjustment proposal. Three major occurrences influenced the success of DOU’s rate adjustment request to council.
1. The formation of a City Council Water Ad hoc Committee. This enabled DOU to fully educate four members of council regarding the cost of the required treatment plant rehabilitation, the mandated capital expenditures and required “best Practices” annual expenditures.
2. DOU redefined the role of the Utilities Rate Advisory Commission (URAC) from the role of deciding what the rates should be and proposing them to council with little or no input from council to the role of verifying the appropriateness of the rates proposed by DOU with input from council and holding DOU and the City accountable to spend the additional funds from the increased rates on the promised capital improvements.
3. DOU launched an extensive public education and engagement campaign.
DOU is currently in the process of finalizing plans for delivering the proposed 3-year capital improvement program, which will include a mix of in-house and consultant project design. Future Directions The changes in the CIP program have been significant in the last year or so, but it is only the beginning in a new direction and much remains to be done. The following is a utility by utility discussion of issues and challenges that will be addressed in the near future. Water
1. Water Rights – One of the City’s most valuable assets, possibly the most valuable asset, is its excellent water rights. If properly protected, these water rights will provide adequate water supply into the foreseeable future. However, the City’s water rights and water usage are under intense scrutiny and the City has been characterized by some as a water waster and less than enthusiastic about water conservation. Reversing this perception and preserving and perfecting the City’s water rights will be one of the City’s most important challenges in the near future.
DOU is a founding member of the Water Forum, an organization comprised of multiple stake holders including environmentalist, water purveyors, business interest and public entities with an interest in securing the region’s water supply and protecting the environmental integrity of the American River. Currently the Forum is working to finalize the American River Flow Management Standard (FMS) that will be taken to the Water Board and incorporated into the City’s water rights. DOU has also developed an aggressive water conservation program and will continue to implement and improve it in the coming years. The keystone of the conservation program is the meter retrofit program, which the City is committed to finishing by 2025 as required by legislation. The meter program will cost about $350 million and will include replacing many aging distribution pipes and moving all distribution mains currently located in backyards into the street.
2. Water supply – The City’s current capacity to treat water for drinking is…

3. Asset Management (AM) – The biggest challenge in water asset management is assessing the
condition of the underground transmission and distribution mains. This has been discussed in the Research and Development section. The AM section will be moving forward to develop a reliable, cost effective assessment technology for underground pressurized pipes. We are confident that we will either find such a technology, or prove to ourselves that such technology does not exist. Once that question is answered we will move forward accordingly.
4. Well Rehab – The City currently has 27 drinking water wells that are capable of producing up to 20 MGD. These wells are of great value to the City in that they allow the City to meet peak demand during times when the flow in the rivers is low. Maintenance on the wells has been deferred for years and a key goal in the near future will be to systematically rehabilitate these wells. The first 10 have already been assessed and 4 are currently being rehabilitated. Some wells may not be able to be rehabilitated and a replacement well will need to be evaluated.
Wastewater
1. Permit compliance – The biggest single challenge in the wastewater system is complying with NPDES permits that regulate the operation of both the separated and combines wastewater system.
a. Separated system WDR – This permit mandates that SSOs in the system be eliminated. This may not be entirely possible, but the WDR (and litigation) requires the City to spend significant money and resources to ensure that there are as few SSOs from the system as possible. This will require the City to spend $10m to $15m per year on this effort in perpetuity.
b. Combined Sewer NPDES – This permit requires that the system be improved to minimize system outfalls (combined flow leaving the system into the streets) and overflows (untreated discharges into the Sacramento River). These system upgrades rehabilitation will require the City to spend about $15m per year for the foreseeable future.
Other Cities in the country that have not complied with similar permit requirements have been faced with consent decrees forcing them to spend hundreds of millions or billions of dollars on system rehabilitation and improvement.
2. Asset Management – The WDR controlling the separated system requires that the condition of the entire system be assessed by 2017 and pipes likely to fail immediately must be repaired, rehabilitated or replaced within 6 months of the assessment. Engineering services is working with Field Services to get all of the pipes assessed and then also work with field on processing the failed pipe. It will then be critical to budget an appropriate amount of CIP money to ensure the rehabilitation or replacement takes place within the 6 months. These types of projects will likely control the separated wastewater CIP until funding levels are adequate for “Best Practices” rehab or replacement of the system.
The other focus of wastewater asset management in the near future will be to work with Field Services and IT to ensure that the field assessments are coming to the engineering services division accurately and in a form that is easily processed and that there are adequate personnel resources in the asset management section for that processing.
3. Master Planning – Big challenge

Storm Drainage
1. Levels of Service – Currently less than a third of the system meets the 10 and 100 year levels of service and it is estimated that there is $300-500 million in capital improvements that will be needed to meet these levels of service. The current plan is to raise levels of spending on drainage CIP to Best Practices levels or about $12.5 million per year. This would allow DOU to address approximately $300 million of those improvements over the next 30 years.
2. Master planning – Currently, only 40% of the drainage basins are master planned. ESD is proposing to spend $1 million per year starting in FY 14/15 until the master planning is done. This will require additional personnel resources to manage the master planning
3. Prop 218 restrictions on rate increases – The biggest hindrance to accomplishing #s 1 and 2 is the requirement to have drainage rate increases approved by the voters. The drainage fund has not had a rate increase since Prop 218 passed in 1996 and currently there is no funding for capital expenditures. There is a modest amount being spent on CIPs but it currently resulting in decreasing fund reserves. DOU proposes to take a rate increase to the residents of the City within the next two years. This will necessitate finishing the drainage rate structure study that is underway and developing an outreach and education strategy to inform the public of the need for the capitol improvements and commensurate rate increases.
4. Asset management – The condition assessment of the drainage system to date has focused on the pump stations. The electrical and mechanical portions of the pump stations have a useful life of 20-30 years. There are about 100 drainage pump stations and they currently are scheduled for electrical and mechanical rehabilitation every 25 years or so. Stations improvements are identified in the master plans and scheduled as funding allows. The assessment of the underground pipes is just beginning and will follow the same pattern and scoring protocol as the wastewater pipes. Because the flow in drainage pipes is not corrosive like wastewater pipes or under pressure like water pipes, the likelihood of failure is less than those other systems.
5. Assessment of pipes through levees – The Army Corps of Engineers is requiring all owner of pipes that go through levees to assess the condition of the pipes and report to the Corps. The Asset Management Section is working with Field Services to perform these assessments. They must be completed by 2015/2016.
General A recent workload assessment exercise produced some important findings concerning our current and proposed capital program:
1. We do not have nearly enough design engineers to develop and deliver all of the proposed 5-year capital program
2. Our Asset Management section is understaffed 3. Our Water Quality section is understaffed 4. Field services needs more engineering support in water conservation and permit compliance. 5. IT is understaffed 6. Drainage, Sewer and Water master planning is understaffed
The exercise showed a total FTE deficit in year 5 of the proposed program of about 24, mostly engineers.

In the coming months DOU will be doing a department-wide organizational assessment, which will include plans to address FTE deficits in the Engineering Services Division. Included in this analysis the Engineering Services Division will need to analyze its project development and project delivery systems to maximize the efficiency of personnel and to fully staff critical project development functions, which are currently understaffed, especially the above mentioned planning and asset management functions. This analysis will need to include decisions about appropriate levels of contracting for delivery and design and re-evaluation of current delivery and design models, as well as succession planning. The Engineering Services Division is currently involved in a benchmarking group that includes several municipalities with similar operations as the City including DOU and DOT functions. Continued participation in this group should assist in decision making moving forward.
SECTION V: FINANCIAL PLAN / RATES The Department engaged the FCS Group to assist in developing a multi-year rate forecast for the City’s water, wastewater, and storm drainage funds. Although the forecast spans multiple years, the rate plan proposed in this study is for the Fiscal Years (FY) 2012/13 through 2014/15. The study and process for adopting utility rates consists of three distinct elements and deliverables:
Financial Policies Review Revenue Requirements (Needs) Forecast Rate Adjustment Process
The complete study prepared by the FCS Group, dated __________ has been incorporated by reference, and therefore this section presents only a summary of their “Executive Summary” included with their full report. Also, adjustments were made to reflect that the City Council approved a 30 year general plan, a five year Capital Improvement Program, and a three year rate increase for the water and wastewater utilities. FCS Group worked closely and collaboratively with City staff throughout the course of this study. The recommendations and findings of this report are based on information and data gathered as part of this study, as well as utility industry best practices. The study findings illustrate a range of rate increases intended to provide an optimal balance between acceptable rate increases and the protection of public health and safety as well as maintaining the longevity of each utility’s infrastructure. The recommendations are based on a point in time analysis and should be adjusted over time as the capital improvement program and corresponding funding program is implemented and adjusted. The intended use of this study and report is to provide the City with financial guidance as it implements the approved utility rate increases. Utility operations and capital needs typically change over time dependent upon a number of variables, such as new development, construction costs, bond issuance costs, and labor contracts. As such, the financial forecast and corresponding rate projections should be revisited periodically to ensure that the City’s financial obligations are met, as well as that an optimal balance between user rates and fiscal requirements is achieved. The analysis described within this report is based on implementing rate increases July 1 for each year.
A. FINANCIAL POLICIES A financial policies review was developed for the Department in connection with the study for the water, wastewater, and storm drainage funds. Financial policies are fundamental to good financial management and provide a standard for assessing fiscal performance. These policies will serve as guidelines for operational and strategic decision-making that identify acceptable and unacceptable courses of action. Further, establishing financial policies and funding recommended reserve policies will promote stability, continuity, predictability, and long-term sustainability of the utility funds. Utility reserve policies are intended to create a measure of safety and security for the uncertain events of the future that impact a utility’s financial health. Reserves can also address variability and timing of expenditures and receipts of revenues, as well as occasional disruptions in activities, costs, or revenues. The general objectives of these policies are to facilitate stable and predictable rates and funding sources, along with equitable recovery of costs from customers. The following reserve recommendations built

upon the policies proposed by City staff during the 2009 rate setting process.1 Based on this review, the following is a summary of the suggested reserves with corresponding recommendations.
Reserve Type Purpose Recommendation
Operating (or Working Capital) Reserve
Provides working capital for day-to-day operations and absorbs fluctuations in cash balance
The Department will set its operating reserve minimum targets at a range of 60 to 120 days of its annual operating expenses (including general fund transfers). Based on current market conditions, an aggregate, minimum unrestricted working capital balance of 120 days will be maintained between the various reserves.
Rate Stabilization Reserve
Provides a revenue source during revenue shortfalls that result from lower than expected customer consumption. A rate stabilization reserve may also be established at the time of debt issuance, setting aside money in a restricted fund that can be used to meet the utility’s annual debt service coverage obligation.
The Department will formalize a rate stabilization reserve policy related to appropriate reserve levels, as well as criteria for replenishing and liquidating the fund. As the Department issues new debt, it will revisit the working capital reserve targets so that both the necessary on-hand liquid cash is available for ongoing operations, as well as the necessary restricted set aside for the purposes of meeting bond coverage obligations. The presence of a rate stabilization reserve will also consequently lower the appropriate target for unrestricted working capital.
Capital Emergency Reserve
Provides a source of emergency funding for emergency repairs and replacements
In the future, the Department will consider establishing and funding a capital reserve minimum in order to be in a position to make short-term emergency repairs and to provide some buffer against capital cost overruns.
Bond Reserve Provides a means of protecting against the risk of nonpayment of bond covenants
The Department will maintain a reserve in compliance with existing bond official statements. Future bond reserve requirements will be defined at the time of each subsequent debt issuance.
In addition to utility reserves, the consultant report discusses different funding options such as cash and debt financing. Given the utility’s significant capital needs in future years, the report recommended the issuance of debt. The Department does not have adequate reserves to cash fund its water, wastewater, and storm drainage capital program without causing significant rate increases. Therefore, the following was recommended and approved for implementation:
The Department will implement a balance of both debt and cash financing, using debt in the near-term to mitigate the impact on rates and a long-term strategy of cash funding replacement projects.
Because debt financing carries added costs, it was recommended and approved that the
Department implement a long-term pay-as-you-go strategy for capital replacements. Cash funding of a capital program will be implemented when the annual capital needs are
relatively flat from year-to-year and the needs are mostly capital replacements. Debt will be used to mitigate capital expenditure spikes as necessary.
Given the need to issue debt in the near-term to meet capital needs, the City’s Treasurer Office worked with its financial advisor, Goldman Sachs, to establish debt assumptions and debt scenarios. These
1 “FY 2009/10 Proposed Budget and Two Year Utility Service Rate Adjustment – Department of Utilities”; Staff Report; June 9, 2009.

assumptions and scenarios were used as guidance in developing the reports recommended revenue requirement approach.
B. REVENUE REQUIREMENTS Once guidelines for establishing financial policies were defined, the next step in the rate study process was to determine the “rate revenue requirement,” or the amount of revenue that rates must generate in order for the Department to be able to meet its various financial obligations. This analysis had two main purposes – to serve as a means of evaluating the Department’s fiscal health and adequacy of current rate levels, and to set the basis for near- and long-term rate planning. For each utility, multiple rate revenue forecasts were developed to explore the feasibility of cash funding versus debt financing for future capital needs. Given each utility’s existing and specific financial position (current fund balance, the need to formalize and follow industry standard fiscal policies, and the need to fund critical capital projects) the revenue requirement analysis projects rate revenue increases for each utility over the next three years. The magnitude of these increases was contingent on the financing mechanism employed, as well as the costs associated with the critical capital needs for the particular utility. Methodology Overview The rate revenue requirement was defined as the net difference between total revenue needs (or expenditures) and the revenue generated through non-rate sources. This analysis involves defining and forecasting both needs and resources within the context of both a cash flow test and a bond coverage sufficiency test. Each of the Department’s utilities must satisfy both tests, each of which provides a different perspective on how much revenue is appropriate. It is worth noting that the grouping of these tests resulted in an overlapping of multiple benchmarks, so that (in tandem) each separate objective was met at all times. The following describes the “cash flow” and “bond coverage” sufficiency tests, which was used to determine the amount of annual revenue that must be collected from rates.
Cash Flow Sufficiency Test – The cash flow test defines the amount of annual revenues that must be generated in order to meet annual expenditure obligations of the utility. These needs can include direct cash expenditures as well as planned transfers or additions to reserves.
Bond Coverage Sufficiency Test – Bond coverage refers to the collection in revenues to meet
all operating expenses and debt service obligations plus an additional multiple of that debt service. A minimum bond coverage ratio of 1.30 is common for rate revenue backed bonds, meaning that the agency needs to collect expenses plus 1.30 times debt service as a minimum legal level of revenues. Many utilities establish higher policy targets (such as coverage ratios of 1.40 – 2.00) to retain or attain high bond ratings with correspondingly lower interest costs.
Expenditures and Revenues As noted, the difference between a utility’s needs (expenses) and available resources (revenues) served as the basis for a revenue requirement analysis.
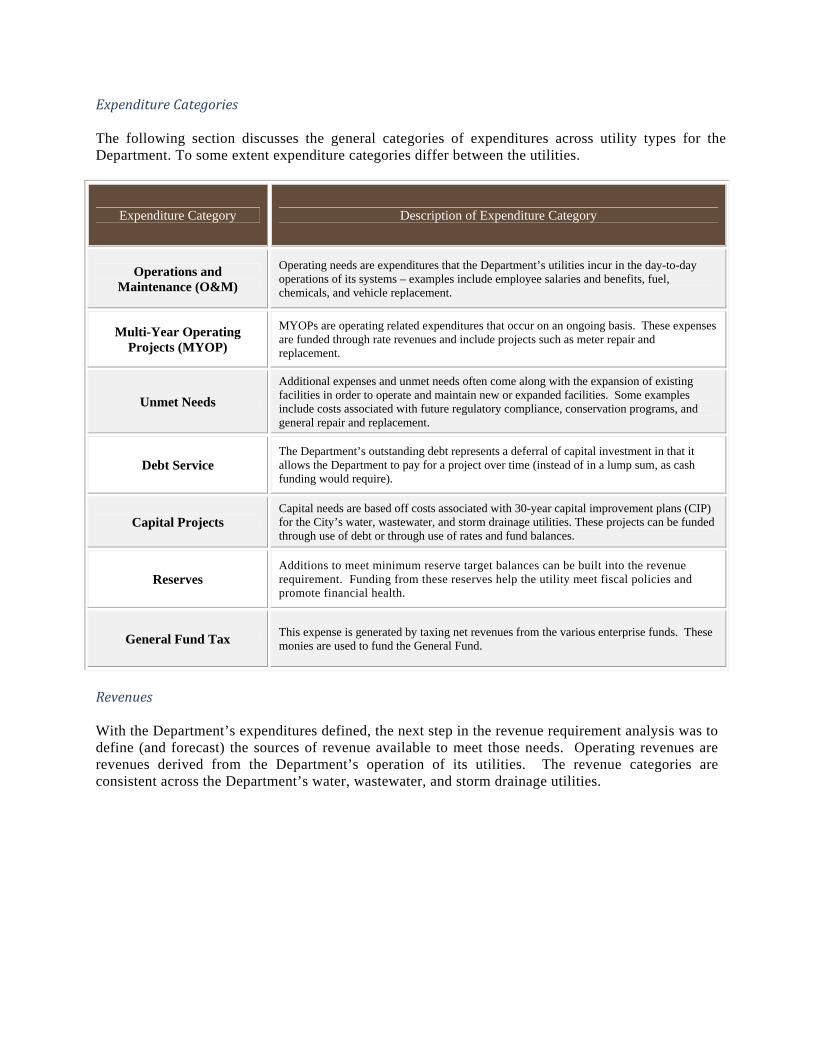
ExpenditureCategories The following section discusses the general categories of expenditures across utility types for the Department. To some extent expenditure categories differ between the utilities.
Expenditure Category Description of Expenditure Category
Operations and Maintenance (O&M)
Operating needs are expenditures that the Department’s utilities incur in the day-to-day operations of its systems – examples include employee salaries and benefits, fuel, chemicals, and vehicle replacement.
Multi-Year Operating Projects (MYOP)
MYOPs are operating related expenditures that occur on an ongoing basis. These expenses are funded through rate revenues and include projects such as meter repair and replacement.
Unmet Needs
Additional expenses and unmet needs often come along with the expansion of existing facilities in order to operate and maintain new or expanded facilities. Some examples include costs associated with future regulatory compliance, conservation programs, and general repair and replacement.
Debt Service The Department’s outstanding debt represents a deferral of capital investment in that it allows the Department to pay for a project over time (instead of in a lump sum, as cash funding would require).
Capital Projects Capital needs are based off costs associated with 30-year capital improvement plans (CIP) for the City’s water, wastewater, and storm drainage utilities. These projects can be funded through use of debt or through use of rates and fund balances.
Reserves Additions to meet minimum reserve target balances can be built into the revenue requirement. Funding from these reserves help the utility meet fiscal policies and promote financial health.
General Fund Tax This expense is generated by taxing net revenues from the various enterprise funds. These monies are used to fund the General Fund.
Revenues With the Department’s expenditures defined, the next step in the revenue requirement analysis was to define (and forecast) the sources of revenue available to meet those needs. Operating revenues are revenues derived from the Department’s operation of its utilities. The revenue categories are consistent across the Department’s water, wastewater, and storm drainage utilities.

General Revenue Types Description of General Revenue Types
User Fees This revenue comes from each utility’s user fees, and represents the Department’s primary source of controllable revenue – it must meet all financial obligations not covered by other revenue sources.
Miscellaneous Miscellaneous revenues (for the purpose of this analysis, revenue that does not fall into any other categories of the categories listed above) fall into this category. Examples include late fees, activation fees, and other miscellaneous service fees.
Impact Fees Impact fees are one-time charges imposed as conditions of development, and are designed to recover an equitable share of the cost of capital investment incurred by a utility.
Debt Proceeds The Department will likely issue debt in the future to fund its capital needs. In doing so, debt proceeds will be available to fund capital projects.
Interest The Department derives this revenue from invested funds – as previously noted. Interest earned on the capital reserve balance is assumed to be available for use toward project expenses and other capital revenue needs.
Water Utility Revenue Requirement The water utility is projected to face significant production and maintenance, non-discretionary fixed costs, regulatory/other and capital expenditure increases in the near term. To fund these expenses, it is necessary to adopt significant rate increases over the next three years. Over the next five year period, significant production and maintenance cost drivers include annual increases of $3.3 million in employee wages and benefits, $1.3 million in supplies and services, and $1.3 million in utility cost increases. Major non-discretionary fixed costs include $4.8 million of annual increases in general fund tax expenditures (which are tied to rate revenues). Regulatory and other expenditures are being driven by the necessity for the utility to raise $5.7 million in funds over the next five years to maintain a 120-day operating fund balance and an additional $8.1 million for a rate stabilization reserve equal to 25% of annual debt service. Meeting these minimum balances will help the City to gain favorable credit ratings for its future debt issuances. Other significant regulatory/other cost drivers include annual increases of $0.6 million to the utility’s Multi-Year Operating Projects. In order to provide reliable services to its customers, the water utility has developed a capital improvement program which includes $427.1 million in escalated costs over the next five years, including $155.3 million for a new water treatment plant and $142.2 million for the residential water meter transition program. Major capital cost increases are being driven by funding for these projects through debt and rates as well as increasing repayment amounts for existing debt issuances. Rate funded capital is expected to be as high as $19.3 million annually and debt repayments are expected to increase from $11.8 million to $32.8 million annually over the five year period. Over the next five years, total water utility expenses are projected to increase by $43.6 million annually, or roughly 56%. Production and maintenance cost increases make up 17% of this amount, non-discretionary fixed cost increases make up 11%, regulatory/other cost increases make up 8%, and capital cost increases make up the remaining 64% of the utility’s projected five year cost increases.
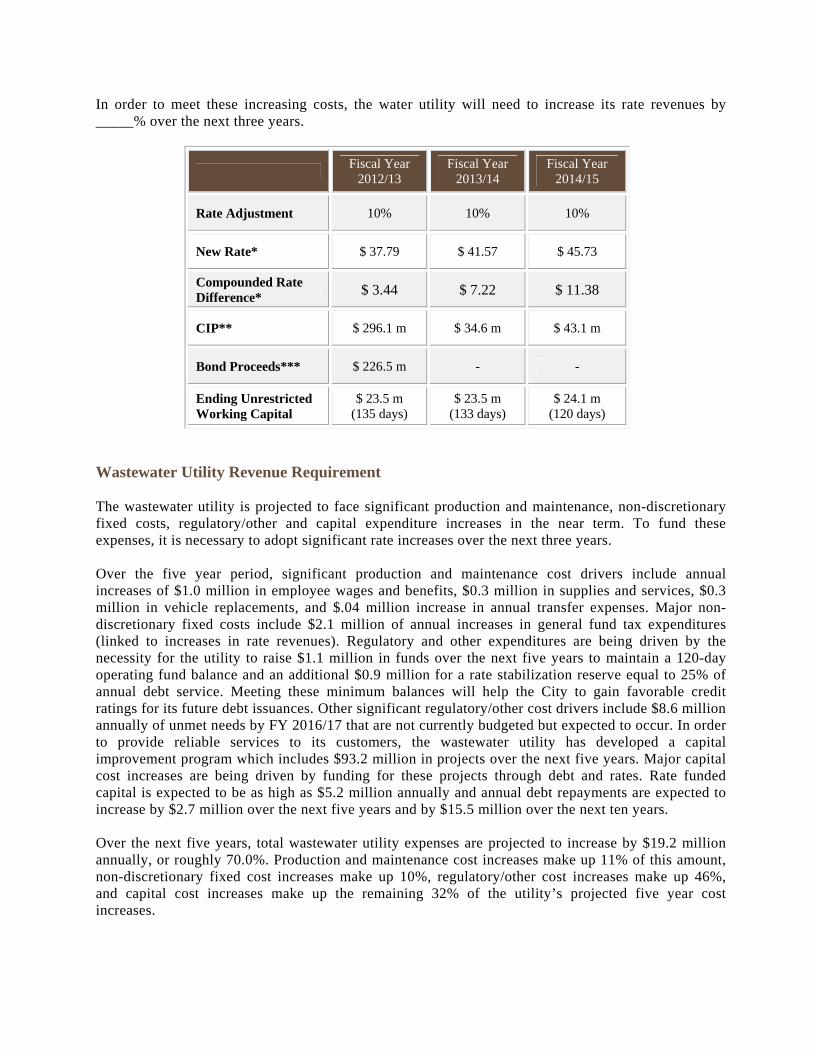
In order to meet these increasing costs, the water utility will need to increase its rate revenues by _____% over the next three years.
Fiscal Year
2012/13 Fiscal Year
2013/14 Fiscal Year
2014/15
Rate Adjustment 10% 10% 10%
New Rate* $ 37.79 $ 41.57 $ 45.73
Compounded Rate Difference* $ 3.44 $ 7.22 $ 11.38
CIP** $ 296.1 m $ 34.6 m $ 43.1 m
Bond Proceeds*** $ 226.5 m - -
Ending Unrestricted Working Capital
$ 23.5 m (135 days)
$ 23.5 m (133 days)
$ 24.1 m (120 days)
Wastewater Utility Revenue Requirement The wastewater utility is projected to face significant production and maintenance, non-discretionary fixed costs, regulatory/other and capital expenditure increases in the near term. To fund these expenses, it is necessary to adopt significant rate increases over the next three years. Over the five year period, significant production and maintenance cost drivers include annual increases of $1.0 million in employee wages and benefits, $0.3 million in supplies and services, $0.3 million in vehicle replacements, and $.04 million increase in annual transfer expenses. Major non-discretionary fixed costs include $2.1 million of annual increases in general fund tax expenditures (linked to increases in rate revenues). Regulatory and other expenditures are being driven by the necessity for the utility to raise $1.1 million in funds over the next five years to maintain a 120-day operating fund balance and an additional $0.9 million for a rate stabilization reserve equal to 25% of annual debt service. Meeting these minimum balances will help the City to gain favorable credit ratings for its future debt issuances. Other significant regulatory/other cost drivers include $8.6 million annually of unmet needs by FY 2016/17 that are not currently budgeted but expected to occur. In order to provide reliable services to its customers, the wastewater utility has developed a capital improvement program which includes $93.2 million in projects over the next five years. Major capital cost increases are being driven by funding for these projects through debt and rates. Rate funded capital is expected to be as high as $5.2 million annually and annual debt repayments are expected to increase by $2.7 million over the next five years and by $15.5 million over the next ten years. Over the next five years, total wastewater utility expenses are projected to increase by $19.2 million annually, or roughly 70.0%. Production and maintenance cost increases make up 11% of this amount, non-discretionary fixed cost increases make up 10%, regulatory/other cost increases make up 46%, and capital cost increases make up the remaining 32% of the utility’s projected five year cost increases.

In order to meet these increasing costs, the wastewater utility will need to increase its rate revenues by _____% over the next three years.
Fiscal Year
2012/13 Fiscal Year
2013/14 Fiscal Year
2014/15
Rate Adjustment 16% 15% 14%
New Rate* $ 17.10 $ 19.49 $ 22.22
Compounded Rate Difference from FY 2011/12*
$ 2.36 $ 4.75 $ 7.48
CIP** $ 15.2 m $ 19.2 m $ 6.7 m
Bond Proceeds*** $ 31.0 m - -
Ending Unrestricted Working Capital
$ 8.9 m (150 days)
$ 8.9 m (135 days)
$ 8.9 m (126 days)
Storm Drainage Utility Revenue Requirement Revenue requirements for the storm drainage utility are addressed in detail in a report that specifically addresses the storm drainage utility. Unlike the water and wastewater utilities, the State Constitution (Proposition 218) now requires that drainage fee rate adjustments receive property owner approval by a mail-in-ballot process conducted by the City. Therefore, implementing rate increases is a difficult and administratively burdensome task. Storm drainage user charges have not been increased since 1992, prior to the implementation of Proposition 218. For this reason, revenue collection has not kept pace with storm drainage system costs, and the utility has been historically underfunded. Utility management has delayed repair and replacement of critical infrastructure in order to bridge these funding shortfalls. In determining a prudent storm drainage user charge, the most significant cost driver includes significant capital investments in order to repair and maintain system infrastructure at levels that provide reliable flood protection and storm drainage for health and safety. Other significant cost drivers include increasing employee costs, additions to meet a 120-day operating fund balance, the creation of a rate stabilization reserve, increases in general fund taxes, increasing debt payments, direct rate funded capital, and unmet needs. The City is now conducting a storm drainage rate study and will be making recommendations to the City Council regarding rate adjustments for storm drainage fees at a later date.

C. CONCLUSIONS The rate proposal complies with the Proposition 218 mandate which allows utilities to only charge rates sufficient to recover the cost of providing utility services. Fiscal Year Rate Increases Water Sewer Year 1 (7-1-2012 – 6-30-2013) 10% 16% Year 2 (7-1-2013 – 6-30-2014) 10% 15% Year 3 (7-1-2014 – 6-30-2015) 10% 14%