city of san pablo - · pdf filecity of san pablo trash management plan 2014-2022 submitted to...
TRANSCRIPT


City of San Pablo Trash Management Plan
2014-2022
Submitted to the California Regional Water Quality Control Board for the San Francisco Bay Region
February 1, 2014
in compliance with Provision C.10 of the Municipal Regional Stormwater Permit
City of San Pablo Trash Management Plan 2014-2022
Contents 1. Introduction by the Contra Costa Clean Water Program (CCCWP) ........................................ 1
A. Trash Sources, Pathways, and Loadings ........................................................................................... 1
B. Background for this Plan................................................................................................................... 1
C. Framework for Long-Term Trash Management ............................................................................... 2
D. Identifying High-Trash Areas ........................................................................................................... 2
E. Trash Management Strategy ............................................................................................................. 3
F. Assessing Effectiveness .................................................................................................................... 3
2. City of San Pablo Trash Management Overview .................................................................... 4
A. Characteristics Affecting Trash Generation and Management ......................................................... 4
B. Drainage System and Water Resources Affected by Trash .............................................................. 4
C. Trash Problems and Priorities ........................................................................................................... 5
3. City of San Pablo Trash Management Strategy ...................................................................... 6
A. Delineation of Trash Management Areas ......................................................................................... 8
B. Area-Specific Control Measures, Implementation Schedules, and Effectiveness Assessment ...... 10
C. Creek and Shoreline Cleanups ........................................................................................................ 10
D. Trash Reduction Policies ................................................................................................................ 10
E. Public Education, Outreach, and Community Involvement ............................................................ 11
F. Jurisdiction-wide Progress Assessment and Continuous Improvement .......................................... 13
4. Trash Management Area Plans ............................................................................................. 13
A. TMA-Specific Plans ........................................................................................................................ 13
5. References ............................................................................................................................ 13
Figures 1-1 Trash Sources and Transport Pathways
Tables 2-1 2010 Census Data
2-2 2005 Land Uses (ABAG)
2-3 Trash Generation Category Percentages by Land Use
3-1 Trash Generation Categories by Trash Management Area
3-2 Control Measures by Trash Management Area
3-3 Creek and Shoreline Hot Spot Cleanups
Attachment City of San Pablo Trash Generation Map
City of San Pablo Trash Management Areas Map
City of San Pablo Full Trash Capture Map
City of San Pablo Trash Management Plan 2014-2022
1
1. Introduction by the Contra Costa Clean Water Program (CCCWP) Contra Costa municipalities have prepared Long-Term Trash Reduction Plans (Plans) in compliance with Provision C.10.c. of the Municipal Regional Stormwater Permit1 (MRP). Each municipal plan describes control measures and best management practices (BMPs) designed to attain a 70% trash load reduction by July 1, 2017 and a 100% reduction by July 1, 2022.
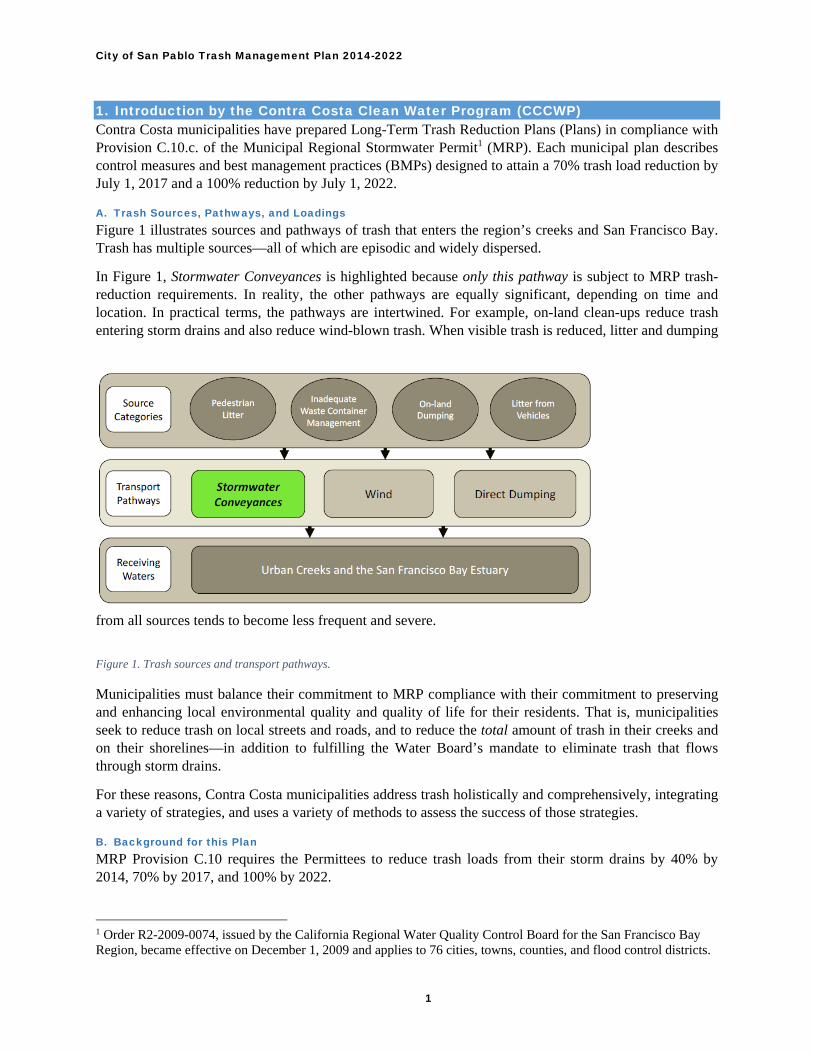
A. Trash Sources, Pathways, and Loadings Figure 1 illustrates sources and pathways of trash that enters the region’s creeks and San Francisco Bay. Trash has multiple sources—all of which are episodic and widely dispersed.
In Figure 1, Stormwater Conveyances is highlighted because only this pathway is subject to MRP trash-reduction requirements. In reality, the other pathways are equally significant, depending on time and location. In practical terms, the pathways are intertwined. For example, on-land clean-ups reduce trash entering storm drains and also reduce wind-blown trash. When visible trash is reduced, litter and dumping
from all sources tends to become less frequent and severe.
Figure 1. Trash sources and transport pathways.
Municipalities must balance their commitment to MRP compliance with their commitment to preserving and enhancing local environmental quality and quality of life for their residents. That is, municipalities seek to reduce trash on local streets and roads, and to reduce the total amount of trash in their creeks and on their shorelines—in addition to fulfilling the Water Board’s mandate to eliminate trash that flows through storm drains.
For these reasons, Contra Costa municipalities address trash holistically and comprehensively, integrating a variety of strategies, and uses a variety of methods to assess the success of those strategies.
B. Background for this Plan MRP Provision C.10 requires the Permittees to reduce trash loads from their storm drains by 40% by 2014, 70% by 2017, and 100% by 2022.
1 Order R2-2009-0074, issued by the California Regional Water Quality Control Board for the San Francisco Bay Region, became effective on December 1, 2009 and applies to 76 cities, towns, counties, and flood control districts.

City of San Pablo Trash Management Plan 2014-2022
2
Provision C.10.a.ii. required each Permittee to determine a baseline trash load and a method for tracking reductions in trash loads. Working collectively through the Bay Area Stormwater Management Agencies Association (BASMAA)—and in close collaboration with Water Board staff—the Permittees developed methods, including a calculator, for tracking loads and load reductions.
The Permittees used these methods to develop Short-Term Trash Load Reduction Plans by February 1, 2012, and are implementing those plans through July 1, 2014 to achieve the 40% reduction. Progress has been documented in the Permittees’ 2012 and 2013 Annual Reports.
Following their review of the Short-Term Plans, Water Board staff requested Permittees to change the methods used to evaluate trash load reductions. Working collectively through BASMAA—and again in close collaboration with Water Board staff—the Permittees developed the framework and planning tools to be used in the Permittees Long-Term Plans.
C. Framework for Long-Term Trash Management The following 8-step framework was developed2:
1. Identify high, medium, and low trash generation areas, based on land use and other geographic data, local knowledge, and field verification.
2. Attempt to identify sources in high and medium trash generation areas to assist in focusing control measures.
3. Prioritize areas and problems/types. 4. Identify options (tools) for dealing with prioritized areas/problems. 5. Define success/goals and measurement type. 6. Select and implement tools. 7. Evaluate success. 8. Modify as needed.
Steps 5 and 7 of this framework acknowledge fundamental challenges presented by Provision C.10—how to define and evaluate success.
D. Identifying High-Trash Areas To implement the first step of the framework—to identify high, medium, and low trash-generation areas—the Permittees collectively, through BASMAA, developed and calibrated a predictive model of trash generation.3 Model variables are designated land use and 2010 median household income; the model was calibrated based on trash collected in full-trash-capture devices (BASMAA, 2012a, BASMAA, 2012b).
The Permittees applied the model as follows: The model was used to generate a preliminary map designating very high, high, moderate, and low trash generation areas. Local municipal staff reviewed the preliminary map and identified areas that had incorrect designations based on local knowledge of actual land uses and of trash generation rates (CCCWP, 2013). Specific methods used to verify local trash generation rates are documented in Section 2 below and may include queries of municipal staff or members of the public, reviews of municipal operations data, viewing areas using Google Maps and Street View, application of BASMAA’s On-Land Visual Trash Assessment Protocol (BASMAA, 2013), or other methods.
2 The framework was developed in a November 1, 2012 meeting at Water Board staff offices and was refined in subsequent meetings with Water Board staff. 3 “Generation” is understood to be the volume of trash potentially available to be transported from the urban watershed (per acre, per year) into the storm drains in the absence of any control measures and BMPs.
City of San Pablo Trash Management Plan 2014-2022
3
E. Trash Management Strategy Municipalities delineated Trash Management Areas (TMAs) within their jurisdictions. TMA boundaries are based on land uses, drainage areas, management areas, and/or geographic considerations, and are drawn to facilitate focused and efficient efforts to reduce trash in areas with very high, high, and medium trash generation rates. The rationale for delineating TMAs in the specific municipality, an overview of the municipality’s trash management approach, and a description of activities that apply throughout the municipality (including hot spot cleanups, jurisdiction-wide policies, and jurisdiction-wide public outreach) is in Section 3.
Section 4 consists of individual summary plans for each municipal TMA. Each TMA plan describes the key TMA characteristics, summarizes control measures, and describes methods for evaluating effectiveness of efforts with in the TMA.
F. Assessing Effectiveness Each TMA summary plan includes methods to evaluate effectiveness. As indicated in the framework, the primary purpose of these evaluations is to facilitate continuous improvement of control measures within the TMA. Continuous improvement requires TMA-specific interpretation of results, including consideration of factors that may have contributed to success, or lack of success, at that locale during the evaluation period. Evaluations of effectiveness and adjustments to the TMA summary plans will be included in each annual report.
A secondary purpose of the evaluation methods is to contribute evidence toward an annual general evaluation of progress toward MRP goals. Such an evaluation will be based on weight-of-evidence, using the results from TMA-level evaluations of the effectiveness of specific actions within the TMA, and of the total of TMA-level actions, during the reporting period. A jurisdiction-wide assessment of progress will be compiled by combining this TMA-level evidence with the results of hot spot cleanups, visual assessments of creeks and shorelines, and observations by local residents and cleanup participants. As additional outcome-based assessment methods are devised and pilot tested—regionally and statewide—information derived from these methods will be incorporated into annual progress assessments.

City of San Pablo Trash Management Plan 2014-2022
4
2. City of San Pablo Trash Management Overview A. Characteristics Affecting Trash Generation and Management Demographic data from the 2010 census is presented in Table 2-1. However, the median household income is from the 2000 census which is the most recent data available.
Table 2-1. 2010 Census Data Population 29,139
Under 18 28.3%
18-24 11.1%
25-44 30.0%
45-64 21.8%
65 and older 8.8%
Median household income $37,184
Table 2-2 summarizes land uses within San Pablo.
Table 2-2. 2005 Land Uses (ABAG) Land Use Category Jurisdictional Area % of Jurisdictional Area
Commercial and Services 119.1 7.6%
Industrial 40.0 2.6%
Residential 997.3 63.9%
Retail 133.4 8.5%
K-12 Schools 80.2 5.1%
Urban Parks 23.1 1.5%
Other 166.7 10.7%
The City of San Pablo is 2.5 square miles in size. The City is built out and densely populated. A majority of the City’s land use is residential (63.9%) with a large amount of multi-family properties. Fifty-three percent of the residents are renters and there is a high turnover in rental properties. With a median household income of $37,184, many of the City’s residents are considered low income.
The 2012 BASMAA trash generation rate study concluded that low income areas typically have more trash. It also found that trash generation rates are linked to land use. San Pablo participated in the study by contributing one data point. The majority of the land use in the City is residential which the study found is not a high trash generating land use. However, the income variable plays a more significant role in San Pablo resulting in a high amount of trash for the City overall even in residential areas.
B. Drainage System and Water Resources Affected by Trash The City is fortunate to have 3 creeks running through its boundaries: Wildcat, San Pablo, and Rheem Creeks. Wildcat and San Pablo Creeks are predominately owned by private property owners whose properties extend to the midline of the creek, with a few sections of City-owned parcels located mostly in parks. Both creeks are day lighted except a few short stretches under I-80 and San Pablo Avenue. Rheem Creek is mainly a concrete flood control channel maintained by the Contra Costa Flood Control and Water Conservation District.
The City has taken many actions to protect the creeks from trash, erosion, and pollution since the creeks are vital to the local flora and fauna. The City has restored multiple sections of creek and recently day lighted a long stretch of creek under the Davis Park baseball field. The City has a close relationship with the local creek group (SPAWNERS) and The Watershed Project, who periodically do cleanups, plantings,
City of San Pablo Trash Management Plan 2014-2022
5
and general maintenance of the restored sites since the City does not have adequate staffing to keep up with the weeds at the restoration sites.
For 20 years, the City has done a tremendous amount to remove trash from the creeks: City crews have obtained applicable state permits and permission to enter private property to clean
the creeks once a year before the rainy season. It takes 4 maintenance workers one month to complete the work. This activity has been effective in removing trash that was either illegally dumped in the creek, washed from upstream, or coming from the outfalls. It also has the dual benefit of reducing flooding.
The City hosts an annual creek cleanup at Davis Park on Wildcat Creek. The cleanup is preceded by in class presentations at the local schools about creeks and how trash travels. See Section 3E for more detail.
The City installed a camera at one location that was a major dumping area. It reduced the amount of trash at that location but other areas saw an increase. The City has not found that reviewing pictures as a means of convicting individuals involved in illegal dumping activities is not an effective mechanism for deterring illegal dumping. Not only is it time consuming to review all the pictures (camera is triggered by any moving objects including cats) but also, unless the person’s face and license plate are clearly visible, the information cannot be used for a conviction. Since other jurisdictions have had success with cameras, we may consider it in the future but for now, we are trying other methods as outlined in Section 3.
Windblown trash is a major problem in a few stretches of creek. On San Pablo Creek at Kennedy Plaza, the City installed a tall metal fence to block some of the trash that blows over from the nearby shopping center. The fence has also reduced the number of homeless in that stretch of the creek. However, the chain linked fences installed in other locations, were cut by the homeless or residents who use creeks to get around town.
The City spends a lot of time cleaning homeless camps in the creeks and vacant lots. In an average year, City crews cleanup 10 homeless camps and it typically takes 4 employees one full day per camp. These efforts are in response to resident calls and complaints. Unfortunately, although there is a shelter nearby, most of the displaced homeless move to other locations in the creek or return.
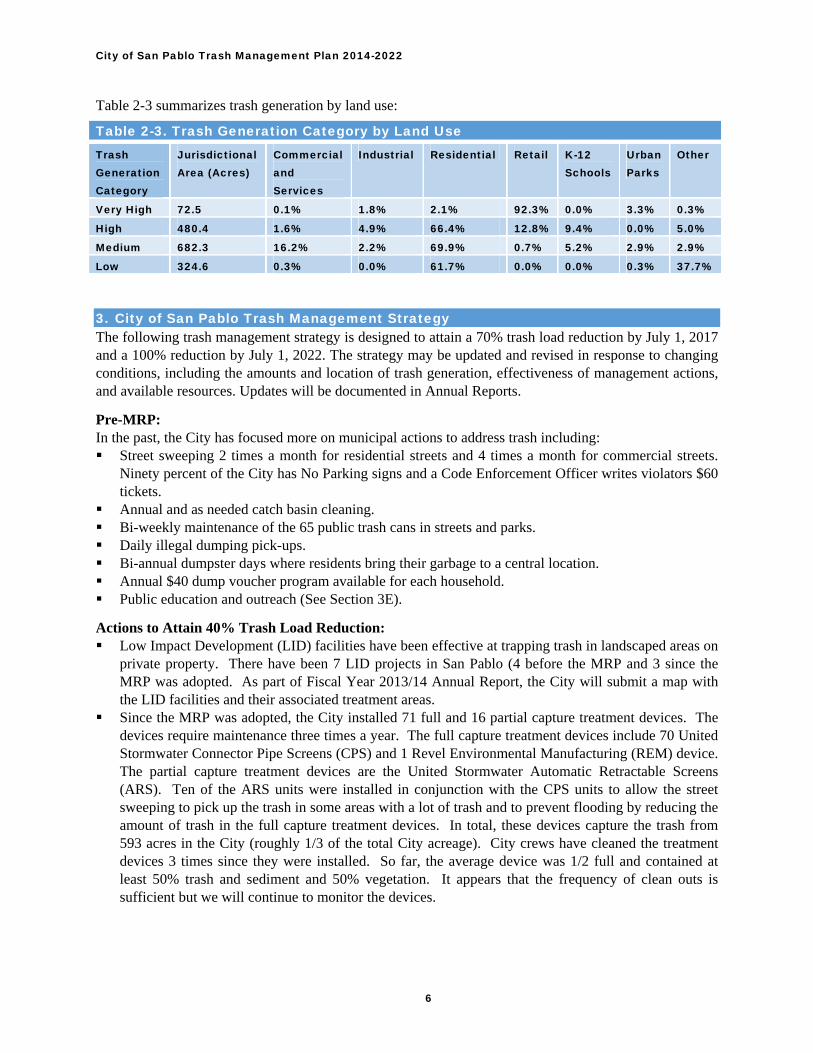
C. Trash Problems and Priorities The modeling used to develop the Trash Generation Maps captured the generation rates accurately for the most part. However, staff made some refinements by reviewing the maps with the Maintenance and Park Facilities Manager, reviewing data on trash collected from City-owned trash cans, viewing Google Maps, and conducting numerous visual observations using BASMAA’s On-Land Visual Assessment Protocol. Some residential areas were changed to high trash, a few businesses were changed to very high, and a few multi-family complexes were changed to low trash since they have an effective home owner’s association.
As shown in Table 2-3 below, retail establishments were by far the land use category with the highest trash generation category and therefore the City will prioritize control measures to addressing those areas first. However, residential areas also have a lot of high trash generation rates and will be the second priority.
City of San Pablo Trash Management Plan 2014-2022
6
Table 2-3 summarizes trash generation by land use:
Table 2-3. Trash Generation Category by Land Use Trash Generation Category
Jurisdictional Area (Acres)
Commercial and Services
Industrial Residential Retail K-12 Schools
Urban Parks
Other
Very High 72.5 0.1% 1.8% 2.1% 92.3% 0.0% 3.3% 0.3%
High 480.4 1.6% 4.9% 66.4% 12.8% 9.4% 0.0% 5.0%
Medium 682.3 16.2% 2.2% 69.9% 0.7% 5.2% 2.9% 2.9%
Low 324.6 0.3% 0.0% 61.7% 0.0% 0.0% 0.3% 37.7%
3. City of San Pablo Trash Management Strategy The following trash management strategy is designed to attain a 70% trash load reduction by July 1, 2017 and a 100% reduction by July 1, 2022. The strategy may be updated and revised in response to changing conditions, including the amounts and location of trash generation, effectiveness of management actions, and available resources. Updates will be documented in Annual Reports.
Pre-MRP: In the past, the City has focused more on municipal actions to address trash including: Street sweeping 2 times a month for residential streets and 4 times a month for commercial streets.
Ninety percent of the City has No Parking signs and a Code Enforcement Officer writes violators $60 tickets.
Annual and as needed catch basin cleaning. Bi-weekly maintenance of the 65 public trash cans in streets and parks. Daily illegal dumping pick-ups. Bi-annual dumpster days where residents bring their garbage to a central location. Annual $40 dump voucher program available for each household. Public education and outreach (See Section 3E).
Actions to Attain 40% Trash Load Reduction: Low Impact Development (LID) facilities have been effective at trapping trash in landscaped areas on
private property. There have been 7 LID projects in San Pablo (4 before the MRP and 3 since the MRP was adopted. As part of Fiscal Year 2013/14 Annual Report, the City will submit a map with the LID facilities and their associated treatment areas.
Since the MRP was adopted, the City installed 71 full and 16 partial capture treatment devices. The devices require maintenance three times a year. The full capture treatment devices include 70 United Stormwater Connector Pipe Screens (CPS) and 1 Revel Environmental Manufacturing (REM) device. The partial capture treatment devices are the United Stormwater Automatic Retractable Screens (ARS). Ten of the ARS units were installed in conjunction with the CPS units to allow the street sweeping to pick up the trash in some areas with a lot of trash and to prevent flooding by reducing the amount of trash in the full capture treatment devices. In total, these devices capture the trash from 593 acres in the City (roughly 1/3 of the total City acreage). City crews have cleaned the treatment devices 3 times since they were installed. So far, the average device was 1/2 full and contained at least 50% trash and sediment and 50% vegetation. It appears that the frequency of clean outs is sufficient but we will continue to monitor the devices.

City of San Pablo Trash Management Plan 2014-2022
7
In 2012, the City negotiated a new contract with the solid waste service provider and included bulky item pick-up service for all single family residential customers. This action will likely reduce some of the illegal dumping in the City.
In 2013, the City Council established an Adopt-a-Spot program to get the community involved in beautifying the City. Although a major goal of the program was to develop on land cleanups, the majority of the groups interested in the program have chosen other projects. Therefore, the City is not including the program in this plan.
Strategy to Attain 70% and 100% Trash Load Reduction: The City has spent significant amount of effort and resources to address litter abatement. However, in order to comply with the 70-100% trash load reduction provisions of the MRP, the City is broadening its strategy for addressing trash by focusing on the sources. The sources can be separated into three categories: business (includes retail, commercial, and industrial), residential, and non-jurisdictional. The urban parks category which also generates some trash will be addressed by performing more on land cleanups. Sources a. Businesses The business trash generators include the large shopping centers, restaurants, industrial, commercial, and multi-family residential properties. The control measures the City is planning to implement include targeting the business property owners/managers and their customers. Business Property Owner/Manager: The City plans on including the high and very high trash generating businesses and multi-family properties to the list of businesses currently inspected by the Public Works Department as part of the NPDES program (such as restaurants and auto facilities). The City’s business inspection program focus has been trash receptacles behind businesses but will now be broadened to also include the parking lot and landscaping where a lot of the litter accumulates.
Since most of the shopping centers or multi-family properties have property management companies handling their maintenance, in 2015 the City plans on establishing a contact list and then meeting with the responsible individual to review the City’s stormwater ordinance related to best management practices for private properties. The goal of these meetings will be to discuss a plan for the business to improve their trash management. Annually thereafter, a percentage of the properties will be inspected to ensure compliance. Since San Pablo is a small city, staff will also respond to trash complaints from the public and other City staff. After the outreach to the high and very high trash generating businesses is completed, the City will begin the same process for the medium trash generating businesses.
In 2014, the City will update its stormwater ordinance. At that time, staff will review the litter provisions of the stormwater ordinance to make sure they sufficiently address properties that generate a lot of trash. Properties in violation of the litter provision of the stormwater ordinance, will receive a notice to abate letter. If the violation is not corrected in the time frame provided in the letter, the business will be issued a fine. Environmental Program staff is trained in issuing notice to abate letters and citations.
Customers: Littering is a major problem in San Pablo so in addition to working with the businesses, the City plans to also address the customers responsible for the littering. The Police Department enforces the CA Penal Code 374.4, 23111, and 23112 for littering but it is usually difficult to catch a person in the act while in a vehicle. Our stormwater ordinance also includes language that prohibits littering, however, it has not been used as an enforcement tool in the past. In 2016, staff will evaluate whether the state or local code
City of San Pablo Trash Management Plan 2014-2022
8
will be more effective in reducing the incidences of littering. Since pedestrian littering is more visible, the Police Department plans to also focus their efforts in that area a few times a year and report on the number of citations issued annually. b. Residential The residential category trash generators include overflowing trash cans, pilfering of recycling cans, and littering. Overflowing Trash: The City is a member of RecycleMore which is a Joint Powers Authority that represents all West County jurisdictions to meet the state mandated solid waste diversion goals. In 2013, RecycleMore and member agencies negotiated a new contract with the solid waste service provider. Currently, organics and recycling cans are collected every other week. Therefore, the trash cans are always full or overflowing. The contractor agreed to collect all three cans (trash, recycling, and organics) weekly starting in late 2014. Environmental Program staff will conduct a waste audit in a few typical high trash generating residential neighborhood for two weeks before the weekly collection program is implemented to establish a baseline. In 2015, Environmental Program staff will once again conduct a waste audit to evaluate whether there have been improvements in overflowing trash cans after the weekly collection has been implemented for a few months. Pilfering: Due to the close proximity to West County’s recycling facility, a lot of people pilfer through the recycling cans on solid waste collection days. Unfortunately, their actions result in a lot of litter falling into the street. The police department brought forward an ordinance to address this issue a few years ago but the City Council at the time decided not to act since they felt it was criminalizing the low income population. Since this is a big source of trash in residential neighborhoods, the City plans to revisit this potential control measure in the future. Littering: Pedestrian littering is a major problem in San Pablo since a lot of people walk. The same approach described above for customers of businesses will be implemented in residential areas. We hope that by giving out a few citations, word will spread and people will stop littering. In addition, since students walking home from school contribute to the littering problem, the 2 resource officers (police officers stationed at the middle school and elementary schools) will work with the students to change their behavior through education or by requiring that they pick up their trash. c. Non-jurisdictional Interstate 80 (I-80) contributes a substantial amount of windblown trash to the adjacent properties. Also, with 5 elementary schools, a middle school, and a high school and a private school right on the border, a lot of litter enters the City streets from sources the City does not have jurisdiction over. The Contra Costa Clean Water Program will coordinate meetings with Caltrans to work on a mutually acceptable plan to reduce trash along the I-80 corridor in 2015. The cities in West Contra Costa Unified School District also plan to meet with the District to work on a plan to reduce trash in schools as well as in the vicinity of schools in 2015.
A. Delineation of Trash Management Areas Unlike the majority of cities where the high trash generation locations are usually located in the heart of the commercial district, in San Pablo, those areas are scattered throughout the City. This provided a challenge in delineating trash management areas (TMAs). The City’s initial goal was to try and group similar categories (i.e. high and very high) together. The next goal was to number the TMAs in order of
City of San Pablo Trash Management Plan 2014-2022
9
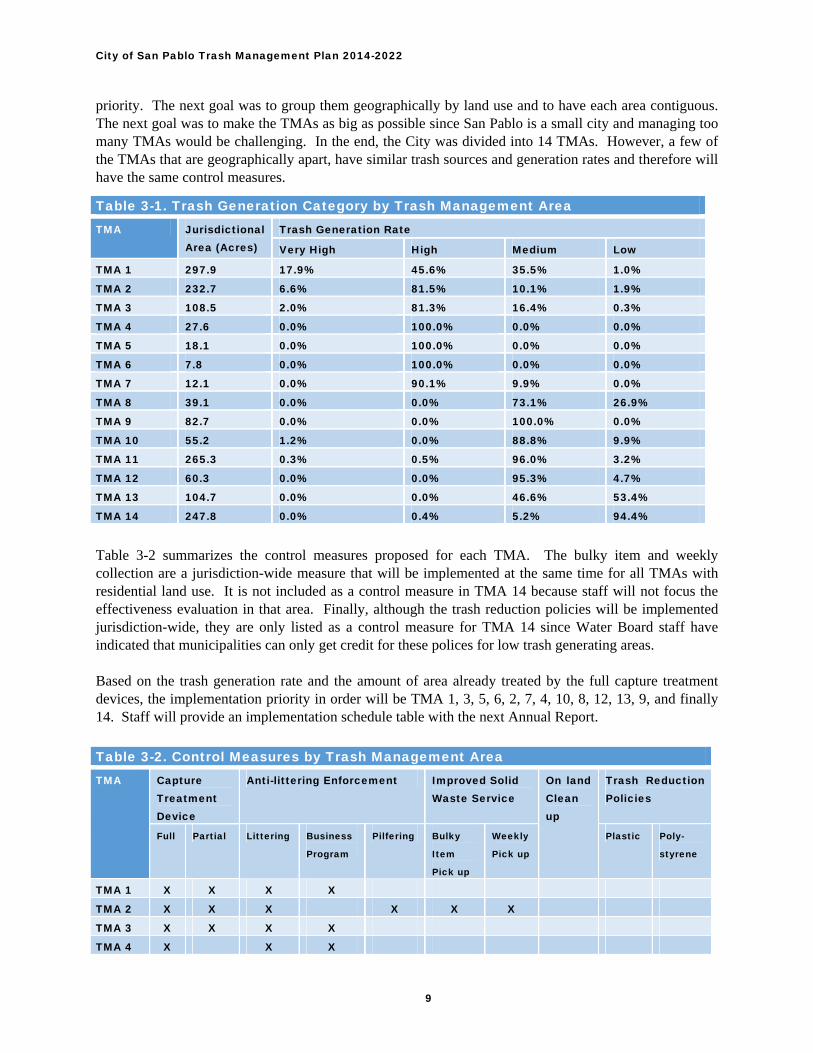
priority. The next goal was to group them geographically by land use and to have each area contiguous. The next goal was to make the TMAs as big as possible since San Pablo is a small city and managing too many TMAs would be challenging. In the end, the City was divided into 14 TMAs. However, a few of the TMAs that are geographically apart, have similar trash sources and generation rates and therefore will have the same control measures.
Table 3-1. Trash Generation Category by Trash Management Area TMA Jurisdictional
Area (Acres) Trash Generation Rate
Very High High Medium Low
TMA 1 297.9 17.9% 45.6% 35.5% 1.0%
TMA 2 232.7 6.6% 81.5% 10.1% 1.9%
TMA 3 108.5 2.0% 81.3% 16.4% 0.3%
TMA 4 27.6 0.0% 100.0% 0.0% 0.0%
TMA 5 18.1 0.0% 100.0% 0.0% 0.0%
TMA 6 7.8 0.0% 100.0% 0.0% 0.0%
TMA 7 12.1 0.0% 90.1% 9.9% 0.0%
TMA 8 39.1 0.0% 0.0% 73.1% 26.9%
TMA 9 82.7 0.0% 0.0% 100.0% 0.0%
TMA 10 55.2 1.2% 0.0% 88.8% 9.9%
TMA 11 265.3 0.3% 0.5% 96.0% 3.2%
TMA 12 60.3 0.0% 0.0% 95.3% 4.7%
TMA 13 104.7 0.0% 0.0% 46.6% 53.4%
TMA 14 247.8 0.0% 0.4% 5.2% 94.4%
Table 3-2 summarizes the control measures proposed for each TMA. The bulky item and weekly collection are a jurisdiction-wide measure that will be implemented at the same time for all TMAs with residential land use. It is not included as a control measure in TMA 14 because staff will not focus the effectiveness evaluation in that area. Finally, although the trash reduction policies will be implemented jurisdiction-wide, they are only listed as a control measure for TMA 14 since Water Board staff have indicated that municipalities can only get credit for these polices for low trash generating areas. Based on the trash generation rate and the amount of area already treated by the full capture treatment devices, the implementation priority in order will be TMA 1, 3, 5, 6, 2, 7, 4, 10, 8, 12, 13, 9, and finally 14. Staff will provide an implementation schedule table with the next Annual Report.
Table 3-2. Control Measures by Trash Management Area TMA Capture
Treatment Device
Anti-littering Enforcement Improved Solid Waste Service
On land Clean up
Trash Reduction Policies
Full Partial Littering Business
Program
Pilfering Bulky
Item
Pick up
Weekly
Pick up
Plastic Poly-
styrene
TMA 1 X X X X
TMA 2 X X X X X X
TMA 3 X X X X
TMA 4 X X X
City of San Pablo Trash Management Plan 2014-2022
10
TMA 5 X X X
TMA 6 X X X X X
TMA 7 X X
TMA 8 X X X X
TMA 9 X X X X
TMA 10 X X X X X X
TMA 11 X X X X X X X
TMA 12 X X X X X
TMA 13 X X X X X
TMA 14 X X X
B. Area-Specific Control Measures, Implementation Schedules, and Effectiveness Assessment Long-Term Trash Reduction Plans for each Trash Management Area, including control measures, detailed implementation plans, and methods of assessing the effectiveness of control measures are in Section 4.
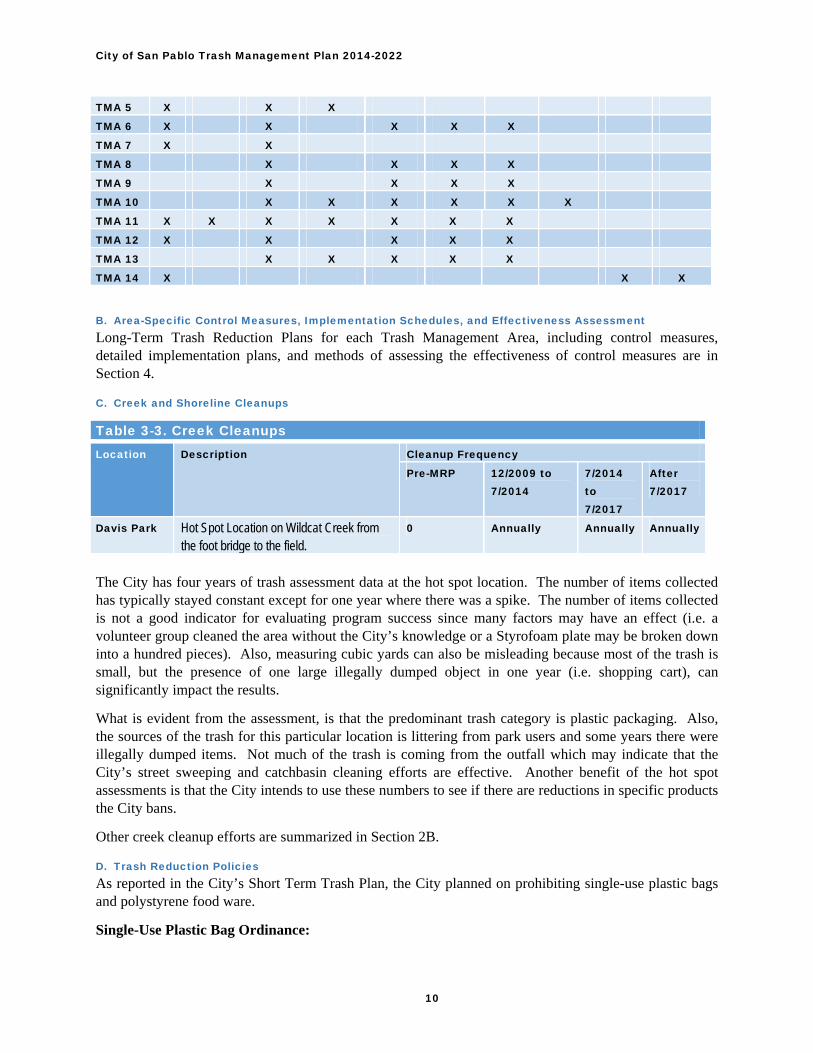
C. Creek and Shoreline Cleanups
Table 3-3. Creek Cleanups Location Description Cleanup Frequency
Pre-MRP 12/2009 to 7/2014
7/2014 to 7/2017
After 7/2017
Davis Park Hot Spot Location on Wildcat Creek from the foot bridge to the field.
0 Annually Annually Annually
The City has four years of trash assessment data at the hot spot location. The number of items collected has typically stayed constant except for one year where there was a spike. The number of items collected is not a good indicator for evaluating program success since many factors may have an effect (i.e. a volunteer group cleaned the area without the City’s knowledge or a Styrofoam plate may be broken down into a hundred pieces). Also, measuring cubic yards can also be misleading because most of the trash is small, but the presence of one large illegally dumped object in one year (i.e. shopping cart), can significantly impact the results.
What is evident from the assessment, is that the predominant trash category is plastic packaging. Also, the sources of the trash for this particular location is littering from park users and some years there were illegally dumped items. Not much of the trash is coming from the outfall which may indicate that the City’s street sweeping and catchbasin cleaning efforts are effective. Another benefit of the hot spot assessments is that the City intends to use these numbers to see if there are reductions in specific products the City bans.
Other creek cleanup efforts are summarized in Section 2B.
D. Trash Reduction Policies As reported in the City’s Short Term Trash Plan, the City planned on prohibiting single-use plastic bags and polystyrene food ware.
Single-Use Plastic Bag Ordinance:
City of San Pablo Trash Management Plan 2014-2022
11
ReycleMore at the request of a few member agencies hired a consultant to prepare the California Environmental Quality Act documents for the single-use plastic bag ordinance. The agency decided to prepare an Environmental Impact Report (EIR) to protect the municipalities from litigation since there were a lot of comments submitted by the Save the Plastic Bag Coalition. Once the EIR was completed, the cities of Richmond, El Cerrito, and San Pablo met to coordinate the timing of the ordinance adoption and outreach efforts. The model ordinance was routed to the various City departments, a public hearing was advertised and held, staff presented the ordinance to various organizations, and the ordinance was unanimously passed by the City Council in the fall of 2013. Staff sent out postcards, sent out a press release, held a workshop for businesses, visited businesses, and put up bus shelters posters.
Environmental Program staff is responsible for implementing and enforcing the single-use carryout bag ordinance. Staff met with the City Attorney about enforcement. Unlike stormwater discharges that cannot be abated and are levied an automatic citation (the City changed the Municipal Code to include this action a few years ago), the single-use plastic bag ordinance violation can be abated and therefore will need to follow the Municipal Code Section related to abatement. However, since this ordinance requires an action the businesses have direct control over, the City Attorney agrees that they can have as little as 24 hours to comply with the ordinance. Other Municipal Code violations typically require a 30 day notice. If the violation is not corrected in the time frame provided in the letter, the business will be issued a citation.
The ordinance has been in place since January of 2014 and staff plans on evaluating its’ success based on the number of enforcement actions taken against the non-compliant businesses (or the percentage of compliant businesses) and by evaluating the hot spot location data. Enforcement will begin in July of 2014. Staff plans on responding to complaints from the residents and by conducting surprise inspections. In the first two weeks of the ordinance being enacted, staff already received a call from a resident reporting a non-compliant business.
Polystyrene Ordinance: The City plans on working on the polystyrene ban in 2014 for an implementation date of January 2015. In addition to just polystyrene food ware, staff is proposing that the sale of all polystyrene in the City also be banned. The ordinance would be similar to the one adopted by the City of Richmond. Enforcement for this action will include checking compliance as part of our NPDES restaurant inspections and also inspecting the few stores that sell polystyrene. Staff will evaluate the effectiveness of the program by the number of enforcement actions taken against the non-compliant business (or the percentage of compliant businesses) and by evaluating the hot spot location data.
E. Public Education, Outreach, and Community Involvement Regional Efforts Through the CCCWP, the Permittees conducted a “Litter Travels, But It Can Stop with You” multi-year campaign beginning in FY 2009-2010. The multi-media campaign was designed to educate Contra Costa’s citizens about the impacts of trash and litter in the County’s waterways and how they can help address this problem and included TV spots, billboards, posters at BART stations, placards on transit buses, print ads and updates to the CCCWP website. Other outreach included more than 10,000 letters to County residents, contact with youth sports leagues, outreach to the 17 school districts in the County, and distribution of flyers to students in 5 of those districts. Pre and post-campaign surveys were conducted.
Through the CCCWP, Permittees also support the work of the California Product Stewardship Council (CPSC) and the Green Business Program. Both of these organizations address trash through source reduction and waste management. CPSC's mission is to promote Extended Producer Responsibility (EPR), which is based upon shifting California's product waste management system from one focused on
City of San Pablo Trash Management Plan 2014-2022
12
government funded and ratepayer financed waste diversion to one that relies on producer responsibility in order to reduce public costs and drive improvements in product design that promote environmental sustainability. The CPSC's position is that the producers should have the primary responsibility to establish, fund, and manage end of life systems for their products. CPSC has advocated for EPR legislation affecting a wide-range of products including pharmaceuticals, batteries, paint, sharps, and mattresses.
The Green Business Program, of which CCCWP is the largest contributing Partner in Contra Costa County, is designed to publicly recognize private businesses and public agencies that take extra steps, beyond baseline compliance with environmental regulations, to prevent pollution and save resources (e.g., conserve water and energy, reduce waste through reuse and recycling, prevent stormwater pollution through good housekeeping practices, etc.). To date, 530 businesses have been certified as Green Businesses in Contra Costa County. Currently, 334 businesses are certified including a large number of auto repair shops, landscapers, waste haulers, printers, grocery and hardware stores, solar panel installers, and home remodelers. Numerous public agencies have also been certified. Municipal stormwater and POTW inspectors assist the Green Business program by encouraging potential Green Business candidates. CCCWP staff serves on the Green Business Program's "Partners Committee" and actively engages in development of the Green Business checklist (i.e., the stormwater pollution prevention section that each business needs to complete before becoming certified as a green business). Some of the more relevant actions that businesses have undertaken to become certified or recertified that also reduce trash loads include the following: commit to reduce waste in a minimum of five ways, maintain parking areas free of litter, keep dumpsters covered when not in use, ensure tarps for covering loads are in good condition and used correctly, and purchase a minimum of three recycled-content products.
To address trash from illegal dumping, the CCCWP operates a 1-800-No-Dumping hotline. The hotline is used by both businesses and the public to report potentially illegal dumping activities. All hotline calls are referred to the appropriate municipality for follow-up and, if necessary, enforcement. Calls have been logged since FY 2004-2005. Calls to the hotline are combined with calls that come directly to municipalities and Contra Costa County Hazardous Materials (Hazmat) Division and are tracked and documented annually in the municipal annual reports.
The CCCWP will continue to identify new partners and areas of outreach for source reduction and measures to reduce trash in the environment. CCCWP is currently in contact with California Department of Transportation (Office of Stormwater Program Development) and hopes to identify trash load reduction projects in Contras Costa County that would be financially and strategically feasible for all involved parties. CCCWP has also made contact with the California Highway Patrol, Contra Costa County Solid Waste Authority, and a number of transfer stations to potentially develop additional outreach materials to reduce litter from uncovered loads.
Local Efforts Due to the high turnover in renters, educational outreach has proven to be challenging. However, the City of San Pablo has always believed in the importance of public education and outreach in changing behavior. The City had been conducting many public education and outreach programs throughout the years:
Tile Art Project - community groups paint tiles that were installed on trash cans and placed throughout the City and parks.
Riparian Lab after School Program – The Watershed Project was contracted to conduct a series of presentations about litter, creeks, and pollution prevention to youth from 4th grade to high school.
City of San Pablo Trash Management Plan 2014-2022
13
Annual Wildcat Creek Cleanup – Kids for the Bay is contracted to conduct in class presentations about the watershed and how litter travels followed by a creek cleanup event.
Community Cleanup Program – The Watershed Project is contracted to conduct in class presentations about litter followed by a school cleanup event.
Staff regularly submits articles in the City’s newsletter and the City Manager’s e-news on litter, litter reduction, cleanup events, and City services for trash disposal.
As part of this plan, the City intends on conducting public education and outreach campaigns before implementing the littering control measures proposed in this plan similar to the extensive outreach done for the single-use plastic bag ordinance.
F. Jurisdiction-wide Progress Assessment and Continuous Improvement In considering appropriate control measures, staff met with other agencies with similar trash generation rates and staff from all applicable City departments. Once the proposed control measures were agreed upon, staff received approval from the Chief of Police and the City Manager. However, since the new expanded approach is the first of its kind for the City, Environmental Program staff will monitor and evaluate all the control measures as they are implemented to see if they are effective in reducing trash. If not, the City will collaborate with other cities with similar trash generation rates and demographic to learn about their success and come up with alternative strategies. The approach we are proposing is heavily dependent on enforcement which the City’s Environmental Program staff has experience in and believe it will has positive outcomes for the City. The difference with this plan compared to current practices is that some of the enforcement (residential littering) will be handled by the Police Department due to safely concerns.
As referenced in Section 1F, the control measure evaluations will help with the annual overall evaluation of our trash plan in attaining the MRP goals. Other information including the hot spot location data and annual on-land visual assessments will be used to evaluate progress.
4. Trash Management Area Plans A. TMA-Specific Plans TMA-specific plans for 14 areas are attached.
5. References BASMAA 2012a. Bay Area Stormwater Management Agencies Association. Trash Generation Rates for San Francisco Bay Area MS4s (Draft Final). Presentation to the BASMAA Trash Committee, August 2012. Prepared by EOA, Inc.
BASMAA 2012b. Baseline Trash Generation Rates, Preliminary Calibration of Modeled Results, Presentation to BASMAA Trash Committee, September, 2012. Prepared by EOA, Inc.
BASMAA 2013a. Visual On-Land Trash Assessment Protocol for Stormwater, Version 1.0 (Draft). April 30, 2013. Prepared by EOA, Inc.
CCCWP, 2013. Contra Costa Clean Water Program. Long-Term Trash Load Reduction Plan Development—Trash Generation Map Refinements. Technical Memorandum, May 20, 2013. Prepared by EOA, Inc.

TMA 1 is important because it consists of the only two entrances into the City from I-80 via San Pablo Dam Road and El Portal Drive. Both of these streets as well as San Pablo Avenue and Church Lane are arterial streets passing through the City.
Along San Pablo Avenue, there are a few shopping centers with large grocery stores and restaurants (predominately fast food restaurants) that generate a lot of trash. Additionally, there are multiple bus stops which contribute to pedestrian-generated litter. In addition, the Casino, hospital, City Hall, and numerous health care facilities are within this TMA resulting in a lot of vehicular traffic. Adjacent to I-80, a substantial amount of wind and vehicular-generated litter enters the City. Please see Section 3 of the plan for the control measure to address non-jurisdictional trash. There are a few multi-family and single-family residential areas as well. Since the main streets are swept four times a month and there are both City-owned and AC Transit-owned trash cans, the majority of trash is found in the landscaping or inside the parking lots of private properties. On San Pablo Dam Road, a fair amount of the trash is blown by the wind into the street from I-80 and the two shopping centers. Summary of Control Measures and Implementation Schedule for Trash Management Area 1
Control Measure Control Measure Details
Pre-
MRP
12/2009
to 7/2014
7/2014 to
7/2017
After
7/2017
Full Capture Treatment
Devices
- Connector pipe screens and one REM device (installed 2012). - 2 LID projects (installed 2009 and 2011)
X X
Partial-Capture
Treatment Devices Automatic retractable screens (installed 2012). X
Anti-littering
Enforcement
- Pedestrian and vehicular littering violations (anticipated 2016) - Business and multi-family property owner trash violations (anticipated 2015)
X X
The full capture treatment devices capture a fair amount of TMA 1 since they were strategically located in the trashiest locations. However, a few very high and high trash generating areas are not treated by the full capture treatment devices and will therefore be the priority for this TMA. Please see Section 3 of the plan for more detail on all three of the control measures. Evaluation of Program Effectiveness for Trash Management Area 1
Control Measure Evaluation Method Evaluation Method Details
Key Characteristics of Trash Management Area 1
Total
Jurisdictional
Area (Acres)
Percent in Trash Generation Category
Dominant Land Uses
Dominant Types and
Sources of Trash Very High High Medium Low
297.9 17.9% 45.6% 35.5% 1.0% Retail and Commercial Retail stores and pedestrian and vehicular-generated litter
TRASH MANAGEMENT AREA
1 City of San Pablo Long-Term Trash Reduction Plan
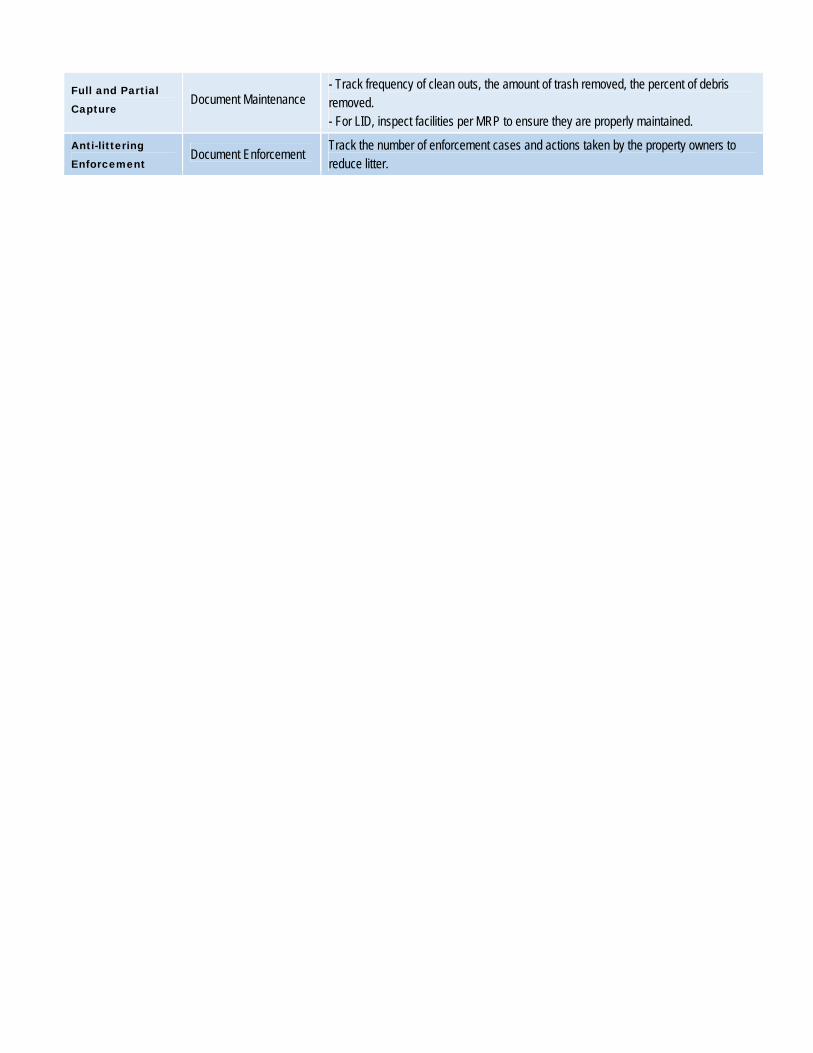
Full and Partial
Capture Document Maintenance
- Track frequency of clean outs, the amount of trash removed, the percent of debris removed. - For LID, inspect facilities per MRP to ensure they are properly maintained.
Anti-littering
Enforcement Document Enforcement
Track the number of enforcement cases and actions taken by the property owners to reduce litter.
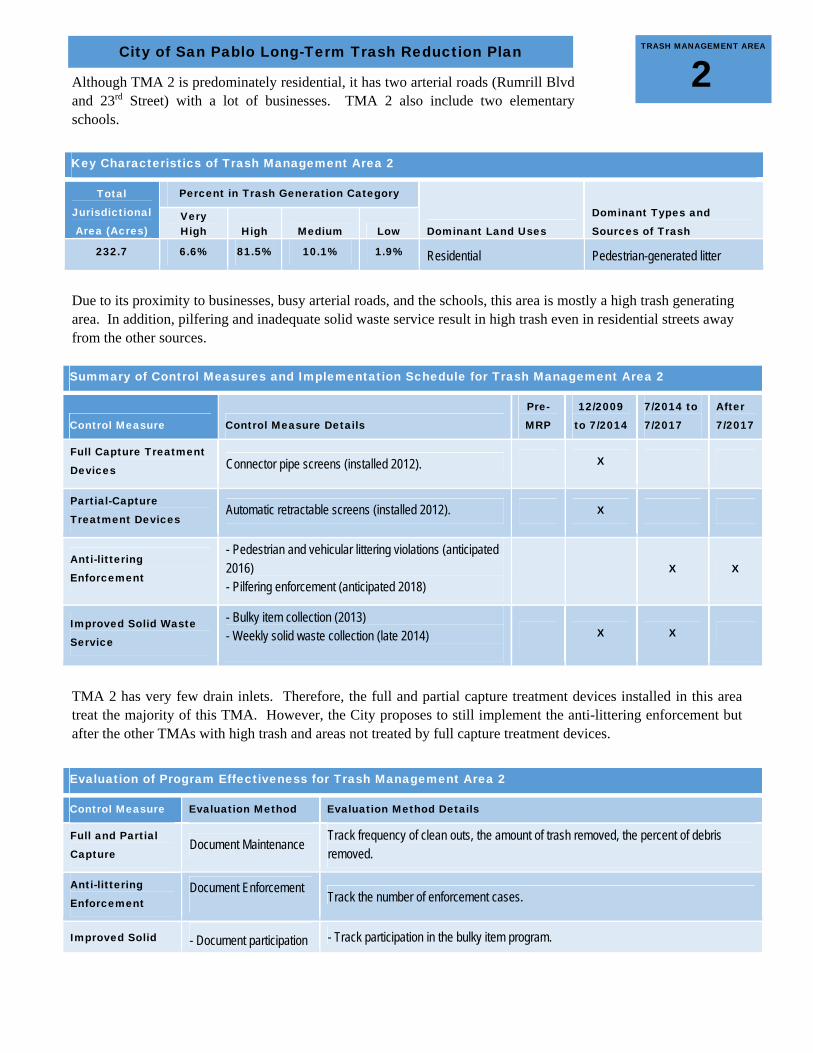
Although TMA 2 is predominately residential, it has two arterial roads (Rumrill Blvd and 23rd Street) with a lot of businesses. TMA 2 also include two elementary schools.
Due to its proximity to businesses, busy arterial roads, and the schools, this area is mostly a high trash generating area. In addition, pilfering and inadequate solid waste service result in high trash even in residential streets away from the other sources. Summary of Control Measures and Implementation Schedule for Trash Management Area 2
Control Measure Control Measure Details
Pre-
MRP
12/2009
to 7/2014
7/2014 to
7/2017
After
7/2017
Full Capture Treatment
Devices Connector pipe screens (installed 2012). X
Partial-Capture
Treatment Devices Automatic retractable screens (installed 2012). X
Anti-littering
Enforcement
- Pedestrian and vehicular littering violations (anticipated 2016) - Pilfering enforcement (anticipated 2018)
X X
Improved Solid Waste
Service
- Bulky item collection (2013) - Weekly solid waste collection (late 2014)
X X
TMA 2 has very few drain inlets. Therefore, the full and partial capture treatment devices installed in this area treat the majority of this TMA. However, the City proposes to still implement the anti-littering enforcement but after the other TMAs with high trash and areas not treated by full capture treatment devices.
Evaluation of Program Effectiveness for Trash Management Area 2
Control Measure Evaluation Method Evaluation Method Details
Full and Partial
Capture Document Maintenance
Track frequency of clean outs, the amount of trash removed, the percent of debris removed.
Anti-littering
Enforcement Document Enforcement
Track the number of enforcement cases.
Improved Solid - Document participation - Track participation in the bulky item program.
Key Characteristics of Trash Management Area 2
Total
Jurisdictional
Area (Acres)
Percent in Trash Generation Category
Dominant Land Uses
Dominant Types and
Sources of Trash Very High High Medium Low
232.7 6.6% 81.5% 10.1% 1.9% Residential Pedestrian-generated litter
TRASH MANAGEMENT AREA
2 City of San Pablo Long-Term Trash Reduction Plan
Waste Service - Waste Audit - Evaluate conditions before and after weekly solid waste collection program.

TMA 3 includes the second half of San Pablo Avenue. Road 20 is also a busy collector street used to get to Rumrill Blvd. In addition, this TMA includes a section with subsidized housing.
Along San Pablo Avenue, there are a few shopping centers with large grocery stores and restaurants (predominately fast food restaurants) that generate a lot of trash. Additionally, there are multiple bus stops which contribute to pedestrian-generated litter. Since the main streets are swept four times a month and there are both City-owned and AC Transit-owned trash cans, the majority of trash is found in the landscaping or inside the parking lots of private properties. Summary of Control Measures and Implementation Schedule for Trash Management Area 3
Control Measure Control Measure Details
Pre-
MRP
12/2009
to 7/2014
7/2014 to
7/2017
After
7/2017
Full Capture Treatment
Devices - Connector pipe screens (installed 2012). - 3 LID projects (installed 2009, 2011, and 2011)
X X
Partial-Capture
Treatment Devices Automatic retractable screens (installed 2012). X
Anti-littering
Enforcement
- Pedestrian and vehicular littering violations (anticipated 2016) - Business and multi-family property owner trash violations (anticipated 2015)
X X
The full capture treatment devices capture a fair amount of TMA 3 since they were strategically located in the trashiest locations. However, a few very high and high trash generating areas are not treated by the full capture treatment devices and will therefore be the priority for this TMA. Please see Section 3 of the plan for more detail on all three of the control measures. Evaluation of Program Effectiveness for Trash Management Area 3
Control Measure Evaluation Method Evaluation Method Details
Full and Partial
Capture Document Maintenance
- Track frequency of clean outs, the amount of trash removed, the percent of debris removed. - For LID, inspect facilities per MRP to ensure they are properly maintained.
Anti-littering
Enforcement Document Enforcement
Track the number of enforcement cases and actions taken by the property owners to reduce litter.
Key Characteristics of Trash Management Area 3
Total
Jurisdictional
Area (Acres)
Percent in Trash Generation Category
Dominant Land Uses
Dominant Types and
Sources of Trash Very High High Medium Low
108.5 2.0% 81.3% 16.4% 0.3% Retail and Residential Retail and Pedestrian and Vehicular-generated litter
TRASH MANAGEMENT AREA
3 City of San Pablo Long-Term Trash Reduction Plan

The majority of the land use in TMA 4 is urban open adjacent to I-80. There are two parcels of retail that primarily include a supermarket and restaurants. San Pablo Dam Road which is an arterial street runs through TMA 4.
Unlike San Pablo Avenue in TMA 1 and 3, San Pablo Dam road is not used by pedestrians often. Due to its proximity to I-80, it is used for commuters and shoppers. Both shopping centers are heavily used.
Summary of Control Measures and Implementation Schedule for Trash Management Area 4
Control Measure Control Measure Details
Pre-
MRP
12/2009
to 7/2014
7/2014 to
7/2017
After
7/2017
Full Capture Treatment
Devices - Connector pipe screens (installed 2012). X
Anti-littering
Enforcement
- Pedestrian and vehicular littering violations (anticipated 2016) - Business and multi-family property owner trash violations (anticipated 2015)
X X
The majority of the trash in TMA 4 is blown by the wind into the urban open parcels and street from I-80. Unfortunately the one full capture treatment device that was installed, treats a small portion of the TMA and therefore anti-littering enforcement and coordination with Cal Trans will be critical. Please see Section 3 of the plan for more detail on all of the control measures. Evaluation of Program Effectiveness for Trash Management Area 4
Control Measure Evaluation Method Evaluation Method Details
Full Capture Document Maintenance Track frequency of clean outs, the amount of trash removed, the percent of debris removed.
Anti-littering
Enforcement Document Enforcement Track the number of enforcement cases and actions taken by the property owners to reduce litter.
Key Characteristics of Trash Management Area 4
Total
Jurisdictional
Area (Acres)
Percent in Trash Generation Category
Dominant Land Uses
Dominant Types and
Sources of Trash Very High High Medium Low
27.6 0.0% 100.0% 0.0% 0.0% Urban Open and Retail Wind Blown and Vehicular-generated litter
TRASH MANAGEMENT AREA
4 City of San Pablo Long-Term Trash Reduction Plan
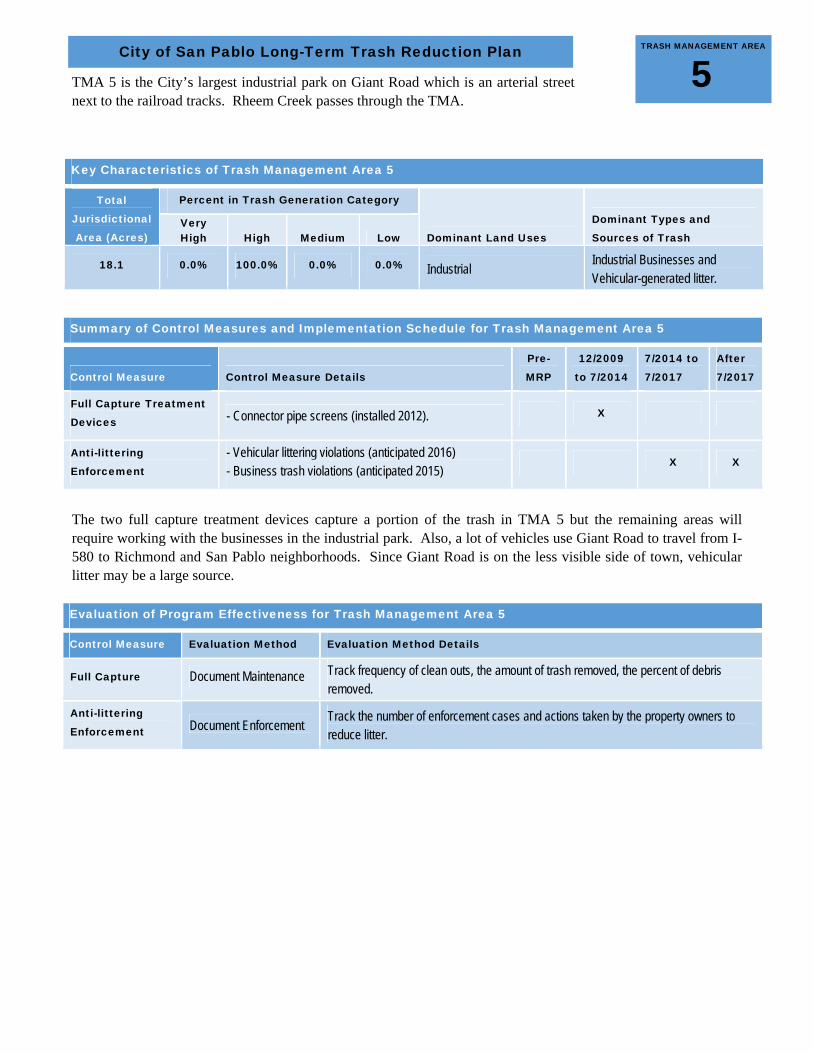
TMA 5 is the City’s largest industrial park on Giant Road which is an arterial street next to the railroad tracks. Rheem Creek passes through the TMA.
Summary of Control Measures and Implementation Schedule for Trash Management Area 5
Control Measure Control Measure Details
Pre-
MRP
12/2009
to 7/2014
7/2014 to
7/2017
After
7/2017
Full Capture Treatment
Devices - Connector pipe screens (installed 2012). X
Anti-littering
Enforcement - Vehicular littering violations (anticipated 2016) - Business trash violations (anticipated 2015)
X X
The two full capture treatment devices capture a portion of the trash in TMA 5 but the remaining areas will require working with the businesses in the industrial park. Also, a lot of vehicles use Giant Road to travel from I-580 to Richmond and San Pablo neighborhoods. Since Giant Road is on the less visible side of town, vehicular litter may be a large source. Evaluation of Program Effectiveness for Trash Management Area 5
Control Measure Evaluation Method Evaluation Method Details
Full Capture Document Maintenance Track frequency of clean outs, the amount of trash removed, the percent of debris removed.
Anti-littering
Enforcement Document Enforcement Track the number of enforcement cases and actions taken by the property owners to reduce litter.
Key Characteristics of Trash Management Area 5
Total
Jurisdictional
Area (Acres)
Percent in Trash Generation Category
Dominant Land Uses
Dominant Types and
Sources of Trash Very High High Medium Low
18.1 0.0% 100.0% 0.0% 0.0% Industrial Industrial Businesses and Vehicular-generated litter.
TRASH MANAGEMENT AREA
5 City of San Pablo Long-Term Trash Reduction Plan

TMA 6 is the entrance to a predominately medium trash generating single-family neighborhood in TMA 11 from San Pablo Avenue. However, this small TMA is categorized as high trash predominately due to trash generated from the multi-family properties.
Though some of the sources of trash in this small TMA can be from vehicular-generated litter since a lot of people take this road to get home, the main source is the trash from the multi-family properties.
Summary of Control Measures and Implementation Schedule for Trash Management Area 6
Control Measure Control Measure Details
Pre-
MRP
12/2009
to 7/2014
7/2014 to
7/2017
After
7/2017
Anti-littering
Enforcement
- Vehicular littering violations (anticipated 2016) - Multi-family property owner trash violations (anticipated 2015) - Pilfering enforcement (anticipated 2018)
X X
Improved Solid Waste
Service
- Bulky item collection (2013) - Weekly solid waste collection (late 2014)
X X
Evaluation of Program Effectiveness for Trash Management Area 6
Control Measure Evaluation Method Evaluation Method Details
Anti-littering
Enforcement Document Enforcement
Track the number of enforcement cases.
Improved Solid
Waste Service - Document participation - Waste Audit
- Track participation in the bulky item program. - Evaluate conditions before and after weekly solid waste collection program.
Key Characteristics of Trash Management Area 6
Total
Jurisdictional
Area (Acres)
Percent in Trash Generation Category
Dominant Land Uses
Dominant Types and
Sources of Trash Very High High Medium Low
7.8 0.0% 100.0% 0.0% 0.0% Residential Multi-family Property litter
TRASH MANAGEMENT AREA
6 City of San Pablo Long-Term Trash Reduction Plan
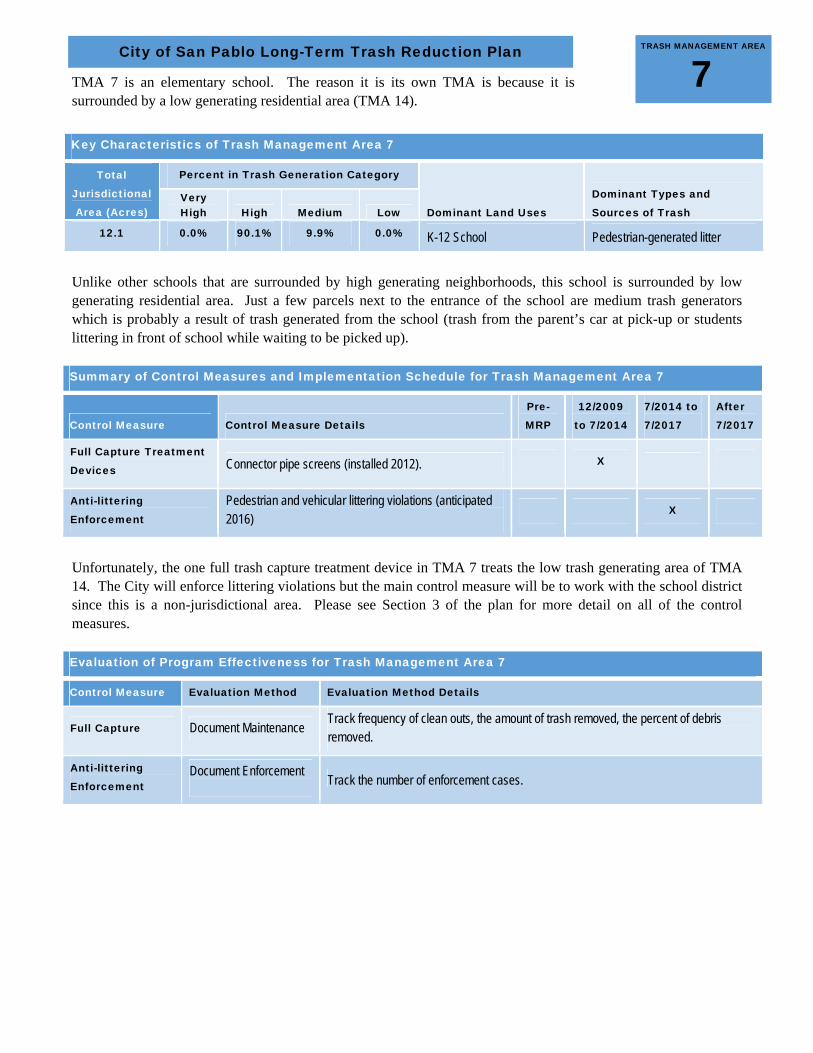
TMA 7 is an elementary school. The reason it is its own TMA is because it is surrounded by a low generating residential area (TMA 14).
Unlike other schools that are surrounded by high generating neighborhoods, this school is surrounded by low generating residential area. Just a few parcels next to the entrance of the school are medium trash generators which is probably a result of trash generated from the school (trash from the parent’s car at pick-up or students littering in front of school while waiting to be picked up). Summary of Control Measures and Implementation Schedule for Trash Management Area 7
Control Measure Control Measure Details
Pre-
MRP
12/2009
to 7/2014
7/2014 to
7/2017
After
7/2017
Full Capture Treatment
Devices Connector pipe screens (installed 2012). X
Anti-littering
Enforcement Pedestrian and vehicular littering violations (anticipated 2016)
X
Unfortunately, the one full trash capture treatment device in TMA 7 treats the low trash generating area of TMA 14. The City will enforce littering violations but the main control measure will be to work with the school district since this is a non-jurisdictional area. Please see Section 3 of the plan for more detail on all of the control measures. Evaluation of Program Effectiveness for Trash Management Area 7
Control Measure Evaluation Method Evaluation Method Details
Full Capture Document Maintenance Track frequency of clean outs, the amount of trash removed, the percent of debris removed.
Anti-littering
Enforcement Document Enforcement
Track the number of enforcement cases.
Key Characteristics of Trash Management Area 7
Total
Jurisdictional
Area (Acres)
Percent in Trash Generation Category
Dominant Land Uses
Dominant Types and
Sources of Trash Very High High Medium Low
12.1 0.0% 90.1% 9.9% 0.0% K-12 School Pedestrian-generated litter
TRASH MANAGEMENT AREA
7 City of San Pablo Long-Term Trash Reduction Plan

TMA 8 consisted primarily of single family residential parcels with an arterial street (Church Lane) going through it. It also includes a church with its own school, the sporting fields of a private school (the main school offices are in the City of Richmond), and a privately owned subdivision.
The private school is well maintained. Because of church activities, school, sporting events, and inadequate solid waste service, the area is mostly medium trash generating. Summary of Control Measures and Implementation Schedule for Trash Management Area 8
Control Measure Control Measure Details
Pre-
MRP
12/2009
to 7/2014
7/2014 to
7/2017
After
7/2017
Anti-littering
Enforcement
- Pedestrian and vehicular littering violations (anticipated 2016) - Pilfering enforcement (anticipated 2018)
X X
Improved Solid Waste
Service
- Bulky item collection (2013) - Weekly solid waste collection (late 2014)
X X
Evaluation of Program Effectiveness for Trash Management Area 8
Control Measure Evaluation Method Evaluation Method Details
Anti-littering
Enforcement Document Enforcement
Track the number of enforcement cases.
Improved Solid
Waste Service - Document participation - Waste Audit
- Track participation in the bulky item program. - Evaluate conditions before and after weekly solid waste collection program.
Key Characteristics of Trash Management Area 8
Total
Jurisdictional
Area (Acres)
Percent in Trash Generation Category
Dominant Land Uses
Dominant Types and
Sources of Trash Very High High Medium Low
39.1 0.0% 0.0% 73.1% 26.9% Residential and K-12 School Pedestrian or vehicular-generated litter
TRASH MANAGEMENT AREA
8 City of San Pablo Long-Term Trash Reduction Plan
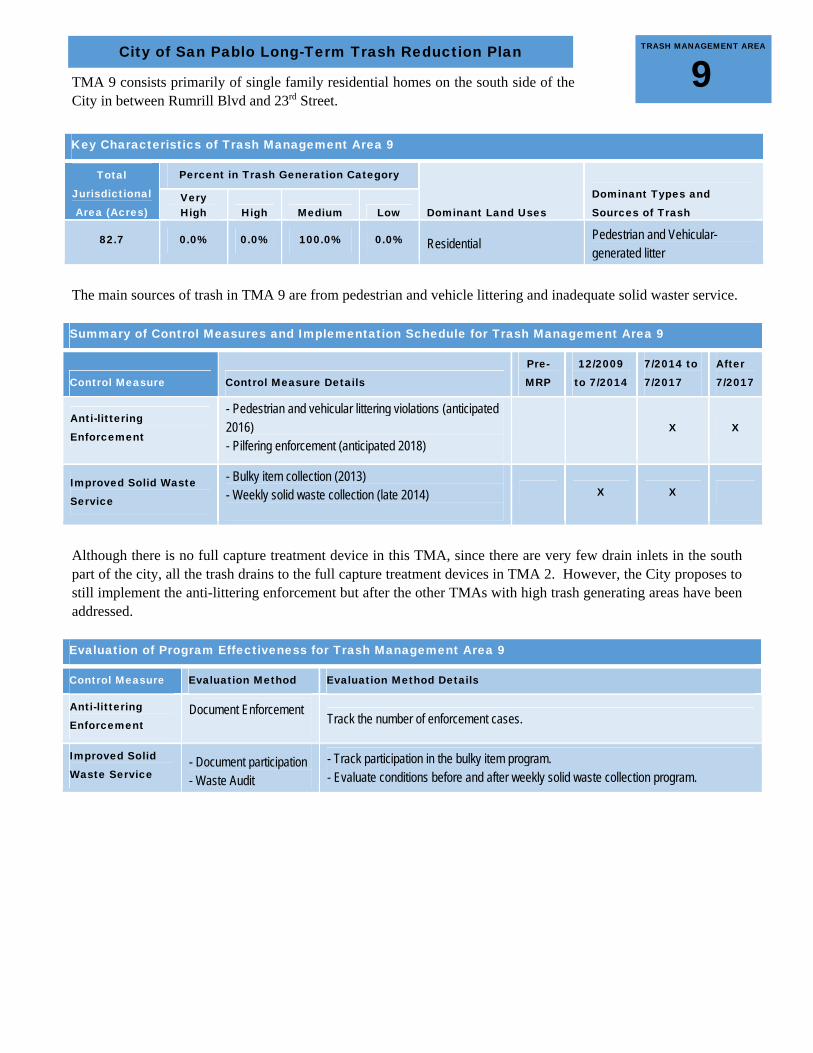
TMA 9 consists primarily of single family residential homes on the south side of the City in between Rumrill Blvd and 23rd Street.
The main sources of trash in TMA 9 are from pedestrian and vehicle littering and inadequate solid waster service. Summary of Control Measures and Implementation Schedule for Trash Management Area 9
Control Measure Control Measure Details
Pre-
MRP
12/2009
to 7/2014
7/2014 to
7/2017
After
7/2017
Anti-littering
Enforcement
- Pedestrian and vehicular littering violations (anticipated 2016) - Pilfering enforcement (anticipated 2018)
X X
Improved Solid Waste
Service
- Bulky item collection (2013) - Weekly solid waste collection (late 2014)
X X
Although there is no full capture treatment device in this TMA, since there are very few drain inlets in the south part of the city, all the trash drains to the full capture treatment devices in TMA 2. However, the City proposes to still implement the anti-littering enforcement but after the other TMAs with high trash generating areas have been addressed. Evaluation of Program Effectiveness for Trash Management Area 9
Control Measure Evaluation Method Evaluation Method Details
Anti-littering
Enforcement Document Enforcement
Track the number of enforcement cases.
Improved Solid
Waste Service - Document participation - Waste Audit
- Track participation in the bulky item program. - Evaluate conditions before and after weekly solid waste collection program.
Key Characteristics of Trash Management Area 9
Total
Jurisdictional
Area (Acres)
Percent in Trash Generation Category
Dominant Land Uses
Dominant Types and
Sources of Trash Very High High Medium Low
82.7 0.0% 0.0% 100.0% 0.0% Residential Pedestrian and Vehicular-generated litter
TRASH MANAGEMENT AREA
9 City of San Pablo Long-Term Trash Reduction Plan
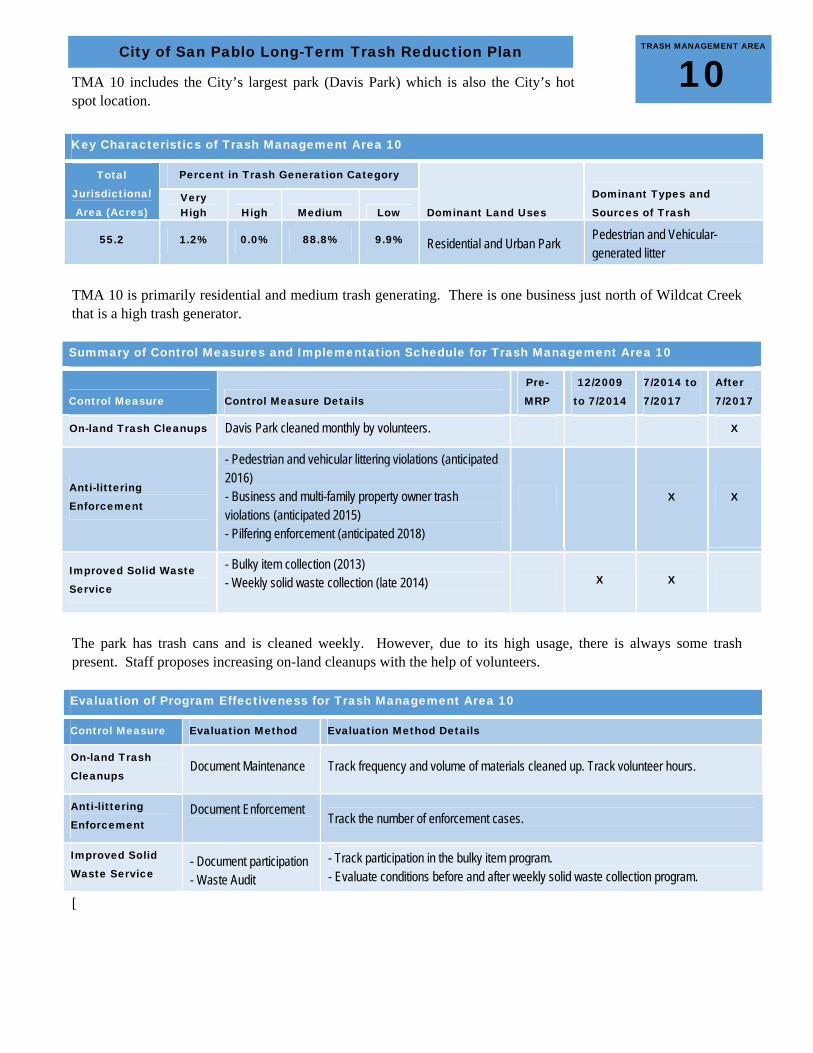
TMA 10 includes the City’s largest park (Davis Park) which is also the City’s hot spot location.
TMA 10 is primarily residential and medium trash generating. There is one business just north of Wildcat Creek that is a high trash generator. Summary of Control Measures and Implementation Schedule for Trash Management Area 10
Control Measure Control Measure Details
Pre-
MRP
12/2009
to 7/2014
7/2014 to
7/2017
After
7/2017
On-land Trash Cleanups Davis Park cleaned monthly by volunteers. X
Anti-littering
Enforcement
- Pedestrian and vehicular littering violations (anticipated 2016) - Business and multi-family property owner trash violations (anticipated 2015) - Pilfering enforcement (anticipated 2018)
X X
Improved Solid Waste
Service
- Bulky item collection (2013) - Weekly solid waste collection (late 2014)
X X
The park has trash cans and is cleaned weekly. However, due to its high usage, there is always some trash present. Staff proposes increasing on-land cleanups with the help of volunteers. Evaluation of Program Effectiveness for Trash Management Area 10
Control Measure Evaluation Method Evaluation Method Details
On-land Trash
Cleanups Document Maintenance Track frequency and volume of materials cleaned up. Track volunteer hours.
Anti-littering
Enforcement Document Enforcement
Track the number of enforcement cases.
Improved Solid
Waste Service - Document participation - Waste Audit
- Track participation in the bulky item program. - Evaluate conditions before and after weekly solid waste collection program.
[
Key Characteristics of Trash Management Area 10
Total
Jurisdictional
Area (Acres)
Percent in Trash Generation Category
Dominant Land Uses
Dominant Types and
Sources of Trash Very High High Medium Low
55.2 1.2% 0.0% 88.8% 9.9% Residential and Urban Park Pedestrian and Vehicular-generated litter
TRASH MANAGEMENT AREA
10 City of San Pablo Long-Term Trash Reduction Plan
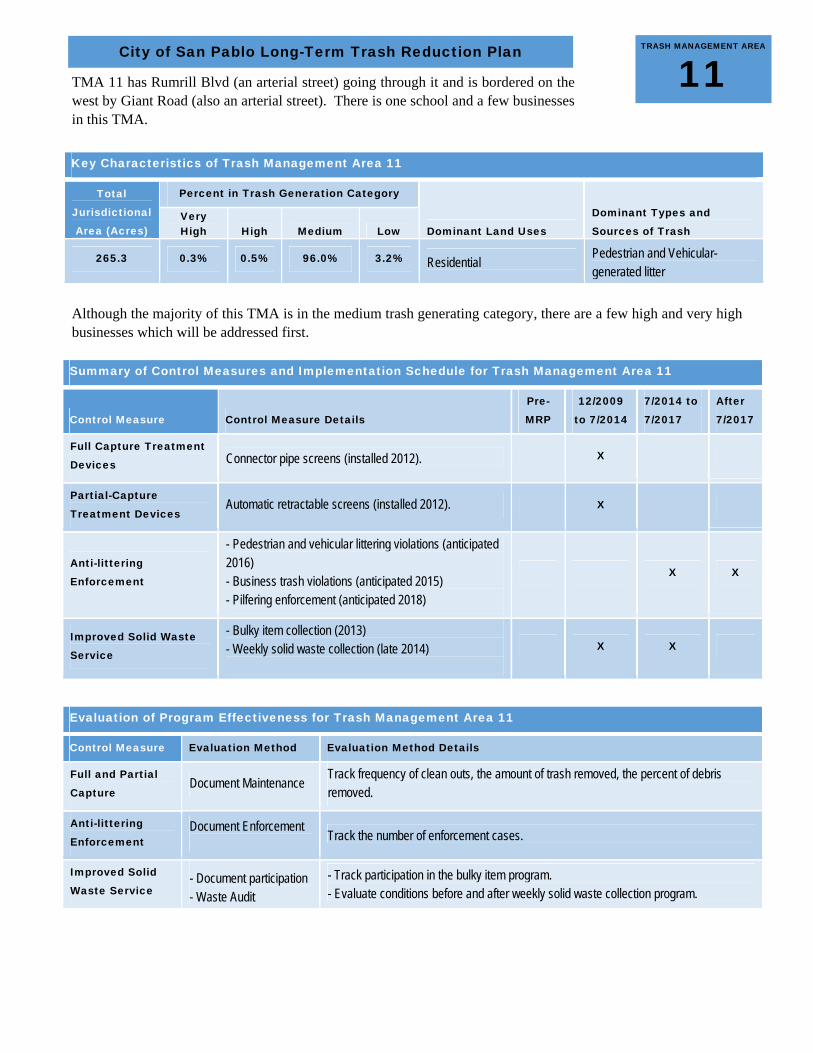
TMA 11 has Rumrill Blvd (an arterial street) going through it and is bordered on the west by Giant Road (also an arterial street). There is one school and a few businesses in this TMA.
Although the majority of this TMA is in the medium trash generating category, there are a few high and very high businesses which will be addressed first. Summary of Control Measures and Implementation Schedule for Trash Management Area 11
Control Measure Control Measure Details
Pre-
MRP
12/2009
to 7/2014
7/2014 to
7/2017
After
7/2017
Full Capture Treatment
Devices Connector pipe screens (installed 2012). X
Partial-Capture
Treatment Devices Automatic retractable screens (installed 2012). X
Anti-littering
Enforcement
- Pedestrian and vehicular littering violations (anticipated 2016) - Business trash violations (anticipated 2015) - Pilfering enforcement (anticipated 2018)
X X
Improved Solid Waste
Service
- Bulky item collection (2013) - Weekly solid waste collection (late 2014)
X X
Evaluation of Program Effectiveness for Trash Management Area 11
Control Measure Evaluation Method Evaluation Method Details
Full and Partial
Capture Document Maintenance
Track frequency of clean outs, the amount of trash removed, the percent of debris removed.
Anti-littering
Enforcement Document Enforcement
Track the number of enforcement cases.
Improved Solid
Waste Service - Document participation - Waste Audit
- Track participation in the bulky item program. - Evaluate conditions before and after weekly solid waste collection program.
Key Characteristics of Trash Management Area 11
Total
Jurisdictional
Area (Acres)
Percent in Trash Generation Category
Dominant Land Uses
Dominant Types and
Sources of Trash Very High High Medium Low
265.3 0.3% 0.5% 96.0% 3.2% Residential Pedestrian and Vehicular-generated litter
TRASH MANAGEMENT AREA
11 City of San Pablo Long-Term Trash Reduction Plan
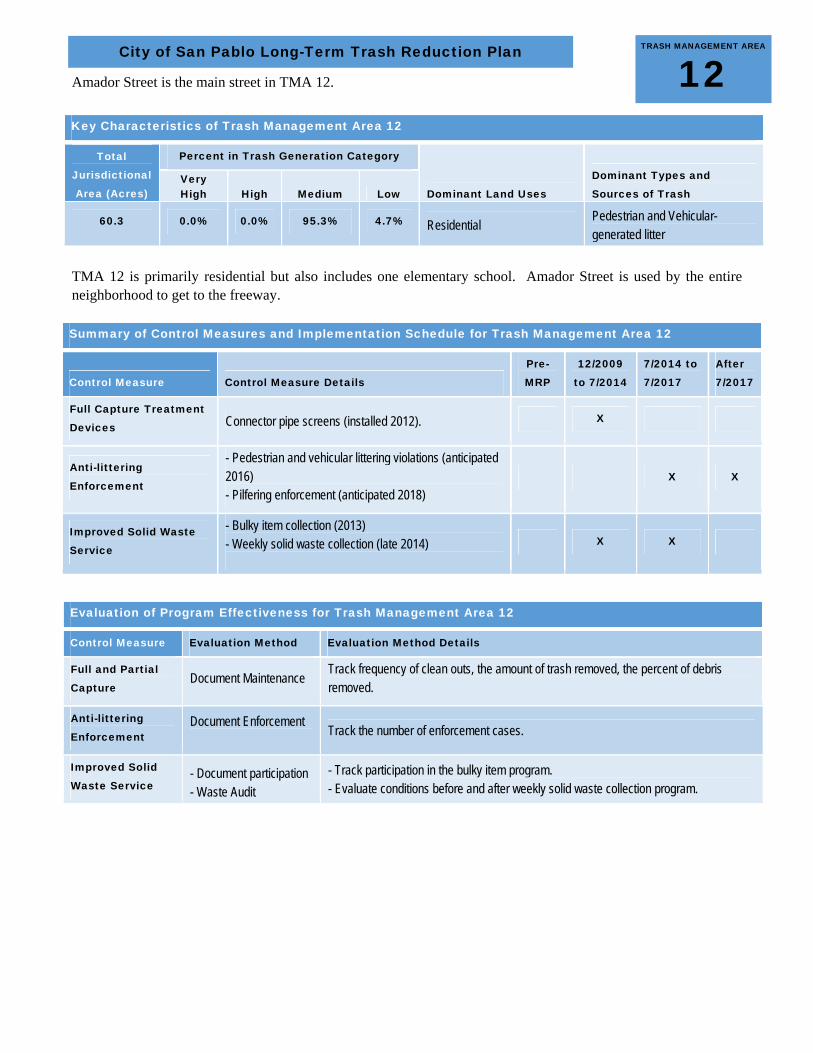
Amador Street is the main street in TMA 12.
TMA 12 is primarily residential but also includes one elementary school. Amador Street is used by the entire neighborhood to get to the freeway. Summary of Control Measures and Implementation Schedule for Trash Management Area 12
Control Measure Control Measure Details
Pre-
MRP
12/2009
to 7/2014
7/2014 to
7/2017
After
7/2017
Full Capture Treatment
Devices Connector pipe screens (installed 2012). X
Anti-littering
Enforcement
- Pedestrian and vehicular littering violations (anticipated 2016) - Pilfering enforcement (anticipated 2018)
X X
Improved Solid Waste
Service
- Bulky item collection (2013) - Weekly solid waste collection (late 2014)
X X
Evaluation of Program Effectiveness for Trash Management Area 12
Control Measure Evaluation Method Evaluation Method Details
Full and Partial
Capture Document Maintenance
Track frequency of clean outs, the amount of trash removed, the percent of debris removed.
Anti-littering
Enforcement Document Enforcement
Track the number of enforcement cases.
Improved Solid
Waste Service - Document participation - Waste Audit
- Track participation in the bulky item program. - Evaluate conditions before and after weekly solid waste collection program.
Key Characteristics of Trash Management Area 12
Total
Jurisdictional
Area (Acres)
Percent in Trash Generation Category
Dominant Land Uses
Dominant Types and
Sources of Trash Very High High Medium Low
60.3 0.0% 0.0% 95.3% 4.7% Residential Pedestrian and Vehicular-generated litter
TRASH MANAGEMENT AREA
12 City of San Pablo Long-Term Trash Reduction Plan
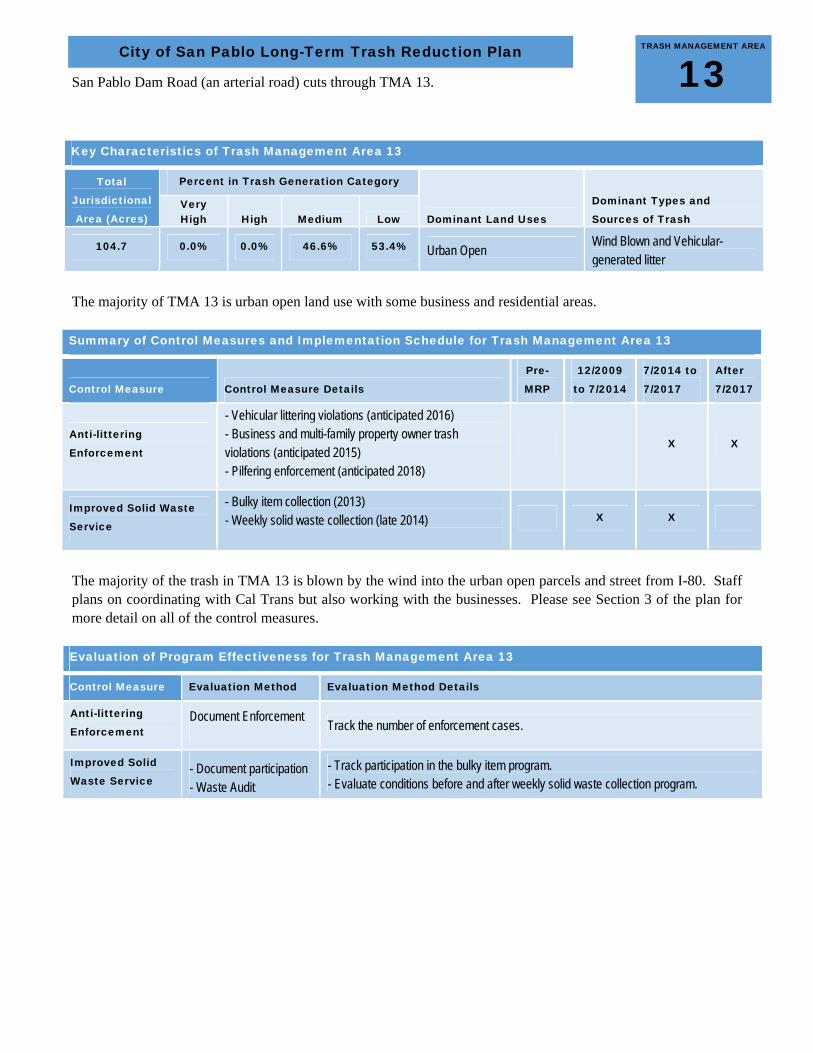
San Pablo Dam Road (an arterial road) cuts through TMA 13.
The majority of TMA 13 is urban open land use with some business and residential areas. Summary of Control Measures and Implementation Schedule for Trash Management Area 13
Control Measure Control Measure Details
Pre-
MRP
12/2009
to 7/2014
7/2014 to
7/2017
After
7/2017
Anti-littering
Enforcement
- Vehicular littering violations (anticipated 2016) - Business and multi-family property owner trash violations (anticipated 2015) - Pilfering enforcement (anticipated 2018)
X X
Improved Solid Waste
Service
- Bulky item collection (2013) - Weekly solid waste collection (late 2014)
X X
The majority of the trash in TMA 13 is blown by the wind into the urban open parcels and street from I-80. Staff plans on coordinating with Cal Trans but also working with the businesses. Please see Section 3 of the plan for more detail on all of the control measures. Evaluation of Program Effectiveness for Trash Management Area 13
Control Measure Evaluation Method Evaluation Method Details
Anti-littering
Enforcement Document Enforcement
Track the number of enforcement cases.
Improved Solid
Waste Service - Document participation - Waste Audit
- Track participation in the bulky item program. - Evaluate conditions before and after weekly solid waste collection program.
Key Characteristics of Trash Management Area 13
Total
Jurisdictional
Area (Acres)
Percent in Trash Generation Category
Dominant Land Uses
Dominant Types and
Sources of Trash Very High High Medium Low
104.7 0.0% 0.0% 46.6% 53.4% Urban Open Wind Blown and Vehicular-generated litter
TRASH MANAGEMENT AREA
13 City of San Pablo Long-Term Trash Reduction Plan
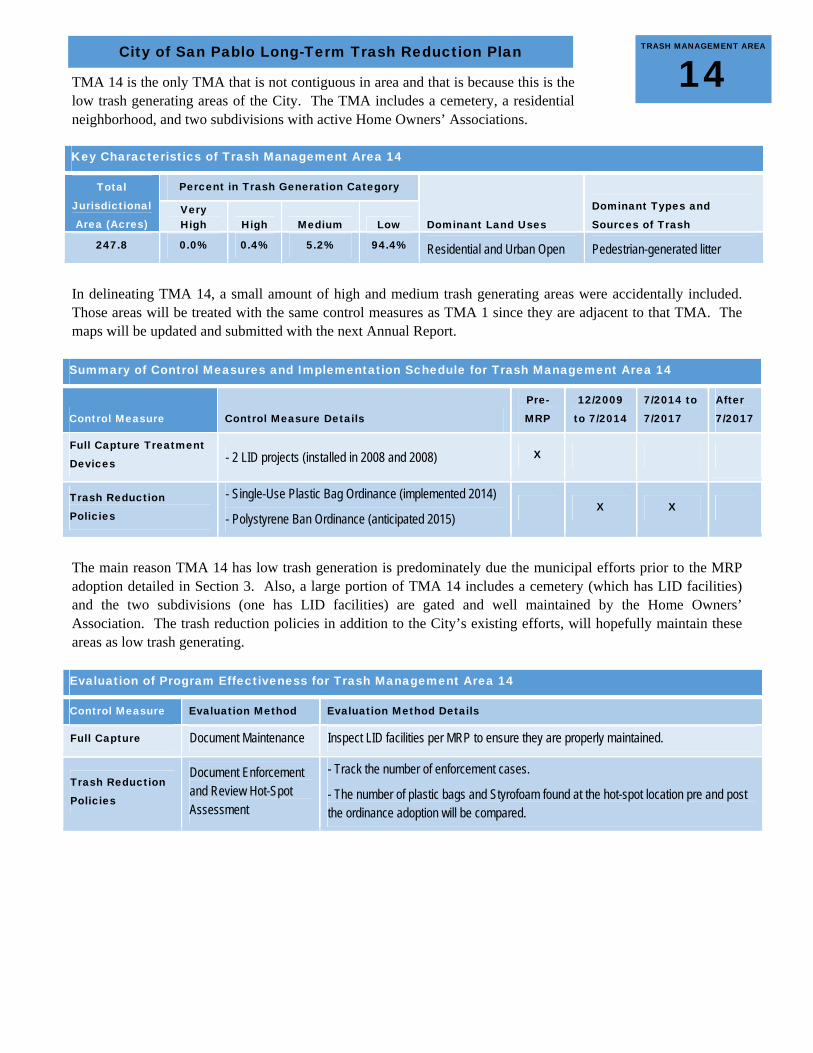
TMA 14 is the only TMA that is not contiguous in area and that is because this is the low trash generating areas of the City. The TMA includes a cemetery, a residential neighborhood, and two subdivisions with active Home Owners’ Associations.
In delineating TMA 14, a small amount of high and medium trash generating areas were accidentally included. Those areas will be treated with the same control measures as TMA 1 since they are adjacent to that TMA. The maps will be updated and submitted with the next Annual Report. Summary of Control Measures and Implementation Schedule for Trash Management Area 14
Control Measure Control Measure Details
Pre-
MRP
12/2009
to 7/2014
7/2014 to
7/2017
After
7/2017
Full Capture Treatment
Devices - 2 LID projects (installed in 2008 and 2008) X
Trash Reduction
Policies
- Single-Use Plastic Bag Ordinance (implemented 2014)
- Polystyrene Ban Ordinance (anticipated 2015) X X
The main reason TMA 14 has low trash generation is predominately due the municipal efforts prior to the MRP adoption detailed in Section 3. Also, a large portion of TMA 14 includes a cemetery (which has LID facilities) and the two subdivisions (one has LID facilities) are gated and well maintained by the Home Owners’ Association. The trash reduction policies in addition to the City’s existing efforts, will hopefully maintain these areas as low trash generating. Evaluation of Program Effectiveness for Trash Management Area 14
Control Measure Evaluation Method Evaluation Method Details
Full Capture Document Maintenance Inspect LID facilities per MRP to ensure they are properly maintained.
Trash Reduction
Policies
Document Enforcement and Review Hot-Spot Assessment
- Track the number of enforcement cases.
- The number of plastic bags and Styrofoam found at the hot-spot location pre and post the ordinance adoption will be compared.
Key Characteristics of Trash Management Area 14
Total
Jurisdictional
Area (Acres)
Percent in Trash Generation Category
Dominant Land Uses
Dominant Types and
Sources of Trash Very High High Medium Low
247.8 0.0% 0.4% 5.2% 94.4% Residential and Urban Open Pedestrian-generated litter
TRASH MANAGEMENT AREA
14 City of San Pablo Long-Term Trash Reduction Plan

Non-Jurisdictional (Dot color = Generation Category)
Trash Generation Category
Legend
Low
Medium
High
Very High
Full-Capture Location")
k!j Creek/Shoreline Hotspot
Full Trash Capture
Streets
Agency Boundary
Creeks
Parcel Boundary
k!jSPB-01
80
Sa
n P
abl
o A
ve
Gia
nt R
d
23R
d S
t
Hilltop Dr
Rheem Ave
20
20T
h S
t
Pine Ave
Richmond Pky
Dover Ave
Shane D
r
21S
t St
11T
h S
t
Moyers
Rd
Lowell Ave
Market Ave
Groom Dr
19T
h S
t
Vale
Rd
Andrade Ave
Blu
me
Dr
Am
ador St
Stanton Ave
Emeric Ave
17T
h S
t
Maricopa Ave
Miner Ave
Brookside Dr
Church Ln
Jo Ann D
r
Mcbryde Ave
Dunn Ave 29T
h S
t
Humphrey Ave
Costa Ave
Hillcrest Rd
Sutter Ave
Rivers St
14T
h S
t
Rollingwood Dr
28T
h S
t
Tulare Ave
San Pablo Dam Rd
12T
h S
t
34T
h S
t
Hellings Ave
Sanford Ave
13T
h S
t
32N
d S
t
Bo
nita R
d
California Ave
Broadway Ave
Coalinga Ave
18T
h S
t
15T
h S
t
El Portal Dr
Rumrill Blvd
Wiswall Dr
Ridge Rd
Lake St
Mas
on S
t
Hillview
Dr
Arlington Blvd
Alpine Rd
22N
d S
t
Bush Ave
Robert H Miller D
r
Col
lins
Ave
John Ave
Brook Way
Espanola Dr24
Th
St
Tyle
r S
t
Gilma Dr
Robert Miller Dr
Palmer Ave
Bar
nard
St
Birmingham
Dr
Hilltop Mall Rd
25T
h S
t
Griffin Dr
Park Ave
Hay
es
St
Oxford Ave
Moran Ave
Barkley D
r
Parker Rd
26T
h S
t
Auto Plz
Pow
ell S
t
Van
Nes
s S
t
Arundel Way
Manor Dr
36T
h S
t
Wilart D
r
Wilcox Ave
Lancaster Dr
Devon Way
Yuba S
t
Visalia Ave
Kern S
t
Morton Ave
Chevy Way
Fo
rdh
am S
t
Mckenzie Dr
Del
Cam
ino
Dr
Alfreda Blvd
Williams Dr
Stone St
Gre
enw
ood
Dr
Lassen St
Lakeside Dr
Kel
ley
Ave
Ba
yo Vista A
ve
Alta
Mira
Dr
Ventura S
t
Garrity Way
Verdi
Duke Ave
Loyola Ave
Sonoma St
Colette
Dr
Vill
a D
r
Morrow Dr
10T
h S
t
Avo
n Ln
Marin Ave
Folsom Ave
Jen
kins
Way
Sto
negl
en
Mission Ave
Pul
lman
St
Man
ches
ter A
ve
Parr Blvd
Mis
sion
Bel
l Dr
Highgate Dr
Monterey A
ve
Mac
arth
ur A
ve
Bowhill Ln
Gonzaga Ave
O Brien Rd
Trenton Blvd
Miflin Ave
Erl
a W
ay
Gateview Cir
Fairmede Dr
Bernhard Ave
Mclaughlin S
t
Glenn Ave
Cla
re S
t
Glenlock S
t
Bea
u R
ivag
e
Kirk Ln
Mullens Dr
Yuba A
ve
Johnson Dr
Canterbury Dr
Mer
ritt A
ve
Fill
mor
e S
t
Willow Rd
Bradford Dr
Henderson Dr
Standard Ave
Groveview Dr
Annapolis Ave
16T
h S
t
Rose Arbor Ave
Acapulco Dr
Lovegrove Ave
Gomer Dr
Mcg
lothen
Way
Harrison Dr
Ba
ncro
ft L
n
Rum
ril B
lvd
Belfa
st W
ay
Douglas St
Pablo Vista Ave
Montoya Ave
Howard St
Ventura A
ve
Benjamin Dr
Nor
thrid
ge D
r
Colin St
Ralston A
ve
Glynis Dr
Gerald A
ve
Joe
l Ct
Gian
t Hw
y
Klose Way
Mo
raga R
d
Contra C
osta Ave
Manzanilla Dr
Research Dr
Oha
re A
ve
Crucero Ave
Overlook Way
Wyman St
Rumrill Rd
Hull D
r
Carlfield Rd
Treeside Way
Casin
o Ave
Bolduc Ct
Aberdeen Way
Marelia Ct
Iola Ave
Post Ave
Evens Ave
Braga Ln
Riverside Ave
Phillips C
t
Bayview Ave
Hum
boldt St
Cam
pus
Dr
Rid
gew
ood
Way
Vale
ncia
Way
Longview Dr
Regina Ave
Vic
tori
a C
t
Hum
boldt Ave
Leke
Wa
y
Stonington AveMesa Buena Ave
Chesley Ave
University Ave
Harbor V
iew A
ve
Parkview Ter
Connecticut Ave
27T
h S
t
Everg
reen
Ter
Bayw
ood Ln
Clement Ave
Sunleaf Way
Chattleton Ln
Barbara Ln
Madrone Way
Mulford Way
Larchmo
nt Ln
College Ln
Barth Ave
She
ffiel
d C
t
Juarez C
t
Wes
t C
t
Jean Ct
Homestead Cir
Shasta Ave
Wes
tgat
e C
ir
Las Moradas Cir
Mor
ning
Sun
Dr
Ala
n C
t
Car
diff
Ct
Austin Ct
Castro S
t
Alpine C
t
Eas
t Ct
Alv
ara
do S
q
Baker St
Dod
son
St
Frie
da C
t
Shirley Ave
Randy Ln
Westview Pl
Bro
oksi
de A
ve
Regello Ct
Kathlee Ave
Southridge Dr
Jud
ith C
t
Natalie Ct
Drake Way
Miflin Ct
Don
Way
Parkgate Ct
Mu
rra C
t
Cedar
Ter
Bro
okha
ven
Ct
Bouquet Ave
Wildcat Canyon Pky
Mar
ia V
ega
Ct
Cut
hbe
rtso
n C
t
Short Ave
Wanlass AveC
astr
o R
d
Duk
e P
ath
Glasgow Ct
Broadwalk Pl
Cherry
wood
Ct
Groveview Ct
Leeds Ct
Carlton Ct
Hidalgo C
t
La Puerta Rd
Muir Ave
Bristol Ct
Cla
rend
on C
t
Redwood Cir
Hannon Dr
Pine
woo
d Te
r
Cha
parr
al C
t
Manzanilla C
t
Center C
t
Pointview Ln
Campo Verde Cir
Marquette C
t
Wis
wal
l Ct
Grand Canyon Ave
Oak
woo
d C
t
Esp
anol
a C
t
Dim
m W
ay
20T
h S
t
Visalia Ave
Yuba Ave
Arlington B
lvd
El P
ortal D
r
26T
h S
t
Willow Rd
Riverside Ave
16T
h S
t
Rumrill Blvd
18T
h S
t
17T
h S
t
Shasta Ave
14T
h S
t
24T
h S
t
19T
h S
t
15T
h S
t
Robert Mille
r Dr
Rum
rill B
lvd
Mer
ritt A
ve
Rumril Blvd
21S
t St
18T
h S
t
Post Ave
17T
h S
t
Lake St
80
Casino Ave
19T
h S
t
Broadway Ave
20
15T
h S
t
17T
h S
t
Blume Dr
Bush Ave
20T
h S
t
Rumrill
Blvd
22N
d S
t
16T
h S
t
Mcbryde Ave
Rivers St
21S
t St
Richmond P
ky
Bush Ave
22N
d S
t
Glenn Ave
Sanford Ave
13T
h S
t
Robert H Miller Dr
18T
h S
t
Rumrill Blvd
19T
h S
t
Marin A
ve
Rheem Creek
Wildcat Creek
San Pablo Creek
Garrity Creek
Sources: Esri, DeLorme, NAVTEQ, TomTom, Intermap, increment P Corp., GEBCO, USGS, FAO, NPS, NRCAN, GeoBase, IGN, Kadaster NL, Ordnance Survey, Esri Japan, METI, Esri China (Hong Kong), swisstopo, and the GIS UserCommunity
±0 0.2 0.40.1 Miles
Data Sources: Roads: Tele Atlas City Boundaries: Contra Costa County Background: ESRI World Topographic Map
Map Created By: EOA, Inc. Date: December 6th, 2013
City of San Pablo Trash Generation Map
Non-Jurisdictional (Dot color = Generation Category)
Trash Generation Category
Legend
Low
Medium
High
Very High
k!j Creek/Shoreline Hotspot Streets
Agency Boundary
Creeks
Parcel Boundary

Non-Jurisdictional (Dot color = Generation Category)
Trash Generation Category
Legend
Low
Medium
High
Very High
Full-Capture Location")
k!j Creek/Shoreline Hotspot
Full Trash Capture
Streets
Agency Boundary
Creeks
Parcel BoundaryNon-Jurisdictional (Dot color = Generation Category)
Trash Generation Category
Legend
Low
Medium
High
Very High
k!j Creek/Shoreline Hotspot
Trash Management Area
Streets
Agency Boundary
Creeks
Parcel Boundary
k!jSPB-01
2
1
11
3
9
14
13
8
14
12
1014
4
57
6
4
80
Sa
n P
abl
o A
ve
Gia
nt R
d
23R
d S
t
Hilltop Dr
Rheem Ave
20
20T
h S
t
Pine Ave
Richmond Pky
Dover Ave
Shane D
r
21S
t St
11T
h S
t
Moyers
Rd
Lowell Ave
Market Ave
Groom Dr
19T
h S
t
Vale
Rd
Andrade Ave
Blu
me
Dr
Am
ador St
Stanton Ave
Emeric Ave
17Th
St
Maricopa Ave
Miner Ave
Brookside Dr
Church Ln
Jo Ann D
r
Mcbryde Ave
Dunn Ave 29T
h S
t
Humphrey Ave
Costa Ave
Hillcrest Rd
Sutter Ave
Rivers St
14T
h S
t
Rollingwood Dr
28T
h S
t
Tulare Ave
San Pablo Dam Rd
12T
h S
t
34T
h S
t
Hellings Ave
Sanford Ave
13T
h S
t
32N
d S
t
Bo
nita R
d
California Ave
Broadway Ave
Coalinga Ave
18T
h S
t
15T
h S
t
El Portal Dr
Rumrill Blvd
Wiswall Dr
Ridge Rd
Lake St
Mas
on S
t
Hillview
Dr
Arlington Blvd
Alpine Rd
22N
d S
t
Bush Ave
Robert H Miller D
r
Col
lins
Ave
John Ave
Brook Way
Espanola Dr24
Th
St
Tyle
r S
t
Gilma Dr
Robert Miller Dr
Palmer Ave
Bar
nard
St
Birmingham
Dr
Hilltop Mall Rd
25T
h S
t
Griffin Dr
Park Ave
Hay
es
St
Oxford Ave
Moran Ave
Barkley D
r
Parker Rd
26T
h S
t
Auto Plz
Pow
ell S
t
Van
Nes
s S
t
Arundel Way
36T
h S
t
Wilart D
r
Wilcox Ave
Lancaster Dr
Devon Way
Yuba S
t
Visalia Ave
Kern S
t
Morton Ave
Chevy Way
Fo
rdh
am S
t
Mckenzie Dr
Del
Cam
ino
Dr
Alfreda Blvd
Williams Dr
Stone St
Gre
enw
ood
Dr
Lassen St
Lakeside Dr
Kel
ley
Ave
Ba
yo Vista A
ve
Alta
Mira
Dr
Ventura S
t
Garrity Way
Verdi
Duke Ave
Loyola Ave
Sonoma St
Colette
Dr
Vill
a D
r
Morrow Dr
10T
h S
t
Avo
n Ln
Marin Ave
Folsom Ave
Jen
kins
Way
Sto
negl
en
Mission Ave
Pul
lman
St
Man
ches
ter A
ve
Parr Blvd
Mis
sion
Bel
l Dr
Highgate Dr
Monterey A
ve
Macarthur A
ve
Bowhill Ln
Gonzaga Ave
O Brien Rd
Trenton Blvd
Miflin Ave
Erl
a W
ay
Gateview Cir
Fairmede Dr
Bernhard Ave
Mclaughlin S
t
Glenn Ave
Cla
re S
t
Glenlock S
t
Bea
u R
ivag
e
Kirk Ln
Mullens Dr
Yuba A
ve
Johnson Dr
Canterbury Dr
Mer
ritt A
ve
Fill
mor
e S
t
Willow Rd
Bradford Dr
Henderson Dr
Standard Ave
Groveview Dr
Annapolis Ave
16T
h S
t
Rose Arbor Ave
Acapulco Dr
Lovegrove Ave
Gomer Dr
Mcg
lothen
Way
Harrison Dr
Ba
ncro
ft L
n
Rum
ril B
lvd
Belfa
st W
ay
Douglas St
Pablo Vista Ave
Montoya Ave
Howard St
Ventura A
ve
Benjamin Dr
Nor
thrid
ge D
r
Colin St
Ralston A
ve
Glynis Dr
Gerald A
ve
Joe
l Ct
Gian
t Hw
y
Klose Way
Mo
raga R
d
Contra C
osta Ave
Manzanilla Dr
Research Dr
Ohare Ave
Crucero Ave
Overlook Way
Wyman St
Rumrill Rd
Hull D
r
Carlfield Rd
Treeside Way
Casino Ave
Bolduc Ct
Aberdeen Way
Iola Ave
Post Ave
Evens Ave
Braga Ln
Riverside Ave
Ba
rranca A
ve
Phillips C
t
Bayview Ave
Hum
boldt St
Cam
pus
Dr
Rid
gew
ood
Way
Vale
ncia
Way
Longview Dr
Regina Ave
Vic
tori
a C
t
Hum
boldt Ave
Leke
Wa
y
Stonington AveMesa Buena Ave
Chesley Ave
University Ave
Harbor V
iew A
ve
Parkview Ter
Connecticut Ave
27T
h S
t
Everg
reen
Ter
Bayw
ood Ln
Clement Ave
Sunleaf Way
Chattleton Ln
Barbara Ln
Madrone Way
Mulford Way
College Ln
Barth Ave
She
ffiel
d C
t
Juarez C
t
Wes
t C
t
Jean Ct
Homestead Cir
Shasta Ave
Wes
tgat
e C
ir
Las Moradas Cir
Mor
ning
Sun
Dr
Ala
n C
t
Car
diff
Ct
Austin Ct
Castro S
t
Alpine C
t
Eas
t Ct
Alv
ara
do S
q
Baker St
Dod
son
St
Frie
da C
t
Shirley Ave
Randy Ln
Westview Pl
Bro
oksi
de A
ve
Regello Ct
Kathlee Ave
Southridge Dr
Jud
ith C
t
Natalie Ct
Drake Way
Miflin Ct
Don
Way
Parkgate Ct
Mu
rra C
t
Cedar
Ter
Bro
okha
ven
Ct
Bouquet Ave
Wildcat Canyon Pky
Mar
ia V
ega
Ct
Cut
hbe
rtso
n C
t
Short Ave
Wanlass AveC
astr
o R
d
Duk
e P
ath
Glasgow Ct
Broadwalk Pl
Cherry
wood
Ct
Groveview Ct
Leeds Ct
Carlton Ct
Hidalgo C
t
La Puerta Rd
Muir Ave
Bristol Ct
Cla
rend
on C
t
Redwood Cir
Hannon Dr
Cha
parr
al C
t
Manzanilla C
t
Center C
t
Pointview Ln
Campo Verde Cir
Marquette C
t
Wis
wal
l Ct
Grand Canyon Ave
Oak
woo
d C
t
Dim
m W
ay
14T
h S
t
Richmond P
ky
20T
h S
t
Mer
ritt A
ve
21S
t St
20
Riverside Ave
16T
h S
t
Broadway Ave
18T
h S
t
Robert Mille
r Dr
Shasta Ave
16T
h S
t
Glenn Ave
19T
h S
t
15T
h S
t
24T
h S
t
Rum
rill B
lvd
Yuba Ave
Rumrill Blvd
Robert H Miller Dr
17T
h S
t
Post Ave
80
Lake St
17T
h S
t
19T
h S
t
22N
d S
t
Marin A
ve
15T
h S
t
18T
h S
t
Blume Dr
17T
h S
t
20T
h S
t
Rumrill
Blvd
Arlington B
lvd
Willow Rd
Mcbryde Ave
Rivers St
21S
t St
El P
ortal D
r
Bush Ave
22N
d S
t
Sanford Ave
13T
h S
t
Bush Ave
18T
h S
t
Rumrill Blvd
26T
h S
t
19T
h S
t
Visalia Ave
Rumril Blvd
Rheem Creek
Wildcat Creek
San Pablo Creek
Garrity Creek
Sources: Esri, DeLorme, NAVTEQ, TomTom, Intermap, increment P Corp., GEBCO, USGS, FAO, NPS, NRCAN, GeoBase, IGN, Kadaster NL, Ordnance Survey, Esri Japan, METI, Esri China (Hong Kong), swisstopo, and the GIS UserCommunity
±0 0.2 0.40.1 Miles
Data Sources: Roads: Tele Atlas City Boundaries: Contra Costa County Background: ESRI World Topographic Map
Map Created By: EOA, Inc. Date: December 6th, 2013
City of San Pablo Trash Management Areas Map
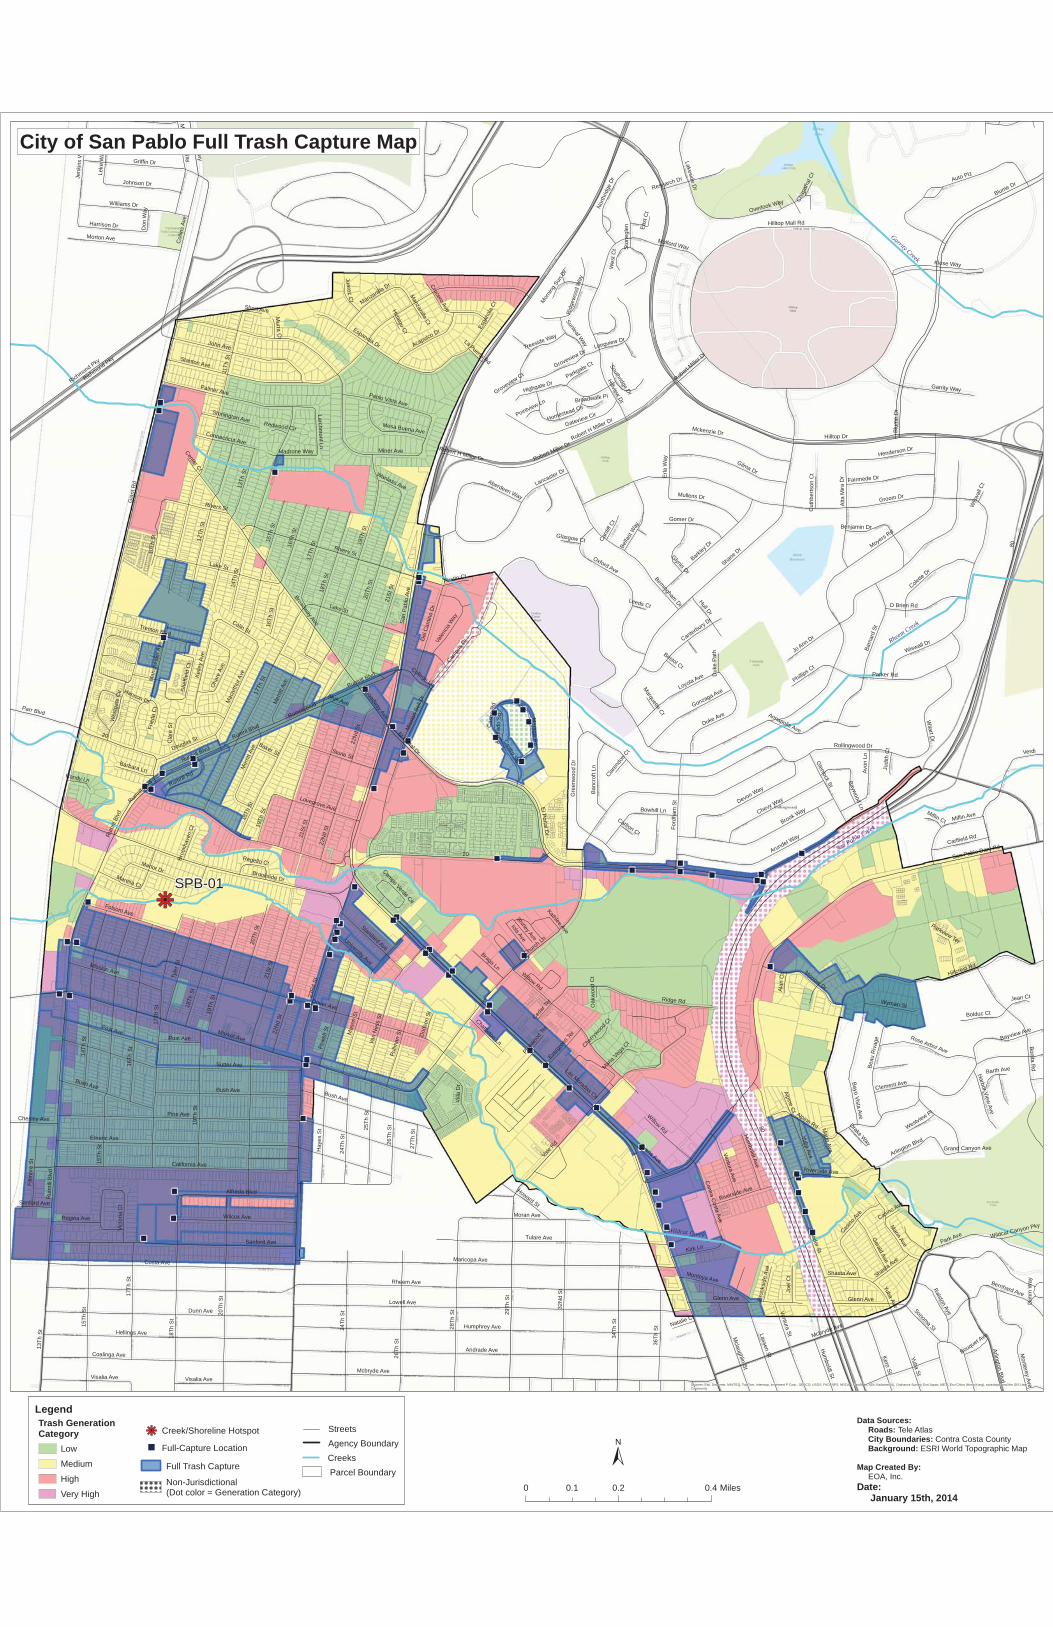
Non-Jurisdictional (Dot color = Generation Category)
Trash Generation Category
Legend
Low
Medium
High
Very High
k!j Creek/Shoreline Hotspot
Trash Management Area
Streets
Agency Boundary
Creeks
Parcel BoundaryNon-Jurisdictional (Dot color = Generation Category)
Trash Generation Category
Legend
Low
Medium
High
Very High
Full-Capture Location")
k!j Creek/Shoreline Hotspot
Full Trash Capture
Streets
Agency Boundary
Creeks
Parcel Boundary
k!jSPB-01
80
Sa
n P
abl
o A
ve
Gia
nt R
d
23R
d S
t
Hilltop Dr
Rheem Ave
20
20T
h S
t
Pine Ave
Richmond Pky
Dover Ave
Shane D
r
21S
t St
11T
h S
t
Moyers
Rd
Lowell Ave
Market Ave
Groom Dr
19T
h S
t
Vale
Rd
Andrade Ave
Blu
me
Dr
Am
ador St
Stanton Ave
Emeric Ave
17Th
St
Maricopa Ave
Miner Ave
Brookside Dr
Church Ln
Jo Ann D
r
Mcbryde Ave
Dunn Ave 29T
h S
t
Humphrey Ave
Costa Ave
Hillcrest Rd
Sutter Ave
Rivers St
14T
h S
t
Rollingwood Dr
28T
h S
t
Tulare Ave
San Pablo Dam Rd
12T
h S
t
34T
h S
t
Hellings Ave
Sanford Ave
13T
h S
t
32N
d S
t
Bo
nita R
d
California Ave
Broadway Ave
Coalinga Ave
18T
h S
t
15T
h S
t
El Portal Dr
Rumrill Blvd
Wiswall Dr
Ridge Rd
Lake St
Mas
on S
t
Hillview
Dr
Arlington Blvd
Alpine Rd
22N
d S
t
Bush Ave
Robert H Miller D
r
Col
lins
Ave
John Ave
Brook Way
Espanola Dr24
Th
St
Tyle
r S
t
Gilma Dr
Robert Miller Dr
Palmer Ave
Bar
nard
St
Birmingham
Dr
Hilltop Mall Rd
25T
h S
t
Griffin Dr
Park Ave
Hay
es
St
Oxford Ave
Moran Ave
Barkley D
r
Parker Rd
26T
h S
t
Auto Plz
Pow
ell S
t
Van
Nes
s S
t
Arundel Way
Manor Dr
36T
h S
t
Wilart D
r
Wilcox Ave
Lancaster Dr
Devon Way
Yuba S
t
Visalia Ave
Kern S
t
Morton Ave
Chevy Way
Fo
rdh
am S
t
Mckenzie Dr
Del
Cam
ino
Dr
Alfreda Blvd
Williams Dr
Stone St
Gre
enw
ood
Dr
Lassen St
Lakeside Dr
Kel
ley
Ave
Ba
yo Vista A
ve
Alta
Mira
Dr
Ventura S
t
Garrity Way
Verdi
Duke Ave
Loyola Ave
Sonoma St
Colette
Dr
Vill
a D
r
Morrow Dr
10T
h S
t
Avo
n Ln
Marin Ave
Folsom Ave
Jen
kins
Way
Sto
negl
en
Mission Ave
Pul
lman
St
Man
ches
ter A
ve
Parr Blvd
Mis
sion
Bel
l Dr
Highgate Dr
Monterey A
ve
Mac
arth
ur A
ve
Bowhill Ln
Gonzaga Ave
O Brien Rd
Trenton Blvd
Miflin Ave
Erl
a W
ay
Gateview Cir
Fairmede Dr
Bernhard Ave
Mclaughlin S
t
Glenn Ave
Cla
re S
t
Glenlock S
t
Bea
u R
ivag
e
Kirk Ln
Mullens Dr
Yuba A
ve
Johnson Dr
Canterbury Dr
Mer
ritt A
ve
Fill
mor
e S
t
Willow Rd
Bradford Dr
Henderson Dr
Standard Ave
Groveview Dr
Annapolis Ave
16T
h S
t
Rose Arbor Ave
Acapulco Dr
Lovegrove Ave
Gomer Dr
Mcg
lothen
Way
Harrison Dr
Ba
ncro
ft L
n
Rum
ril B
lvd
Belfa
st W
ay
Douglas St
Pablo Vista Ave
Montoya Ave
Howard St
Ventura A
ve
Benjamin Dr
Nor
thrid
ge D
r
Colin St
Ralston A
ve
Glynis Dr
Gerald A
ve
Joe
l Ct
Gian
t Hw
y
Klose Way
Mo
raga R
d
Contra C
osta Ave
Manzanilla Dr
Research Dr
Oha
re A
ve
Crucero Ave
Overlook Way
Wyman St
Rumrill Rd
Hull D
r
Carlfield Rd
Treeside Way
Casin
o Ave
Bolduc Ct
Aberdeen Way
Marelia Ct
Iola Ave
Post Ave
Evens Ave
Braga Ln
Riverside Ave
Phillips C
t
Bayview Ave
Hum
boldt St
Cam
pus
Dr
Rid
gew
ood
Way
Vale
ncia
Way
Longview Dr
Regina Ave
Vic
tori
a C
t
Hum
boldt Ave
Leke
Wa
y
Stonington AveMesa Buena Ave
Chesley Ave
University Ave
Harbor V
iew A
ve
Parkview Ter
Connecticut Ave
27T
h S
t
Everg
reen
Ter
Bayw
ood Ln
Clement Ave
Sunleaf Way
Chattleton Ln
Barbara Ln
Madrone Way
Mulford Way
Larchmo
nt Ln
College Ln
Barth Ave
She
ffiel
d C
t
Juarez C
t
Wes
t C
t
Jean Ct
Homestead Cir
Shasta Ave
Wes
tgat
e C
ir
Las Moradas Cir
Mor
ning
Sun
Dr
Ala
n C
t
Car
diff
Ct
Austin Ct
Castro S
t
Alpine C
t
Eas
t Ct
Alv
ara
do S
q
Baker St
Dod
son
St
Frie
da C
t
Shirley Ave
Randy Ln
Westview Pl
Bro
oksi
de A
ve
Regello Ct
Kathlee Ave
Southridge Dr
Jud
ith C
t
Natalie Ct
Drake Way
Miflin Ct
Don
Way
Parkgate Ct
Mu
rra C
t
Cedar
Ter
Bro
okha
ven
Ct
Bouquet Ave
Wildcat Canyon Pky
Mar
ia V
ega
Ct
Cut
hbe
rtso
n C
t
Short Ave
Wanlass AveC
astr
o R
d
Duk
e P
ath
Glasgow Ct
Broadwalk Pl
Cherry
wood
Ct
Groveview Ct
Leeds Ct
Carlton Ct
Hidalgo C
t
La Puerta Rd
Muir Ave
Bristol Ct
Cla
rend
on C
t
Redwood Cir
Hannon Dr
Pine
woo
d Te
r
Cha
parr
al C
t
Manzanilla C
t
Center C
t
Pointview Ln
Campo Verde Cir
Marquette C
t
Wis
wal
l Ct
Grand Canyon Ave
Oak
woo
d C
t
Esp
anol
a C
t
Dim
m W
ay
20T
h S
t
Visalia Ave
Yuba Ave
Arlington B
lvd
El P
ortal D
r
26T
h S
t
Willow Rd
Riverside Ave
16T
h S
t
Rumrill Blvd
18T
h S
t
17T
h S
t
Shasta Ave
14T
h S
t
24T
h S
t
19T
h S
t
15T
h S
t
Robert Mille
r Dr
Rum
rill B
lvd
Mer
ritt A
ve
Rumril Blvd
21S
t St
18T
h S
t
Post Ave
17T
h S
t
Lake St
80
Casino Ave
19T
h S
t
Broadway Ave
20
15T
h S
t
17T
h S
t
Blume Dr
Bush Ave
20T
h S
t
Rumrill
Blvd
22N
d S
t
16T
h S
t
Mcbryde Ave
Rivers St
21S
t St
Richmond P
ky
Bush Ave
22N
d S
t
Glenn Ave
Sanford Ave
13T
h S
t
Robert H Miller Dr
18T
h S
t
Rumrill Blvd
19T
h S
t
Marin A
ve
Rheem Creek
Wildcat Creek
San Pablo Creek
Garrity Creek
Sources: Esri, DeLorme, NAVTEQ, TomTom, Intermap, increment P Corp., GEBCO, USGS, FAO, NPS, NRCAN, GeoBase, IGN, Kadaster NL, Ordnance Survey, Esri Japan, METI, Esri China (Hong Kong), swisstopo, and the GIS UserCommunity
±0 0.2 0.40.1 Miles
Data Sources: Roads: Tele Atlas City Boundaries: Contra Costa County Background: ESRI World Topographic Map
Map Created By: EOA, Inc. Date: January 15th, 2014
City of San Pablo Full Trash Capture Map