city of scotts valley wastewater treatment facility annual ... · 1 city of scotts valley...
TRANSCRIPT

1
CITY OF SCOTTS VALLEY WASTEWATER TREATMENT FACILITY
ANNUAL REPORT 2009 Plant Summary and Compliance Usually this is where we begin the annual report by saying that we didn’t record a single discharge violation in the previous year, and we can say that about 2009 once again; however, after reporting no violations in 2008, it was discovered that we, in fact, did have a discharge violation. In August of 2008 the City violated its discharge limit for TCDD equivalents (dioxin). We were not aware of the violation at the time the 2008 report was submitted. Dioxin is sampled using HVWS (high water volume sampling), a process that collects continuous sample flow for a 30-day period through a semi permeable membrane. This is a relatively new sample method and calculation methods vary and are not standardized. Our samples were analyzed at a contract laboratory and the data showed we had no violations. In early 2009, our new Senior Laboratory Analyst reviewed the previous year’s data and discovered that the calculation for determining compliance for the HVWS was not correct. We notified the Regional Water Quality Control Board and resubmitted the monitoring section of the 2008 annual report. Dioxin is a waste byproduct of combustion, chemical manufacturing, and chlorine bleaching and it is prevalent in every person, animal, and plant. Dioxin is not removed through the treatment process and no controllable sources exist in Scotts Valley. For the year 2009, effluent suspended solids averaged 7.0 mg/L (a 97.1% removal rate), effluent cBOD’s averaged 3.0 mg/L (a 98.7% removal rate), and effluent BOD’s averaged 4.0 mg/L (a 98.8% removal rate). Our compliance record is a direct result of a very knowledgeable and dedicated treatment plant staff that takes pride in their work and protecting the environment. Recycled water usage totaled 47.92 million gallons. The Scotts Valley Water District continues to pursue additional recycled water users so we anticipate that we will continue to see increased recycled water usage. On occasion, unexpected things happen that break up our normal workday routines. On January 14, Operator II, Mark Cattera found an antique diamond ring while performing routine cleaning of the sewer lines in the Lockewood Lane area of Scotts Valley. Mark has been with the City for 27 years and knows the area well. After work, Mark took it upon himself to visit a nearby retirement home and asked if there had been a report of a lost ring. There was immediate excitement as the facility had been tearing the plumbing apart trying to find a 93 old resident’s lost wedding/engagement ring! Mark returned the ring to its tearful owner who said Mark had restored her faith in mankind. Laboratory

2
In 2009, the EPA picked the City of Scotts Valley Wastewater Reclamation Facility Laboratory to participate in the Discharge Monitoring Report Quality Assurance (DMR-QA ) Study 29. DMR-QA covers major and some selected minor permit holders under the Clean Water Act’s National Pollutant Discharge Elimination System (NPDES), and plays a key role in monitoring the quality of data used to ensure the safety of the nation’s waters. This was the first time the lab has ever participated in a DMR-QA study. Like the Environmental Laboratory Accreditation Program (ELAP), the lab had to pass all laboratory performance tests, and is graded by the accredited Proficiency Testing Providers. All subcontract laboratories that the lab uses have to participate as well. The Laboratory successfully participated in the DMR-QA Study 29, along with the annual required ELAP performance evaluation. Early in 2009, our lab discovered that the 2008 dioxin data was not correct and, in fact, not in compliance. Interpreting HVWS (high volume water sampling) data is complex and relatively new to labs. It was not clearly reported from our subcontract lab what control spike values were used, and what dilutions were used upon extraction. This lack of information in turn affected the initial set up of the complex “water calculator” which is used to generate the final data points. The corrections were made and resubmitted later in the year of 2009. Laboratories used during 2009 were: Inorganic Chemistry: City of Scotts Valley Wastewater Reclamation Facility Lab 700 Lundy Lane Scotts Valley, CA 95066 ELAP Certificate No. 1062 Soil Control Lab 42 Hangar Way Watsonville, CA 95076 ELAP Certificate No. 1494 Metals and Organic Chemitsry: McCampbell Analytical, Inc. 1534 Willow Pass Rd. Pittsburg, CA 94565 ELAP Certificate No. 1644 Bioassay Testing:

3
Aquatic Testing Laboratories 4350 Transport Street, Unit 107 Ventura, CA 93003 ELAP Certificate No.1775 Toxscan Inc. Bioassay 42 Hangar Way Watsonville, CA 95076 NPDES Certificate No. CA0048828 Annual HVWS: Frontier Analytical Laboratory 5172 Hillsdale Circle El Dorado Hills, CA 95762 NELAP Certification No. CA02113 Lift Stations The City of Scotts Valley owns and operates seven lift stations at various locations throughout the City. All stations are inspected three times each week. During these routine inspections, hour readings are taken to verify normal running times and flow throughput, each pump is individually started and stopped to ensure proper operation, and wet-wells are visually inspected to confirm water levels with digital level reading on automatic pump controllers. Once each week, stations equipped with permanent emergency generators are tested on emergency power to ensure proper operation. Five stations are equipped with permanent emergency stand-by power. At this time, no other stations require permanent on-site emergency power, as limited flows allow ample time for City staff to respond to alarm conditions and provide portable generator power prior to overflows occurring. All of the City's seven stations have back-up pumps and alarm systems that automatically call 24-hour emergency personnel in case of a power outage or high-level conditions. Collection System After reporting two overflows in 2008, the City did not have one collection system overflow in 2009.

4
The City's sanitary sewer collection system is made up of approximately 40 miles of pipeline. City crews spend an average of two days each week performing preventative maintenance using a combination vacuum/hydro-jet truck to clean the lines. Source Control Program Industrial: There is one remaining significant industrial (SIU) user in the City of Scotts Valley: ThermoFisher, a categorical metal finishing industry (40 CFR 433.15). AVIZA Technology, Inc., previously also an SIU, is no longer discharging any industrial process wastewater. They are only discharging domestic wastewater; therefore they are no longer permitted as an industrial discharger. Aviza reported no violations of their wastewater discharge permit while they were still in operation in 2009. Likewise, ThermoFisher reported no violations of their wastewater discharge permit in 2009. Groundwater Remediation: There is a groundwater pump and treat site discharging to the sewer in the City of Scotts Valley, under a permit. The responsible parties for the site are Shell Oil Products US and ConocoPhillips, and the treatment system and reporting is managed by Delta Consultants. Discharge began on March 7, 2008. The site has met all permit conditions to date. It is understood that this site has received closure status from the Regional Water Quality Control Board and will soon cease to pump and treat groundwater. The City will close the permit and oversee the disconnection of the site to the sewer. All categorical industries and the groundwater pump and treat site in the City were monitored and permitted through the pretreatment program in 2009. The City began strictly enforcing stormwater regulations at light industries such as auto repair shops and restaurants. As a result, there were several exterior washing and exterior storage operations that were eliminated. Grease Trap Installation and Maintenance: The fats, oils, and greases (FOG) program is in place with most facilities operating in compliance with local ordinances. Source Control continues to routinely inspect and monitor the conditions of the grease interceptors operating in Scotts Valley. A Best Environmental Management Practices pamphlet is being used as a training tool for local restaurant managers and owners.

5
Maintenance and Repairs
• Installed new brush assembly on washer/compactor and influent pump station • New belts were installed on belt filter press • Installed chemical dispensing system at influent pump station for odor control • Purchased new 18 cubic yard dump truck for hauling dewatered sludge to Marina • Repaired leaks in aeration panels • Installed new diversion pump for tertiary filter influent and rebuilt old diversion pump
to be used for back-up • Replaced bearings on aeration blowers during annual maintenance • Installed new brushes on clarifier cleaning system • Purchased new fork-lift
O & M Manual The plant’s main operations and maintenance manual (O&M) was not changed during 2009; however, the plant’s O&M manual library was updated to include new equipment that was placed into service over the past year. Updating the plant’s O&M manual takes place on an ongoing basis. We have one O&M manual that is used for operational guidelines and minor service to plant equipment. We also catalog individual O&M’s for every piece of equipment in place at the treatment plant, collection system, and lift stations. Training
• All staff was retrained in the plants annual Red Cross Adult CPR and Standard First Aid Certification Program.
• All staff participates in the plant’s in-house safety/training meetings that are conducted every other Wednesday throughout the year.
• Operations staff participated in several one-day training classes and seminars related to wastewater treatment operations and maintenance.
• Senior Laboratory Analyst, Kathleen King, attended a California Rural Water Association one-day workshop in Monterey on Nitrification in the Distribution System
Public Outreach/Education The Monterey Bay Area Green Business Program continues to thrive. Goals of the green business program include promoting pollution prevention, waste minimization, and implementing best management practices that go above and beyond the regulatory standards. A Task Force consisting of multimedia regulators (stormwater, air, hazardous materials, as well as wastewater) and several non-profit organizations

6
continue to meet every quarter to coordinate the program. The program was expanded to begin certifying restaurants in July of 2004, plumbers in 2005, and office/retail facilities in 2006. In 2007, the program expanded to begin working with hotels/hospitality, custodial companies, beauty salons, and laundromats. In 2008, the program is now capable of servicing wineries, painters, and landscapers. In 2009, the program was expanded to begin servicing property management/multi-family dwellings, schools, medical facilities, and garment cleaners. A significant portion of the program for restaurants, hotels, and plumbers is dedicated to minimizing fats, oils, and greases (FOG) into the sanitary sewer. Currently, the Program has certified, or is in the process of certifying, over 200 businesses. There has been a dramatic increase in the number of businesses certified and the expansion of existing criteria to incentivize participation in innovative programs. Fifteen businesses are now certified in the City of Scotts Valley, up from seven the previous year. Most of these businesses have been advertised in a local paper and will be advertised again in the spring. City Staff, in collaboration with the County of Santa Cruz and other City agencies, were successful in obtaining a grant from the California Integrated Waste Management Board (CIWMB) in order to implement a pharmaceutical and sharps disposal program. The goal of the program was to provide a convenient and permanent system to collect used sharps and unwanted pharmaceuticals in the County of Santa Cruz. The County established 30 convenient, widely publicized, and well-known locations throughout the region for drop-off of sharps and pharmaceutical waste. Most of the sites are pharmacies, in addition one medical facility, all of the local household hazardous waste (HHW) facilities, and the Santa Cruz Police Station. There are three such sites in the City of Scotts Valley: two are pharmacies and one is a medical office. A plan has been worked out with Hospice of Santa Cruz County to begin a legal, Drug Enforcement Agency (DEA)-approved mail-back program for controlled substances. The program, dubbed Sharp Solutions for Home Medicines, has been highly publicized in the local media. Newspaper, television, and radio commercials were aired to communicate the program to the public. To date, the program has collected over 8 tons of sharps and pharmaceutical waste. The program will continue to collect household medicines and sharps to reduce water pollution and public health risks at the 30 permanent collection sites. Through this program, large quantities of pharmaceutical waste and sharps have been diverted from improper waste disposal channels such as the sewer systems and storm drains. Electronic Waste: On Saturday, September 12, 2009, the City of Scotts Valley conducted its 7th annual e-waste collection event. The City collected 31,000 pounds of electronics, mostly in the form of computers, monitors and television sets, from over 300 participants. These items are now banned from landfill disposal because of their hazardous material content of lead, mercury, and other heavy metals.

7
Appliance & Tire Collection: The City of Scotts Valley held its 6th annual Appliance and Tire Collection Event on Saturday, October 10. The 79 participants dropped off at total of 8 water heaters, 10 washers, 8 dryers, 14 oven/stoves, 9 refrigerators, 41 misc. small appliances and 275 tires. Scrap metal from appliances was shredded, melted and made into new metal products. Collected tires were ground into small pieces and will be recycled into rubber playground surfaces and rubber floor mats. On an annual basis, the treatment plant staff provides a number of ongoing public outreach/education services. Some of those services include:
• Oil Recycling: As a member of the County's regional oil recycling program, the City distributes oil recycling containers to local automotive supply stores where they are distributed to residents at no cost. The 2.5 gallon used oil containers have labels containing information on proper disposal practices and can be used throughout the county in any curbside collection program as part of the integrated regional program.
• Christmas Tree Recycling: Every year following the Thanksgiving Holiday on their three-times-weekly lift station rounds, operations staff delivers bundles of informational flyers to local Christmas tree vendors for distribution to residents and businesses. Flyers contain information on free tree collection and drop-off locations so that trees can be chipped and reused.
• As always, plant tours are encouraged and given upon request to any person or
group wishing to learn about the treatment process. Several individual and group tours were given in 2009.

8
NPDES PERMIT EFFLUENT VIOLATIONS 2000-2009
2000 2001 2002 2003 2004 2005 2006 2007 2008 2009
January 0 0 0 0 0 0 0 0 0 0February 0 0 0 0 0 0 0 0 0 0March 0 0 0 0 0 0 0 0 0 0April 0 0 0 0 0 0 0 0 0 0May 0 0 0 0 0 0 0 0 0 0June 0 0 0 0 0 0 0 0 0 0July 0 0 0 0 0 0 0 0 0 0August 0 0 0 0 0 0 0 0 1* 0September 0 0 0 0 0 0 0 0 0 0October 0 0 0 0 0 0 0 0 0 0November 0 0 0 0 0 0 0 0 0 0December 0 0 0 0 0 0 0 0 0 0
Total 0 0 0 0 0 0 0 0 1 0*TCDD

9
TABLE 1
2009 PLANT FLOW AND RAINFALL
Effluent Total Effluent Recycled Total Flow Daily Flow Plant Flow Inst. Max. Total Flow Rainfall
Million Gallons MGD Eff.+Rec.MGD MGD Million Gallons Inches (mnth avg)
(mnth avg) (peak) (Total)
January 28.806 0.816 0.833 2.26 0.517 2.13 February 35.732 1.067 1.083 3.91 0.467 17.43
March 34.371 0.909 0.948 3.80 1.216 2.50 April 28.224 0.690 0.817 3.73 3.825 0.50 May 31.909 0.617 0.790 2.24 5.380 1.41 June 29.429 0.487 0.732 2.28 7.361 0.01 July 29.921 0.450 0.725 2.28 8.516 0.00
August 30.754 0.502 0.758 2.26 7.919 0.00 September 28.970 0.554 0.757 3.73 6.102 0.28
October 32.938 0.765 0.847 3.94 2.522 8.45 November 28.769 0.677 0.776 1.95 2.971 0.37 December 30.868 0.781 0.817 2.45 1.121 4.92
Total 370.691 47.917 38.00 Average 30.891 0.693 0.824 2.90 3.993 3.17
Maximum 35.732 1.067 1.083 3.94 8.516 17.43 Minimum 28.224 0.450 0.725 1.95 0.467 0.00
ADDWF, MGD 0.752 Eff + Recycle
10
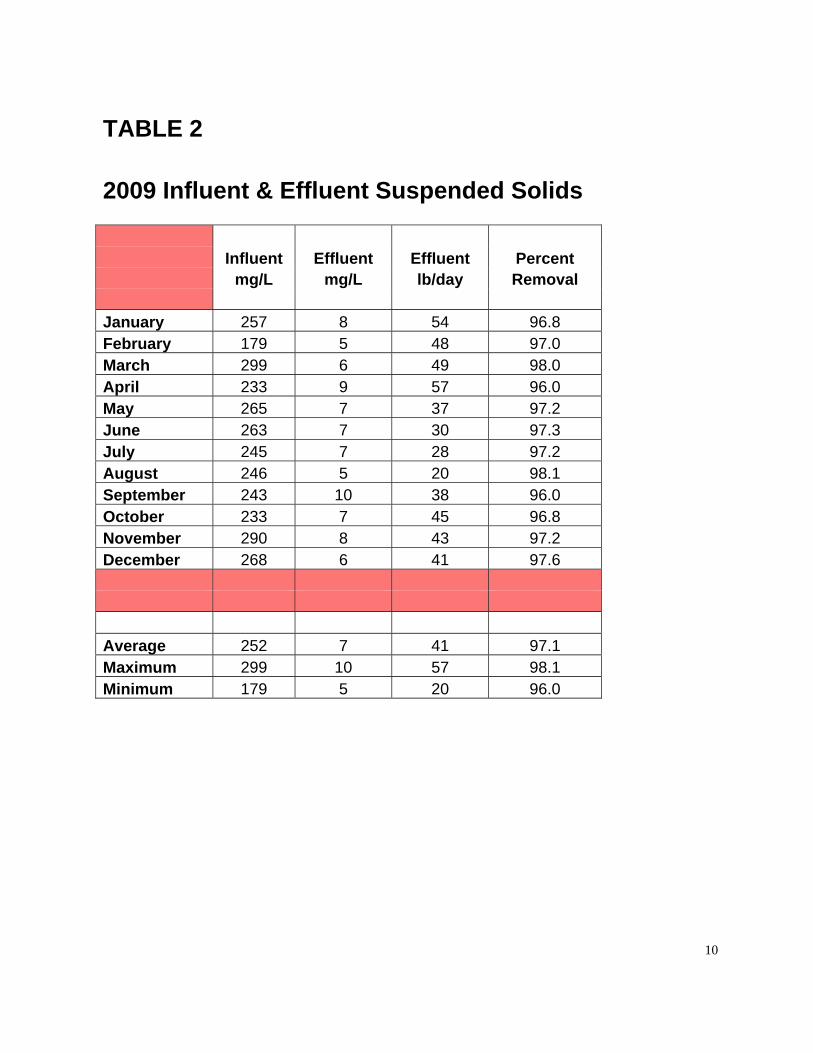
TABLE 2
2009 Influent & Effluent Suspended Solids
Influent Effluent Effluent Percent mg/L mg/L lb/day Removal January 257 8 54 96.8 February 179 5 48 97.0 March 299 6 49 98.0 April 233 9 57 96.0 May 265 7 37 97.2 June 263 7 30 97.3 July 245 7 28 97.2 August 246 5 20 98.1 September 243 10 38 96.0 October 233 7 45 96.8 November 290 8 43 97.2 December 268 6 41 97.6 Average 252 7 41 97.1 Maximum 299 10 57 98.1 Minimum 179 5 20 96.0

11
TABLE 3
2009 Influent & Effluent BOD & cBOD
Influent Effluent Effluent BOD Influent Effluent Effluent cBODBOD BOD BOD Percent cBOD cBOD cBOD Percentmg/L mg/L lb/day Removal mg/L mg/L lb/day Removal
January 394 5 34 98.8 265 4 27 98.5February 349 4 31 98.8 206 3 22 98.5March 358 4 35 98.8 208 3 24 98.6April 390 5 36 98.7 240 4 27 98.4May 393 5 36 98.7 234 4 28 98.3June 406 5 29 98.8 250 3 19 98.8July 394 3 11 99.1 253 2 8 99.0August 330 3 12 99.2 228 2 9 99.1September 342 4 26 98.7 221 4 21 98.4October 295 4 18 98.6 219 3 14 98.5November 325 4 19 98.7 246 3 15 98.7December 329 4 22 98.9 259 3 16 99.0
Average 359 4 26 98.8 236 3 19 98.7Maximum 406 5 36 99.2 265 4 28 99.1Minimum 295 3 11 98.6 206 2 8 98.3

12
TABLE 4
2009 Tertiary Effluent Nitrogen
InfluentTotal Nmg/Las N
January 0.39 1.2 2.9 < 0.1 55 91.8February < 0.22 < 1.0 4.5 < 0.1 53 91.6March < 0.28 1.6 4.8 < 0.1 53 88.0April < 0.28 1.8 5.4 < 0.1 62 88.4May < 0.28 1.8 3.2 < 0.1 64 92.2June < 0.28 1.6 4.7 < 0.1 71 91.1July < 0.28 1.2 4.8 < 0.1 63 90.4August < 0.28 1.5 4.8 < 0.1 63 90.1September < 0.28 1.6 4.6 < 0.1 66 90.7October < 0.28 2.0 4.6 < 0.2 61 89.1November < 0.28 4.5 5.0 < 0.2 69 86.2December < 0.28 1.3 7.9 < 0.2 66 86.0
Average < 0.28 1.7 4.8 < 0.1 62 89.6Maximum 0.39 4.5 7.9 < 0.2 71 92.2Minimum < 0.22 < 1.0 2.9 < 0.1 53 86.0
TertiaryAmmonia
mg/L as N
TertiaryOrganic N
mg/Las N
TertiaryNitratemg/Las N
TertiaryNitritemg/Las N
TertiaryNitrogenRemovalPercent

13
TABLE 5
2009 Influent & Effluent pH and Effluent Turbidity, Settleable Solids, and Oil & Grease
Influent Effluent Effluent Effluent Effluent EffluentpH pH Turbidity Settleable Oil & Grease Oil & Grease
Std Units Std Units NTU Solids mg/L lb/dayml/L
January 8.3 7.1 4.2 < 0.1 6 39February 8.1 7.1 3.0 < 0.1 < 5 < 35March 8.2 7.1 2.4 < 0.1 < 5 < 41April 8.3 7.2 2.8 < 0.1 < 5 < 34May 8.2 7.3 4.1 < 0.1 < 5 < 34June 8.2 7.3 4.5 < 0.1 < 5 < 31July 8.1 7.2 3.7 < 0.1 18 57August 8.1 7.2 4.6 < 0.1 < 5 < 24September 8.1 7.2 5.5 < 0.1 < 5 < 30October 8.1 7.2 8.7 < 0.1 < 5 < 22November 8.2 7.1 3.9 < 0.1 < 5 < 23December 8.1 7.0 2.8 < 0.1 < 5 < 30
Average 8.2 7.2 4.2 < 0.1 < 5 < 33Maximum 8.3 7.3 8.7 < 0.1 18 57Minimum 8.1 7.0 2.4 < 0.1 < 5 < 22

14
TABLE 6
2009 Effluent Chlorine Residual andBacteriological Quality
Chlorine Total FecalResidual Coliform Coliform Enterococcus
mg/L MPN/100mL MPN/100mL MPN/100mL@Santa Cruz
January 0.02 820 < 200 < 100February < 0.01 1,900 < 200 < 100March < 0.01 1,160 200 < 100April < 0.01 18,720 760 < 100May < 0.01 800 < 200 < 100June < 0.01 1,220 141 123July < 0.01 1,900 < 380 < 100August < 0.01 2,420 460 < 100September < 0.01 2,580 200 202October < 0.01 1,360 420 120November < 0.01 3,060 240 100December < 0.01 1,717 300 100
Geomean < 0.01 1,938 < 274 < 110Maximum 0.02 18,720 760 202Minimum < 0.01 800 < 200 < 100

15
TABLE 7
2009 Sludge Wasting
WAS WAS WAS Hours Sludge SludgeFlow Percent Metric Tons Pressed Cake Hauled
MG/mnth Solids per month per/mnth % Solids Tons/mnth(dry wt) (dry wt)
January 0.609 0.98 23.3 148 15.7 28.4February 0.594 0.95 23.2 132 15.5 29.1March 0.626 1.04 24.1 139 15.7 29.4April 0.586 0.99 21.4 132 15.7 26.6May 0.589 0.92 21.1 127 15.3 25.4June 0.631 0.90 22.8 130 15.6 25.8July 0.689 0.86 21.1 144 15.7 27.5August 0.599 0.83 20.3 119 15.4 22.7September 0.624 0.87 21.1 140 16.1 24.2October 0.631 0.79 18.7 135 15.8 24.8November 0.611 0.87 20.7 131 16.0 25.4December 0.664 0.95 22.5 145 15.9 29.8
Total 7.453 260.3 1,621 319.3Average 0.621 0.91 21.7 135 15.7 26.6Maximum 0.689 1.04 24.1 148 16.1 29.8Minimum 0.586 0.79 18.7 119 15.3 22.7

16
TABLE 8
2009 Plant Operating Parameters
Aerator Clarifier Total RAS MLSS Clar. SS MCRT F/M SVIlbs lbs lbs mg/L mg/L mg/L 7-day 7-day Ratio
January 13,949 6,870 20,819 9,651 5,546 1,623 8.7 0.20 162February 13,040 8,730 21,770 10,219 5,184 2,063 9.2 0.28 175March 12,403 7,446 19,849 9,779 4,931 1,760 8.3 0.26 168April 11,862 7,295 19,157 9,992 4,716 1,724 8.9 0.25 171May 12,288 6,694 18,982 8,994 4,885 1,582 8.9 0.25 176June 12,792 6,396 19,187 8,970 5,085 1,511 8.4 0.24 175July 12,586 6,286 18,871 8,543 5,004 1,485 9.1 0.24 181August 12,074 6,630 18,704 8,212 4,800 1,587 9.2 0.23 194September 12,632 7,709 20,341 8,270 5,022 1,822 9.6 0.22 185October 11,842 6,240 18,082 8,321 4,708 1,475 9.5 0.25 171November 12,900 6,718 19,618 8,488 5,128 1,588 9.2 0.21 175December 12,674 7,053 19,727 8,732 5,039 1,667 9.0 0.22 185
Average 12,587 7,006 19,592 9,014 5,004 1,657 9.0 0.24 176Maximum 13,949 8,730 21,770 10,219 5,546 2,063 9.6 0.28 194Minimum 11,842 6,240 18,082 8,212 4,708 1,475 8.3 0.20 162

17
FIGURE 1
0.00
5.00
10.00
15.00
20.00
25.00
30.00
35.00
40.00
Jan Feb Mar Apr May Jun Jul Aug Sep Oct Nov Dec
Inches or Million Gallons
2009 Rainfall & Monthly Plant Flow
Rainfall Total Flow
FIGURE 2

18
FIGURE 3
FIGURE 4
94%
95%
96%
97%
98%
99%
100%
Jan Feb Mar Apr May Jun Jul Aug Sep Oct Nov Dec
% Removal
2009 Plant Removal RatesTSS, BOD, cBOD
TSS Removal BOD Removal cBOD Removal

19
FIGURE 5
0123456789
050
100150200250300350400450
Jan Feb Mar Apr May Jun Jul Aug Sep Oct Nov Dec
Effluent, mg/L
Influent, mg/L
2009 Plant BOD
Influent BOD Effluent BOD
FIGURE 6
0
1
2
3
4
5
6
0
50
100
150
200
250
300
Jan Feb Mar Apr May Jun Jul Aug Sep Oct Nov Dec
Effluent, mg/L
Influent, mg/L
2009 Plant cBOD
Influent cBOD Effluent cBOD

20
FIGURE 7
0.0
1.0
2.0
3.0
4.0
5.0
6.0
7.0
8.0
9.0
Jan Feb Mar Apr May Jun Jul Aug Sep Oct Nov Dec
mg/L as N
2009 Tertiary PlantEffluent Nitrogen
Ammonia Organic N Nitrate Nitrite
FIGURE 8
75
80
85
90
95
100
0102030405060708090
100
Jan Feb Mar Apr May Jun Jul Aug Sep Oct Nov Dec
Tertiary N Removal, %
Influent Total N, mg/L
2009 Tertiary PlantNitrogen Removal
Influent Total N Tertiary Nitrogen Removal

21
FIGURE 9
6.4
6.6
6.8
7.0
7.2
7.4
7.6
7.8
8.0
8.2
8.4
Jan Feb Mar Apr May Jun Jul Aug Sep Oct Nov Dec
pH Units
2009 Plant pH
Influent pH Effluent pH
FIGURE 10
0.0
1.0
2.0
3.0
4.0
5.0
6.0
7.0
8.0
9.0
10.0
Jan Feb Mar Apr May Jun Jul Aug Sep Oct Nov Dec
NTU or ml/l
2009 Plant Effluent Turbidity & Settleable Solids
Effluent Turbidity, NTU Effluent Settleable Solids, ml/l

22
FIGURE 11
0612182430
3642485460
02468
10
1214161820
Jan Feb Mar Apr May Jun Jul Aug Sep Oct Nov Dec
lb/day
mg/L
2009 Effluent Oil & Grease
Oil & Grease mg/L Oil & Grease lb/day
FIGURE 12
0.00
0.01
0.01
0.02
0.02
0.03
Jan Feb Mar Apr May Jun Jul Aug Sep Oct Nov Dec
mg/L
2009 Plant Effluent Chlorine Residual@ Santa Cruz
Plant Effluent Chlorine Residual

23
FIGURE 13
0
1
10
100
1,000
10,000
100,000
Jan Feb Mar Apr May Jun Jul Aug Sep Oct Nov Dec
MPN/100ml
2009 Plant Effluent Bacterial Quality
Total Coliform Fecal Coliform Enterococcus
FIGURE 14
0.0
5.0
10.0
15.0
20.0
25.0
30.0
0.000
0.200
0.400
0.600
0.800
1.000
1.200
Jan Feb Mar Apr May Jun Jul Aug Sep Oct Nov Dec
Tons Wasted
WAS Flow, MG & % Solids
2009 Waste Activated Sludge
WAS Flow WAS % Solids Tons Wasted

24
FIGURE 15
0
5
10
15
20
25
30
35
14.8
15.0
15.2
15.4
15.6
15.8
16.0
16.2
Jan Feb Mar Apr May Jun Jul Aug Sep Oct Nov Dec
Tons Solids
% Solids
2009 Dewatered Sludge Cake
% Solids Tons Solids
FIGURE 16
0
50
100
150
200
250
0
5,000
10,000
15,000
20,000
25,000
Jan Feb Mar Apr May Jun Jul Aug Sep Oct Nov Dec
SVI
Aerator & Clarifier, lbs
2009 Plant Solids Inventory
Aerator lbs Clarifier lbs SVI

25
FIGURE 17
0
2,000
4,000
6,000
8,000
10,000
12,000
Jan Feb Mar Apr May Jun Jul Aug Sep Oct Nov Dec
mg/L
2009 In-Plant Solids Concentrations
Return Sludge Mixed Liquor Clarifiers
FIGURE 18
0.00
0.05
0.10
0.15
0.20
0.25
0.30
7.5
8.0
8.5
9.0
9.5
10.0
Jan Feb Mar Apr May Jun Jul Aug Sep Oct Nov Dec
7-day F/M
7-Day MCRT
2009 Plant 7-Day MCRT & F/M
MCRT 7-day F/M 7-day

26
FIGURE 19
FIGURE 20
0.000
2.000
4.000
6.000
8.000
10.000
12.000
MG/month
Reclaimed Wastewater Delivered2002 through 2009
Reclaim Flow