city of sebastian, floridapublic.cityofsebastian.org/pdfs/02finstmts.pdf · the city of sebastian...
TRANSCRIPT
i
CITY OF SEBASTIAN, FLORIDA
Comprehensive Annual Financial Report For the Year Ended September 30, 2002
CITY COUNCIL
Walter W. Barnes ...............................Mayor James A. Hill .......................................Vice-Mayor Joe Barczyk .........................................Councilmember Edward J. Majcher, Jr. ......................Councilmember Ray Coniglio ........................................Councilmember
Prepared By: Mark C. Mason, CPA Director of Finance
THIS PAGE INTENTIONALLY LEFT BLANK
ii

iii
INTRODUCTORY SECTION
This section contains the following subsections:
Table of Contents
Letter of Transmittal
Certificate of Achievement for Excellence in Financial Reporting for the Fiscal Year Ended September 30, 2001
Organizational Chart
List of Officials

iv
CITY OF SEBASTIAN, FLORIDA
COMPREHENSIVE ANNUAL FINANCIAL REPORT SEPTEMBER 30, 2002
TABLE OF CONTENTS
INTRODUCTORY SECTION Page
Title Page....................................................................................................................................................... i Table of Contents........................................................................................................................................... iv Letter of Transmittal ...................................................................................................................................... vii Certificate of Achievement for Excellence in Financial Reporting ............................................................... x Organizational Chart...................................................................................................................................... xi List of Officials.............................................................................................................................................. xii
FINANCIAL SECTION Independent Auditor’s Report ....................................................................................................................... 3
Management’s Discussion and Analysis ....................................................................................................... 5
Basic Financial Statements – Overview
Government-wide Financial Statements:
Statement of Net Assets.......................................................................................................................... 13
Statement of Activities ........................................................................................................................... 14
Fund Financial Statements:
Balance Sheet – Governmental Funds.................................................................................................... 15
Statement of Revenues, Expenditures, and Changes in Fund Balances – Governmental Funds........................................................................................................................... 16
Reconciliation of the Statement of Revenues, Expenditures, and Changes in Fund Balances of Governmental Funds to the Statement of Activities ....................................................................... 17
Statement of Net Assets – Proprietary Funds ......................................................................................... 18
Statement of Revenues, Expenses, and Changes in Fund Net Assets – Proprietary Funds .................... 19
Statement of Cash Flows – Proprietary Funds ...................................................................................... 20
Statement of Fiduciary Net Assets – Fiduciary Funds............................................................................ 22
Statement of Changes in Fiduciary Net Assets – Fiduciary Fund – Pension Trust ................................ 23
Notes to Financial Statements................................................................................................................... 24
Required Supplementary Information:
Schedule of Revenues, Expenditures, and Changes in Fund Balances – Budget and Actual – General Fund............................................................................................................................ 39
Schedule of Revenues, Expenditures, and Changes in Fund Balances – Budget and Actual – Discretionary Sales Tax Special Revenue Fund ...................................................................... 40
Notes to the Required Supplementary Information – Budget Comparisons .............................................. 41
Police Officers’ Pension Plan – Schedule of Contributions from the Employer and other Contributing Entities .............................................................................................................................. 42
Combining and Individual Nonmajor Financial Fund Statements and Budget to Actual Schedules
Combining Balance Sheet – Nonmajor Governmental Funds ....................................................................... 46
Combining Statement of Revenues, Expenditures, and Changes in Fund Balances – Nonmajor Governmental Funds .................................................................................................................................. 48
Schedule of Revenues, Expenditures, and Changes in Fund Balances – Budget and Actual – Local Option Gas Tax Special Revenue Fund............................................................................. 50
Schedule of Revenues, Expenditures, and Changes in Fund Balances – Budget and Actual – Riverfront Redevelopment Special Revenue Fund...................................................................... 51
Schedule of Revenues, Expenditures, and Changes in Fund Balances – Budget and Actual – Recreation Impact Fee Special Revenue Fund ............................................................................ 52

v
PageSchedule of Revenues, Expenditures, and Changes in Fund Balances – Budget and Actual – Stormwater Utility Special Revenue Fund .................................................................................. 52
Schedule of Revenues, Expenditures, and Changes in Fund Balances – Budget and Actual – Law Enforcement Forfeiture Special Revenue Fund................................................................... 53
Schedule of Revenues, Expenditures, and Changes in Fund Balances – Budget and Actual – G.R.E.A.T. Program Special Revenue Fund ............................................................................... 53
Schedule of Revenues, Expenditures, and Changes in Fund Balances – Budget and Actual – Debt Service Fund ....................................................................................................................... 54
Schedule of Revenues, Expenditures, and Changes in Fund Balances – Budget and Actual – Road Paving Program Projects Fund........................................................................................... 55
Capital Assets Used in the Operations of Governmental Funds – Schedule by Function and Activity......... 56
STATISTICAL SECTION (Unaudited) Table
General Governmental Expenditures & Other Financing Uses by Function – Last Ten Fiscal Years............................................................................................................ 1 58
General Governmental Revenues & Other Financing Sources – Last Ten Fiscal Years........................................................................................................................... 2 60
Property Tax Levies and Collections – Last Ten Fiscal Years ................................................. 3 62
Assessed and Estimated Actual Value of Property – Last Ten Fiscal Years ............................ 4 64
Principal Taxpayers .................................................................................................................. 5 66
Property Tax Rates – Direct and Overlapping Governments – Last Ten Fiscal Years............. 6 67
Special Assessments Billing and Collections – Last Ten Fiscal Years..................................... 7 68
Computation of Legal Debt Margin.......................................................................................... 8 69
Ratio of Net General Obligation Bonded Debt to Assessed Value and Net General Obligation Bonded Debt Per Capita ........................................................................ 9 70
Ratio of Annual Debt Service Expenditures for General Obligation Bonded Debt To Total General Government Expenditures ........................................................................ 10 70
Computation of Direct and Overlapping Bonded Debt – General Obligation Bonds............... 11 71
Revenue Bond Coverage – Golf Course Bond – Last Ten Fiscal Years................................... 12 72
Demographic Statistics – Last Ten Fiscal Years ...................................................................... 13 73
Property Value, Construction and Bank Deposits – Last Ten Fiscal Years.............................. 14 74
Miscellaneous Statistics............................................................................................................ 15 76
SINGLE AUDIT SECTION
Independent Auditor’s Report on Compliance and on Internal Control Over Financial Reporting Based on an Audit of Financial Statements Performed in Accordance with Governmental Auditing Standards............................................................................................................. 79
Independent Auditor’s Report on Compliance and Internal Control over Compliance Applicable to Each Major State Project ..................................................................................................... 81
Schedule of Findings and Questioned Costs – State Projects ........................................................................ 83
Schedule of Expenditures of State Financial Assistance ............................................................................... 86
Independent Auditor’s Management Letter ................................................................................................... 87

THIS PAGE INTENTIONALLY LEFT BLANK
vi


viii
REPORTING ENTITY
The City of Sebastian is located on the central east coast of Florida, “the Treasure Coast”, in Indian River County. The City is a Florida municipal corporation with a five-member City Council comprised of five council members with a Mayor selected from the five members. The City operates under a Council-City Manager form of government. The Director of Finance reports to the City Manager and they are responsible for the administration of City finances. The City provides a wide range of services including general government administration, police protection, public works, a golf course, and a general aviation airport.
This report includes all funds of the City. In evaluating the City as a reporting entity, we have included all component units for which the City Council is financially accountable.
The component units have been blended with the financial statements presented for the Primary Government because the component unit’s governing body is the same as the City Council or because the component unit exclusively serves the City. The blended component units are the Riverfront Redevelopment Agency and the Sebastian Police Officer’s Pension Trust Fund.
FACTORS AFFECTING FINANCIAL CONDITIONS
The information presented in the financial statements is perhaps best understood when it is considered from the broader perspective of the specific environment within which the City of Sebastian operates.
Local Economy
The City of Sebastian currently enjoys a favorable economic environment and local indicators (building permits, both commercial and residential) suggest continued stability. The region, though agricultural in nature, also enjoys light industrial as well as a strong retail base which draws numerous visitors from around the area.
The region (which includes the City of Sebastian and the surrounding unincorporated area with the same county) has a fluctuating labor force depending on agricultural demand and a strong retirement community. Although the labor force fluctuates, unemployment in the region has been between 6.8% and 9.8% over the past several years.
Long-term Financial Planning
The voters of Indian River County in November 2003, extended the Infrastructure Sales Surtax in the amount of $.01 per $1.00 sale for an additional fifteen years and seven months beginning in January 2004. This Infrastructure Sales Surtax is estimated to provide the City in excess of $40 million dollars over the life of the extension.
U.S. Highway 1, which includes a substantial portion of the business district of the City of Sebastian, underwent major renovations over the past year. This should have a considerable impact on tourism and commercial opportunities. In addition, over the past year, three new commercial centers and doctor’s offices have been built along this major artery in the City.
FINANCIAL INFORMATION
Internal Accounting Controls
In developing and evaluating the City’s accounting system, consideration is given to the adequacy of internal accounting controls. Internal accounting controls are designed to provide reasonable, but not absolute, assurances regarding: (1) the safeguarding of assets against loss from unauthorized use or disposition; and (2) the reliability of financial records for preparing financial statements and maintaining accountability for assets. The concept of reasonable assurance recognizes that: (1) the cost of a control should not exceed the benefits likely to be derived, and (2) the evaluation of costs and benefits requires estimates and judgements of management.
All internal control evaluations occur within this framework. We believe that the City’s internal accounting controls adequately safeguard assets and provide reasonable assurance of proper recording of financial transactions.
Budgetary Control
Budgetary control is maintained at the budget account level by the encumbrance of estimated purchase amounts prior to the release of purchase orders to vendors. Open encumbrances are reported as reservations of fund balances as of September 30, 2002. Appropriations are approved on an annual basis and are subject to regular

ix
review by City Management and a quarterly review by the City Council. Monthly budget reports are submitted to senior administrative officials and are available to the City Council.
Cash Management
Cash temporarily idle during the year was invested in repurchase agreements and other obligations with maturities less than one year. Funds were invested with the State Board of Administration which pools funds from local governmental units and with local banks which are considered Qualified Public Depositories as described in the Florida Security for Public Deposits Act. In addition, the City maintains a zero balance disbursement account system whereby excess funds are cleared from the account at the end of each banking day and automatically invested in an overnight repurchase agreement.
Risk Management
All risk management activities are recorded in each particular fund, including general property liability insurance premiums and related costs and workers compensation. The City administers both policies under the direction of the Finance and Human Resources departments, respectively. In addition, the City has a Safety Committee that reviews all worker compensation accidents and provides recommendations for corrective action.
Retirement Commitments
Police Officers’ Pension Plan – There were 34 active and retired members in the Police Officers’ Pension Plan as of September 30, 2002. This pension plan is a single employer, defined benefit plan and is administered by a Board of Trustees. The actuarially determined funding requirements are based upon the market value of the pension plan’s investment portfolios. The City’s policy of funding to meet the actuarially determined requirements was met for 2002. Contributions to the pension plan totaled $153,211, which includes $8,620 from the City, $61,714 from employees, and $82,877 from the State of Florida.
REPORTING ACHIEVEMENT
The Government Finance Officers Association of the United States and Canada (GFOA) awarded a Certificate of Achievement for Excellence in Financial Reporting to the City of Sebastian for its comprehensive annual financial report for the fiscal year ended September 30, 2001. The Certificate of Achievement is a prestigious national award recognizing conformance with the highest standards for preparation of state and local government financial reports. In order to be awarded a Certificate of Achievement, a government must publish an easily readable and efficiently organized comprehensive annual financial report. This report must satisfy both U.S. generally accepted accounting principles and applicable legal requirements.
A Certificate of Achievement is valid for a period of one year only. We believe that our current comprehensive annual financial report continues to meet the Certificate of Achievement Program’s requirements and we are submitting it to the GFOA to determine its eligibility for another certificate.
ACKNOWLEDGEMENTS
The preparation of this report would not be possible without the dedicated service of the Finance department staff. Their efforts toward improving the accounting and financial reporting systems has led to the improved quality of information reported to the City Council, State and federal agencies and the citizens of the City of Sebastian. We sincerely appreciate their contributions.
Respectfully submitted,
Mark C. Mason, CPA Director of Finance
Terrence R. Moore City Manager

x

CITY OF SEBASTIANORGANIZATIONAL CHART
xi
CITY
MANAGER
GROWTH MANAGEMENT
BUILDING DEPARTMENT
POLICE FINANCE
HUMAN RESOURCES
GOLF COURSE
AIRPORT
BOARDS &
COMMISSIONS
ADMINISTRATION
UNIFORM
DETECTIVE
DISPATCH
PUBLIC WORKS
CITIZENS OF SEBASTIAN
CITY COUNCIL
CITY
ATTORNEYCITY
CLERK
ENGINEERING
CODE
ENFORCEMENT
SUPPORT
SERVICES
COMMUNITY
POLICING
SCHOOL RESOURCEBUILDING
MAINTENANCE
PARKS &
RECREATION
CEMETERY
ROADS & DRAINAGE
GENERAL SERVICES
ADMINISTRATION
CENTRAL GARAGE

xii
CITY OF SEBASTIAN, FLORIDA
CITY OFFICIALS
City Manager TERRENCE R. MOORE
City Clerk SALLY A. MAIO, CMC
City Attorney RICH STRINGER
DEPARTMENT HEADS:
Director of Finance MARK C. MASON, CPA
City Engineer DAVID FISHER, P.E.
Police Chief JAMES DAVIS
Public Works Director TERRY HILL
Growth Management Director TRACY HASS
Building Director GEORGE BONACCI
Human Resources Director JAMES SEXTON
Golf Course Manager GREG GARDNER
Airport Manager JASON MILEWSKI

1
FINANCIAL SECTION
This section contains the following subsections:
Independent Auditor’s Report
Management’s Discussion and Analysis
Government-wide Financial Statements
Fund Financial Statements
Notes to Financial Statements
Required Supplementary Information
Combined and Individual Fund Statements and Schedules

THIS PAGE INTENTIONALLY LEFT BLANK
2


5
MANAGEMENT’S DISCUSSION AND ANALYSIS
The City of Sebastian’s (the “City”) discussion and analysis is designed to (a) assist the reader in focusing on significant financial issues, (b) provide an overview of the City’s financial activity, (c) identify changes in the City’s financial position, (d) identify any material deviations from the financial plan, and (e) identify individual fund issues or concerns.
Since the Management’s Discussion and Analysis (MD&A) is designed to focus on the current years activities, resulting changes and currently known facts, please read it in conjunction with the Transmittal Letter (beginning on page vii) and the City’s financial statements (beginning on page 13).
HIGHLIGHTS
Financial Highlights
The City’s Net Assets increased by $3,096,106 primarily as a result of completing and capitalizing $2,210,367 in capital improvement projects, purchases of capital equipment of $400,199 and the implementation of the Recreation Impact Fee and Stormwater Utility Fee which contributed $1,044,138 in additional revenue for capital improvements. The total cost of all the City’s programs was $10,673,279, an increase of $1,561,842 or 17.1%. During the year, the City’s governmental-type activities revenues increased $1,756,001 or 17.3% and expenses increased 1,539,443 or 20.6%, over the previous year. The City’s business-type activities revenue increased by $37,503 or 2.1% and expenses increased by $22,399 or 1.4%. The City completed $556,015 in land purchases, representing 11.5 acres, for recreation. The City completed $704,306 in road reconstruction and repaving.
USING THIS ANNUAL REPORT
The annual report consists of a series of financial statements. The Statement of Net Assets and the Statement of Activities (on pages 13 and 14) provide information about the activities of the City as a whole and present a longer-term view of the City’s finances. Fund financial statements begin on page 15. For governmental activities, these statements tell how these services were financed in the short term as well as what remains for future spending. Fund financial statements also report the City’s operations in more detail by providing information about the City’s most significant funds. The remaining statements provide financial information about activities for which the City acts solely as a trustee or agent for the benefit of those outside of the government.
Reporting the City as a Whole
Our analysis of the City as a whole begins on page 13. One of the most important questions asked about the City’s finances is, “Is the City as a whole better off or worse off as a result of the year’s activities?” The Statement of Net Assets and the Statement of Activities report information about the City as a whole and about its activities in a way that helps answer this question. These statements include all assets and liabilities using the accrual basis of accounting, which is similar to the accounting used in most private-sector companies. All of the current year’s revenues and expenses are taken into account regardless of when cash is received or paid.
These two statements report the City’s net assets and changes in them. You can think of the City’s net assets – the difference between assets and liabilities – as one way to measure the City’s financial health, or financial position. Over time, increases or decreases in the City’s net assets, is one indicator of whether its financial
6
health is improving or deteriorating. You will need to consider other nonfinancial factors, however, such as changes in the City’s property tax base and the condition of the City’s roads, to assess the overall health of the City.
In the Statement of Net Assets and the Statement of Activities, we divide the City into two kinds of activities: Governmental activities – Most of the City’s basic services are reported here, including the police, public works and parks departments, and general administration. Property taxes, franchise fees, and state shared revenue finance most of these activities.
Business-type activities – The City charges a fee to customers to help it cover all or most of the cost of certain services it provides. The City’s Golf Course and Airport are reported here.
Reporting the City’s Most Significant Funds
Our analysis of the City’s major funds begins on page 15. The fund financial statements provide detailed information about the most significant funds – not the City as a whole. Some funds are required to be established by State law and by bond covenants. However, the City Council establishes many other funds to help it control and manage money for particular purposes (like the road paving program) or to show that it is meeting legal responsibilities for using certain taxes, grants, and other money (like the local option gas tax and infrastructure sales surtax (a.k.a. Discretionary Sales Tax)). The City’s two kinds of funds – governmental and proprietary – use different accounting approaches.
Governmental funds – Most of the City’s basic services are reported in governmental funds, which focus on how money flows into and out of those funds and the balances left at year-end that are available for spending. These funds are reported using an accounting method called modified accrual accounting, which measures cash and all other financial assets that can readily be converted to cash. The governmental fund statements provide a detailed short-term view of the City’s general government operations and the basic services it provides. Governmental fund information helps you determine whether there are more or fewer financial resources that can be spent in the near future to finance the City’s programs. We describe the relationship (or differences) between governmental activities (reported in the Statement of Net Assets and the Statement of Activities) and governmental funds in reconciliations at the bottom of the fund financial statements.
Proprietary funds – When the City charges customers for the services it provides – whether to outside customers or to other units of the City – these services are generally reported in proprietary funds. Proprietary funds are reported in the same way that all activities are reported in the Statement of Net Assets and the Statement of Activities. In fact, the City’s enterprise funds (a component of proprietary funds) are the same as the business-type activities we report in the government-wide statements but provide more detail and additional information, such as cash flows, for proprietary funds.
The City as Trustee
The City is the trustee, or fiduciary, for the Police Officers’ Pension Plan. The City’s fiduciary activities are reported in separate Statements of Fiduciary Net Assets and Changes in Fiduciary Net Assets on page 22 and 23. We exclude these activities from the City’s other financial statements because the City cannot use these assets to finance its operations. The City is responsible for ensuring that the assets reported in these funds are used for their intended purposes.
The City holds deposits for various individuals and businesses for contract performance that are then returned when the contract has been completed. These deposits are accounted for in an Agency fund, where assets equal liabilities.

7
THE CITY AS A WHOLE
Financial Analysis of the City as a Whole
The City’s combined net assets increased $3.1 million from $22.2 million to $25.3 million or 13.9%. Looking at the net assets and net revenues of the governmental and business-type activities, the largest increase occurred in the governmental-type activities. Our analysis focuses on net assets (Table 1) and changes in net assets (Table 2) of the City’s governmental and business-type activities.
GOVERNMENT-WIDE STATEMENTS
Statement of Net Assets
The following table reflects the condensed Statements of Net Assets:
For more detail information see the Statement of Net Assets on page 13.
Net assets of the governmental-type activities increased $2.9 million or 14.3%. Unrestricted net assets-the part of net assets that can be used to finance day-to-day operations without constraints established by debt covenants, enabling legislation, or legal requirements-increased from $5.4 million to $5.9 million or $500,000, while restricted net assets increased $1.0 million from $2.3 million to $3.3 million. Investment in capital assets, net of related debt increased from $12.8 to $14.2 million or $1.6 million.
Unrestricted net assets increased as a result of communication services taxes exceeding anticipated amounts and an increase in building permit fees exceeding anticipated amounts due to an increase in building activity resulting from a decrease in interest rates. Restricted net assets increased from the implementation and receipt of net revenue in excess of expenditures from the Stormwater Utility Fee ($720,814) and the Recreation Impact Fee ($258,455).
Net assets of the City’s business-type activities increased by 9.3% ($1.942 million compared to $1.778 million) in fiscal year 2002. The increase results from capital contributions from the Florida Department of Transportation-Aviation Section for capital improvements at the City’s general aviation airport of $264,772, however, net assets at the golf course decreased $7,127.
2002 2001 2002 2001 2002 2001
Current and other assets 10,157$ 8,400$ 1,827$ 2,152$ 11,984$ 10,552$
Capital assets 17,743 16,620 2,527 2,393 20,270 19,013
Total assets 27,900$ 25,020$ 4,354$ 4,545$ 32,254$ 29,565$
Non-current liabilities 4,043$ 4,251$ 2,278$ 2,371$ 6,321$ 6,622$
Other liabilities 459 303 134 396 593 699
Total liabilities 4,502$ 4,554$ 2,412$ 2,767$ 6,914$ 7,321$
Net assets:
Invested in capital assets,
net of related debt 14,243$ 12,778$ 364$ 151$ 14,607$ 12,929$
Restricted 3,290 2,270 458 641 3,748 2,911
Unrestricted 5,865 5,418 1,120 986 6,985 6,404
Total net assets 23,398$ 20,466$ 1,942$ 1,778$ 25,340$ 22,244$
Governmental Activities Business-type Activities Total Primary Government
Table 1
Statements of Net Assets
as of September 30, 2002 and 2001
(in thousands)

8
The following chart shows the revenue and expenses of the total primary government.
The City’s total revenues increased by 15.0% ($1.794 million). The total cost of all programs increased by 17.1% ($1.562 million) with two new programs added this year. Even with this increase in expenses, the City was still able to cover its costs. Our analysis below separately considers the operations of governmental and business-type activities.
Governmental Activities
The cost of all governmental activities this year was $9.0 million compared to $7.5 million last year. However, as shown in the Statement of Activities on page 14, the amount the City’s taxpayers ultimately financed for these activities through City taxes was only $4.4 million because some of the cost was paid by those who directly benefited from the programs ($1.7 million) or by other governments and organizations that subsidized certain programs with grants and contributions ($3.7 million). Overall the City’s governmental program revenues increased in fiscal year 2002 from $4.1 million to $5.4 million, principally based upon the implementation of the Recreation Impact and Stormwater Utility Fees, which amounted to $258,455 and $785,683, respectively. The City paid for the remaining “public benefit” portion of governmental activities with $4.4 million in taxes and with other revenues, such as interest and general entitlements.
2002 2001 2002 2001 2002 2001
REVENUES
Program revenues:
Charges for services 1,682$ 792$ 1,545$ 1,282$ 3,227$ 2,074$
Operating grants and contributions 958 902 51 124 1,009 1,026
Capital grants and contributions 2,734 2,444 214 299 2,948 2,743
General revenues:
Property taxes 2,616 2,557 - - 2,616 2,557
Other taxes 1,750 1,905 - - 1,750 1,905
Intergovernmental 2,069 1,336 - - 2,069 1,336
Other 119 236 32 99 151 335
Total revenues 11,928 10,172 1,842 1,804 13,770 11,976
EXPENSES
General government 2,010 1,676 - - 2,010 1,676
Public safety 2,946 2,527 - - 2,946 2,527
Public works 2,767 2,082 - - 2,767 2,082
Housing and community development 223 242 - - 223 242
Culture and recreation 777 674 - - 777 674
Cemetery 104 95 - - 104 95
Golf Course - - 1,393 1,341 1,393 1,341
Airport - - 284 314 284 314
Interest on long-term debt 169 161 - - 169 161
Total expenses 8,996 7,457 1,677 1,655 10,673 9,112Change in net assets 2,932$ 2,715$ 165$ 149$ 3,097$ 2,864$
Ending net assets 23,398$ 20,466$ 1,942$ 1,778$ 25,340$ 22,244$
Activities Activities Government
Governmental Business-type Total Primary
Table 2
Changes in Net Assets
For the Fiscal Years Ended September 30, 2002 and 2001
(in thousands)

9
On the next page is a graphic illustration of the comparison for governmental activities revenue and expenses.
Business-type Activities
Revenues of the City’s business-type activities (see Table 2) increased by 2.1% ($1.842 million in fiscal year 2002 compared to $1.804 million in fiscal year 2001) and expenses rose 1.3%. The factors driving the results are:
The City golf course, benefiting from a full year’s operation (course was closed for four months in fiscal year 2001 for renovations) increased its revenues by 19% and expenses rose 12.3%, to $1.4 million. Higher costs due to an increase in debt service interest and personal services costs drove the increase. The City general aviation airport enjoys a continued interest by the Florida Department of Transportation-Aviation Section to upgrade the airport facilities as evidenced by repeated support via grant funding. Although revenues decreased by 11.8%, expenses decreased a corresponding amount, 9.6%, both decreases due to the completion and adoption of the Airport Master Plan, resulting in a net increase in assets.
Following is a graphic comparison of the City’s business-type activities.
Governmental Activities for 2002 and 2001
-
500
1,000
1,500
2,000
2,500
3,000
3,500
Charges for services
Operating grants
Captital grants
Propertytaxes
Other taxes
Intergovernmental
Other revenue
General government
Publicsafety
Publicworks
Housing and community
development
Culture
and recreation
Cemetery
Interest on long-term
debt
Revenue/Expense types
Am
ou
nt
2002 2001
Business-Type Activities Comparison
-
200
400
600
800
1,000
1,200
1,400
1,600
1,800
Charges for services
Operating gran
ts
Captital grants
Otherrevenue
Golf Course expenses
Airport e
xpenses
Revenue/Expense types
Am
ou
nt
2002 2001

10
THE CITY’S FUNDS
As the City completed the year, its governmental funds (as presented in the balance sheet on page 15) reported a combined fund balance of $9.6 million, which is an increase of $1.6 million over the prior year of $8.0 million. The primary reason for the overall increase is the addition of two new programs, the Recreation Impact Fee and the Stormwater Utility Fee. In addition, the general fund received $446,237 in excess of anticipated revenue primarily due to the Communications Services Tax implemented by the State of Florida in the current fiscal year.
General Fund Budgetary Highlights
Over the course of the year, the City Council revised the City budget three times. These budget amendments fall into three categories. The first category includes amendments and supplemental appropriations that were approved shortly after the beginning of the year and reflect the actual beginning balances (versus the amounts originally estimated in July 2001). The second category includes the changes that the Council made during the year to take into account the City’s staff restructuring efforts. The principal amendment was to provide for a larger distribution from the Communications Services Tax than originally calculated of $197,106. The Communications Services Tax was implemented by the State of Florida in an effort to combine several disparate communications franchise and utility tax rates throughout the State into one common rate for all. As a result, the revenue received from the State exceeded original estimates based upon rates used for the various fees in the prior year.
Even with these adjustments, the actual charges to appropriations (expenditures) were $224,109 below the final budgeted amount.
The City’s General fund balance of $3,922,747 reported on page 15 differs from the General fund’s budgetary balance of $3,055,620 reported in the budgetary comparison schedule on page 39. This is principally due to the fact that the budgetary fund balance excludes $197,131 of encumbrances reported as expenditures for budgetary purposes, as well as $669,996 of excess revenues over expenses exceeding the amended budget.
CAPITAL ASSET AND DEBT ADMINISTRATION
Capital Assets
At the end of 2002 the City had $32,001,428 invested in a broad range of capital assets, including land, police and public works equipment, buildings, park facilities, roads, bridges, and stormwater drainage structures. This amount represents a net increase (including additions and deductions) of $1,745,555, or 5.8%, over last year. The following table illustrates the changes in capital assets. See page 30 in the notes to the financial statements for detailed changes in capital assets.
2002 2001 2002 2001 2002 2001
Land 4,488,173$ 3,748,585$ 9,060$ 9,060$ 4,497,233$ 3,757,645$
Buildings 2,556,708 2,310,816 333,189 344,114 2,889,897 2,654,930
Improvements 2,049,225 2,367,192 574,109 540,990 2,623,334 2,908,182
Equipment 4,570,141 4,384,245 486,016 450,633 5,056,157 4,834,878
Infrastructure 13,951,040 13,288,248 2,371,821 2,372,976 16,322,861 15,661,224
Construction-in
Process 264,456 356,079 347,490 82,935 611,946 439,014
Totals 27,879,743$ 26,455,165$ 4,121,685$ 3,800,708$ 32,001,428$ 30,255,873$
Table 3
Totals
G overnmental
Activities
B usiness-type
Activities

11
The City’s fiscal year 2003 capital budget calls for another $4,841,868 in capital projects, principally for the completion of airport improvements of $2,855,000, funded primarily by State and Federal Grants, and road improvements of $762,000 funded by discretionary sales tax and local option gas tax revenue sources.
Debt
At September 30, 2002, the City had $5,791,998 in bonds, notes and capital leases outstanding versus $6,229,027 at September 30, 2001 – a decrease of 7.0% – as shown in the following table:
The decrease in debt is solely attributable to principal payments. The City did not issue any new debt in fiscal year 2002. See note IV.H. on pages 34 and 35 for further information.
The City’s revenue refunding bond carries an AAA rating from Standard & Poor’s, a rating it has held since 1992. All of the City’s other debt, primarily notes and a capital lease, are not rated.
Other obligations of the City include accrued vacation pay and sick leave.
ECONOMIC FACTORS AND NEXT YEAR’S BUDGETS AND RATES
The City’s elected and appointed officials considered many factors when setting the fiscal year 2003 budget, tax rates, and fees that will be charged for the business-type activities. One of those factors is the economy.
Sebastian’s local economy consists largely of retail and service industries. Less than one percent is devoted to industrial activities. Construction of new homes is the largest single business in the area. Some of the largest retail stores include Wal-Mart Stores, Inc. and Winn Dixie Stores, Inc. The Indian River County unemployment rate in 2002 was 9.8% up from 6.8% in the previous year and down from a high of 11.9% in 1992. This indicates that although business growth in the area has improved as evidenced by the construction of several new commercial establishments in the area, the unemployment of farm workers continues to burden the unemployment rate. Continued stability and the increase of annual residential building permits issued provides a trend for steady economic development in the area.
These indicators were taken into account when adopting the General Fund budget for fiscal year 2003. Amounts available for appropriation in the General Fund budget are $9,403,970, an increase of 11.2% over the final fiscal year 2002 budget of $8,130,544. Property taxes (benefiting from a 2002 increase in assessed valuations of 8.63%), public services taxes, and State shared revenue are expected to lead this increase. The City will use these increases in revenues to finance programs we currently offer, implement an active recreation program, as well as, the effect that we expect inflation to have on program costs. Budgeted expenditures, not including transfers out, are expected to rise 9.1%, to $8,759,970 from $8,030,544 in fiscal year 2002. Increased wage and cost-of-living adjustments and health insurance based on agreements reached with the police and general employee’s unions in fiscal year 2002 of roughly $981,320, including an increase of $125,358 in worker’s compensation insurance are the largest increments.
2002 2001 2002 2001 2002 2001
134,299$ 187,901$ -$ -$ 134,299$ 187,901$
2,593,939 2,773,847 - - 2,593,939 2,773,847
788,957 900,000 - - 788,957 900,000
- - 2,274,803 2,367,279 2,274,803 2,367,279
Totals 3,517,195$ 3,861,748$ 2,274,803$ 2,367,279$ 5,791,998$ 6,229,027$
Table 4
Governmental Business-type
Activities Activities Totals
Revenue Note (backed by
local option gas tax)
Capital lease obligation
(backed by City)
Revenue bond (backed by
golf course revenue)
Special assessment debt

12
If these estimates are realized, the City’s budgetary fund balance is expected to increase moderately by the close of fiscal year 2003.
As for the City’s business-type activities, we expect the fiscal year 2003 results will also be moderate based upon current and future initiatives:
The Golf Course results are anticipated to increase slightly as a result of rate increases for play.
The Airport is undergoing a reconstruction and economic development revitalization, as a result of master planning initiatives, primarily funded with Federal Aviation Administration and Florida State grants. In addition, the airport has entered into a lease agreement for T-hangers that is anticipated to increase revenues by 35.2% upon completion of construction. The results of operations, however, are expected to be modest for several years.
CONTACTING THE CITY’S FINANCIAL MANAGEMENT
This financial report is designed to provide our citizens, taxpayers, customers, and investors and creditors with a general overview of the City’s finances and to show the City’s accountability for the money it receives. If you have questions about this report or need additional information, contact the City Finance Department at City of Sebastian, 1225 Main Street, Sebastian, Florida 32958.

Governmental Business-type
Activities Activities Total
ASSETS
Cash and cash equivalents:
Cash in banks 500,680$ 1,250$ 501,930$
Equity in pooled investments 6,720,303 820,500 7,540,803
Receivables 699,272 58,751 758,023
Special assessment receivable 66,048 - 66,048
Inventory 19,220 13,203 32,423
Prepaid expenses 8,927 2,465 11,392
Investments 1,003,750 - 1,003,750
Restricted assets:
Temporarily restricted:
Equity in pooled investments 722,054 819,308 1,541,362
Permanently restricted:
Cash in banks 200,000 - 200,000
Equity in pooled investments 199,225 - 199,225
Deferred charges 17,264 111,175 128,439
Capital assets (net of accumulated depreciation):
Land 4,488,173 9,060 4,497,233
Buildings 1,490,070 82,636 1,572,706
Improvements other than buildings 1,372,607 457,738 1,830,345
Machinery and equipment 2,029,584 175,756 2,205,340
Infrastructure 8,097,873 1,454,775 9,552,648
Construction in progress 264,456 347,490 611,946
Total assets 27,899,506 4,354,107 32,253,613
LIABILITIES
Accounts payable and accrued liabilities 334,328 59,359 393,687
Retainage payable 25,820 - 25,820
Accrued interest payable 34,149 3,549 37,698
Deferred revenues 57,952 71,308 129,260
Deposits 6,340 - 6,340
Noncurrent liabilities:
Due within one year 391,251 223,023 614,274
Due in more than one year 3,651,776 2,054,803 5,706,579
Total liabilities 4,501,616 2,412,042 6,913,658
NET ASSETS
Invested in capital assets, net of related debt 14,242,832 363,827 14,606,659
Restricted for:
Capital projects - 21,919 21,919
Highways and streets 1,654,288 - 1,654,288
Redevelopment 25,540 - 25,540
Recreation 258,455 - 258,455
Stormwater 720,814 - 720,814
Law enforcement 20,764 - 20,764
Debt service 163,870 436,095 599,965
Perpetual care:
Expendable 46,714 - 46,714
Nonexpendable 399,225 - 399,225
Unrestricted 5,865,388 1,120,224 6,985,612
Total net assets 23,397,890$ 1,942,065$ 25,339,955$
The accompanying notes to financial statements are an integral part of this financial statement.
13
City of Sebastian, Florida
Statement of Net Assets
September 30, 2002

Op
erat
ing
Cap
ital
Ch
arge
s fo
rG
ran
ts a
nd
Gra
nts
an
dG
over
nm
enta
lB
usi
nes
s-ty
pe
Fu
nct
ion
/Pro
gram
Exp
ense
sS
ervi
ces
Con
trib
uti
ons
Con
trib
uti
on
sA
ctiv
itie
sA
ctiv
itie
sT
otal
Gov
ernm
enta
l ac
tivi
ties
:
Gen
eral
gov
ernm
ent
2,01
0,28
8$
65
1,69
8$
-$
-$
(1,3
58,5
90)
$
-$
(1,3
58,5
90)
$
Pub
lic
safe
ty2,
945,
701
146,
361
12
3,66
7
35,7
82
(2
,639
,891
)
-
(2
,639
,891
)
Pub
lic
wor
ks2,
766,
797
785,
683
83
4,56
2
2,20
4,35
1
1,
057,
799
-
1,05
7,79
9
Hou
sing
and
com
mun
ity
deve
lopm
ent
223,
207
24
,869
-
-
(198
,338
)
-
(198
,338
)
Cul
ture
and
rec
reat
ion
777,
019
24
,563
-
493,
946
(2
58,5
10)
-
(2
58,5
10)
Cem
eter
y10
4,24
1
48,4
50
-
-
(5
5,79
1)
-
(5
5,79
1)
Inte
rest
on
long
-ter
m d
ebt
168,
749
-
-
-
(1
68,7
49)
-
(1
68,7
49)
Tot
al g
over
nmen
tal
acti
viti
es8,
996,
002
1,68
1,62
4
95
8,22
9
2,73
4,07
9
(3
,622
,070
)
-
(3
,622
,070
)
Bus
ines
s-ty
pe a
ctiv
itie
s:
Gol
f C
ours
e1,
393,
551
1,36
5,02
7
49
0
-
-
(2
8,03
4)
(2
8,03
4)
Air
port
283,
726
17
9,37
3
50,5
97
21
4,1
75
-
160,
419
16
0,41
9
Tot
al b
usin
ess-
type
act
ivit
ies
1,677
,277
1,54
4,40
0
51
,087
214,
175
-
13
2,38
5
132,
385
Tot
al g
over
nmen
t10
,673
,279
$
3,22
6,02
4$
1,
009,
316
$
2,94
8,25
4$
(3
,622
,070
)13
2,38
5(3
,489
,685
)
Gen
eral
Rev
enue
s:
Pro
pert
y ta
xes
2,61
5,93
9
-
2,
615,
939
Pub
lic
util
ity
taxe
s98
3,23
6
-
983,
236
Fra
nchi
se f
ees
766,
901
-
76
6,90
1
Int
ergo
vern
men
tal
2,06
8,75
3
-
2,
068,
753
Unr
estr
icte
d in
vest
men
t ea
rnin
gs11
8,84
0
32,1
22
15
0,96
2
Tot
al g
ener
al r
even
ues
6,55
3,66
9
32
,122
6,58
5,79
1
Cha
nge
in n
et a
sset
s2,
931,
599
164,
507
3,
096,
106
Net
ass
ets
- be
ginn
ing
20,4
66,2
91
1,
777,
558
22,2
43,8
49
Net
ass
ets
- en
ding
23,3
97,8
90$
1,
942,
065
$
25,3
39,9
55$
The
acc
om
pan
yin
g n
otes
to
fina
nci
al s
tate
men
ts a
re a
n in
tegr
al p
art
of t
his
fina
ncia
l st
atem
ent.
14
Ch
ange
s in
Net
Ass
ets
Net
(E
xpen
se)
Rev
enu
e an
d
Cit
y of
Seb
asti
an, F
lori
da
Sta
tem
ent
of A
ctiv
itie
s
For
th
e ye
ar e
nd
ed S
epte
mb
er 3
0, 2
002
Pro
gram
Rev
enu
es

Road Other Total
Discretionary Capital Paving Governmental Governmental
General Sales Tax Improvements Program Funds Funds
ASSETS
Cash and cash equivalents:
Cash in banks 500,680$ -$ -$ -$ -$ 500,680$
Equity in pooled investments 2,315,917 429,770 1,534,787 - 2,439,829 6,720,303
Receivables 224,296 6 11,912 - 333 236,547
Due from other funds 2,294 - - - - 2,294
Due from other governments 186,700 160,903 49,751 - 65,371 462,725
Special assessments receivable - - - - 66,048 66,048
Inventory 19,220 - - - - 19,220
Prepaid items 8,927 - - - - 8,927
Investments 1,003,750 - - - - 1,003,750
Restricted assets:
Cash in banks - - - - 200,000 200,000
Equity in pooled investments - - - 590,083 331,196 921,279
Total assets 4,261,784$ 590,679$ 1,596,450$ 590,083$ 3,102,777$ 10,141,773$
LIABILITIES AND FUND BALANCES
Liabilities:
Accounts payable 274,745$ 92$ 45,967$ -$ 43,751$ 364,555$
Retainage payable - - 4,973 - 20,847 25,820
Due to other funds - - - - 2,294 2,294
Deposits 6,340 - - - - 6,340
Deferred revenues 57,952 - - - 66,048 124,000
Total liabilities 339,037 92 50,940 - 132,940 523,009
Fund balances:
Reserved for:
Encumbrances 197,131 - 289,674 425,518 191,600 1,103,923
Inventory 19,220 - - - - 19,220
Prepaid items 8,927 - - - - 8,927
Donations 6,810 - - - - 6,810
Debt service - - - - 131,971 131,971
Law enforcement - - - - 18,470 18,470
Cemetery care - - - - 445,939 445,939
Unreserved:
Designated for emergencies 350,000 - - - - 350,000
Designated for employee events 8,221 - - - - 8,221
Unreserved, reported in:
General fund 3,332,438 - - - - 3,332,438
Special revenue funds - 590,587 - - 1,217,701 1,808,288
Capital projects funds - - 1,255,836 164,565 964,156 2,384,557
Total fund balances 3,922,747 590,587 1,545,510 590,083 2,969,837 9,618,764
Total liabilities and fund balances 4,261,784$ 590,679$ 1,596,450$ 590,083$ 3,102,777$
17,742,763
(3,963,637)
Net assets of governmental activities 23,397,890$
The accompanying notes to financial statements are an integral part of this financial statement.
City of Sebastian, Florida
Balance Sheet
Governmental Funds
September 30, 2002
15
Capital assets used in governmental funds are not financial resources and therefore are not reported in the funds.
Some liabilities, including compensated absences and notes and capital leases, are not due and payable in the current
period and therefore are not reported in the funds (Note II.A. page 28).
Amounts reported for governmental activities in the statement of net assets (page 13) are different because:
Road Other Total
Discretionary Capital Paving Governmental Governmental
General Sales Tax Improvements Program Funds Funds
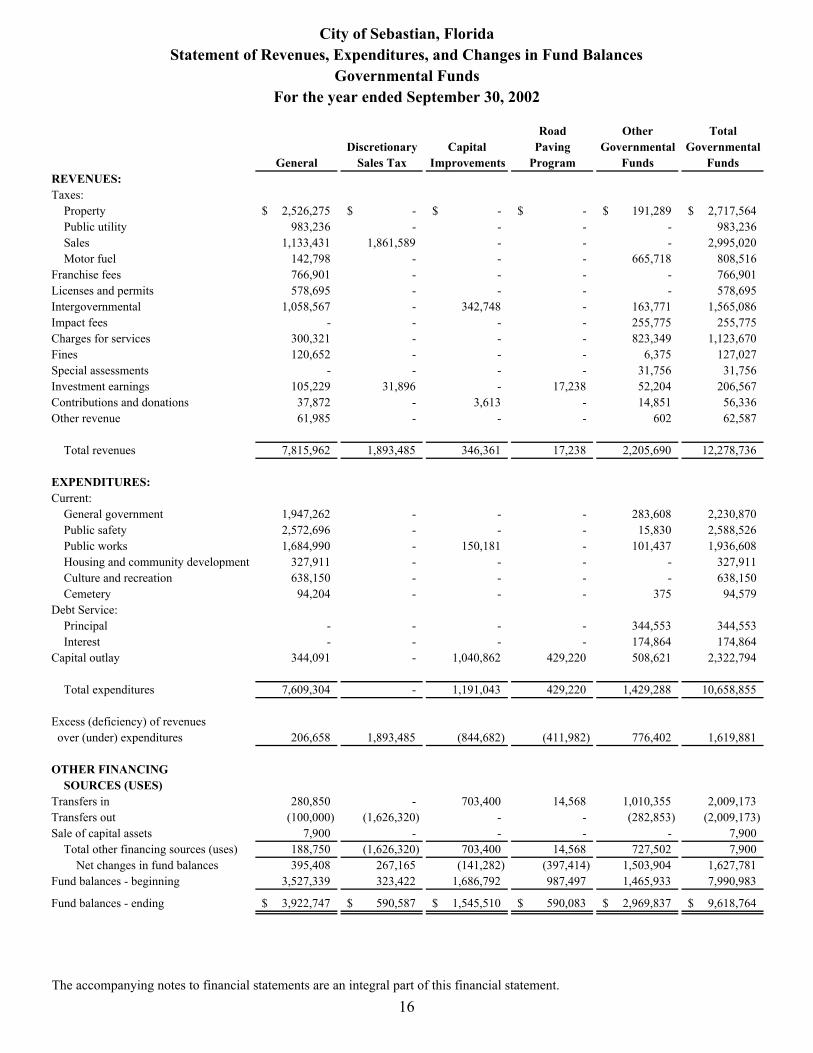
REVENUES:
Taxes:
Property 2,526,275$ -$ -$ -$ 191,289$ 2,717,564$
Public utility 983,236 - - - - 983,236
Sales 1,133,431 1,861,589 - - - 2,995,020
Motor fuel 142,798 - - - 665,718 808,516
Franchise fees 766,901 - - - - 766,901
Licenses and permits 578,695 - - - - 578,695
Intergovernmental 1,058,567 - 342,748 - 163,771 1,565,086
Impact fees - - - - 255,775 255,775
Charges for services 300,321 - - - 823,349 1,123,670
Fines 120,652 - - - 6,375 127,027
Special assessments - - - - 31,756 31,756
Investment earnings 105,229 31,896 - 17,238 52,204 206,567
Contributions and donations 37,872 - 3,613 - 14,851 56,336
Other revenue 61,985 - - - 602 62,587
Total revenues 7,815,962 1,893,485 346,361 17,238 2,205,690 12,278,736
EXPENDITURES:
Current:
General government 1,947,262 - - - 283,608 2,230,870
Public safety 2,572,696 - - - 15,830 2,588,526
Public works 1,684,990 - 150,181 - 101,437 1,936,608
Housing and community development 327,911 - - - - 327,911
Culture and recreation 638,150 - - - - 638,150
Cemetery 94,204 - - - 375 94,579
Debt Service:
Principal - - - - 344,553 344,553
Interest - - - - 174,864 174,864
Capital outlay 344,091 - 1,040,862 429,220 508,621 2,322,794
Total expenditures 7,609,304 - 1,191,043 429,220 1,429,288 10,658,855
Excess (deficiency) of revenues
over (under) expenditures 206,658 1,893,485 (844,682) (411,982) 776,402 1,619,881
OTHER FINANCING
SOURCES (USES)
Transfers in 280,850 - 703,400 14,568 1,010,355 2,009,173
Transfers out (100,000) (1,626,320) - - (282,853) (2,009,173)
Sale of capital assets 7,900 - - - - 7,900
Total other financing sources (uses) 188,750 (1,626,320) 703,400 14,568 727,502 7,900
Net changes in fund balances 395,408 267,165 (141,282) (397,414) 1,503,904 1,627,781
Fund balances - beginning 3,527,339 323,422 1,686,792 987,497 1,465,933 7,990,983
Fund balances - ending 3,922,747$ 590,587$ 1,545,510$ 590,083$ 2,969,837$ 9,618,764$
The accompanying notes to financial statements are an integral part of this financial statement.
16
City of Sebastian, Florida
Statement of Revenues, Expenditures, and Changes in Fund Balances
Governmental Funds
For the year ended September 30, 2002

Net change in fund balances - total government funds 1,627,781$
1,122,610
344,553
(163,345)
Change in net assets of governmental activities 2,931,599$
The accompanying notes to financial statements are an integral part of this financial statement.
Reconciliation of the Statement of Revenues, Expenditures,
To the Statement of Activities
For the year ended September 30, 2002
and Changes in Fund Balances of Governmental Funds
17
Some expenses and revenues reported in the statement of activities do not add to or require the use of current financial
resources and therefore are not reported as revenues or expenditures in governmental funds (Note II.B. page 28).
Governmental funds report capital outlays as expenditures. However, in the statement of activities the cost of those assets is
allocated over their estimated useful lives and reported as depreciation expense. This is the amount by which capital outlay
($2,322,794) exceeded depreciation ($1,240,899, net of loss on disposal of assets of $87,894) in the current period. In the
governmental funds, the proceeds from the sale ($7,900) increased financial resources.
Repayment of debt principal is an expenditure in governmental funds, but the repayment reduces long-term liabilities in the
statement of net assets. This is the amount by which repayments reduced long-term liabilities (Note II.B. page 28).
City of Sebastian, Florida

Totals
ASSETS
Current assets:
Cash and cash equivalents:Cash in banks 1,250$ -$ 1,250$Equity in pooled investments 592,954 227,546 820,500
Accounts receivable 76 4,930 5,006Due from other governments - 53,745 53,745Inventory 13,203 - 13,203Prepaid expenses 1,725 740 2,465
Total current assets 609,208 286,961 896,169
Noncurrent assets:Restricted asset - cash and cash equivalents:
Equity in pooled investments 458,014 361,294 819,308Unamortized bond issue costs 111,175 - 111,175Capital assets:
Land - 9,060 9,060Buildings 333,189 - 333,189Improvements other than buildings 226,537 347,572 574,109Machinery and equipment 337,709 148,307 486,016Infrastructure 1,615,848 755,973 2,371,821Construction in process - 347,490 347,490
Less accumulated depreciation (1,265,580) (328,650) (1,594,230)
Total noncurrent assets 1,816,892 1,641,046 3,457,938
Total assets 2,426,100 1,928,007 4,354,107
LIABILITIESCurrent liabilities:
Accounts payable and accrued liabilities 22,979 36,380 59,359Accrued interest payable 3,549 - 3,549Current portion of long-term debt 222,718 305 223,023Deferred revenue 70,989 319 71,308
Total current liabilities 320,235 37,004 357,239
Noncurrent liabilities:Long-term debt 2,054,803 - 2,054,803
Total liabilities 2,375,038 37,004 2,412,042
NET ASSETSInvested in capital assets,
net of related debt (915,925) 1,279,752 363,827Restricted for:
Capital projects 21,919 - 21,919Debt service 436,095 - 436,095
Unrestricted 508,973 611,251 1,120,224
Total net assets 51,062$ 1,891,003$ 1,942,065$
The accompanying notes to financial statements are an integral part of this financial statement.
18
Golf Course Airport
Enterprise Funds
City of Sebastian, Florida
Proprietary Funds
September 30, 2002
Statement of Net Assets

Totals
Operating revenues:
Charges for fees and rents:
Golf course fees 1,309,498$ -$ 1,309,498$
Rents 29,798 167,061 196,859
Other revenue 26,221 12,312 38,533
Total operating revenues 1,365,517 179,373 1,544,890
Operating expenses:
Salaries, wages and employee benefits 279,735 67,829 347,564
Contractual services, materials and supplies 860,905 132,232 993,137
Depreciation 126,776 83,665 210,441
Amortization 13,099 - 13,099
Total operating expenses 1,280,515 283,726 1,564,241
Operating income (loss) 85,002 (104,353) (19,351)
Nonoperating revenues (expenses):
Investment earnings 20,907 11,215 32,122
Interest expense (112,803) - (112,803)
Loss on sale of fixed assets (233) - (233)
Total nonoperating revenues (expenses) (92,129) 11,215 (80,914)
Loss before capital contributions (7,127) (93,138) (100,265)
Capital contributions - 264,772 264,772
Change in net assets (7,127) 171,634 164,507
Total net assets - beginning 58,189 1,719,369 1,777,558
Total net assets - ending 51,062$ 1,891,003$ 1,942,065$
The accompanying notes to financial statements are an integral part of this financial statement.
19
Golf Course Airport
Enterprise Funds
City of Sebastian, Florida
Proprietary Funds
Statement of Revenues, Expenses and Changes in Fund Net Assets
For the year ended September 30, 2002

Totals
ACTIVITIES:
Cash received from customers and users 1,296,401$ 159,784$ 1,456,185$
Cash payments to suppliers (969,628) (179,697) (1,149,325)
Cash payments for employee services (277,474) (67,972) (345,446)
Other operating receipts 56,019 12,312 68,331
Payments for interfund services used (38,088) (32,114) (70,202)
activities 67,230 (107,687) (40,457)
CASH FLOWS FROM CAPITAL AND
RELATED FINANCING ACTIVITIES:
Acquisition and construction of capital assets (45,337) (299,863) (345,200)
Receipts from capital grants - 307,573 307,573
Principal paid on revenue bond maturities (100,000) - (100,000)
Interest paid on revenue bonds (104,481) - (104,481)
Net cash provided (used) by capital and
related financing activities (249,818) 7,710 (242,108)
CASH FLOWS FROM INVESTING
ACTIVITIES:
Interest on investments 20,972 11,251 32,223
Net cash provided by investing activities 20,972 11,251 32,223
Net decrease in cash and cash equivalents (161,616) (88,726) (250,342)
1,213,834 677,566 1,891,400
1,052,218$ 588,840$ 1,641,058$
The accompanying notes to financial statements are an integral part of this financial statement.
Net cash provided (used) by operating
20
City of Sebastian, Florida
Statement of Cash Flows
Proprietary Funds
For the year ended September 30, 2002
Enterprise Funds
Golf Course Airport
CASH FLOWS FROM OPERATING
Cash and cash equivalents, October 1
Cash and cash equivalents, September 30

Totals
Reconciliation of operating income (loss) to
net cash provided (used) by operating activities:
Operating income (loss) 85,002$ (104,353)$ (19,351)$
Adjustments not affecting cash:
Depreciation expense 126,776 83,665 210,441
Amortization 13,099 - 13,099
Changes in assets and liabilities:
Decrease (increase) in accounts receivable 7,294 (4,696) 2,598
Decrease in prepaid expenses 113 2,295 2,408
Decrease in inventories 12,577 - 12,577
Decrease in accounts payable (159,501) (81,874) (241,375)
Increase (decrease) in compensated absences 4 (685) (681)
Increase in accrued wages and taxes 2,257 542 2,799
Decrease in deferred revenues (20,391) (2,581) (22,972)
Total adjustments (17,772) (3,334) (21,106)
Net cash provided (used) by operating activities 67,230$ (107,687)$ (40,457)$
Cash and cash equivalents reconciliation:
Cash and cash equivalents :
Cash in banks 1,250$ -$ 1,250$
Equity in pooled investments 592,954 227,546 820,500
Restricted asset - cash and cash equivalents:
Equity in pooled investments 458,014 361,294 819,308
Cash and cash equivalents at September 30 1,052,218$ 588,840$ 1,641,058$
The accompanying notes to financial statements are an integral part of this financial statement.
21
Enterprise Funds
(Continued)
City of Sebastian, Florida
AirportGolf Course
Statement of Cash Flows
Proprietary Funds
For the year ended September 30, 2002

Pension
Trust Agency
Police
Officers' Performance
Pension Deposits
ASSETS
Cash and cash equivalents:
Cash in banks 251,301$ -$
Equity in pooled investments - 4,182
Receivables:
Employee contributions 2,265 -
Interest and dividends 26,737 -
Total receivables 29,002 -
Investments, at fair value:
U.S. government obligations 862,488 -
Federal agency notes 944,862 -
Corporate bonds 20,568 -
Common stock 508,080 -
Total investments 2,335,998 -
Total assets 2,616,301 4,182$
LIABILITIES
Refunds payable - 4,182$
Total liabilities - 4,182$
NET ASSETS
Held in trust for pension benefits 2,616,301$
The accompanying notes to financial statements are an integral part of this financial statement.
22
City of Sebastian, Florida
Fiduciary Funds
Statement of Fiduciary Net Assets
September 30, 2002

Police
Officers'
Pension
ADDITIONS
Contributions:
Employer 8,620$
Plan members 61,714
State 82,877
Total contributions 153,211
Investment earnings:
Net decrease in fair value of investments (48,448)
Interest and dividends 112,906
Total investment earnings 64,458
Less investment expenses (19,732)
Net investment earnings 44,726
Total additions 197,937
DEDUCTIONS
Benefits 24,283
Refunded contributions 18,053
Other expenses 7,253
Total deductions 49,589
Change in net assets 148,348
Net assets - beginning of year 2,467,953
Net assets - end of year 2,616,301$
The accompanying notes to financial statements are an integral part of this financial statement.
23
City of Sebastian, Florida
Statement of Changes in Fiduciary Net Assets
Fiduciary Fund - Pension Trust
For the year ended September 30, 2002

24
CITY OF SEBASTIAN, FLORIDA Notes to the Financial Statements
September 30, 2002
I. SUMMARY OF SIGNIFICANT ACCOUNTING POLICIES
The City of Sebastian (the “City”), a Florida Municipal Corporation, was incorporated in 1924 under Sections 1826-1832 of the Revised Florida Statutes. The City has a population of approximately 17,200 living in an area of approximately 13.5 square miles. The governing body is a five member elected City Council with a mayor elected from the five members. The City Council appoints the City Managerwho is responsible for the administration of all City services.
The financial statements of the City have been prepared in conformity with U.S. generally accepted accounting principles as applied to governmental units. The more significant of the City’s accounting policies are described below:
A. Reporting Entity
In evaluating the City as a reporting entity, management has included all component units in accordance with Governmental Accounting Standards Board (GASB) Statement No. 14, “Defining the Financial Reporting Entity”. The Financial Reporting Entity consists of the City of Sebastian (the primary government) and its blended component units. Blended component units are legallyseparate organizations for which the City Council is financially accountable. The component units discussed below are included in the City’s reporting entity.
Blended Component Units
The following component units are blended with the primary government for financial statement purposes because the component unit’s governing body is substantially the same as the City Council or because the component unit exclusively serves the City. The financial statements of these component units may be obtained from the City Clerk of the City of Sebastian.
Community Redevelopment Agency (CRA) – The governing body of the CRA is the Sebastian City Council. The CRA is accounted for in a special revenue fund entitled “Riverfront Redevelopment”.
City of Sebastian Police Officers’ Pension Plan – The City Council only appoints two of the five members of the governing board,but it is financially responsible for funding the police officers’ pension benefits. The City of Sebastian Police Officers’ Pension Trust Fund only exists to provide pension benefits to City of Sebastian police officers. It is accounted for as a Pension Trust fund entitled “Police Officers’ Pension”.
B. Basic Financial Statements
The government-wide financial statements (i.e., the statement of net assets and the statement of changes in net assets) report information on all of the nonfiduciary activities of the primary government and its blended component units. For the most part, the effect of interfund activity has been removed from these statements. Governmental activities, which normally are supported by taxes and intergovernmental revenues, are reported separately from business-type activities, which rely to a significant extent on fees and charges for support.
Separate fund financial statements are provided for governmental funds, proprietary funds, and fiduciary funds, even though the latter are excluded from the government-wide financial statements. Major individual governmental funds and major individual enterprisefunds are reported as separate columns in the fund financial statements.
GASB Statement No. 34 Basic Financial Statements and Management Discussion and Analysis for State and Local Governments sets forth minimum criteria (percentage of the assets, liabilities, revenues or expenditures/expenses of either fund category or thegovernmental and enterprise funds combined) for the determination of major funds. The nonmajor funds are combined in a column in the fund financial statements and detailed in the combining section.
C. Measurement Focus, Basis of Accounting, and Financial Statement Presentation
1. Economic Resources Measurement Focus and Accrual Basis of Accounting
The government-wide financial statements are reported using the economic resources measurement focus and the accrual basis of accounting, as are the proprietary fund and fiduciary fund financial statements. This means that revenues are recorded when earned and expenses are recorded when a liability is incurred, regardless of the timing of the related cash flows. Property taxes are recognized as revenues in the year for which they are levied. Grants and similar items are recognized as revenue as soon asall eligibility requirements imposed by the provider have been met.

25
In applying the “susceptible to accrual” concept to intergovernmental revenues pursuant to GASB Statement No. 33, Accounting and Financial Reporting for Nonexchange Transactions as amended by GASB Statement No. 36, Recipient Reporting of Certain Shared Nonexchange Revenues (the City may act as either provider or recipient), the provider should recognize liabilities and expenses and the recipient should recognize receivables and revenue when the applicable eligibility requirements including timerequirements, are met. Resources transmitted before the eligibility requirements are met should, under most circumstances, be reported as advances by the provider and deferred revenue by the recipient.
Private-sector standards of accounting and financial reporting issued prior to December 1, 1989, generally are followed in boththe government-wide and proprietary fund financial statements to the extent that those standards do not conflict with or contradict guidance of the Governmental Accounting Standards Board. Governments also have the option of following subsequent private-sector guidance for their business-type activities and enterprise funds, subject to this same limitation. Thegovernment has elected not to follow subsequent private-sector guidance.
As a general rule the effect of interfund activity has been eliminated from the government-wide financial statements.
The statement of activities demonstrates the degree to which the direct expenses of a given function or segment are offset by program revenues. Direct expenses are those that are clearly identifiable with a specific function or segment. Programrevenues include 1) charges to customers or applicants who purchase, use, or directly benefit from goods, services, or privileges provided by a given function or segment and 2) grants and contributions that are restricted to meeting the operational or capital requirements of a particular function or segment. Taxes and other items not properly included among program revenues are reported instead as general revenues.
Proprietary funds distinguish operating revenues and expenses from nonoperating items. Operating revenues and expenses generally result from providing services and producing and delivering goods in connection with a proprietary fund’s principal ongoing operations. The principal operating revenues of the golf course fund are charges to customers for sales and services and for the airport fund lease revenue. Operating expenses for enterprise funds include cost of sales and services, administrativeexpenses, and depreciation on capital assets. All revenues and expenses not meeting this definition are reported as nonoperating revenues and expenses.
2. Modified Accrual
Governmental fund financial statements are reported using the current financial resources measurement focus and the modifiedaccrual basis of accounting. Revenues are recognized as soon as they are both measurable and available. “Available” means collectible within the current period or soon enough thereafter to be used to pay liabilities of the current period. For this purpose, the City considers revenues to be available if they are collected within sixty (60) days of the end of the current fiscal period. All material revenues, except for occupational licenses and property taxes, are considered measurable and available andare thus susceptible to accrual. Occupational licenses are not considered available since neither a legally enforceable claim exists nor were the related services provided before October 1, 2002. Expenditures are generally recognized under the modifiedaccrual basis of accounting when the related fund liability is incurred, if measurable. An exception to this general rule is principal and interest on general long-term obligations, which are recognized when due.
Property taxes, public utility taxes, franchise fees, sales and fuel taxes, licenses, and interest associated with the current fiscalperiod are all considered to be susceptible to accrual and so have been recognized as revenues in the current fiscal period. Only the portion of special assessments receivable due within the current fiscal period is considered to be susceptible to accrual asrevenue of the current period. All other revenue items are considered to be measurable and available only when cash is receivedby the government.
The government reports the following major governmental funds:
The general fund is the government’s primary operating fund. It accounts for all financial resources of the general government, except those required to be accounted for in another fund.
The discretionary sales tax fund accounts for the financial resources used for infrastructure improvements and equipment purchases.
The capital improvements fund accounts for the accumulated resources associated with infrastructure improvements such as drainage, parks and buildings.
The road paving program fund accounts for the resources associated with debt for the purposes of reconstructing and paving roads.
The government reports the following major proprietary funds:
The golf course fund accounts for the activities of the municipal golf course.
The airport fund accounts for the activities of the municipality’s general aviation airport.

26
Additionally, the government reports the following fund types:
The pension trust fund accounts for the activities of the Police Officer’s Retirement System, which accumulates resources for pension benefit payments to qualified police officers.
The performance deposits fund accounts for deposits placed by bidders and developers to guarantee performance pursuant to bid or contract and for deposits for use of City owned buildings and parks to guarantee performance pursuant to contract. These funds are held by the City as agent for individuals and businesses.
When both restricted and unrestricted resources are available for use, it is the government’s policy to use restricted resources first, and then unrestricted resources as needed.
D. Assets, Liabilities and Fund Equity
1. Cash and cash equivalents
Cash and cash equivalents represents all investments that are short term, highly liquid, and readily convertible to a specifiedcash value. These investments generally have original maturities of three months or less. Cash equivalents consist of cash inbanks and on hand.
2. Equity in pooled investments
Equity in pooled investments consists of investments in the Local Government Surplus Funds Trust Fund administered by the Florida State Board of Administration. The State Board of Administration is not a registrant with the Securities and Exchange Commission. However, the Board has adopted operating procedures consistent with the requirements for a 2a-7 fund. In accordance with the regulations of 2a-7 like pools, the City’s share of investments held at the State Board of Administration arereported at amortized cost, which approximates fair value. This pool is regulated by the State and the fair value of the position in the pool is the same as the value of the pool share. Investment earnings of the pool are allocated to the participating funds at the end of each month based upon the ratio of each participant’s investment to the total pooled investments.
Pursuant to Florida Statutes, interest income earned on Local Option Gas Tax funds is required to be earmarked for transportation infrastructure improvements. Local Option Gas Tax funds held as investments in the Transportation Projects fund, which are part of an internal investment pool, are assigned and recorded in the Local Option Gas Tax Special Revenue Fund in accordance with these legal restrictions.
As of September 30, 2002, all funds participated in pooled cash investments except the Pension Trust and the Road Paving Program.
3. Investments
Investments, including the Police Officers’ Pension Fund, are stated at fair value, (quoted market price or the best available information).
4. Interfund Receivables and Payables
During the course of operations, transactions occur between individual funds that may result in amounts owed between funds. Short-term interfund loans are reported as “due to and from other funds.” Due to and from other funds are eliminated in the Statement of Net Assets. There were no interfund loans between the Governmental funds and Proprietary funds as of September 30, 2002.
5. Receivables
Receivables consist of trade receivables, due from other governments and interest receivable (see Note IV.C. on page 30 for detail) and are recorded at gross amount. The City, as of September 30, 2002, has no allowance for doubtful accounts, since allreceivables are considered collectible.
6. Inventory and Prepaid Items
Inventory is valued at cost using the average cost method. Inventory in the General fund consists of materials and supplies heldfor consumption. The cost is recorded as an expenditure/expense at the time the individual inventory items are consumed. Inventory in the Golf Course fund consists of supplies held for resale.
Certain payments to vendors reflect costs applicable to future accounting periods and are recorded as prepaid items in both government-wide and fund financial statements.

27
7. Restricted Assets
Certain assets of the governmental activities, representing equity in pooled investments, are classified as restricted on the statement of net assets because they are limited as to use by Federal, State or local law.
Certain proceeds of the Golf Course enterprise fund revenue bonds, as well as certain resources set aside for their repayment, are classified as restricted assets on the statement of net assets because their use is limited by applicable bond covenants. The “revenue bond renewal and replacement “account is used to report resources set aside to fund asset renewals and replacements. The “revenue bond airport rent” account is used to report resources set aside to subsidize potential deficiencies in lease payments that could adversely affect debt service payments.
8. Capital Assets
Capital assets, which include land, buildings, improvements, equipment, and infrastructure assets (e.g., roads, bridges, sidewalks, and similar items), are reported in the applicable governmental or business-type activities columns in the government-wide financial statements. Capital assets are defined by the government as assets with an initial, individual cost of more than $500 and an estimated useful life in excess of one year. Such assets are recorded at historical cost, if purchased, andat fair market value at date of gift, if donated.
Major additions are capitalized while maintenance and repairs that do not improve or extend the life of the respective assets arecharged to expense.
Capital asset depreciation is recognized using the straight-line method over the estimated useful lives as follows:
Classification Range of LivesBuildings and improvements 20-40 years Public domain infrastructure 40-50 years System infrastructure 15-30 years Improvements other than buildings 10-20 years Machinery, equipment and other 5-15 years Airport runways 25 years
9. Compensated Absences
It is the City’s policy to permit employees to accumulate earned but unused vacation and sick leave benefits and are accounted for using the termination payment method. All vacation and sick leave amounts are accrued in the government-wide and proprietary financial statements. A liability for these amounts is reported in governmental funds only if they have matured, forexample, as a result of employee resignations and retirements.
10. Long-Term Liabilities
In the government-wide financial statements, and proprietary fund types in the fund financial statements, long-term debt and other long-term obligations are reported as liabilities in the applicable governmental activities, business-type activities, orproprietary fund type statement of net assets. Bond premiums and discounts, as well as issuance costs, are deferred and amortized over the life of the bonds using the straight-line method. Bonds payable are recorded net of the applicable bond premium or discount. Bond issuance costs are reported as deferred charges and amortized over the life of the related debt. Inthe fund financial statements, governmental fund types recognize bond premium and discounts, as well as debt issuance costs, during the current period. The face amount of debt issued is reported as other financing sources. Premiums received on debt issuances are reported as other financing sources while discounts on debt issuances are reported as other financing uses. Issuance costs, whether or not withheld from the actual debt proceeds received, are reported as debt service expenditures.
11. Fund Equity
In the fund financial statements, governmental funds report reservations of fund balance for amounts that are not available forappropriation or are legally restricted by outside parties for use for a specific purpose. The nature and purpose of these reserves are explained as follows:
Reserved for Encumbrances – represents encumbrances outstanding at year end that the City intends to honor as commitments.
Reserved for Inventory – represents amounts held for future consumption.
Reserved for Prepaid Items – represents amounts paid from current resources applicable to future years.
Reserved for Donations – represents amounts received from donors for certain programs.
Reserved for Debt Service – represents, in accordance with legal restrictions, amounts for payment of principal and interest maturing in later years.

28
Reserved for Law Enforcement – represents, in accordance with State Statutes, funds required to be spent on drug education and awareness activities.
Reserved for Cemetery Care – represents amounts restricted for use in cemetery maintenance.
Designations of unreserved fund balances are not required by law or accounting principles, but are further classifications of fundequity to identify funds that are not earmarked for specific purposes.
II. RECONCILIATION OF GOVERNMENT-WIDE AND FUND FINANCIAL STATEMENTS
A. Explanation of Certain Differences Between the Governmental Fund Balance Sheet and the Government-wide Statement of Net Assets
The governmental fund balance sheet includes a reconciliation between fund balance-total governmental funds and net assets-governmental activities as reported in the government-wide statement of net assets.
An element of that reconciliation explains that “some liabilities, including compensated absences and notes and capital leases, are not due and payable in the current period and therefore are not reported in the funds.” The details of this $3,963,637 difference are identified as follows:
B. Explanation of Certain Differences Between the Governmental Fund Statement of Revenues, Expenditures, and Changes in Fund Balances and the Government-wide Statement of Activities
The governmental fund statement of revenues, expenditures, and changes in fund balances includes a reconciliation between netchanges in fund balances – total governmental funds and changes in net assets of governmental activities as reported in the government-wide statement of activities.
One element of the reconciliation explains that “repayment of debt principal is an expenditure in governmental funds, but the repayment reduces long-term liabilities in the statement of net assets. The details of this ($344,553) difference is as follows:
Another element of that reconciliation states that “some expenses and revenues reported in the statement of activities do not require the use of current financial resources and therefore are not reported as expenditures in governmental funds.” The details of the($163,345) difference are as follows:
Notes Payable 2,728,238$
(8,220)
Accrued interest payable 34,149
Special assessment deferred revenue (66,048)
Capital leases payable 788,957
(9,044)
Compensated absences 495,605
3,963,637$
Less: Deferred charge for issuance costs (to be amortized over life of debt)
Less: Deferred charge for issuance costs (to be amortized over life of debt)
Net adjustment to reduce fund balance-total governmental funds to arrive at net assets-governmental activities
Principal repayments:
Bank note debt 179,908$
Special assessment debt 53,602
Lease debt 111,043
344,553$
Net adjustment to decrease net changes in fund balances-total governmental funds to
arrive at changes in net assets of governmental activities
Accrued interest 6,115$
Amortization of issuance costs (2,338)
Special assessment revenue (31,756)
Compensated absences (135,366)
(163,345)$
Net adjustment to decrease net changes in fund balances-total governmental funds to
arrive at changes in net assets of governmental activities
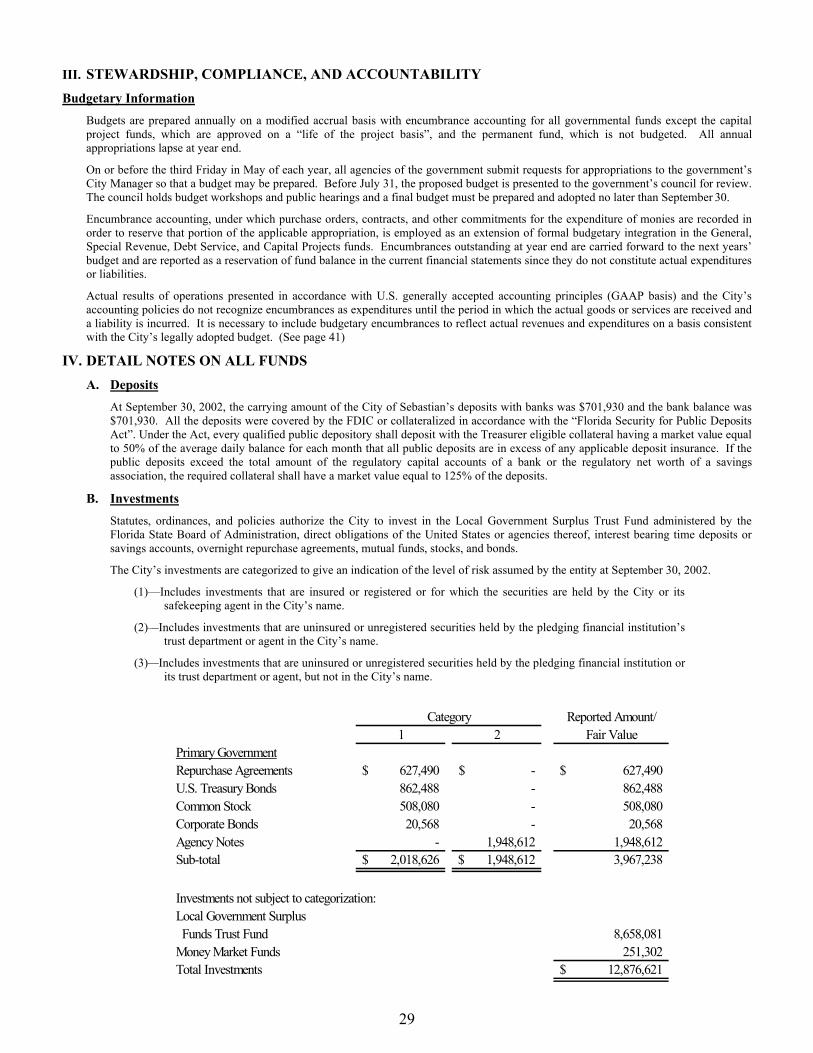
29
III. STEWARDSHIP, COMPLIANCE, AND ACCOUNTABILITY
Budgetary Information
Budgets are prepared annually on a modified accrual basis with encumbrance accounting for all governmental funds except the capital project funds, which are approved on a “life of the project basis”, and the permanent fund, which is not budgeted. All annual appropriations lapse at year end.
On or before the third Friday in May of each year, all agencies of the government submit requests for appropriations to the government’s City Manager so that a budget may be prepared. Before July 31, the proposed budget is presented to the government’s council for review. The council holds budget workshops and public hearings and a final budget must be prepared and adopted no later than September 30.
Encumbrance accounting, under which purchase orders, contracts, and other commitments for the expenditure of monies are recorded in order to reserve that portion of the applicable appropriation, is employed as an extension of formal budgetary integration in the General, Special Revenue, Debt Service, and Capital Projects funds. Encumbrances outstanding at year end are carried forward to the next years’ budget and are reported as a reservation of fund balance in the current financial statements since they do not constitute actual expenditures or liabilities.
Actual results of operations presented in accordance with U.S. generally accepted accounting principles (GAAP basis) and the City’s accounting policies do not recognize encumbrances as expenditures until the period in which the actual goods or services are received and a liability is incurred. It is necessary to include budgetary encumbrances to reflect actual revenues and expenditures on a basis consistent with the City’s legally adopted budget. (See page 41)
IV. DETAIL NOTES ON ALL FUNDS
A. Deposits
At September 30, 2002, the carrying amount of the City of Sebastian’s deposits with banks was $701,930 and the bank balance was$701,930. All the deposits were covered by the FDIC or collateralized in accordance with the “Florida Security for Public DepositsAct”. Under the Act, every qualified public depository shall deposit with the Treasurer eligible collateral having a market value equal to 50% of the average daily balance for each month that all public deposits are in excess of any applicable deposit insurance. If the public deposits exceed the total amount of the regulatory capital accounts of a bank or the regulatory net worth of a savings association, the required collateral shall have a market value equal to 125% of the deposits.
B. Investments
Statutes, ordinances, and policies authorize the City to invest in the Local Government Surplus Trust Fund administered by the Florida State Board of Administration, direct obligations of the United States or agencies thereof, interest bearing time deposits or savings accounts, overnight repurchase agreements, mutual funds, stocks, and bonds.
The City’s investments are categorized to give an indication of the level of risk assumed by the entity at September 30, 2002.
(1)—Includes investments that are insured or registered or for which the securities are held by the City or its safekeeping agent in the City’s name.
(2)—Includes investments that are uninsured or unregistered securities held by the pledging financial institution’s trust department or agent in the City’s name.
(3)—Includes investments that are uninsured or unregistered securities held by the pledging financial institution or its trust department or agent, but not in the City’s name.
Reported Amount/
1 2 Fair Value
Primary Government
Repurchase Agreements 627,490$ -$ 627,490$
U.S. Treasury Bonds 862,488 - 862,488
Common Stock 508,080 - 508,080
Corporate Bonds 20,568 - 20,568
Agency Notes - 1,948,612 1,948,612
Sub-total 2,018,626$ 1,948,612$ 3,967,238
Investments not subject to categorization:
Local Government Surplus
Funds Trust Fund 8,658,081
Money Market Funds 251,302
Total Investments 12,876,621$
Category

30
C. Receivables
Receivables at September 30, 2002 for the government’s individual major funds and nonmajor funds in the aggregate are as follows:
All receivables are anticipated to be collected.
Governmental funds report deferred revenue in connection with receivables for revenues that are not considered to be available to liquidate liabilities of the current period. Governmental funds also defer revenue recognition in connection with resources that have been received, but not yet earned. At September 30, 2002, the various components of deferred revenue and unearned revenuereported in the governmental funds were as follows:
D. Capital Assets
Capital asset activity for the year ended September 30, 2002 was as follows:
The reclassification identified above represents land misclassified in prior years. The underlying assets were not depreciated in prior years.
Nonmajor
Discretionary Capital Golf and Other
General Sales Tax Improvements Course Airport Funds Total
Receivables:
Interest 14,619$ 6$ -$ 2$ 5$ 333$ 14,965$
Accounts 209,677 - 11,912 74 4,925 - 226,588
Intergovernmental 186,700 160,903 49,751 - 53,745 65,371 516,470
Gross receivables 410,996 160,909 61,663 76 58,675 65,704 758,023
Unavailable Deferred
Special assessments not yet due (debt service fund) 66,048$ -$
Occupational licenses received in advance (general fund) - 57,952
Total deferred/unearned revenue for governmental funds 66,048$ 57,952$
Beginning Ending
Balance Increases Decreases Reclassifications Balance
Governmental activities:
Capital assets, not being depreciated:
Land 3,748,585$ 606,009$ (8,147)$ 141,726$ 4,488,173$
Construction in progress 356,079 194,137 (285,760) - 264,456
Total capital assets, not being depreciated 4,104,664 800,146 (293,907) 141,726 4,752,629
Capital assets, being depreciated:
Buildings 2,310,816 254,627 (10,235) 1,500 2,556,708
Improvements other than buildings 2,367,192 204,529 (377,270) (145,226) 2,049,225
Machinery and equipment 4,384,245 400,199 (212,803) (1,500) 4,570,141
Infrastructure 13,288,248 989,770 (330,478) 3,500 13,951,040
Total capital assets being depreciated 22,350,501 1,849,125 (930,786) (141,726) 23,127,114
Less accumulated depreciation for:
Buildings (1,011,353) (64,029) 9,410 (666) (1,066,638)
Improvements other than buildings (925,090) (87,394) 335,866 - (676,618)
Machinery and equipment (2,150,412) (566,096) 175,285 666 (2,540,557)
Infrastructure (5,748,157) (435,486) 330,476 - (5,853,167)
Total accumulated depreciation (9,835,012) (1,153,005) 851,037 - (10,136,980)
Total capital assets, being depreciated, net 12,515,489 696,120 (79,749) (141,726) 12,990,134
Governmental activities capital assets, net 16,620,153$ 1,496,266$ (373,656)$ -$ 17,742,763$

31
Depreciation expense was charged to functions/programs of the government as follows:
Construction Commitments
The government has active construction projects as of September 30, 2002. The projects include street widening, paving and reconstruction and airport facilities construction. At year end the government’s commitment with contractors are as follows:
The residential street construction is being financed entirely with a bank loan that will be repaid using local option gas taxes. The airport improvements are being funded by a combination of Federal Aviation Administration grants, Florida Department of Transportation-Aviation Section grants and airport fund.
Remaining
Project Spent-to-date Commitment
Residential street construction 3,127,336$ 425,518$
Airport improvements 336,771 333,342
Total 3,464,107$ 758,860$
Governmental activities:
General government 64,934$
Public safety 256,278
Public works, including depreciation of general infrastructure assets 682,282
Housing and community development 8,284
Culture and recreation 135,609
Cemetery 5,618
Total depreciation expense-governmental activities 1,153,005$
Business-type activities:
Golf Course 126,776$
Airport 83,665
Total depreciation expense-business-type activities 210,441$
Beginning Ending
Balance Increases Decreases Balance
Business-type activities:
Capital assets, not being depreciated:
Land 9,060$ -$ -$ 9,060$
Construction in progress 82,935 268,889 (4,334) 347,490
Total capital assets, not being depreciated 91,995 268,889 (4,334) 356,550
Capital assets, being depreciated:
Buildings 344,114 - (10,925) 333,189
Improvements other than buildings 540,990 39,231 (6,112) 574,109
Machinery and equipment 450,633 65,746 (30,363) 486,016
Infrastructure 2,372,976 - (1,155) 2,371,821
Total capital assets being depreciated 3,708,713 104,977 (48,555) 3,765,135
Less accumulated depreciation for:
Buildings (250,261) (10,941) 10,649 (250,553)
Improvements other than buildings (74,725) (47,558) 5,912 (116,371)
Machinery and equipment (273,324) (60,421) 23,485 (310,260)
Infrastructure (809,469) (108,775) 1,198 (917,046)
Total accumulated depreciation (1,407,779) (227,695) 41,244 (1,594,230)
Total capital assets, being depreciated, net 2,300,934 (122,718) (7,311) 2,170,905
Business-type activities capital assets, net 2,392,929$ 146,171$ (11,645)$ 2,527,455$
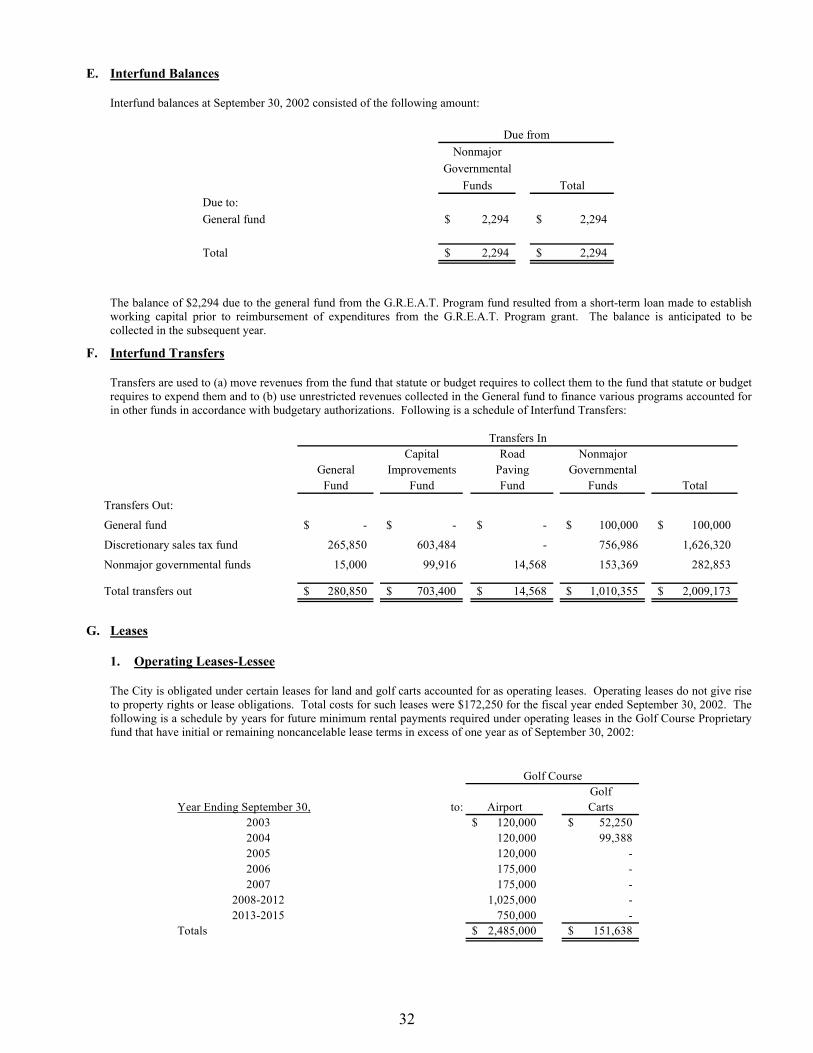
32
E. Interfund Balances
Interfund balances at September 30, 2002 consisted of the following amount:
The balance of $2,294 due to the general fund from the G.R.E.A.T. Program fund resulted from a short-term loan made to establishworking capital prior to reimbursement of expenditures from the G.R.E.A.T. Program grant. The balance is anticipated to be collected in the subsequent year.
F. Interfund Transfers
Transfers are used to (a) move revenues from the fund that statute or budget requires to collect them to the fund that statute or budget requires to expend them and to (b) use unrestricted revenues collected in the General fund to finance various programs accounted for in other funds in accordance with budgetary authorizations. Following is a schedule of Interfund Transfers:
G. Leases
1. Operating Leases-Lessee
The City is obligated under certain leases for land and golf carts accounted for as operating leases. Operating leases do not give rise to property rights or lease obligations. Total costs for such leases were $172,250 for the fiscal year ended September 30, 2002. The following is a schedule by years for future minimum rental payments required under operating leases in the Golf Course Proprietary fund that have initial or remaining noncancelable lease terms in excess of one year as of September 30, 2002:
Golf
Year Ending September 30, to: Airport Carts
2003 120,000$ 52,250$
2004 120,000 99,388
2005 120,000 -
2006 175,000 -
2007 175,000 -
2008-2012 1,025,000 -
2013-2015 750,000 -
Totals 2,485,000$ 151,638$
Golf Course
Nonmajor
Governmental
Funds Total
Due to:
General fund 2,294$ 2,294$
Total 2,294$ 2,294$
Due from
Capital Road Nonmajor
General Improvements Paving Governmental
Fund Fund Fund Funds Total
Transfers Out:
General fund -$ -$ -$ 100,000$ 100,000$
Discretionary sales tax fund 265,850 603,484 - 756,986 1,626,320
Nonmajor governmental funds 15,000 99,916 14,568 153,369 282,853
Total transfers out 280,850$ 703,400$ 14,568$ 1,010,355$ 2,009,173$
Transfers In

33
2. Capital Leases-Lessee
The government has entered into a lease agreement as lessee for financing the acquisition of heavy construction equipment for itspublic works department. This lease agreement qualifies as a capital lease for accounting purposes and, therefore, has been recorded at the present value of its future minimum lease payments as of the inception date.
The assets acquired through the capital lease are as follows:
The future minimum lease obligations and the net present value of these minimum lease payments as of September 30, 2002 were asfollows:
3. Operating Leases-Lessor
The airport is the lessor of various properties (land with a cost basis of $9,060) with lease terms varying from twenty to thirtyyears. Following is a schedule by year of minimum future rental income on noncancelable operating leases:
Governmental
Activities
Asset:
Machinery and equipment 859,859$
Less: Accumulated depreciation (138,618)
Total 721,241$
Year Ending September 30, Amount
2003 161,434$
2004 161,434
2005 161,434
2006 216,434
2007 216,434
2008-2012 1,232,169
2013-2017 949,969
2018-2022 86,785
2023-2027 77,134
2028-2031 50,105
Total minimum future rentals 3,313,332$
Governmental
Year Ending September 30, Activities
2003 154,693$
2004 154,693
2005 154,693
2006 154,693
2007 154,694
2008 154,694
Total minimum lease payments 928,160
Less: amount representing interest (139,203)
Present value of minimum lease payments 788,957$

34
H. Long-term Obligations
1. Revenue Bonds/Notes
Revenue bonds/notes are secured by and payable from the revenues of the respective funds that issued them.
a. The City issued a ten (10) year, $527,993 Revenue Bond, Series 1996 for the purpose of financing the construction costs of a waterline along the City’s riverfront. The principal and interest are paid from special assessments received on an annual basis. The City is obligated by a covenant to budget and appropriate in the event revenues collected and/or defaults occur which are less than debt service requirements. Currently the City has $23,802 in default assessments. These funds are accumulated in the Debt Service fund.
b. The City entered into a fifteen (15) year loan agreement in 1998 with a local bank for $3,268,890 to provide financing to repave certain roads in the City. The City pledged Local Option Gas Tax and Municipal Gas Tax to repay the note payable. The funds are accumulated in the Local Option Gas Tax Special Revenue fund for repayment of principal and interest.
c. The City issued ten (10) year, $2,435,000 Golf Course Revenue Refunding Bonds, Series 2001 in March 2001. The City has pledged Golf Course revenues along with a covenant to budget and appropriate for repayment of principal and interest.
2. Changes in Long-term Debt
The following is a summary of changes in Long-Term Debt of the City for the year ended September 30, 2002:
Special revenue funds predominantly serve the governmental funds. Also, for the governmental activities, compensated absences are generally liquidated by the general fund.
Beginning Ending Due within
Balance Additions Reductions Balance One Year
Governmental activities:
Bonds payable:
Special assessment debt
with government commitment 187,901$ -$ 53,602$ 134,299$ 56,684$
Total bonds payable 187,901 - 53,602 134,299 56,684
Notes payable 2,773,847 - 179,908 2,593,939 187,911
Capital leases 900,000 - 111,043 788,957 116,429
Compensated absences 389,674 154,522 18,364 525,832 30,227
Governmental activitylong-term liabilites 4,251,422$ 154,522$ 362,917$ 4,043,027$ 391,251$
Business-type activities:
Bonds payable:
Revenue bonds 2,435,000$ -$ 100,000$ 2,335,000$ 220,000$
Less deferred amounts:
For issuance premium/(discount) 7,177 - 798 6,379 -
Loss on refunding (74,898) - (8,322) (66,576) -
Total bonds payable 2,367,279 - 92,476 2,274,803 220,000
Compensated absences 3,704 - 681 3,023 3,023
Business-type activitylong-term liabilites 2,370,983$ -$ 93,157$ 2,277,826$ 223,023$
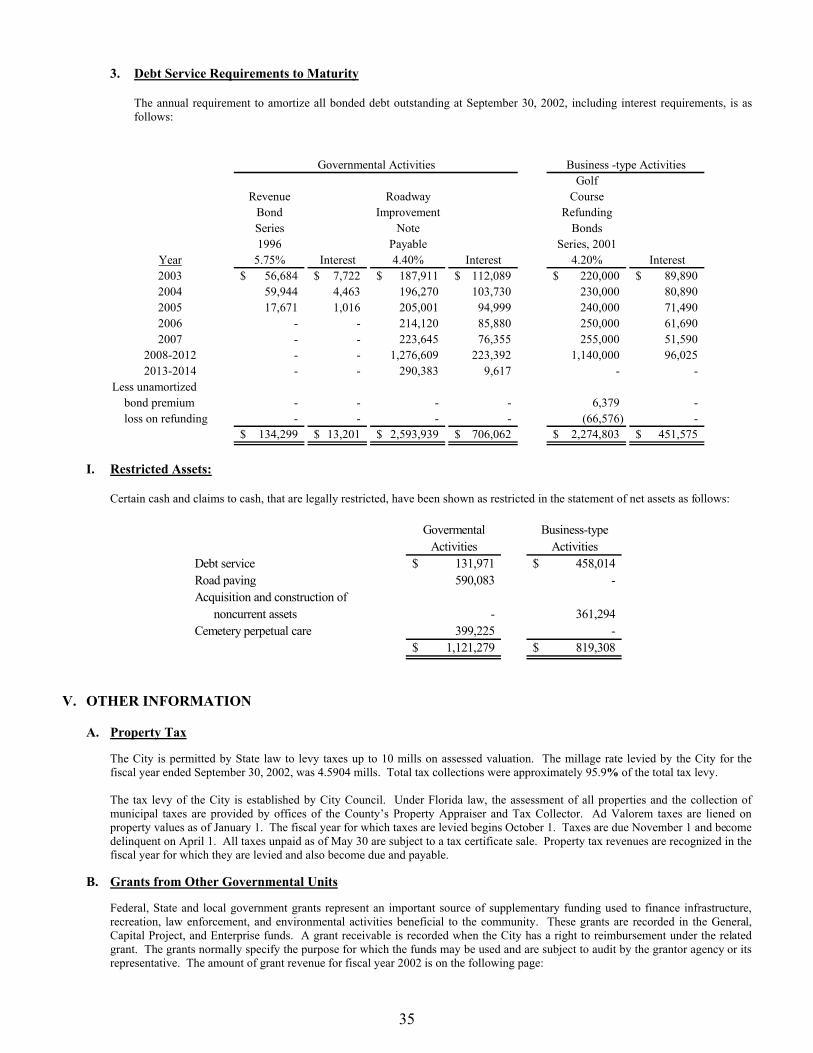
35
3. Debt Service Requirements to Maturity
The annual requirement to amortize all bonded debt outstanding at September 30, 2002, including interest requirements, is as follows:
I. Restricted Assets:
Certain cash and claims to cash, that are legally restricted, have been shown as restricted in the statement of net assets as follows:
V. OTHER INFORMATION
A. Property Tax
The City is permitted by State law to levy taxes up to 10 mills on assessed valuation. The millage rate levied by the City for the fiscal year ended September 30, 2002, was 4.5904 mills. Total tax collections were approximately 95.9% of the total tax levy.
The tax levy of the City is established by City Council. Under Florida law, the assessment of all properties and the collection of municipal taxes are provided by offices of the County’s Property Appraiser and Tax Collector. Ad Valorem taxes are liened on property values as of January 1. The fiscal year for which taxes are levied begins October 1. Taxes are due November 1 and become delinquent on April 1. All taxes unpaid as of May 30 are subject to a tax certificate sale. Property tax revenues are recognized in the fiscal year for which they are levied and also become due and payable.
B. Grants from Other Governmental Units
Federal, State and local government grants represent an important source of supplementary funding used to finance infrastructure, recreation, law enforcement, and environmental activities beneficial to the community. These grants are recorded in the General, Capital Project, and Enterprise funds. A grant receivable is recorded when the City has a right to reimbursement under the related grant. The grants normally specify the purpose for which the funds may be used and are subject to audit by the grantor agency or its representative. The amount of grant revenue for fiscal year 2002 is on the following page:
Govermental Business-type
Activities Activities
Debt service 131,971$ 458,014$
Road paving 590,083 -
Acquisition and construction of
noncurrent assets - 361,294
Cemetery perpetual care 399,225 -
1,121,279$ 819,308$
Golf
Revenue Roadway Course
Bond Improvement Refunding
Series Note Bonds
1996 Payable Series, 2001
Year 5.75% Interest 4.40% Interest 4.20% Interest
2003 56,684$ 7,722$ 187,911$ 112,089$ 220,000$ 89,890$
2004 59,944 4,463 196,270 103,730 230,000 80,890
2005 17,671 1,016 205,001 94,999 240,000 71,490
2006 - - 214,120 85,880 250,000 61,690
2007 - - 223,645 76,355 255,000 51,590
2008-2012 - - 1,276,609 223,392 1,140,000 96,025
2013-2014 - - 290,383 9,617 - -
Less unamortized
bond premium - - - - 6,379 -
loss on refunding - - - - (66,576) -
134,299$ 13,201$ 2,593,939$ 706,062$ 2,274,803$ 451,575$
Governmental Activities Business -type Activities

36
C. Police Pension Plan
Plan Description. The Police Officers’ Pension Plan is a Florida Statute Chapter 185 single-employer defined benefit plan. Only City police officers participate in the Police Pension Plan. The state provides a contribution to the Police Pension Plan through a distribution of funds collected from insurance premium taxes. Pension plan data is provided from an actuarial report dated October 1, 2000. Although the Police Officers’ Pension Plan provides separate reporting, which may be obtained in the Finance department, it is also a component unit (reporting as a Pension Trust Fund) of the City’s financial reporting entity.
Employee membership data as of the latest actuarial data available related to the plan is as follows:
Police Pension Plan 2000
Retirees and beneficiaries currently receiving benefits 2 Terminated employees entitled to refund of employee contribution but not yet received 0 Fully, partially, and non-vested active plan participants 32Total 34
Benefit Provisions and Contribution Requirements. The Police Officers’ Pension Plan provides retirement and disability benefits to plan members and beneficiaries. This plan is administered by a separate local Board of Trustees. Chapter 185, Florida Statutes, as amended governs all benefit provisions of the plan. Contribution requirements, in accordance with Chapter 185, Florida Statutes, are established by City ordinance, as provided in Chapter 58, Article III of the Sebastian City Code. The City Council has the authority to amend funding requirements.
Funding Policy. The employer, employee, and State contribution requirements are applicable to the Plan and actuarially determined on a bi-annual basis in accordance with Florida State Statute. Administration costs of the pension plan are financed by the plan. The employee contribution rate, expressed as a percentage of compensation, was 5.0% for the 2001-2002 fiscal year. The employer contribution rate, expressed as a percentage of compensation, was .7% for the 2001-2002 fiscal year. A tax is levied on property and casualty insurance premiums and collected by the State which partially funds the Plan. The City is required to contribute the remaining amounts to ensure that the Plan is actuarially sound.
The City’s annual contributions exceeded the annual pension cost for the Police Officers’ Pension Plan for the year ended September 30, 2002. The City’s contribution to the plan was $91,497, including State contribution of $82,877.
Required trend information for the Police Officers’ Pension Plan was as follows:
AmountAnnual Pension Cost (APC)
1999 $ 82,645 2000 $ 0 2001 $ 10,057
Percentage of APC contributed 1999 116.00% 2000 204.00% 2001 124.00%
Since the employer contribution exceeded the annual pension costs, there is no net pension obligation for the plan.
The annual required contribution for the Police Officers’ Pension Plan was determined as part of the October 1, 2000, actuarialvaluation using the aggregate actuarial cost method. This method does not identify or separately amortize unfunded actuarial accrued liabilities. The actuarial assumptions included (a) an 8.0% rate of return (net of administrative costs) and (b) projected salary increases of 7.5% per year, including inflation at 3%. There is no unfunded actuarial accrued liability as of September 30, 2002.
Reserves. All of the net assets of the Police Pension Plan are legally reserved for plan participant benefits.
Primary Government Amount
COPS Grants 102,565$
Local Law Enforcement Block Grant 10,906
General Construction 362,453
Airport 264,772
Total reporting entity 740,696$
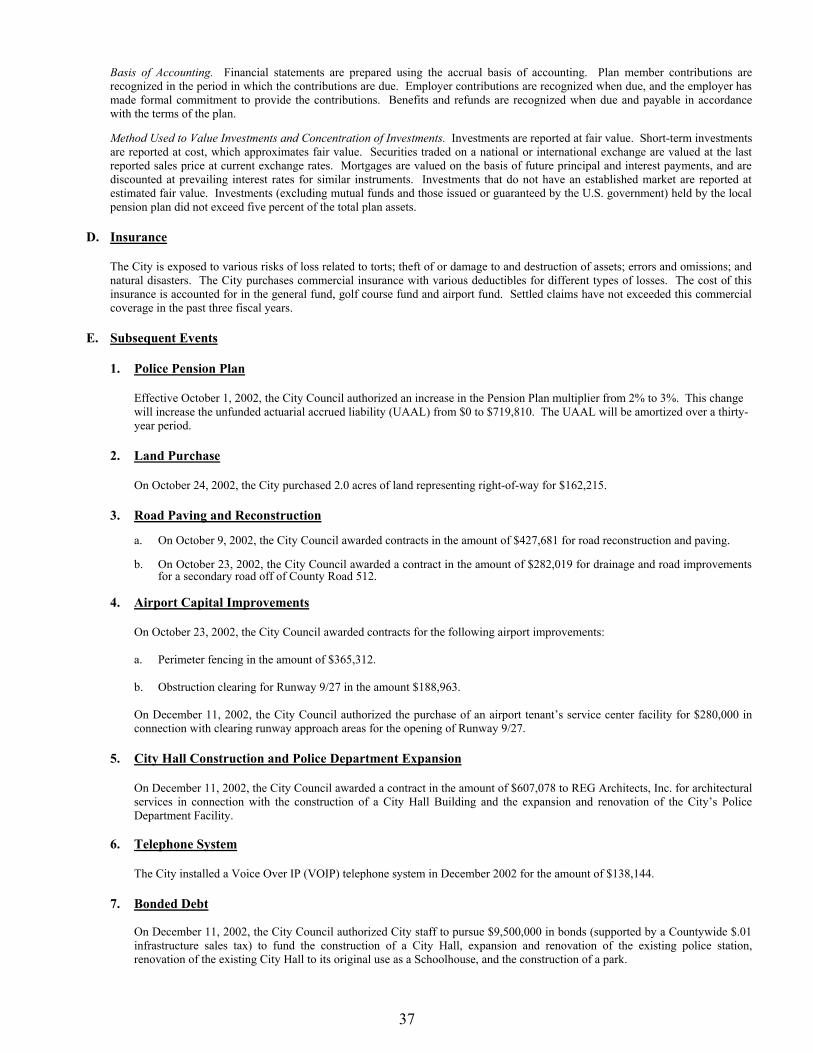
37
Basis of Accounting. Financial statements are prepared using the accrual basis of accounting. Plan member contributions are recognized in the period in which the contributions are due. Employer contributions are recognized when due, and the employer hasmade formal commitment to provide the contributions. Benefits and refunds are recognized when due and payable in accordance with the terms of the plan.
Method Used to Value Investments and Concentration of Investments. Investments are reported at fair value. Short-term investments are reported at cost, which approximates fair value. Securities traded on a national or international exchange are valued at the last reported sales price at current exchange rates. Mortgages are valued on the basis of future principal and interest payments, and are discounted at prevailing interest rates for similar instruments. Investments that do not have an established market are reported at estimated fair value. Investments (excluding mutual funds and those issued or guaranteed by the U.S. government) held by the local pension plan did not exceed five percent of the total plan assets.
D. Insurance
The City is exposed to various risks of loss related to torts; theft of or damage to and destruction of assets; errors and omissions; and natural disasters. The City purchases commercial insurance with various deductibles for different types of losses. The cost of this insurance is accounted for in the general fund, golf course fund and airport fund. Settled claims have not exceeded this commercial coverage in the past three fiscal years.
E. Subsequent Events
1. Police Pension Plan
Effective October 1, 2002, the City Council authorized an increase in the Pension Plan multiplier from 2% to 3%. This change will increase the unfunded actuarial accrued liability (UAAL) from $0 to $719,810. The UAAL will be amortized over a thirty- year period.
2. Land Purchase
On October 24, 2002, the City purchased 2.0 acres of land representing right-of-way for $162,215.
3. Road Paving and Reconstruction
a. On October 9, 2002, the City Council awarded contracts in the amount of $427,681 for road reconstruction and paving.
b. On October 23, 2002, the City Council awarded a contract in the amount of $282,019 for drainage and road improvements for a secondary road off of County Road 512.
4. Airport Capital Improvements
On October 23, 2002, the City Council awarded contracts for the following airport improvements:
a. Perimeter fencing in the amount of $365,312.
b. Obstruction clearing for Runway 9/27 in the amount $188,963.
On December 11, 2002, the City Council authorized the purchase of an airport tenant’s service center facility for $280,000 in connection with clearing runway approach areas for the opening of Runway 9/27.
5. City Hall Construction and Police Department Expansion
On December 11, 2002, the City Council awarded a contract in the amount of $607,078 to REG Architects, Inc. for architectural services in connection with the construction of a City Hall Building and the expansion and renovation of the City’s Police Department Facility.
6. Telephone System
The City installed a Voice Over IP (VOIP) telephone system in December 2002 for the amount of $138,144.
7. Bonded Debt
On December 11, 2002, the City Council authorized City staff to pursue $9,500,000 in bonds (supported by a Countywide $.01 infrastructure sales tax) to fund the construction of a City Hall, expansion and renovation of the existing police station, renovation of the existing City Hall to its original use as a Schoolhouse, and the construction of a park.

THIS PAGE INTENTIONALLY LEFT BLANK
38

Actual Variance with
Amounts on Final Budget -
a Budgetary Positive
Original Final Basis (Negative)REVENUES:Taxes:
Property 2,555,605$ 2,503,513$ 2,526,275$ 22,762$Public utility 936,237 961,252 983,236 21,984Sales 1,112,252 1,112,252 1,133,431 21,179Motor fuel taxes 144,264 144,264 142,798 (1,466)
Franchise fees 649,347 641,617 766,901 125,284Licenses and permits 483,120 483,120 578,695 95,575Intergovernmental 743,419 947,104 1,058,567 111,463Charges for services 244,407 268,482 300,321 31,839Fines 151,396 151,396 120,652 (30,744)Investment earnings 157,338 88,795 105,229 16,434Contributions and donations 18,500 41,000 37,872 (3,128)Other revenue 26,930 26,930 61,985 35,055
Total revenues 7,222,815 7,369,725 7,815,962 446,237
EXPENDITURES:Current:
General government:Legislative 40,610 40,610 37,859 2,751Manager 273,074 273,710 273,669 41Clerk 278,589 285,991 278,759 7,232Attorney 120,339 118,860 114,140 4,720Finance 345,781 365,785 363,500 2,285Human resources 181,331 193,070 179,599 13,471Vehicle maintenance 154,366 156,227 142,443 13,784Building 343,750 356,410 343,932 12,478Nondepartmental 579,018 853,403 838,112 15,291
Total general government 2,316,858 2,644,066 2,572,013 72,053
Public safety-Police 2,721,314 2,710,662 2,647,283 63,379 Public works:
Engineering 325,371 337,911 323,195 14,716Roads and drainage 1,146,475 1,169,681 1,142,016 27,665Building maintenance 198,993 197,143 185,421 11,722
Total public works 1,670,839 1,704,735 1,650,632 54,103
Housing and community development 230,745 233,681 218,274 15,407
Culture and recreation 636,020 642,561 630,367 12,194
Cemetery 96,739 94,839 87,866 6,973
Total expenditures 7,672,515 8,030,544 7,806,435 224,109
(449,700) (660,819) 9,527 670,346
OTHER FINANCING SOURCES (USES)Transfers in 280,850 280,850 280,850 -Transfers out (100,000) (100,000) (100,000) -Sale of capital assets 18,850 8,250 7,900 (350)
Total other financing sources (uses) 199,700 189,100 188,750 (350)
Net changes in fund balances (250,000) (471,719) 198,277 669,996
Fund balances - beginning 3,527,339 3,527,339 3,527,339 -
Fund balances - ending 3,277,339$ 3,055,620$ 3,725,616 669,996$
Explanation of differences:
197,131
3,922,747$
The accompanying notes to required supplementary information are an integral part of this schedule.
39
Encumbrances for equipment and supplies ordered but not received are reported in the year the orders are placed for budgetary purposes, but are reported in the year the equipment and supplies are
received for GAAP purposes.Amount reported as ending fund balance in the statement of revenues, expenditures and changes in fund
balance for the General fund.
Excess (deficiency) of revenues over
expenditures
Budget Amounts
City of Sebastian, Florida
General FundSchedule of Revenues, Expenditures, and Changes in Fund Balances - Budget and Actual
For the year ended September 30, 2002

Actual Variance with
Amounts on Final Budget -
a Budgetary Positive
Original Final Basis (Negative)
REVENUES:
Taxes:
Sales 1,859,575$ 1,859,575$ 1,861,589$ 2,014$
Investment earnings 69,316 29,316 31,896 2,580
Total revenues 1,928,891 1,888,891 1,893,485 4,594
OTHER FINANCING USES
Transfers out (1,568,354) (1,626,320) (1,626,320) -
Net changes in fund balances 360,537 262,571 267,165 4,594
Fund balances - beginning 323,422 323,422 323,422 -
Fund balances - ending 683,959$ 585,993$ 590,587$ 4,594$
The accompanying notes to required supplementary information are an integral part of this schedule.
40
Budget Amounts
City of Sebastian, Florida
Discretionary Sales Tax Special Revenue Fund
Schedule of Revenue, Expenditures, and Changes in Fund Balances - Budget and Actual
For the year ended September 30, 2002
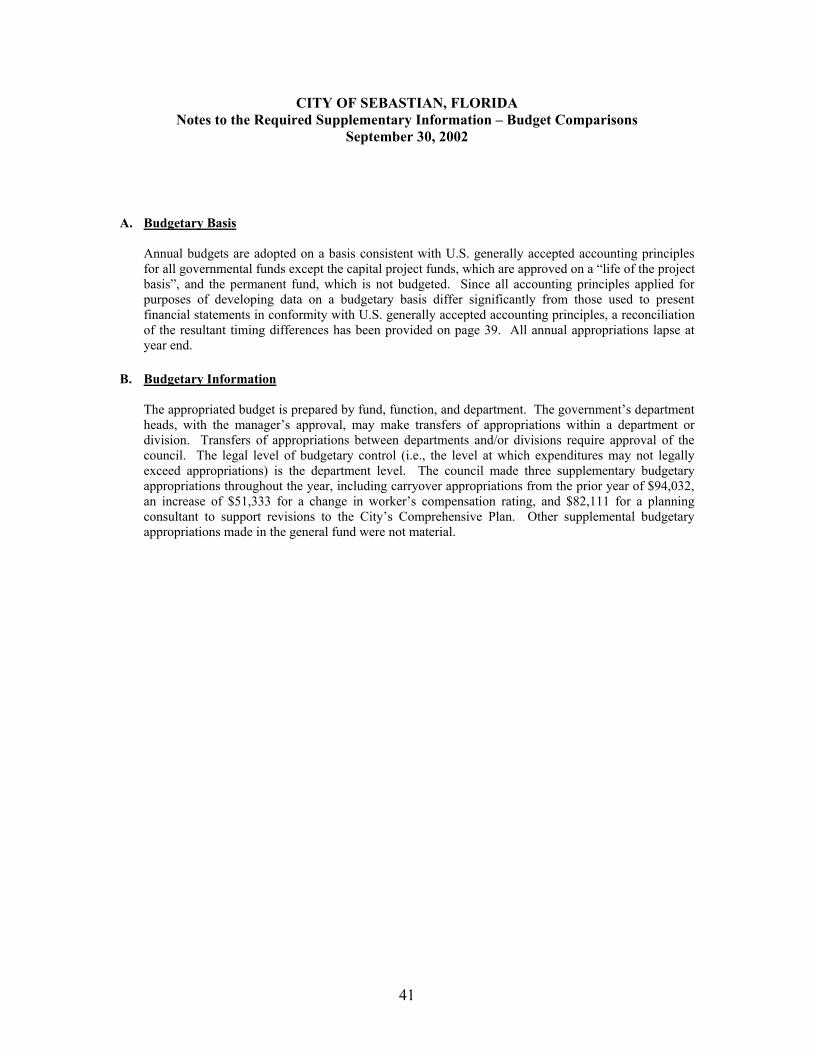
41
CITY OF SEBASTIAN, FLORIDA Notes to the Required Supplementary Information – Budget Comparisons
September 30, 2002
A. Budgetary Basis
Annual budgets are adopted on a basis consistent with U.S. generally accepted accounting principles for all governmental funds except the capital project funds, which are approved on a “life of the project basis”, and the permanent fund, which is not budgeted. Since all accounting principles applied for purposes of developing data on a budgetary basis differ significantly from those used to present financial statements in conformity with U.S. generally accepted accounting principles, a reconciliation of the resultant timing differences has been provided on page 39. All annual appropriations lapse at year end.
B. Budgetary Information
The appropriated budget is prepared by fund, function, and department. The government’s department heads, with the manager’s approval, may make transfers of appropriations within a department or division. Transfers of appropriations between departments and/or divisions require approval of the council. The legal level of budgetary control (i.e., the level at which expenditures may not legally exceed appropriations) is the department level. The council made three supplementary budgetary appropriations throughout the year, including carryover appropriations from the prior year of $94,032, an increase of $51,333 for a change in worker’s compensation rating, and $82,111 for a planning consultant to support revisions to the City’s Comprehensive Plan. Other supplemental budgetary appropriations made in the general fund were not material.

42
REQUIRED SUPPLEMENTARY INFORMATION
Police Officers’ Pension Plan
Governmental Accounting Standards Board Statements No. 25 and 27, Financial Reporting for Defined Benefit Pension Plans and Note Disclosures for Defined Contribution Plans and Accounting for Pensions by State and Local Governmental Employers require supplementary information be reported on the local pension plans in addition to that provided in the Notes to the Financial Statements. This information is presented in the following schedules:
The information presented in the required supplementary schedules was determined as part of the actuarial evaluation at the date indicated. Additional information as of the latest actuarial valuation is as follows:
Contribution rates as of 9/30/01
City 0.8%
Plan Members 5.0%
Annual pension cost 10,057$
Contributions made 29,134$
Valuation date 10/1/1998
Actuarial cost method Aggregate
Amortization method N/A
Remaining amortization period N/A
Asset valuation method Market Value
Actuarial return assumptions
Investment rate of return 8.0%
Projected salary increase* 7.5%
* Includes inflation at 3.0%
Post Retirement COLA 0.0%
Annual
Fiscal Required City State Percentage
Year Contributions Contribution Contribution Contributed
2001 78,703 29,134 68,646 124.24%
2000 68,954 27,704 112,773 203.73%
1999 129,435 103,548 46,790 116.15%
1998 102,215 96,039 39,753 132.85%
1997 121,571 90,798 36,089 104.37%
1996 108,037 97,488 32,503 120.32%
SCHEDULE OF CONTRIBUTIONS FROM THE EMPLOYER
AND OTHER CONTRIBUTING ENTITIES
LAST SIX FISCAL YEARS

43
Development of Net Pension Obligation (NPO)
This municipal Defined Benefit Plan has been subject to the minimum funding standards since the adoption of the “Florida Protection of Public Employee Retirement Benefit Act” (Part VII of Chapter 112, Florida Statutes) in 1980. Accordingly, the sponsor has funded the actuarially determined required contributions for all years from October 1, 1987, through the transition date, October 1, 1997. Thus, the NPO on October 1, 1997, is $0.
The development of the Net Pension Obligation as of September 30, 2001 is as follows:
9/30/1999 9/30/2000 9/30/2001
Actuarially Determined Contribution (A) 82,645$ -$ 10,057$
Interest on NPO (2,686) (4,818) (7,858)
Adjustment to (A) (3,055) (5,479) (8,936)
Annual Pension Cost 76,904 (10,297) (6,737)
Contributions made 103,548 27,704 29,134
Increase in NPO (26,644) (38,001) (35,871)
NPO beginning of year (33,577) (60,221) (98,222)
NPO end of year (60,221)$ (98,222)$ (134,093)$

THIS PAGE INTENTIONALLY LEFT BLANK
44

45
Nonmajor Governmental Funds
Special Revenue Funds
Special revenue funds are used to account for specific revenues that are legally restricted to expenditures for particular purposes.
Local Option Gas Tax Fund – This fund is used to account for the government’s share of motor fuel tax revenues that are legally restricted to transportation related expenditures within the government’s boundaries.
Riverfront Redevelopment Fund – This fund is used to account for tax increment revenues that are legally restricted for the redevelopment of the City’s riverfront area.
Recreation Impact Fee Fund – This fund is used to account for recreation impact fees that are restricted for use in the expansion or construction of recreational facilities.
Stormwater Utility Fee Fund – This fund is used to account for fees collected on a per unit basis that are restricted for the purposes of managing the City’s Stormwater system.
Law Enforcement Forfeiture Fund – This fund is used to account for the receipt of forfeited cash and equipment associated with police activities and is restricted to police related equipment purchases and community education initiatives.
G.R.E.A.T. Program Fund – This fund is used to account for a federal law enforcement grant to be used for gang resistance, education and training for school children from grade school through middle school.
Debt Service Fund
Debt Service Fund – This fund is used to account for the receipt of special assessments and the associated repayment of debt.
Capital Projects Funds
Capital projects funds are used to account for the acquisition and construction of major capital facilities other than those financed by proprietary funds.
General Capital Projects Fund – This fund is used to account for the construction of non-stormwater related improvements and general capital construction projects. Governmental resources and State grant revenues are used to finance the improvements in this fund.
Transportation Improvements Fund – This fund is used to account for transportation related construction such as, roads, intersections, and sidewalks and are funded with governmental resources, impact fees and State grants.
Permanent Fund
Permanent funds are used to report resources that are legally restricted to the extent that only earnings, not principal, may be used for purposes that support the reporting government’s programs.
Cemetery Permanent Fund – This fund is used to account for principal trust amounts received, sale of cemetery lots and related interest income. One-half of the cemetery lot sales and the interest portion of the trust can be used to maintain the community cemetery.

Local Law
Option Riverfront Recreation Stormwater Enforcement
Gas Tax Redevelopment Impact Fee Utility Forfeiture
ASSETS
Cash and cash equivalents:
Equity in pooled investments 197,909$ 38,205$ 258,455$ 712,511$ 20,534$
Receivables 9 - - - 1
Due from other governments 55,688 - - 8,303 -
Special assessments receivable - - - - -
Inventory - - - - -
Prepaid items - - - - -
Restricted assets:
Cash in banks - - - - -
Equity in pooled investments - - - - -
Total assets 253,606$ 38,205$ 258,455$ 720,814$ 20,535$
LIABILITIES AND FUND BALANCES
Liabilities:
Accounts payable 249$ 12,665$ -$ -$ 2,607$
Retainage payable - - - - -
Due to other funds - - - - -
Deferred revenues - - - - -
Total liabilities 249 12,665 - - 2,607
Fund balances:
Reserved for:
Encumbrances 17,775 22,690 - - -
Debt service - - - - -
Law enforcement - - - - 17,928
Cemetery care - - - - -
Unreserved 235,582 2,850 258,455 720,814 -
Total fund balances 253,357 25,540 258,455 720,814 17,928
Total liabilities and fund balances 253,606$ 38,205$ 258,455$ 720,814$ 20,535$
City of Sebastian, Florida
Combining Balance Sheet
Nonmajor Governmental Funds
September 30, 2002
Special Revenue Funds
46

Permanent
Fund Total
Debt General Other
G.R.E.A.T. Service Capital Transportation Governmental
Program Total Fund Projects Improvements Total Cemetery Funds
1,811$ 1,229,425$ -$ 304,794$ 859,214$ 1,164,008$ 46,396$ 2,439,829$
- 10 - - - - 323 333
1,380 65,371 - - - - - 65,371
- - 66,048 - - - - 66,048
- - - - - - - -
- - - - - - - -
- - - - - - 200,000 200,000
- - 131,971 - - - 199,225 331,196
3,191$ 1,294,806$ 198,019$ 304,794$ 859,214$ 1,164,008$ 445,944$ 3,102,777$
355$ 15,876$ -$ 351$ 27,519$ 27,870$ 5$ 43,751$
- - - - 20,847 20,847 - 20,847
2,294 2,294 - - - - - 2,294
- - 66,048 - - - - 66,048
2,649 18,170 66,048 351 48,366 48,717 5 132,940
- 40,465 - 910 150,225 151,135 - 191,600
- - 131,971 - - - - 131,971
542 18,470 - - - - - 18,470
- - - - - - 445,939 445,939
- 1,217,701 - 303,533 660,623 964,156 - 2,181,857
542 1,276,636 131,971 304,443 810,848 1,115,291 445,939 2,969,837
3,191$ 1,294,806$ 198,019$ 304,794$ 859,214$ 1,164,008$ 445,944$ 3,102,777$
Capital Projects Funds
47

Local LawOption Riverfront Recreation Stormwater Enforcement
Gas Tax Redevelopment Impact Fee Utility Forfeiture
REVENUES:
Taxes:
Property -$ 191,289$ -$ -$ -$
Motor fuel 665,718 - - - -
Intergovernmental - - - - -
Impact fees - - 255,775 -
Charges for services - - - 774,899 -
Fines - - - - 6,375
Special assessments - - - - -
Investment earnings 14,796 2,601 2,680 10,784 60
Contributions and donations - - - - 14,851
Other revenue - - - - -
Total revenues 680,514 193,890 258,455 785,683 21,286
EXPENDITURES:
Current:
General government 174,006 44,532 - 64,869 -
Public safety - - - - 5,044
Public works 23,396 8,427 - - -
Cemetery - - - - -
Debt Service:
Principal 179,908 - - - -
Interest 120,092 - - - -
Capital outlay 3,890 7,444 - - 11,585
Total expenditures 501,292 60,403 - 64,869 16,629
Excess (deficiency) of revenues
over (under) expenditures 179,222 133,487 258,455 720,814 4,657
OTHER FINANCING
SOURCES (USES)
Transfers in - - - - -
Transfers out (148,780) (114,484) - - -
Total other financing sources (uses) (148,780) (114,484) - - -
Net changes in fund balances 30,442 19,003 258,455 720,814 4,657
Fund balances - beginning 222,915 6,537 - - 13,271
Fund balances - ending 253,357$ 25,540$ 258,455$ 720,814$ 17,928$
City of Sebastian, Florida
Combining Statement of Revenues, Expenditures, and Changes in Fund Balances
Nonmajor Governmental Funds
For the year ended September 30, 2002
Special Revenue Funds
48

PermanentFund Total
Debt General OtherG.R.E.A.T. Service Capital Transportation Governmental
Program Total Fund Projects Improvements Total Cemetery Funds
-$ 191,289$ -$ -$ -$ -$ -$ 191,289$
- 665,718 - - - - - 665,718
10,726 10,726 - 19,705 133,340 153,045 - 163,771
- 255,775 255,775
- 774,899 - - - - 48,450 823,349
- 6,375 - - - - - 6,375
- - 31,756 - - - - 31,756
- 30,921 10,273 543 - 543 10,467 52,204
- 14,851 - - - - - 14,851
602 602 - - - - - 602
11,328 1,951,156 42,029 20,248 133,340 153,588 58,917 2,205,690
- 283,407 201 - - - - 283,608
10,786 15,830 - - - - - 15,830
- 31,823 - 12,020 57,594 69,614 - 101,437
- - - - - - 375 375
- 179,908 53,602 111,043 - 111,043 - 344,553
- 120,092 10,764 44,008 - 44,008 - 174,864
- 22,919 - 69,126 416,576 485,702 - 508,621
10,786 653,979 64,567 236,197 474,170 710,367 375 1,429,288
542 1,297,177 (22,538) (215,949) (340,830) (556,779) 58,542 776,402
- - - 221,089 789,266 1,010,355 - 1,010,355
- (263,264) - - - - (19,589) (282,853)
- (263,264) - 221,089 789,266 1,010,355 (19,589) 727,502
542 1,033,913 (22,538) 5,140 448,436 453,576 38,953 1,503,904
- 242,723 154,509 299,303 362,412 661,715 406,986 1,465,933
542$ 1,276,636$ 131,971$ 304,443$ 810,848$ 1,115,291$ 445,939$ 2,969,837$
Capital Projects Funds
49

Actual Variance with
Amounts on Final Budget -
a Budgetary Positive
Original Final Basis (Negative)
REVENUES:
Motor fuel taxes 618,548$ 618,548$ 665,718$ 47,170$
Investment earnings 17,610 10,203 14,796 4,593
Total revenues 636,158 628,751 680,514 51,763
EXPENDITURES:
Current:
Operating 187,378 233,488 215,177 18,311
Debt service:
Principal 179,907 179,907 179,908 (1)
Interest 120,093 120,093 120,092 1
Capital outlay - 3,890 3,890 -
Total expenditures 487,378 537,378 519,067 18,311
Excess of revenues over expenditures 148,780 91,373 161,447 70,074
OTHER FINANCING USES
Transfers out (148,780) (148,780) (148,780) -
Net changes in fund balances - (57,407) 12,667 70,074
Fund balances - beginning 222,915 222,915 222,915 -
Fund balances - ending 222,915$ 165,508$ 235,582$ 70,074$
50
Budget Amounts
City of Sebastian, Florida
Local Option Gas Tax Special Revenue Fund
Schedule of Revenues, Expenditures, and Changes in Fund Balances - Budget and Actual
For the year ended September 30, 2002

Actual Variance with
Amounts on Final Budget -
a Budgetary Positive
Original Final Basis (Negative)
REVENUES:
Tax increment 121,956$ 191,289$ 191,289$ -$
Investment earnings 2,068 2,588 1,857 (731)
Other revenue - 744 744 -
Total revenues 124,024 194,621 193,890 (731)
EXPENDITURES:
Current:
Operating 24,108 77,393 75,649 1,744
Capital outlay - 7,444 7,444 -
Total expenditures 24,108 84,837 83,093 1,744
Excess of revenues over expenditures 99,916 109,784 110,797 1,013
OTHER FINANCING USES
Transfers out (99,916) (114,484) (114,484) -
Net changes in fund balances - (4,700) (3,687) 1,013
Fund balances - beginning 1,837 1,837 6,537 4,700
Fund balances - ending 1,837$ (2,863)$ 2,850$ 5,713$
51
Budget Amounts
City of Sebastian, Florida
Riverfront Redevelopment Special Revenue Fund
Schedule of Revenues, Expenditures, and Changes in Fund Balances - Budget and Actual
For the year ended September 30, 2002

Actual Variance with
Amounts on Final Budget -
a Budgetary Positive
Original Final Basis (Negative)
REVENUES:
Investment earnings 7,370$ 2,660$ 2,680$ 20$
Impact fees 195,000 195,000 255,775 60,775
Total revenues 202,370 197,660 258,455 60,795
Excess of revenues over expenditures 202,370 197,660 258,455 60,795
Fund balances - beginning - - - -
Fund balances - ending 202,370$ 197,660$ 258,455$ 60,795$
Actual Variance with
Amounts on Final Budget -
a Budgetary Positive
Original Final Basis (Negative)
REVENUES:
Investment earnings -$ 10,450$ 10,784$ 334$
Charges for services - 737,450 774,899 37,449
Total revenues - 747,900 785,683 37,783
EXPENDITURES:
Current:
Operating - 38,811 64,869 (26,058)
Capital outlay - - - -
Total expenditures - 38,811 64,869 (26,058)
Excess of revenues over expenditures - 709,089 720,814 11,725
Fund balances - beginning - - - -
Fund balances - ending -$ 709,089$ 720,814$ 11,725$
Schedule of Revenues, Expenditures, and Changes in Fund Balances - Budget and Actual
For the year ended September 30, 2002
52
Budget Amounts
Budget Amounts
City of Sebastian, Florida
Stormwater Utility Special Revenue Fund
City of Sebastian, Florida
Recreation Impact Fee Special Revenue Fund
Schedule of Revenues, Expenditures, and Changes in Fund Balances - Budget and Actual
For the year ended September 30, 2002

Actual Variance with
Amounts on Final Budget -
a Budgetary Positive
Original Final Basis (Negative)
REVENUES:
Investment earnings 150$ 150$ 60$ (90)$
Other revenue 3,000 6,000 21,226 15,226
Total revenues 3,150 6,150 21,286 15,136
EXPENDITURES:
Current:
Operating 3,150 5,150 5,044 106
Capital outlay - 11,585 11,585 -
Total expenditures 3,150 16,735 16,629 106
Excess of revenues over expenditures - (10,585) 4,657 15,242
Fund balances - beginning 13,271 13,271 13,271 -
Fund balances - ending 13,271$ 2,686$ 17,928$ 15,242$
Actual Variance with
Amounts on Final Budget -
a Budgetary Positive
Original Final Basis (Negative)
REVENUES:
Intergovernmental -$ 11,640$ 10,726$ (914)$
Investment earnings - - 2 2
Other revenue - 600 600 -
Total revenues - 12,240 11,328 (912)
EXPENDITURES:
Current:
Operating - 12,240 10,786 1,454
Capital outlay - - - -
Total expenditures - 12,240 10,786 1,454
Excess of revenues over expenditures - - 542 542
Fund balances - beginning - - - -
Fund balances - ending -$ -$ 542$ 542$
53
Budget Amounts
City of Sebastian, Florida
Law Enforcement Forfeiture Special Revenue Fund
Schedule of Revenues, Expenditures, and Changes in Fund Balances - Budget and Actual
For the year ended September 30, 2002
Budget Amounts
City of Sebastian, Florida
G.R.E.A.T. Program Special Revenue Fund
Schedule of Revenues, Expenditures, and Changes in Fund Balances - Budget and Actual

Actual Variance with
Amounts on Final Budget -
a Budgetary Positive
Original Final Basis (Negative)
REVENUES:
Special assessments 26,195$ 26,195$ 31,756$ 5,561$
Interest and other revenues 16,213 4,979 10,273 5,294
Total revenues 42,408 31,174 42,029 10,855
EXPENDITURES:
Current:
Operating 318 318 201 117
Debt service:
Principal 53,602 53,602 53,602 -
Interest 10,804 10,804 10,764 40
Total expenditures 64,724 64,724 64,567 157
Excess of expenditures over revenues (22,316) (33,550) (22,538) 11,012
Fund balances - beginning 154,509 154,509 154,509 -
Fund balances - ending 132,193$ 120,959$ 131,971$ 11,012$
54
Budget Amounts
City of Sebastian, Florida
Schedule of Revenues, Expenditures, and Changes in Fund Balances - Budget and Actual
Debt Service Fund
For the year ended September 30, 2002
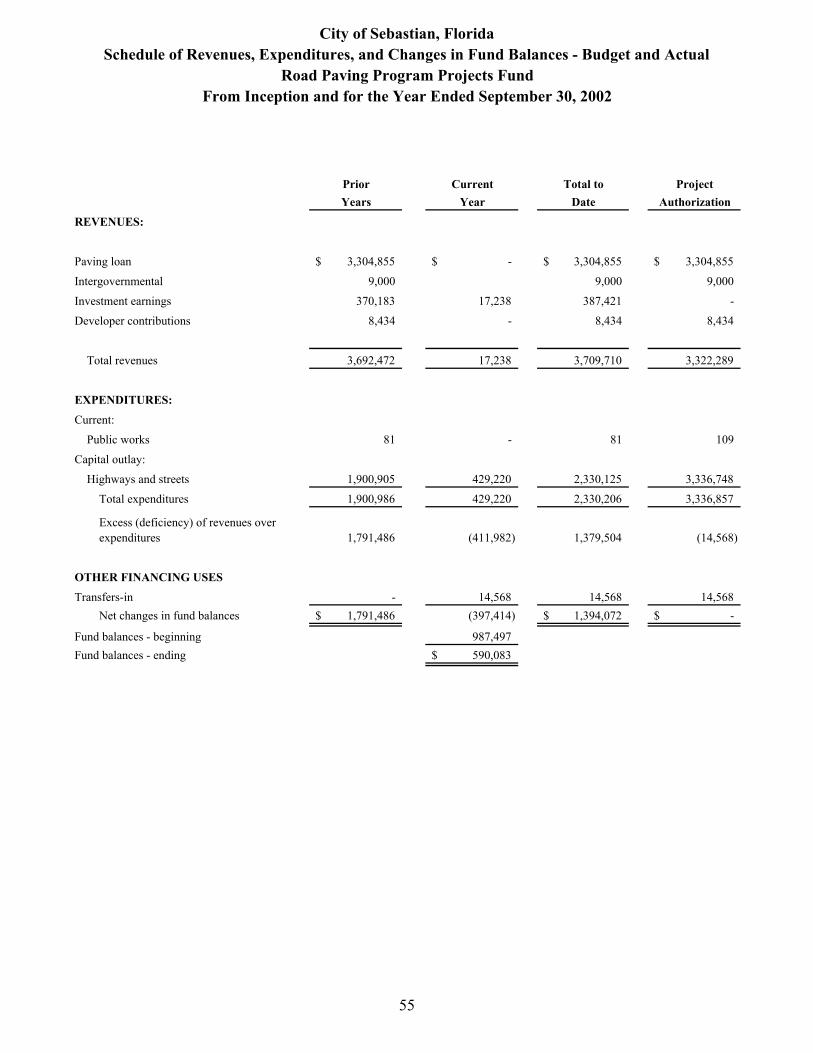
Prior Current Total to Project
Years Year Date Authorization
REVENUES:
Paving loan 3,304,855$ -$ 3,304,855$ 3,304,855$
Intergovernmental 9,000 9,000 9,000
Investment earnings 370,183 17,238 387,421 -
Developer contributions 8,434 - 8,434 8,434
Total revenues 3,692,472 17,238 3,709,710 3,322,289
EXPENDITURES:
Current:
Public works 81 - 81 109
Capital outlay:
Highways and streets 1,900,905 429,220 2,330,125 3,336,748
Total expenditures 1,900,986 429,220 2,330,206 3,336,857
1,791,486 (411,982) 1,379,504 (14,568)
OTHER FINANCING USES
Transfers-in - 14,568 14,568 14,568
Net changes in fund balances 1,791,486$ (397,414) 1,394,072$ -$
Fund balances - beginning 987,497
Fund balances - ending 590,083$
55
Excess (deficiency) of revenues over
expenditures
City of Sebastian, Florida
Road Paving Program Projects Fund
Schedule of Revenues, Expenditures, and Changes in Fund Balances - Budget and Actual
From Inception and for the Year Ended September 30, 2002
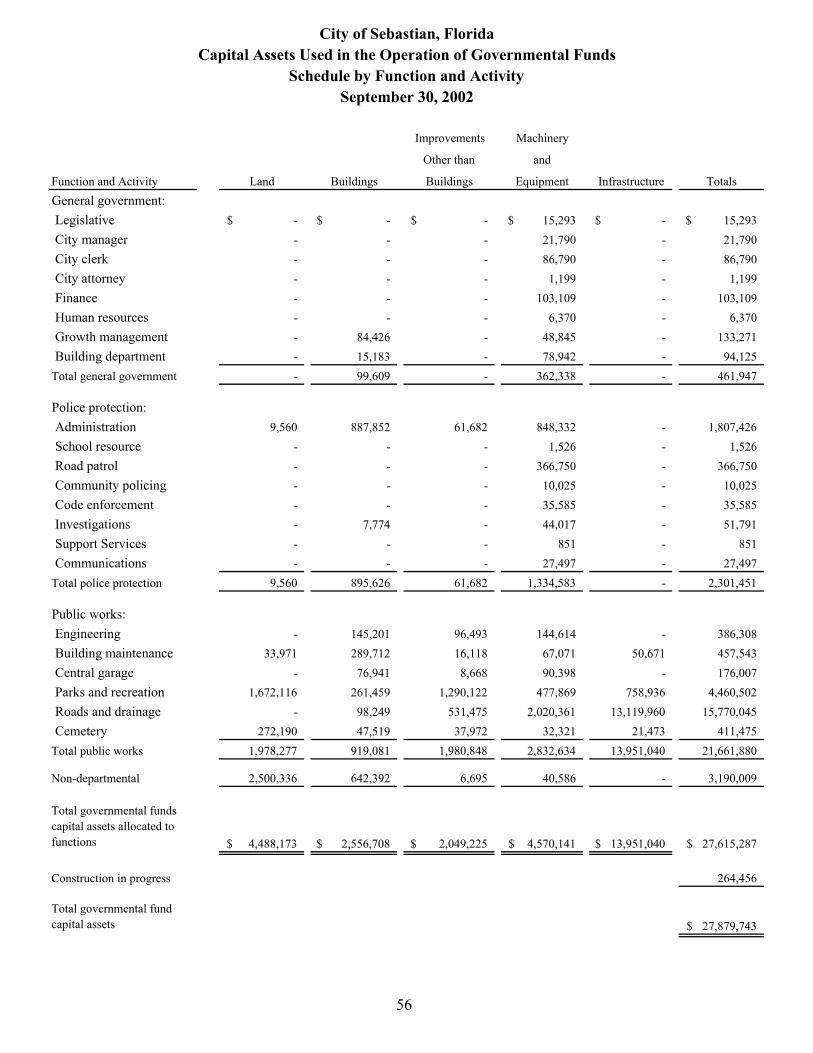
Improvements Machinery
Other than and
Function and Activity Land Buildings Buildings Equipment Infrastructure Totals
General government:
Legislative -$ -$ -$ 15,293$ -$ 15,293$
City manager - - - 21,790 - 21,790
City clerk - - - 86,790 - 86,790
City attorney - - - 1,199 - 1,199
Finance - - - 103,109 - 103,109
Human resources - - - 6,370 - 6,370
Growth management - 84,426 - 48,845 - 133,271
Building department - 15,183 - 78,942 - 94,125
Total general government - 99,609 - 362,338 - 461,947
Police protection:
Administration 9,560 887,852 61,682 848,332 - 1,807,426
School resource - - - 1,526 - 1,526
Road patrol - - - 366,750 - 366,750
Community policing - - - 10,025 - 10,025
Code enforcement - - - 35,585 - 35,585
Investigations - 7,774 - 44,017 - 51,791
Support Services - - - 851 - 851
Communications - - - 27,497 - 27,497
Total police protection 9,560 895,626 61,682 1,334,583 - 2,301,451
Public works:
Engineering - 145,201 96,493 144,614 - 386,308
Building maintenance 33,971 289,712 16,118 67,071 50,671 457,543
Central garage - 76,941 8,668 90,398 - 176,007
Parks and recreation 1,672,116 261,459 1,290,122 477,869 758,936 4,460,502
Roads and drainage - 98,249 531,475 2,020,361 13,119,960 15,770,045
Cemetery 272,190 47,519 37,972 32,321 21,473 411,475
Total public works 1,978,277 919,081 1,980,848 2,832,634 13,951,040 21,661,880
Non-departmental 2,500,336 642,392 6,695 40,586 - 3,190,009
Total governmental funds
capital assets allocated to
functions 4,488,173$ 2,556,708$ 2,049,225$ 4,570,141$ 13,951,040$ 27,615,287$
Construction in progress 264,456
Total governmental fund
capital assets 27,879,743$
56
City of Sebastian, Florida
Capital Assets Used in the Operation of Governmental Funds
September 30, 2002
Schedule by Function and Activity

57
STATISTICAL SECTION
The Statistical Schedules differ from the other financial statement presentations because they generally disclose data for more than one fiscal year. They also present non-accounting data such as social and economic data and financial trends of the City.
General Governmental Expenditures & Other Financing Uses by Function – Last Ten Fiscal Years
General Governmental Revenues & Other Financing Sources – Last Ten Fiscal Years
Property Tax Levies and Collections – Last Ten Fiscal Years
Assessed and Estimated Actual Value of Property – Last Ten Fiscal Years
Principal Taxpayers
Property Tax Rates – Direct and Overlapping Governments – Last Ten Fiscal Years
Special Assessments Billing and Collections – Last Ten Fiscal Years
Computation of Legal Debt Margin
Ratio of Net General Obligation Bonded Debt to Assessed Value and Net General Obligation Bonded Debt Per Capita
Ratio of Annual Debt Service Expenditures for General Obligation Bonded Debt To Total General Government Expenditures
Computation of Direct and Overlapping Bonded Debt – General Obligation Bonds
Revenue Bond Coverage – Golf Course Bond – Last Ten Fiscal Years
Demographic Statistics – Last Ten Fiscal Years
Property Value, Construction and Bank Deposits – Last Ten Fiscal Years
Miscellaneous Statistics

TABLE 11 of 2
Fiscal General Public Public Debt
Year Government Safety Works Service
1993 1,147,930$ 1,650,850$ 1,413,134$ 136,422$
1994 1,271,768 1,785,073 1,677,206 133,008
1995 1,856,873 1,585,901 1,454,962 133,008
1996 2,651,408 1,627,955 1,442,598 255,297
1997 1,944,089 1,706,546 1,543,487 214,175
1998 1,439,181 1,842,266 2,006,966 211,956
1999 1,816,090 2,122,823 1,908,915 386,183
2000 1,934,610(3)
2,129,662(3)
2,008,451 364,396
2001 2,087,382 2,316,796 2,087,873 364,407
2002 2,558,781 2,588,526 2,449,167 364,366
(1) This schedule lists expenditures of the General, Special Revenue, and Debt Service funds only.
(2) Represents Operating Transfers Out to Capital Projects Funds
(3) Code Enforcement Division previously reported under General Government, but isnow reported under Public Safety
(4) Housing and Community Development expenditures related to CDBG Grant.
58
CITY OF SEBASTIAN, FLORIDA
LAST TEN FISCAL YEARS
GENERAL GOVERNMENTAL EXPENDITURES
& OTHER FINANCING USES BY FUNCTION
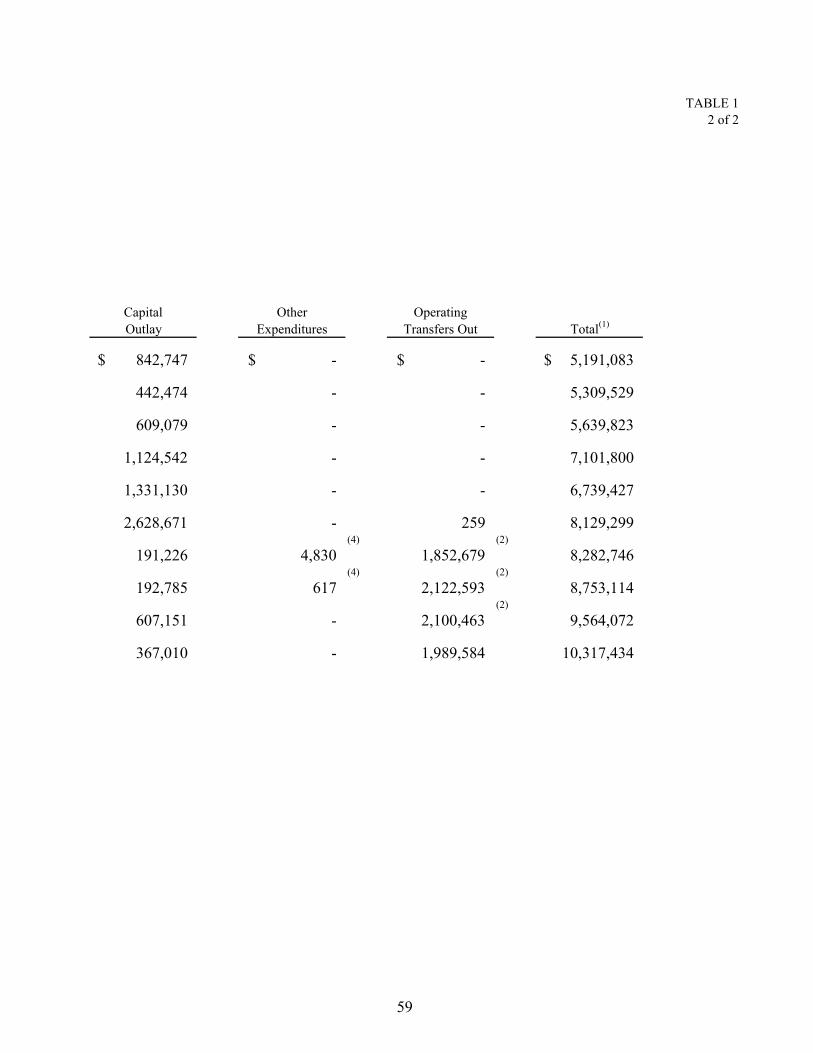
TABLE 12 of 2
Capital Other Operating
Outlay Expenditures Transfers Out Total(1)
842,747$ -$ -$ 5,191,083$
442,474 - - 5,309,529
609,079 - - 5,639,823
1,124,542 - - 7,101,800
1,331,130 - - 6,739,427
2,628,671 - 259 8,129,299
191,226 4,830 (4)
1,852,679(2)
8,282,746
192,785 617 (4)
2,122,593(2)
8,753,114
607,151 - 2,100,463(2)
9,564,072
367,010 - 1,989,584 10,317,434
59

TABLE 21 of 2
LicensesFiscal and Inter- Charges for
Year Taxes Permits Governmental Services
1993 3,901,663$ 287,660$ 782,896$ 92,611$
1994 4,230,835 347,786 934,210 166,095
1995 4,486,685 278,618 961,887 82,653
1996 4,931,996 321,149 1,166,881 74,657
1997 5,250,861 345,463 1,332,676 84,051
1998 5,612,313 388,936 1,366,428 51,196
1999 3,800,242(3) 448,928 3,600,474 (3) 33,097
2000 4,018,521 475,345 3,725,671 159,701
2001 4,513,698 487,618 4,031,263 282,521
2002 4,467,701 578,695 4,782,829 1,075,220
(1) This schedule lists revenues of the General, Special Revenue, and Debt Service funds only.
(2) No Special Assessments for these years.
(3) Local Option Gas Tax and Discretionary Sales Tax previously classified as taxes. The City doesnot collect these taxes, but receives them from the State. Therefore, they are not included in Taxes.
(4) Capital Projects and additional Special Revenue Funds established in Fiscal Year 1999resulting in Operating Transfers In.
60
CITY OF SEBASTIAN, FLORIDA
GENERAL GOVERNMENTAL REVENUES & OTHER FINANCING SOURCES
LAST TEN FISCAL YEARS

TABLE 22 of 2
Interest and Special Operating
Fines Other Revenues Assessments Transfers In Total(1)
59,640$ 347,715$ $ (2) -$ 5,472,185$
57,257 205,169(2) - 5,941,352
67,774 441,312 174,060 - 6,492,989
82,477 417,495 135,336 - 7,129,991
59,198 461,249 68,474 - 7,601,972
71,194 510,007 30,522 - 8,030,596
89,697 314,910 44,964 278,855(4) 8,611,167
140,672 485,479 128,154 11,317 9,144,860
148,676 490,143 28,528 337,620 10,320,067
127,027 557,304 31,756 280,850 11,901,382
61

TABLE 31 of 2
Percent of
Current Tax
Fiscal Total Tax Current Tax Collections
Year Levy Collections to Tax Levy(1)
1993 2,143,544$ 1,934,066$ 90.2%
1994 2,452,523 2,245,731 91.6%
1995 2,510,166 2,294,209 91.4%
1996 2,667,313 2,463,039 92.3%
1997 2,727,083 2,513,627 92.2%
1998 2,909,597 2,679,819 92.1%
1999 2,869,796 2,726,857 95.0%
2000 2,422,756 2,283,898 94.3%
2001 2,542,544 2,455,930 96.6%
2002 2,635,277 2,489,854 94.5%
Source: Indian River County Property Appraiser and Tax Collector
(1) Does not include penalties and interest on delinquent taxes.
62
CITY OF SEBASTIAN, FLORIDA
PROPERTY TAX LEVIES AND COLLECTIONS
LAST TEN FISCAL YEARS

TABLE 32 of 2
Percent of
Delinquent Total Tax
Tax Total Tax Collections
Collections(1) Collections(1)to Tax Levy
188,575$ 2,122,641$ 99.0%
177,793 2,423,524 98.8%
167,181 2,461,390 98.1%
156,752 2,619,791 98.2%
150,526 2,664,153 97.7%
130,803 2,810,622 96.6%
2,912 2,729,769 95.1%
35,050 2,318,948 95.7%
51,690 2,507,620 98.6%
36,421 2,526,275 95.9%
63

TABLE 4
1 of 2
Fiscal Assessed Estimated Assessed Estimated
Year Value Actual Value Value Actual Value
1993 452,669,880$ 565,837,350$ 26,386,374$ 26,386,374$
1994 484,794,820 605,993,525 25,954,533 25,954,533
1995 514,374,980 642,968,725 26,554,691 26,554,691
1996 531,461,580 664,326,975 24,774,960 24,774,960
1997 563,855,210 704,819,013 30,303,882 30,303,882
1998 587,811,960 734,764,950 31,210,876 31,210,876
1999 626,274,970 782,843,713 46,027,721 46,027,721
2000 656,619,860 820,774,825 42,216,162 41,533,985
2001 754,577,150 943,221,438 45,195,579 45,195,579
2002 829,224,615 1,036,530,769 45,355,170 45,355,170
Source: Indian River County Property Appraiser
(1) Total assessed value based on approximately 80 percent of estimated actual value
64
Real Property
CITY OF SEBASTIAN, FLORIDAASSESSED AND ESTIMATED ACTUAL VALUE OF PROPERTY(1)
LAST TEN FISCAL YEARS
Personal Property

TABLE 4
2 of 2
Ratio of Total
Exemptions Total Total Assessed Value
Real Assessed Estimated To Total Estimated
Property Value Actual Value Actual Value
123,618,185$ 479,056,254$ 592,223,724$ 80.9%
146,957,174 510,749,353 631,948,058 80.8%
154,362,555 540,929,671 669,523,416 80.8%
161,007,095 556,236,540 689,101,935 80.7%
172,478,432 594,159,092 735,122,895 80.8%
177,515,747 619,022,836 765,975,826 80.8%
187,751,454 672,302,691 828,871,434 81.1%
190,327,263 698,836,022 862,308,810 81.0%
198,445,669 799,772,729 988,417,017 80.9%
205,977,066 874,579,785 1,081,885,939 80.8%
65
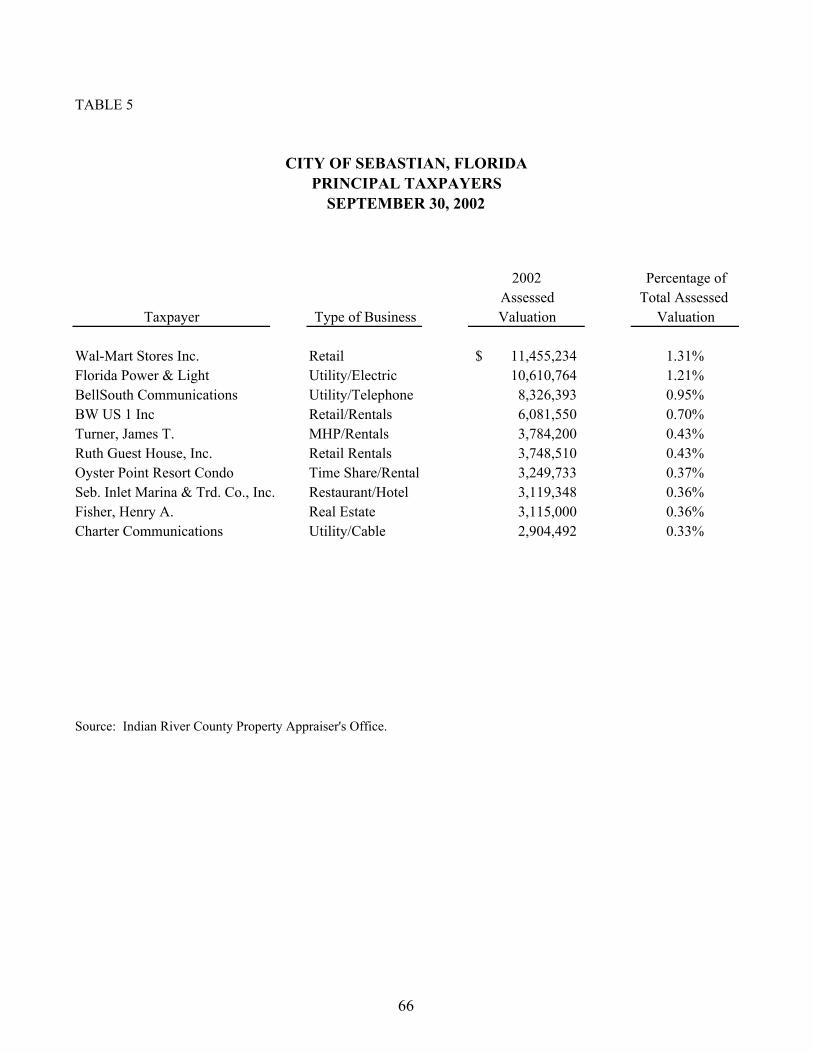
TABLE 5
2002 Percentage of
Assessed Total Assessed
Taxpayer Type of Business Valuation Valuation
Wal-Mart Stores Inc. Retail 11,455,234$ 1.31%
Florida Power & Light Utility/Electric 10,610,764 1.21%
BellSouth Communications Utility/Telephone 8,326,393 0.95%
BW US 1 Inc Retail/Rentals 6,081,550 0.70%
Turner, James T. MHP/Rentals 3,784,200 0.43%
Ruth Guest House, Inc. Retail Rentals 3,748,510 0.43%
Oyster Point Resort Condo Time Share/Rental 3,249,733 0.37%
Seb. Inlet Marina & Trd. Co., Inc. Restaurant/Hotel 3,119,348 0.36%
Fisher, Henry A. Real Estate 3,115,000 0.36%
Charter Communications Utility/Cable 2,904,492 0.33%
Source: Indian River County Property Appraiser's Office.
CITY OF SEBASTIAN, FLORIDA
PRINCIPAL TAXPAYERS
SEPTEMBER 30, 2002
66

TABLE 6
Debt Total Total Debt Total
Fiscal Operating Service City County(1)
Operating Service School
Year Millage Millage Millage Millage Millage Millage Millage Other(2)
1993 6.4410 -- 6.4410 5.65490 (3) (3) 9.56260 2.72080
1994 6.9000 -- 6.9000 5.77090 8.59060 1.25400 9.84460 2.58730
1995 6.9000 -- 6.9000 5.95235 8.98330 1.21500 10.19830 2.26023
1996 6.9000 -- 6.9000 5.92350 9.13800 1.21000 10.34800 2.74083
1997 6.9000 -- 6.9000 5.92330 9.15400 1.16500 10.31900 2.64544
1998 6.9000 -- 6.9000 5.80800 9.00300 1.13700 10.14000 2.49690
1999 6.5000 -- 6.5000 6.99230 8.61400 1.00000 9.61400(3)
2000 5.0000 -- 5.0000 6.78040 8.61400 1.00000 9.61400 1.52091
2001 5.0000 -- 5.0000 6.80920 8.67700 0.88000 9.55700 1.62899
2002 4.5904 -- 4.5904 6.61080 8.40200 0.68000 9.08200 1.61045
(1) Millage includes General Fund, M.S.T.U.s, Emergency Services District and Land Bonds.
(2) All Special Taxing Districts.
(3) Information not available.
Source: Indian River County Property Appraiser's Office
67
Indian River County School BoardCity of Sebastian
CITY OF SEBASTIAN, FLORIDA
PROPERTY TAX RATES
DIRECT AND OVERLAPPING GOVERNMENTS
LAST TEN FISCAL YEARS
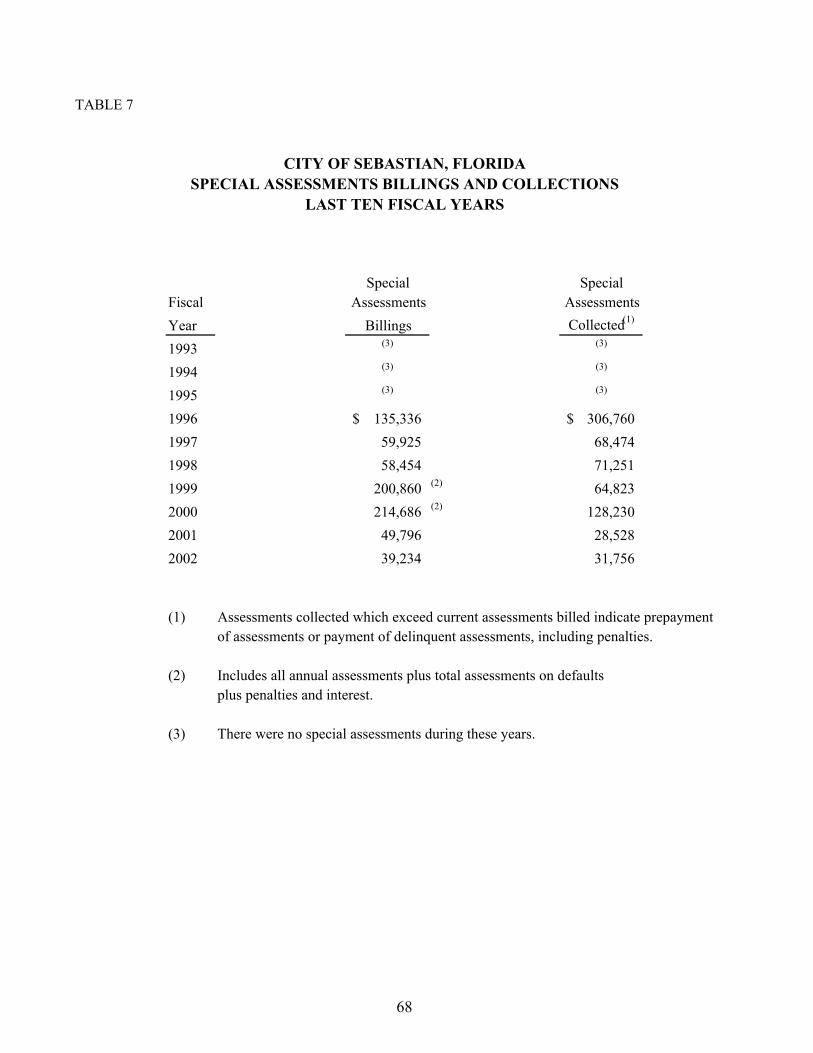
TABLE 7
Special Special
Fiscal Assessments Assessments
Year Billings Collected(1)
1993(3) (3)
1994 (3) (3)
1995(3) (3)
1996 135,336$ 306,760$
1997 59,925 68,474
1998 58,454 71,251
1999 200,860(2) 64,823
2000 214,686(2)
128,230
2001 49,796 28,528
2002 39,234 31,756
(1) Assessments collected which exceed current assessments billed indicate prepayment
of assessments or payment of delinquent assessments, including penalties.
(2) Includes all annual assessments plus total assessments on defaults
plus penalties and interest.
(3) There were no special assessments during these years.
CITY OF SEBASTIAN, FLORIDA
SPECIAL ASSESSMENTS BILLINGS AND COLLECTIONS
LAST TEN FISCAL YEARS
68

TABLE 8
Assessed valuations:
Assessed value 623,247,549$
Add back: exempt real property 205,977,066
Total assessed value 829,224,615$
Legal debt margin:
Debt limitation - 10 percent of total assessed value 82,922,462$
Debt applicable to limitation:
Total bonded debt 3,517,195$
Less: Special assessment bonds (134,299)
Revenue bonds --
Amount available for repayment of general
obligation bonds --
Total applicable to limitation 3,382,896
Legal debt margin 79,539,566$
CITY OF SEBASTIAN, FLORIDA
COMPUTATION OF LEGAL DEBT MARGIN
SEPTEMBER 30, 2002
69

TABLE 9
TABLE 10
70
CITY OF SEBASTIAN, FLORIDA
RATIO OF NET GENERAL OBLIGATION BONDED DEBT
TO ASSESSED VALUE AND NET GENERAL OBLIGATION
SEPTEMBER 30, 2002
TO TOTAL GENERAL GOVERNMENT EXPENDITURES
SEPTEMBER 30, 2002
The City of Sebastian has no general bonded debt.
BONDED DEBT PER CAPITA
The City of Sebastian has no general bonded debt.
CITY OF SEBASTIAN, FLORIDA
RATIO OF ANNUAL DEBT SERVICE EXPENDITURES
FOR GENERAL OBLIGATION BONDED DEBT

TABLE 11
71
The City of Sebastian has no overlapping bonded debt or general bonded debt.
CITY OF SEBASTIAN, FLORIDA
COMPUTATION OF DIRECT AND OVERLAPPING BONDED DEBT
GENERAL OBLIGATION BONDS
SEPTEMBER 30, 2002

TABLE 12
Net Revenue
Fiscal Gross Operating Available for
Year Revenues(1) Expenses (2)Debt Service Principal Interest Total Coverage
1993 1,133,014$ 981,310$ 151,704$ 80,000$ 126,655$ 206,655$ (3) 0.73 (4)
1994 1,178,875 891,881 286,994 80,000 123,855 203,855 (3) 1.41 (4)
1995 1,139,795 788,449 351,346 85,000 120,655 205,655 (3) 1.71 (4)
1996 1,213,952 854,479 359,473 90,000 116,830 206,830 (3) 1.74 (4)
1997 1,356,609 884,286 472,323 95,000 112,600 207,600 (3) 2.28 (4)
1998 1,351,368 926,174 425,194 100,000 107,850 207,850 (3) 2.05 (4)
1999 1,414,976 982,772 432,204 105,000 102,650 207,650 (3) 2.08 (4)
2000 1,471,743 1,004,760 466,983 110,000 96,980 206,980 (3) 2.26 (4)
2001 1,165,091 (5) 1,115,270 (5) 49,821 -- -- -- (6) -- (7)
2002 1,386,424 1,253,443 132,981 100,000 104,481 204,481 (6) 0.65 (7)
(1) Total revenues (including interest) and other non-operating revenues.
(2) Total operating expenses plus interest and exclusive of depreciation and amortization.
(3) Golf Course Bond, Series 1985 refunded in 1992 with Series 1992.
(4) Required coverage is 1.0.
(5) Golf Course closed for four months for renovations.
(6)
(7) Required coverage is 1.25.
Debt Service Requirements
Golf Course Bond, Series 1992 refunded with Recreational Facilities Improvement and Refunding Revenue Bonds, Series 2001
Debt Service payment due October 1.
72
CITY OF SEBASTIAN, FLORIDA
REVENUE BOND COVERAGE
GOLF COURSE BOND
LAST TEN FISCAL YEARS.

TABLE 13
Fiscal School Unemployment
Year Population (1)
Enrollment(2)
Rate(3)
1993 12,154 1,382 10.7%
1994 12,800 1,397 11.0%
1995 13,488 1,413 9.4%
1996 13,967 1,313 9.5%
1997 14,470 1,324 8.4%
1998 15,115 1,410 8.1%
1999 15,707 1,383 8.6%
2000 16,181(4)
1,342 9.5%
2001 16,667 1,371 6.8%
2002 17,167 4,309 9.8%
Data Sources(1) Bureau of Economics & Business Research University of Florida
(2) School District
(3) State Department of Labor - for Indian River County
(4) 2000 Census figure.
CITY OF SEBASTIAN, FLORIDA
DEMOGRAPHIC STATISTICS
LAST TEN FISCAL YEARS
73

TABLE 14
1 of 2
Fiscal
Year Commercial Residential Exemptions Total
1993 943,738$ 19,612,746$ 627,412$ 21,183,896$
1994 6,303,712 25,587,753 1,306,648 33,198,113
1995 141,544 19,538,885 996,617 20,677,046
1996 1,104,514 20,155,914 940,629 22,201,057
1997 3,626,024 24,918,675 2,027,739 30,572,438
1998 3,142,469 25,549,287 1,044,055 29,735,811
1999 4,177,601 27,941,640 1,150,494 33,269,735
2000 6,873,360 27,420,413 2,278,255 36,572,028
2001 2,449,336 31,267,926 3,379,271 37,096,533
2002 2,615,694 37,266,992 1,401,672 41,284,358
(1) Estimated assessed value from Table 4 (estimated at 80% of estimated actual value)
(2) Source: City Building Department
(3) Source: Federal Deposit Insurance Corporation and Federal Savings and Loan Insurance Corporation
(4) Information not available
* Valuation fees paid.
74
CITY OF SEBASTIAN, FLORIDA
PROPERTY VALUE, CONSTRUCTION AND BANK DEPOSITS
LAST TEN FISCAL YEARS
Property Value (1)

TABLE 14
2 of 2
Number of Number of Bank
Units Value* Units Value* Deposits(3)*
4 27,517$ 267 179,122$ 252,032$
0 46,305 351 233,502 308,643
10 23,192 238 179,816 318,583
9 30,621 240 183,177 331,765
11 42,111 335 216,196 293,368
0 42,628 276 223,511 312,097
11 46,236 282 248,702 (4)
9 53,368 283 253,218 157,103
16 48,558 328 269,862 394,824
8 42,583 451 420,649 394,894
75
Commercial
Construction(2)
Residential
Construction(2)

TABLE 15
Date of Incorporation 1924
Form of Government Council/Manager
Number of employees (excluding police and fire): 107
Classified 85
Exempt 22
Area in Square Miles 13.5
Name of Government facilities and services:
Miles of streets 140 Miles
Number of street lights 3,531
Culture and Recreation:
Community centers 2
Parks 10
Park acreage 207.85
Golf courses 1
Swimming pools 0
Tennis courts 6
Police Protection:
Number of stations 1
Number of police personnel and officers 54
Number of patrol units 23
Number of law violations:
Physical arrests 515
Traffic violations 2,528
Parking violations 207
Facilities and services not included in the reporting entity
Fire Protection:
Number of stations 2
Number of fire personnel and officers 12
Number of calls answered 941
Number of inspections conducted 96
Sewage System:
Number of service connections 1,312
Water System:
Number of service connections 4,220
Number of fire hydrants 682
Education:
Number of elementary schools 2
Number of elementary school instructors 112
Number of secondary schools 2
Number of secondary school instructors 212
Source: City of Sebastian Police and Growth Management Departments.
CITY OF SEBASTIAN, FLORIDA
MISCELLANEOUS STATISTICS
SEPTEMBER 30, 2002
76

77
SINGLE AUDIT SECTION
The Single Audit Section contains various independent auditor’s reports and schedules as required by the Florida Single Audit Act, Chapter 215.97, Florida Statutes for state and local governments that receive state assistance.
Report on Compliance and on Internal Control Over Financial Reporting Based on an Audit of Financial Statements Performed in Accordance with Governmental Auditing Standards
Independent Auditor’s Report on Compliance and Internal Control over Compliance Applicable to Each Major State Project
Schedule of Findings and Questioned Costs – State Projects
Schedule of Expenditures of State Financial Assistance

THIS PAGE INTENTIONALLY LEFT BLANK
78


State
CSFA State Contract/ State
Number Grant Number Expenditures
DEPARTMENT OF ENVIRONMENTAL PROTECTION
Florida Recreation Development Assistance Program
Expansion of Riverview Park 37.017 * F02370 199,008$
Barber Street Sports Complex 37.017 * F01049 11,967
Riverview Park Expansion 37.017 * F03394 598
Total Department of Environmental Protection 211,573
FLORIDA FISH & WILDLIFE CONSERVATION COMMISSION
Division of Law Enforcement
Derelict Vessel Removal 77.005 FWC 00061 11,250
FLORIDA DEPARTMENT OF STATE
Division of Historical Resources
Architecture for City Hall 45.031 S1083 8,455
DEPARTMENT OF TRANSPORTATION
Joint Participation Agreement with Florida
Department of Transportation Aviation
Administration:
Five Year Airport Master Plan 55.004 * 407176-1-94-01 33,025
T Hangars and Lighting 55.004 * 407345-1-94-01 44,628
Install Runway Lighting & Airfield Security 55.004 * 408783-1-94-01 4,331
Golf Course Renovation, Water Line Installation/ 55.004 * 236320-1-94-01 33,927
Road Extension/Access Gates
Airfield Lighting Vault & Equipment 55.004 * 411094-1-94-01 4,855
Rehab of Runway 9/27 55.004 * 412976-1-94-01 106,876
Install Security Fencing 55.004 * 412975-1-94-01 256
Clear Runway 9/27 Safety Areas 55.004 * 407552-1-94-01 1,698
Total Department of Transportation 229,596
Total expenditures of State Financial Assistance 460,874$
Notes:
* Denotes major project
This schedule is prepared on the accrual basis of accounting.
CITY OF SEBASTIAN, FLORIDA
SCHEDULE OF EXPENDITURES OF STATE FINANCIAL ASSISTANCE
FOR THE YEAR ENDED SEPTEMBER 30, 2002
86
Project Title
and
State Agency