city of sedona effluent injection well permitting project
TRANSCRIPT

3 0 3 3 N O R T H 4 4 T H S T R E E T • S U I T E 1 0 1 • P H O E N I X , A R I Z O N A 8 5 0 1 8 • ( 6 0 2 ) 2 6 3 - 9 5 0 0 • F A X ( 6 0 2 ) 2 6 5 - 1 4 2 2 pw://Carollo/Documents/Client/AZ/Sedona/8256A00/Deliverables/TM2 (Draft 3/2010)
City of Sedona
Effluent Injection Well Permitting Project
TECHNICAL MEMORANDUM NO. 2 WASTEWATER RECLAMATION
PLANT EVALUATION
DRAFT March 2010


March 2, 2010 - DRAFT i pw://Carollo/Documents/Client/AZ/Sedona/8256A00/Deliverables/TM2 (Draft 3/2010)
City of Sedona
Effluent Injection Well Permitting Project
TECHNICAL MEMORANDUM NO. 2
WASTEWATER RECLAMATION PLANT EVALUATION
TABLE OF CONTENTS
1.0 INTRODUCTION ..................................................................................................
Page No.
2-1
2.0 EFFLUENT WATER QUALITY OVERVIEW ......................................................... 2-1 2.1 Pathogens ................................................................................................. 2-2 2.2 Inorganic and Organic Chemicals .............................................................. 2-2 2.3 Emerging Contaminants ............................................................................ 2-3
3.0 REGULATORY REQUIREMENTS ........................................................................ 2-5 3.1 National Pollutant Discharge Elimination System (NPDES) Program ........ 2-5 3.2 Federal Guidelines for Reclaimed Water Reuse ........................................ 2-6 3.3 ADEQ BADCT Requirement ...................................................................... 2-6 3.4 ADEQ Reuse Applications ......................................................................... 2-7 3.5 Aquifer Protection Permits ....................................................................... 2-10 3.6 Emerging Contaminants and Reuse ........................................................ 2-10 3.7 Regulatory Summary ............................................................................... 2-11
4.0 EFFLUENT WATER QUALITY DATA REVIEW .................................................. 2-12 4.1 Effluent Nitrogen ...................................................................................... 2-12 4.2 Effluent Turbidity and Suspended Solids ................................................. 2-12 4.3 Effluent Fecal Coliform Counts ................................................................ 2-15
5.0 EXISTING FACILITIES DESCRIPTION .............................................................. 2-15 5.1 Headworks .............................................................................................. 2-15 5.2 Secondary Treatment .............................................................................. 2-19 5.3 Tertiary Treatment ................................................................................... 2-19 5.4 Solids Treatment ..................................................................................... 2-19
6.0 TREATMENT PROCESS EVALUATION ............................................................ 2-20 6.1 Secondary Treatment Process Evaluation ............................................... 2-20 6.2 Tertiary Treatment Process Evaluation .................................................... 2-30 6.3 Preliminary Plant Upgrades Cost Estimates ............................................ 2-35
7.0 PROCESS EVALUATION SUMMARY ................................................................ 2-36

March 2, 2010 - DRAFT ii pw://Carollo/Documents/Client/AZ/Sedona/8256A00/Deliverables/TM2 (Draft 3/2010)
LIST OF TABLES
Table 2.1 Inorganic and Organic Chemical Constituents of Concern ........................... 2-2 Table 2.2 ADEQ BADCT Effluent Requirements ......................................................... 2-6 Table 2.3 ADEQ Reclaimed Water Quality Standards ................................................. 2-8 Table 2.4 Design Hydraulic Peaking Factors ............................................................. 2-21 Table 2.5 Average Influent Wastewater Characteristics ............................................. 2-23 Table 2.6 Influent Loading Peaking Factors ............................................................... 2-23 Table 2.7 Design Wastewater Concentrations ........................................................... 2-24 Table 2.8 Process Model Calibration Results ............................................................ 2-26 Table 2.9 Process Model Simulation Results ............................................................. 2-29 Table 2.10 Tertiary Filters Hydraulic Loading Criteria .................................................. 2-31 Table 2.11 UV Disinfection System Capacity Analysis ................................................. 2-34 Table 2.12 Preliminary Cost Estimates ........................................................................ 2-36
LIST OF FIGURES
Figure 2.1 Historical Effluent Nitrogen Concentrations ................................................ 2-13 Figure 2.2 Historical Effluent Turbidity ........................................................................ 2-14 Figure 2.3 Historical Effluent Total Suspended Solids Concentrations ........................ 2-16 Figure 2.4 Historical Effluent Fecal Coliform Counts ................................................... 2-17 Figure 2.5 Process Flow Schematic ............................................................................ 2-18 Figure 2.6 Influent Flow and Peaking Factors Analysis ............................................... 2-22
LIST OF APPENDICES
APPENDIX 2A - WWRP PROCESS DATA GRAPHS APPENDIX 2B - COLLIMATED BEAM TESTING RESULTS APPENDIX 2C - UV SYSTEM UPGRADE PROPOSAL
March 2, 2010 - DRAFT 2-1 pw://Carollo/Documents/Client/AZ/Sedona/8256A00/Deliverables/TM2
Technical Memorandum No. 2 WASTEWATER RECLAMATION PLANT EVALUATION
1.0 INTRODUCTION The City of Sedona (City) is conducting a study to evaluate potential options to update its current effluent management practices at the Sedona Wastewater Reclamation Plant (WWRP). The 2.0 million gallons per day (mgd) design capacity WWRP is currently operating at a flow of approximately 1.2 mgd. Effluent generated by the facility is disposed of through spray irrigation on adjacent City property. A variety of factors, including growth, potential land values/alternative utility, effluent disposal limitations, and other social, political, economic, and environmental factors have prompted the City to develop a comprehensive effluent management strategy.
A previous study completed for the City recommended further evaluation of effluent injection as a potential effluent management option. In an effort to identify the best overall strategy to meet the City’s goals, the Wastewater Effluent Disposal and Land Use (WEDLU) Task Force also investigated other effluent management and disposal alternatives, which include but are not limited to constructed wetlands, mechanical evaporators, and direct discharge to surface waters, including the Verde River. Ultimately, the selected effluent management strategy should incorporate the alternative, or combination of alternatives, which provide a robust and flexible solution to meet the City’s technical, economic, social and sustainable objectives.
Depending on the effluent disposal method(s) selected, an increase in effluent quality from Class B+ to A+ may be required or desired by the City. Upgrading the effluent quality will likely require improvements to some of the existing unit processes at the facility. In order to determine what improvements may be required, an evaluation of the facility’s current processes, as well as an analysis of current effluent water quality data, was performed as part of this project. This Technical Memorandum No. 2 provides an overview of applicable effluent water quality regulations, an evaluation of the Sedona WWRP’s existing processes, and an analysis of the facility’s current performance. The purpose of this WWRP evaluation is to provide the City with recommendations of potential improvements to the facility to achieve the effluent quality required.
2.0 EFFLUENT WATER QUALITY OVERVIEW The main constituents of present and potentially future concern in reclaimed water for reuse applications include:
• Pathogens
• Inorganic and Organic Chemicals
• Emerging Contaminants

March 2, 2010 - DRAFT 2-2 pw://Carollo/Documents/Client/AZ/Sedona/8256A00/Deliverables/TM2 (Draft 3/2010)
A brief overview of each constituent and their significance on the Sedona WWRP are included in the following sections.
2.1 Pathogens
Pathogens are of concern in reclaimed water because they are disease-causing organisms such as bacteria, viruses, and parasites. Fecal coliforms and Escherichia Coli are commonly used as indicators for the presence of pathogens in reclaimed water applications. Enteric viruses (Norovirus, Astrovirus, etc.) and protozoan parasites (e.g., Cryptosporidium parvum, Giardia lamblia) also pose significant risks to human health.
2.2 Inorganic and Organic Chemicals
Table 2.1 presents some of the inorganic and organic chemicals commonly present in reclaimed water and the basis for concern over these constituents. Table 2.1 Inorganic and Organic Chemical Constituents of Concern
Wastewater Reclamation Plant Evaluation City of Sedona, Arizona
Constituent Measured Parameters Reasons for Concern
Suspended Solids Suspended solids (SS),
including volatile and fixed solids
• Suspended solids can shield microorganisms from disinfectants.
• Excessive amounts of suspended solids cause plugging in irrigation systems or other disposal media.
Biodegradable Organics
Biochemical oxygen demand, chemical oxygen
demand, total organic carbon
• Aesthetic and nuisance problems. • Organics provide food for
microorganisms. • Some organics including humics,
lignin, and various aromatics strongly absorb UV radiation and can adversely affect disinfection processes.
• Make water unsuitable for some industrial or other uses.
Nutrients Nitrogen, Phosphorus
• Concerns over eutrophication in the receiving waters due to presence of excess nitrogen and phosphorus.
• Ammonia consumes dissolved oxygen and is toxic to fish.
• Elevated concentrations of nitrates are associated with human health concerns.
Stable Organics Specific compounds • Some organics resist

March 2, 2010 - DRAFT 2-3 pw://Carollo/Documents/Client/AZ/Sedona/8256A00/Deliverables/TM2
Table 2.1 Inorganic and Organic Chemical Constituents of Concern Wastewater Reclamation Plant Evaluation City of Sedona, Arizona
Constituent Measured Parameters Reasons for Concern (e.g., pesticides, chlorinated
hydrocarbons) conventional methods of wastewater treatment.
• Some organics are toxic in the environment, and their presence may limit the suitability of reclaimed water for irrigation or other uses.
• Health concerns over certain organics.
Hydrogen Ion Concentration pH
• The pH of wastewater affects disinfection and coagulation processes and metal solubility.
• High alkalinity in treated wastewater causes precipitation and buildup of calcium carbonate in soils.
Heavy Metals Specific elements (e.g., Cd, Zn, Ni, and Hg)
• Some heavy metals accumulate in the environment and are toxic to plants, animals, and humans.
• Their presence may limit the suitability of reclaimed water for irrigation or other uses.
Dissolved Inorganics
Total dissolved solids, electrical conductivity,
specific elements (e.g., Na, Ca, Mg, and B)
• Excessive salinity may damage some crops and limit application for irrigation of sensitive end uses (i.e., golf courses).
Residual Chlorine Free and combined chlorine
• Excessive amounts of free available chlorine (>0.05 mg/L) may cause leaf tip burn and damage some sensitive crops.
2.3 Emerging Contaminants
Emerging contaminants are a class of compounds that include prescription and non-prescription drugs, personal care products, synthetic steroids, antibiotics, and other endocrine disruptors. With recent advancements in analytical techniques, extremely low concentrations of some of these compounds can now be measured/quantified. Consequently, some of these organic compounds have recently been detected in treated wastewater in trace quantities, drawing significant attention to these formerly undetected/little studied compounds.

March 2, 2010 - DRAFT 2-4 pw://Carollo/Documents/Client/AZ/Sedona/8256A00/Deliverables/TM2 (Draft 3/2010)
Endocrine disruptors, pharmaceuticals and personal care products are chemicals that interfere with the normal function of the endocrine system consisting of a number of ductless glands in the human body. The 1996 Safe Drinking Water Act Amendments and the Food Quality Protection Act require United States Environmental Protection Agency (USEPA) to develop a screening and testing program to determine which chemical substances have possible endocrine disrupting effects in humans. The Endocrine Disruptor Screening and Testing Advisory Committee (EDSTAC) defines endocrine disruptors as exogenous chemical substances, or mixtures, that alter the structure or function(s) of the endocrine system and cause adverse effects at the level of the organism, its progeny, populations, or subpopulations of organisms, based on scientific principles, data, weight-of-evidence, and the precautionary principle.
The USEPA’s EDSTAC estimated that there are approximately 87,000 chemicals that should be screened for their endocrine disrupting activity. Approximately 25,000 are polymers with high molecular weights, making them incapable of penetrating the biological membranes. Removing these chemicals resulted in approximately 62,000 chemicals remaining to be screened. These compounds may include organohalides (chloroform, PCBs, dioxins, etc.), food antioxidants (BHA), pesticides (atrazine, chlordane, DDT and its metabolites), herbicides and insecticides (lindane), phthalates and plasticizers (bisphenol A), synthetic hormones and hormone blockers, natural hormones (phytoestrogens), surfactants, fire retardant chemicals, antibiotics, antacids, analgesics, and other pharmaceuticals, and metals (arsenic, mercury and lead). A number of these contaminants are already regulated in drinking water.
A study by the Toxic Substances Hydrology Program of the U.S. Geological Survey (USGS) showed that a broad range of chemicals were found in residential, industrial and agricultural wastewaters. The chemicals included human and veterinary drugs (including antibiotics), natural and synthetic hormones, detergent metabolites, plasticizers, insecticides, and fire retardants. One or more of these chemicals were found in 80 percent of the surveyed streams (139 streams in 30 states). Half of the streams contained seven or more of these chemicals, and about one-third of the streams contained 10 or more of these chemicals. These observations indicate that occurrence of these chemicals is widespread, and a large number of these contaminants may be regulated in the future.
Some of the compounds (e.g., N-nitrosodimethylamine, or NDMA) that have been identified in treated effluents are known to cause acute and chronic health effects, depending on the concentration. However, the long-term health and environmental effects of most emerging contaminants are not yet well understood. Ongoing research includes evaluations of the human health and environmental effects of emerging contaminants, as well as their fate in current treatment systems.

March 2, 2010 - DRAFT 2-5 pw://Carollo/Documents/Client/AZ/Sedona/8256A00/Deliverables/TM2
3.0 REGULATORY REQUIREMENTS Water quality standards for reclaimed water depend on the intended use of the effluent. The purpose of this section is to provide a general overview of the current regulatory environment, and to identify potential future water quality requirements for the Sedona WWRP.
3.1 National Pollutant Discharge Elimination System (NPDES) Program
The National Pollutant Discharge Elimination System (NPDES), established by the USEPA, is a permitting program that establishes requirements for wastewater effluent discharge to surface water bodies (as distinguished from aquifers). The NPDES is enforced through monitoring and reporting. NPDES permits are site-specific discharge standards that incorporate Federal Clean Water Act mandates and the State Surface Water Quality Standards. On December 5, 2002, Arizona became one of 45 states with authorization from USEPA to operate the NPDES Permit Program (Section 402 of the Clean Water Act) on the state level.
Under the Arizona Pollutant Discharge Elimination System (AZPDES) Permit Program, all facilities that discharge pollutants from any point source into waters of the United States (navigable waters) are required to obtain or seek coverage under an AZPDES permit. Pollutants can enter waters of the United States from a variety of pathways, including agricultural, domestic, and industrial sources. For regulatory purposes, these sources are generally categorized as either point source or non-point sources. The Arizona Department of Environmental Quality (ADEQ) developed rules for the AZPDES program in 2001, and revised them in 2002 and 2004. The most recent revision was published in the Arizona Administrative Code (A.A.C.) on December 26, 2003.
ADEQ recently completed a triennial review of surface water quality standards. ADEQ submitted a Notice of Final Rulemaking for Surface Water Quality Standards to the Governor’s Regulatory Review Council (GRCC) in December 2008, which was published in the Arizona Administrative Register (A.A.R.), Volume 14, Issue 52.
A.A.C. Title 18, Chapter 11 (R18-11) sets the numerical water quality standards for surface waters within the state. When discharging to surface waters, the applicable numerical standards apply depending on the specific conditions of the receiving water body. Among the many parameters listed in A.A.C. R18-11, nutrients such as nitrogen (including ammonia) and phosphorous can significantly impact the treatment technology and associated design criteria requirements. Likely all of the inorganic and organic compounds, as well as pathogens, would affect the AZPDES permit, with the exception of emerging contaminants.
The City’s current discharge/disposal via land irrigation is not considered a point source discharge, and is therefore not subject to an AZPDES permit. However, if the City considers surface water discharge as an effluent disposal method (i.e., discharge to the Verde River),
March 2, 2010 - DRAFT 2-6 pw://Carollo/Documents/Client/AZ/Sedona/8256A00/Deliverables/TM2 (Draft 3/2010)
an AZPDES permit would be required, and the numerical standards associated with the surface water discharge would need to be met.
3.2 Federal Guidelines for Reclaimed Water Reuse
There are currently no federal regulations for reclaimed water reuse applications. In 2004, the USEPA suggested guidelines for reclaimed water quality standards for various reuse categories. The general industry practice is to use the Safe Drinking Water Act (SDWA) National Primary Drinking Water Regulations (NPDWRs) when defining requirements for reclaimed water that is used for potable reuse. Current drinking water standards, however, were developed based on freshwater sources, and were not based on municipal wastewater as a source. Furthermore, none of the emerging constituents of concern, including endocrine disruptors, pharmaceuticals, personal care products, and hormones, are currently regulated by maximum contaminant levels in the SDWA.
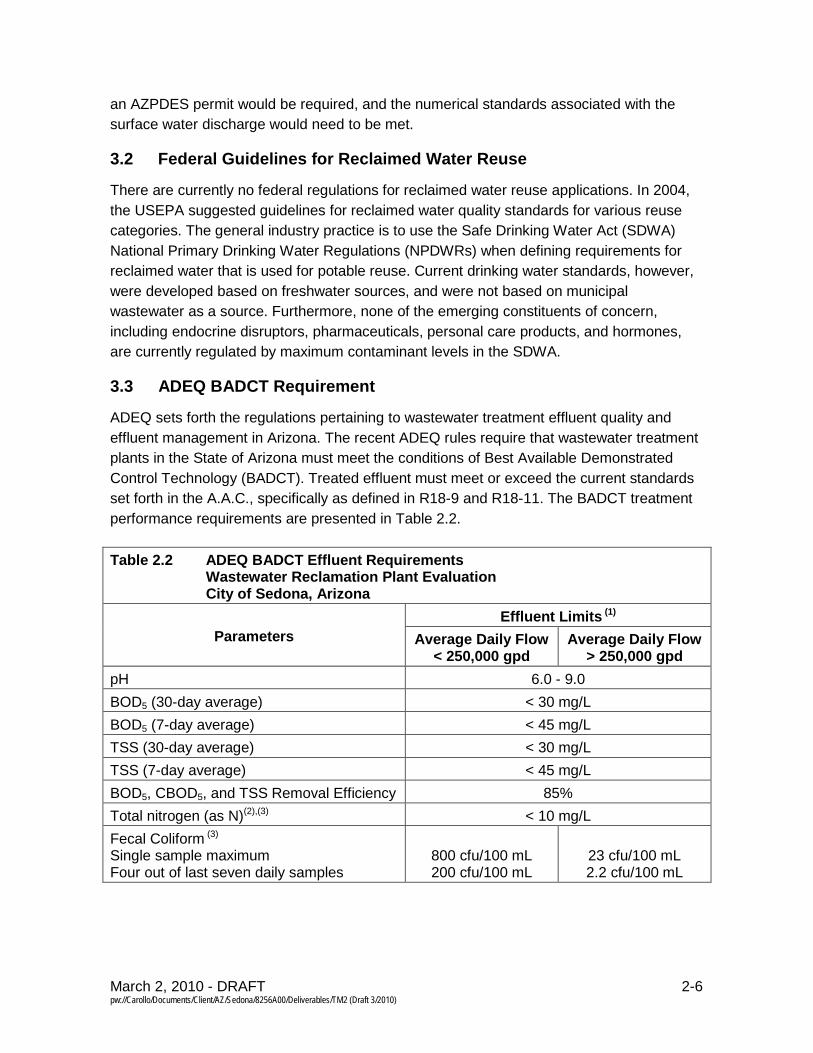
3.3 ADEQ BADCT Requirement
ADEQ sets forth the regulations pertaining to wastewater treatment effluent quality and effluent management in Arizona. The recent ADEQ rules require that wastewater treatment plants in the State of Arizona must meet the conditions of Best Available Demonstrated Control Technology (BADCT). Treated effluent must meet or exceed the current standards set forth in the A.A.C., specifically as defined in R18-9 and R18-11. The BADCT treatment performance requirements are presented in Table 2.2. Table 2.2 ADEQ BADCT Effluent Requirements
Wastewater Reclamation Plant Evaluation City of Sedona, Arizona
Parameters Effluent Limits (1)
Average Daily Flow < 250,000 gpd
Average Daily Flow > 250,000 gpd
pH 6.0 - 9.0 BOD5 (30-day average) < 30 mg/L BOD5 (7-day average) < 45 mg/L TSS (30-day average) < 30 mg/L TSS (7-day average) < 45 mg/L BOD5, CBOD5, and TSS Removal Efficiency 85% Total nitrogen (as N)(2),(3) < 10 mg/L Fecal Coliform (3) Single sample maximum Four out of last seven daily samples
800 cfu/100 mL 200 cfu/100 mL
23 cfu/100 mL 2.2 cfu/100 mL

March 2, 2010 - DRAFT 2-7 pw://Carollo/Documents/Client/AZ/Sedona/8256A00/Deliverables/TM2
Table 2.2 ADEQ BADCT Effluent Requirements Wastewater Reclamation Plant Evaluation City of Sedona, Arizona
Parameters Effluent Limits (1)
Average Daily Flow < 250,000 gpd
Average Daily Flow > 250,000 gpd
R18-11-406(B-G) constituents including: • Inorganic chemicals • Organic chemicals • Pesticides and polychlorinated biphenyls • Radionuclides • Fecal coliform • Turbidity
Numeric water quality standards must be met
A.R.S. 49-243(I) regulated chemicals including: • Known carcinogens • Substances listed in the Resource
Conservation and Recovery Act (RCRA) • Any organic toxic pollutant the Director
lists as a substantial short-term and long-term human health threat in minute amounts
Removal to greatest extent possible without regard to cost
Trihalomethanes Minimize THM compounds generated as disinfection byproducts using chlorination,
dechlorination Notes(1) Reference: A.A.C. R18-9-B204.
:
(2) Five month rolling geometric mean. (3) BADCT standards allow for soil aquifer treatment if it can be proven that the required level of
treatment is reached prior to effluent interfacing with the groundwater.
3.4 ADEQ Reuse Applications
The required quality of treated effluent in Arizona is dependent on the intended end use of the reclaimed water. The ADEQ reuse regulations categorize reclaimed water into three main classes: A, B or C effluent. In addition, if nitrogen removal is provided, then the water can be classified as A+ or B+. Class A+ water essentially has unlimited options for water reuse applications (except for potable water supply), while Class B+, though unacceptable for use at schools, parks and recreational lakes, is adequate for golf courses and other restricted-access landscape irrigation uses. The Sedona WWRP is currently permitted to produce Class B+ quality effluent, and currently disposes of treated effluent via spray irrigation on City property around the WWRP.

March 2, 2010 - DRAFT 2-8 pw://Carollo/Documents/Client/AZ/Sedona/8256A00/Deliverables/TM2 (Draft 3/2010)
Several of the effluent disposal alternatives evaluated as part of this project will require plant upgrades and permit modifications to achieve a Class A+ quality effluent. These alternatives requiring Class A+ quality effluent include effluent disposal via constructed wetlands will require Class A+ quality, mechanical evaporation, offsite disposal into the Verde River, as well as direct injection into the aquifer. Therefore, treating wastewater to a Class A+ reclaimed water quality provides the City with flexibility to adopt most effluent disposal alternatives.
The primary difference between Class A+ and B+ reclaimed water quality, in terms of treatment requirements, is the level of tertiary filtration and disinfection required. Table 2.3 summarizes the different requirements for Class A+, B+, and C quality reclaimed water. It is important to note that BADCT requirements are essentially equivalent to the Class A+ quality requirements for new or expanded facilities with design flows above 250,000 gpd. Table 2.3 ADEQ Reclaimed Water Quality Standards
Wastewater Reclamation Plant Evaluation City of Sedona, Arizona
Parameter Effluent Limits
Class A+(1) Class B+(2) Class C(3)
Secondary treatment X X Stabilization ponds
with 20-day detention
Filtration X NR NR Denitrification X X NR Disinfection X X With or without Total Nitrogen (as N)(4) < 10 mg/L < 10 mg/L N/A Turbidity Daily (24-hour) average Single sample maximum
2 NTU 5 NTU
N/A N/A
N/A N/A
Fecal Coliform Single sample maximum Four out of last seven daily samples
< 23 cfu/100 mL
ND
< 800 cfu/100 mL < 200 cfu/100 mL
< 4,000 cfu/100 mL < 1,000 cfu/100 mL
NotesX =Required
:
NR =Not Required (1) Reference: A.A.C. R18-11-303 (2) Reference: A.A.C. R18-11-305 (3) Reference: A.A.C. R18-11-307 (4) Five sample geometric mean.
March 2, 2010 - DRAFT 2-9 pw://Carollo/Documents/Client/AZ/Sedona/8256A00/Deliverables/TM2
3.4.1
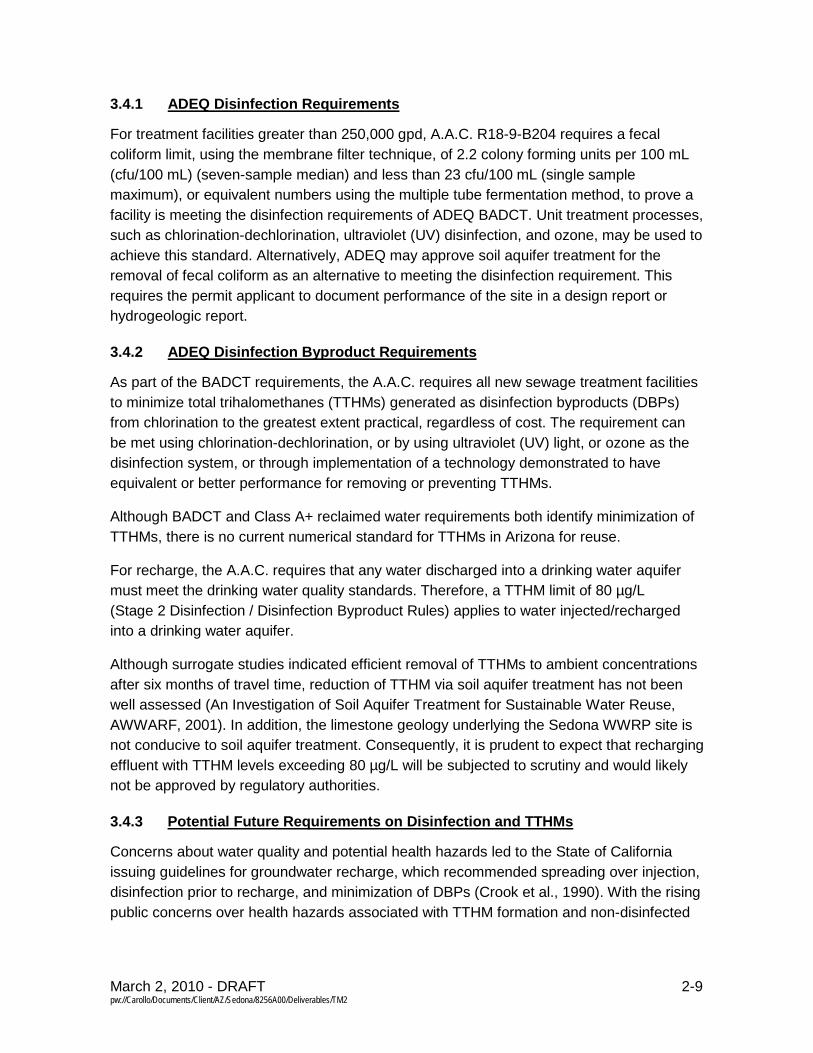
For treatment facilities greater than 250,000 gpd, A.A.C. R18-9-B204 requires a fecal coliform limit, using the membrane filter technique, of 2.2 colony forming units per 100 mL (cfu/100 mL) (seven-sample median) and less than 23 cfu/100 mL (single sample maximum), or equivalent numbers using the multiple tube fermentation method, to prove a facility is meeting the disinfection requirements of ADEQ BADCT. Unit treatment processes, such as chlorination-dechlorination, ultraviolet (UV) disinfection, and ozone, may be used to achieve this standard. Alternatively, ADEQ may approve soil aquifer treatment for the removal of fecal coliform as an alternative to meeting the disinfection requirement. This requires the permit applicant to document performance of the site in a design report or hydrogeologic report.
ADEQ Disinfection Requirements
3.4.2
As part of the BADCT requirements, the A.A.C. requires all new sewage treatment facilities to minimize total trihalomethanes (TTHMs) generated as disinfection byproducts (DBPs) from chlorination to the greatest extent practical, regardless of cost. The requirement can be met using chlorination-dechlorination, or by using ultraviolet (UV) light, or ozone as the disinfection system, or through implementation of a technology demonstrated to have equivalent or better performance for removing or preventing TTHMs.
ADEQ Disinfection Byproduct Requirements
Although BADCT and Class A+ reclaimed water requirements both identify minimization of TTHMs, there is no current numerical standard for TTHMs in Arizona for reuse.
For recharge, the A.A.C. requires that any water discharged into a drinking water aquifer must meet the drinking water quality standards. Therefore, a TTHM limit of 80 µg/L (Stage 2 Disinfection / Disinfection Byproduct Rules) applies to water injected/recharged into a drinking water aquifer.
Although surrogate studies indicated efficient removal of TTHMs to ambient concentrations after six months of travel time, reduction of TTHM via soil aquifer treatment has not been well assessed (An Investigation of Soil Aquifer Treatment for Sustainable Water Reuse, AWWARF, 2001). In addition, the limestone geology underlying the Sedona WWRP site is not conducive to soil aquifer treatment. Consequently, it is prudent to expect that recharging effluent with TTHM levels exceeding 80 µg/L will be subjected to scrutiny and would likely not be approved by regulatory authorities.
3.4.3
Concerns about water quality and potential health hazards led to the State of California issuing guidelines for groundwater recharge, which recommended spreading over injection, disinfection prior to recharge, and minimization of DBPs (Crook et al., 1990). With the rising public concerns over health hazards associated with TTHM formation and non-disinfected
Potential Future Requirements on Disinfection and TTHMs

March 2, 2010 - DRAFT 2-10 pw://Carollo/Documents/Client/AZ/Sedona/8256A00/Deliverables/TM2 (Draft 3/2010)
recharge water, it is anticipated that ADEQ will enact requirements on recharge stream disinfection and TTHM compliance in the near future.
Typical reclaimed water may exceed the anticipated aquifer water quality standards. TTHM issues are frequently related to the disinfection method and the presence of DBP precursors (e.g., TOC, bromide, pH, temperature). Unless DBP precursors are removed or reduced, the addition of chlorine will cause the formation of TTHMs which, when recharged, may exceed aquifer water quality standards.
3.5 Aquifer Protection Permits
In Arizona, an Aquifer Protection Permit (APP) is required for any facility that discharges a pollutant either directly to an aquifer, to the land surface, or into the vadose zone (the area between an aquifer and the land surface) in such a manner that there is a reasonable probability that the pollutant will reach an aquifer. Wastewater treatment facilities and injection wells are considered to be discharging pollutants and therefore require APP permits. Aquifer water quality standards are outlined in A.A.C Title 18, Chapter 11, Article 4. Aquifer water quality standards apply to aquifers that are classified for drinking water protected use. There are numerous requirements specified in the A.A.C regarding aquifer protection. However, the following are the most critical:
1. The best available demonstrated control technology (BADCT) must be used by the facility (see Section 3.3).
2. The facility must demonstrate that aquifer water quality standards (AWQS) will not be violated in the aquifer at a point of compliance as a result of discharge from the facility. If the level of a pollutant in the aquifer already exceeds the AWQS at the time of permit issuance, the aquifer must not be further degraded.
APPs typically include monitoring requirements for both the point of compliance and also for the groundwater in the influenced aquifer. Each point of compliance is assigned a discharge limit (DL) along with an alert limit (AL) while groundwater monitoring is assigned a aquifer quality limit (AQL) along with an alert level. Any change to the Sedona WWRP or associated effluent disposal practice will require a revision to Sedona’s existing APP and potential modifications to the associated regulations contained therein.
3.6 Emerging Contaminants and Reuse
The United States Geological Survey (USGS) completed a nationwide survey in 2000 that tested for the occurrence of pharmaceuticals, hormones, and other organic wastewater contaminants (OWCs) in streams across the U.S. A total of 139 streams in 30 states were tested for 95 OWCs using five new research methods developed by the USGS. All sampling locations selected were located near urban areas. Four sampling locations were selected in Arizona including the Santa Cruz River near Rio Rico, the City of Phoenix 91st Avenue Wastewater Treatment Plant (WWTP) outfall, the Santa Cruz River at Cortaro Road, and the Gila River above diversions, at Gillespie Dam.

March 2, 2010 - DRAFT 2-11 pw://Carollo/Documents/Client/AZ/Sedona/8256A00/Deliverables/TM2
At least one OWC was detected in 80 percent of the streams sampled, with 82 of the 95 analyzed OWCs detected in at least one sample. Steroids, nonprescription drugs, and an insect repellent were the three chemical groups most commonly detected in the streams. Detergent metabolites, steroids, and plasticizers were generally found at the highest concentrations.
The USEPA and other regulatory agencies are currently working to classify, quantify and understand the health impacts of the multitude of endocrine disruptors, pharmaceuticals and personal care products, which can occur in treated effluent. While some of these compounds may ultimately be regulated and/or require treatment, such regulation and associated treatment is still very undefined and not likely to be implemented in the near future.
Consequently, while Sedona should continue to closely monitor regulation of these compounds, it is not recommended that the City implement any physical or operational changes at this point to accommodate future treatment. Until regulations and required treatment are better defined, any capital or O&M expenditures could be premature and could result in wasted efforts. If the City moves forward with other physical or operational improvements to accommodate ancillary goals (i.e., UV system upgrades to produce Class A+ effluent), these improvements should be completed with consideration for potential future treatment of emerging contaminants.
3.7 Regulatory Summary
Based on the potential uses of effluent from the Sedona WWRP, it is recommended that the City implement the required physical and operational modifications required to treat wastewater to ADEQ Class A+ reclaimed water quality standards. This approach provides the most flexibility for the effluent disposal alternatives being considered and will provide the City with the highest quality effluent – consistent with their social, political, and aesthetic goals. Effluent disposal via constructed wetlands , aquifer recharge, or mechanical evaporation will all require Class A+ quality due to the potential exposure to the public. If surface water discharge is considered in the future, the NPDES regulations would need to be further evaluated for the specific receiving stream.
Regulations for emerging contaminants such as pharmaceuticals and endocrine disruptors are still in early stages of development, and there is no certainty as to which compounds will be regulated, if any, and what treatment standards or methods may be required. Therefore, it is recommended that the regulatory process for emerging contaminants be monitored in order to plan the necessary treatment facilities when the treatment goals are better defined.

March 2, 2010 - DRAFT 2-12 pw://Carollo/Documents/Client/AZ/Sedona/8256A00/Deliverables/TM2 (Draft 3/2010)
4.0 EFFLUENT WATER QUALITY DATA REVIEW As part of the overall evaluation, the team conducted a review of the treatment performance of the Sedona WWRP. The performance review was based on historical plant operational data between January 2004 and May 2009. The primary purpose of the data review and evaluation was to compare the existing plant performance to the water quality standards established by the ADEQ Class A+ water quality requirements, in order to identify the suitability of the existing processes to produce Class A+ quality effluent. It should be noted that existing effluent water quality is associated with an average plant flow of only 1.2 mgd - significantly below the 2.0 mgd rated capacity of the facility. The facility’s current performance may not necessarily be an indicator of its future performance when more fully loaded (i.e., when plant flows approach/reach 2.0 mgd). Consequently, the main focus of this Section is to review historical performance, and not to predict performance at future flows. The process evaluation at future flows is addressed in Section 6.0.
4.1 Effluent Nitrogen
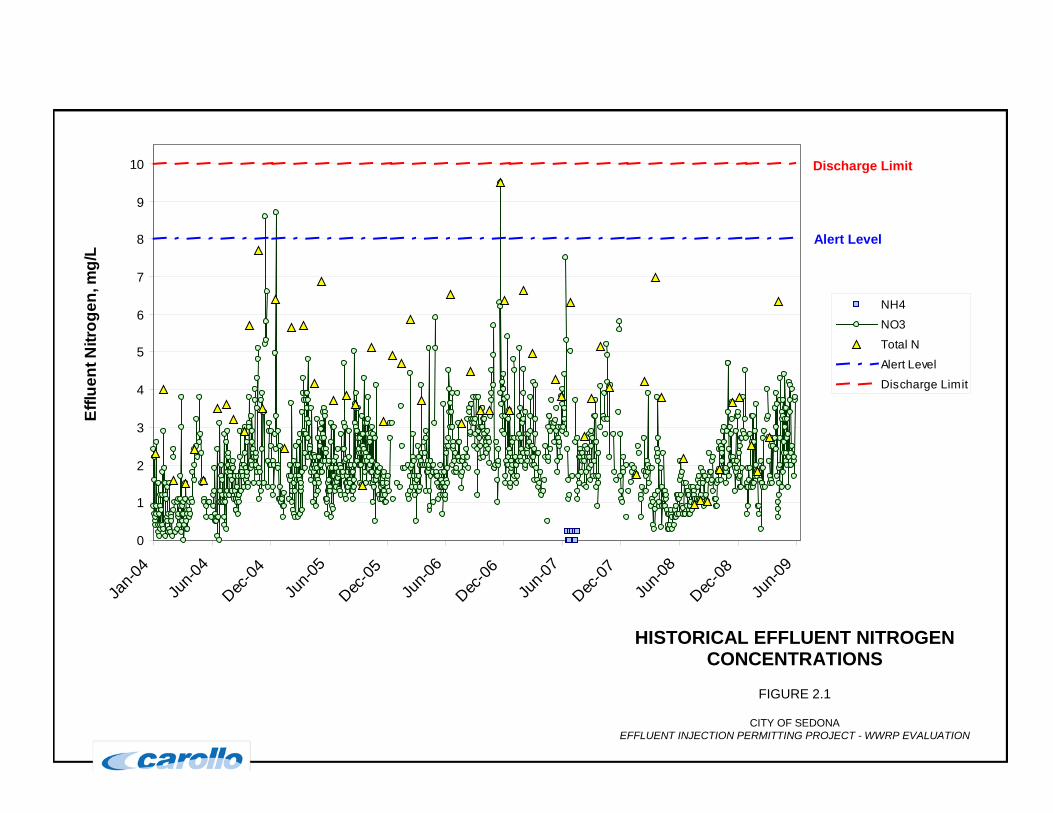
Effluent total nitrogen concentrations were found to be consistently below the permit limit of 10 mg/L and the alert level of 8 mg/L, which meets the Class A+ effluent quality standards of less than 10 mg/L. The average effluent nitrate concentration was 2.1 mg/L. Ammonia nitrogen is not routinely measured, but the average effluent total nitrogen concentration was 4.0 mg/L. These levels of nitrate and total nitrogen in the effluent indicate that the nitrification and denitrification processes in the existing activated sludge basins have been sufficient at current flows to comply with a 10 mg/L limit. Figure 2.1 presents an overview of the historical effluent nitrogen concentrations between 2004 and 2009.
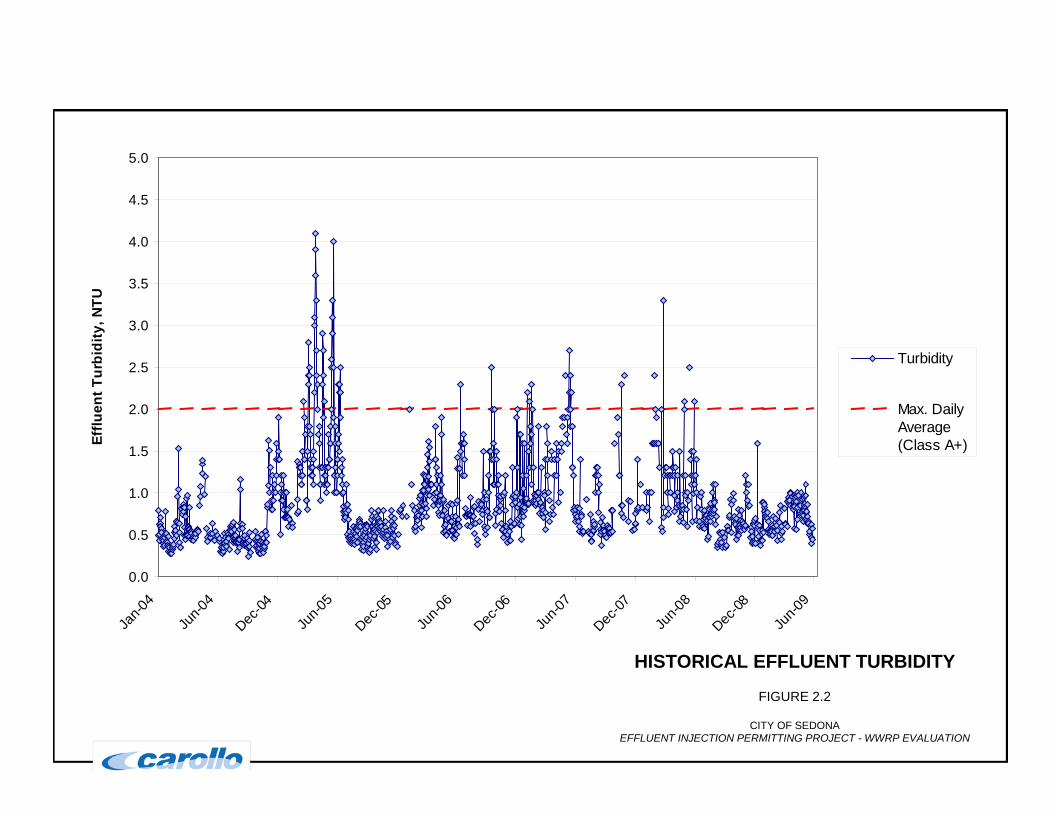
4.2 Effluent Turbidity and Suspended Solids
Effluent turbidity has generally been below the daily average limit of 2 NTU specified by Class A+ requirements. The average effluent turbidity over the analysis period was approximately 0.88 NTU. During the last year of operation, effluent turbidity values have been consistently between 0.5 and 1.0 NTU. However, the 96th percentile of the daily effluent turbidity values was 2.0 NTU. Therefore, approximately 4 percent of the data points (50 days out of 1,243) were equal to or greater than the daily average turbidity limit of 2 NTU specified by Class A+ requirements. The maximum reported effluent turbidity was 4.1 NTU. Figure 2.2 presents an overview of the historical effluent turbidity between 2004 and 2009.
The observed effluent turbidity levels indicate that, in general, the existing tertiary filtration process is providing sufficient turbidity removal at current flows to meet a daily effluent turbidity limit of 2.0 NTU. The observed occasional spikes in effluent turbidity can likely be mitigated with the addition of a filter aid system, which is a provision typically required by ADEQ for Class A+ effluent.
0
1
2
3
4
5
6
7
8
9
10
Jan-0
4
Jun-0
4
Dec-04
Jun-0
5
Dec-05
Jun-0
6
Dec-06
Jun-0
7
Dec-07
Jun-0
8
Dec-08
Jun-0
9
Efflu
ent N
itrog
en, m
g/L
NH4
NO3
Total N
Alert Level
Discharge Limit
HISTORICAL EFFLUENT NITROGEN
CONCENTRATIONS
FIGURE 2.1
CITY OF SEDONA EFFLUENT INJECTION PERMITTING PROJECT - WWRP EVALUATION
Discharge Limit
Alert Level
0.0
0.5
1.0
1.5
2.0
2.5
3.0
3.5
4.0
4.5
5.0
Jan-0
4
Jun-0
4
Dec-04
Jun-0
5
Dec-05
Jun-0
6
Dec-06
Jun-0
7
Dec-07
Jun-0
8
Dec-08
Jun-0
9
Efflu
ent T
urbi
dity
, NTU
Turbidity
Max. DailyAverage(Class A+)
HISTORICAL EFFLUENT TURBIDITY
FIGURE 2.2
CITY OF SEDONA EFFLUENT INJECTION PERMITTING PROJECT - WWRP EVALUATION
March 2, 2010 - DRAFT 2-15 pw://Carollo/Documents/Client/AZ/Sedona/8256A00/Deliverables/TM2
The effluent total suspended solids (TSS) concentrations are relatively low compared to typical values for traveling bridge sand media filter effluents. The observed average effluent TSS of 1.7 mg/L indicates the tertiary filters are providing very good solids removal, which is likely assisted by good performance of the secondary clarifiers. The 98th percentile of the effluent TSS values is 5 mg/L, a value typically required by UV system manufacturers for optimum performance of the disinfection system downstream of tertiary filtration. Therefore, only 2 percent of the reported TSS values (approximately 5 values out of 236) exceeded 5 mg/L, with a maximum reported value of 8 mg/L. Figure 2.3 presents an overview of the historical effluent total suspended solids concentrations between 2004 and 2009.
4.3 Effluent Fecal Coliform Counts
Effluent fecal coliform counts have generally been below the single sample maximum limit of 23 most probable number per 100 milliliters (MPN/100 mL) specified by Class A+ requirements, with several exceptions in 2004 and 2005. The 94.5 percentile of the reported fecal coliform values is 23 MPN/100 mL. Therefore, 5.5 percent of the reported values (approximately 16 out of 283) exceeded 23 MPN/100 mL, with a maximum reported value of >1,600 MPN/100 mL. With the exception of one data point in 2007, all of the values exceeding 23 MPN/100 mL fall in the 2004 to 2005 time period. Figure 2.4 presents an overview of the historical effluent fecal coliform counts between 2004 and 2009.
5.0 EXISTING FACILITIES DESCRIPTION Sedona is currently permitted to discharge 2.0 mgd annual average day flow (AADF) of Class B+ effluent. The treatment process includes screening, grit removal, activated sludge treatment, secondary clarification, sand filtration, and ultraviolet disinfection. Solids are aerobically digested, and dewatered using air drying beds or centrifuges. The major unit processes of the Sedona WWRP are shown in the process flow schematic in Figure 2.5, and are further described in this section.
5.1 Headworks
Existing headworks facilities include two in-channel mechanical bar screens and one mechanical vortex grit removal unit. The screenings are discharged to a bin for off-site disposal without washing or compacting.

HISTORICAL EFFLUENT TOTAL SUSPENDED SOLIDS
FIGURE 2.3
CITY OF SEDONA
EFFLUENT INJECTION PERMITTING PROJECT - WWRP EVALUATION
Maximum for Optimal UV Operation

1
10
100
1,000
10,000
Jan-0
4
Jun-0
4
Dec-04
Jun-0
5
Dec-05
Jun-0
6
Dec-06
Jun-0
7
Dec-07
Jun-0
8
Dec-08
Jun-0
9
Efflu
ent F
ecal
Col
iform
Cou
nts,
MPN
/100
mL
FecalColiformCount
SingleSample Max(Class A+)
Note:Values reported as <2 or <1 are plotted w ith a value of 1.
HISTORICAL EFFLUENT FECAL COLIFORM COUNTS
FIGURE 2.4
CITY OF SEDONA
EFFLUENT INJECTION PERMITTING PROJECT - WWRP EVALUATION

V:\Client40\Sedona\Reports\8256a.oo\Figures\Fig2.5.doc
EXISTING PROCESS FLOW SCHEMATIC
FIGURE 2.5
CITY OF SEDONA EFFLUENT INJECTION PERMITTING PROJECT – WWRP EVALUATION
March 2, 2010 - DRAFT 2-19 pw://Carollo/Documents/Client/AZ/Sedona/8256A00/Deliverables/TM2
5.2 Secondary Treatment
Secondary treatment includes activated sludge and secondary clarification processes. The activated sludge treatment facilities include four aeration basins, each with an anoxic zone, one aeration zone, and an internal mixed liquor recycle pump that transfers activated sludge from the end of the aeration zone back to the first anoxic zone. The aeration basins are configured to achieve nitrification and denitrification through a Modified Ludzak-Ettinger (MLE) configuration when four basins are operated in parallel. However, the basins are designed to allow various different treatment configurations, including a four-stage Bardenpho configuration with two sets of anoxic-aerobic stages, in the event that effluent nitrogen or phosphorus regulations become more stringent in the future.
The aeration system includes three centrifugal blowers (two duty and one standby) and fine bubble diffusers. Each aeration blower has a design capacity of 1,300 standard cubic feet per minute (scfm). Each aeration basin is equipped with dissolved oxygen (DO) monitoring. However, blower operation is currently not controlled automatically based on DO concentrations in the aeration basins.
The secondary clarification facilities include two circular (55-foot diameter) secondary clarifiers. Sludge settled in the secondary clarifiers is returned to the aeration basins via the return activated sludge (RAS) pump station, which includes one pump for each clarifier and a shared standby unit. Sludge wasting is achieved using the RAS pumps and an automatically controlled valve located at the RAS discharge header. Currently, only one clarifier is in operation at a time.
5.3 Tertiary Treatment
The tertiary treatment facilities include the filtration and disinfection unit processes. Filtration of secondary effluent is achieved with traveling bridge sand media filters. A total of four units are installed at the Sedona WWRP each with a filtration area of 324 square feet.
The existing disinfection system consists of two channels equipped with low pressure, low intensity, open channel UV disinfection equipment (Trojan UV 3000). The existing disinfection equipment was sized for peak flows of 2.0 mgd in Channel 1, and 1.8 mgd in Channel 2, based on a design dose of 30 millijoules per square centimeter (mJ/cm2). The existing facilities do not include redundant disinfection capacity at peak flows.
5.4 Solids Treatment
Waste activated sludge (WAS) from the secondary treatment system is transferred to an aerobic digester, which provides an approximate 10-day solids retention time (SRT). The partially stabilized sludge is either dried via air drying beds, or mechanically dewatered using two centrifuge units. Dewatered solids are stored in roll off bins and hauled to a landfill for disposal.

March 2, 2010 - DRAFT 2-20 pw://Carollo/Documents/Client/AZ/Sedona/8256A00/Deliverables/TM2 (Draft 3/2010)
6.0 TREATMENT PROCESS EVALUATION The primary purpose of the treatment process evaluation was to determine whether the existing facilities are adequate to reliably produce Class A+ quality reclaimed water/effluent at the current 1.2 mgd flow and future flows (assuming current influent quality characteristics), and if not, to identify the required process improvements to achieve a Class A+ quality effluent. An ancillary benefit of the treatment process evaluation was the ability to determine the ultimate WWRP capacity based on current influent characteristics (which differ from the original design parameters as outlined below).
In general, the secondary treatment, tertiary filtration, and disinfection processes are critical to achieving Class A+ quality effluent. The existing activated sludge treatment process (secondary process) was evaluated using a process model that simulates the performance based on inputs for flow, loading, and other operating conditions. The existing tertiary filtration facilities were evaluated based on standard engineering design criteria combined with the analysis of the historical data for filter performance. The existing UV disinfection process was evaluated based on current standard practice design parameters and water quality sampling and testing by the UV manufacturer.
6.1 Secondary Treatment Process Evaluation
A process model was used to evaluate the treatment capacity of the Sedona WWRP. The process model simulates the plant performance based on inputs for flow, loading, and other operating conditions. Outputs from the model include process effluent characteristics, process safety factors associated with achieving given criteria, and/or the maximum allowable loading to ensure permit compliance.
The primary objective for modeling the performance of the Sedona WWRP was to evaluate the performance of the existing facilities under current and future loadings, in order to determine the true treatment capacity of the existing facilities and their ability to produce Class A+ quality effluent. In addition, the analysis assisted in determining the maximum loading at which the WWRP can achieve Class A quality effluent+.
The approach used for the process modeling effort included the following steps:
• Establish design influent wastewater flows and characteristics to be used for the process evaluation under existing and future conditions.
• Customize and calibrate the process model for the Sedona WWRP under current conditions.
• Using the calibrated process model, evaluate the performance of the secondary treatment process under future conditions, using the design wastewater flows and loadings established for the evaluation.

March 2, 2010 - DRAFT 2-21 pw://Carollo/Documents/Client/AZ/Sedona/8256A00/Deliverables/TM2
6.1.1
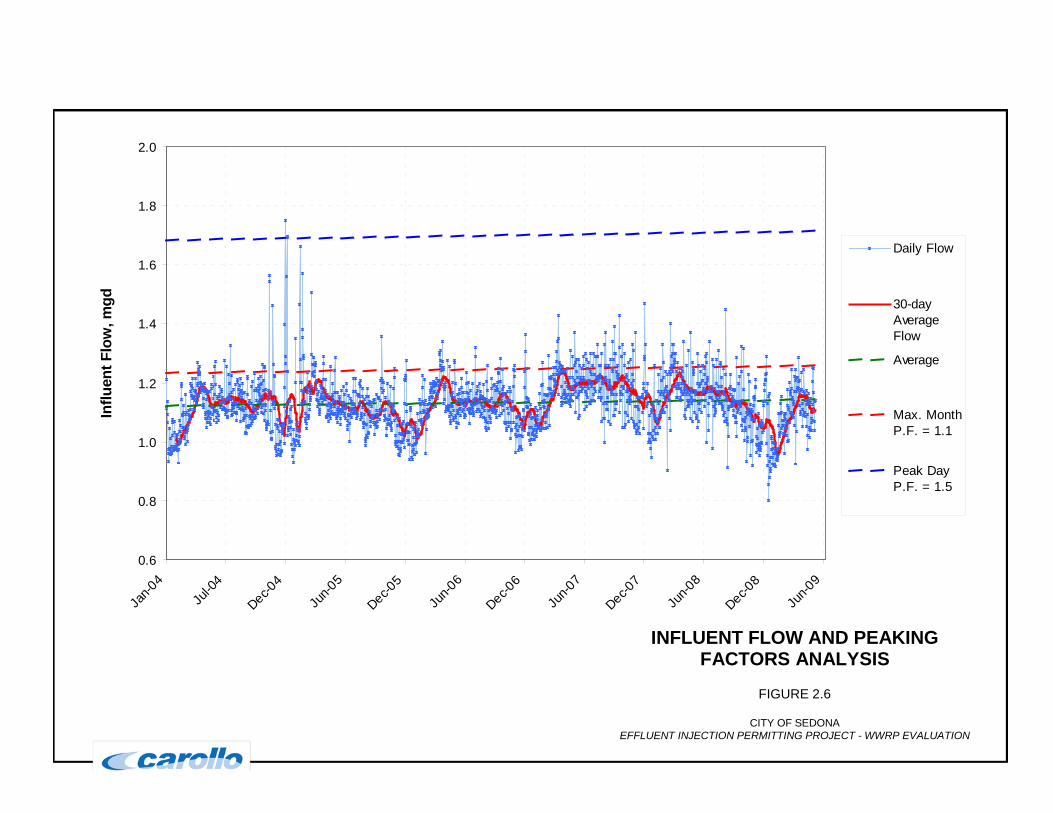
Daily average influent flows were obtained from plant operational data records between January 2004 and May 2009. The average daily flow into the plant has been relatively constant over the time period analyzed. Throughout a calendar year, the plant typically receives higher monthly flows during spring months (April-May), and lower monthly flows during winter months (December-February). Peak day flows do not follow a repeatable pattern and occur at different times throughout the year. A chart indicating the historical flow data analysis and the recommended influent flow peaking factors is presented in Figure 2.6.
Wastewater Flow
The recommended maximum month flow peaking factor was based on the ratio between the maximum 30-day running average flow and the annual average day flow. A linear regression was used to calculate the annual average flow over the entire period of data analysis. The peak day factor was based on the ratio between the maximum daily average flow and the annual average flow. The peak hour factor proposed is based on Carollo’s design experience for the observed range of flows. The recommended peaking factors are presented in Table 2.4. Table 2.4 Design Hydraulic Peaking Factors
Sedona WWRP Evaluation Memo City of Sedona, Arizona
Hydraulic Peaking Factor (1) Value Maximum Month Average Day 1.1 Peak Day 1.5 Peak Hour (2) 2.0 Notes(1) Based on analysis of historical data between January 2004 and May 2009. All peaking factors
are relative to the annual average day flow.
:
(2) Base on Carollo’s experience for the observed range of flows.
6.1.2
The wastewater characteristics used as part of the WWRP analysis were determined based on an analysis of the plant’s historical wastewater quality records. Influent characteristics were obtained from plant operational records between 2004 and 2009. Composite samples of the plant influent are taken at the headworks, before the wastewater goes through screening and grit removal. Flow and characteristics from the tertiary filter backwash stream and sludge dewatering equipment, which are recycled to the headworks, are not routinely measured individually, but are represented/included in the influent wastewater quality characteristics.
Wastewater Characteristics
The following influent wastewater quality data provided by the City were used in the analysis: Chemical Oxygen Demand (COD), Total Suspended Solids (TSS), Volatile Suspended Solids (VSS), and Ammonia Nitrogen (as Nitrogen (NH3-N).
0.6
0.8
1.0
1.2
1.4
1.6
1.8
2.0
Jan-0
4Ju
l-04
Dec-04
Jun-0
5
Dec-05
Jun-0
6
Dec-06
Jun-0
7
Dec-07
Jun-0
8
Dec-08
Jun-0
9
Influ
ent F
low
, mgd
Daily Flow
30-dayAverageFlow
Average
Max. MonthP.F. = 1.1
Peak DayP.F. = 1.5
INFLUENT FLOW AND PEAKING
FACTORS ANALYSIS
FIGURE 2.6
CITY OF SEDONA EFFLUENT INJECTION PERMITTING PROJECT - WWRP EVALUATION

March 2, 2010 - DRAFT 2-23 pw://Carollo/Documents/Client/AZ/Sedona/8256A00/Deliverables/TM2
Table 2.5 presents the average influent wastewater characteristics over the analysis period. Graphs of influent wastewater concentrations and calculated loadings are included in Appendix 2A. Outliers deviating more than two standard deviations from the mean were removed from the data set.
Table 2.5 Average Influent Wastewater Characteristics Sedona WWRP Evaluation Memo City of Sedona, Arizona
Parameter 2004 2005 2006 2007 2008 2009 (1) Average
2004-2009 COD, mg/L N.A. N.A. N.A. 760 925 852 832 TSS, mg/L 533 417 344 418 580 307 488 VSS, mg/L 409 336 305 356 492 280 376 NH3-N, mg/L N.A. N.A. N.A. 30 25 23 26 Notes(1) From January to May 2009
:
The wastewater concentrations under annual average day loadings and maximum month average day loadings were used as part of the capacity evaluation. The wastewater characteristics for annual average day loadings were based on average wastewater concentrations over the entire analysis period (2004 to 2009). The wastewater characteristics for maximum month loadings were based on a statistical analysis of the reported wastewater quality. The maximum month load peaking factors were calculated based on the ratio between the 92nd percentile and the average wastewater concentrations in the analysis period. Table 2.6 presents the recommended maximum load peaking factors for design and capacity analysis purposes.
Table 2.6 Influent Loading Peaking Factors Sedona WWRP Evaluation Memo City of Sedona, Arizona
Parameter Average (1) 92nd
Percentile (1)
Recommended Maximum Month Load
Peaking Factor COD, mg/L 832 1,095 1.32 TSS, mg/L 488 738 1.65 NH3-N, mg/L 26 30 1.32 (2) Notes(1) Based on historical data between January 2004 and May 2009. All peaking factors are relative
to the annual average day flow.
:
(2) The calculated peaking factor is 1.15. The recommended peaking factor is equal to the COD load peaking factor for a conservative design/capacity analysis of the denitrification process.
The flows and wastewater concentrations in the plant influent suggest that the maximum month wastewater loadings (pounds per day) coincide with the maximum month flows (mgd). Therefore, the proposed wastewater concentrations at the maximum month

March 2, 2010 - DRAFT 2-24 pw://Carollo/Documents/Client/AZ/Sedona/8256A00/Deliverables/TM2 (Draft 3/2010)
conditions are calculated by multiplying the annual average concentration by the maximum month load peaking factor, and dividing by the maximum month flow peaking factor.
Temperature for design and capacity evaluation purposes was based on 30-day averages of the plant-reported values for the influent wastewater. Process temperature is a critical parameter for the design and capacity evaluation of the secondary treatment system. Process evaluations were performed at maximum month loadings and a temperature of 17 degrees Celsius (spring months), and at annual average day loadings and minimum temperature of 15 degrees Celsius (winter months). The most critical conditions for the secondary system evaluation are represented by maximum month loadings during spring months.
Table 2.7 presents the wastewater characteristics at average and maximum month conditions, used for the capacity evaluation presented herein. The average COD and TSS are relatively high compared to typical values commonly used for the design of wastewater treatment facilities treating domestic wastewater. However, the concentrations at the Sedona WWRP are comparable to those observed recently in many rapidly growing communities in Arizona, including communities in Northern Arizona such as the City of Prescott. Factors contributing to higher wastewater concentrations include increased use of water efficiency fixtures and food grinders, lifestyle changes in the community, and increased commercial and industrial contributions, among others.
Table 2.7 Design Wastewater Concentrations Wastewater Reclamation Plant Evaluation City of Sedona, Arizona
Parameter Unit Annual
Average Day Maximum Month Average Day (1)
Design Concentrations COD mg/L 832 996 BOD (2) mg/L 366 439 TSS mg/L 448 672 VSS mg/L 376 566 NH3-N mg/L 26 31 TKN (3) mg/L 42 50 Alkalinity (4) mg/L 250 250 Temperature (5) °C 15 17 pH (4) -- 7.3 7.3 Notes(1) Based on the assumption that the maximum month loads coincide with the maximum month
flows.
:
(2) Based on process model calculations for conversion between COD to BOD. (3) No data available. Assumed based on an ammonia to TKN ratio of 62 percent. (4) No data available. Assumed based on typical concentrations in domestic wastewater. (5) Based on 30-day averages of influent wastewater temperature records.

March 2, 2010 - DRAFT 2-25 pw://Carollo/Documents/Client/AZ/Sedona/8256A00/Deliverables/TM2
6.1.3
Process modeling for the Sedona WWRP was performed using the Biological Treatment Analysis (Biotran) modeling program. Biotran is a modeling tool developed by Carollo Engineers for wastewater treatment plant design and process evaluations. This program utilizes mass balances, and biological and physical models, to simulate interactions between the different unit processes in a wastewater treatment facility. The model is used in conjunction with the wastewater characteristics and design criteria to establish treatment capacities for the different processes. The model also generates projections for biosolids production, oxygen utilization, etc., that can be used to size auxiliary facilities (i.e., blowers, pumps, etc.).
Model Setup and Calibration
Biotran is a steady-state model. Therefore, the model predictions represent average values and not individual values taken at a particular time of the day. In reality, plant flows, concentrations and operating conditions vary during the course of the day, and from week to week. As a result, projections from a steady-state model, as shown here, must not be expected to accurately replicate individual samples taken on any particular day. However, model predictions can be compared to average concentration and parameters observed over a period of time for which the evaluation is being performed.
The Biotran process model was customized to simulate the existing unit processes at the Sedona WWRP. Basin dimensions, flow routing, and equipment capacities were based on engineering drawings, site visits, and information provided by plant staff.
The approach used for model calibration was to incorporate the available plant data as inputs to the model and compare the steady-state model predictions with annual averages of plant operating data. The annual average influent COD, TSS, and ammonia values were used as inputs for the model calibration. Graphs of process data used for the model calibration procedure are included in Appendix 2A.
The model predictions were in relatively good agreement with the plant data. The model was calibrated to match the values predicted by the model to the actual reported average values of ammonia, nitrate (NO3-N) and nitrite (NO2-N)concentration in the effluent, as well as solids production in the waste activated sludge (WAS) stream. The results of the model calibration are outlined in Table 2.8.

March 2, 2010 - DRAFT 2-26 pw://Carollo/Documents/Client/AZ/Sedona/8256A00/Deliverables/TM2 (Draft 3/2010)
Table 2.8 Process Model Calibration Results Wastewater Reclamation Plant Evaluation City of Sedona, Arizona
Parameter Unit Plant Data (1) Model Prediction (1) Effluent NO3-N mg/L 2.2 3.3 Effluent NO2-N mg/L 0.04 0.05 Effluent TSS mg/L 1.7 2.0 WAS Solids Concentration mg/L 13,048 13,143 WAS Solids ppd 2,502 2,728 Notes(1) Calibration is based on period between January 2005 and May 2009.
:
The main inputs used in the model calibration procedure are specific parameters that define the different components of domestic wastewater, in addition to input parameters based on actual data such as influent COD, TSS, and ammonia. Wastewater is composed of biodegradable, unbiodegradable, and inorganic fractions, and each of these fractions is further subdivided into soluble and particulate components. Each of these specific parameters affects the predicted performance of the biological system in a particular manner. For example, effluent nitrate levels are very dependent on the amount of soluble biodegradable matter (i.e., soluble BOD) in the anoxic zones of the system. Sludge production is influenced not only by the amount of bacterial growth, but also by the unbiodegradable particulate fraction of the influent TSS. The specific parameters that determine the biodegradable, unbiodegradable, and inorganic fractions of soluble and particulate components were calibrated within typical ranges of values normally observed in domestic wastewater.
6.1.4
For some treatment process units, such as tertiary treatment (filtration and disinfection) facilities, the rated capacity is based on the hydraulic peak flows through the associated unit. For this evaluation, the maximum rated capacity of unit processes governed by hydraulic flow was compared to peak daily or peak hourly flows to determine possible limitations in the overall treatment process capacity. The wastewater flow peaking factors (maximum month average day, peak day, peak hour) used as part of this evaluation were presented in Table 2.4.
Evaluation Criteria
The capacity of the secondary process, however, is based not only on flow, but also on the influent wastewater characteristics, and on operating parameters such as solids retention time (SRT), mixed liquor suspended solids (MLSS) and sludge settleability characteristics. The secondary process includes the aeration basins, aeration system, secondary sedimentation basins, and mixed liquor return (MLR) and return activated sludge (RAS) pumps.

March 2, 2010 - DRAFT 2-27 pw://Carollo/Documents/Client/AZ/Sedona/8256A00/Deliverables/TM2
To determine the secondary process treatment capacity, the activated sludge treatment facilities were evaluated based on their capacity to operate effectively at different design influent flow and loadings. The process modeling approach was to allow the secondary clarifier overflow rate and solids loading safety factor to determine the maximum acceptable operating MLSS concentration in the aeration basins. The resulting MLSS provides an SRT for the secondary system, which was evaluated together with the effluent characteristics to determine whether the predicted performance of the secondary system would be acceptable to meet the effluent quality criteria.
6.1.4.1 Solids Retention Time
The primary requirement in the selection of a minimum required SRT is that the operating aerobic SRT must be long enough to support stable nitrification throughout the year. A recommended minimum aerobic SRT is calculated in the Biotran model as a guideline for ensuring stable nitrification. The evaluations presented in this technical memorandum were based on achieving a minimum aerobic SRT of approximately 5.0 days under maximum month average day flow (MMADF) conditions and 6.5 days under annual average day flow (AADF) conditions. Shorter aerobic SRTs compromise the ability of the plant to successfully perform nitrogen removal, especially under winter conditions.
6.1.4.2 Clarifier Safety Factor
The clarifier safety factor (CSF) is defined as the ratio between the maximum settling velocity of the mixed liquor and the basin overflow rate. The purpose of maintaining a minimum clarifier safety factor is to prevent solids carryover in the effluent from the secondary clarifiers. A minimum CSF of 2.0 was selected for this analysis, with an additional safety factor of 15 percent under AADF to account for variability in sludge settling characteristics.
6.1.4.3 Effluent Characteristics
Effluent characteristics are also important criteria in determining the capacity of the secondary process. The governing criterion for this analysis was the effluent total nitrogen (TN), which is the sum of ammonia (NH3-N), nitrate (NO3-N), nitrite (NO2-N), and organic nitrogen. In the capacity evaluations reported in this technical memorandum, a maximum allowable total inorganic nitrogen (TIN) concentration of approximately 6 mg/L was selected. TIN includes ammonia, nitrate and nitrite nitrogen. This criterion allows the organic nitrogen concentration to reach approximately 2 mg/L before the effluent TN reaches the alert level of 8 mg/L. Typically, Aquifer Protection Permits stipulate TN limits and alert levels based on five-sample rolling geometric mean values.
In addition to the TN criterion, maximum effluent ammonia and nitrite concentrations of approximately 1.5 and 1.0 mg/L, respectively, were used as part of the evaluation. These concentrations are primarily controlled by the extent of nitrification occurring in the system. The most critical conditions are represented by maximum month loadings during spring

March 2, 2010 - DRAFT 2-28 pw://Carollo/Documents/Client/AZ/Sedona/8256A00/Deliverables/TM2 (Draft 3/2010)
conditions, which result in decreased aerobic SRT values (making nitrification during spring months the controlling factor).
6.1.5
The calibrated model was used to evaluate the performance of the secondary treatment process at the projected future loadings. Table 2.9 summarizes the model simulation results for different scenarios.
Model Results
6.1.5.1 Permitted Capacity with Existing Facilities
The two simulations presented under this scenario (annual average and maximum month loadings) are based on the permitted flow capacity of the WWRP - average monthly flow of 2.0 mgd. The model simulation results indicate that the treatment performance of the secondary treatment process will be compromised even with all the existing aeration basins and secondary clarifiers in service.
The primary limitation under this scenario is the low aerobic and total SRT of the system. The low aerobic SRT results in incomplete nitrification, as shown by the elevated effluent ammonia and nitrite concentrations.
Based on the target clarifier safety factor, the maximum allowable MLSS concentration in the aeration basins is on the higher end of typical MLSS concentrations for conventional activated sludge systems. Therefore, additional aeration basin capacity is likely required to achieve the additional SRT necessary to successfully and reliably perform nitrogen removal in the system.
The estimated blower capacity required under this scenario is also higher than the currently installed capacity. Under MMADF conditions, all three existing blower units would need to be in service, which would not allow for any redundancy in the aeration equipment.
6.1.5.2 Estimated Capacity Based on Existing Facilities
The AADF capacity of the existing WWRP is estimated to be 1.5 mgd based on current influent loadings. The two simulations presented under this scenario (annual average and maximum month loadings) are based on the estimated flow capacity of the WWRP - average monthly flow of 1.5 mgd. The model simulation results indicate that the performance of the secondary treatment process will be adequate to treat 1.5 mgd when all existing aeration basins and secondary clarifiers are in service.
The secondary clarification capacity under this scenario would support either a higher influent flow or a higher MLSS concentration in the aeration basins. However, for design purposes, it is standard practice to limit the MLSS concentration in the aeration basins to approximately 3,000 to 3,200 mg/L to minimize potential operational issues associated with higher MLSS concentrations. Therefore, the factor controlling the estimated capacity of the existing plant is the aeration basin volume.

March 2, 2010 - D
RAFT
2-29 pw://Carollo/Documents/Client/AZ/Sedona/8256A00/Deliverables/TM
2 (Draft 3/2010)
Table 2.9 Process Model Simulation Results Wastewater Reclamation Plant Evaluation City of Sedona, Arizona
Parameter Units
Original Design Conditions at
Permitted Capacity
Estimated Actual Conditions
Based on Existing Facilities
Conditions With Additional
Facilities to Meet Originally Permitted
Capacity
Loading Condition - Annual
Average Maximum
Month Annual
Average Maximum
Month Annual
Average Maximum
Month WWRP Capacity mgd 2.00 2.20 1.50 1.65 2.00 2.20 Aeration Basins Installed (in Service) # 4 (4) 4 (4) 4 (4) 4 (4) 5 (5) 5 (5) Mixed Liquor Suspended Solids (MLSS) mg/L 2,910 2,910 3,200 3,200 2,910 3,200 Aerobic Solids Retention Time days 5.52 3.42 8.86 5.43 7.27 5.03 Solids Retention Time days 8.34 5.17 13.38 8.22 10.99 7.60 Ammonia-Nitrogen (NH4-N) mg/L 1.06 1.77 0.47 0.55 0.63 0.64 Nitrate-Nitrogen (NO3-N) mg/L 3.12 1.82 3.90 4.24 3.68 4.10 Nitrite-Nitrogen (NO2-N) mg/L 0.43 1.96 0.12 0.21 0.19 0.27 Total Inorganic Nitrogen (TIN) mg/L 4.61 5.55 4.50 5.00 4.49 5.01 Total Nitrogen (TN) mg/L 7.47 8.65 7.28 8.02 7.30 8.04 Secondary Clarifiers Installed (in Service) # 2 (2) 2 (2) 2 (2) 2 (2) 3 (2) 3 (3) Clarifier Safety Factor - 2.3 2.1 2.7 2.5 2.3 2.8 Blowers Installed (in Service) # 3 (2) 3 (3) 3 (2) 3 (2) 4 (2) 4 (3) Required Blower Capacity , each scfm 1,200 1,200 900 1,300 1,200 1,200
March 2, 2010 - DRAFT 2-30 pw://Carollo/Documents/Client/AZ/Sedona/8256A00/Deliverables/TM2 (Draft 3/2010)
It should be noted that industry standard practice is to design secondary clarification facilities with a redundant secondary clarifier, under AADF loading conditions. The existing facilities do not provide such redundancy at the estimated AADF capacity of 1.5 mgd.
The estimated blower capacity required under this scenario is also adequate with the currently installed equipment. Under MMADF conditions, two of the existing blower units would need to be in service, leaving the third blower as a completely redundant unit.
6.1.5.3 Additional Facilities Required to Provide Original Design/Permitted Capacity
The two simulations presented under this scenario (annual average and maximum month loadings) are based on the permitted flow capacity of the WWRP, equivalent to an average monthly flow of 2.0 mgd. These simulations assume that one additional aeration basin, one additional secondary clarifier, and one additional blower are added to the existing WWRP to provide redundancy and operational flexibility. The model simulation results under these conditions indicate that the treatment performance of the secondary treatment process will be adequate under both AADF and MMADF conditions.
Redundancy under this scenario is based on industry standard practice of providing a redundant secondary clarifier under AADF loading conditions. However, based on the model simulations, all three secondary clarifiers are required to be in service under MMADF loading conditions.
The estimated blower capacity assumed under this scenario is consistent with the capacity of each of the existing units. Under MMADF conditions, three blower units would need to be in service. A (new) fourth blower is recommended to provide a redundant unit.
6.2 Tertiary Treatment Process Evaluation
6.2.1
Tertiary filtration was evaluated in terms of past solids removal performance and typical hydraulic loading criteria for traveling bridge filters. As discussed in Section 4.2, the solids and turbidity removal performance of the existing filters has generally been good, with a few notable exceptions.
Filtration
The hydraulic loading criteria for the existing traveling bridge filters is summarized in Table 2.10. The filter hydraulic loading at existing and projected future flows is well below typical hydraulic loading criteria. Typical design hydraulic loading rates for traveling bridge filters are 2.0 gpm/sf under average day flows, and 4.0 gpm/sf under peak day flows, with one unit out of service. The existing filters appear to have adequate capacity to meet Class A+ reclaimed water requirements.

March 2, 2010 - DRAFT 2-31 pw://Carollo/Documents/Client/AZ/Sedona/8256A00/Deliverables/TM2
Due to the occasional historical spikes in effluent turbidity, the addition of filter aid (polymer or alum) facilities will likely be required by ADEQ to ensure that Class A+ turbidity limits are consistently met. It should be noted that Class A+ indicates that facilities should include the ability to add filter aid to handle temporary increases in effluent turbidity and/or suspended solids concentrations. Table 2.10 Tertiary Filters Hydraulic Loading Criteria
Wastewater Reclamation Plant Evaluation City of Sedona, Arizona
Criteria Units Average Day Flow Peak Day Flow Total Number of Units - 4 4 Number of Units in Service - 3 3 Filtration Area in Service sf 972 972 Hydraulic Loading at Existing Flows Plant Flow mgd 1.13 1.70 Hydraulic Loading gpm/sf 0.81 (2) 1.21 (3) Hydraulic Loading at Permitted Flows Plant Flow mgd 2.00 3.00 Hydraulic Loading gpm/sf 1.43 (2) 2.14 (3) Notes(1) Existing filters have 324 sf per unit.
:
(2) Typical design hydraulic loading rates for traveling bridge filters at average day flows is 2.0 gpm/sf.
(3) Typical design hydraulic loading rates for traveling bridge filters at peak day flows is 4.0 gpm/sf.
6.2.2
6.2.2.1 Existing System
Disinfection
The original design peak flow capacity for the existing disinfection (UV) system is 2.0 mgd in Channel 1 and 1.8 mgd in Channel 2, providing a total capacity of 3.8 mgd. With the peak hour factor of 2.0 used for this analysis, the total average day flow capacity of the existing UV system is 1.9 mgd, based on the original design criteria. The disinfection capacity of Channel 2 was designed to be readily expandable to 2.0 mgd by adding 3 additional modules to the existing banks. Adding these modules would provide a total average annual day flow (AADF) capacity of 2.0 mgd combined in the two existing channels.
However, there is no redundancy provided in the existing disinfection system design. The original design assumed that both channels would be in service in order to achieve the effluent quality required to meet Class B+ standards at the plant design AADF capacity of 2.0 mgd.

March 2, 2010 - DRAFT 2-32 pw://Carollo/Documents/Client/AZ/Sedona/8256A00/Deliverables/TM2 (Draft 3/2010)
6.2.2.2 Required Upgrades
The existing disinfection system requires a significant upgrade to meet Class A+ disinfection standards at the plant’s permitted flow of 2 mgd (AADF). The specific UV System upgrades required to meet Class A+ disinfection standards are generally associated with increased UV dose and additional system redundancy. The existing disinfection equipment was sized using a design UV dose of 30 mJ/cm2. The UV dose is the product between the UV intensity and the exposure time of the fluid in the disinfection reactor. The design dose determines the specific log inactivation that can be achieved with a given system. For a given disinfection system, a higher inactivation rate requires a higher UV dose for a given flow. The existing disinfection system was designed to meet Class B+ effluent standards without redundancy. Consequently, a higher UV dose is required to meet Class A+ effluent standards for the same design flow. In addition, redundancy needs to be provided in order to consistently meet non-detect coliform counts (as required per Class A+ effluent standards), with one disinfection unit out of service.
6.2.2.3 NWRI Standards
The Trojan UV 3000 system at the Sedona WWRP was designed and installed before the National Water Research Institute (NWRI) 2003 Ultraviolet Disinfection Guidelines for Drinking Water and Water Reuse were developed and published. After publication, UV manufacturers performed the extensive third-party validation testing required in the guidelines. As a result of that validation testing, some UV manufacturers de-rated the capacity of their systems, including Trojan's UV 3000. While the NWRI guidelines are not formally adopted into the Arizona Administrative Code (A.A.C.) at this time, per the recommendation of the consultant and the direction of the City, this report evaluated the system capacity in relation to the NWRI (2003) guidelines’ recommended dose developed to maintain non-detect E. coli in the UV effluent.
6.2.2.4 Collimated Beam Testing
The NWRI guidelines (2003) recommend a dose of 100 mJ/cm2 as sufficient to meet Class A+ fecal coliform and E. coli requirements, if filtration is properly employed upstream of UV. Carollo's experience with various reclaimed water UV systems indicates that non-detect fecal coliform and E. coli counts can regularly be achieved with a UV dose between 35 and 75 mJ/cm2.
To assist in this evaluation, benchtop collimated beam UV testing was performed to determine a reasonable UV dose required to meet non-detect fecal coliform and E. coli standards for the Sedona WWRP effluent. The testing results were used to assist in the selection of the appropriate design dose for the Sedona WWRP disinfection system. Collimated beam testing results are included in Appendix 2B.

March 2, 2010 - DRAFT 2-33 pw://Carollo/Documents/Client/AZ/Sedona/8256A00/Deliverables/TM2
6.2.2.5 Design Criteria for Upgraded Disinfection System
Peak Flow. Ideally, the upgraded disinfection system should be capable of meeting the plant design peak flow of 4 mgd with full redundancy. However, analyses completed as part of this study showed that a third channel would be required to meet the plant design peak flow of 4 mgd, with the existing UV system equipment. Therefore, initial efforts were directed at maximizing the flow capacity of the existing channels with an upgraded UV disinfection system.
Redundancy. Full redundancy is recommended for the disinfection system. Redundancy is critical to handle events when equipment fails or needs to be removed for major repair or maintenance. Redundancy can be achieved by redundant trains or by redundant equipment in each train. The best method to achieve redundancy ultimately depends on the layout of the disinfection equipment. For the Sedona WWRP, a redundant train is the best alternative based on the potential layouts in the existing concrete channels.
Design Dose. The NWRI guidelines recommend a dose of 100 mJ/cm2 in applications after media filtration. The Arizona Administrative Code (A.A.C.) has not yet adopted the NWRI guidelines as standards, nor does the A.A.C. recommend a specific UV dose. The collimated beam testing results on Sedona WWRP effluent showed that UV doses as low as 10 mJ/cm2 may be sufficient to achieve non-detect fecal coliforms in the existing filter effluent. However, it is important to note that the collimated beam tests are based on only two grab samples. In addition, current plant performance may not be an ideal indicator of future plant performance as the existing unit processes are significantly underloaded at the WWRP current flows. Therefore, the design UV dose needs to account for possible changes in the filter effluent quality, future performance, and be within current standard practices for reclaimed water disinfection. Finally, when establishing the design dose for the UV system, it is important that the UV system manufacturer guarantees compliance with Class A+ disinfection requirements at the specific conditions for the Sedona WWRP. Consequently, Carollo worked closely with Trojan to determine an acceptable UV dose for the specific application.
Based on the NWRI recommended dose, the limited sample size of the collimated beam testing, and the current underloading of the WWRP, the team agreed to base this preliminary evaluation on a design dose of 100 mJ/cm2. While this dose is conservative when compared to the actual testing data for the WWRP, it is consistent with the performance guarantee from Trojan, meets or exceeds the design dose for similar UV installations throughout the state, and provides the City with a degree of future flexibility. Should the actual system performance after installation exceed the design criteria, additional disinfection capacity may be available without requiring additional UV equipment.
UV Transmittance. Another critical component to the treatment capacity of the disinfection system is the UV transmittance (UVT) value of the filter effluent. Based on the testing performed on the Sedona WWRP filter effluent, UVT values were 71 and 74 percent in the
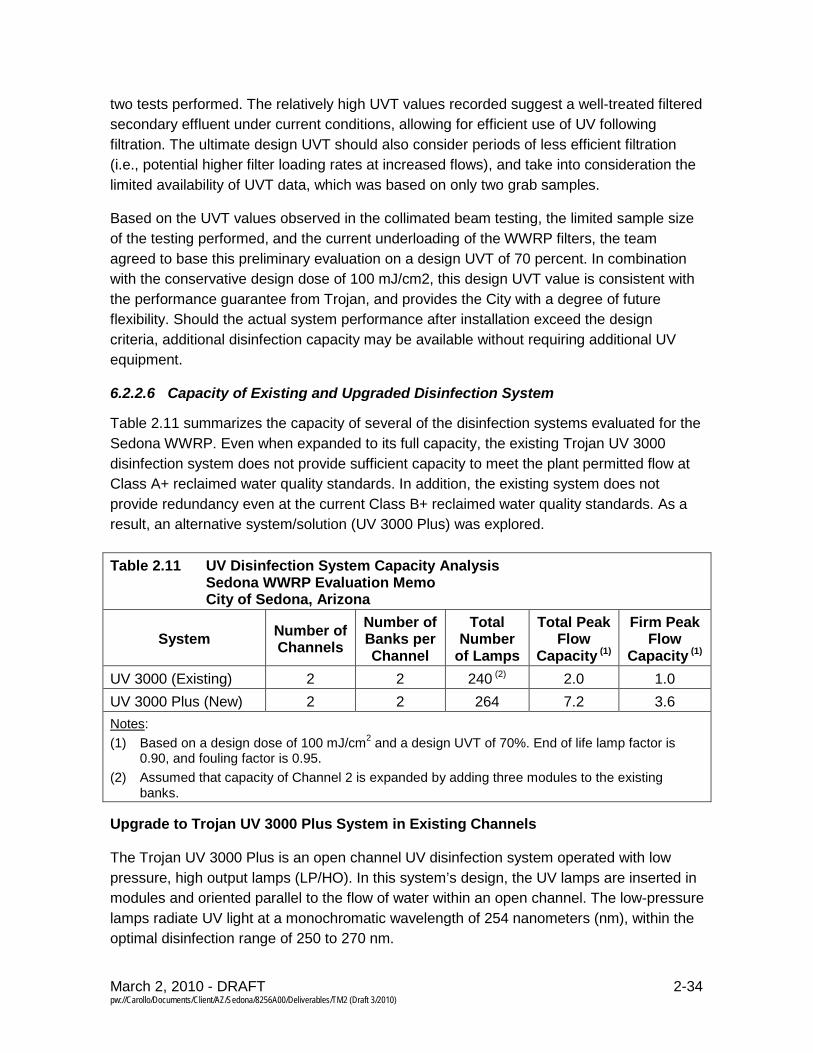
March 2, 2010 - DRAFT 2-34 pw://Carollo/Documents/Client/AZ/Sedona/8256A00/Deliverables/TM2 (Draft 3/2010)
two tests performed. The relatively high UVT values recorded suggest a well-treated filtered secondary effluent under current conditions, allowing for efficient use of UV following filtration. The ultimate design UVT should also consider periods of less efficient filtration (i.e., potential higher filter loading rates at increased flows), and take into consideration the limited availability of UVT data, which was based on only two grab samples.
Based on the UVT values observed in the collimated beam testing, the limited sample size of the testing performed, and the current underloading of the WWRP filters, the team agreed to base this preliminary evaluation on a design UVT of 70 percent. In combination with the conservative design dose of 100 mJ/cm2, this design UVT value is consistent with the performance guarantee from Trojan, and provides the City with a degree of future flexibility. Should the actual system performance after installation exceed the design criteria, additional disinfection capacity may be available without requiring additional UV equipment.
6.2.2.6 Capacity of Existing and Upgraded Disinfection System
Table 2.11 summarizes the capacity of several of the disinfection systems evaluated for the Sedona WWRP. Even when expanded to its full capacity, the existing Trojan UV 3000 disinfection system does not provide sufficient capacity to meet the plant permitted flow at Class A+ reclaimed water quality standards. In addition, the existing system does not provide redundancy even at the current Class B+ reclaimed water quality standards. As a result, an alternative system/solution (UV 3000 Plus) was explored. Table 2.11 UV Disinfection System Capacity Analysis
Sedona WWRP Evaluation Memo City of Sedona, Arizona
System Number of Channels
Number of Banks per Channel
Total Number
of Lamps
Total Peak Flow
Capacity (1)
Firm Peak Flow
Capacity (1) UV 3000 (Existing) 2 2 240 (2) 2.0 1.0 UV 3000 Plus (New) 2 2 264 7.2 3.6 Notes(1) Based on a design dose of 100 mJ/cm2 and a design UVT of 70%. End of life lamp factor is
0.90, and fouling factor is 0.95.
:
(2) Assumed that capacity of Channel 2 is expanded by adding three modules to the existing banks.
Upgrade to Trojan UV 3000 Plus System in Existing Channels
The Trojan UV 3000 Plus is an open channel UV disinfection system operated with low pressure, high output lamps (LP/HO). In this system’s design, the UV lamps are inserted in modules and oriented parallel to the flow of water within an open channel. The low-pressure lamps radiate UV light at a monochromatic wavelength of 254 nanometers (nm), within the optimal disinfection range of 250 to 270 nm.
March 2, 2010 - DRAFT 2-35 pw://Carollo/Documents/Client/AZ/Sedona/8256A00/Deliverables/TM2
One advantage of the Trojan UV 3000 Plus system is that it provides a level of familiarity for plant operations staff, based on their experience with the existing UV 3000 system. Another advantage of this system is that the low-pressure lamps consume less energy than systems using medium-pressure lamps, which results in energy cost savings. However, because the lamps are low pressure, more lamps are needed to achieve the required design dose, which can result in a larger footprint and higher capital costs in new installations. Another advantage to the UV 3000 Plus system is that it includes an automated cleaning system for the associated lamps.
A new UV 3000 Plus system can be retrofitted in the two existing concrete channels at the Sedona WWRP. Flow control through the Trojan UV 3000 Plus system is achieved by a weighted gate weir at the end of the channel to maintain a constant water surface elevation. A 6-lamp-per-module system will fit in the existing channels, but the ballasts would be approximately 2 inches above the floor level. The ballasts are designed to allow operators to walk on top of them.
The new equipment for the Trojan UV 3000 Plus system in the existing channels would include:
• Four banks (2 banks per channel)
• 44 modules (11 modules per bank)
• 264 lamps (6 lamps per module)
The total peak flow capacity of a new UV 3000 Plus system in the existing channels would be approximately 7.2 mgd based on the design criteria outlined in this report. With one channel out of service, the firm peak flow capacity would be approximately 3.6 mgd. The firm peak flow capacity translates to an average day flow of 1.8 mgd, which is 90 percent of the plant’s current permitted capacity. The proposal received from Trojan outlining the UV 3000 Plus equipment is included in Appendix 2C.
If the City believes it is critical to ensure a full 2.0 mgd (AADF) of capacity immediately, alternatively, a third UV channel could be added. However, a third channel would require significantly more civil and structural work, which would increase the cost of the project for a marginal increase in plant capacity. Therefore, we recommend retrofitting the existing channels with the maximum number of lamps possible, which could provide a plant AADF capacity of 1.8 mgd with full redundancy at a Class A+ disinfection level.
6.3 Preliminary Plant Upgrades Cost Estimates
Table 2.12 provides a summary of the preliminary estimated costs associated with the various proposed plant upgrades. It is important to note that the cost estimates presented were prepared with minimal engineering data and were based on preliminary planning level concepts for each of the proposed upgrades. At this conceptual level, the expected accuracy for the associated estimates is within +50 percent to -30 percent.

March 2, 2010 - DRAFT 2-36 pw://Carollo/Documents/Client/AZ/Sedona/8256A00/Deliverables/TM2 (Draft 3/2010)
It should be noted that Carollo has no control over the cost of labor, materials, equipment, or services furnished by others, or over a Contractor's methods of determining prices, or other competitive bidding or market conditions, practices, or bidding strategies. Cost estimates provided as part of this tech memo are Carollo’s opinion based on experience and judgment and do NOT include engineering or construction administration and inspection services costs. Carollo cannot and does not guarantee that proposals, bids, or actual project construction costs will not vary from cost estimates prepared. Table 2.12 Preliminary Cost Estimates
Sedona WWRP Evaluation Memo City of Sedona, Arizona
Description Cost Estimate Aeration Basin(1) $1.6M Secondary Clarifier(1) $2.5M Aeration Blower(2) $400,000 Polymer Filter Aid Feed System(3) $290,000 UV System Upgrades(3) $1.5M Total $6.3M Notes(1) Cost estimates are based on previous similar Carollo projects at current conditions and at this
location. The estimate reflects Carollo’s professional opinion of costs at this time and is subject to change based on more defined/modified system information and criteria.
:
(2) Costs for new aeration blowers are based on replacement of existing centrifugal blowers with new Turbo Blowers as outlined in the Potential Ancillary WWRP Upgrades Memorandum.
(3) Cost estimate is based on manufacturer’s preliminary proposal with contingencies for installation and other potential unforeseen requirements.
7.0 PROCESS EVALUATION SUMMARY The Sedona WWRP is currently designed and permitted to produce Class B+ quality reclaimed water. The evaluation presented in this report identifies the plant process areas that require improvements to produce Class A+ reclaimed water quality at the rated plant capacity of 2.0 mgd. The main water quality requirements that establish Class A+ reclaimed water standards include:
• Total nitrogen less than 10 mg/L,
• Daily average turbidity l than 2 NTU, and instantaneous maximum less than 5.0 NTU, and
• Non-detect fecal coliform counts in 4 out of 7 samples, with a single sample maximum of 23 MPN/100 mL.

March 2, 2010 - DRAFT 2-37 pw://Carollo/Documents/Client/AZ/Sedona/8256A00/Deliverables/TM2
Based on a detailed evaluation of historical plant performance and simulated plant performance predictions at future flows and loadings, the following conclusions can be drawn from this WWRP evaluation:
• The biological nutrient removal process is adequate to meet a total nitrogen limit of 10 mg/L. However, the existing facilities would NOT provide redundancy or operational flexibility under high flow conditions. Additional aeration basin, secondary clarification, and blower capacity are required to consistently meet the total nitrogen limit and/or provide required redundancy at annual average daily flows above 1.5 mgd (and may be required by ADEQ based on revised loading information).
• The existing traveling bridge filters are adequately sized to handle the plant’s permitted average day flow of 2.0 mgd and a peak day flow of 3.0 mgd. Additional filter aid (polymer) facilities are recommended to handle occasional spikes in turbidity and suspended solids, and would likely be required by ADEQ as part of the permitting process.
• A significant upgrade of the UV disinfection system is required to meet Class A+ reclaimed water quality standards at the plant’s permitted average flow of 2.0 mgd. The existing system does not provide sufficient peak flow capacity at the design UV dose required to achieve non-detect fecal coliform counts. The recommended strategy includes upgrading the existing UV disinfection system to a new Trojan UV 3000 Plus system, using the existing channels. This configuration will provide an average disinfection flow capacity of 1.8 mgd, with complete redundancy, based on the results of bench-scale testing, industry best practices and manufacturer performance guarantee information.
March 2, 2010 - DRAFT 2-38 pw://Carollo/Documents/Client/AZ/Sedona/8256A00/Deliverables/TM2 (Draft 3/2010)
This Page Intentionally Left Blank
pw://Carollo/Documents/Client/AZ/Sedona/8256A00/Deliverables/TM2 (Draft 3/2010)
Appendix 2A WWRP PROCESS DATA GRAPHS

pw://Carollo/Documents/Client/AZ/Sedona/8256A00/Deliverables/TM2
This Page Intentionally Left Blank

600
800
1,000
1,200
1,400
once
ntra
tion,
mg/
LInfluent Chemical Oxygen Demand
COD
Avg COD
Max Month CODAvg + 2SD
0
200
400
May-07 Jul-07 Oct-07 Jan-08 Apr-08 Jul-08 Oct-08 Jan-09 Apr-09
CO
D C
o

1 000
1,500
2,000
2,500
3,000
Con
cent
ratio
n, m
g/L
Influent Total Suspended Solids
TSS
Avg TSS
Max Month TSS
Avg + 2SD
0
500
1,000
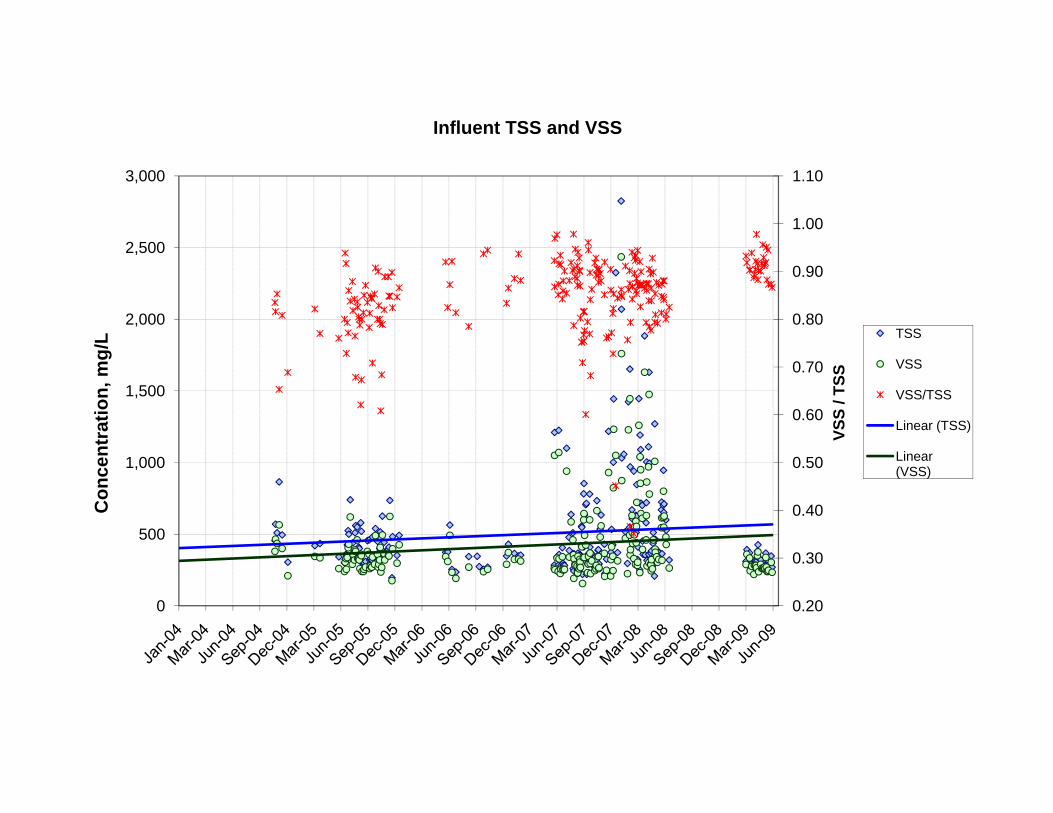
1.103,000
Influent TSS and VSS
0.90
1.002,500
0.70
0.802,000
SSmg/
L TSS
VSS
0.50
0.60
1,000
1,500
VSS
/ TS
cent
ratio
n,
VSS/TSS
Linear (TSS)
Linear (VSS)
0.30
0.40500
Con
c (VSS)
0.200

16
18
20
22
24
26
28
30
empe
ratu
re, d
eg. C
Influent Temperature
Daily Temperature
30-day Average Temperature
10
12
14
16Te

1.118,000
Mixed Liquor Suspended Solids
0 8
0.9
1.0
14,000
16,000
0 6
0.7
0.8
10,000
12,000
Rat
io
n, m
g/L
MLSS
0.4
0.5
0.6
6,000
8,000
SS /
MLS
S R
ncen
trat
ion MLSS
MLVSSVSS / SS
0.2
0.3
2,000
4,000
MLV
S
MLS
S co
n
0.10

140,000Waste Activated Sludge
100 000
120,000
me
(gal
)
80,000
100,000
Dai
ly V
olum
TSS
40 000
60,000
(mg/
L) a
nd
VOLUME
20,000
40,000
WA
S TS
S (
0

12,000
Waste Activated Sludge Solids
10,000
8,000
b/da
y)
4,000
6,000
WA
S TS
S (lb
2,000
W
0

pw://Carollo/Documents/Client/AZ/Sedona/8256A00/Deliverables/TM2
This Page Intentionally Left Blank

pw://Carollo/Documents/Client/AZ/Sedona/8256A00/Deliverables/TM2 (Draft 3/2010)
Appendix 2B COLLIMATED BEAM TESTING RESULTS

pw://Carollo/Documents/Client/AZ/Sedona/8256A00/Deliverables/TM2
This Page Intentionally Left Blank

CERTIFICATE OF ANALYSISFinal Report
TROJAN UWATER CONFIDENCF
Project Name: City of Sedona WWTPContact: Kelly ParlinAddress:
Telephone:Email:
City of Sedona WWTP102 Road Runner DrSedona AZ 86336
Trojan Sales:Local Trojan Rep:Engineer:
Sample #:
Jordan Foumier
09-0658
COLLIMATED BEAM RESULTS
DESCRIPTION OF ANALYSES%T (Percent Transmittance)The percentage of germicidal UV light that is able to penetrate through 1cm sample of water measure with a Trojan UVat 254nm. The higher the %T value measured the more effective a UV system Will be. %T can be reduced by iron,humic acids.%T Filtered (Percent Transmittance) - The percentage of germicidal UV light that is able to penetrate through a sample of water after ithas passed through a 1 .2pm Glass Fiber Filter.Total Suspended Solids (TSS in PPM — Parts-Per-Million or mg/L — milligrams per Liter) - The weight measurement of all suspendedmatter larger than 1 .2pm for a predetermined volume of water.Collimated Beam - Determines the UV dose necessary to disinfect wastewater effluent to legislated permit levels or lower for specifiedtarget microorganisms.
Comments:
*Contacted Kelly Parli , the site’s lab personnel. According to her, the low fecal counts are typical in the wastewater of this site.
If ied by B ianValidation & Research Services Manager
(928) 204 2234
Received DateiTime: September 02, 2009 1:30 pm Treatment Process: Activated SludgeAnalysis Date: September 02, 2009 Weather Conditions: ClearRelease Date: September 04, 2009 Disinfection Limit: 1000 FC/100 mL
SAMPLE RECEIVED FLOW %T TSSLAB SAMPLE NO. SAMPLE IDENTIFICATION DATEII1ME TEMP. RATE %T FILT. PPM
(MIDIY) (°C) (MGD) (1.2pm)
09-0658 CB sample %?~°5t~ 17.0 1.1 71 71 1.4
Dose 09458(inWslcm2) E. collllOOmL
0 2115 <210 <220 <240 <280 <2
Photometer (Blue Box)organic dyes, tannins,
TROJAN TECHNOLOGIES 3020 GORE ROAD. LONDON, ONTARIO, CANADA N5V 4T7 T 519.457.3400 F 519.457.3030 WWW.TROJANUV.COM

City of Sedona, AZConventional Activated Sludge
10000 September01, 2009
7I%UVT, 71%UVTtiI, 1.4ppm TSS
— Disinfection Limit -1000 Cf u/i OOmL
1000
-JECC
1000U
U0U
10~
1~ I 4
0 10 20 30 40 50 60 70 80UV Dose (mWslcm2)
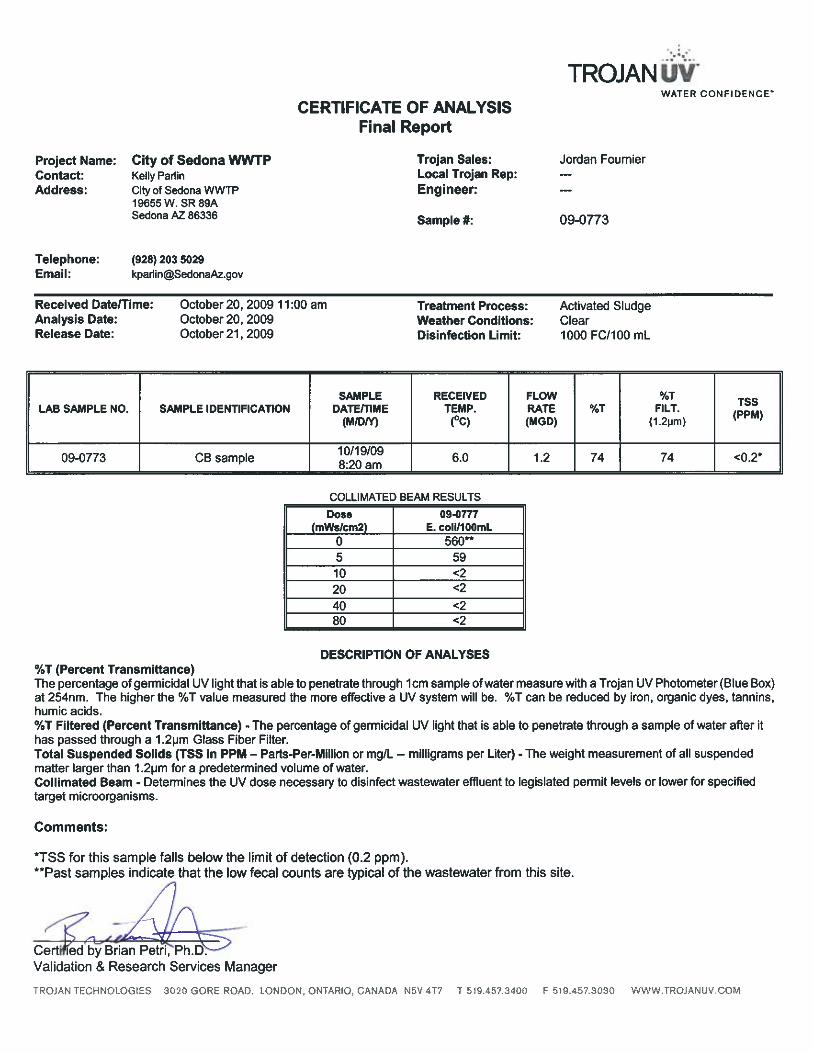
TROJANWATER CONFIDENCE
CERTIFICATE OF ANALYSISFinal Report
Project Name: City of Sedona WWTP Trojan Sales: Jordan FoumierContact: Kelly Parlin Local Trojan Rep:Address: City of Sedona WWTP Engineer:
19655W. SR 89ASedona AZ 86336 Sample #: 09-0773
Telephone: (928) 203 5029Email: kparIin~SedonaAz.gov
Received DatelTime: October20, 200911:00 am Treatment Process: Activated SludgeAnalysis Date: October 20, 2009 Weather Conditions: ClearRelease Date: October 21, 2009 Disinfection Limit: 1000 FC/100 mL
SAMPLE RECEIVED FLOW %T TSSLAB SAMPLE NO. SAMPLE IDENTIFICATION DATEJTIME TEMP. RATE %T FILT. (PPM)
(MIDrY) (°C) (MGD) (12pm)
09-0773 CB sample 6.0 1.2 74 74
COLLIMATED BEAM RESULTSDose 09477?
(mWslcm2) E. coIiIlOOmL0 560~5 5910 <220 <240 <280 <2
DESCRIPTION OF ANALYSES%T (Percent Transmittance)The percentage of germicidal UV light that is able to penetrate through 1cm sample of water measure With a Trojan UV Photometer (Blue Box)at 254nrn. The higher the %T value measured the more effective a UV system will be. %T can be reduced by iron, organic dyes, tannins,humic acids.%T Filtered (Percent Transmittance) - The percentage of germicidal UV light that is able to penetrate through a sample of water after ithas passed through a 1.2pm Glass Fiber Filter.Total Suspended Solids (TSS in PPM — Parts-Per-Million or mgIL — milligrams per Liter) - The weight measurement of all suspendedmatter larger than 1 .2pm for a predetermined volume of water.Collimated Beam - Determines the UV dose necessary to disinfect wastewater effluent to legislated permit levels or lower for specifiedtarget microorganisms.
Comments:
tTSS for this sample falls below the limit of detection (0.2 ppm).**Past samples indicate that the low fecal counts are typical of the wastewater from this site.
24Cert red by Brian Petri, Ph.D.Validation & Research Services Manager
TROJAN TECHNOLOGIES 3020 GORE ROAD. LONDON, ONTARIO CANADA N~V4T7 T 519.45?.3400 F 519.457.3030 WWW.TROJANUV.COM

City of Sedona, AZConventional Activated Sludge
October 19, 2009i0000•
74%UVT, 74%UVTfiI, <O.2ppm TSS
— Disinfection Limit -1000 Cfu/i OOmL
1000•
-JE0
100•0U
UC)
LI~
10
1 4 p p
0 10 20 30 40 50 60 70 80UV Dose (mWslcm2)

pw://Carollo/Documents/Client/AZ/Sedona/8256A00/Deliverables/TM2 (Draft 3/2010)
Appendix 2C UV SYSTEM UPGRADE PROPOSAL

pw://Carollo/Documents/Client/AZ/Sedona/8256A00/Deliverables/TM2
This Page Intentionally Left Blank

PROPOSAL FOR THE CITY OF SEDONA, AZ QUOTE: LHJ1147C 11/23/2009
The TrojanUV3000Plus™ is operating in over 750 municipal wastewater plants around the world.
Disinfecting over 7 billion gallons a day, the TrojanUV3000Plus™ has become the reference standard in the industry.

Sedona LHJ1147C 11/23/2009
- 2 -
November 23, 2009 Carollo Engineers 3033 N 44th St. Suite 101 Phoenix, AZ 85018 US Attention: Carlos Lopez In response to your request, we are pleased to provide the following TrojanUV3000Plus™ proposal for the Sedona project. The TrojanUV3000Plus
TM has been shown in over 750 installations to provide dependable performance,
simplified maintenance, and superior electrical efficiency. As explained in this proposal, the system incorporates innovative features to reduce O&M costs, including variable output electronic ballasts to provide dimming capability and Trojan’s revolutionary ActiClean
TM system – the industry’s only online chemical and mechanical
quartz sleeve cleaning system. All Trojan installations are supported by a global network of certified Service Representatives providing local service and support. Please do not hesitate to call us if you have any questions regarding this proposal. Thank you for the opportunity to quote the TrojanUV3000Plus™ and we look forward to working with you on this project. With best regards, Jordan Fournier 3020 Gore Road London, Ontario N5V 4T7 Canada (519) 457 – 3400 ext. 2193 [email protected]
Local Representative: Jason Vernon The Coombs-Hopkins Company 668 North 44th Street Suite 251, Phoenix, AZ 85008 USA (602) 275-4303
DESIGN CRITERIA SEDONA
Peak Design Flow: 3.61 MGD (utilizing Carollo speficied 0.90 EOLL) 4.05 MGD (utilizing third party validated 0.98 EOLL)
UV Transmittance: 70% (minimum)
Total Suspended Solids: 5 mg/l (Maximum, grab sample)
Disinfection Limit: 23 fecal coliform per 100 ml, based on a 1 day Maximum, 4 of 7 nondetect of consecutive daily grab samples
Design Dose: 100,000 µWs/cm2, bioassay validated per NWRI protocol
Validation Factors: 0.98 end of lamp life factor CA DHS approved (LP Amalgam Lamps) 0.95 fouling factor CA DHS approved (ActiClean™ Chemical / Mechanical Cleaning System)
Redundancy: 100%
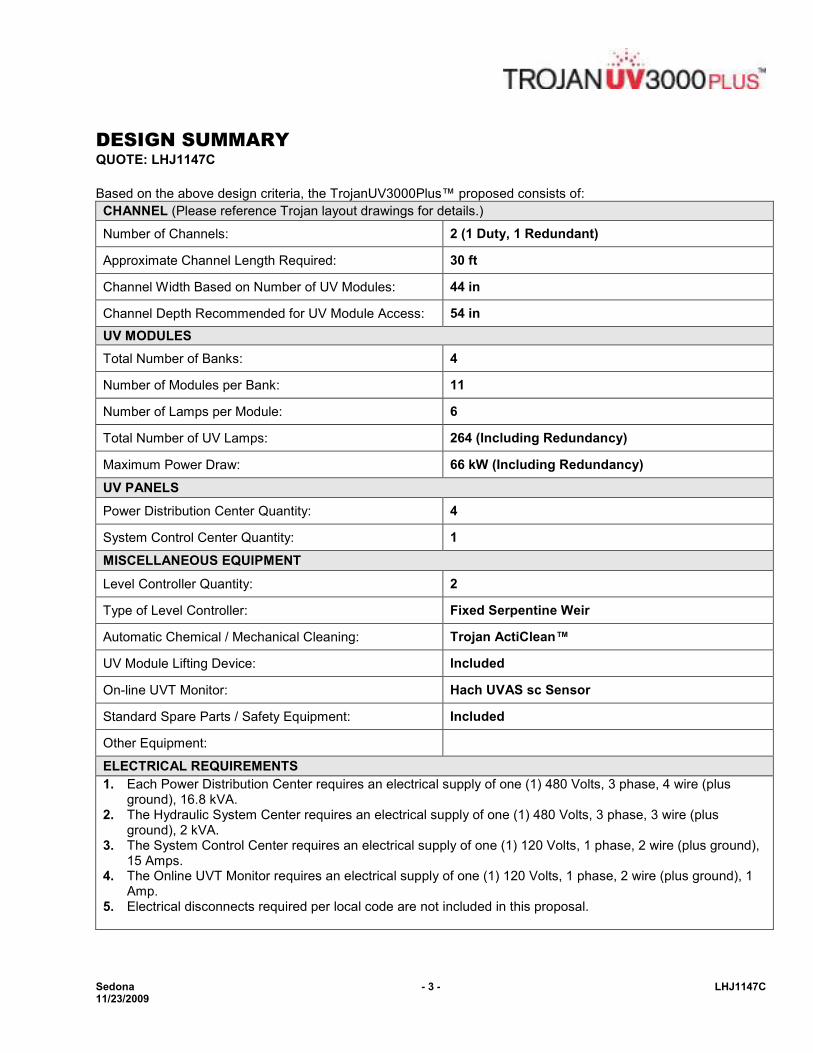
Sedona LHJ1147C 11/23/2009
- 3 -
DESIGN SUMMARY QUOTE: LHJ1147C
Based on the above design criteria, the TrojanUV3000Plus™ proposed consists of:
CHANNEL (Please reference Trojan layout drawings for details.)
Number of Channels: 2 (1 Duty, 1 Redundant)
Approximate Channel Length Required: 30 ft
Channel Width Based on Number of UV Modules: 44 in
Channel Depth Recommended for UV Module Access: 54 in
UV MODULES
Total Number of Banks: 4
Number of Modules per Bank: 11
Number of Lamps per Module: 6
Total Number of UV Lamps: 264 (Including Redundancy)
Maximum Power Draw: 66 kW (Including Redundancy)
UV PANELS
Power Distribution Center Quantity: 4
System Control Center Quantity: 1
MISCELLANEOUS EQUIPMENT
Level Controller Quantity: 2
Type of Level Controller: Fixed Serpentine Weir
Automatic Chemical / Mechanical Cleaning: Trojan ActiClean™
UV Module Lifting Device: Included
On-line UVT Monitor: Hach UVAS sc Sensor
Standard Spare Parts / Safety Equipment: Included
Other Equipment:
ELECTRICAL REQUIREMENTS
1. Each Power Distribution Center requires an electrical supply of one (1) 480 Volts, 3 phase, 4 wire (plus ground), 16.8 kVA.
2. The Hydraulic System Center requires an electrical supply of one (1) 480 Volts, 3 phase, 3 wire (plus ground), 2 kVA.
3. The System Control Center requires an electrical supply of one (1) 120 Volts, 1 phase, 2 wire (plus ground), 15 Amps.
4. The Online UVT Monitor requires an electrical supply of one (1) 120 Volts, 1 phase, 2 wire (plus ground), 1 Amp.
5. Electrical disconnects required per local code are not included in this proposal.

Sedona LHJ1147C 11/23/2009
- 4 -
COMMERCIAL INFORMATION
Total Capital Cost: $667,900 (US$)
This price excludes any taxes that may be applicable and is valid for 90 days from the date of this letter.
OPERATING COST ESTIMATE
Operating Conditions Average Flow: 1.37 MGD Yearly Usage: 8760 hours UV Transmittance: 70%
Power Requirements Lamp Replacement
Average Power Draw: 15.8 kW Number lamps per year: 48
Cost per kW hour: $0.10 Price per lamp: $260
Annual Power Cost: $13,841 Annual Lamp Replacement Cost:
$12,480
Total Annual O&M Cost: $26,321
This cost estimate is based on the average flow and UV transmittance listed above. Actual operating costs may be lower due to the TrojanUV3000Plus™ automatic dose pacing control system. As UV demand decreases, by a change in operating conditions, the power level of the lamps decreases accordingly. The dose pacing system minimizes equipment power levels while the target UV dose is maintained to ensure disinfection at all times.
EQUIPMENT WARRANTEES
1. Trojan Technologies warrants all components of the system (excluding UV lamps) against faulty workmanship
and materials for a period of 12 months from date of start-up or 18 months after shipment, which ever comes first.
2. UV lamps purchased are warranted for 9,000 hours of operation or 3 years from shipment, whichever comes first. If a lamp fails prior to 9,000 hours of use, a new lamp is provided at no charge.
3. Electronic ballasts are warranted for 5 years, pro-rated after 1 year.

