city of vancouver civic service satisfaction survey › files › cov › 2018-civic-service...this...
TRANSCRIPT
© 2018 Ipsos
© 2018 Ipsos. All rights reserved. Contains Ipsos' Confidential and Proprietary information and may not be disclosed or reproduced without the prior written consent of Ipsos.
Civic Service Satisfaction Survey FINAL REPORT SUMMARY
City of Vancouver

© 2018 Ipsos 2
INTRODUCTION Background, Objectives and Methodology

© 2018 Ipsos 3
INTRODUCTION Background and Objectives This report presents the findings of the City of Vancouver’s 2018 Civic Service Satisfaction Survey.
The primary objective of the survey is to obtain Vancouver residents and businesses’ feedback on municipal services and the value they perceive they are receiving from the City.
Key survey topics included:
• Important local issues
• Quality of life
• City services (satisfaction, level of investment)
• Value for taxes
Where appropriate, the City of Vancouver’s results have been compared to Ipsos’ municipal norms to provide a benchmark against which the City can evaluate its performance. These norms are based on research Ipsos has conducted in other Canadian municipalities within the past five years. Normative comparisons are available for residents only.
Due to changes in methodology and questionnaire design, this year’s survey results cannot be compared to similar prior surveys.
© 2018 Ipsos 4
INTRODUCTION Methodology (page 1 of 2)
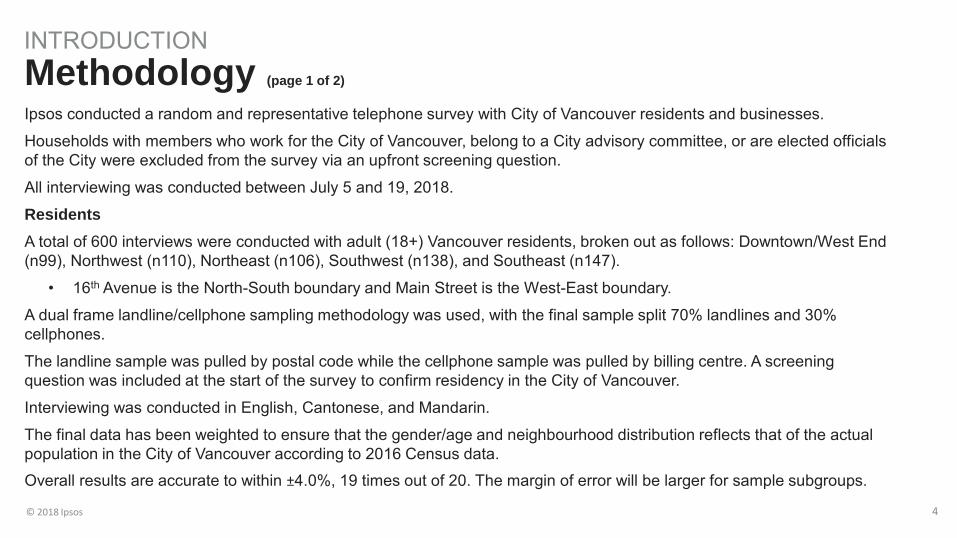
Ipsos conducted a random and representative telephone survey with City of Vancouver residents and businesses.
Households with members who work for the City of Vancouver, belong to a City advisory committee, or are elected officials of the City were excluded from the survey via an upfront screening question.
All interviewing was conducted between July 5 and 19, 2018.
Residents A total of 600 interviews were conducted with adult (18+) Vancouver residents, broken out as follows: Downtown/West End (n99), Northwest (n110), Northeast (n106), Southwest (n138), and Southeast (n147).
• 16th Avenue is the North-South boundary and Main Street is the West-East boundary.
A dual frame landline/cellphone sampling methodology was used, with the final sample split 70% landlines and 30% cellphones.
The landline sample was pulled by postal code while the cellphone sample was pulled by billing centre. A screening question was included at the start of the survey to confirm residency in the City of Vancouver.
Interviewing was conducted in English, Cantonese, and Mandarin.
The final data has been weighted to ensure that the gender/age and neighbourhood distribution reflects that of the actual population in the City of Vancouver according to 2016 Census data.
Overall results are accurate to within ±4.0%, 19 times out of 20. The margin of error will be larger for sample subgroups.
© 2018 Ipsos 5
INTRODUCTION Methodology (page 2 of 2)
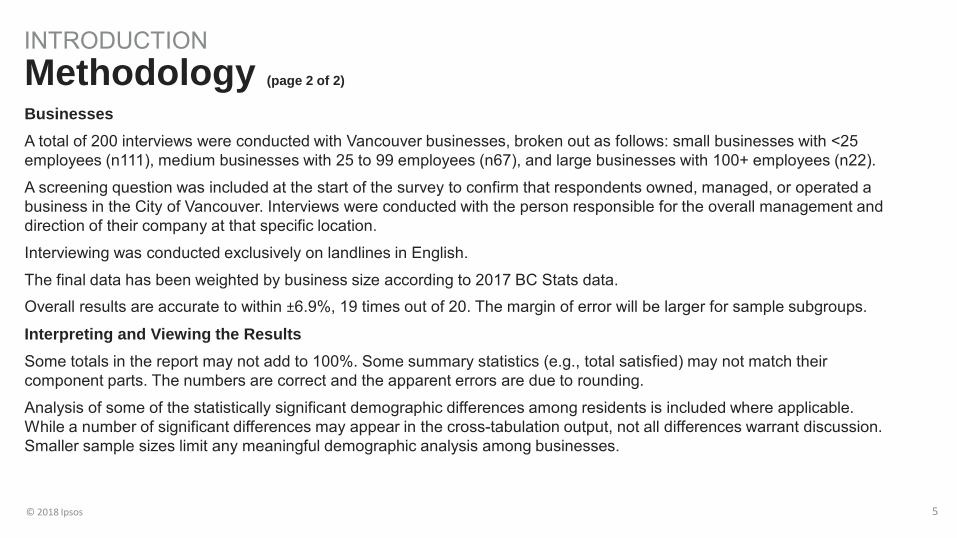
Businesses A total of 200 interviews were conducted with Vancouver businesses, broken out as follows: small businesses with <25 employees (n111), medium businesses with 25 to 99 employees (n67), and large businesses with 100+ employees (n22).
A screening question was included at the start of the survey to confirm that respondents owned, managed, or operated a business in the City of Vancouver. Interviews were conducted with the person responsible for the overall management and direction of their company at that specific location.
Interviewing was conducted exclusively on landlines in English.
The final data has been weighted by business size according to 2017 BC Stats data.
Overall results are accurate to within ±6.9%, 19 times out of 20. The margin of error will be larger for sample subgroups.
Interpreting and Viewing the Results Some totals in the report may not add to 100%. Some summary statistics (e.g., total satisfied) may not match their component parts. The numbers are correct and the apparent errors are due to rounding.
Analysis of some of the statistically significant demographic differences among residents is included where applicable. While a number of significant differences may appear in the cross-tabulation output, not all differences warrant discussion. Smaller sample sizes limit any meaningful demographic analysis among businesses.

© 2018 Ipsos 6
EXECUTIVE SUMMARY
© 2018 Ipsos 7
Executive Summary Summary of Results (page 1 of 2)
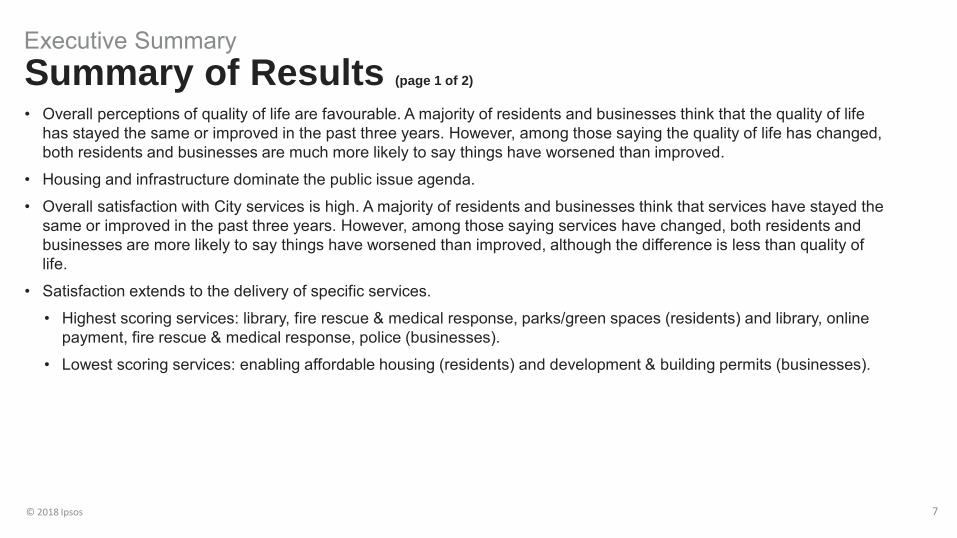
• Overall perceptions of quality of life are favourable. A majority of residents and businesses think that the quality of life has stayed the same or improved in the past three years. However, among those saying the quality of life has changed, both residents and businesses are much more likely to say things have worsened than improved.
• Housing and infrastructure dominate the public issue agenda.
• Overall satisfaction with City services is high. A majority of residents and businesses think that services have stayed the same or improved in the past three years. However, among those saying services have changed, both residents and businesses are more likely to say things have worsened than improved, although the difference is less than quality of life.
• Satisfaction extends to the delivery of specific services.
• Highest scoring services: library, fire rescue & medical response, parks/green spaces (residents) and library, online payment, fire rescue & medical response, police (businesses).
• Lowest scoring services: enabling affordable housing (residents) and development & building permits (businesses).
© 2018 Ipsos 8
Executive Summary Summary of Results (page 2 of 2)
• Respondents think the City should invest more or the same (not less) in all the tested services. Top investment priorities include:
• Residents: enabling affordable housing, social policies & projects, and homelessness services. Transportation infrastructure places fourth.
• Businesses: street infrastructure, development & building permits, and keeping our community clean.
• The majority of respondents say they receive good value for their municipal tax dollars.

© 2018 Ipsos 9
QUALITY OF LIFE
© 2018 Ipsos 10
Quality of Life Section Summary (slide 1 of 2)
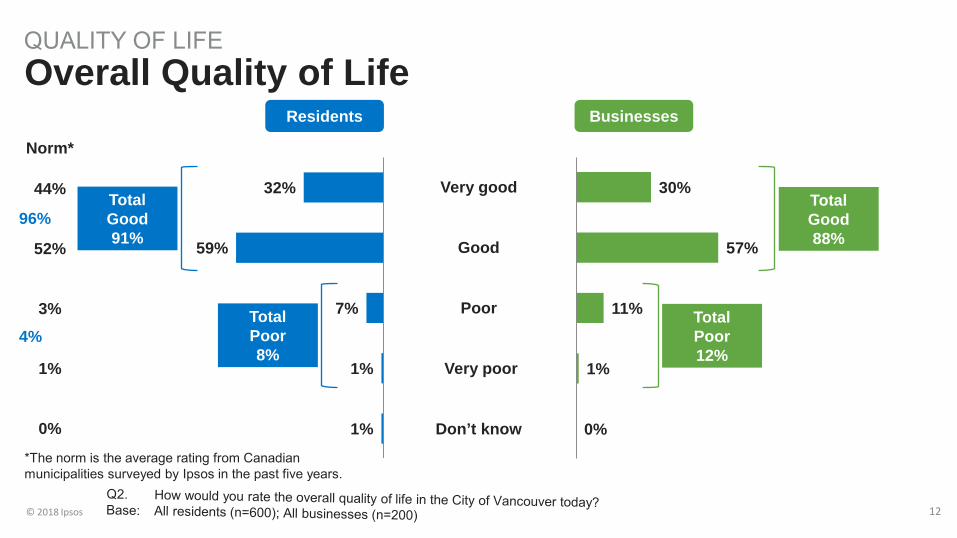
Overall perceptions of Vancouver’s quality of life are favourable although lower than the norm. Overall, 91% of residents and 88% of businesses rate the quality of life in Vancouver today as ‘very good’ or ‘good’. In comparison, the normative resident score is 96% total good.
• Residents’ overall perceptions (combined ‘very good/good’ ratings) of Vancouver’s quality of life are consistent across all key demographic subgroups.
• However, some differences are seen in the intensity of ratings, with higher ‘very good’ scores reported by homeowners (36% vs. 27% of renters) and those with household incomes of $100K+ (39% vs. 27% of <$60K, 28% of $60K-<$100K).
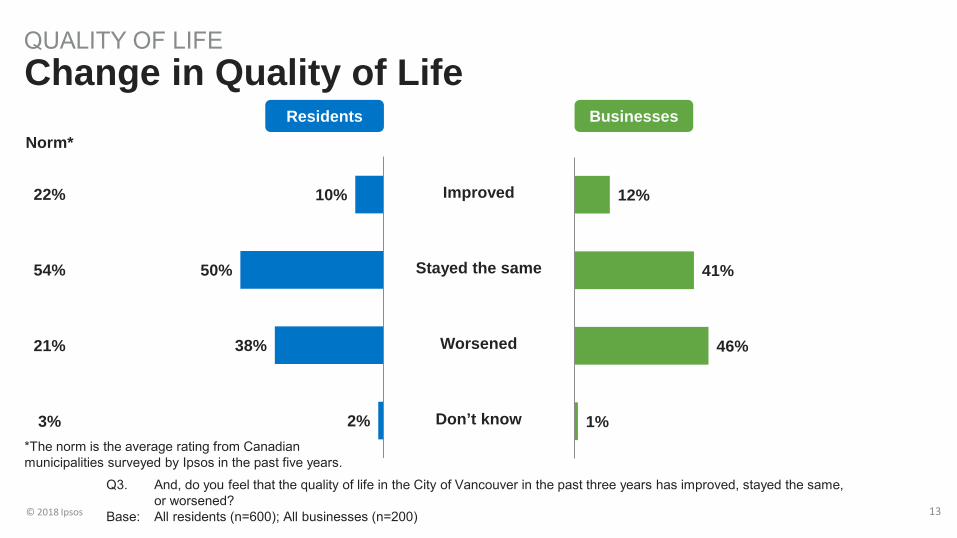
A majority of residents and businesses think that the quality of life has stayed the same or improved in the past three years. However, among those saying the quality of life has changed, both residents and businesses are much more likely to say things have worsened than improved. Specifically, 50% of residents say Vancouver’s quality of life has ‘stayed the same’, 10% say ‘improved’, and 38% say ‘worsened’. Among businesses, 41% say ‘stayed the same’, 12% say ‘improved’, and 46% say ‘worsened’. These results are different than the norm, where residents tend to take a more balanced view towards the direction quality of life is taking (54% ‘stayed the same’, 22% ‘improved’, 21% ‘worsened’).
• Among residents, perceptions of a ‘worsened’ quality of life are higher among those who are 55+ years of age (52% vs. 22% of 18-34 years, 40% of 35-54 years), homeowners (43% vs. 32% of renters), and those with household incomes of $60K-<$100K (46% vs. 30% of <$60K, 34% of $100K+).
• Conversely, residents who are more likely to report an ‘improved’ quality of life include those who are 35-54 years of age (13% vs. 6% of 55+ years, 12% of 18-34 years) and those with children under the age of 18 living at home (16% vs. 9% of those without children at home).
© 2018 Ipsos 11
Quality of Life Section Summary (slide 2 of 2)
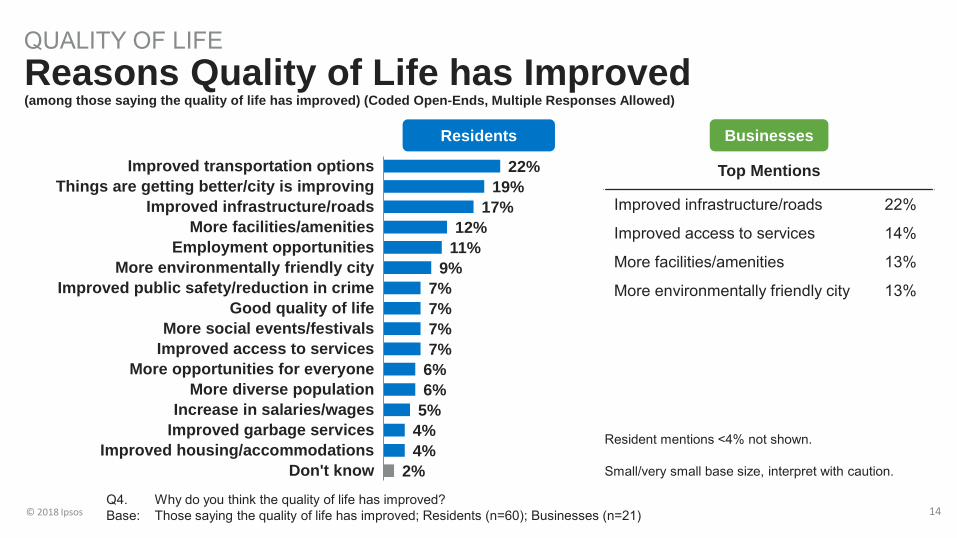
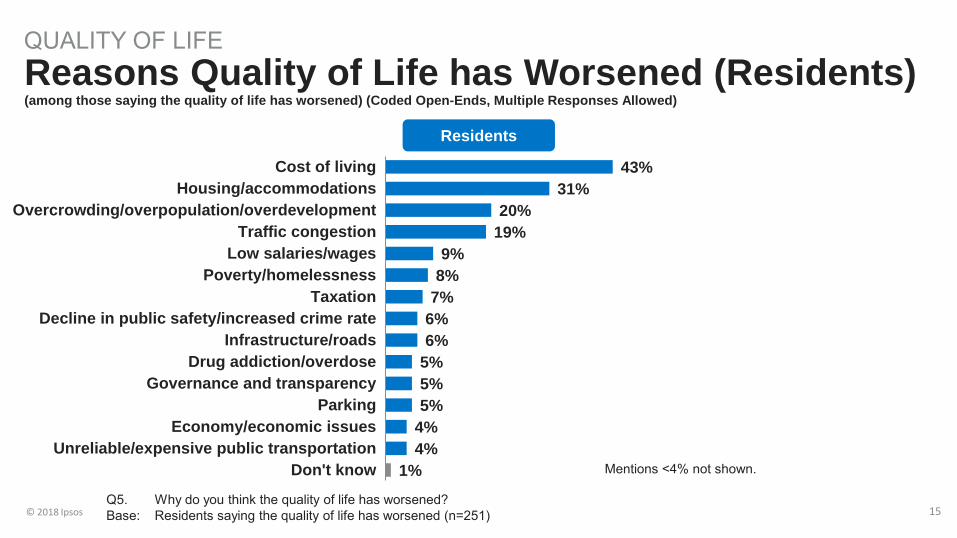
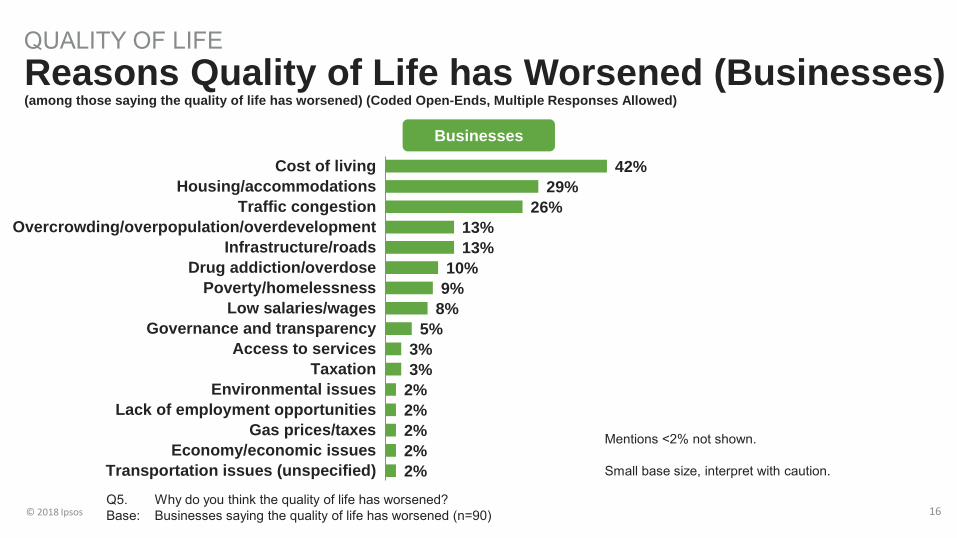
A variety of factors are behind impressions of an improved quality of life. Among residents saying the quality of life has improved, the top five open-ended reasons behind perceptions of an improved quality of life are “improved transportation options” (22%), “things are getting better/city is improving” (19%), “improved infrastructure/roads” (17%), “more facilities/amenities” (12%), and “employment opportunities” (11%). Among the few businesses saying the quality of life has improved, the leading open-ended reason is “improved infrastructure/roads” (22%). However, with only 21 businesses answering this question, these results should be interpreted with caution. The cost of living and housing are driving perceptions of a worsened quality of life. Other factors include overcrowding and traffic. Among residents saying the quality of life has worsened, 43% attribute this to the “cost of living” and 31% mention “housing/accommodations” (coded open-ends). Secondary factors include “overcrowding/overpopulation/ overdevelopment” (20%) and “traffic congestion” (19%). Similarly, 42% of businesses saying the quality of life has worsened point to the “cost of living”. Other top mentions include “housing/accommodations” (29%) and “traffic congestion” (26%).
• Mentions of “cost of living” are higher among residents who are <55 years of age (53% vs. 31% of 55+ years), rent (54% vs. 36% of homeowners), and have household incomes of <$100K (includes 62% of <$60K and 46% of $60K-<$100K vs. 29% of $100K+).
© 2018 Ipsos 12
Very good
Good
Poor
Very poor
Don’t know
30%
57%
11%
1%
0%
32%
59%
7%
1%
1%
QUALITY OF LIFE Overall Quality of Life
Total Good 91%
Total Poor 8%
Total Good 88%
Total Poor 12%
Residents Businesses
96%
4%
Norm*
44%
52%
3%
1%
0%
*The norm is the average rating from Canadian municipalities surveyed by Ipsos in the past five years.
© 2018 Ipsos 13
Improved
Stayed the same
Worsened
Don’t know
Q3. And, do you feel that the quality of life in the City of Vancouver in the past three years has improved, stayed the same, or worsened?
Base: All residents (n=600); All businesses (n=200)
12%
41%
46%
1%
10%
50%
38%
2%
QUALITY OF LIFE Change in Quality of Life
Residents Businesses Norm*
22%
54%
21%
3% *The norm is the average rating from Canadian municipalities surveyed by Ipsos in the past five years.
© 2018 Ipsos 14 Q4. Why do you think the quality of life has improved? Base: Those saying the quality of life has improved; Residents (n=60); Businesses (n=21)
Residents
22% 19%
17% 12%
11% 9%
7% 7% 7% 7%
6% 6%
5% 4% 4%
2%
Improved transportation optionsThings are getting better/city is improving
Improved infrastructure/roadsMore facilities/amenities
Employment opportunitiesMore environmentally friendly city
Improved public safety/reduction in crimeGood quality of life
More social events/festivalsImproved access to services
More opportunities for everyoneMore diverse population
Increase in salaries/wagesImproved garbage services
Improved housing/accommodationsDon't know
QUALITY OF LIFE Reasons Quality of Life has Improved (among those saying the quality of life has improved) (Coded Open-Ends, Multiple Responses Allowed)
Resident mentions <4% not shown. Small/very small base size, interpret with caution.
Top Mentions
Improved infrastructure/roads 22%
Improved access to services 14%
More facilities/amenities 13%
More environmentally friendly city 13%
Businesses
© 2018 Ipsos 15 Q5. Why do you think the quality of life has worsened? Base: Residents saying the quality of life has worsened (n=251)
Residents
43% 31%
20% 19%
9% 8%
7% 6% 6%
5% 5% 5%
4% 4%
1%
Cost of livingHousing/accommodations
Overcrowding/overpopulation/overdevelopmentTraffic congestion
Low salaries/wagesPoverty/homelessness
TaxationDecline in public safety/increased crime rate
Infrastructure/roadsDrug addiction/overdose
Governance and transparencyParking
Economy/economic issuesUnreliable/expensive public transportation
Don't know
QUALITY OF LIFE Reasons Quality of Life has Worsened (Residents) (among those saying the quality of life has worsened) (Coded Open-Ends, Multiple Responses Allowed)
Mentions <4% not shown.
© 2018 Ipsos 16 Q5. Why do you think the quality of life has worsened? Base: Businesses saying the quality of life has worsened (n=90)
Businesses
42% 29%
26% 13% 13%
10% 9%
8% 5%
3% 3%
2% 2% 2% 2% 2%
Cost of livingHousing/accommodations
Traffic congestionOvercrowding/overpopulation/overdevelopment
Infrastructure/roadsDrug addiction/overdose
Poverty/homelessnessLow salaries/wages
Governance and transparencyAccess to services
TaxationEnvironmental issues
Lack of employment opportunitiesGas prices/taxes
Economy/economic issuesTransportation issues (unspecified)
QUALITY OF LIFE Reasons Quality of Life has Worsened (Businesses) (among those saying the quality of life has worsened) (Coded Open-Ends, Multiple Responses Allowed)
Mentions <2% not shown. Small base size, interpret with caution.

© 2018 Ipsos 17
IMPORTANT LOCAL ISSUES
© 2018 Ipsos 18
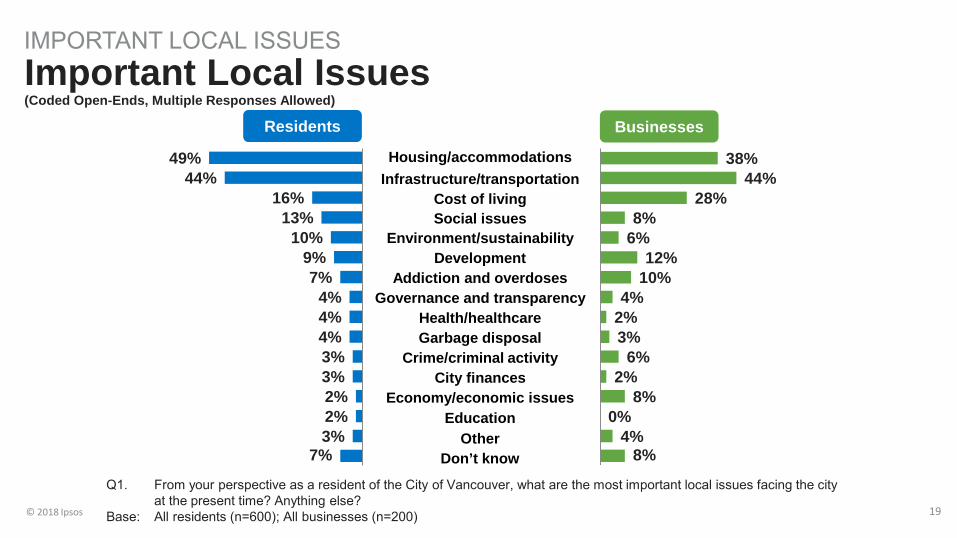
Important Local Issues Section Summary Housing and infrastructure dominate the public issue agenda. Among residents, the two most frequently mentioned top-of-mind issues are “housing/accommodations” (49%) and “infrastructure/transportation” (44%). All other issues are a distant second in priority. The same top two issues are also voiced by businesses although the order is reversed, with 44% mentioning “infrastructure/transportation” and 38% mentioning “housing/accommodations”. “Cost of living” is a third issue of note among businesses, garnering 28% of mentions.
• Among residents, mentions of “housing/accommodations” are higher among women (56% vs. 41% of men), those who are 35-54 years of age (55% vs. 43% of 18-34 years, 47% of 55+ years), and those with household incomes of $100K+ (58% vs. 39% of <$60K, 50% of $60K-<$100K).
• Mentions of “infrastructure/transportation” are higher among residents living in the Southwest (52% vs. 37% in the Downtown/West End, 38% in the Southeast, 48% in the Northwest, 48% in the Northeast) and homeowners (49% vs. 38% of renters).
© 2018 Ipsos 19
Housing/accommodations Infrastructure/transportation
Cost of living Social issues
Environment/sustainability Development
Addiction and overdoses Governance and transparency
Health/healthcare Garbage disposal
Crime/criminal activity City finances
Economy/economic issues Education
Other Don’t know
49% 44%
16% 13%
10% 9% 7%
4% 4% 4% 3% 3% 2% 2% 3%
7%
38% 44%
28% 8%
6% 12%
10% 4%
2% 3%
6% 2%
8% 0%
4% 8%
Residents Businesses
IMPORTANT LOCAL ISSUES Important Local Issues (Coded Open-Ends, Multiple Responses Allowed)
Q1. From your perspective as a resident of the City of Vancouver, what are the most important local issues facing the city at the present time? Anything else?
Base: All residents (n=600); All businesses (n=200)

© 2018 Ipsos 20
CITY SERVICES
© 2018 Ipsos 21
City Services Section Summary (slide 1 of 4)
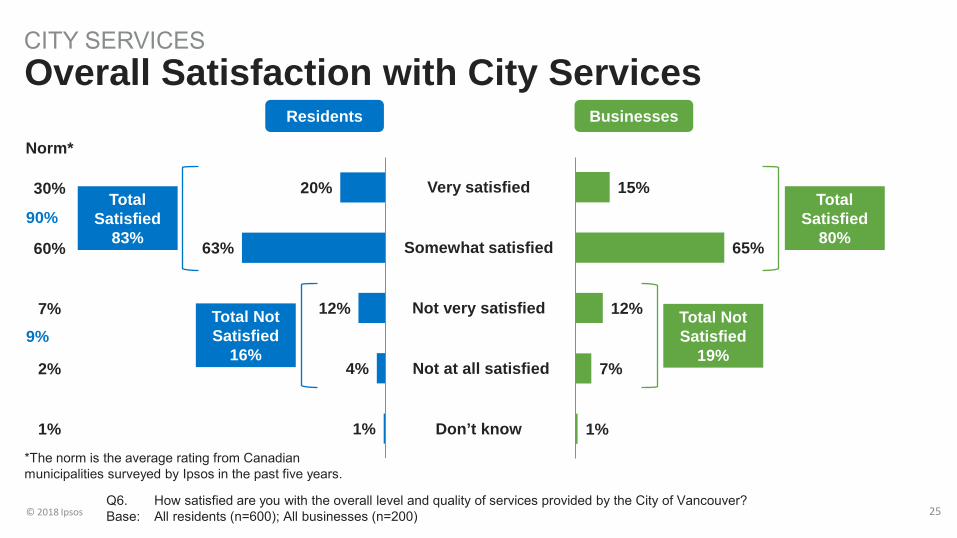
Most residents and businesses are satisfied with the overall level and quality of City services although satisfaction is lower than the norm. Overall, 83% of residents and 80% of businesses say they are satisfied (combined ‘very/somewhat satisfied’ ratings) with the overall level and quality of services provided by the City of Vancouver. In comparison, the normative resident score is 90% total satisfied.
• Younger residents are more likely to say they are satisfied (combined ‘very/somewhat satisfied’ ratings) with the City’s overall level and quality of services (87% of 18-34 years vs. 78% of 55+ years, 82% of 35-54 years).
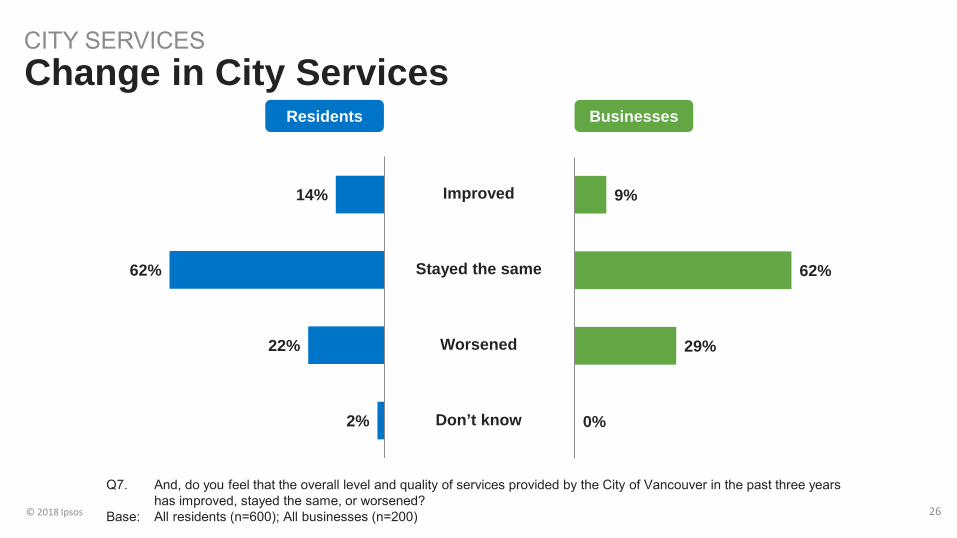
A majority of residents and businesses think that services have stayed the same or improved in the past three years. However, among those saying services have changed, both residents and businesses are more likely to say things have worsened than improved, although the difference is less than quality of life. Specifically, 62% of residents say services have ‘stayed the same’, 14% say ‘improved’, and 22% say ‘worsened’. Among businesses, 62% say ‘stayed the same’, 9% say ‘improved’, and 29% say ‘worsened’.
• Among residents, perceptions of ‘worsened’ services are higher among those who are 55+ years of age (33% vs. 12% of 18-34 years, 21% of 35-54 years), those living in the Downtown/West End (30% vs. 16% in the Southeast, 19% in the Northeast, 25% in the Northwest, 25% in the Southwest), homeowners (29% vs. 15% of renters), and those with household incomes of $100K+ (26% vs. 16% of <$60K, 18% of $60K-<$100K).
• Conversely, perceptions of ‘improved’ services are higher among those with household incomes of <$60K (20% vs. 7% of $60K-<$100K, 13% of $100K+).
© 2018 Ipsos 22
City Services Section Summary (slide 2 of 4)
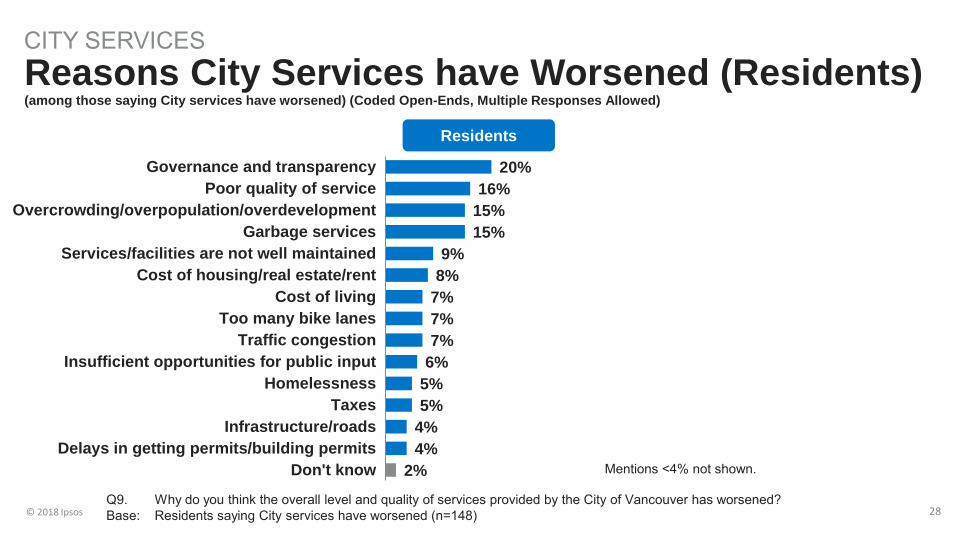
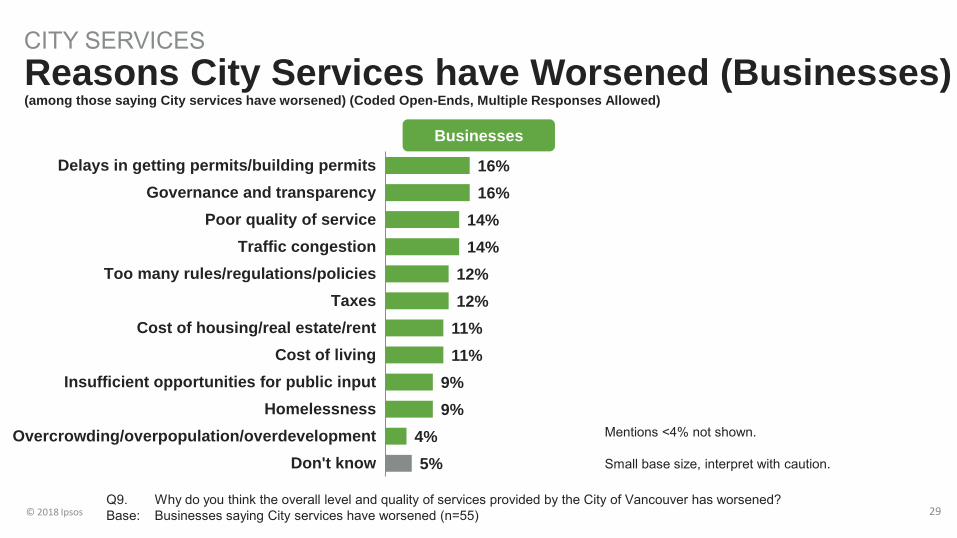
Residents and businesses offer different explanations for saying City services have improved. Among residents saying City services have improved, the most frequently mentioned open-ended reason is “more transportation options” (21%). Other explanations include “improved infrastructure/roads” (16%), “good customer service” (14%), “services have improved (unspecified)” (13%), “improved access to services” (13%), and “increased focus on environment” (13%). Conversely, among the few businesses saying City services have improved, the leading open-ended reason is “good customer service” (30%). However, with only 19 businesses answering this question, these results should be interpreted with caution. Respondents who think City services have worsened attribute this to a variety of factors, with no single explanation standing out from the rest. Among residents saying the overall level and quality of City services has worsened, the leading open-ended explanations are “governance and transparency” (20%), “poor quality of service” (16%), “overcrowding/overpopulation/overdevelopment” (15%), and “garbage services” (15%). Businesses saying City services have worsened offer an even greater diversity of opinion, with only five percentage points separating the eight most frequently mentioned open-ended responses (and none garnering more than 16% of mentions). Of these, the two leading responses are “delays in getting permits/building permits” (16%) and “governance and transparency” (16%).
© 2018 Ipsos 23
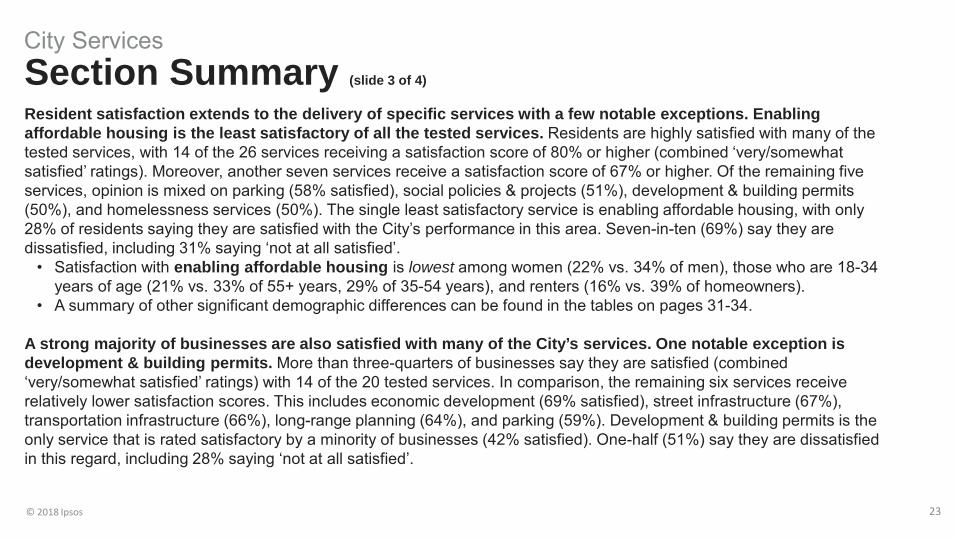
City Services Section Summary (slide 3 of 4)
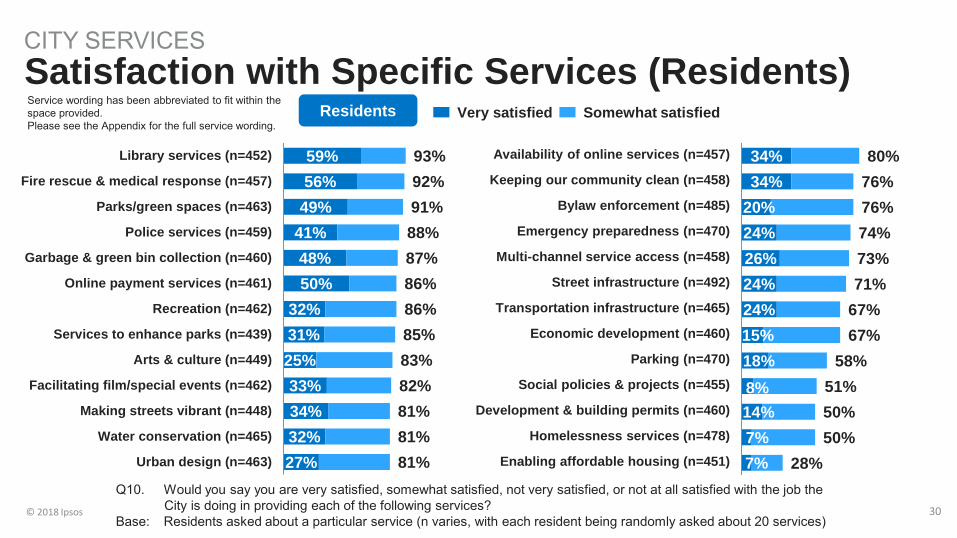
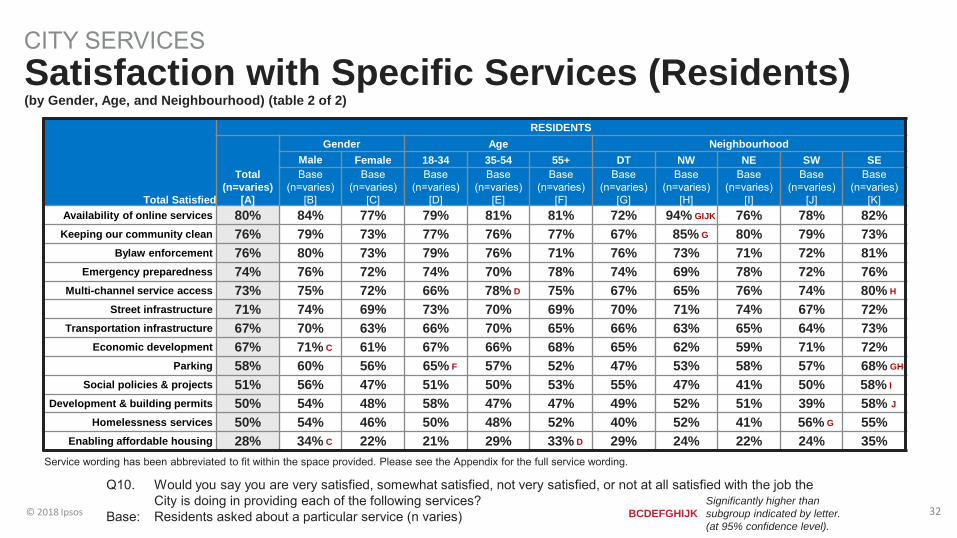
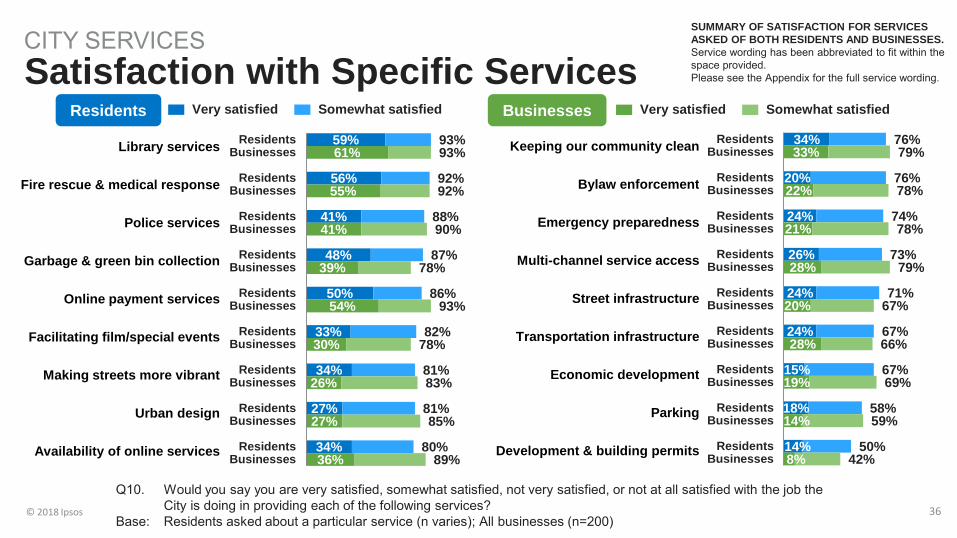
Resident satisfaction extends to the delivery of specific services with a few notable exceptions. Enabling affordable housing is the least satisfactory of all the tested services. Residents are highly satisfied with many of the tested services, with 14 of the 26 services receiving a satisfaction score of 80% or higher (combined ‘very/somewhat satisfied’ ratings). Moreover, another seven services receive a satisfaction score of 67% or higher. Of the remaining five services, opinion is mixed on parking (58% satisfied), social policies & projects (51%), development & building permits (50%), and homelessness services (50%). The single least satisfactory service is enabling affordable housing, with only 28% of residents saying they are satisfied with the City’s performance in this area. Seven-in-ten (69%) say they are dissatisfied, including 31% saying ‘not at all satisfied’.
• Satisfaction with enabling affordable housing is lowest among women (22% vs. 34% of men), those who are 18-34 years of age (21% vs. 33% of 55+ years, 29% of 35-54 years), and renters (16% vs. 39% of homeowners).
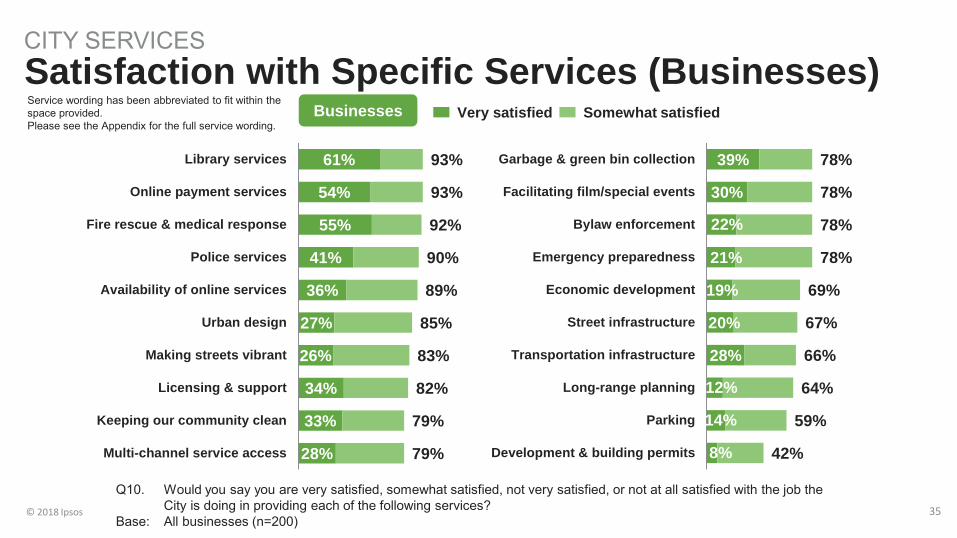
• A summary of other significant demographic differences can be found in the tables on pages 31-34. A strong majority of businesses are also satisfied with many of the City’s services. One notable exception is development & building permits. More than three-quarters of businesses say they are satisfied (combined ‘very/somewhat satisfied’ ratings) with 14 of the 20 tested services. In comparison, the remaining six services receive relatively lower satisfaction scores. This includes economic development (69% satisfied), street infrastructure (67%), transportation infrastructure (66%), long-range planning (64%), and parking (59%). Development & building permits is the only service that is rated satisfactory by a minority of businesses (42% satisfied). One-half (51%) say they are dissatisfied in this regard, including 28% saying ‘not at all satisfied’.
© 2018 Ipsos 24
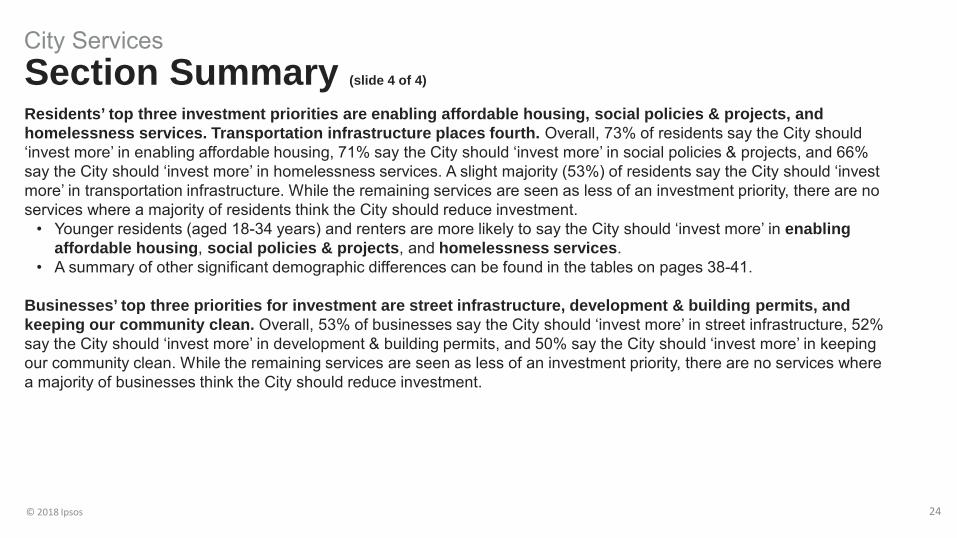
City Services Section Summary (slide 4 of 4)
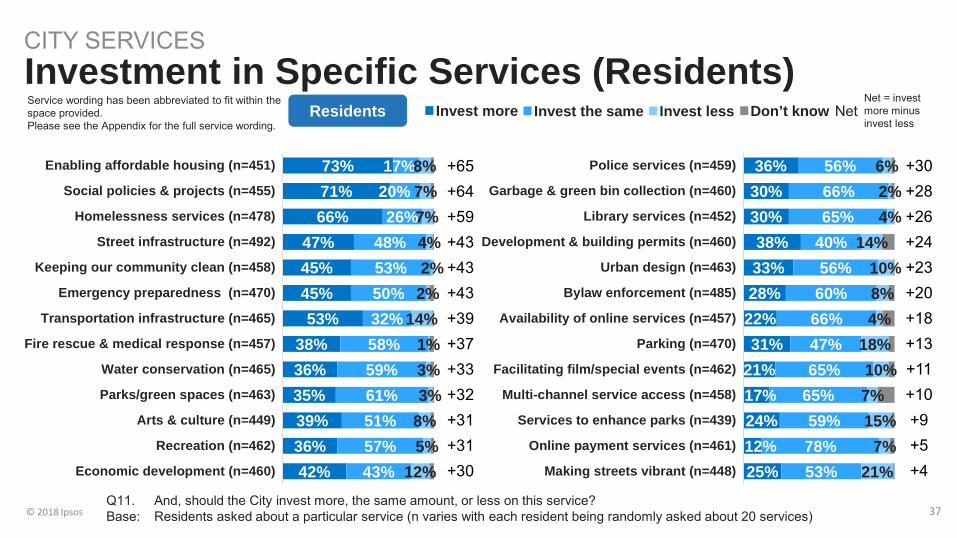
Residents’ top three investment priorities are enabling affordable housing, social policies & projects, and homelessness services. Transportation infrastructure places fourth. Overall, 73% of residents say the City should ‘invest more’ in enabling affordable housing, 71% say the City should ‘invest more’ in social policies & projects, and 66% say the City should ‘invest more’ in homelessness services. A slight majority (53%) of residents say the City should ‘invest more’ in transportation infrastructure. While the remaining services are seen as less of an investment priority, there are no services where a majority of residents think the City should reduce investment.
• Younger residents (aged 18-34 years) and renters are more likely to say the City should ‘invest more’ in enabling affordable housing, social policies & projects, and homelessness services.
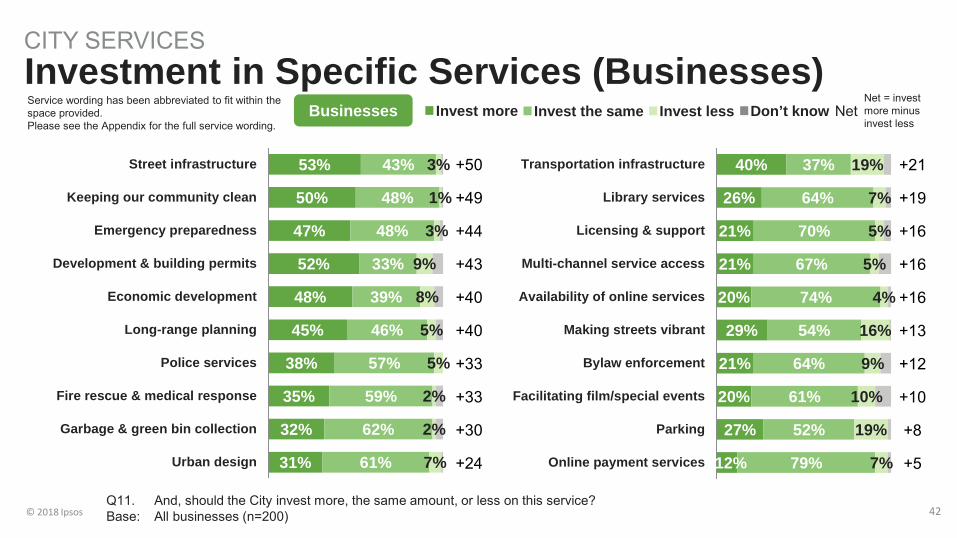
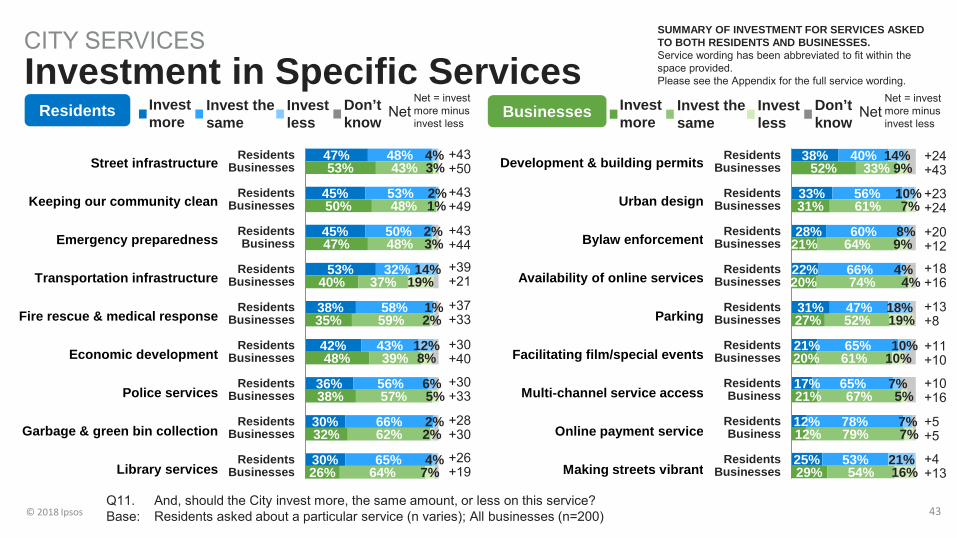
• A summary of other significant demographic differences can be found in the tables on pages 38-41. Businesses’ top three priorities for investment are street infrastructure, development & building permits, and keeping our community clean. Overall, 53% of businesses say the City should ‘invest more’ in street infrastructure, 52% say the City should ‘invest more’ in development & building permits, and 50% say the City should ‘invest more’ in keeping our community clean. While the remaining services are seen as less of an investment priority, there are no services where a majority of businesses think the City should reduce investment.
© 2018 Ipsos 25
Very satisfied
Somewhat satisfied
Not very satisfied
Not at all satisfied
Don’t know
15%
65%
12%
7%
1%
20%
63%
12%
4%
1%
Norm*
30%
60%
7%
2%
1%
Total Satisfied
83%
Total Not Satisfied
16%
Total Satisfied
80%
Total Not Satisfied
19%
90%
9%
CITY SERVICES Overall Satisfaction with City Services
Q6. How satisfied are you with the overall level and quality of services provided by the City of Vancouver? Base: All residents (n=600); All businesses (n=200)
Residents Businesses
*The norm is the average rating from Canadian municipalities surveyed by Ipsos in the past five years.
© 2018 Ipsos 26
Improved
Stayed the same
Worsened
Don’t know
9%
62%
29%
0%
14%
62%
22%
2%
CITY SERVICES Change in City Services
Q7. And, do you feel that the overall level and quality of services provided by the City of Vancouver in the past three years has improved, stayed the same, or worsened?
Base: All residents (n=600); All businesses (n=200)
Residents Businesses
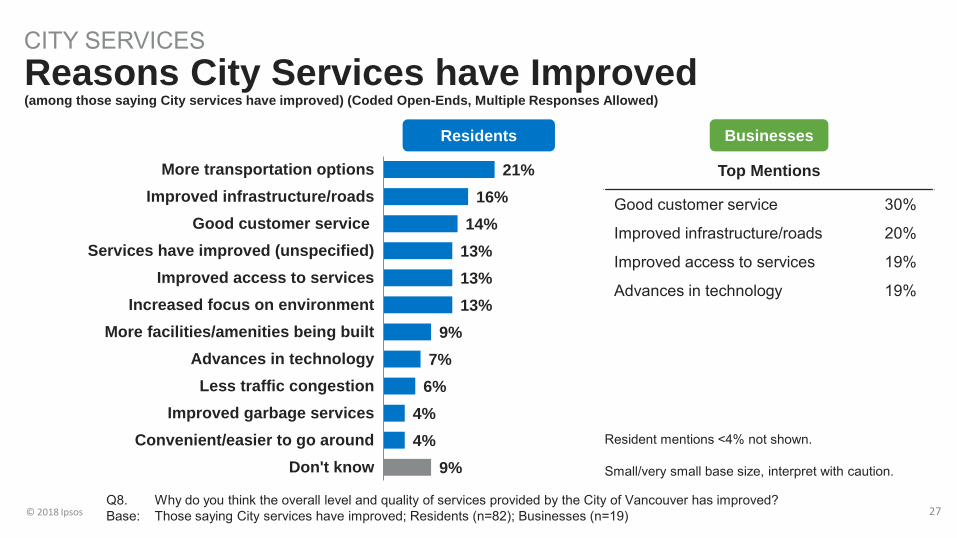
© 2018 Ipsos 27 Q8. Why do you think the overall level and quality of services provided by the City of Vancouver has improved? Base: Those saying City services have improved; Residents (n=82); Businesses (n=19)
Residents
21% 16%
14% 13% 13% 13%
9% 7%
6% 4% 4%
9%
More transportation optionsImproved infrastructure/roads
Good customer serviceServices have improved (unspecified)
Improved access to servicesIncreased focus on environment
More facilities/amenities being builtAdvances in technologyLess traffic congestion
Improved garbage servicesConvenient/easier to go around
Don't know
CITY SERVICES Reasons City Services have Improved (among those saying City services have improved) (Coded Open-Ends, Multiple Responses Allowed)
Top Mentions
Good customer service 30%
Improved infrastructure/roads 20%
Improved access to services 19%
Advances in technology 19%
Businesses
Resident mentions <4% not shown. Small/very small base size, interpret with caution.
© 2018 Ipsos 28
Residents
20% 16%
15% 15%
9% 8%
7% 7% 7%
6% 5% 5%
4% 4%
2%
Governance and transparencyPoor quality of service
Overcrowding/overpopulation/overdevelopmentGarbage services
Services/facilities are not well maintainedCost of housing/real estate/rent
Cost of livingToo many bike lanes
Traffic congestionInsufficient opportunities for public input
HomelessnessTaxes
Infrastructure/roadsDelays in getting permits/building permits
Don't know
CITY SERVICES Reasons City Services have Worsened (Residents) (among those saying City services have worsened) (Coded Open-Ends, Multiple Responses Allowed)
Q9. Why do you think the overall level and quality of services provided by the City of Vancouver has worsened? Base: Residents saying City services have worsened (n=148)
Mentions <4% not shown.
© 2018 Ipsos 29
Businesses
16% 16%
14% 14%
12% 12%
11% 11%
9% 9%
4% 5%
Delays in getting permits/building permitsGovernance and transparency
Poor quality of serviceTraffic congestion
Too many rules/regulations/policiesTaxes
Cost of housing/real estate/rentCost of living
Insufficient opportunities for public inputHomelessness
Overcrowding/overpopulation/overdevelopmentDon't know
CITY SERVICES Reasons City Services have Worsened (Businesses) (among those saying City services have worsened) (Coded Open-Ends, Multiple Responses Allowed)
Q9. Why do you think the overall level and quality of services provided by the City of Vancouver has worsened? Base: Businesses saying City services have worsened (n=55)
Mentions <4% not shown. Small base size, interpret with caution.
© 2018 Ipsos 30
CITY SERVICES Satisfaction with Specific Services (Residents)
59% 56%
49% 41% 48% 50%
32% 31% 25% 33% 34% 32% 27%
93% 92% 91% 88% 87% 86% 86% 85% 83% 82% 81% 81% 81%
Library services (n=452)
Fire rescue & medical response (n=457)
Parks/green spaces (n=463)
Police services (n=459)
Garbage & green bin collection (n=460)
Online payment services (n=461)
Recreation (n=462)
Services to enhance parks (n=439)
Arts & culture (n=449)
Facilitating film/special events (n=462)
Making streets vibrant (n=448)
Water conservation (n=465)
Urban design (n=463)
34% 34%
20% 24% 26% 24% 24% 15% 18% 8% 14% 7% 7%
80% 76% 76% 74% 73% 71%
67% 67%
58% 51% 50% 50%
28%
Availability of online services (n=457)
Keeping our community clean (n=458)
Bylaw enforcement (n=485)
Emergency preparedness (n=470)
Multi-channel service access (n=458)
Street infrastructure (n=492)
Transportation infrastructure (n=465)
Economic development (n=460)
Parking (n=470)
Social policies & projects (n=455)
Development & building permits (n=460)
Homelessness services (n=478)
Enabling affordable housing (n=451)
Q10. Would you say you are very satisfied, somewhat satisfied, not very satisfied, or not at all satisfied with the job the City is doing in providing each of the following services?
Base: Residents asked about a particular service (n varies, with each resident being randomly asked about 20 services)
Somewhat satisfied Very satisfied Residents Service wording has been abbreviated to fit within the space provided. Please see the Appendix for the full service wording.
© 2018 Ipsos 31
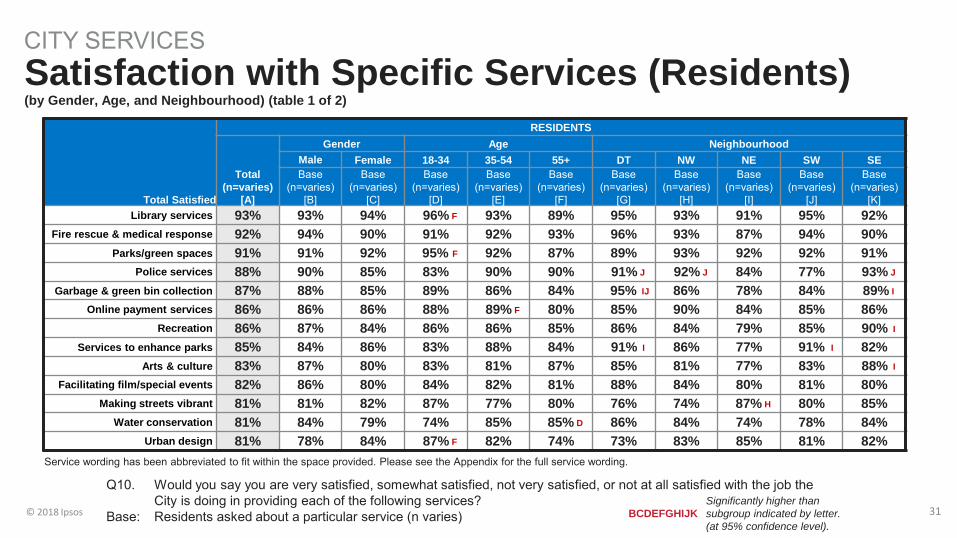
CITY SERVICES Satisfaction with Specific Services (Residents) (by Gender, Age, and Neighbourhood) (table 1 of 2)
Total Satisfied
RESIDENTS
Total (n=varies)
[A]
Gender Age Neighbourhood Male Female 18-34 35-54 55+ DT NW NE SW SE Base
(n=varies) [B]
Base (n=varies)
[C]
Base (n=varies)
[D]
Base (n=varies)
[E]
Base (n=varies)
[F]
Base (n=varies)
[G]
Base (n=varies)
[H]
Base (n=varies)
[I]
Base (n=varies)
[J]
Base (n=varies)
[K] Library services 93% 93% 94% 96% F 93% 89% 95% 93% 91% 95% 92%
Fire rescue & medical response 92% 94% 90% 91% 92% 93% 96% 93% 87% 94% 90% Parks/green spaces 91% 91% 92% 95% F 92% 87% 89% 93% 92% 92% 91%
Police services 88% 90% 85% 83% 90% 90% 91% J 92% J 84% 77% 93% J Garbage & green bin collection 87% 88% 85% 89% 86% 84% 95% IJ 86% 78% 84% 89% I
Online payment services 86% 86% 86% 88% 89% F 80% 85% 90% 84% 85% 86% Recreation 86% 87% 84% 86% 86% 85% 86% 84% 79% 85% 90% I
Services to enhance parks 85% 84% 86% 83% 88% 84% 91% I 86% 77% 91% I 82% Arts & culture 83% 87% 80% 83% 81% 87% 85% 81% 77% 83% 88% I
Facilitating film/special events 82% 86% 80% 84% 82% 81% 88% 84% 80% 81% 80% Making streets vibrant 81% 81% 82% 87% 77% 80% 76% 74% 87% H 80% 85%
Water conservation 81% 84% 79% 74% 85% 85% D 86% 84% 74% 78% 84% Urban design 81% 78% 84% 87% F 82% 74% 73% 83% 85% 81% 82%
Q10. Would you say you are very satisfied, somewhat satisfied, not very satisfied, or not at all satisfied with the job the City is doing in providing each of the following services?
Base: Residents asked about a particular service (n varies)
Service wording has been abbreviated to fit within the space provided. Please see the Appendix for the full service wording.
Significantly higher than subgroup indicated by letter. (at 95% confidence level).
BCDEFGHIJK
© 2018 Ipsos 32
CITY SERVICES
Total Satisfied
RESIDENTS
Total (n=varies)
[A]
Gender Age Neighbourhood Male Female 18-34 35-54 55+ DT NW NE SW SE Base
(n=varies) [B]
Base (n=varies)
[C]
Base (n=varies)
[D]
Base (n=varies)
[E]
Base (n=varies)
[F]
Base (n=varies)
[G]
Base (n=varies)
[H]
Base (n=varies)
[I]
Base (n=varies)
[J]
Base (n=varies)
[K] Availability of online services 80% 84% 77% 79% 81% 81% 72% 94% GIJK 76% 78% 82% Keeping our community clean 76% 79% 73% 77% 76% 77% 67% 85% G 80% 79% 73%
Bylaw enforcement 76% 80% 73% 79% 76% 71% 76% 73% 71% 72% 81% Emergency preparedness 74% 76% 72% 74% 70% 78% 74% 69% 78% 72% 76%
Multi-channel service access 73% 75% 72% 66% 78% D 75% 67% 65% 76% 74% 80% H Street infrastructure 71% 74% 69% 73% 70% 69% 70% 71% 74% 67% 72%
Transportation infrastructure 67% 70% 63% 66% 70% 65% 66% 63% 65% 64% 73% Economic development 67% 71% C 61% 67% 66% 68% 65% 62% 59% 71% 72%
Parking 58% 60% 56% 65% F 57% 52% 47% 53% 58% 57% 68% GH Social policies & projects 51% 56% 47% 51% 50% 53% 55% 47% 41% 50% 58% I
Development & building permits 50% 54% 48% 58% 47% 47% 49% 52% 51% 39% 58% J Homelessness services 50% 54% 46% 50% 48% 52% 40% 52% 41% 56% G 55%
Enabling affordable housing 28% 34% C 22% 21% 29% 33% D 29% 24% 22% 24% 35% Service wording has been abbreviated to fit within the space provided. Please see the Appendix for the full service wording.
Significantly higher than subgroup indicated by letter. (at 95% confidence level).
BCDEFGHIJK
Satisfaction with Specific Services (Residents) (by Gender, Age, and Neighbourhood) (table 2 of 2)
Q10. Would you say you are very satisfied, somewhat satisfied, not very satisfied, or not at all satisfied with the job the City is doing in providing each of the following services?
Base: Residents asked about a particular service (n varies)
© 2018 Ipsos 33
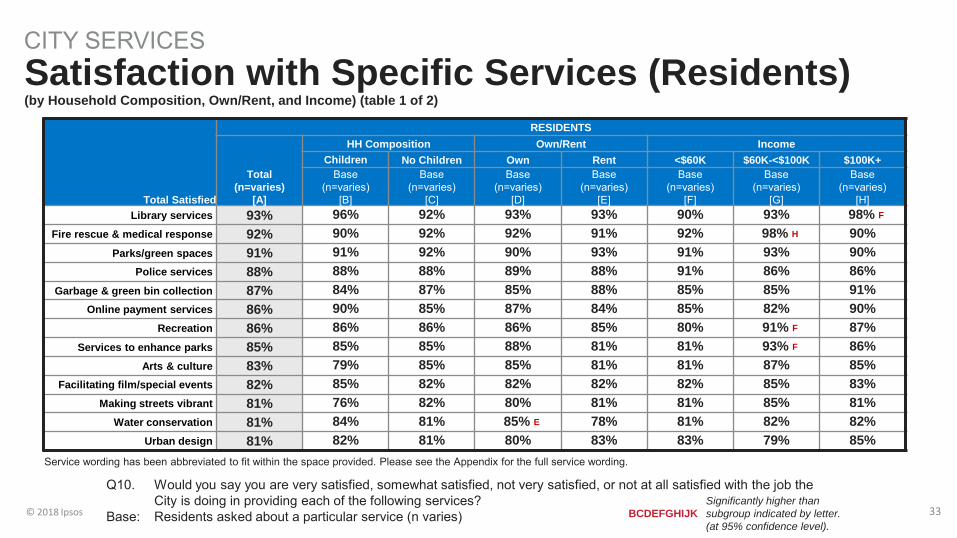
CITY SERVICES Satisfaction with Specific Services (Residents) (by Household Composition, Own/Rent, and Income) (table 1 of 2)
Total Satisfied
RESIDENTS
Total (n=varies)
[A]
HH Composition Own/Rent Income Children No Children Own Rent <$60K $60K-<$100K $100K+
Base (n=varies)
[B]
Base (n=varies)
[C]
Base (n=varies)
[D]
Base (n=varies)
[E]
Base (n=varies)
[F]
Base (n=varies)
[G]
Base (n=varies)
[H] Library services 93% 96% 92% 93% 93% 90% 93% 98% F
Fire rescue & medical response 92% 90% 92% 92% 91% 92% 98% H 90% Parks/green spaces 91% 91% 92% 90% 93% 91% 93% 90%
Police services 88% 88% 88% 89% 88% 91% 86% 86% Garbage & green bin collection 87% 84% 87% 85% 88% 85% 85% 91%
Online payment services 86% 90% 85% 87% 84% 85% 82% 90% Recreation 86% 86% 86% 86% 85% 80% 91% F 87%
Services to enhance parks 85% 85% 85% 88% 81% 81% 93% F 86% Arts & culture 83% 79% 85% 85% 81% 81% 87% 85%
Facilitating film/special events 82% 85% 82% 82% 82% 82% 85% 83% Making streets vibrant 81% 76% 82% 80% 81% 81% 85% 81%
Water conservation 81% 84% 81% 85% E 78% 81% 82% 82% Urban design 81% 82% 81% 80% 83% 83% 79% 85%
Service wording has been abbreviated to fit within the space provided. Please see the Appendix for the full service wording.
Significantly higher than subgroup indicated by letter. (at 95% confidence level).
BCDEFGHIJK
Q10. Would you say you are very satisfied, somewhat satisfied, not very satisfied, or not at all satisfied with the job the City is doing in providing each of the following services?
Base: Residents asked about a particular service (n varies)

© 2018 Ipsos 34
CITY SERVICES Satisfaction with Specific Services (Residents) (by Household Composition, Own/Rent, and Income) (table 2 of 2)
Total Satisfied
RESIDENTS
Total (n=varies)
[A]
HH Composition Own/Rent Income Children No Children Own Rent <$60K $60K-<$100K $100K+
Base (n=varies)
[B]
Base (n=varies)
[C]
Base (n=varies)
[D]
Base (n=varies)
[E]
Base (n=varies)
[F]
Base (n=varies)
[G]
Base (n=varies)
[H] Availability of online services 80% 82% 80% 83% 78% 77% 85% 81% Keeping our community clean 76% 75% 77% 77% 76% 75% 77% 77%
Bylaw enforcement 76% 76% 75% 74% 76% 76% 76% 77% Emergency preparedness 74% 76% 74% 73% 74% 75% 74% 75%
Multi-channel service access 73% 88% C 70% 77% 69% 70% 76% 75% Street infrastructure 71% 72% 70% 68% 75% 79% H 73% 66%
Transportation infrastructure 67% 72% 65% 66% 70% 76% GH 62% 63% Economic development 67% 75% 64% 66% 69% 70% 69% 65%
Parking 58% 68% C 56% 58% 57% 62% 52% 61% Social policies & projects 51% 58% 49% 54% 50% 55% 55% 46%
Development & building permits 50% 54% 49% 45% 55% 59% H 56% H 40% Homelessness services 50% 51% 50% 55% E 43% 49% 56% 51%
Enabling affordable housing 28% 33% 27% 39% E 16% 23% 33% 28% Service wording has been abbreviated to fit within the space provided. Please see the Appendix for the full service wording.
Significantly higher than subgroup indicated by letter. (at 95% confidence level).
BCDEFGHIJK
Q10. Would you say you are very satisfied, somewhat satisfied, not very satisfied, or not at all satisfied with the job the City is doing in providing each of the following services?
Base: Residents asked about a particular service (n varies)
© 2018 Ipsos 35
CITY SERVICES Satisfaction with Specific Services (Businesses)
61%
54%
55%
41%
36%
27%
26%
34%
33%
28%
93%
93%
92%
90%
89%
85%
83%
82%
79%
79%
Library services
Online payment services
Fire rescue & medical response
Police services
Availability of online services
Urban design
Making streets vibrant
Licensing & support
Keeping our community clean
Multi-channel service access
Somewhat satisfied Very satisfied Businesses Service wording has been abbreviated to fit within the space provided. Please see the Appendix for the full service wording.
Q10. Would you say you are very satisfied, somewhat satisfied, not very satisfied, or not at all satisfied with the job the City is doing in providing each of the following services?
Base: All businesses (n=200)
39%
30%
22%
21%
19%
20%
28%
12%
14%
8%
78%
78%
78%
78%
69%
67%
66%
64%
59%
42%
Garbage & green bin collection
Facilitating film/special events
Bylaw enforcement
Emergency preparedness
Economic development
Street infrastructure
Transportation infrastructure
Long-range planning
Parking
Development & building permits
© 2018 Ipsos 36
34% 33%
20% 22%
24% 21%
26% 28%
24% 20%
24% 28%
15% 19%
18% 14%
14% 8%
76% 79%
76% 78%
74% 78%
73% 79%
71% 67%
67% 66%
67% 69%
58% 59%
50% 42%
ResidentsBusinesses
ResidentsBusinesses
ResidentsBusinesses
ResidentsBusinesses
ResidentsBusinesses
ResidentsBusinesses
ResidentsBusinesses
ResidentsBusinesses
ResidentsBusinesses
CITY SERVICES Satisfaction with Specific Services
59% 61%
56% 55%
41% 41%
48% 39%
50% 54%
33% 30%
34% 26%
27% 27%
34% 36%
93% 93%
92% 92%
88% 90%
87% 78%
86% 93%
82% 78%
81% 83%
81% 85%
80% 89%
ResidentsBusinesses
ResidentsBusinesses
ResidentsBusinesses
ResidentsBusinesses
ResidentsBusinesses
ResidentsBusinesses
ResidentsBusinesses
ResidentsBusinesses
ResidentsBusinesses
Somewhat satisfied Very satisfied
Q10. Would you say you are very satisfied, somewhat satisfied, not very satisfied, or not at all satisfied with the job the City is doing in providing each of the following services?
Base: Residents asked about a particular service (n varies); All businesses (n=200)
Businesses Residents Somewhat satisfied Very satisfied
SUMMARY OF SATISFACTION FOR SERVICES ASKED OF BOTH RESIDENTS AND BUSINESSES. Service wording has been abbreviated to fit within the space provided. Please see the Appendix for the full service wording.
Library services
Fire rescue & medical response
Police services
Garbage & green bin collection
Online payment services
Facilitating film/special events
Making streets more vibrant
Urban design
Availability of online services
Keeping our community clean
Bylaw enforcement
Emergency preparedness
Multi-channel service access
Street infrastructure
Transportation infrastructure
Economic development
Parking
Development & building permits
© 2018 Ipsos 37
36% 30% 30% 38% 33% 28%
22% 31%
21% 17% 24% 12% 25%
56% 66% 65%
40% 56%
60% 66% 47% 65%
65% 59% 78% 53%
6% 2% 4%
14% 10% 8% 4%
18% 10% 7% 15%
7% 21%
Police services (n=459)
Garbage & green bin collection (n=460)
Library services (n=452)
Development & building permits (n=460)
Urban design (n=463)
Bylaw enforcement (n=485)
Availability of online services (n=457)
Parking (n=470)
Facilitating film/special events (n=462)
Multi-channel service access (n=458)
Services to enhance parks (n=439)
Online payment services (n=461)
Making streets vibrant (n=448)
CITY SERVICES Investment in Specific Services (Residents)
Residents
73% 71% 66%
47% 45% 45% 53%
38% 36% 35% 39% 36% 42%
17% 20% 26%
48% 53% 50% 32% 58% 59% 61% 51% 57% 43%
8% 7% 7% 4% 2%
2% 14%
1% 3% 3%
8% 5%
12%
Enabling affordable housing (n=451)
Social policies & projects (n=455)
Homelessness services (n=478)
Street infrastructure (n=492)
Keeping our community clean (n=458)
Emergency preparedness (n=470)
Transportation infrastructure (n=465)
Fire rescue & medical response (n=457)
Water conservation (n=465)
Parks/green spaces (n=463)
Arts & culture (n=449)
Recreation (n=462)
Economic development (n=460)
Q11. And, should the City invest more, the same amount, or less on this service? Base: Residents asked about a particular service (n varies with each resident being randomly asked about 20 services)
Service wording has been abbreviated to fit within the space provided. Please see the Appendix for the full service wording.
+65 +64 +59 +43 +43 +43 +39 +37 +33 +32 +31 +31 +30
Invest more Invest the same Invest less Don’t know Net Net = invest more minus invest less
+30 +28 +26 +24 +23 +20 +18 +13 +11 +10 +9 +5 +4

© 2018 Ipsos 38
CITY SERVICES Investment in Specific Services (Residents) (by Gender, Age, and Neighbourhood) (table 1 of 2)
Invest More
RESIDENTS
Total (n=varies)
[A]
Gender Age Neighbourhood Male Female 18-34 35-54 55+ DT NW NE SW SE Base
(n=varies) [B]
Base (n=varies)
[C]
Base (n=varies)
[D]
Base (n=varies)
[E]
Base (n=varies)
[F]
Base (n=varies)
[G]
Base (n=varies)
[H]
Base (n=varies)
[I]
Base (n=varies)
[J]
Base (n=varies)
[K] Enabling affordable housing 73% 71% 76% 85% EF 72% 63% 76% 69% 81% 70% 72%
Social policies & projects 71% 67% 75% 76% F 72% 64% 67% 71% 75% 71% 71% Homelessness services 66% 60% 72% B 73% F 65% 60% 72% 65% 69% 65% 63%
Street infrastructure 47% 47% 46% 48% 45% 49% 42% 46% 48% 47% 51% Keeping our community clean 45% 45% 46% 49% 43% 43% 51% H 34% 41% 40% 52% H
Emergency preparedness 45% 46% 46% 49% 46% 41% 41% 50% 47% 42% 47% Transportation infrastructure 53% 53% 54% 64% F 56% F 40% 54% 55% 53% 49% 55%
Fire rescue & medical response 38% 36% 40% 35% 35% 44% 32% 41% 30% 41% 43% Water conservation 36% 33% 38% 39% 37% 31% 26% 34% 45% G 32% 38% Parks/green spaces 35% 38% 32% 30% 36% 39% 33% 44% 35% 32% 33%
Arts & culture 39% 38% 39% 48% F 38% 30% 42% 37% 53% K 37% 31% Recreation 36% 36% 36% 35% 40% 34% 35% 33% 35% 40% 37%
Economic development 42% 42% 42% 46% 43% 37% 35% 44% 43% 39% 47% Service wording has been abbreviated to fit within the space provided. Please see the Appendix for the full service wording.
Significantly higher than subgroup indicated by letter. (at 95% confidence level).
BCDEFGHIJK Q11. And, should the City invest more, less, or the same amount on this service? Base: Residents asked about a particular service (n varies)
© 2018 Ipsos 39
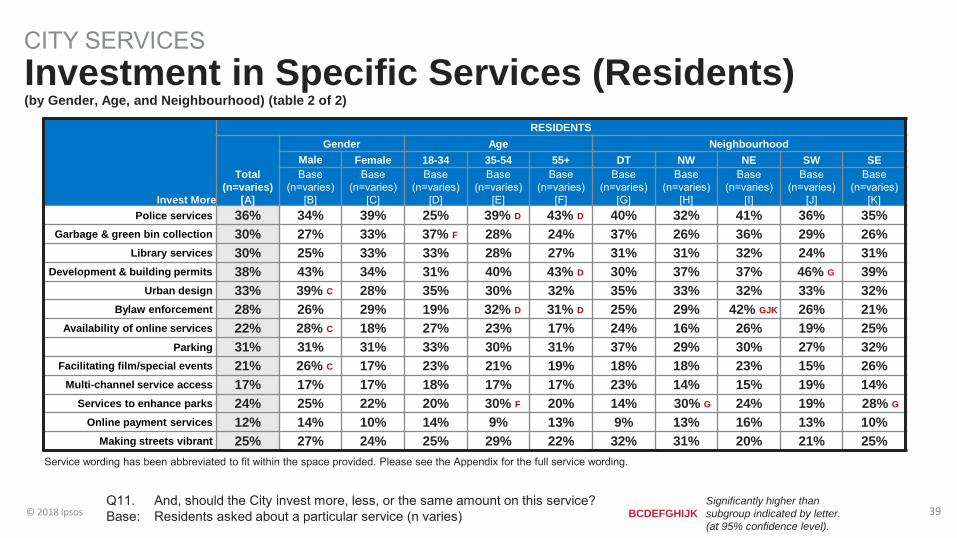
CITY SERVICES Investment in Specific Services (Residents) (by Gender, Age, and Neighbourhood) (table 2 of 2)
Invest More
RESIDENTS
Total (n=varies)
[A]
Gender Age Neighbourhood Male Female 18-34 35-54 55+ DT NW NE SW SE Base
(n=varies) [B]
Base (n=varies)
[C]
Base (n=varies)
[D]
Base (n=varies)
[E]
Base (n=varies)
[F]
Base (n=varies)
[G]
Base (n=varies)
[H]
Base (n=varies)
[I]
Base (n=varies)
[J]
Base (n=varies)
[K] Police services 36% 34% 39% 25% 39% D 43% D 40% 32% 41% 36% 35%
Garbage & green bin collection 30% 27% 33% 37% F 28% 24% 37% 26% 36% 29% 26% Library services 30% 25% 33% 33% 28% 27% 31% 31% 32% 24% 31%
Development & building permits 38% 43% 34% 31% 40% 43% D 30% 37% 37% 46% G 39% Urban design 33% 39% C 28% 35% 30% 32% 35% 33% 32% 33% 32%
Bylaw enforcement 28% 26% 29% 19% 32% D 31% D 25% 29% 42% GJK 26% 21% Availability of online services 22% 28% C 18% 27% 23% 17% 24% 16% 26% 19% 25%
Parking 31% 31% 31% 33% 30% 31% 37% 29% 30% 27% 32% Facilitating film/special events 21% 26% C 17% 23% 21% 19% 18% 18% 23% 15% 26%
Multi-channel service access 17% 17% 17% 18% 17% 17% 23% 14% 15% 19% 14% Services to enhance parks 24% 25% 22% 20% 30% F 20% 14% 30% G 24% 19% 28% G
Online payment services 12% 14% 10% 14% 9% 13% 9% 13% 16% 13% 10% Making streets vibrant 25% 27% 24% 25% 29% 22% 32% 31% 20% 21% 25%
Service wording has been abbreviated to fit within the space provided. Please see the Appendix for the full service wording.
Significantly higher than subgroup indicated by letter. (at 95% confidence level).
BCDEFGHIJK Q11. And, should the City invest more, less, or the same amount on this service? Base: Residents asked about a particular service (n varies)
© 2018 Ipsos 40
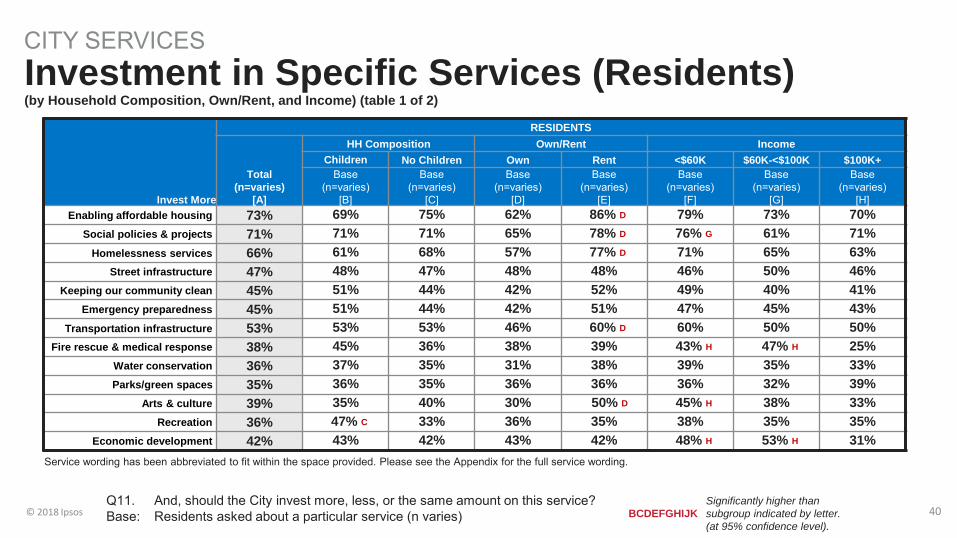
CITY SERVICES Investment in Specific Services (Residents) (by Household Composition, Own/Rent, and Income) (table 1 of 2)
Invest More
RESIDENTS
Total (n=varies)
[A]
HH Composition Own/Rent Income Children No Children Own Rent <$60K $60K-<$100K $100K+
Base (n=varies)
[B]
Base (n=varies)
[C]
Base (n=varies)
[D]
Base (n=varies)
[E]
Base (n=varies)
[F]
Base (n=varies)
[G]
Base (n=varies)
[H] Enabling affordable housing 73% 69% 75% 62% 86% D 79% 73% 70%
Social policies & projects 71% 71% 71% 65% 78% D 76% G 61% 71% Homelessness services 66% 61% 68% 57% 77% D 71% 65% 63%
Street infrastructure 47% 48% 47% 48% 48% 46% 50% 46% Keeping our community clean 45% 51% 44% 42% 52% 49% 40% 41%
Emergency preparedness 45% 51% 44% 42% 51% 47% 45% 43% Transportation infrastructure 53% 53% 53% 46% 60% D 60% 50% 50%
Fire rescue & medical response 38% 45% 36% 38% 39% 43% H 47% H 25% Water conservation 36% 37% 35% 31% 38% 39% 35% 33% Parks/green spaces 35% 36% 35% 36% 36% 36% 32% 39%
Arts & culture 39% 35% 40% 30% 50% D 45% H 38% 33% Recreation 36% 47% C 33% 36% 35% 38% 35% 35%
Economic development 42% 43% 42% 43% 42% 48% H 53% H 31% Service wording has been abbreviated to fit within the space provided. Please see the Appendix for the full service wording.
Significantly higher than subgroup indicated by letter. (at 95% confidence level).
BCDEFGHIJK Q11. And, should the City invest more, less, or the same amount on this service? Base: Residents asked about a particular service (n varies)

© 2018 Ipsos 41
CITY SERVICES Investment in Specific Services (Residents) (by Household Composition, Own/Rent, and Income) (table 2 of 2)
Invest More
RESIDENTS
Total (n=varies)
[A]
HH Composition Own/Rent Income Children No Children Own Rent <$60K $60K-<$100K $100K+
Base (n=varies)
[B]
Base (n=varies)
[C]
Base (n=varies)
[D]
Base (n=varies)
[E]
Base (n=varies)
[F]
Base (n=varies)
[G]
Base (n=varies)
[H] Police services 36% 39% 35% 38% 36% 40% 40% 31%
Garbage & green bin collection 30% 32% 30% 26% 37% D 35% 32% 25% Library services 30% 33% 29% 29% 33% 34% 26% 28%
Development & building permits 38% 45% 36% 44% E 33% 40% 35% 40% Urban design 33% 31% 33% 29% 38% 38% 25% 30%
Bylaw enforcement 28% 29% 27% 29% 28% 33% 26% 24% Availability of online services 22% 27% 21% 21% 26% 25% 25% 20%
Parking 31% 30% 31% 27% 36% D 37% H 37% H 23% Facilitating film/special events 21% 23% 20% 20% 22% 26% H 23% 15%
Multi-channel service access 17% 17% 17% 13% 22% D 20% 19% 13% Services to enhance parks 24% 32% C 21% 21% 28% 26% 23% 22%
Online payment services 12% 11% 12% 11% 15% 15% 12% 10% Making streets vibrant 25% 30% 24% 22% 31% D 31% 22% 23%
Service wording has been abbreviated to fit within the space provided. Please see the Appendix for the full service wording.
Significantly higher than subgroup indicated by letter. (at 95% confidence level).
BCDEFGHIJK Q11. And, should the City invest more, less, or the same amount on this service? Base: Residents asked about a particular service (n varies)
© 2018 Ipsos 42
CITY SERVICES Investment in Specific Services (Businesses)
Businesses
40%
26%
21%
21%
20%
29%
21%
20%
27%
12%
37%
64%
70%
67%
74%
54%
64%
61%
52%
79%
19%
7%
5%
5%
4%
16%
9%
10%
19%
7%
Transportation infrastructure
Library services
Licensing & support
Multi-channel service access
Availability of online services
Making streets vibrant
Bylaw enforcement
Facilitating film/special events
Parking
Online payment services
53%
50%
47%
52%
48%
45%
38%
35%
32%
31%
43%
48%
48%
33%
39%
46%
57%
59%
62%
61%
3%
1%
3%
9%
8%
5%
5%
2%
2%
7%
Street infrastructure
Keeping our community clean
Emergency preparedness
Development & building permits
Economic development
Long-range planning
Police services
Fire rescue & medical response
Garbage & green bin collection
Urban design
Q11. And, should the City invest more, the same amount, or less on this service? Base: All businesses (n=200)
Service wording has been abbreviated to fit within the space provided. Please see the Appendix for the full service wording.
Invest more Invest the same Invest less Don’t know Net Net = invest more minus invest less
+50
+49
+44
+43
+40
+40
+33
+33
+30
+24
+21
+19
+16
+16
+16
+13
+12
+10
+8
+5
© 2018 Ipsos 43
38% 52%
33% 31%
28% 21%
22% 20%
31% 27%
21% 20%
17% 21%
12% 12%
25% 29%
40% 33%
56% 61%
60% 64%
66% 74%
47% 52%
65% 61%
65% 67%
78% 79%
53% 54%
14% 9%
10% 7%
8% 9%
4% 4%
18% 19%
10% 10%
7% 5%
7% 7%
21% 16%
ResidentsBusinesses
ResidentsBusinesses
ResidentsBusinesses
ResidentsBusinesses
ResidentsBusinesses
ResidentsBusinesses
ResidentsBusiness
ResidentsBusiness
ResidentsBusinesses
Development & building permits
Urban design
Bylaw enforcement
Availability of online services
Parking
Facilitating film/special events
Multi-channel service access
Online payment service
Making streets vibrant
CITY SERVICES Investment in Specific Services
47% 53%
45% 50%
45% 47%
53% 40%
38% 35%
42% 48%
36% 38%
30% 32%
30% 26%
48% 43%
53% 48%
50% 48%
32% 37%
58% 59%
43% 39%
56% 57%
66% 62%
65% 64%
4% 3%
2% 1%
2% 3%
14% 19%
1% 2%
12% 8%
6% 5%
2% 2%
4% 7%
ResidentsBusinesses
ResidentsBusinesses
ResidentsBusiness
ResidentsBusinesses
ResidentsBusinesses
ResidentsBusinesses
ResidentsBusinesses
ResidentsBusinesses
ResidentsBusinesses
Businesses Residents
Q11. And, should the City invest more, the same amount, or less on this service? Base: Residents asked about a particular service (n varies); All businesses (n=200)
Street infrastructure
Keeping our community clean
Emergency preparedness
Transportation infrastructure
Fire rescue & medical response
Economic development
Police services
Garbage & green bin collection
Library services
SUMMARY OF INVESTMENT FOR SERVICES ASKED TO BOTH RESIDENTS AND BUSINESSES. Service wording has been abbreviated to fit within the space provided. Please see the Appendix for the full service wording.
+43 +50
Invest more
Invest the same
Invest less
Don’t know
Net Net = invest more minus invest less
Invest more
Invest the same
Invest less
Don’t know
Net Net = invest more minus invest less
+43 +49
+43 +44
+39 +21
+37 +33
+30 +40
+30 +33
+28 +30
+26 +19
+24 +43
+23 +24
+20 +12
+18 +16
+13 +8
+11 +10
+10 +16
+5 +5
+4 +13

© 2018 Ipsos 44
VALUE FOR TAXES
© 2018 Ipsos 45
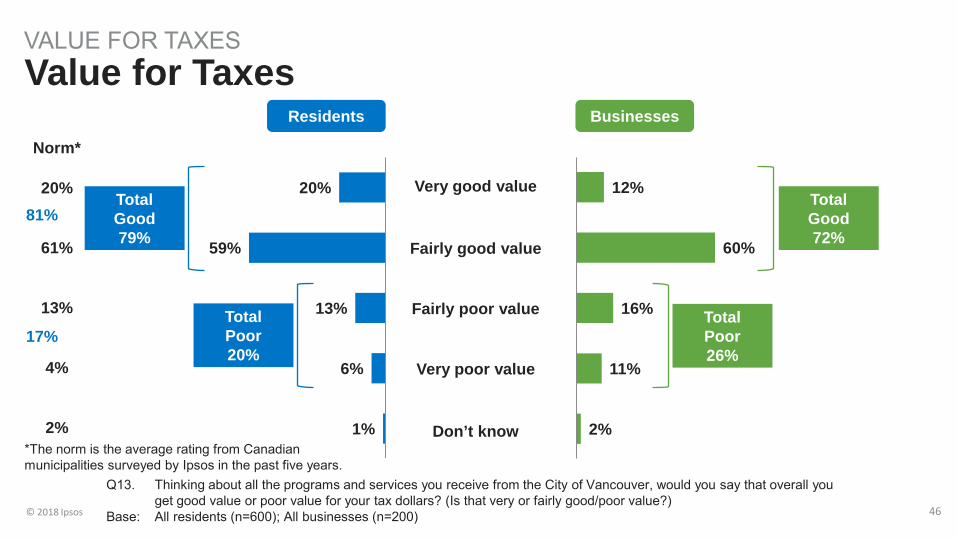
Value for Taxes Section Summary The majority of residents and businesses say they receive good value for their municipal tax dollars, consistent with the norm. Overall, 79% of residents and 72% of businesses say they receive ‘very’ or ‘fairly’ good value for their municipal tax dollars. In comparison, the normative resident score is 81% total good value.
• Residents living in households without children under the age of 18 are more likely to say they receive good value (combined ‘very/fairly good value’ ratings) for their municipal tax dollars (81% vs. 72% of those with children at home).
© 2018 Ipsos 46
Very good value
Fairly good value
Fairly poor value
Very poor value
Don’t know
12%
60%
16%
11%
2%
20%
59%
13%
6%
1%
Norm*
20%
61%
13%
4%
2%
Total Good 79%
Total Poor 20%
Total Good 72%
Total Poor 26%
81%
17%
Q13. Thinking about all the programs and services you receive from the City of Vancouver, would you say that overall you get good value or poor value for your tax dollars? (Is that very or fairly good/poor value?)
Base: All residents (n=600); All businesses (n=200)
Value for Taxes VALUE FOR TAXES
Residents Businesses
*The norm is the average rating from Canadian municipalities surveyed by Ipsos in the past five years.

© 2018 Ipsos 47
WEIGHTED SAMPLE CHARACTERISTICS
© 2018 Ipsos 48
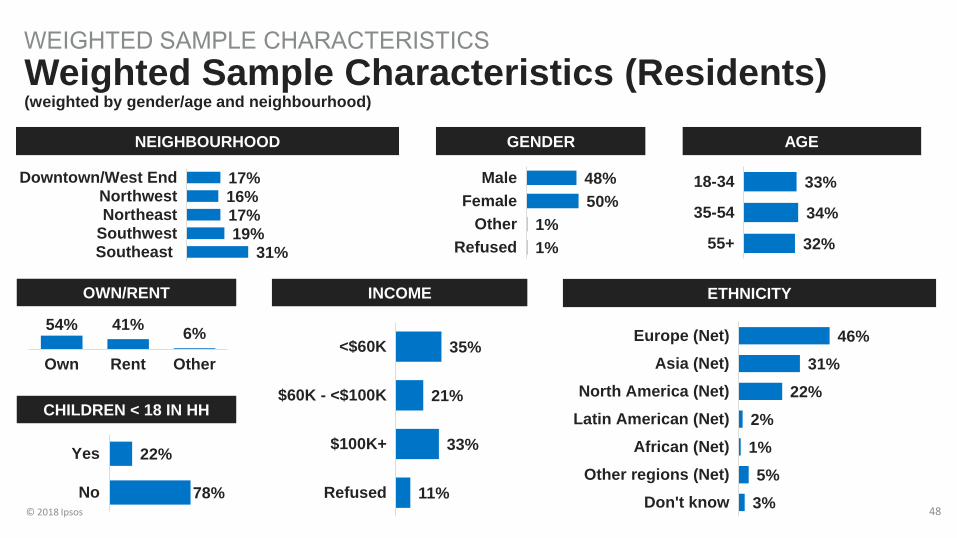
54% 41% 6%
Own Rent Other
GENDER AGE NEIGHBOURHOOD
17% 16% 17% 19%
31%
Downtown/West EndNorthwestNortheast
SouthwestSoutheast
INCOME OWN/RENT
35%
21%
33%
11%
<$60K
$60K - <$100K
$100K+
Refused
33%
34%
32%
18-34
35-54
55+
ETHNICITY
46% 31%
22% 2% 1% 5% 3%
Europe (Net)Asia (Net)
North America (Net)Latin American (Net)
African (Net)Other regions (Net)
Don't know
48% 50%
1% 1%
MaleFemale
OtherRefused
Weighted Sample Characteristics (Residents) (weighted by gender/age and neighbourhood)
WEIGHTED SAMPLE CHARACTERISTICS
CHILDREN < 18 IN HH
22%
78%
Yes
No
© 2018 Ipsos 49
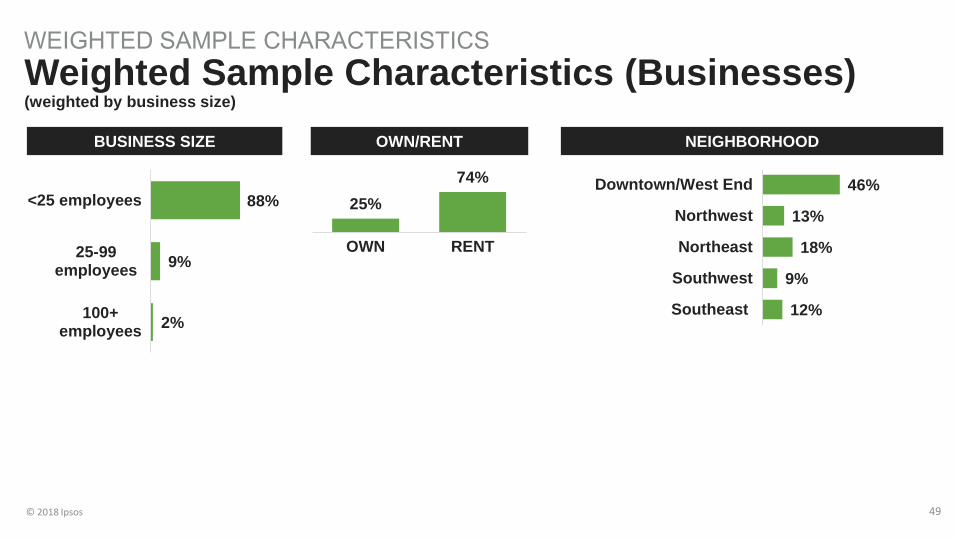
25% 74%
OWN RENT
OWN/RENT NEIGHBORHOOD BUSINESS SIZE
88%
9%
2%
<25 employees
25-99employees
100+employees
Weighted Sample Characteristics (Businesses) (weighted by business size)
WEIGHTED SAMPLE CHARACTERISTICS
46%
13%
18%
9%
12%
Downtown/West End
Northwest
Northeast
Southwest
Southeast

© 2018 Ipsos 50
APPENDIX
© 2018 Ipsos 51
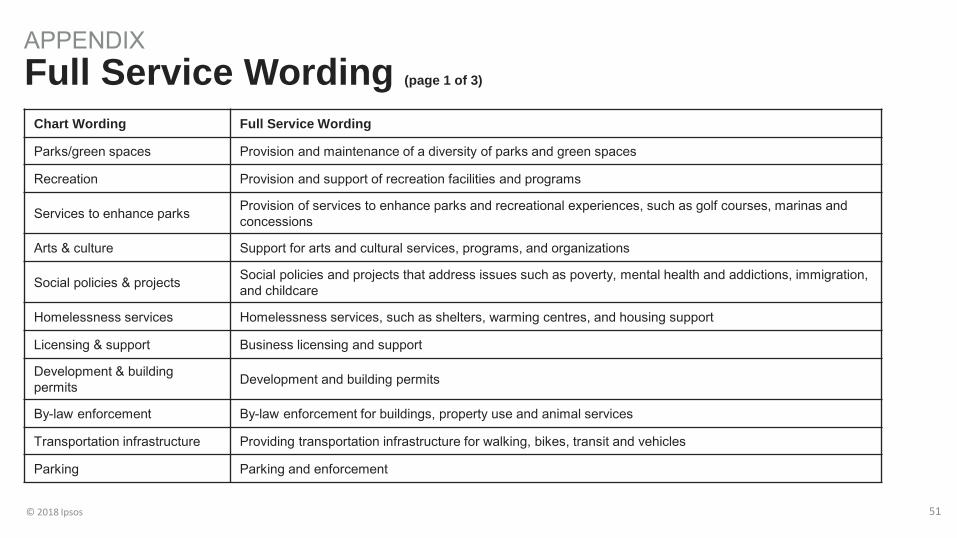
APPENDIX Full Service Wording (page 1 of 3)
Chart Wording Full Service Wording
Parks/green spaces Provision and maintenance of a diversity of parks and green spaces
Recreation Provision and support of recreation facilities and programs
Services to enhance parks Provision of services to enhance parks and recreational experiences, such as golf courses, marinas and concessions
Arts & culture Support for arts and cultural services, programs, and organizations
Social policies & projects Social policies and projects that address issues such as poverty, mental health and addictions, immigration, and childcare
Homelessness services Homelessness services, such as shelters, warming centres, and housing support
Licensing & support Business licensing and support
Development & building permits Development and building permits
By-law enforcement By-law enforcement for buildings, property use and animal services
Transportation infrastructure Providing transportation infrastructure for walking, bikes, transit and vehicles
Parking Parking and enforcement
© 2018 Ipsos 52
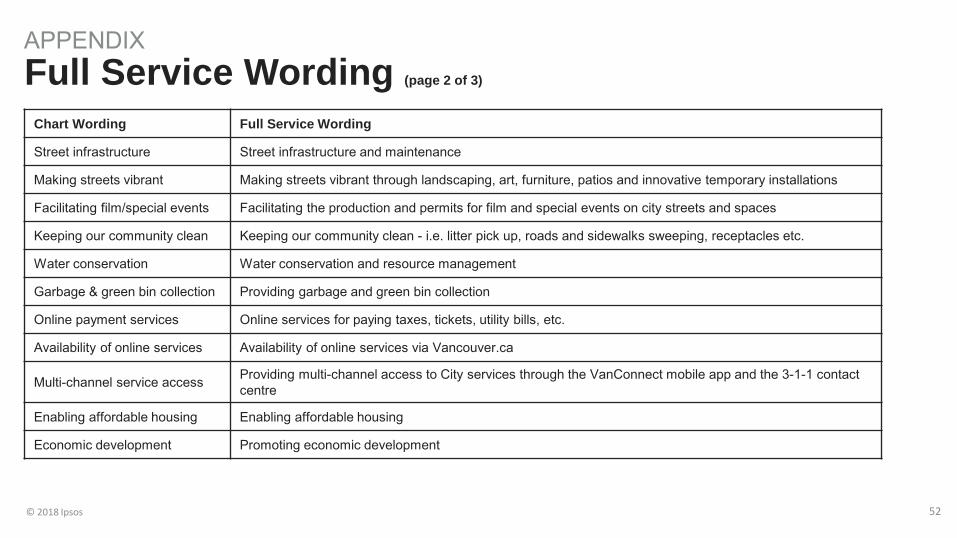
APPENDIX Full Service Wording (page 2 of 3)
Chart Wording Full Service Wording
Street infrastructure Street infrastructure and maintenance
Making streets vibrant Making streets vibrant through landscaping, art, furniture, patios and innovative temporary installations
Facilitating film/special events Facilitating the production and permits for film and special events on city streets and spaces
Keeping our community clean Keeping our community clean - i.e. litter pick up, roads and sidewalks sweeping, receptacles etc.
Water conservation Water conservation and resource management
Garbage & green bin collection Providing garbage and green bin collection
Online payment services Online services for paying taxes, tickets, utility bills, etc.
Availability of online services Availability of online services via Vancouver.ca
Multi-channel service access Providing multi-channel access to City services through the VanConnect mobile app and the 3-1-1 contact centre
Enabling affordable housing Enabling affordable housing
Economic development Promoting economic development
© 2018 Ipsos 53
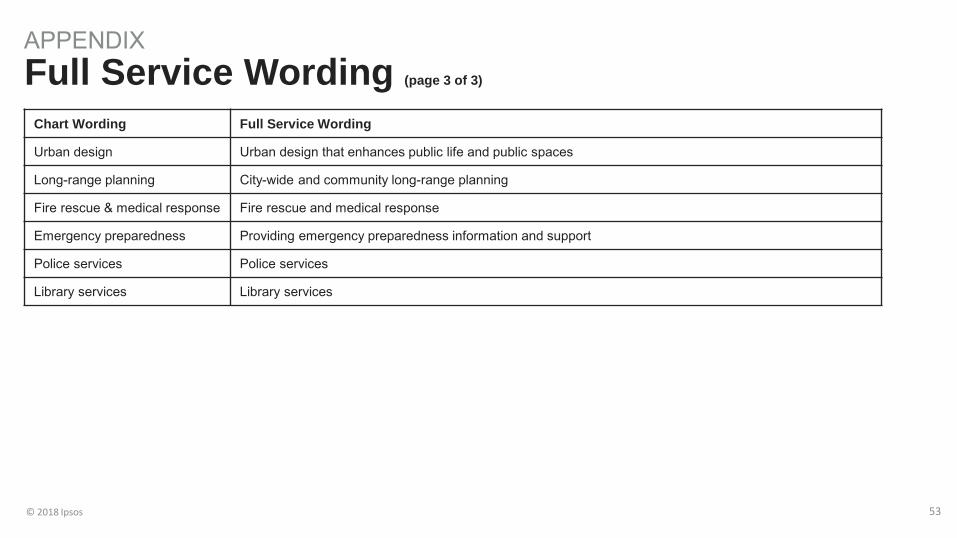
APPENDIX Full Service Wording (page 3 of 3)
Chart Wording Full Service Wording
Urban design Urban design that enhances public life and public spaces
Long-range planning City-wide and community long-range planning
Fire rescue & medical response Fire rescue and medical response
Emergency preparedness Providing emergency preparedness information and support
Police services Police services
Library services Library services