civil engineering ’13 -...
TRANSCRIPT

CIVILENGINEERING ’134th International Scientific Conference
PROCEEDINGSVolume 4
Jelgava 2013
Part II
Latvia University of AgricultureFaculty of Rural Engineering

International Scientific Conference and Proceedings “Civil Engineering 13” – dedicated to the 150th anniversary of the higher agriculture education in Latvia and the Latvia University of Agriculture,
and the 275th anniversary of the Jelgava Palace
The 4th International Scientific Conference „Civil Engineering 13” is organized on a regular basis and this year it was held on May 16-17, 2013. More than 80 reports were presented at six conference sections. Reports were presented by scientists and civil engineering professionals from the Latvia University of Agriculture, Riga Technical University as well as scientists from universities of Lithuania, Estonia, Russia, Poland, Netherlands and other countries. The main research directions represented at the conference were: construction and materials, landscape architecture, land management and geodesy, building and renovation, structural engineering, environment and environmental effects, industrial energy efficiency and others. One of the nowadays research priorities – effective usage and saving of energy resources, received a lot of attention - 10 scientific reports were presented at the “Industrial Energy Efficiency” section.
The conference „Civil Engineering 13” international scientific committee is represented by civil engineering experts and academic staff from Latvia, Lithuania, Estonia, Poland, Finland,Sweden, Czech Republic, Netherlands.
The 4th International Scientific Conference „Civil Engineering 13” Proceedings are developed in a notable anniversary year for all of us – the conference and proceedings are dedicated to the 150 anniversary of the higher agriculture education in Latvia and the Latvia University of Agriculture. The home of the Latvia University of Agriculture is the Jelgava Palace - the largest architectural monument in the Baltic States. The Jelgava Palace this year is celebrating its 275 anniversary years. We are proud that this monument is fundamental and outstanding and it definitely influences also modern building tendencies in Latvia and abroad.
It is important to note that scientific papers from previous International Scientific Conference „Civil Engineering 11” Proceedings were included in the AGRIS, CAB ABSTRACTS, EBSCO Central & Eastern European Academic Source and SCOPUS databases.
Scientific Conference "Civil Engeneering" has become very traditional and I hope that in future it will expand and will provide a collection of excellent researches.
Sincerely,Dr. sc. ing., prof. Juris Skujans
Rector of Latvia University of Agriculture
Organizing Committee
Chairpersons:Dr.sc.ing. Janis Kreilis, Latvia University of AgricultureDr.arch. Una Ile, Latvia University of Agriculture
Co-chairperson:Mg.sc.ing. Silvija Strausa, Latvia University of Agriculture
Members:Dr.sc.ing. Guntis Andersons, Latvia University of AgricultureDr.habil.sc.ing. Janis Brauns, Latvia University of AgricultureMg.sc.ing. Raitis Brencis, Latvia University of AgricultureMg.sc.ing. Arturs Gaurilka, Latvia University of AgricultureDr.oec. Sandra Gusta, Latvia University of AgricultureMg.sc.ing. Linda Grinberga, Latvia University of Agriculture
Mg.arch. Lilita Lazdane, Latvia University of AgricultureDr.sc.ing. Andris Steinerts, Latvia University of AgricultureDr.arch. Daiga Zigmunde, Latvia University of AgricultureMg.arch. Kristine Vugule, Latvia University of AgricultureDr.sc.ing. Reinis Ziemelnieks, Latvia University of AgricultureDr.arch. Aija Ziemelniece, Latvia University of Agriculture
_________________________________________________________________________
_________________________________________________________________________
LATVIA UNIVERSITY OF AGRICULTURE
FACULTY OF RURAL ENGINEERING
Department of Architecture and Building
Department of Structural Engineering
CIVIL ENGINEERING ’13 4
th International Scientific Conference
PROCEEDINGS
Volume 4
Part II
Jelgava 2013
ISSN 2255-7776

_________________________________________________________________________
_________________________________________________________________________
Civil Engineering` 13
4th
International Scientific Conference Proceedings, Vol. 4
Jelgava, Latvia University of Agriculture, 2013, 81 pages
ISSN 2255-7776
SCIENTIFIC COMMITTEE
Chairperson
Dr.sc.ing. Juris Skujans, Latvia University of Agriculture, Latvia
Co-chairpersons
Dr.sc.ing. Andris Steinerts, Latvia University of Agriculture, Latvia
Dr.arch. Daiga Zigmunde, Latvia University of Agriculture, Latvia
Members
Ainars Paeglitis, Dr.sc.ing., Riga Technical University, Latvia
Juris Skujans, Dr.sc.ing., Latvia University of Agriculture, Latvia
Arturs Lesinskis, Dr.sc.ing., Latvia University of Agriculture, Latvia
Eriks Tilgalis, Dr.sc.ing., Latvia University of Agriculture, Latvia
Gintaras Stauskis, Dr., Vilnius Gediminas Technical University, Lithuania
Jaan Miljan, Dr.sc.ing., Estonian University of Life Science, Estonia
Janis Brauns, Dr.habil.sc.ing., Latvia University of Agriculture, Latvia
Janis Kreilis, Dr.sc.ing., Latvia University of Agriculture, Latvia
Lilita Ozola, Dr.sc.ing., Latvia University of Agriculture, Latvia
Simon Bell, Dr.arch, Estonian University of Life Science, Estonia
Daiga Zigmunde, Dr.arch., Latvia University of Agriculture, Latvia
Ralejs Tepfers, Dr.sc.ing., Chalmers University of Technology, Sweden
Raimondas Sadzevicius, Dr.sc.ing., Aleksandras Stulginskis University, Lithuania
Ugis Bratuskins, Dr.arch., Riga Technical University, Latvia
Uldis Iljins, Dr.habil.sc.ing., Latvia University of Agriculture, Latvia
Velta Parsova, Dr.oec., Latvia University of Agriculture, Latvia
Anatolijs Borodinecs, Dr.sc.ing., Riga Tehnical University, Latvia
Nico Scholten, PhD, Expert Centre Regulations in Building, Netherland
Aija Ziemelniece, Dr.arch., Latvia University of Agriculture, Latvia
Reinis Ziemelnieks, Dr.sc.ing., Latvia University of Agriculture, Latvia
Reviewers
J. Skujans, A. Paeglitis, A. Lesinskis, E. Tilgalis, G. Stauskis, J. Miljan, J. Brauns, J. Kreilis, L. Ozola, S. Bell,
D. Zigmunde, R. Tepfers, U. Bratuskins, U. Iljins, S. Strausa, G. Andersons, S. Gusta, A. Ziemelniece, A. Borodinecs,
R. Sadzevicius, R. Ziemelnieks, K. Zaleckis, U. Ile, R. Misius, I. Niedzwiecka-Filipiak, E. Navickiene, N. Liba,
J. Kaminskis, I. Bimane, A. Jankava, U. Skadins, V. Parsova, M. Pelse
ABSTRACTED AND INDEXED: AGRIS, CAB ABSTRACTS, EBSCO Central & Eastern European Academic Source,
SCOPUS. Note: the data bases select the articles from the proceedings for including them in their data bases after
individual qualitative examination.
EDITORS
Editor of language
Diana Svika, Mg.paed., Larisa Malinovska, Dr.paed.
Technical editor
Madara Markova, Mg.arch.
Latvia University of Agriculture
Printed in SIA Puse Plus
The collection of articles provides important ideas for further scientific activities and is dedicated to the 150 anniversary
of the Latvia University of Agriculture.
PROCEEDINGS ARE SUPPORTED BY
4th International Conference CIVIL ENGINEERING`13 Proceedings Part II
CONTENT
_____________________________________________________________________________________________________________
_______________________________________________________________________________________
3
Construction and Materials ................................................................................................. 5
Aleksandrs Korjakins, Liga Upeniece, Diana Bajare
HIGH EFFICIENCY POROUS CERAMICS WITH CONTROLLABLE POROSITY ....... 5
Uldis Lencis, Aigars Udris, Aleksandrs Korjakins
EFFECT OF ELEVATED TEMPERATURE ENVIRONMENT ON ULTRASONIC
PULSE VELOCITY IN CURING CONCRETE ................................................................. 11
Andina Sprince,Leonids Pakrastinsh, Aleksandrs Korjakins
CREEP BEHAVIOR OF HIGH PERFORMANCE FIBER REINFORCED CONCRETE
(HPFRC) ............................................................................................................................... 19
Patricija Kara
RHEOLOGICAL AND STRENGTH PERFORMANCE OF CEMENT PASTE WITH
GROUND FLUORESCENT LAMP WASTE GLASS AND ASH ..................................... 23
Building and Renovation ................................................................................................... 28
Nico P.M. Scholten, Rob de Wildt, Ton.C.W.M. Vrouwenvelder
NEED TO INNOVATE THE DUTCH BUILDING REGULATION ................................. 28
Nico P.M. Scholten
PROBABILISM, THE WAY OUT FOR PERFORMANCE BASED BUILDING
REGULATIONS .................................................................................................................. 39
Nico P.M. Scholten, Ton C.W.M. Vrouwenvelder
EUROCODES AND STRUCTURAL SAFETY OF THE EXISTING BUILDINGS -
CONSIDERING THE PUBLICATION OF THE DUTCH NEN 8700 ............................... 49
Landscape Architecture .................................................................................................... 56
Patricija Kara, Peteris Pastars
THE BENEFITS OF GREEN ROOFING FOR LATVIAN BUILDING
ENVIRONMENT ............................................................................................................... 56
Olga Pasko
LANDSCAPING OF SIBERIAN CITIES ........................................................................... 63
Environment and Environmental Effects......................................................................... 68
Romans Neilands, Simona Larsson, Roberts Neilands, Boriss Gjunsburgs, Maris Bernats,
Elina Strade
HIGH STRENGTH WASTEWATER TREATMENT PROCESS SIMULATION ............ 68
CONTENT

4th International Conference CIVIL ENGINEERING`13 Proceedings Part II
CONTENT
_____________________________________________________________________________________________________________
_________________________________________________________________________
4
Aleksandrs Polyakovs, Viktors Mironovs, Aleksandrs Korjakins, Andrej Shishkin,
Janis Baronins
PREPARATION OF COAL-WATER SLURRY USING A HIGH-SPEED MIXER-
DISPERSER ......................................................................................................................... 77

4th International Conference CIVIL ENGINEERING`13 Proceedings Part II
CONSTRUCTION AND MATERIALS _____________________________________________________________________________________________________________
_______________________________________________________________________________________
5
HIGH EFFICIENCY POROUS CERAMICS WITH CONTROLLABLE
POROSITY
Aleksandrs Korjakins*, Liga Upeniece**, Diana Bajare***
Riga Technical University, Chair of building materials and wares
E-mail: *aleks @latnet.lv, ** liga.upeniece @rtu.lv, *** [email protected]
one empty line 10pt here>
ABSTRACT
The increasingly growing anxiety in society about global warming and interest about construction materials
which are less harmful to the environment, encourages manufactures and scientists to think about the use of
more effective resources which are available and necessary for production, as well as finding possibilities
and solutions for the decrease of primary energy resources depletion by producing ecological materials from
local raw materials such as clay – the main raw material for the production of ceramic materials and their
products, as well as more widely distributed sediments which mainly form the upper part of the Earth’s crust.
Notwithstanding the distribution of clay, the current amount of clay usage is similar to that of the second part
of the ‘50s which is equal to the middle of the ‘30s of the past century.
Besides traditional ceramic materials, porous ceramics has also been widely researched and is becoming a
more and more popular material in the world, thanks to its wide possibilities of usage in different
applications and technology industries – from construction to mechanical engineering and even cosmic
applications.
The chemical-mineral content, type of formation, thermal processing provisions, etc., of raw materials
determine the ceramic material’s porosity characteristics.
Many researchers have investigated porous ceramics with efficient properties, in order to research factors
which influence the microstructure of porous ceramics, using polymer-material saturation with clay slicker
and concluding how to produce porous ceramics. During the presented research porous ceramics was
produced, by using a polymer material which was saturated with clay slicker.
The obtaining of porous ceramics, using a foam polyurethane pump as a burnable filler, is promoted by the
fact that current technology used for producing foam polyurethane allows it to form preferable porous
structures within wide ranges, with pore dimensions starting from some micrometers up to 2-3 millimeters.
Porous ceramic materials obtained within this research breathe; they are thermostable, resistant to thermal
impacts, corrosion, and are easy to process.
Key words: ceramics, ecological materials, insulation materials, production waste, controllable porosity
INTRODUCTION
Energy, energy efficiency, greenhouse effect and
resources are the words which are most commonly
used emphasizing the role of heat insulation for
buildings, because the inhabited homes are the
greatest direct energy consumers in Latvia. Using
its own resources, Latvia produces only a small part
of consumed energy, and at the same time the cost
of energy resources is increasing in geometrical
progression.
Heat insulation is an effective way to decrease the
costs of heat supply and thus economize. Heating
does not assume the waste of energy resources and
minimize greenhouse effect gas exudation in the
atmosphere. Besides, the smaller the amount of fuel
used for heating (but during the summer – for
cooling), the less the environment is polluted. Good
heat insulation not only improves the microclimate
indoors, but also minimizes unfavourable changes
in the climate.
The modern building industry offers a wide choice
of heating materials, where the range of
environmentally friendly, nontoxic materials and
the range of materials produced by local
manufacturers is slowly increasing, to where one of
these materials could be porous ceramics, which
can be obtained by the polymer sponge saturation
method.
The materials containing tailored porosity exhibit
special properties and features that usually cannot
be achieved by their conventional dense
counterparts. Therefore, nowadays porous materials
find many applications as end products and in
several technological processes (Studart et al,
2006). Contrary to metallic and polymeric
structures, pores have been traditionally avoided in
ceramic components because of their inherently
brittle nature. However, an increasing number of
applications that require porous ceramics have
appeared in the last decades, especially for
CONSTRUCTION AND MATERIALS
Building and Renovation
4th International Conference CIVIL ENGINEERING`13 Proceedings Part II
CONSTRUCTION AND MATERIALS _____________________________________________________________________________________________________________
_________________________________________________________________________
6
environments where high temperatures, extensive
wear and corrosive media are involved.
Such applications include, for example, the
filtration of molten metals, high-temperature
thermal insulation, support for catalytic reactions,
filtration of particulates from diesel engine exhaust
gases and filtration of hot corrosive gases in various
industrial processes (Rice, 1998, Scheffer and
Colombo, 2005, Studart et al., 2006).
Solid sponges (i.e. open-celled foams) belong to the
cellular materials. The key characteristics of solid
sponges are a high and continuously accessible
porosity of typically about 75-95%. (Dietrich et al.
2009, Dietrich et al., 2010).
The nature of the polymer sponge method is that in
the scope of this method a thin layer of ceramic
slurry is coated on the surface of the struts of a
reticulate polymer sponge. After burning out the
polymer skeleton, a positive replica of the sponge is
obtained. However, the space occupied by the
polymer remains as an internal defect in the ceramic
body and the thin layer of ceramic slurry coating on
the polymer sponge forms very thin walls between
pores, which results in a structure of low
mechanical strength (Ramay H.R and Zhang M.,
2003). This method is in fact considered as the first
method deliberately used for the production of
macroporous ceramics. The original invention dates
back to the early 1960s, when Schwartzwalder and
Somers (Schwartzwalder and Somers, 1963) started
using polymeric sponges as templates to prepare
ceramic cellular structures of various pore sizes,
porosities and chemical compositions. Since then
this technique has become the most popular method
to produce macroporous ceramics and is extensively
used today (Studart et al., 2006).
By the use of the polymer sponge saturation method
we can get not only samples with particular pore
sizes and amounts, but also with different
geometrical characteristics and shapes. The polymer sponge method is not the only one for
obtaining such porous ceramics, methods like sacrificial template and direct foaming (Studart et
al., 2006), each of the methods has its own merits
and drawbacks (Young Yang et al., 2010).
A disadvantage of the polymeric sponge replica
technique is the fact that the struts of the reticulated
structure are often cracked during pyrolysis of the
polymeric sponge, markedly degrading the final
mechanical strength of the porous ceramic
(Sepulveda, 1997).
The strut flaws reduce the compressive strength of
the porous ceramics to levels usually lower than the
strength theoretically predicted for open cell
structures (Gibson and Ashby, 1997).
As the alternative for the use of such a method, Sherman et al. developed a similar process to the
polymeric sponge replica method, where the
polymeric sponge is first converted into a vitreous
carbon skeleton and is subsequently infiltrated with
reactive gaseous species to form macroporous
ceramics of many different carbides, oxides,
borides, nitrides and silicides (Studart et al., 2006).
As the polymer sponge saturation method was used
in the study for obtaining porous ceramics that in
spite of its processing simplicity and low processing
cost, it is not suitable for production of porous
ceramics with small pore sizes (< 200 μm), due to
the difficulty of obtaining an efficient slurry
impregnation into the polymeric sponge (Lange and
Miller, 1987), samples of porous ceramics will be
obtained from macropores. Predominantly open porous structures are produced
by this method, as the original cellular sponge has
to be accessible for the impregnation of the ceramic
suspension or precursor. However, the ratio of open
to closed pores in the final ceramic material may be
adjusted to a certain extent by controlling the
suspension viscosity and shear thinning behavior
(Studart et al., 2006).
Such types of macroporous ceramics with
interconnected open structures are widely used in
everyday life and modern industries because of their
inherent characteristics such as low thermal mass,
low thermal conductivity, controlled permeability,
high surface area, low density, high specific
strength and low dielectric constant (Ishizaki et al.,
1998, Young Yang et al., 2010).
Worldwide several researches for obtaining porous
ceramics have been performed, using the replica
method for production of porous ceramics. For
example, Silva with his colleagues did research,
using vegetal sponge for the production of a
reticulated ceramic that combines the morphology
of a vegetal sponge with ceramic properties, such as
thermal stability, resistance to chemical attack,
elevated porous degree and reticulation (Silva et al.,
2009). Reticulated ceramics are materials made up
of interconnected voids surrounded by a ceramic
net, perceived to have high permeability and low
density, thus rendering them suitable for many
applications (Saggio et al., 1992). These include
filters, catalysts, sensors, implants, among others
(Peng et al., 2000).
The polymeric sponge method was used to obtain a
reticulated ceramic in milimetric scale degree (5-
10mm) using a vegetal sponge, L. cylindrica species
as a template. The combination of the clay, K –
feldspar and sand promoted an ideal plasticity to the
slurry, leading to the morphology of the reticulated
ceramic was identical to the vegetal sponge used as
templating. Like the template structure, the
reticulated ceramic has a tridimensional structure,
where the ceramic fibers randomly link to each
other (Silva et al., 2009).
The Electro-Chemistry Institute of Belgrade
University performed a study for stating the factors
which have an influence on the microstructure of
porous ceramic. A clay slip saturated polymer
material was used in the above mentioned study and
4th International Conference CIVIL ENGINEERING`13 Proceedings Part II
CONSTRUCTION AND MATERIALS _____________________________________________________________________________________________________________
_______________________________________________________________________________________
7
it was concluded that the viscosity of the mixture
has an essential role in the production of porous
ceramics using the polymer sponge saturation
method (Tripkovic D., et al. 2006).
Samples of porous ceramics were produced within
the scope of the research, using the polymer-sponge
saturation method thus obtaining samples with
particular physical characteristics and strength
parameters.
The goal of the given research is to obtain a porous
ceramic material with specific features of strength
and density thus achieving a material that could be
used to insulate buildings.
MATERIALS AND METHODS
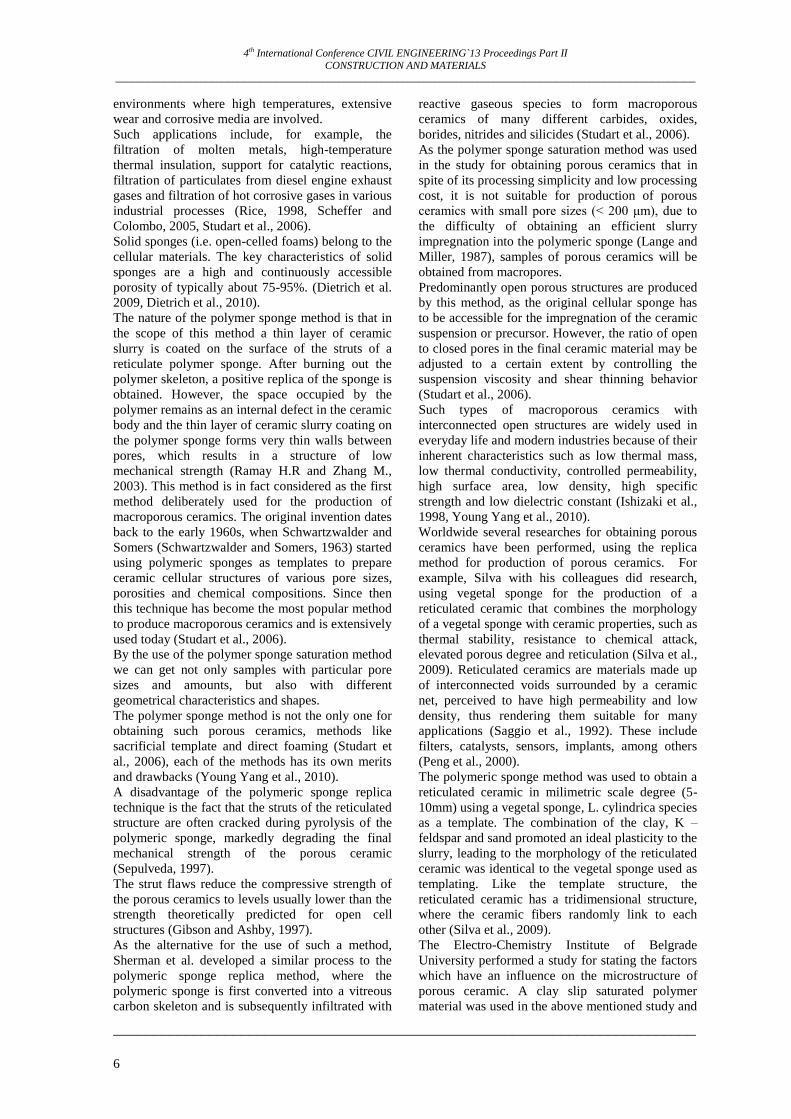
At the beginning of the research two different types
of polymer sponges were selected (Fig. 1a, 1b) and
the main consideration in the selection process of
such types of polymer sponges was their wide
availability and light saturation with ceramic slurry.
Figure 1a: Polymer sponge with pore size 1 - 3 mm
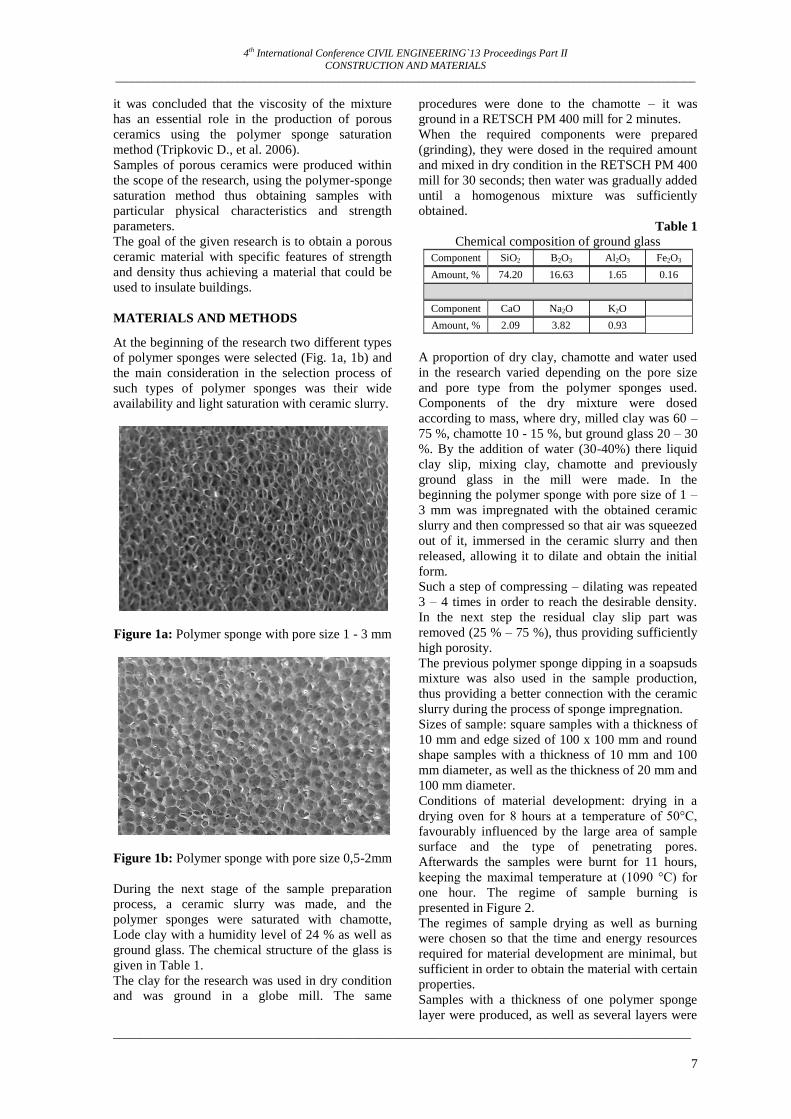
Figure 1b: Polymer sponge with pore size 0,5-2mm
During the next stage of the sample preparation
process, a ceramic slurry was made, and the
polymer sponges were saturated with chamotte,
Lode clay with a humidity level of 24 % as well as
ground glass. The chemical structure of the glass is
given in Table 1.
The clay for the research was used in dry condition
and was ground in a globe mill. The same
procedures were done to the chamotte – it was
ground in a RETSCH PM 400 mill for 2 minutes.
When the required components were prepared
(grinding), they were dosed in the required amount
and mixed in dry condition in the RETSCH PM 400
mill for 30 seconds; then water was gradually added
until a homogenous mixture was sufficiently
obtained.
Table 1 Chemical composition of ground glass
Component SiO2 B2O3 Al2O3 Fe2O3
Amount, % 74.20 16.63 1.65 0.16
Component CaO Na2O K2O
Amount, % 2.09 3.82 0.93
A proportion of dry clay, chamotte and water used
in the research varied depending on the pore size
and pore type from the polymer sponges used.
Components of the dry mixture were dosed
according to mass, where dry, milled clay was 60 –
75 %, chamotte 10 - 15 %, but ground glass 20 – 30
%. By the addition of water (30-40%) there liquid
clay slip, mixing clay, chamotte and previously
ground glass in the mill were made. In the
beginning the polymer sponge with pore size of 1 –
3 mm was impregnated with the obtained ceramic
slurry and then compressed so that air was squeezed
out of it, immersed in the ceramic slurry and then
released, allowing it to dilate and obtain the initial
form.
Such a step of compressing – dilating was repeated
3 – 4 times in order to reach the desirable density.
In the next step the residual clay slip part was
removed (25 % – 75 %), thus providing sufficiently
high porosity.
The previous polymer sponge dipping in a soapsuds
mixture was also used in the sample production,
thus providing a better connection with the ceramic
slurry during the process of sponge impregnation.
Sizes of sample: square samples with a thickness of
10 mm and edge sized of 100 x 100 mm and round
shape samples with a thickness of 10 mm and 100
mm diameter, as well as the thickness of 20 mm and
100 mm diameter.
Conditions of material development: drying in a
drying oven for 8 hours at a temperature of 50°C,
favourably influenced by the large area of sample
surface and the type of penetrating pores.
Afterwards the samples were burnt for 11 hours,
keeping the maximal temperature at (1090 °C) for
one hour. The regime of sample burning is
presented in Figure 2.
The regimes of sample drying as well as burning
were chosen so that the time and energy resources
required for material development are minimal, but
sufficient in order to obtain the material with certain
properties.
Samples with a thickness of one polymer sponge
layer were produced, as well as several layers were

4th International Conference CIVIL ENGINEERING`13 Proceedings Part II
CONSTRUCTION AND MATERIALS _____________________________________________________________________________________________________________
_________________________________________________________________________
8
combined and two different types of sponges were
used. Samples were produced in several layers
using several plates of polymer-sponge, then these
plates were joined when produced in the ceramic
slurry (in the process of sample saturation).One
thicker sample composed of several layers was
made after the sample was dried and burnt. (Fig.3.).
Figure 2: Regime of sample burning, using
polymer material sponge
Figure 3: Porous ceramic sample made of 3 layers
Figure 4: Sample with evened surface
By sample preparation for compressive strength
tests, their surface was evened out with a layer of
plaster paste (4 - 6 mm) from both sides (Fig. 4),
pressing the sample between two parallel, smooth
glass surfaces.
Verification of samples developed by the polymeric
sponge replica method was carried out by the
ZWICK Z100 perpendicular to the formation
direction of the samples, thus providing the
establishment of mean strength in the cross section,
reducing the influence of certain weakening, which
could have formed while samples were removed
from mounds and a non-homogenous structural
density in the direction of the cross-section
formation.
<insert one empty line 10pt here>
RESULTS AND DISCUSSION
Porous ceramic materials were obtained during
research. Compressive strength tests were
performed, as well as their volume density and
water absorption was determined.
Usage of polymeric sponge saturation with ceramic
slurry method, by varying quantity of grinded glass
in slurry, leads to development of several types of
materials. Three basic mixtues have been used in
further material production and testing:
1.) 70% clay, 20% ground glass, 10% chamotte;
2.) 65% clay, 25% ground glass, 10% chamotte;
3.) 60% clay, 30% ground glass, 10% chamotte.
The raw materials used, provide the acquisition of
necessary properties of porous ceramics where clay
serves as a cohesive substance, but chamotte
provides the necessary stiffness, by making a stable
frame during the burning process of the polymeric
sponge, whereas the glass provides higher strength
and better cohesion between the mixture and sponge
within the sample formation process.
From two different types of polymer sponges the
samples with the amount of glass 20-30% were
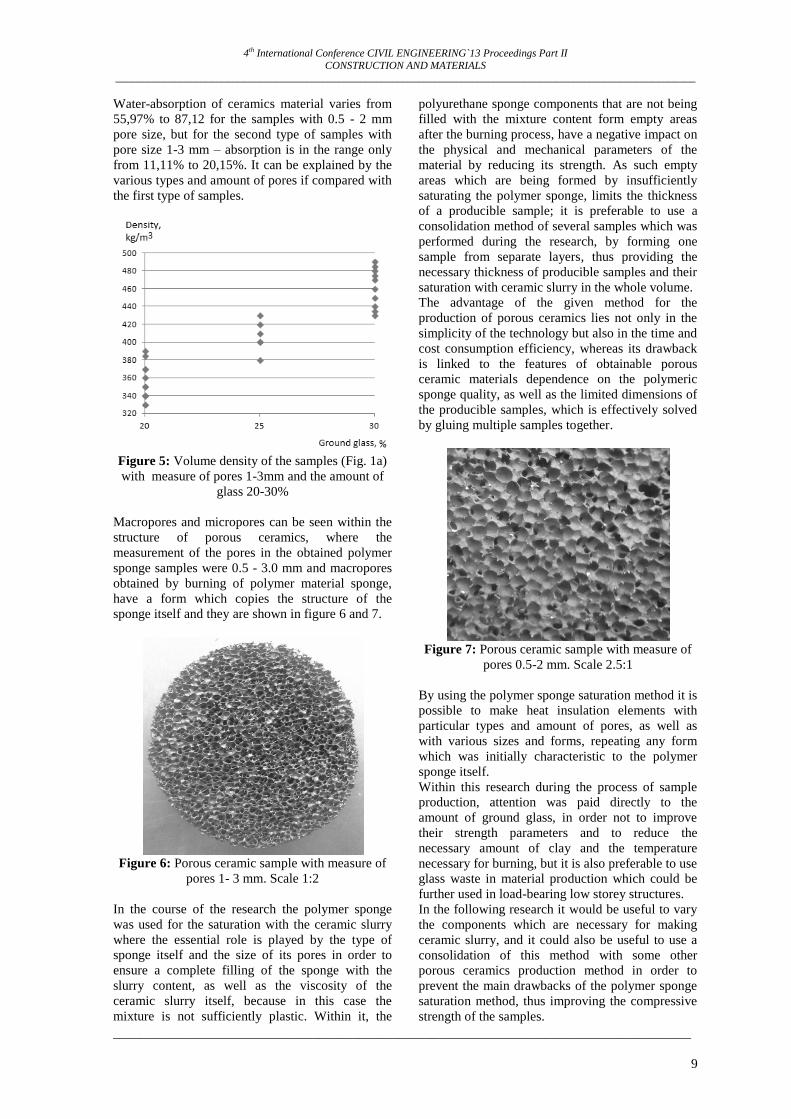
made. Their density was within the scope of 330 to
490 kg/m3, because the main aim of the experiment
was to improve the compressive strength
parameters ( Fig.5.).
Average volume density of the samples (Fig.6.)
with 20% of ground glass is 364 kg/m3, 408 kg/m3
for samples with 25% of ground glass and 462
kg/m3 for samples with 30% of ground glass.
Comparing the volume density of the samples
before and after burning, it decreased per 29.2% to
32.6% for the all types of samples after burning.
Average volume density of the samples (Fig.7.)
with 20% of ground glass is 380 kg/m3, 416 kg/m3
for samples with 25% of ground glass and 492
kg/m3 for samples with 30% of ground glass.
The size of samples, comparing them before and
after burning, decreased from 3-9% per edge length
and from 1-4% per thickness.
By comparing the sample compressive strength, a
higher strength was observed for the samples where
the amount of glass used was 20-30%. The highest
compressive strength was 1.84 MPa, using 30% of
ground glass and 1.42 MPa, using 25% of ground
glass. For the samples, using 20% of ground glass,
the highest compressive strength was 1.24 MPa.
4th International Conference CIVIL ENGINEERING`13 Proceedings Part II
CONSTRUCTION AND MATERIALS _____________________________________________________________________________________________________________
_______________________________________________________________________________________
9
Water-absorption of ceramics material varies from
55,97% to 87,12 for the samples with 0.5 - 2 mm
pore size, but for the second type of samples with
pore size 1-3 mm – absorption is in the range only
from 11,11% to 20,15%. It can be explained by the
various types and amount of pores if compared with
the first type of samples.
Figure 5: Volume density of the samples (Fig. 1a)
with measure of pores 1-3mm and the amount of
glass 20-30%
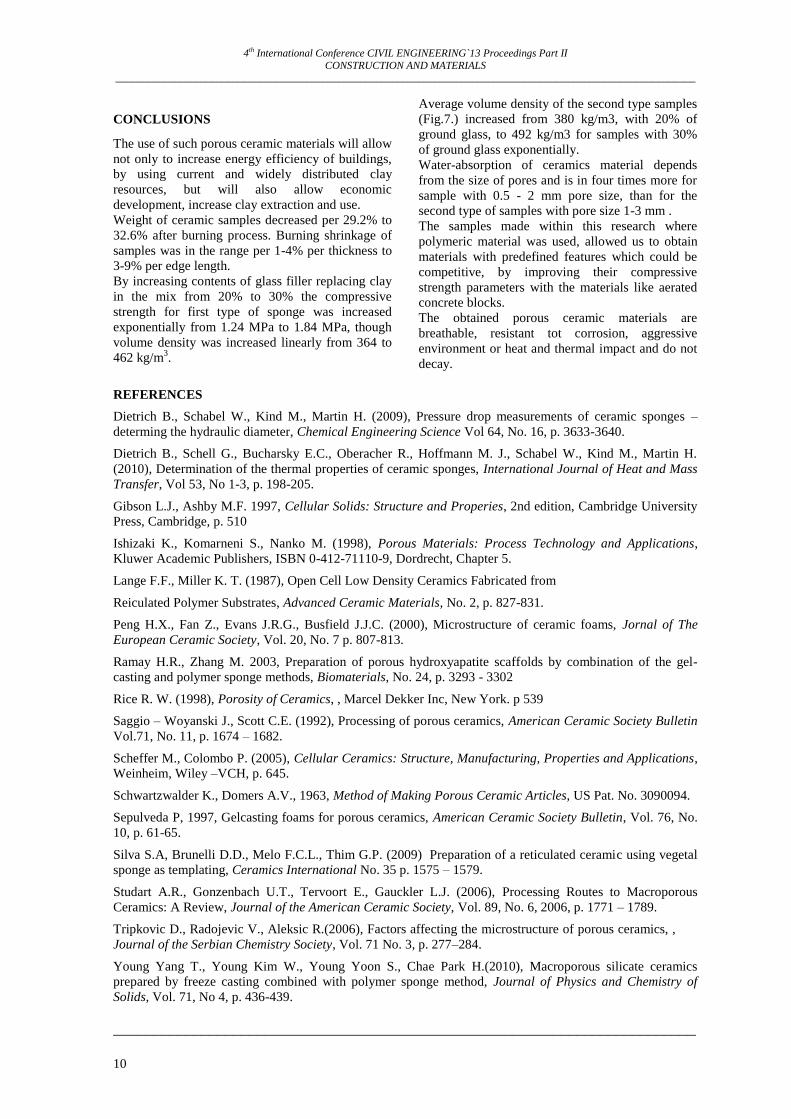
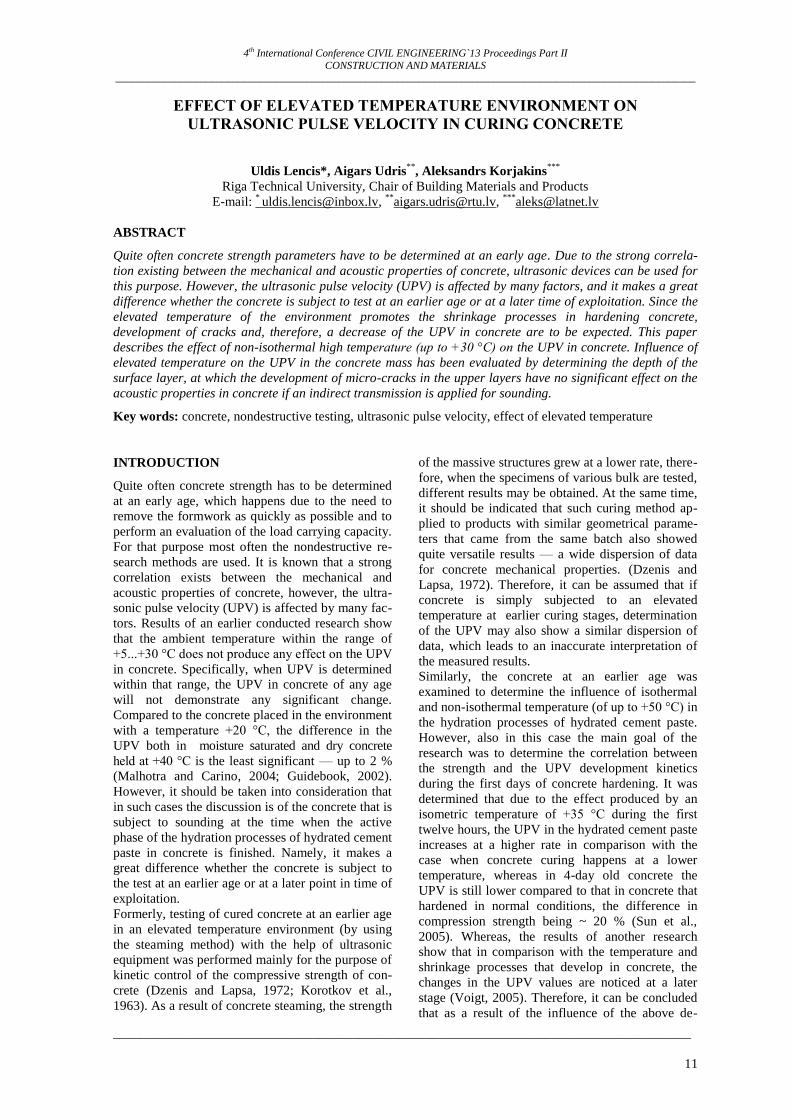
Macropores and micropores can be seen within the
structure of porous ceramics, where the
measurement of the pores in the obtained polymer
sponge samples were 0.5 - 3.0 mm and macropores
obtained by burning of polymer material sponge,
have a form which copies the structure of the
sponge itself and they are shown in figure 6 and 7.
Figure 6: Porous ceramic sample with measure of
pores 1- 3 mm. Scale 1:2
In the course of the research the polymer sponge
was used for the saturation with the ceramic slurry
where the essential role is played by the type of
sponge itself and the size of its pores in order to
ensure a complete filling of the sponge with the
slurry content, as well as the viscosity of the
ceramic slurry itself, because in this case the
mixture is not sufficiently plastic. Within it, the
polyurethane sponge components that are not being
filled with the mixture content form empty areas
after the burning process, have a negative impact on
the physical and mechanical parameters of the
material by reducing its strength. As such empty
areas which are being formed by insufficiently
saturating the polymer sponge, limits the thickness
of a producible sample; it is preferable to use a
consolidation method of several samples which was
performed during the research, by forming one
sample from separate layers, thus providing the
necessary thickness of producible samples and their
saturation with ceramic slurry in the whole volume.
The advantage of the given method for the
production of porous ceramics lies not only in the
simplicity of the technology but also in the time and
cost consumption efficiency, whereas its drawback
is linked to the features of obtainable porous
ceramic materials dependence on the polymeric
sponge quality, as well as the limited dimensions of
the producible samples, which is effectively solved
by gluing multiple samples together.
Figure 7: Porous ceramic sample with measure of
pores 0.5-2 mm. Scale 2.5:1
By using the polymer sponge saturation method it is
possible to make heat insulation elements with
particular types and amount of pores, as well as
with various sizes and forms, repeating any form
which was initially characteristic to the polymer
sponge itself.
Within this research during the process of sample
production, attention was paid directly to the
amount of ground glass, in order not to improve
their strength parameters and to reduce the
necessary amount of clay and the temperature
necessary for burning, but it is also preferable to use
glass waste in material production which could be
further used in load-bearing low storey structures.
In the following research it would be useful to vary
the components which are necessary for making
ceramic slurry, and it could also be useful to use a
consolidation of this method with some other
porous ceramics production method in order to
prevent the main drawbacks of the polymer sponge
saturation method, thus improving the compressive
strength of the samples.
4th International Conference CIVIL ENGINEERING`13 Proceedings Part II
CONSTRUCTION AND MATERIALS _____________________________________________________________________________________________________________
_________________________________________________________________________
10
CONCLUSIONS
The use of such porous ceramic materials will allow
not only to increase energy efficiency of buildings,
by using current and widely distributed clay
resources, but will also allow economic
development, increase clay extraction and use.
Weight of ceramic samples decreased per 29.2% to
32.6% after burning process. Burning shrinkage of
samples was in the range per 1-4% per thickness to
3-9% per edge length.
By increasing contents of glass filler replacing clay
in the mix from 20% to 30% the compressive
strength for first type of sponge was increased
exponentially from 1.24 MPa to 1.84 MPa, though
volume density was increased linearly from 364 to
462 kg/m3.
Average volume density of the second type samples
(Fig.7.) increased from 380 kg/m3, with 20% of
ground glass, to 492 kg/m3 for samples with 30%
of ground glass exponentially.
Water-absorption of ceramics material depends
from the size of pores and is in four times more for
sample with 0.5 - 2 mm pore size, than for the
second type of samples with pore size 1-3 mm .
The samples made within this research where
polymeric material was used, allowed us to obtain
materials with predefined features which could be
competitive, by improving their compressive
strength parameters with the materials like aerated
concrete blocks.
The obtained porous ceramic materials are
breathable, resistant tot corrosion, aggressive
environment or heat and thermal impact and do not
decay.
REFERENCES
Dietrich B., Schabel W., Kind M., Martin H. (2009), Pressure drop measurements of ceramic sponges –
determing the hydraulic diameter, Chemical Engineering Science Vol 64, No. 16, p. 3633-3640.
Dietrich B., Schell G., Bucharsky E.C., Oberacher R., Hoffmann M. J., Schabel W., Kind M., Martin H.
(2010), Determination of the thermal properties of ceramic sponges, International Journal of Heat and Mass
Transfer, Vol 53, No 1-3, p. 198-205.
Gibson L.J., Ashby M.F. 1997, Cellular Solids: Structure and Properies, 2nd edition, Cambridge University
Press, Cambridge, p. 510
Ishizaki K., Komarneni S., Nanko M. (1998), Porous Materials: Process Technology and Applications,
Kluwer Academic Publishers, ISBN 0-412-71110-9, Dordrecht, Chapter 5.
Lange F.F., Miller K. T. (1987), Open Cell Low Density Ceramics Fabricated from
Reiculated Polymer Substrates, Advanced Ceramic Materials, No. 2, p. 827-831.
Peng H.X., Fan Z., Evans J.R.G., Busfield J.J.C. (2000), Microstructure of ceramic foams, Jornal of The
European Ceramic Society, Vol. 20, No. 7 p. 807-813.
Ramay H.R., Zhang M. 2003, Preparation of porous hydroxyapatite scaffolds by combination of the gel-
casting and polymer sponge methods, Biomaterials, No. 24, p. 3293 - 3302
Rice R. W. (1998), Porosity of Ceramics, , Marcel Dekker Inc, New York. p 539
Saggio – Woyanski J., Scott C.E. (1992), Processing of porous ceramics, American Ceramic Society Bulletin
Vol.71, No. 11, p. 1674 – 1682.
Scheffer M., Colombo P. (2005), Cellular Ceramics: Structure, Manufacturing, Properties and Applications,
Weinheim, Wiley –VCH, p. 645.
Schwartzwalder K., Domers A.V., 1963, Method of Making Porous Ceramic Articles, US Pat. No. 3090094.
Sepulveda P, 1997, Gelcasting foams for porous ceramics, American Ceramic Society Bulletin, Vol. 76, No.
10, p. 61-65.
Silva S.A, Brunelli D.D., Melo F.C.L., Thim G.P. (2009) Preparation of a reticulated ceramic using vegetal
sponge as templating, Ceramics International No. 35 p. 1575 – 1579.
Studart A.R., Gonzenbach U.T., Tervoort E., Gauckler L.J. (2006), Processing Routes to Macroporous
Ceramics: A Review, Journal of the American Ceramic Society, Vol. 89, No. 6, 2006, p. 1771 – 1789.
Tripkovic D., Radojevic V., Aleksic R.(2006), Factors affecting the microstructure of porous ceramics, ,
Journal of the Serbian Chemistry Society, Vol. 71 No. 3, p. 277–284.
Young Yang T., Young Kim W., Young Yoon S., Chae Park H.(2010), Macroporous silicate ceramics
prepared by freeze casting combined with polymer sponge method, Journal of Physics and Chemistry of
Solids, Vol. 71, No 4, p. 436-439.
4th International Conference CIVIL ENGINEERING`13 Proceedings Part II
CONSTRUCTION AND MATERIALS _____________________________________________________________________________________________________________
_______________________________________________________________________________________
11
EFFECT OF ELEVATED TEMPERATURE ENVIRONMENT ON
ULTRASONIC PULSE VELOCITY IN CURING CONCRETE
Uldis Lencis*, Aigars Udris**
, Aleksandrs Korjakins***
Riga Technical University, Chair of Building Materials and Products
E-mail: * [email protected],
ABSTRACT
Quite often concrete strength parameters have to be determined at an early age. Due to the strong correla-
tion existing between the mechanical and acoustic properties of concrete, ultrasonic devices can be used for
this purpose. However, the ultrasonic pulse velocity (UPV) is affected by many factors, and it makes a great
difference whether the concrete is subject to test at an earlier age or at a later time of exploitation. Since the
elevated temperature of the environment promotes the shrinkage processes in hardening concrete,
development of cracks and, therefore, a decrease of the UPV in concrete are to be expected. This paper
describes the effect of non-isothermal high temperature (up to +30 °C) on the UPV in concrete. Influence of
elevated temperature on the UPV in the concrete mass has been evaluated by determining the depth of the
surface layer, at which the development of micro-cracks in the upper layers have no significant effect on the
acoustic properties in concrete if an indirect transmission is applied for sounding.
Key words: concrete, nondestructive testing, ultrasonic pulse velocity, effect of elevated temperature
INTRODUCTION
Quite often concrete strength has to be determined
at an early age, which happens due to the need to
remove the formwork as quickly as possible and to
perform an evaluation of the load carrying capacity.
For that purpose most often the nondestructive re-
search methods are used. It is known that a strong
correlation exists between the mechanical and
acoustic properties of concrete, however, the ultra-
sonic pulse velocity (UPV) is affected by many fac-
tors. Results of an earlier conducted research show
that the ambient temperature within the range of
+5...+30 °C does not produce any effect on the UPV
in concrete. Specifically, when UPV is determined
within that range, the UPV in concrete of any age
will not demonstrate any significant change.
Compared to the concrete placed in the environment
with a temperature +20 °C, the difference in the
UPV both in moisture saturated and dry concrete
held at +40 °C is the least significant — up to 2 %
(Malhotra and Carino, 2004; Guidebook, 2002).
However, it should be taken into consideration that
in such cases the discussion is of the concrete that is
subject to sounding at the time when the active
phase of the hydration processes of hydrated cement
paste in concrete is finished. Namely, it makes a
great difference whether the concrete is subject to
the test at an earlier age or at a later point in time of
exploitation.
Formerly, testing of cured concrete at an earlier age
in an elevated temperature environment (by using
the steaming method) with the help of ultrasonic
equipment was performed mainly for the purpose of
kinetic control of the compressive strength of con-
crete (Dzenis and Lapsa, 1972; Korotkov et al.,
1963). As a result of concrete steaming, the strength
of the massive structures grew at a lower rate, there-
fore, when the specimens of various bulk are tested,
different results may be obtained. At the same time,
it should be indicated that such curing method ap-
plied to products with similar geometrical parame-
ters that came from the same batch also showed
quite versatile results — a wide dispersion of data
for concrete mechanical properties. (Dzenis and
Lapsa, 1972). Therefore, it can be assumed that if
concrete is simply subjected to an elevated
temperature at earlier curing stages, determination
of the UPV may also show a similar dispersion of
data, which leads to an inaccurate interpretation of
the measured results.
Similarly, the concrete at an earlier age was
examined to determine the influence of isothermal
and non-isothermal temperature (of up to +50 °C) in
the hydration processes of hydrated cement paste.
However, also in this case the main goal of the
research was to determine the correlation between
the strength and the UPV development kinetics
during the first days of concrete hardening. It was
determined that due to the effect produced by an
isometric temperature of +35 °C during the first
twelve hours, the UPV in the hydrated cement paste
increases at a higher rate in comparison with the
case when concrete curing happens at a lower
temperature, whereas in 4-day old concrete the
UPV is still lower compared to that in concrete that
hardened in normal conditions, the difference in
compression strength being ~ 20 % (Sun et al.,
2005). Whereas, the results of another research
show that in comparison with the temperature and
shrinkage processes that develop in concrete, the
changes in the UPV values are noticed at a later
stage (Voigt, 2005). Therefore, it can be concluded
that as a result of the influence of the above de-

4th International Conference CIVIL ENGINEERING`13 Proceedings Part II
CONSTRUCTION AND MATERIALS _____________________________________________________________________________________________________________
_________________________________________________________________________
12
scribed physical processes, subsequent changes in
the UPV are observable later, not during the first
days of hydrated cement paste hardening.
Research conducted earlier proves that changes in
moisture and temperature conditions can have quite
a significant effect on the UPV in concrete (Alimov,
2007; Dzenis and Lapsa, 1972; Korotkov et al.,
1963). Within the considered temperature range of
+5...+30 °C the UPV in concrete decreases with a
temperature increase. This may presumably happen
because in the process of drying the specimens
become increasingly dry and lose a certain per-
centage of moisture. It should be emphasized that
the influence of the moisture factor on the UPV in
concrete is much more significant, which was
proved by the latest research in this area (Alimov,
2007; Fadragas and Gonzalez, 2011). Under the
influence of elevated temperatures minor UPV and
strength changes are observable in concrete with the
comparatively lower strength as well as in the
mixes with a lesser amount of coarse aggregates,
which is largely explained by the higher
homogeneity and greater porosity of the material
(Glinchikov and Makagonov, 1974).
Regulations of the State standards do not contain
specific guidance on the influence of temperature
on the UPV propagation in concrete.
The currently existing Latvian standard and EU
standard (Latvian Standard, 2004) stipulate that
upon measuring the temperatures within the
+10...+30 °C range, concrete is not supposed to
show any significant changes in the strength or elas-
tic properties. According to the regulations of the
Standard, adjustments of the UPV measurements
should be made only when sounding is carried out
beyond a specified range of temperature.
Furthermore, during testing the temperature of the
concrete needs to be recorded in the test report only
in this particular case. This standard does not
contain any regulations regarding the influence of
the shrinkage process on the UPV in concrete.
The existing Russian Federation standard highlights
the possibility of UPV variations and, accordingly,
the probability of inaccuracy in interpreting the
measured results if the degree of moisture and in-
fluence of low temperatures on the tested concrete
products are ignored (Russian Standard, 1988). At
the same time, the standard does not contain any
regulations regarding the influence of non-isother-
mal positive temperature on the UPV in concrete.
As it is known, during hardening the elevated tem-
perature of the environment promotes the shrinkage
processes in concrete, which normally causes devel-
opment of cracks in the upper layer of the concrete
and therefore a decrease of the UPV. It should be
added that the influence of the shrinkage processes
on the propagation of the UPV in concrete (espe-
cially in the upper layers of the material) has not
been extensively studied. This work studies the ef-
fect, which the non-isothermal high temperature (of
up to +30 °C) produces on the UPV in concrete if
the ultrasonic testing method, the most frequently
applied in practice, is used ― the indirect transmis-
sion with a longitudinal wave pulse.
For this research it was decided to manufacture con-
crete specimens that would be subsequently placed
in various curing conditions — in a normal or ele-
vated temperature environment. For part of the spe-
cimens the curing conditions were simulated to re-
semble the situation at the building site in hot sum-
mer. For the purpose of evaluation of the differ-
ences in the UPV and compressive strength up to a
certain age, during hardening some specimens were
kept in the formwork and some were released from
the formwork to harden. The main task was to
evaluate the influence of elevated temperatures on
the UPV in the depth of the concrete mass and to
determine the depth of the surface layer at which,
given the respective hardening conditions, the
development of micro-cracks in the upper layers of
a specimen have no significant effect on the UPV
in concrete.
MEASURING DEVICE, SPECIMENS FOR RE-
SEARCH
For this research the ultrasonic tester "UK-1401"
(made in Russia) was applied, which is a frequently
used device for such kind of testing both in the
laboratory and in building objects. This device has
two built-in dry point contact (DPC) transducers to
achieve the efficient emitting and reception of lon-
gitudional pulses. The main technical parameters of
the «UK-1401» device are as follows: path length
(constant distance between the contact elements) —
15 cm, working frequency of the ultrasonic vibra-
tions — 70 kHz, measuring error of the ultrasonic
time and velocity — not more than ±1 %.
The object of the research — 27 concrete specimens
(with the dimensions of 15×15×15 cm).
After manufacturing, the concrete specimens were
kept for 2 days at room temperature in a metal
formwork; the surface of the specimens was
covered with polyethylene film. At the age of 2
days 18 specimens were released form the form-
work, while 9 were left inside. 9 dismantled speci-
mens were placed in a standard moist room, while
18 specimens were placed in the climatic chamber
(9 dismantled and 9 undismantled specimens). The
specimens placed in the climatic chamber were kept
in conditions that corresponded to the situation at
the building sites during a hot summer. For exam-
ple, all faces of the undismantled specimens were
partially protected to prevent moisture evaporation
during concrete hardening (upper surface of the spe-
cimens was covered with polyethylene film). In the
standard moist room a constant air temperature of
+18 °C and a relative humidity of 95...100 % were
maintained, while in the climatic chamber with
constant ventilation and humidity control the fol-

4th International Conference CIVIL ENGINEERING`13 Proceedings Part II
CONSTRUCTION AND MATERIALS _____________________________________________________________________________________________________________
_______________________________________________________________________________________
13
lowing cyclic conditions were maintained over 24
hours ― for 17 hours: at +10 °C, for 7 hours: at +30
°C, with the air humidity changing within a 20...50
% range subject to temperature alterations.
Depending on the environment, in which the
hardening of concrete took place, the specimens
were grouped as follows: N ― in a standard moist
room; K ― in a climatic chamber (dismantled); KV
― in a climatic chamber (undismantled). Each speci-
men group contained 3 specimens.
Along with the three different groups of hardening
environment, the specimens were further subdi-
vided into three subgroups. Namely, for certain spe-
cimens hardening was discontinued, they were re-
leased from the formwork and had the side faces cut
off at three different ages — 7, 14 and 28 days (at
the age of 28 days the side face of the 3rd
group of
specimens was not cut off). Each specimen sub-
group contained 9 specimens. Therefore, when the
specimens reached each of the above indicated ages
the following number of specimens were removed
from the chambers: 3 ― from the standard moist
room; 6 ― from the climatic chamber (3 dismantled
and 3 undismantled). At the age of 84 days approxi-
mately a 1 cm thick layer was cut off the upper face
of all specimens. Cutting off of the surface layers
was carried out to evaluate the possible influence of
the shrinkage process on the UPV in the concrete
below the cut off layer. Sounding of the surface of
concrete specimens was carried out by the ultra-
sonic tester at the age of 2, 7, 14, 64 and 84 days.
TESTING RESULTS
For each specimen the sounding was carried out in
three faces that were marked according to concrete
casting direction: U — top; S — side; L — bottom.
Prior to sounding the mass of the specimens,
weight was determined as well as surface moisture
measured (with the help of the measuring device
"Tramex Concrete Moisture Encounter"). 9 di-
agonal measurements of each specimen face were
carried out with the tester.
After processing the UPV results on various faces
of the concrete specimens, the following was estab-
lished. For the cubic-shaped specimens due to their
casting direction, top faces almost always showed a
lower UPV compared with the side and bottom
faces, see Table 1. To this day, this feature was
mainly explained by segregation of the concrete
being influenced by compacting. However, during
this research it was established that mainly it was
affected by the environment in which the hardening
took place. It is known that moisture promotes the
hydration processes that occur in hydrated cement
paste. Therefore the concrete sections with a higher
level of accumulated moisture showed also a higher
UPV. However, it should be emphasized that in this
case the UPV increase is influenced by the moisture
present in concrete, which plays a role of the
initiator of chemical processes taking place there
rather than as a physical factor. During the research
it was established that if the specimens dry up at a
steady pace over the whole bulk, the proportion of
the UPV determined for various faces is preserved,
only the absolute values of the UPV decrease.
It should be noted that, during another research that
was conducted earlier, it also was established that
distribution of the velocity of ultrasonic longitu-
dinal waves and the surface waves throughout the
height of a concrete specimen is not uniform
(Staviski, 1982). It was discovered that for concrete
specimens that were subject to various steaming
conditions the UPV at the top is comparatively
lower than the same at the bottom, while in the sec-
tions very close to the top face of the concrete it ap-
pears to be considerably lower.
A very significant difference between the UPV
results for the top and the bottom faces was found
for the specimens, which during hardening were
subject to a cyclical impact of an elevated
temperature (nonisothermal conditions) and which
were not released from the formwork — KV group
specimens. Although the upper faces of the speci-
mens of this group were also covered with
polyethylene film (thus, emission of heat in the
process of concrete hardening caused an
accumulation of moisture on the specimen surface),
here the fixed UPV appears to be explicitly lower in
comparison to the measurements taken at the side
and at the bottom faces, see Table 1. Besides, the
longer the specimen was subject to such hardening
conditions, the larger the UPV difference was. The
other two specimen groups did not demonstrate
such a strongly explicit tendency in the UPV
differences. At the same time it should be noted that
as a result of the influence of similar curing
conditions the UPV measured for the upper face of
the KV group specimens of various ages is almost
identical to that of the K group specimens.
As it was already mentioned, the physical influence
of the moisture factor on the UPV in concrete is not
a determinant in this case. Where initially
differences in the amount of moisture present in the
upper and bottom sides of the 2, 7 and 14-day old
concrete specimens were fixed, then, later, when the
64-daysold specimens were tested, the moisture
became evenly distributed almost throughout the
whole bulk of those specimens. Measurements
performed for certain specimens, which were ap-
proximately 3 years old, support the above
assumption. Specifically, it was determined that the
difference in the UPV fixed for the side and bottom
faces of the specimens remained on the same level
as it had been fixed at the age of 2 day.
The results obtained for the UPV show a compara-
tively greater dispersion in the specimens of group
K. Since these specimens were released from the
formwork and hardened at an elevated temperature,
the conditions under which the structure of the hy-
drated cement paste was formed to a certain extent
4th International Conference CIVIL ENGINEERING`13 Proceedings Part II
CONSTRUCTION AND MATERIALS _____________________________________________________________________________________________________________
_________________________________________________________________________
14
appear to be similar to the specimens that hardened
under steaming conditions, which also demonstrate
greater dispersion of acoustic properties (Dzenis
and Lapsa, 1972; Gorshkov et al., 1979).
Considering the above mentioned, the following
conclusions can be drawn:—it is assumed that
during the process of hardening in a hot
environment (when the temperature during the day
reaches at least +30 oC or exceeds this level) the
porosity of the upper layers of hydrated cement
paste and/or intensity of the quantity of microcracks
in the undismantled concrete would be much higher
compared with the rest of the mass, covered by the
formwork.
In such cases, for examination of the structures with
the help of nondestructive testing equipment, sclera-
ometric devices as a rule are not useful because
quite often the surface that stays free from the form-
work has significant asperity. Therefore, quite often
the method of acoustic testing is the only possible
way to evaluate the degree of homogeneity of the
concrete in the structure and, in addition, to deter-
mine its strength parameters. Nevertheless, as seen
from the results obtained in the course of the
experiment, one should be especially careful when
carrying out an assessment of general technical
conditions of the concrete structures with the help
of ultrasonic equipment. This is mainly because the
concrete top surface, which in contrast to the rest of
the faces (covered by the formwork) that hardened
in a different environment, in warm weather
conditions is subject to moisture evaporation even if
the surface is covered with polyethylene film,
which promotes moisture accumulation. Therefore,
the UPV measured on the concrete surface freed
from the formwork quite often proves to be lower in
comparison with the rest of the concrete mass, and
based on such results one may rush to the
conclusions about the insufficient strength of con-
crete structure. In turn, when measurements are
taken for the bottom faces of the concrete that was
released from the formwork, the opposite
inaccuracy may be made — here obtained the UPV
will be higher than the results shown for the rest of
the structure in general. Accordingly, the concrete
that was hardened in such an environment should be
sounded in all available faces and, additionally, the
moisture degree should be determined. Adherence to
such a measuring method will lead to more a
accurate interpretation of the UPV measurement
results with relation to the results of concrete
homogeneity and strength.
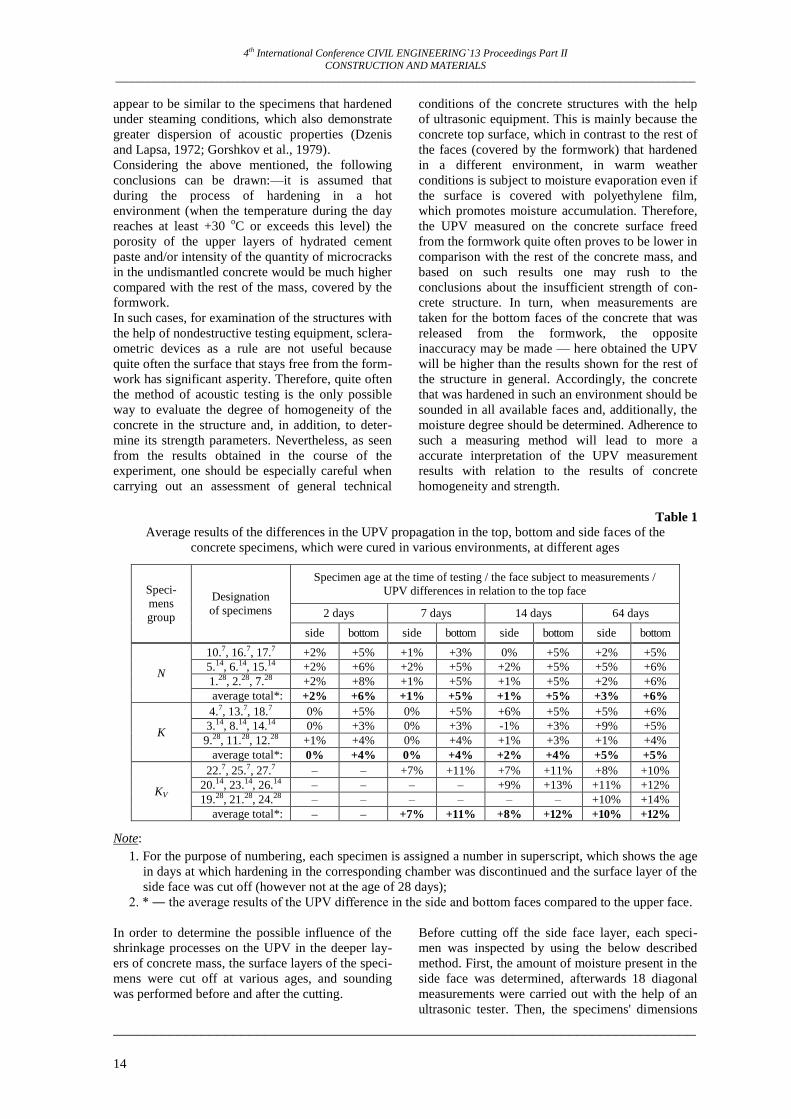
Table 1
Average results of the differences in the UPV propagation in the top, bottom and side faces of the
concrete specimens, which were cured in various environments, at different ages
Speci-
mens
group
Designation
of specimens
Specimen age at the time of testing / the face subject to measurements /
UPV differences in relation to the top face
2 days 7 days 14 days 64 days
side bottom side bottom side bottom side bottom
N
10.7, 16.7, 17.7 +2% +5% +1% +3% 0% +5% +2% +5%
5.14, 6.14, 15.14 +2% +6% +2% +5% +2% +5% +5% +6%
1.28, 2.28, 7.28 +2% +8% +1% +5% +1% +5% +2% +6%
average total*: +2% +6% +1% +5% +1% +5% +3% +6%
K
4.7, 13.7, 18.7 0% +5% 0% +5% +6% +5% +5% +6%
3.14, 8.14, 14.14 0% +3% 0% +3% -1% +3% +9% +5%
9.28, 11.28, 12.28 +1% +4% 0% +4% +1% +3% +1% +4%
average total*: 0% +4% 0% +4% +2% +4% +5% +5%
KV
22.7, 25.7, 27.7 – – +7% +11% +7% +11% +8% +10%
20.14, 23.14, 26.14 – – – – +9% +13% +11% +12%
19.28, 21.28, 24.28 – – – – – – +10% +14%
average total*: – – +7% +11% +8% +12% +10% +12%
Note:
1. For the purpose of numbering, each specimen is assigned a number in superscript, which shows the age
in days at which hardening in the corresponding chamber was discontinued and the surface layer of the
side face was cut off (however not at the age of 28 days);
2. * ― the average results of the UPV difference in the side and bottom faces compared to the upper face.
In order to determine the possible influence of the
shrinkage processes on the UPV in the deeper lay-
ers of concrete mass, the surface layers of the speci-
mens were cut off at various ages, and sounding
was performed before and after the cutting.
Before cutting off the side face layer, each speci-
men was inspected by using the below described
method. First, the amount of moisture present in the
side face was determined, afterwards 18 diagonal
measurements were carried out with the help of an
ultrasonic tester. Then, the specimens' dimensions
4th International Conference CIVIL ENGINEERING`13 Proceedings Part II
CONSTRUCTION AND MATERIALS _____________________________________________________________________________________________________________
_______________________________________________________________________________________
15
and mass were measured to determine the density.
Such preliminary work was necessary because the
specimen was moistened during cutting, and while
it dried it was necessary to control the two
parameters ― the surface moisture and density.
Namely, it was necessary to ensure that these two
parameters got back to the initial level fixed before
the cutting. (It should be noted that after surface
layers were cut off, repeated dimensioning of the
specimens was done). When the surface moisture
and density reached the required level, measure-
ments of the side faces of the specimens were car-
ried out with the help of an ultrasonic tester. Adher-
ence to such a method is considered as a major pre-
requisite to ensure accurate comparison of the UPV
results obtained before and after cutting off the sur-
face layer.
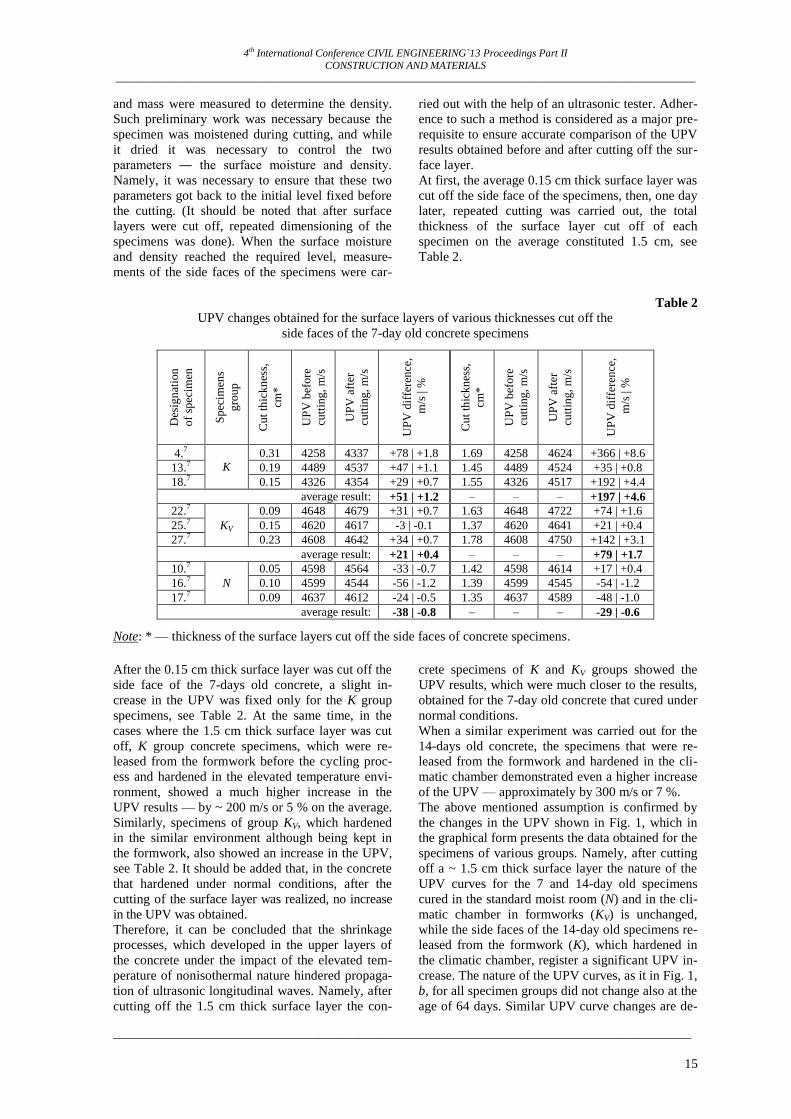
At first, the average 0.15 cm thick surface layer was
cut off the side face of the specimens, then, one day
later, repeated cutting was carried out, the total
thickness of the surface layer cut off of each
specimen on the average constituted 1.5 cm, see
Table 2.
Table 2
UPV changes obtained for the surface layers of various thicknesses cut off the
side faces of the 7-day old concrete specimens
Des
ign
atio
n
of
spec
imen
Sp
ecim
ens
gro
up
Cu
t th
ick
nes
s,
cm*
UP
V b
efo
re
cutt
ing
, m
/s
UP
V a
fter
cutt
ing
, m
/s
UP
V d
iffe
ren
ce,
m/s
| %
Cu
t th
ick
nes
s,
cm*
UP
V b
efo
re
cutt
ing
, m
/s
UP
V a
fter
cutt
ing
, m
/s
UP
V d
iffe
ren
ce,
m/s
| %
4.7
K
0.31 4258 4337 +78 | +1.8 1.69 4258 4624 +366 | +8.6
13.7 0.19 4489 4537 +47 | +1.1 1.45 4489 4524 +35 | +0.8
18.7 0.15 4326 4354 +29 | +0.7 1.55 4326 4517 +192 | +4.4
average result: +51 | +1.2 – – – +197 | +4.6
22.7
KV
0.09 4648 4679 +31 | +0.7 1.63 4648 4722 +74 | +1.6
25.7 0.15 4620 4617 -3 | -0.1 1.37 4620 4641 +21 | +0.4
27.7 0.23 4608 4642 +34 | +0.7 1.78 4608 4750 +142 | +3.1
average result: +21 | +0.4 – – – +79 | +1.7
10.7
N
0.05 4598 4564 -33 | -0.7 1.42 4598 4614 +17 | +0.4
16.7 0.10 4599 4544 -56 | -1.2 1.39 4599 4545 -54 | -1.2
17.7 0.09 4637 4612 -24 | -0.5 1.35 4637 4589 -48 | -1.0
average result: -38 | -0.8 – – – -29 | -0.6
Note: * — thickness of the surface layers cut off the side faces of concrete specimens.
After the 0.15 cm thick surface layer was cut off the
side face of the 7-days old concrete, a slight in-
crease in the UPV was fixed only for the K group
specimens, see Table 2. At the same time, in the
cases where the 1.5 cm thick surface layer was cut
off, K group concrete specimens, which were re-
leased from the formwork before the cycling proc-
ess and hardened in the elevated temperature envi-
ronment, showed a much higher increase in the
UPV results — by ~ 200 m/s or 5 % on the average.
Similarly, specimens of group KV, which hardened
in the similar environment although being kept in
the formwork, also showed an increase in the UPV,
see Table 2. It should be added that, in the concrete
that hardened under normal conditions, after the
cutting of the surface layer was realized, no increase
in the UPV was obtained.
Therefore, it can be concluded that the shrinkage
processes, which developed in the upper layers of
the concrete under the impact of the elevated tem-
perature of nonisothermal nature hindered propaga-
tion of ultrasonic longitudinal waves. Namely, after
cutting off the 1.5 cm thick surface layer the con-
crete specimens of K and KV groups showed the
UPV results, which were much closer to the results,
obtained for the 7-day old concrete that cured under
normal conditions.
When a similar experiment was carried out for the
14-days old concrete, the specimens that were re-
leased from the formwork and hardened in the cli-
matic chamber demonstrated even a higher increase
of the UPV — approximately by 300 m/s or 7 %.
The above mentioned assumption is confirmed by
the changes in the UPV shown in Fig. 1, which in
the graphical form presents the data obtained for the
specimens of various groups. Namely, after cutting
off a ~ 1.5 cm thick surface layer the nature of the
UPV curves for the 7 and 14-day old specimens
cured in the standard moist room (N) and in the cli-
matic chamber in formworks (KV) is unchanged,
while the side faces of the 14-day old specimens re-
leased from the formwork (K), which hardened in
the climatic chamber, register a significant UPV in-
crease. The nature of the UPV curves, as it in Fig. 1,
b, for all specimen groups did not change also at the
age of 64 days. Similar UPV curve changes are de-

4th International Conference CIVIL ENGINEERING`13 Proceedings Part II
CONSTRUCTION AND MATERIALS _____________________________________________________________________________________________________________
_________________________________________________________________________
16
termined for the K group concrete specimens, when
the results for the side face cuttings, i.e., for the data
obtained at the age of 14 days are compared with
the results fixed in 64 days.
By summarizing the data it was stated that concrete
specimens of K group, after an approximately 1.5
cm thick surface layer was cut off the side face, for
various initial UPV values, fixed before cutting,
demonstrated a significant difference in the UPV in-
crease that was measured after the cutting, see Fig. 2.
Specifically, the lowest initial UPV (4258 m/s)
showed the highest UPV increase — 8.6 % (4624 m/s).
And conversely — the highest initial UPV (4489 m/s)
corresponded to the lowest increase of UPV — 0.8 %
(4524 m/s).
In addition to cutting off the side faces of speci-
mens, all concrete specimens at the age of 84 days
had the top face cut off as well.
In that case, the most significant differences in the
UPV were obtained only for the 28-day old speci-
mens that hardened in the climatic chamber. Spe-
cifically, for the specimens of the K and KV groups,
after they had an approximately 1 cm thick surface
layer cut off, fixed an increase of the UPV com-
pared to the UPV in the uncut surface: 171 m/s or
4.1 % and 184 m/s or 4.4 %, accordingly. In its
turn, the specimens, which for 28 days hardened in
the standard moist room (N group), demonstrated an
increase of UPV by 54 m/s or 1.2 %.
Figure 1. UPV changes obtained for the 7- (a) and 14- (b) days old concrete hardened in various
environments after the surface layer of the side face was cut off
Figure 2. Differences in the UPV increase rate of the K group concrete specimens with different initial UPV,
after approximately 1.5 cm thick surface layer was cut off the side faces
It should be emphasized that in contrast to the
above determined relationships for the side faces of
the concrete, in this case, the top faces of the K and
KV group specimens were subject to equal harden-
ing conditions. Therefore, the obtained UPV differ-
ences also appear to be of similar nature.
For each of the specimens, after measuring and com-
paring the UPV data in various faces, different re-
4258
4326
4489
4447
4389
4306
0%
2%
4%
6%
8%
10%
4200 4250 4300 4350 4400 4450 4500 4550
Initial UPV (before cutting), m/s
UP
V i
ncr
ease
rate
7-days old concrete 14-days old concrete
,
b a
4200
4400
4600
4800
5000
top side bottom
Measured faces of concrete specimens
Ult
ra
son
ic p
uls
e v
elo
cit
y,
m/s
Kv-7(Nr.22;25;27) K-7(Nr.4;13;18) N-7(Nr.10;16;17)
4200
4400
4600
4800
5000
top side bottom
Measured faces of concrete specimens
Ult
ra
son
ic p
uls
e v
elo
cit
y,
m/s
Kv-7(Nr.22;25;27) K-7(Nr.4;13;18) N-7(Nr.10;16;17)
4th International Conference CIVIL ENGINEERING`13 Proceedings Part II
CONSTRUCTION AND MATERIALS _____________________________________________________________________________________________________________
_______________________________________________________________________________________
17
sulting trends have been obtained depending on the
environment, in which hardening took place. Namely,
the propagation of the UPV throughout the whole
bulk of concrete specimen is best characterized by
the data in its top face, after an approximately 1 cm
thick surface layer has been cut off. However, such
conditions can be referred only to the specimens,
which hardened in the standard moist room or were
kept in the formwork even in sufficiently hot
weather conditions, whereas, for the concrete that
was dismantled and placed in a hot environment,
the optimal characteristic UPV value is medium-
level, which is obtained by sounding the bottom and
side faces.
Thus, it should be concluded that when ultrasonic
measurements of concrete are carried out by using
the indirect transmission method, the correlation of
the acoustic and mechanical properties is to a great
extent dependent upon the conditions in which
hardening took place. Besides, the data obtained for
the upper layer of concrete may not provide the
correct characteristics of the concrete condition in
general.
CONCLUSIONS
1. In relation to the concrete casting direction the
top face of the specimens showed lower UPV in
comparison to that obtained on the sides and at
the bottom. This feature is the result of the con-
crete segregation occurring during compacting as
well as influenced by the environment, in which
hardening took place. Since moisture promotes
the hydration processes in the hydrated cement
paste, UPV also proves to be higher in the sec-
tions where more moisture is accumulated. In
this case an increase of the UPV is contributed
by moisture not as a physical factor but rather as
the initiator for chemical reactions in concrete. In
the 3-year old specimens after uniform drying
throughout the whole bulk, the UPV for various
sides was retained, only the absolute UPV values
decreased.
2. A very significant difference between the UPV
results for the upper and bottom faces was deter-
mined for the specimens that were not released
from the formwork and during hardening were
subject to the impact of the elevated nonisother-
mal temperature (KV group). The UPV fixed in
the top layer of the concrete is less by 15 % com-
pared to the values measured at the sides and at
the bottom.
3. The concrete that hardened in a hot environment
(at the air temperature reaching +30 oC) usually
has increased porosity of the hydrated cement
paste in the upper layers and/or microcracks,
which prevented propagation of ultrasonic waves.
The average increase of the UPV determined at
the depth of 1.5 cm at the side faces of concrete
specimens of K group at the age of 14 days con-
stituted 300 m/s or 7 %. At such a depth the UPV
is much closer to the values, measured on the
surface of the concrete, which hardened in nor-
mal conditions. The KV group specimens also
showed a noticeable UPV increase. In its turn, no
UPV increase at the specified depth was ob-
tained in the concrete that hardened in normal
conditions. A similar correlation was determined
when sounding of the top faces of the concrete
specimens was carried out at a later age.
4. For concrete specimens of K group at the depth
of 1.5 cm obtained significant difference in the
UPV increase in comparison with the initial
UPV values. Namely, a higher increase in the
UPV corresponds to lower initial UPV value,
and conversely — higher initial UPV
corresponds to lower UPV increase.
5. It is concluded that when ultrasonic measure-
ments of the concrete are carried out by using the
indirect transmission method, the correlation be-
tween the acoustic and mechanical properties to
a great extent depends on the environment, in
which the concrete was cured. Besides, the data
obtained for the upper layer of concrete may not
provide correct characteristics of the concrete
condition in general. The concrete which was
hardened at the elevated temperature should be
sounded in all available faces and at the same
time it is important to determine the degree of
the surface moisture. Such measuring
methodology is going to significantly improve
interpretation of the UPV measurement results in
respect of homogeneity and strength parameters
of concrete.
ACKNOWLEDGEMENT
The financial support of the ERAF project Nr. 2010/0286/2DP/2.1.1.1.0/10/APIA/VIAA/033 "High effi-
ciency nanoconcretes" is acknowledged.
REFERENCES
Alimov A.G. (2007) Improvement of the theoretical foundations of the ultrasonic diagnosis of concrete and
reinforced concrete hydrotechnical structures. «Energoprogress». Hydrotechnical Construction No. 2. [In
Russian].
Dzenis V.V., Lapsa V.H. (1972) Ultrasonic testing of hardening concrete. «Strojizdat» Publishing House for
the construction, Leningrad. [In Russian].
4th International Conference CIVIL ENGINEERING`13 Proceedings Part II
CONSTRUCTION AND MATERIALS _____________________________________________________________________________________________________________
_________________________________________________________________________
18
Fadragas C.R., Gonzalez M.R. (2011) Dependence of Ultrasonic Pulse Propagation Velocity on Free Water
Content in Concrete Structure under Tropical Climate Conditions. 5th Pan American Conference for NDT.
Cancun, Mexico.
Glinchikov V.S., Makagonov V.A. (1974) Interconnection of mechanical and acoustic properties of concrete
at high temperatures. Nondestructive testing methods of building materials and structures. Chapter 1. Higher
and Secondary Special Education Ministry of Latvian SSR. Riga Polytechnic Institute. [In Russian].
Gorshkov A.M., Mizrohi J.N., Tsintskiladze D.M., Lyarsky V.P. (1969) Monitoring of concrete hardening by
using ultrasonic method. Concrete and reinforced concrete, Vol. No. 7. [In Russian].
Guidebook on non-destructive testing of concrete structures. (2002) Training course series No. 17. Industrial
Applications and Chemistry Section. International Atomic Energy Agency. Vienna,. ISSN 1018–5518.
Available: http://www-pub.iaea.org/mtcd/publications/pdf/tcs-17_web.pdf
Korotkov S.N., Koskin Y.S., Babikova G.N. (1963) Research of some properties of concrete and production
experience in strength monitoring of precast reinforced concrete with ultrasonic devices. Research of con-
crete and reinforced concrete. The collection of articles, Vol. VII. Institute of Construction and Architecture
of Scientific Academy of Latvian SSR. [In Russian].
Latvian standard LVS EN 12504-4:2004 A. Testing concrete – Part 4: Determination of ultrasonic pulse ve-
locity. LVS, 2004. [In Latvian].
Malhotra V.M., Carino N.J. (2004) Handbook on Nondestructive Testing of Concrete. Second edition. ASTM
International, CRC Press LLC, USA.
Russian Standard ГОСТ 17624-87. Concrete. Ultrasonic method of strength determination. State Construc-
tion Committee of the USSR. Moscow, 1988. [In Russian].
Staviski B., Noviks J.A., Rutkovsky A.S. (1982) Research of homogeneity of steamed concrete by using ul-
trasonic longitudinal and surface waves. Nondestructive testing methods of building materials and structures.
Higher and Secondary Special Education Ministry of Latvian SSR. Riga Polytechnic Institute. [In Russian].
Sun Z., Voigt T., Shah S. P. (2005) Temperature Effects on Strength Evaluation of Cement-Based Materials
with Ultrasonic Wave Reflection Technique. ACI Materials Journal, V. 102, No. 4. Title no. 102-M31. 275.
Voigt T. (2005) The Application of an Ultrasonic Shear Wave Reflection Method for Nondestructive Testing
of Cement-Based Materials at Early Ages. An Experimental and Numerical Analysis. University of Leipzig,
Germany.
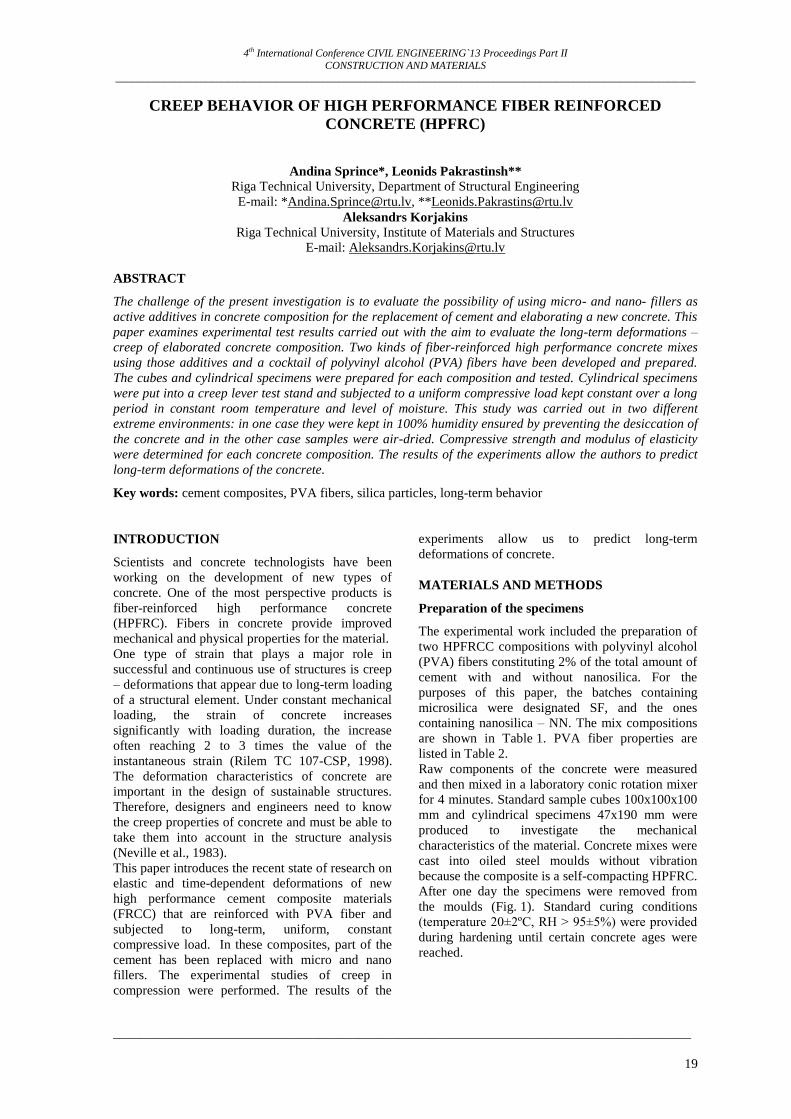
4th International Conference CIVIL ENGINEERING`13 Proceedings Part II
CONSTRUCTION AND MATERIALS _____________________________________________________________________________________________________________
_______________________________________________________________________________________
19
CREEP BEHAVIOR OF HIGH PERFORMANCE FIBER REINFORCED
CONCRETE (HPFRC)
Andina Sprince*, Leonids Pakrastinsh**
Riga Technical University, Department of Structural Engineering
E-mail: *[email protected], **[email protected]
Aleksandrs Korjakins
Riga Technical University, Institute of Materials and Structures
E-mail: [email protected]
ABSTRACT
The challenge of the present investigation is to evaluate the possibility of using micro- and nano- fillers as
active additives in concrete composition for the replacement of cement and elaborating a new concrete. This
paper examines experimental test results carried out with the aim to evaluate the long-term deformations –
creep of elaborated concrete composition. Two kinds of fiber-reinforced high performance concrete mixes
using those additives and a cocktail of polyvinyl alcohol (PVA) fibers have been developed and prepared.
The cubes and cylindrical specimens were prepared for each composition and tested. Cylindrical specimens
were put into a creep lever test stand and subjected to a uniform compressive load kept constant over a long
period in constant room temperature and level of moisture. This study was carried out in two different
extreme environments: in one case they were kept in 100% humidity ensured by preventing the desiccation of
the concrete and in the other case samples were air-dried. Compressive strength and modulus of elasticity
were determined for each concrete composition. The results of the experiments allow the authors to predict
long-term deformations of the concrete.
Key words: cement composites, PVA fibers, silica particles, long-term behavior
INTRODUCTION
Scientists and concrete technologists have been
working on the development of new types of
concrete. One of the most perspective products is
fiber-reinforced high performance concrete
(HPFRC). Fibers in concrete provide improved
mechanical and physical properties for the material.
One type of strain that plays a major role in
successful and continuous use of structures is creep
– deformations that appear due to long-term loading
of a structural element. Under constant mechanical
loading, the strain of concrete increases
significantly with loading duration, the increase
often reaching 2 to 3 times the value of the
instantaneous strain (Rilem TC 107-CSP, 1998).
The deformation characteristics of concrete are
important in the design of sustainable structures.
Therefore, designers and engineers need to know
the creep properties of concrete and must be able to
take them into account in the structure analysis
(Neville et al., 1983).
This paper introduces the recent state of research on
elastic and time-dependent deformations of new
high performance cement composite materials
(FRCC) that are reinforced with PVA fiber and
subjected to long-term, uniform, constant
compressive load. In these composites, part of the
cement has been replaced with micro and nano
fillers. The experimental studies of creep in
compression were performed. The results of the
experiments allow us to predict long-term
deformations of concrete.
MATERIALS AND METHODS
Preparation of the specimens
The experimental work included the preparation of
two HPFRCC compositions with polyvinyl alcohol
(PVA) fibers constituting 2% of the total amount of
cement with and without nanosilica. For the
purposes of this paper, the batches containing
microsilica were designated SF, and the ones
containing nanosilica – NN. The mix compositions
are shown in Table 1. PVA fiber properties are
listed in Table 2.
Raw components of the concrete were measured
and then mixed in a laboratory conic rotation mixer
for 4 minutes. Standard sample cubes 100x100x100
mm and cylindrical specimens 47x190 mm were
produced to investigate the mechanical
characteristics of the material. Concrete mixes were
cast into oiled steel moulds without vibration
because the composite is a self-compacting HPFRC.
After one day the specimens were removed from
the moulds (Fig. 1). Standard curing conditions
(temperature 20±2ºC, RH > 95±5%) were provided
during hardening until certain concrete ages were
reached.
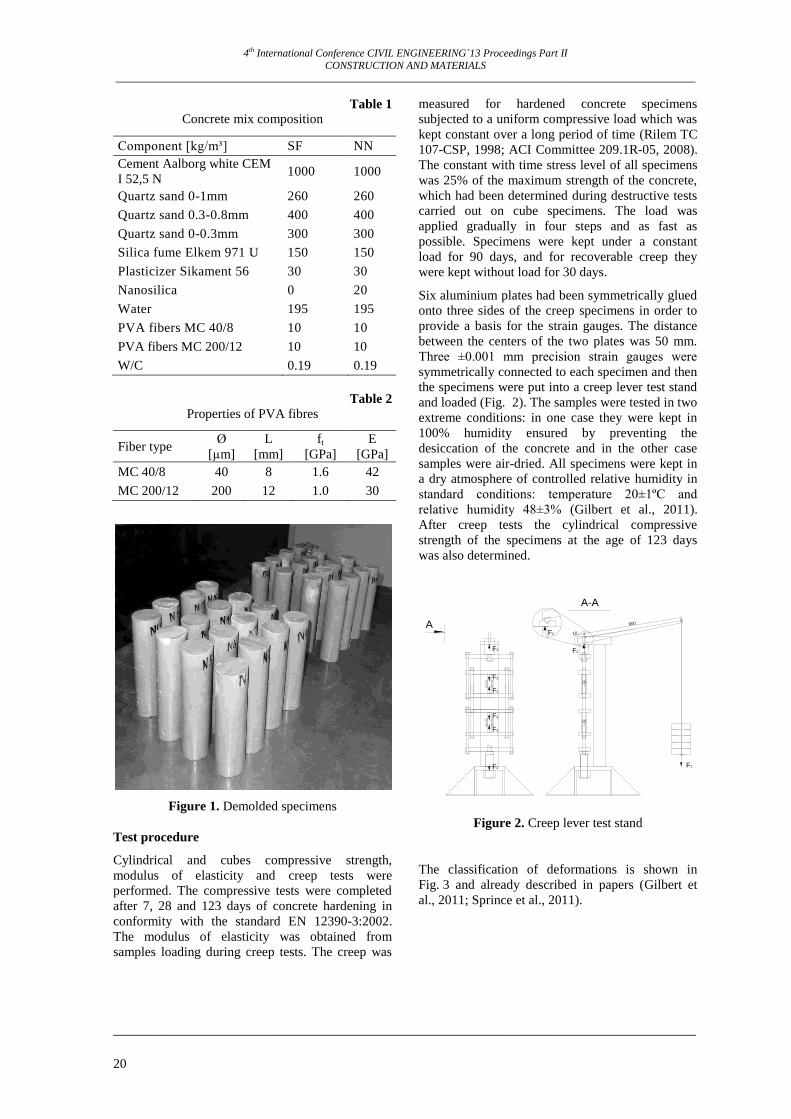
4th International Conference CIVIL ENGINEERING`13 Proceedings Part II
CONSTRUCTION AND MATERIALS _____________________________________________________________________________________________________________
_________________________________________________________________________
20
Table 1
Concrete mix composition
Component [kg/m³] SF NN
Cement Aalborg white CEM
I 52,5 N 1000 1000
Quartz sand 0-1mm 260 260
Quartz sand 0.3-0.8mm 400 400
Quartz sand 0-0.3mm 300 300
Silica fume Elkem 971 U 150 150
Plasticizer Sikament 56 30 30
Nanosilica 0 20
Water 195 195
PVA fibers MC 40/8 10 10
PVA fibers MC 200/12 10 10
W/C 0.19 0.19
Table 2
Properties of PVA fibres
Fiber type Ø
[µm]
L
[mm]
ft
[GPa]
E
[GPa]
MC 40/8 40 8 1.6 42
MC 200/12 200 12 1.0 30
Figure 1. Demolded specimens
Test procedure
Cylindrical and cubes compressive strength,
modulus of elasticity and creep tests were
performed. The compressive tests were completed
after 7, 28 and 123 days of concrete hardening in
conformity with the standard EN 12390-3:2002.
The modulus of elasticity was obtained from
samples loading during creep tests. The creep was
measured for hardened concrete specimens
subjected to a uniform compressive load which was
kept constant over a long period of time (Rilem TC
107-CSP, 1998; ACI Committee 209.1R-05, 2008).
The constant with time stress level of all specimens
was 25% of the maximum strength of the concrete,
which had been determined during destructive tests
carried out on cube specimens. The load was
applied gradually in four steps and as fast as
possible. Specimens were kept under a constant
load for 90 days, and for recoverable creep they
were kept without load for 30 days.
Six aluminium plates had been symmetrically glued
onto three sides of the creep specimens in order to
provide a basis for the strain gauges. The distance
between the centers of the two plates was 50 mm.
Three ±0.001 mm precision strain gauges were
symmetrically connected to each specimen and then
the specimens were put into a creep lever test stand
and loaded (Fig. 2). The samples were tested in two
extreme conditions: in one case they were kept in
100% humidity ensured by preventing the
desiccation of the concrete and in the other case
samples were air-dried. All specimens were kept in
a dry atmosphere of controlled relative humidity in
standard conditions: temperature 20±1ºC and
relative humidity 48±3% (Gilbert et al., 2011).
After creep tests the cylindrical compressive
strength of the specimens at the age of 123 days
was also determined.
Figure 2. Creep lever test stand
The classification of deformations is shown in
Fig. 3 and already described in papers (Gilbert et
al., 2011; Sprince et al., 2011).
A
A-A
F1
F2
F2
F2
F2
F2
F2
F2
F2
800
10
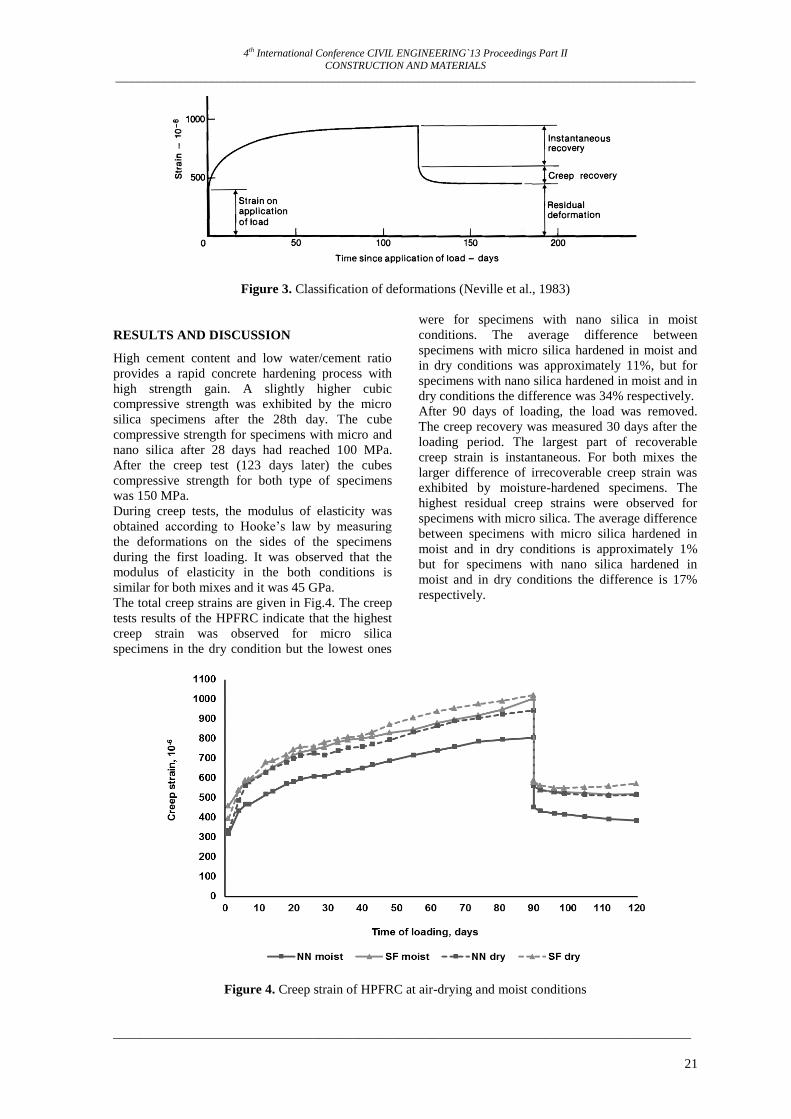
4th International Conference CIVIL ENGINEERING`13 Proceedings Part II
CONSTRUCTION AND MATERIALS _____________________________________________________________________________________________________________
_______________________________________________________________________________________
21
Figure 3. Classification of deformations (Neville et al., 1983)
RESULTS AND DISCUSSION
High cement content and low water/cement ratio
provides a rapid concrete hardening process with
high strength gain. A slightly higher cubic
compressive strength was exhibited by the micro
silica specimens after the 28th day. The cube
compressive strength for specimens with micro and
nano silica after 28 days had reached 100 MPa.
After the creep test (123 days later) the cubes
compressive strength for both type of specimens
was 150 MPa.
During creep tests, the modulus of elasticity was
obtained according to Hooke’s law by measuring
the deformations on the sides of the specimens
during the first loading. It was observed that the
modulus of elasticity in the both conditions is
similar for both mixes and it was 45 GPa.
The total creep strains are given in Fig.4. The creep
tests results of the HPFRC indicate that the highest
creep strain was observed for micro silica
specimens in the dry condition but the lowest ones
were for specimens with nano silica in moist
conditions. The average difference between
specimens with micro silica hardened in moist and
in dry conditions was approximately 11%, but for
specimens with nano silica hardened in moist and in
dry conditions the difference was 34% respectively.
After 90 days of loading, the load was removed.
The creep recovery was measured 30 days after the
loading period. The largest part of recoverable
creep strain is instantaneous. For both mixes the
larger difference of irrecoverable creep strain was
exhibited by moisture-hardened specimens. The
highest residual creep strains were observed for
specimens with micro silica. The average difference
between specimens with micro silica hardened in
moist and in dry conditions is approximately 1%
but for specimens with nano silica hardened in
moist and in dry conditions the difference is 17%
respectively.
Figure 4. Creep strain of HPFRC at air-drying and moist conditions

4th International Conference CIVIL ENGINEERING`13 Proceedings Part II
CONSTRUCTION AND MATERIALS _____________________________________________________________________________________________________________
_________________________________________________________________________
22
The final creep coefficient is a useful measure of
the creeping capacity of concrete and increases with
time at an ever-decreasing rate. The creep
coefficient reduces significantly with the growth of
the concrete strength. The highest creep coefficients
were established for concrete specimens with micro
silica in the both conditions and it reached 3.2. The
lowest creep coefficient was exhibited by the
specimens with nano-silica. In both conditions it
was 2.8.
CONCLUSIONS
Two fiber-reinforced concrete compositions
(HPFRC) with micro and nano-silica as active
additives were prepared for laboratory examination.
The cube compressive strength, modulus of
elasticity and creep strain were determined.
The compression strengths before and after the
creep test (123 days old) were established.
During creep tests, the modulus of elasticity was
obtained. It was observed that the modulus of
elasticity in both conditions is similar for both
mixes.
Concrete specimens were tested on creep. All
specimens were loaded with an equal stress level of
0.25. The load was applied for 90 days and the
long-term deformation responses were measured.
The highest creep strain was observed for micro
silica specimens in dry conditions but the lowest
ones were for specimens with nano-silica in moist
conditions. The creep recovery was observed over a
time period of 30 days. The creep deformations
were found to decrease with concrete aging and
time. The largest part of recoverable creep strain is
instantaneous. For both mixes the larger difference
of irrecoverable creep strain was exhibited by
moist-hardened specimens. The highest residual
creep strains were observed for specimens with
micro silica.
The creep coefficient reduces significantly with the
increase in concrete strength. The highest creep
coefficients were established for concrete
specimens with micro silica and the lowest creep
coefficient was exhibited by the specimens with
nano-silica.
In the future, the physical and mechanical
properties of new FRCC containing micro and
nano-silica should be investigated in a more
detailed way.
The obtained results indicate quite high dispersion
of experimental data. In order to decrease the
dispersion of results, the number of specimens and
tests should be increased.
ACKNOWLEDGEMENT
This work has been supported by the European
Social Fund within the scope of the project
“Support for the Implementation of Doctoral
Studies at Riga Technical University”.
REFERENCES
ACI Committee 209 (2005) Report on Factors Affecting Shrinkage and Creep of Hardened Concrete (ACI
209.1R-05) American Concrete Institute, Farmington Hills, Michigan, USA. 12 p.
EN 12390-3:2009 Testing hardened concrete - Part 3: Compressive strength of test specimens. 22 p.
Gilbert R.I., Ranzi G. (2011) Time-Dependent Behaviour of Concrete Structures. Span Press, London and
New York, England and USA. 426 p.
Neville A.M., Dilger W.H., Brooks J.J. (1983) Creep of Plain and Structural Concrete. Construction Press,
London and New York. 361 p.
Rilem TC 107-CSP (1998): Creep and Shrinkage Prediction Models: Principles of Their Formation.
Measurement of Time-dependent Strains of Concrete. Materials and Structure, Vol. 31, p. 507-512.
Sprince A., Pakrastinsh L., Korjakins A. (2011) Experimental study on creep of new concrete mixtures. In:
Proceedings of the International Scientific Conference „Civil Engineering’11” of Latvia University of
Agriculture, May 12-13, Jelgava 2011. p. 20-26.
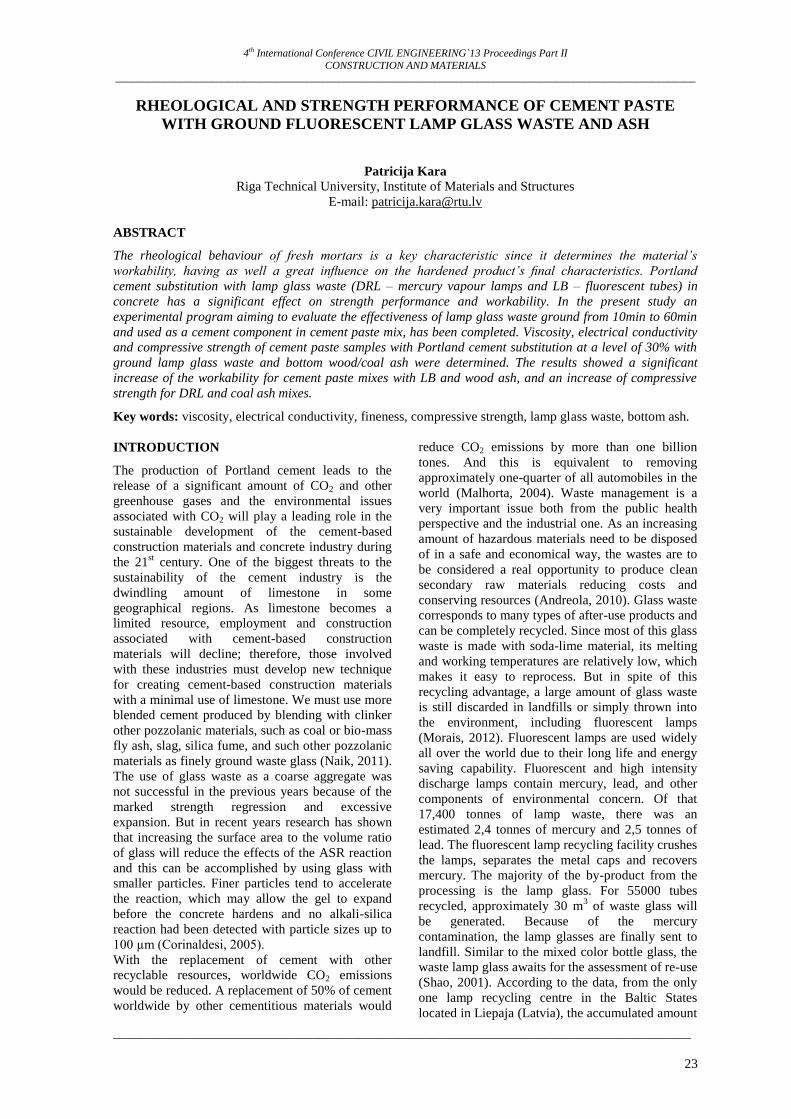
4th International Conference CIVIL ENGINEERING`13 Proceedings Part II
CONSTRUCTION AND MATERIALS _____________________________________________________________________________________________________________
_______________________________________________________________________________________
23
RHEOLOGICAL AND STRENGTH PERFORMANCE OF CEMENT PASTE
WITH GROUND FLUORESCENT LAMP GLASS WASTE AND ASH
Patricija Kara
Riga Technical University, Institute of Materials and Structures
E-mail: [email protected]
ABSTRACT
The rheological behaviour of fresh mortars is a key characteristic since it determines the material’s
workability, having as well a great influence on the hardened product’s final characteristics. Portland
cement substitution with lamp glass waste (DRL – mercury vapour lamps and LB – fluorescent tubes) in
concrete has a significant effect on strength performance and workability. In the present study an
experimental program aiming to evaluate the effectiveness of lamp glass waste ground from 10min to 60min
and used as a cement component in cement paste mix, has been completed. Viscosity, electrical conductivity
and compressive strength of cement paste samples with Portland cement substitution at a level of 30% with
ground lamp glass waste and bottom wood/coal ash were determined. The results showed a significant
increase of the workability for cement paste mixes with LB and wood ash, and an increase of compressive
strength for DRL and coal ash mixes.
Key words: viscosity, electrical conductivity, fineness, compressive strength, lamp glass waste, bottom ash.
INTRODUCTION
The production of Portland cement leads to the
release of a significant amount of CO2 and other
greenhouse gases and the environmental issues
associated with CO2 will play a leading role in the
sustainable development of the cement-based
construction materials and concrete industry during
the 21st century. One of the biggest threats to the
sustainability of the cement industry is the
dwindling amount of limestone in some
geographical regions. As limestone becomes a
limited resource, employment and construction
associated with cement-based construction
materials will decline; therefore, those involved
with these industries must develop new technique
for creating cement-based construction materials
with a minimal use of limestone. We must use more
blended cement produced by blending with clinker
other pozzolanic materials, such as coal or bio-mass
fly ash, slag, silica fume, and such other pozzolanic
materials as finely ground waste glass (Naik, 2011).
The use of glass waste as a coarse aggregate was
not successful in the previous years because of the
marked strength regression and excessive
expansion. But in recent years research has shown
that increasing the surface area to the volume ratio
of glass will reduce the effects of the ASR reaction
and this can be accomplished by using glass with
smaller particles. Finer particles tend to accelerate
the reaction, which may allow the gel to expand
before the concrete hardens and no alkali-silica
reaction had been detected with particle sizes up to
100 µm (Corinaldesi, 2005).
With the replacement of cement with other
recyclable resources, worldwide CO2 emissions
would be reduced. A replacement of 50% of cement
worldwide by other cementitious materials would
reduce CO2 emissions by more than one billion
tones. And this is equivalent to removing
approximately one-quarter of all automobiles in the
world (Malhorta, 2004). Waste management is a
very important issue both from the public health
perspective and the industrial one. As an increasing
amount of hazardous materials need to be disposed
of in a safe and economical way, the wastes are to
be considered a real opportunity to produce clean
secondary raw materials reducing costs and
conserving resources (Andreola, 2010). Glass waste
corresponds to many types of after-use products and
can be completely recycled. Since most of this glass
waste is made with soda-lime material, its melting
and working temperatures are relatively low, which
makes it easy to reprocess. But in spite of this
recycling advantage, a large amount of glass waste
is still discarded in landfills or simply thrown into
the environment, including fluorescent lamps
(Morais, 2012). Fluorescent lamps are used widely
all over the world due to their long life and energy
saving capability. Fluorescent and high intensity
discharge lamps contain mercury, lead, and other
components of environmental concern. Of that
17,400 tonnes of lamp waste, there was an
estimated 2,4 tonnes of mercury and 2,5 tonnes of
lead. The fluorescent lamp recycling facility crushes
the lamps, separates the metal caps and recovers
mercury. The majority of the by-product from the
processing is the lamp glass. For 55000 tubes
recycled, approximately 30 m3 of waste glass will
be generated. Because of the mercury
contamination, the lamp glasses are finally sent to
landfill. Similar to the mixed color bottle glass, the
waste lamp glass awaits for the assessment of re-use
(Shao, 2001). According to the data, from the only
one lamp recycling centre in the Baltic States
located in Liepaja (Latvia), the accumulated amount
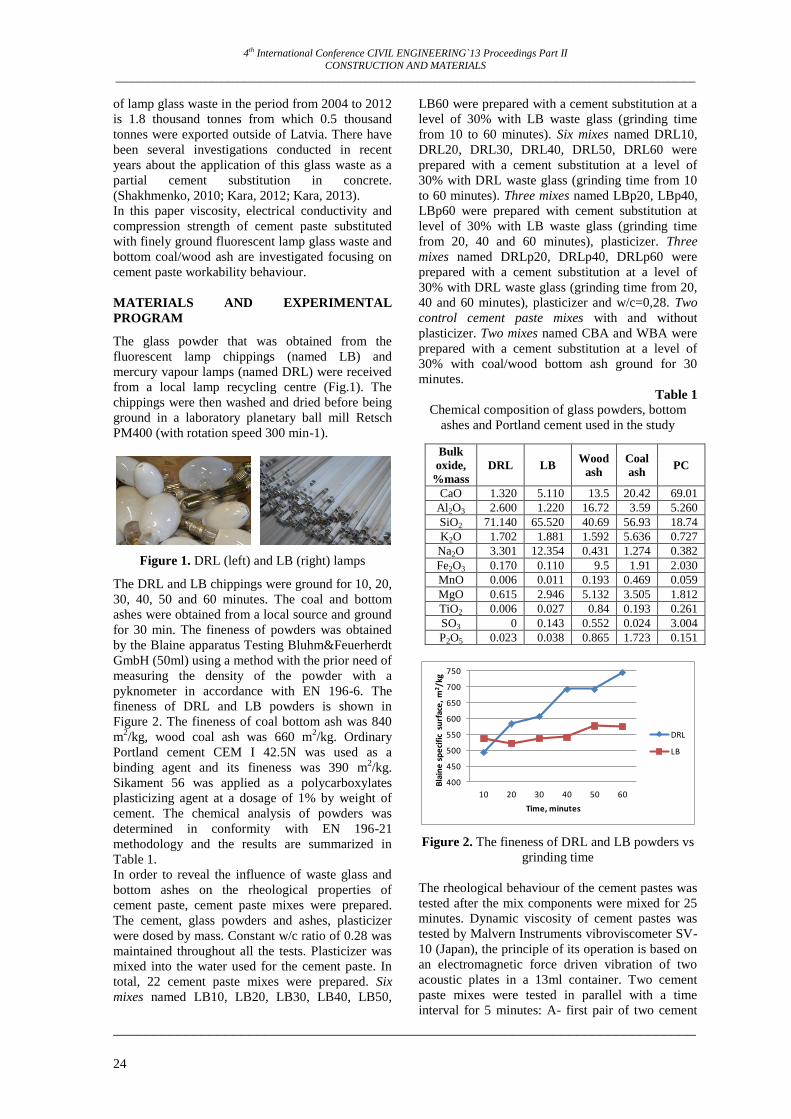
4th International Conference CIVIL ENGINEERING`13 Proceedings Part II
CONSTRUCTION AND MATERIALS _____________________________________________________________________________________________________________
_________________________________________________________________________
24
of lamp glass waste in the period from 2004 to 2012
is 1.8 thousand tonnes from which 0.5 thousand
tonnes were exported outside of Latvia. There have
been several investigations conducted in recent
years about the application of this glass waste as a
partial cement substitution in concrete.
(Shakhmenko, 2010; Kara, 2012; Kara, 2013).
In this paper viscosity, electrical conductivity and
compression strength of cement paste substituted
with finely ground fluorescent lamp glass waste and
bottom coal/wood ash are investigated focusing on
cement paste workability behaviour.
MATERIALS AND EXPERIMENTAL
PROGRAM
The glass powder that was obtained from the
fluorescent lamp chippings (named LB) and
mercury vapour lamps (named DRL) were received
from a local lamp recycling centre (Fig.1). The
chippings were then washed and dried before being
ground in a laboratory planetary ball mill Retsch
PM400 (with rotation speed 300 min-1).
Figure 1. DRL (left) and LB (right) lamps
The DRL and LB chippings were ground for 10, 20,
30, 40, 50 and 60 minutes. The coal and bottom
ashes were obtained from a local source and ground
for 30 min. The fineness of powders was obtained
by the Blaine apparatus Testing Bluhm&Feuerherdt
GmbH (50ml) using a method with the prior need of
measuring the density of the powder with a
pyknometer in accordance with EN 196-6. The
fineness of DRL and LB powders is shown in
Figure 2. The fineness of coal bottom ash was 840
m2/kg, wood coal ash was 660 m
2/kg. Ordinary
Portland cement CEM I 42.5N was used as a
binding agent and its fineness was 390 m2/kg.
Sikament 56 was applied as a polycarboxylates
plasticizing agent at a dosage of 1% by weight of
cement. The chemical analysis of powders was
determined in conformity with EN 196-21
methodology and the results are summarized in
Table 1.
In order to reveal the influence of waste glass and
bottom ashes on the rheological properties of
cement paste, cement paste mixes were prepared.
The cement, glass powders and ashes, plasticizer
were dosed by mass. Constant w/c ratio of 0.28 was
maintained throughout all the tests. Plasticizer was
mixed into the water used for the cement paste. In
total, 22 cement paste mixes were prepared. Six
mixes named LB10, LB20, LB30, LB40, LB50,
LB60 were prepared with a cement substitution at a
level of 30% with LB waste glass (grinding time
from 10 to 60 minutes). Six mixes named DRL10,
DRL20, DRL30, DRL40, DRL50, DRL60 were
prepared with a cement substitution at a level of
30% with DRL waste glass (grinding time from 10
to 60 minutes). Three mixes named LBp20, LBp40,
LBp60 were prepared with cement substitution at
level of 30% with LB waste glass (grinding time
from 20, 40 and 60 minutes), plasticizer. Three
mixes named DRLp20, DRLp40, DRLp60 were
prepared with a cement substitution at a level of
30% with DRL waste glass (grinding time from 20,
40 and 60 minutes), plasticizer and w/c=0,28. Two
control cement paste mixes with and without
plasticizer. Two mixes named CBA and WBA were
prepared with a cement substitution at a level of
30% with coal/wood bottom ash ground for 30
minutes.
Table 1
Chemical composition of glass powders, bottom
ashes and Portland cement used in the study
Figure 2. The fineness of DRL and LB powders vs
grinding time
The rheological behaviour of the cement pastes was
tested after the mix components were mixed for 25
minutes. Dynamic viscosity of cement pastes was
tested by Malvern Instruments vibroviscometer SV-
10 (Japan), the principle of its operation is based on
an electromagnetic force driven vibration of two
acoustic plates in a 13ml container. Two cement
paste mixes were tested in parallel with a time
interval for 5 minutes: A- first pair of two cement
400
450
500
550
600
650
700
750
10 20 30 40 50 60
Bla
ine
sp
eci
fic
surf
ace
, m
2/k
g
Time, minutes
DRL
LB
Bulk
oxide,
%mass
DRL LB Wood
ash
Coal
ash PC
CaO 1.320 5.110 13.5 20.42 69.01
Al2O3 2.600 1.220 16.72 3.59 5.260
SiO2 71.140 65.520 40.69 56.93 18.74
K2O 1.702 1.881 1.592 5.636 0.727
Na2O 3.301 12.354 0.431 1.274 0.382
Fe2O3 0.170 0.110 9.5 1.91 2.030
MnO 0.006 0.011 0.193 0.469 0.059
MgO 0.615 2.946 5.132 3.505 1.812
TiO2 0.006 0.027 0.84 0.193 0.261
SO3 0 0.143 0.552 0.024 3.004
P2O5 0.023 0.038 0.865 1.723 0.151

4th International Conference CIVIL ENGINEERING`13 Proceedings Part II
CONSTRUCTION AND MATERIALS _____________________________________________________________________________________________________________
_______________________________________________________________________________________
25
paste mixes, B – second pair, C- third pair. Each
test had six levels: (i) first cement paste was
prepared and tested at vibroviscometer for 5
minutes, in the meantime of running the experiment
a second cement paste mix was prepared, (ii) the
first cement paste mix was taken off from the
vibroviscometer and left to harden, a second paste
mix was placed for testing for 5 minutes; (iii) a
second cement paste mix was taken off from the
vibroviscometer and left to harden, then the first
paste mix was slightly remixed in the test container
by spoon and placed for testing for another 5
minutes; (iv) the first cement paste mix was taken
off from the vibroviscometer and left to harden, the
second paste mix was slightly remixed in the test
container by spoon and placed for testing for
another 5 minutes; (v) and (vi) – repeat of (iii) and
(iv). The dependence of the cement paste’s
(w/c=0.28) viscosity on time when the grinding
time of LB waste glass was increased from 10 to 60
minutes is shown in Figure 3. The dependence of
the cement paste’s viscosity on time when the
grinding time of DRL waste glass was increased
from 10 to 60 minutes is shown in Figure 4. The
dependence of the cement paste’s (w/c=0.28)
viscosity with plasticizer on time when the grinding
time of LB and DRL waste glass was 20, 40 and 60
minutes is shown in Figure 5. The dependence of
the cement paste’s viscosity on time of wood
(WBA) and coal (CBA) bottom ashes is shown in
Figure 6.
Figure 3. Time dependence of viscosity of Portland
cement paste with the increase of LB waste glass
powder grinding time
It can be seen in Figure 2 and 3 that the finer the LB
glass waste is, the better the viscosity is of the
cement paste. The optimal grinding time for LB
glass waste is 30 minutes with Blaine specific
surface area of 542 m2/kg. In Figure 3 it is possible
to observe the increase of the viscosity of cement
paste with LB glass waste with increased time
duration. The best result in this experiment set is for
the mix LB60C. In comparison with Figure 6 where
it is shown the viscosity of the cement paste,
cement substitution with LB glass waste reasonably
improves the workability and has an impact on the
rheological properties of the cement paste.
However, after first 10 minutes of the experiment it
is observed that there is a slight decrease of
viscosity for all cement paste samples with LB glass
waste.
Figure 4. Time dependence of viscosity of
Portland cement paste with the increase of DRL
glass waste powder grinding time
It can be seen from Figures 2 and 4 that the finer is
DRL glass waste the better viscosity of the cement
paste in the first 5 minutes of the experiment. The
Blaine specific surface area of DRL glass waste is
much higher in comparison to LB glass waste with
an increase of grinding time as it can be seen in
Figure 2. The optimal grinding time for DRL glass
waste is 20-30 minutes. In Figure 3 it is possible to
observe a decrease of the viscosity of cement paste
with DRL glass waste with an increased duration of
time. The higher the grinding time of DRL glass
waste the lower is the viscosity is of the cement
paste. It can be described by the fact that - DRL
particles are finer and more active than they are for
pozzolanic reactions in the cement paste. The best
result in this experiment set was the mix DRL10A
from the workability’s point of view. In comparison
with the control mix, the cement paste with DRL
glass waste also performed better.
Figure 5. Time dependence of viscosity of Portland
cement paste with plasticizer and LB and DRL
glass waste powder ground for 20, 40 and 60
minutes
It can be seen in Figure 5 that the addition of
plasticizer into cement paste mixes changes the
character of viscosity of the mixes with DRL and
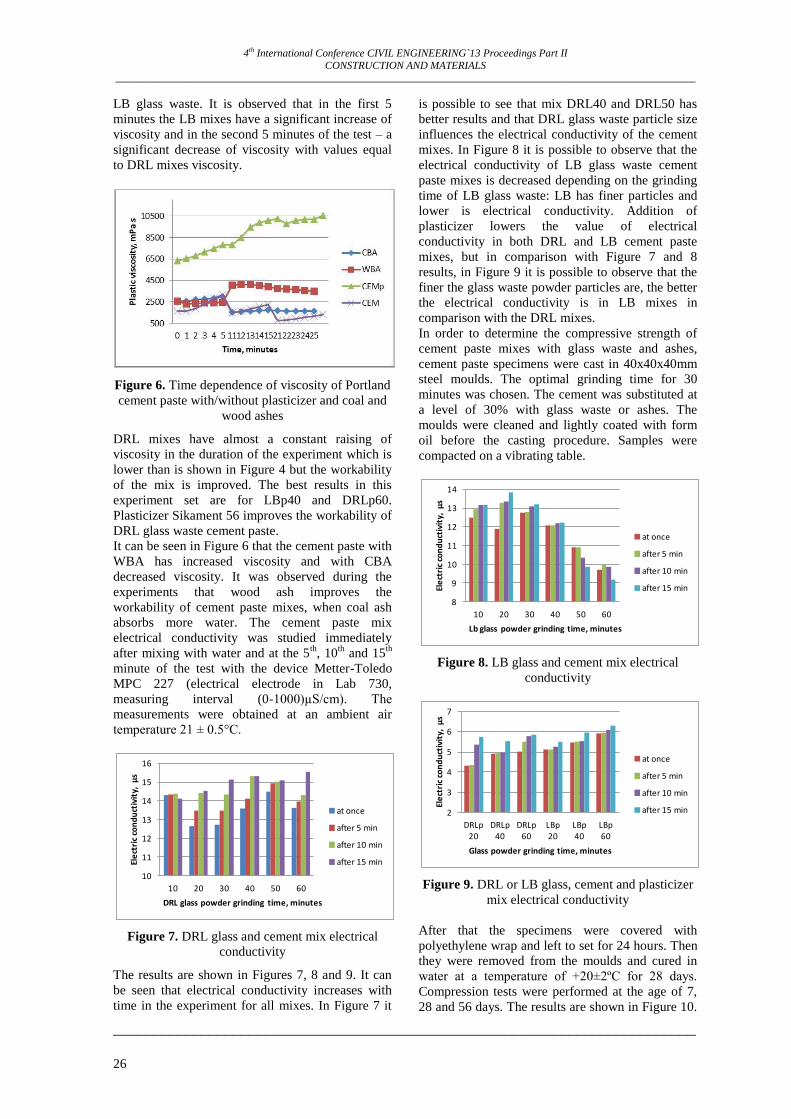
4th International Conference CIVIL ENGINEERING`13 Proceedings Part II
CONSTRUCTION AND MATERIALS _____________________________________________________________________________________________________________
_________________________________________________________________________
26
LB glass waste. It is observed that in the first 5
minutes the LB mixes have a significant increase of
viscosity and in the second 5 minutes of the test – a
significant decrease of viscosity with values equal
to DRL mixes viscosity.
Figure 6. Time dependence of viscosity of Portland
cement paste with/without plasticizer and coal and
wood ashes
DRL mixes have almost a constant raising of
viscosity in the duration of the experiment which is
lower than is shown in Figure 4 but the workability
of the mix is improved. The best results in this
experiment set are for LBp40 and DRLp60.
Plasticizer Sikament 56 improves the workability of
DRL glass waste cement paste.
It can be seen in Figure 6 that the cement paste with
WBA has increased viscosity and with CBA
decreased viscosity. It was observed during the
experiments that wood ash improves the
workability of cement paste mixes, when coal ash
absorbs more water. The cement paste mix
electrical conductivity was studied immediately
after mixing with water and at the 5th
, 10th
and 15th
minute of the test with the device Metter-Toledo
MPC 227 (electrical electrode in Lab 730,
measuring interval (0-1000)µS/cm). The
measurements were obtained at an ambient air
temperature 21 ± 0.5°C.
Figure 7. DRL glass and cement mix electrical
conductivity
The results are shown in Figures 7, 8 and 9. It can
be seen that electrical conductivity increases with
time in the experiment for all mixes. In Figure 7 it
is possible to see that mix DRL40 and DRL50 has
better results and that DRL glass waste particle size
influences the electrical conductivity of the cement
mixes. In Figure 8 it is possible to observe that the
electrical conductivity of LB glass waste cement
paste mixes is decreased depending on the grinding
time of LB glass waste: LB has finer particles and
lower is electrical conductivity. Addition of
plasticizer lowers the value of electrical
conductivity in both DRL and LB cement paste
mixes, but in comparison with Figure 7 and 8
results, in Figure 9 it is possible to observe that the
finer the glass waste powder particles are, the better
the electrical conductivity is in LB mixes in
comparison with the DRL mixes.
In order to determine the compressive strength of
cement paste mixes with glass waste and ashes,
cement paste specimens were cast in 40x40x40mm
steel moulds. The optimal grinding time for 30
minutes was chosen. The cement was substituted at
a level of 30% with glass waste or ashes. The
moulds were cleaned and lightly coated with form
oil before the casting procedure. Samples were
compacted on a vibrating table.
Figure 8. LB glass and cement mix electrical
conductivity
Figure 9. DRL or LB glass, cement and plasticizer
mix electrical conductivity
After that the specimens were covered with
polyethylene wrap and left to set for 24 hours. Then
they were removed from the moulds and cured in
water at a temperature of +20±2ºC for 28 days.
Compression tests were performed at the age of 7,
28 and 56 days. The results are shown in Figure 10.
10
11
12
13
14
15
16
10 20 30 40 50 60
Ele
ctri
c co
nd
uct
ivit
y, µ
s
DRL glass powder grinding time, minutes
at once
after 5 min
after 10 min
after 15 min
8
9
10
11
12
13
14
10 20 30 40 50 60
Ele
ctri
c co
nd
uct
ivit
y, µ
s
Lb glass powder grinding time, minutes
at once
after 5 min
after 10 min
after 15 min
2
3
4
5
6
7
DRLp 20
DRLp 40
DRLp 60
LBp 20
LBp 40
LBp 60
Ele
ctri
c co
nd
uct
ivit
y, µ
s
Glass powder grinding time, minutes
at once
after 5 min
after 10 min
after 15 min

4th International Conference CIVIL ENGINEERING`13 Proceedings Part II
CONSTRUCTION AND MATERIALS _____________________________________________________________________________________________________________
_______________________________________________________________________________________
27
As it can be seen the best results were performed by
the mixes with DRL glass waste powder with a
maximum compressive strength for mixes DRL30
equal to 102 Mpa and DRLp30 equal to 117MPa at
the age of 56 days.
Figure 10. Influence of glass waste and bottom ash
and curing time on the cement paste mix
compressive strength
CONCLUSIONS
The rheological behavior of cement paste is
improved by the application of fluorescent lamp
glass waste in the mixes. However, the
effectiveness of glass waste grinding time on
rheological behavior and strength performance
depends on the chemical composition of the glass
waste and bottom ash used as a cement component
in the cement paste mix. As it was observed, the
finer the LB glass waste particles were the higher
the value of viscosity was including lower electrical
conductivity. The finer the DRL glass waste
particles, the lower value of viscosity, and an
almost constant electrical conductivity was
observed.
AKNOWLEDGEMENT
The financial support of the ERAF project Nr.
2010/0286/2DP/2.1.1.1.0/10/APIA/VIAA/033
„High efficiency nanoconcretes” and Riga
Technical University are acknowledged. The author
gratefully acknowledges the help of the VGTU
Civil Engineering Centre and Scientific Institute of
Thermal Insulation in providing the laboratory
equipment.
REFERENCES
Andreola, F., Barbieri, L., Lancellotti, I. (2010). End of life-materials: WEEE glass recovery in construction
sector. In: Proceedings of the second international conference on sustainable construction materials and
technologies, Ancona. Available: http://www.claisse.info/2010%20papers/l43.pdf
Gorinaldesi V, Gnappi G, Moriconi G, Montenero A. (2005). Reuse of ground waste glass as aggregate for
mortars. Waste Management, 25(2), pp. 197–201.
Kara P., Korjakins A. (2013). Investigation of thermal properties of cement paste with fluorescent lamp
waste glass, glass cullet and coal/wood ashes, Journal of Sustainable Architecture and Civil Engineering,
KTU, Kaunas, Lithuania,, 2013, Vol. 2(3) (accepted for print)
Kara, P., Korjakins, A., Kovalenko, K. (2012). The Usage of Fluorescent Waste Glass Powder in Concrete.
Scientific Journal of Riga Technical University, Construction Science, 13 vol., pp. 26-32.
Malhorta V.M. (2004). Role of supplementary cementing materials and superplasticizers in reducing
greenhouse gas emissions. In the proceeding of ICFRC international conference on Fiber Composites, High
performance concrete and smart materials, Indian Institute of Technology, Chennai, India, pp. 489-499.
Morais A.S.C., Caldas T.C.C, Monteiro S.N., Vieira C.M.F. (2012). Characterization of fluorescent lamp
glass waste powders, Materials Science Forum Vol. 727-728, pp.1579-1584.
Naik T.R. (2011). Current sustainability issues and innovations in cement-based materials, in the proceedings
of 2nd
Workshop on The new boundaries of structural concrete, UPM &ACI Italy chapter, Ancona, 2011, pp.
217-225.
Shao Y., Lehoux P.(2001). Feasibility of using ground waste glass as a cementitious material, Recycling and
reuse of glass cullet, Thomas Telford Publishing, London, UK, pp. 209-219.
Shakhmenko G., Korjakins A., Bumanis G. (2010). Concrete with microfiller obtained from recycled lamp
glass. In the proceedings of the 10th international Conference Modern building materials, structures and
techniques, Vilnius Lithuania, 19-21 May, 2010, pp. 280-284.
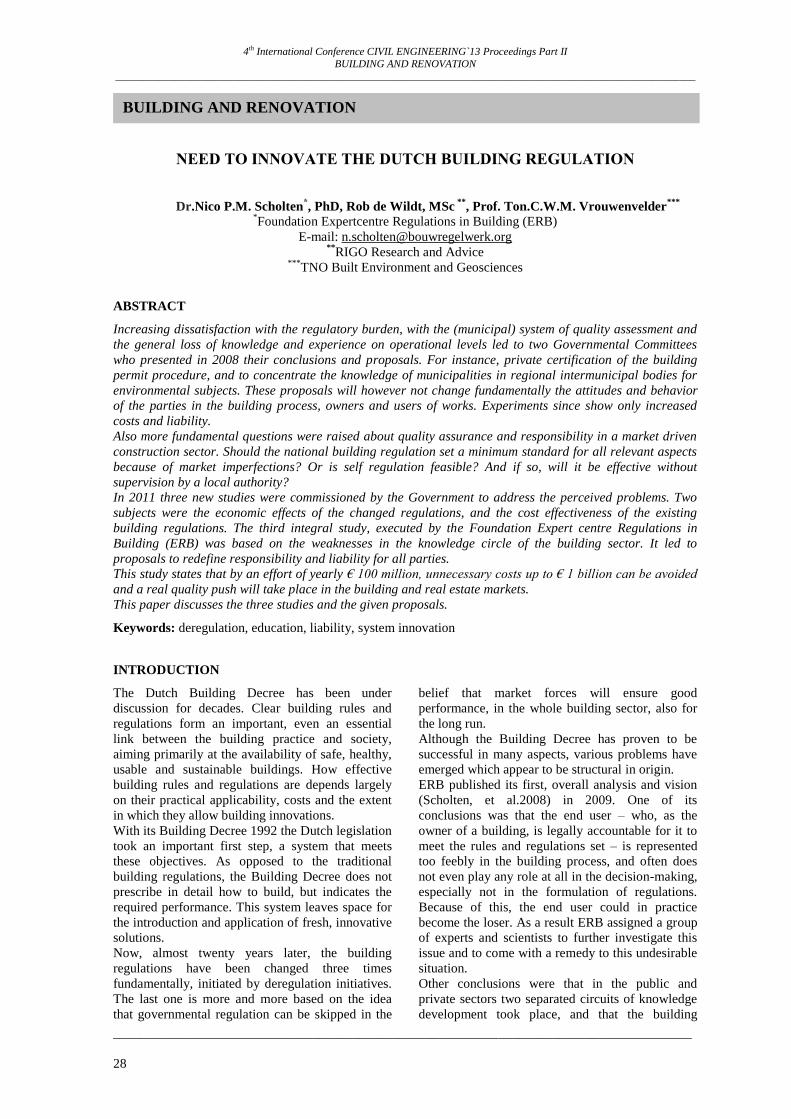
4th International Conference CIVIL ENGINEERING`13 Proceedings Part II
BUILDING AND RENOVATION
_____________________________________________________________________________________________________________
_______________________________________________________________________________________
28
NEED TO INNOVATE THE DUTCH BUILDING REGULATION
Dr.Nico P.M. Scholten*, PhD, Rob de Wildt, MSc
**, Prof. Ton.C.W.M. Vrouwenvelder
***
*Foundation Expertcentre Regulations in Building (ERB)
E-mail: [email protected] **
RIGO Research and Advice ***
TNO Built Environment and Geosciences
ABSTRACT
Increasing dissatisfaction with the regulatory burden, with the (municipal) system of quality assessment and
the general loss of knowledge and experience on operational levels led to two Governmental Committees
who presented in 2008 their conclusions and proposals. For instance, private certification of the building
permit procedure, and to concentrate the knowledge of municipalities in regional intermunicipal bodies for
environmental subjects. These proposals will however not change fundamentally the attitudes and behavior
of the parties in the building process, owners and users of works. Experiments since show only increased
costs and liability.
Also more fundamental questions were raised about quality assurance and responsibility in a market driven
construction sector. Should the national building regulation set a minimum standard for all relevant aspects
because of market imperfections? Or is self regulation feasible? And if so, will it be effective without
supervision by a local authority?
In 2011 three new studies were commissioned by the Government to address the perceived problems. Two
subjects were the economic effects of the changed regulations, and the cost effectiveness of the existing
building regulations. The third integral study, executed by the Foundation Expert centre Regulations in
Building (ERB) was based on the weaknesses in the knowledge circle of the building sector. It led to
proposals to redefine responsibility and liability for all parties.
This study states that by an effort of yearly € 100 million, unnecessary costs up to € 1 billion can be avoided
and a real quality push will take place in the building and real estate markets.
This paper discusses the three studies and the given proposals.
Keywords: deregulation, education, liability, system innovation
INTRODUCTION
The Dutch Building Decree has been under
discussion for decades. Clear building rules and
regulations form an important, even an essential
link between the building practice and society,
aiming primarily at the availability of safe, healthy,
usable and sustainable buildings. How effective
building rules and regulations are depends largely
on their practical applicability, costs and the extent
in which they allow building innovations.
With its Building Decree 1992 the Dutch legislation
took an important first step, a system that meets
these objectives. As opposed to the traditional
building regulations, the Building Decree does not
prescribe in detail how to build, but indicates the
required performance. This system leaves space for
the introduction and application of fresh, innovative
solutions.
Now, almost twenty years later, the building
regulations have been changed three times
fundamentally, initiated by deregulation initiatives.
The last one is more and more based on the idea
that governmental regulation can be skipped in the
belief that market forces will ensure good
performance, in the whole building sector, also for
the long run.
Although the Building Decree has proven to be
successful in many aspects, various problems have
emerged which appear to be structural in origin.
ERB published its first, overall analysis and vision
(Scholten, et al.2008) in 2009. One of its
conclusions was that the end user – who, as the
owner of a building, is legally accountable for it to
meet the rules and regulations set – is represented
too feebly in the building process, and often does
not even play any role at all in the decision-making,
especially not in the formulation of regulations.
Because of this, the end user could in practice
become the loser. As a result ERB assigned a group
of experts and scientists to further investigate this
issue and to come with a remedy to this undesirable
situation.
Other conclusions were that in the public and
private sectors two separated circuits of knowledge
development took place, and that the building
BUILDING AND RENOVATION
Building and Renovation
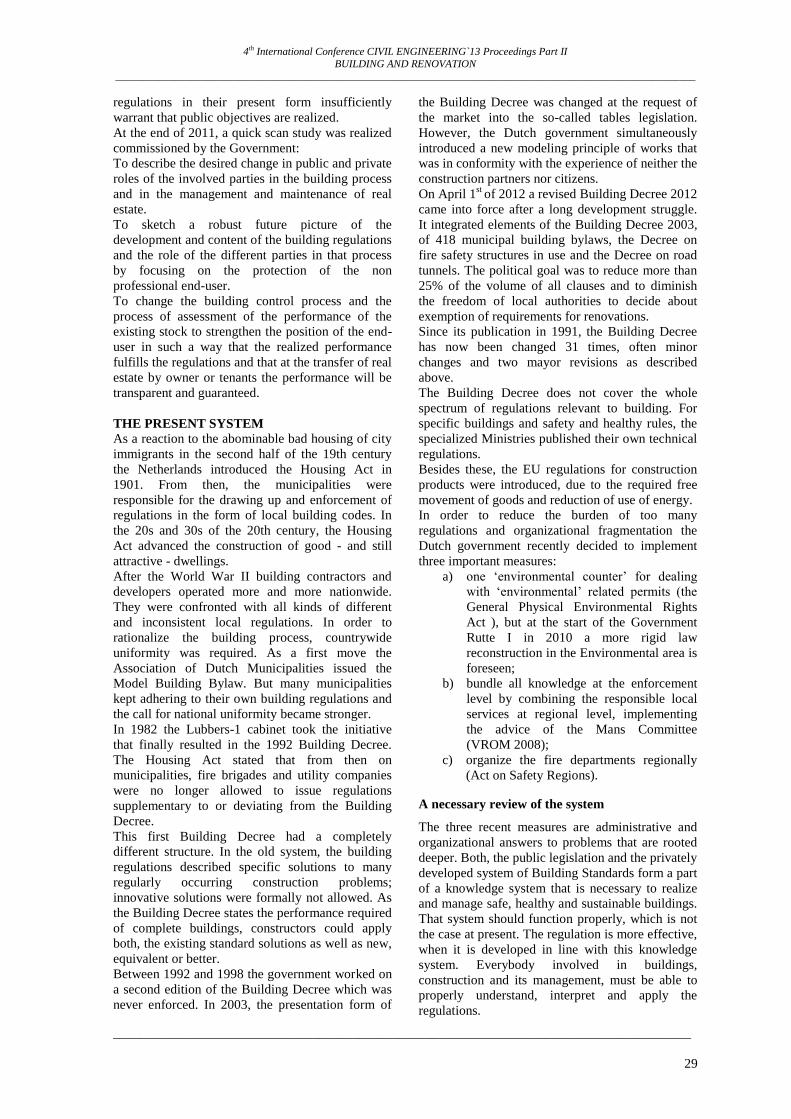
4th International Conference CIVIL ENGINEERING`13 Proceedings Part II
BUILDING AND RENOVATION
_____________________________________________________________________________________________________________
_______________________________________________________________________________________
29
regulations in their present form insufficiently
warrant that public objectives are realized.
At the end of 2011, a quick scan study was realized
commissioned by the Government:
To describe the desired change in public and private
roles of the involved parties in the building process
and in the management and maintenance of real
estate.
To sketch a robust future picture of the
development and content of the building regulations
and the role of the different parties in that process
by focusing on the protection of the non
professional end-user.
To change the building control process and the
process of assessment of the performance of the
existing stock to strengthen the position of the end-
user in such a way that the realized performance
fulfills the regulations and that at the transfer of real
estate by owner or tenants the performance will be
transparent and guaranteed.
THE PRESENT SYSTEM
As a reaction to the abominable bad housing of city
immigrants in the second half of the 19th century
the Netherlands introduced the Housing Act in
1901. From then, the municipalities were
responsible for the drawing up and enforcement of
regulations in the form of local building codes. In
the 20s and 30s of the 20th century, the Housing
Act advanced the construction of good - and still
attractive - dwellings.
After the World War II building contractors and
developers operated more and more nationwide.
They were confronted with all kinds of different
and inconsistent local regulations. In order to
rationalize the building process, countrywide
uniformity was required. As a first move the
Association of Dutch Municipalities issued the
Model Building Bylaw. But many municipalities
kept adhering to their own building regulations and
the call for national uniformity became stronger.
In 1982 the Lubbers-1 cabinet took the initiative
that finally resulted in the 1992 Building Decree.
The Housing Act stated that from then on
municipalities, fire brigades and utility companies
were no longer allowed to issue regulations
supplementary to or deviating from the Building
Decree.
This first Building Decree had a completely
different structure. In the old system, the building
regulations described specific solutions to many
regularly occurring construction problems;
innovative solutions were formally not allowed. As
the Building Decree states the performance required
of complete buildings, constructors could apply
both, the existing standard solutions as well as new,
equivalent or better.
Between 1992 and 1998 the government worked on
a second edition of the Building Decree which was
never enforced. In 2003, the presentation form of
the Building Decree was changed at the request of
the market into the so-called tables legislation.
However, the Dutch government simultaneously
introduced a new modeling principle of works that
was in conformity with the experience of neither the
construction partners nor citizens.
On April 1st
of 2012 a revised Building Decree 2012
came into force after a long development struggle.
It integrated elements of the Building Decree 2003,
of 418 municipal building bylaws, the Decree on
fire safety structures in use and the Decree on road
tunnels. The political goal was to reduce more than
25% of the volume of all clauses and to diminish
the freedom of local authorities to decide about
exemption of requirements for renovations.
Since its publication in 1991, the Building Decree
has now been changed 31 times, often minor
changes and two mayor revisions as described
above.
The Building Decree does not cover the whole
spectrum of regulations relevant to building. For
specific buildings and safety and healthy rules, the
specialized Ministries published their own technical
regulations.
Besides these, the EU regulations for construction
products were introduced, due to the required free
movement of goods and reduction of use of energy.
In order to reduce the burden of too many
regulations and organizational fragmentation the
Dutch government recently decided to implement
three important measures:
a) one ‘environmental counter’ for dealing
with ‘environmental’ related permits (the
General Physical Environmental Rights
Act ), but at the start of the Government
Rutte I in 2010 a more rigid law
reconstruction in the Environmental area is
foreseen;
b) bundle all knowledge at the enforcement
level by combining the responsible local
services at regional level, implementing
the advice of the Mans Committee
(VROM 2008);
c) organize the fire departments regionally
(Act on Safety Regions).
A necessary review of the system
The three recent measures are administrative and
organizational answers to problems that are rooted
deeper. Both, the public legislation and the privately
developed system of Building Standards form a part
of a knowledge system that is necessary to realize
and manage safe, healthy and sustainable buildings.
That system should function properly, which is not
the case at present. The regulation is more effective,
when it is developed in line with this knowledge
system. Everybody involved in buildings,
construction and its management, must be able to
properly understand, interpret and apply the
regulations.
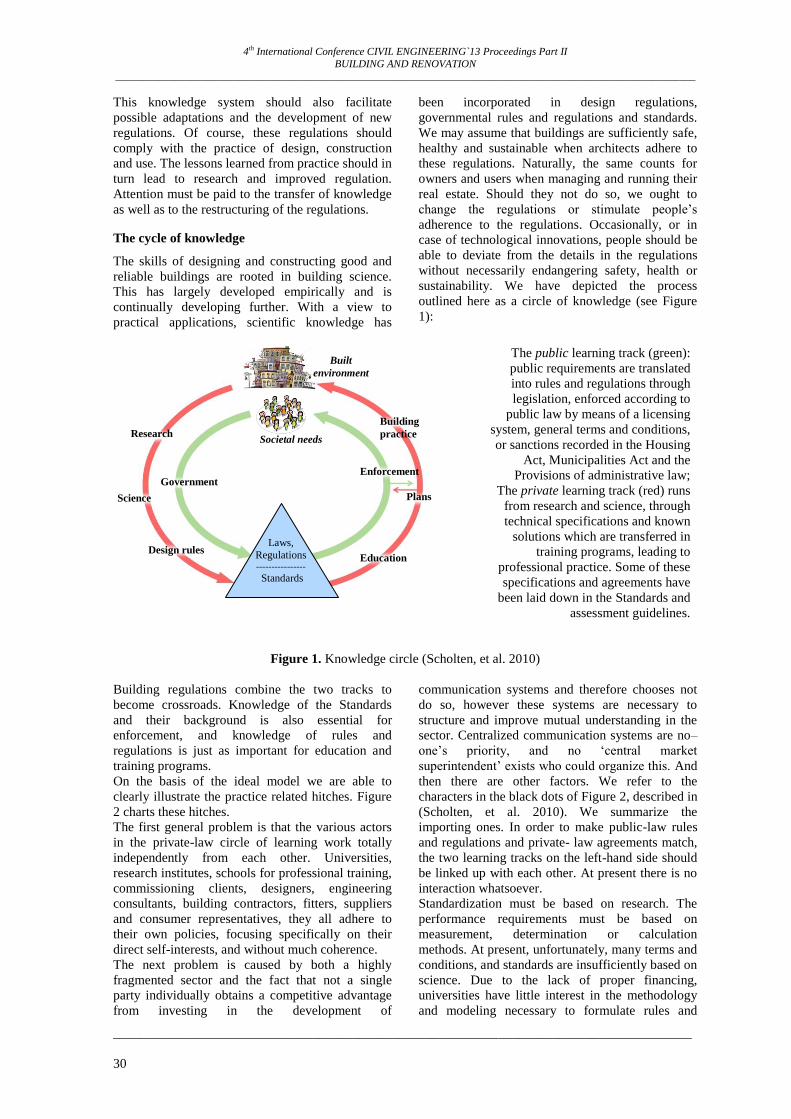
4th International Conference CIVIL ENGINEERING`13 Proceedings Part II
BUILDING AND RENOVATION
_____________________________________________________________________________________________________________
_______________________________________________________________________________________
30
This knowledge system should also facilitate
possible adaptations and the development of new
regulations. Of course, these regulations should
comply with the practice of design, construction
and use. The lessons learned from practice should in
turn lead to research and improved regulation.
Attention must be paid to the transfer of knowledge
as well as to the restructuring of the regulations.
The cycle of knowledge
The skills of designing and constructing good and
reliable buildings are rooted in building science.
This has largely developed empirically and is
continually developing further. With a view to
practical applications, scientific knowledge has
been incorporated in design regulations,
governmental rules and regulations and standards.
We may assume that buildings are sufficiently safe,
healthy and sustainable when architects adhere to
these regulations. Naturally, the same counts for
owners and users when managing and running their
real estate. Should they not do so, we ought to
change the regulations or stimulate people’s
adherence to the regulations. Occasionally, or in
case of technological innovations, people should be
able to deviate from the details in the regulations
without necessarily endangering safety, health or
sustainability. We have depicted the process
outlined here as a circle of knowledge (see Figure
1):
The public learning track (green):
public requirements are translated
into rules and regulations through
legislation, enforced according to
public law by means of a licensing
system, general terms and conditions,
or sanctions recorded in the Housing
Act, Municipalities Act and the
Provisions of administrative law;
The private learning track (red) runs
from research and science, through
technical specifications and known
solutions which are transferred in
training programs, leading to
professional practice. Some of these
specifications and agreements have
been laid down in the Standards and
assessment guidelines.
Figure 1. Knowledge circle (Scholten, et al. 2010)
Building regulations combine the two tracks to
become crossroads. Knowledge of the Standards
and their background is also essential for
enforcement, and knowledge of rules and
regulations is just as important for education and
training programs.
On the basis of the ideal model we are able to
clearly illustrate the practice related hitches. Figure
2 charts these hitches.
The first general problem is that the various actors
in the private-law circle of learning work totally
independently from each other. Universities,
research institutes, schools for professional training,
commissioning clients, designers, engineering
consultants, building contractors, fitters, suppliers
and consumer representatives, they all adhere to
their own policies, focusing specifically on their
direct self-interests, and without much coherence.
The next problem is caused by both a highly
fragmented sector and the fact that not a single
party individually obtains a competitive advantage
from investing in the development of
communication systems and therefore chooses not
do so, however these systems are necessary to
structure and improve mutual understanding in the
sector. Centralized communication systems are no–
one’s priority, and no ‘central market
superintendent’ exists who could organize this. And
then there are other factors. We refer to the
characters in the black dots of Figure 2, described in
(Scholten, et al. 2010). We summarize the
importing ones. In order to make public-law rules
and regulations and private- law agreements match,
the two learning tracks on the left-hand side should
be linked up with each other. At present there is no
interaction whatsoever.
Standardization must be based on research. The
performance requirements must be based on
measurement, determination or calculation
methods. At present, unfortunately, many terms and
conditions, and standards are insufficiently based on
science. Due to the lack of proper financing,
universities have little interest in the methodology
and modeling necessary to formulate rules and
Built
environment
Societal needs Research
Science
Enforcement
Building
practice
Plans
Education
Laws,
Regulations ----------------
Standards
Government
Design rules
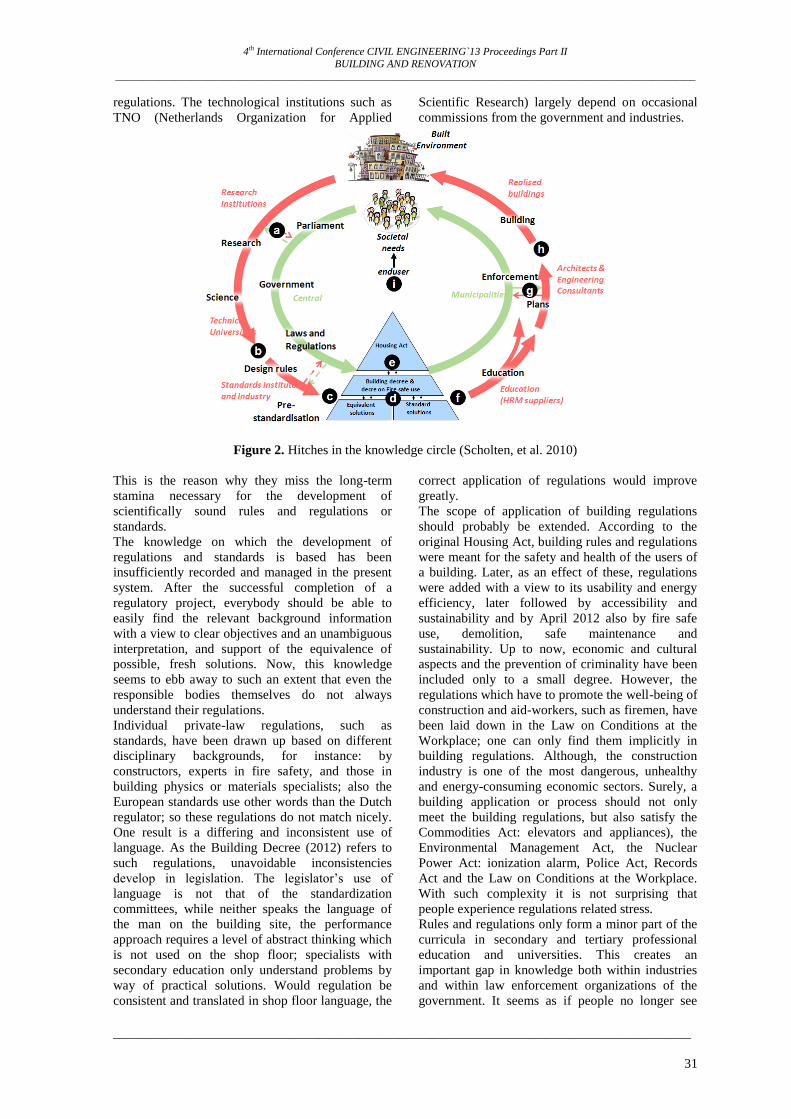
4th International Conference CIVIL ENGINEERING`13 Proceedings Part II
BUILDING AND RENOVATION
_____________________________________________________________________________________________________________
_______________________________________________________________________________________
31
regulations. The technological institutions such as
TNO (Netherlands Organization for Applied
Scientific Research) largely depend on occasional
commissions from the government and industries.
Figure 2. Hitches in the knowledge circle (Scholten, et al. 2010)
This is the reason why they miss the long-term
stamina necessary for the development of
scientifically sound rules and regulations or
standards.
The knowledge on which the development of
regulations and standards is based has been
insufficiently recorded and managed in the present
system. After the successful completion of a
regulatory project, everybody should be able to
easily find the relevant background information
with a view to clear objectives and an unambiguous
interpretation, and support of the equivalence of
possible, fresh solutions. Now, this knowledge
seems to ebb away to such an extent that even the
responsible bodies themselves do not always
understand their regulations.
Individual private-law regulations, such as
standards, have been drawn up based on different
disciplinary backgrounds, for instance: by
constructors, experts in fire safety, and those in
building physics or materials specialists; also the
European standards use other words than the Dutch
regulator; so these regulations do not match nicely.
One result is a differing and inconsistent use of
language. As the Building Decree (2012) refers to
such regulations, unavoidable inconsistencies
develop in legislation. The legislator’s use of
language is not that of the standardization
committees, while neither speaks the language of
the man on the building site, the performance
approach requires a level of abstract thinking which
is not used on the shop floor; specialists with
secondary education only understand problems by
way of practical solutions. Would regulation be
consistent and translated in shop floor language, the
correct application of regulations would improve
greatly.
The scope of application of building regulations
should probably be extended. According to the
original Housing Act, building rules and regulations
were meant for the safety and health of the users of
a building. Later, as an effect of these, regulations
were added with a view to its usability and energy
efficiency, later followed by accessibility and
sustainability and by April 2012 also by fire safe
use, demolition, safe maintenance and
sustainability. Up to now, economic and cultural
aspects and the prevention of criminality have been
included only to a small degree. However, the
regulations which have to promote the well-being of
construction and aid-workers, such as firemen, have
been laid down in the Law on Conditions at the
Workplace; one can only find them implicitly in
building regulations. Although, the construction
industry is one of the most dangerous, unhealthy
and energy-consuming economic sectors. Surely, a
building application or process should not only
meet the building regulations, but also satisfy the
Commodities Act: elevators and appliances), the
Environmental Management Act, the Nuclear
Power Act: ionization alarm, Police Act, Records
Act and the Law on Conditions at the Workplace.
With such complexity it is not surprising that
people experience regulations related stress.
Rules and regulations only form a minor part of the
curricula in secondary and tertiary professional
education and universities. This creates an
important gap in knowledge both within industries
and within law enforcement organizations of the
government. It seems as if people no longer see
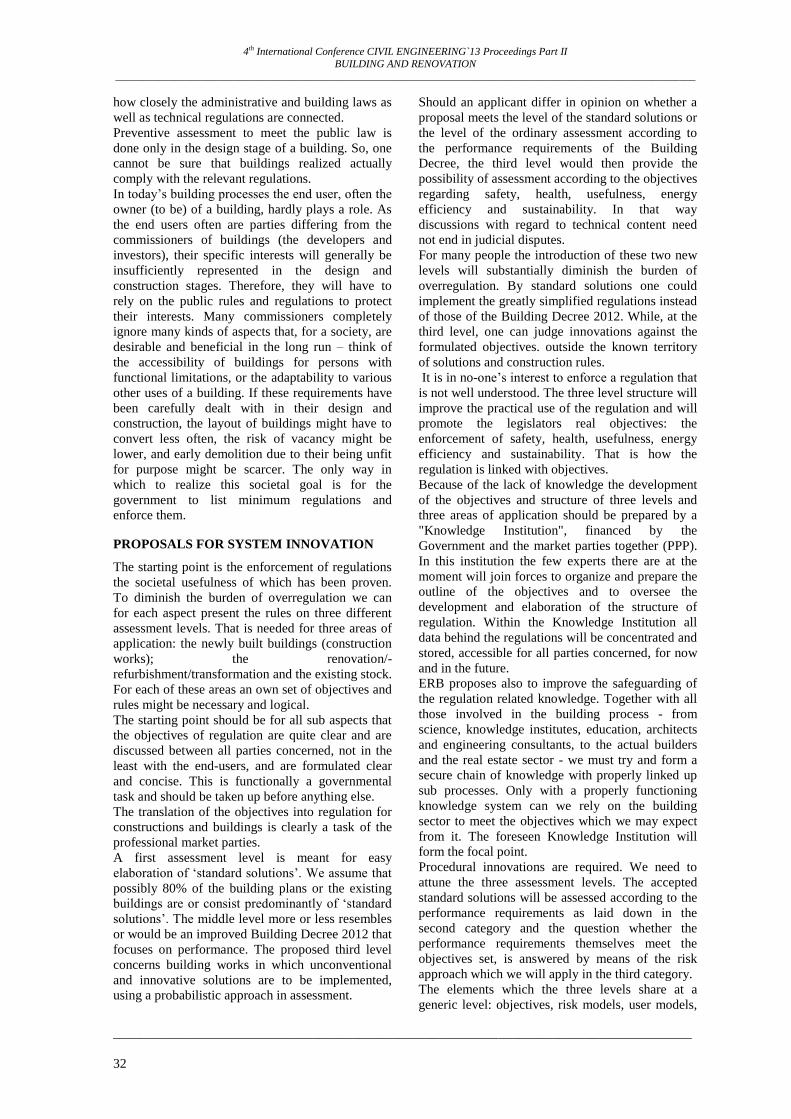
4th International Conference CIVIL ENGINEERING`13 Proceedings Part II
BUILDING AND RENOVATION
_____________________________________________________________________________________________________________
_______________________________________________________________________________________
32
how closely the administrative and building laws as
well as technical regulations are connected.
Preventive assessment to meet the public law is
done only in the design stage of a building. So, one
cannot be sure that buildings realized actually
comply with the relevant regulations.
In today’s building processes the end user, often the
owner (to be) of a building, hardly plays a role. As
the end users often are parties differing from the
commissioners of buildings (the developers and
investors), their specific interests will generally be
insufficiently represented in the design and
construction stages. Therefore, they will have to
rely on the public rules and regulations to protect
their interests. Many commissioners completely
ignore many kinds of aspects that, for a society, are
desirable and beneficial in the long run – think of
the accessibility of buildings for persons with
functional limitations, or the adaptability to various
other uses of a building. If these requirements have
been carefully dealt with in their design and
construction, the layout of buildings might have to
convert less often, the risk of vacancy might be
lower, and early demolition due to their being unfit
for purpose might be scarcer. The only way in
which to realize this societal goal is for the
government to list minimum regulations and
enforce them.
PROPOSALS FOR SYSTEM INNOVATION
The starting point is the enforcement of regulations
the societal usefulness of which has been proven.
To diminish the burden of overregulation we can
for each aspect present the rules on three different
assessment levels. That is needed for three areas of
application: the newly built buildings (construction
works); the renovation/-
refurbishment/transformation and the existing stock.
For each of these areas an own set of objectives and
rules might be necessary and logical.
The starting point should be for all sub aspects that
the objectives of regulation are quite clear and are
discussed between all parties concerned, not in the
least with the end-users, and are formulated clear
and concise. This is functionally a governmental
task and should be taken up before anything else.
The translation of the objectives into regulation for
constructions and buildings is clearly a task of the
professional market parties.
A first assessment level is meant for easy
elaboration of ‘standard solutions’. We assume that
possibly 80% of the building plans or the existing
buildings are or consist predominantly of ‘standard
solutions’. The middle level more or less resembles
or would be an improved Building Decree 2012 that
focuses on performance. The proposed third level
concerns building works in which unconventional
and innovative solutions are to be implemented,
using a probabilistic approach in assessment.
Should an applicant differ in opinion on whether a
proposal meets the level of the standard solutions or
the level of the ordinary assessment according to
the performance requirements of the Building
Decree, the third level would then provide the
possibility of assessment according to the objectives
regarding safety, health, usefulness, energy
efficiency and sustainability. In that way
discussions with regard to technical content need
not end in judicial disputes.
For many people the introduction of these two new
levels will substantially diminish the burden of
overregulation. By standard solutions one could
implement the greatly simplified regulations instead
of those of the Building Decree 2012. While, at the
third level, one can judge innovations against the
formulated objectives. outside the known territory
of solutions and construction rules.
It is in no-one’s interest to enforce a regulation that
is not well understood. The three level structure will
improve the practical use of the regulation and will
promote the legislators real objectives: the
enforcement of safety, health, usefulness, energy
efficiency and sustainability. That is how the
regulation is linked with objectives.
Because of the lack of knowledge the development
of the objectives and structure of three levels and
three areas of application should be prepared by a
"Knowledge Institution", financed by the
Government and the market parties together (PPP).
In this institution the few experts there are at the
moment will join forces to organize and prepare the
outline of the objectives and to oversee the
development and elaboration of the structure of
regulation. Within the Knowledge Institution all
data behind the regulations will be concentrated and
stored, accessible for all parties concerned, for now
and in the future.
ERB proposes also to improve the safeguarding of
the regulation related knowledge. Together with all
those involved in the building process - from
science, knowledge institutes, education, architects
and engineering consultants, to the actual builders
and the real estate sector - we must try and form a
secure chain of knowledge with properly linked up
sub processes. Only with a properly functioning
knowledge system can we rely on the building
sector to meet the objectives which we may expect
from it. The foreseen Knowledge Institution will
form the focal point.
Procedural innovations are required. We need to
attune the three assessment levels. The accepted
standard solutions will be assessed according to the
performance requirements as laid down in the
second category and the question whether the
performance requirements themselves meet the
objectives set, is answered by means of the risk
approach which we will apply in the third category.
The elements which the three levels share at a
generic level: objectives, risk models, user models,
4th International Conference CIVIL ENGINEERING`13 Proceedings Part II
BUILDING AND RENOVATION
_____________________________________________________________________________________________________________
_______________________________________________________________________________________
33
functional models and performance requirements,
prepared by the Knowledge Institution and
discussed with all parties concerned.
The general structure of rules and regulations as
presented below, in Figure 3, has been depicted in
the form of the grey triangle. This part of the
structure ensures that the system remains consistent,
also when objectives change or new objectives,
rules or constructions are introduced. The parts
relevant to applicants and assessors are represented
in blue.
Figure 3. Presentation of the firm structure of development of building regulations (Scholten, et al. 2010)
Explanation of captions used in Figure 3
Objectives. Regulation must be the outcome of a
single coherent system of objectives. These
objectives are the foundation of the regulatory
system and should be well defined and written
down.
Risk models. Absolute guaranties for safety, health
and sustainability cannot be given. Objectives
always deal with possibilities and risks. They deal
with the possibility of collapse, the risk of
permanent physical injury or death, and the
possibility of environmental damage. The present
regulation often provides strictly limited values for
these possibilities and risks. Does it mean that
exceeding these limit values immediately results in
unsafe and unhealthy situations or limited
sustainability? Depending on varying circumstances
or the use expected, a building may still, in an
acceptable way, meet the objectives laid down.
That is why we will again have to standardize the
whole system of regulations, standards and limit
values according to the objectives using risk models
and the theory of probability. These models must
become an integral part of the regulatory system.
This too would greatly simplify regulation.
User models. We can only translate objectives into
specifications for buildings if we also know how
these are going to be used and who their end users
will be. Models are necessary because of the
variation of use in practice. That is why there is a
need for realistic rules and regulation based on user
models. By projecting these user models on the
model of a building, in terms of floors, working
spaces and partitioning elements, we then can list
functional and performance requirements.
Functional and performance requirements.
Functional requirements describe the requirements
of a building in a functional sense.
The performance requirements for a building and its
parts depend on their function and use.
Modifiability. Naturally, the rule and regulation
system reacts to ever changing opinions in the
society. In the past decade, for instance, terrorism,
4th International Conference CIVIL ENGINEERING`13 Proceedings Part II
BUILDING AND RENOVATION
_____________________________________________________________________________________________________________
_______________________________________________________________________________________
34
climate change and sustainability moved to top
positions in agenda. Undoubtedly, new
requirements and objectives will be added in the
coming decades which cannot be foreseen for the
moment. We should be able to change the rules and
regulations as easily as possible, with minimum
economic effects for users and real estate managers,
while retaining previously acquired rights.
Knowledge. Many rules are clear-cut. But it is not
always clear why certain rules exist or why others
do not, or why specific terms are used. Often, the
persons involved have stored this background
knowledge in their minds, but it is not at all or
hardly available to third parties. That is why this
knowledge has to be publicly recorded and
everybody will be able to properly interpret and
apply this.
The government wishes to withdraw from markets
that might just as well be left to trade and industry,
as underlined in the report of the Dekker Committee
’Private whenever possible, public whenever
required’.
Differing from most of the other industrial sectors, the
knowledge process in the building sector is highly
dispersed, as has been shown earlier and depicted in
Figure 2. Most of the parties only take responsibility
for their own part in the process; nobody feels any
overall responsibility. The chain of responsibilities is
poorly organized in the building sector and the
process is highly fragmented. This might be different
in other countries, but it is the case in the Netherlands.
We are highly dependent on the smooth cooperation
of all parties. This has its advantages but also many
disadvantages.
The system of regulations and standards forms an
essential link in the knowledge process, so we should
continue to invest in it for future development and
maintenance. However, that does not happen
sufficiently. In Figure 4 we have indicated several
points of necessary improvements in the knowledge
cycle.
The present public system of assessment against the
building regulations is aimed at the granting of an
“Environmental” permit in case of a construction or
renovation project. But the authority will never be
responsible and will never guarantee that the building
fulfills the regulation. The authority does not have the
duty or the capacity to check the whole building
process. Many people have the false hope that the
authorities will guarantee that the performances of the
building will be in line with the regulations and the
market wishes. Reality is that most of the buildings do
not fulfill the regulations, a lot of mistakes are made
and that contractors do not feel the responsibility and
liability. They say „we have a permit and it is
accepted by the authorities”.
The owner of real estate is responsible that the
building will be in line with the regulation. The
authorities should issue penalties in case of non
compliance. But the authorities do not have the
manpower and the knowledge to do so. In reality we
do not know whether buildings comply or not. The
owner does not know what the performance of his
real estate is, nor the requirements. When transferring
to a new owner or tenant no one knows what quality
is sold or rented.
To break through this false chain we propose the
following:
1) Technical assessment of the construction project
will no longer be necessary beforehand, but just
before occupation of a building it should be
clearly stated and documented by a recognized,
independent body, that it meets the regulation; if
not, the use of the building will be forbidden; in
the environmental permit this clause will be
standard implemented. How much
documentation is necessary depends on the level
of regulation that is applicable (simplified
solutions, performance based clauses or
probabilistic methods).
2) The regulation for the existing buildings will be
based on the Civil Law so that liabilities are
clear and people can submit objections and
complaints at the Civil Court Chamber; experts
of the Knowledge Institution can advise the
Court on the technical content.
3) When transferring real estate (sale or rental;
conveyance) a guaranteed documentation of
actual performance will be handed over for
which the seller or landlord is liable;
4) All parties involved, also the normal man in the
street, can complain at a new Body in case of
unsafe or unhealthy building in the
neighborhood.
By changing the system in this way and by
changing the content of the building regulations and
the process to develop and maintain the regulations
as mentioned before, self regulation of the marked
will become possible and a knowledge push will
take place. All parties concerned will probably take
insurance so they can bear their responsibilities and
liability. Not the law dictates the duty to insure, but
the market system will realize that by itself. That
also will strengthen the quality chain. This
innovated system will give an upward impulse to
realize real performances to the level that the
market expects. This system will only function
when the knowledge chain is closed.
The implementation will create new functions.
Acknowledgement should be organized for
independent technical-legal arbitration, so that for
parties that have a conflict on technical points, the
dispute can quickly be settled on technical-legal
arguments. The formal road of objection and appeal
according to the General Administrative Law is much
too cumbersome for this and can be evaded.
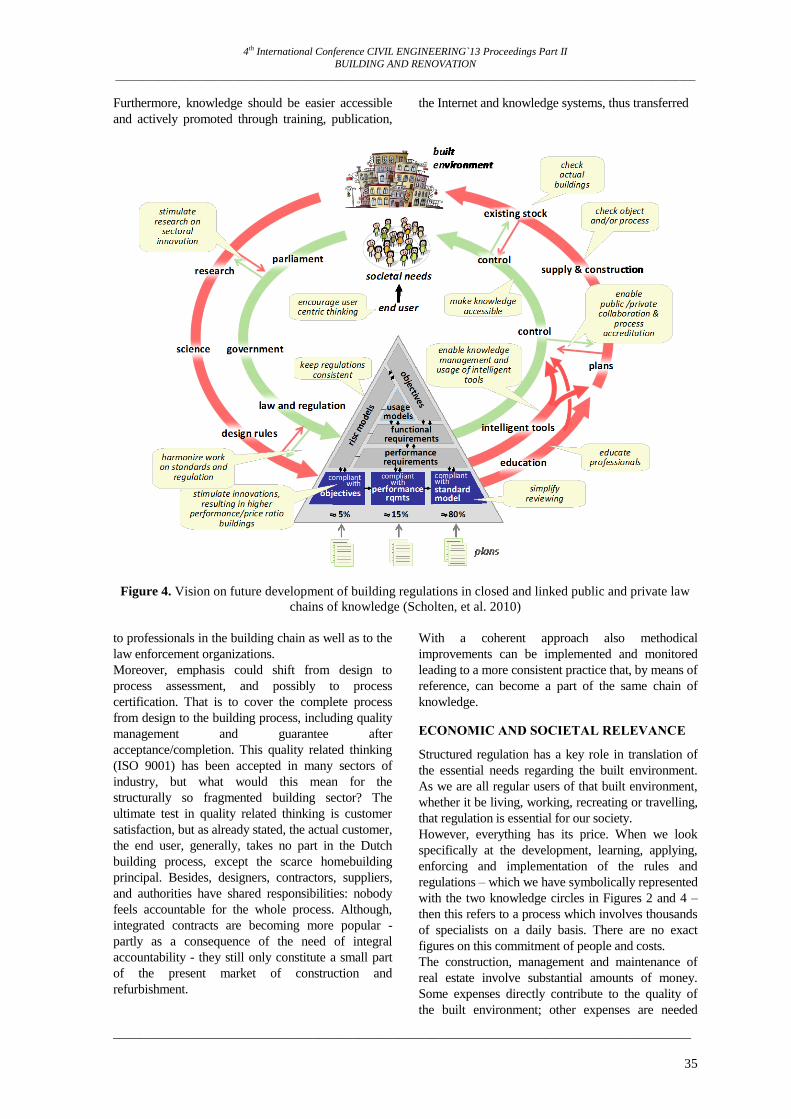
4th International Conference CIVIL ENGINEERING`13 Proceedings Part II
BUILDING AND RENOVATION
_____________________________________________________________________________________________________________
_______________________________________________________________________________________
35
Furthermore, knowledge should be easier accessible
and actively promoted through training, publication,
the Internet and knowledge systems, thus transferred
Figure 4. Vision on future development of building regulations in closed and linked public and private law
chains of knowledge (Scholten, et al. 2010)
to professionals in the building chain as well as to the
law enforcement organizations.
Moreover, emphasis could shift from design to
process assessment, and possibly to process
certification. That is to cover the complete process
from design to the building process, including quality
management and guarantee after
acceptance/completion. This quality related thinking
(ISO 9001) has been accepted in many sectors of
industry, but what would this mean for the
structurally so fragmented building sector? The
ultimate test in quality related thinking is customer
satisfaction, but as already stated, the actual customer,
the end user, generally, takes no part in the Dutch
building process, except the scarce homebuilding
principal. Besides, designers, contractors, suppliers,
and authorities have shared responsibilities: nobody
feels accountable for the whole process. Although,
integrated contracts are becoming more popular -
partly as a consequence of the need of integral
accountability - they still only constitute a small part
of the present market of construction and
refurbishment.
With a coherent approach also methodical
improvements can be implemented and monitored
leading to a more consistent practice that, by means of
reference, can become a part of the same chain of
knowledge.
ECONOMIC AND SOCIETAL RELEVANCE
Structured regulation has a key role in translation of
the essential needs regarding the built environment.
As we are all regular users of that built environment,
whether it be living, working, recreating or travelling,
that regulation is essential for our society.
However, everything has its price. When we look
specifically at the development, learning, applying,
enforcing and implementation of the rules and
regulations – which we have symbolically represented
with the two knowledge circles in Figures 2 and 4 –
then this refers to a process which involves thousands
of specialists on a daily basis. There are no exact
figures on this commitment of people and costs.
The construction, management and maintenance of
real estate involve substantial amounts of money.
Some expenses directly contribute to the quality of
the built environment; other expenses are needed
4th International Conference CIVIL ENGINEERING`13 Proceedings Part II
BUILDING AND RENOVATION
_____________________________________________________________________________________________________________
_______________________________________________________________________________________
36
solely to apply regulations, so at the best they
contribute indirectly to the safety, health and
sustainability of buildings. The latter expenses ERB
estimates for a big part unnecessary.
Moreover, costs arise when a design or existing work
does not meet the regulation, because the applicant
simply knows them insufficiently and the regulation
is not enforced. At present, enforcement takes place
mainly by means of random checks based building
plans on paper. Enforcement should take place much
more on the basis of buildings actually constructed,
specifically with a view to the real risks for which this
regulation has been written.
In the ERB study report it is demonstrated in a
conservative estimation that by implementing the
proposals every year more than € 1 billion can be
saved on a turnover of € 20 billion. Other benefits will
be:
5) Better and more understandable building
regulations;
6) A very simplified process to get the
environmental permit;
7) Better environmental performance ;
8) Less disputes;
9) More satisfied people in relation to the quality of
buildings.
THE STEPS TO TAKE
The ERB report 'After Dekker' describes actions to be
taken to innovate the building regulations and the
building assessment system. First of all the parties
concerned have to sign a covenant that outlines their
intentions, their duties and their rights. The
government has to provide the starting capital to
finance the creation of the independent Knowledge
Institution and the first steps of the renewal of the
system of building regulations (stating the objectives).
Also the government has to decide the necessary
changes in the laws and the moment that the
environmental permit system will no longer need the
technical assessment of a building plan, but instead
the owner and contractor will have to declare the
performance at the occupation moment.
When those decisions will be taken, all other
improvements will follow as the logical outcome of
the new structure. All parties involved can finance
yearly the Institution from their savings every year,
estimated at least the € 1 billion predicted efficiency
improvement.
At the moment the Parliament is in discussion with
the Ministry about the future of the building
regulations and the innovation that is needed. The
reports of Actal, EIB and ERB are therefore the
starting point. The need is higher because of the
political discussion about the limited quality of the
Building Decree 2012.
ACTAL AND EIB-STUDIES
The Actal study is complete in line with the ideas of
the ERB-study. The differences are that the ERB-
study is comprehensive, both in regulation steps as
well as in process steps, with an activity plan, time
schedule and cost reduction estimation. The Actal
study only gives suggestions without further
motivations and conclusions.
The predominantly monetary EIB study calculates
costs and benefits of rules and regulations. They focus
on rules and regulations that they define as
unnecessary, because they are not cost effective. The
study sees balconies and sheds as unnecessary: houses
are cheaper without. The same applies to high
standards for energy saving. The calculation of the
savings of money is too high: it is not related to the
effects in reality (e.g, 10% less balconies, because the
majority of houses still get them) but takes the costs
of all balconies because they are not longer an
obligation. For other aspects they argue that the rules
are not effective and thus unnecessary (the
measurements of staircases). We think this is an
argument for better regulation, not doing without. In
total the study counts to 0,5 billion cheaper
construction without these rules, which is only
theoretical and highly overstated.
INTERNATIONAL EXPERIENCES
In a lot of countries discussions are ongoing about the
system of building regulations, deregulation, and the
position of the parties in the building process, and to
attain building of adequate quality faced by the end
users.
In Sweden the system of only private certification to
the building regulation is deserted. Sweden had bad
experiences regarding the quality that was built. And
as a result of that the Swedish Parliament changed the
Planning and Building Act in May 2011 (Stig, 2012).
The major changes are about the construction process
with reinforced inspection and construction
supervision.
The new construction process involves the
introduction of both - new elements and rules that are
extended and clarified. New stages of the process are
the start permit, site visits and final consultation and
the use permit for the building to be used. The content
in the technical consultation and the inspection plan
requirements are clarified.
Building regulatory systems in Iceland are enacted to
protect the interest of the general public and are run
by the government – central, provincial, state or
municipal, depending on the structure of a country
government and the authority of particular levels of
the government. In Iceland, there are only two levels
of government; central and municipal. The central
government makes policy decisions and is in charge
of developing the legislation and building regulations
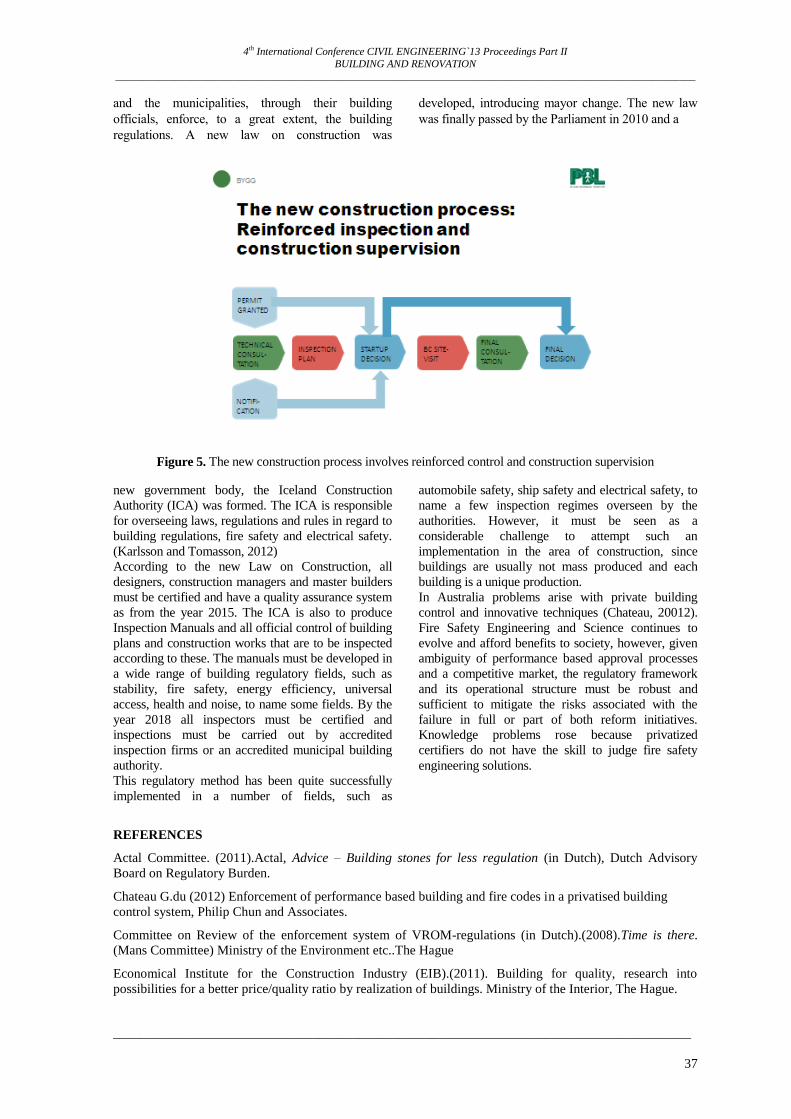
4th International Conference CIVIL ENGINEERING`13 Proceedings Part II
BUILDING AND RENOVATION
_____________________________________________________________________________________________________________
_______________________________________________________________________________________
37
and the municipalities, through their building
officials, enforce, to a great extent, the building
regulations. A new law on construction was
developed, introducing mayor change. The new law
was finally passed by the Parliament in 2010 and a
Figure 5. The new construction process involves reinforced control and construction supervision
new government body, the Iceland Construction
Authority (ICA) was formed. The ICA is responsible
for overseeing laws, regulations and rules in regard to
building regulations, fire safety and electrical safety.
(Karlsson and Tomasson, 2012)
According to the new Law on Construction, all
designers, construction managers and master builders
must be certified and have a quality assurance system
as from the year 2015. The ICA is also to produce
Inspection Manuals and all official control of building
plans and construction works that are to be inspected
according to these. The manuals must be developed in
a wide range of building regulatory fields, such as
stability, fire safety, energy efficiency, universal
access, health and noise, to name some fields. By the
year 2018 all inspectors must be certified and
inspections must be carried out by accredited
inspection firms or an accredited municipal building
authority.
This regulatory method has been quite successfully
implemented in a number of fields, such as
automobile safety, ship safety and electrical safety, to
name a few inspection regimes overseen by the
authorities. However, it must be seen as a
considerable challenge to attempt such an
implementation in the area of construction, since
buildings are usually not mass produced and each
building is a unique production.
In Australia problems arise with private building
control and innovative techniques (Chateau, 20012).
Fire Safety Engineering and Science continues to
evolve and afford benefits to society, however, given
ambiguity of performance based approval processes
and a competitive market, the regulatory framework
and its operational structure must be robust and
sufficient to mitigate the risks associated with the
failure in full or part of both reform initiatives.
Knowledge problems rose because privatized
certifiers do not have the skill to judge fire safety
engineering solutions.
REFERENCES
Actal Committee. (2011).Actal, Advice – Building stones for less regulation (in Dutch), Dutch Advisory
Board on Regulatory Burden.
Chateau G.du (2012) Enforcement of performance based building and fire codes in a privatised building
control system, Philip Chun and Associates.
Committee on Review of the enforcement system of VROM-regulations (in Dutch).(2008).Time is there.
(Mans Committee) Ministry of the Environment etc..The Hague
Economical Institute for the Construction Industry (EIB).(2011). Building for quality, research into
possibilities for a better price/quality ratio by realization of buildings. Ministry of the Interior, The Hague.

4th International Conference CIVIL ENGINEERING`13 Proceedings Part II
BUILDING AND RENOVATION
_____________________________________________________________________________________________________________
_______________________________________________________________________________________
38
Karlsson B., Tómasson B. (2012) Developing a Performance Based Building Regulation and Paving the way
toward Electronic Submission of Building Permits and Automated Code Compliance Checks, Iceland
Construction Authority.
Scholten, P.P.M, De Wildt R., Vrouwenvelder A.C.W.M.(2011) After Dekker – Innovation of the Building
regulations (in Dutch). ERB-RIGO-TNO, Delft.
Scholten N.P.M., Gielingh W.F., Vrouwenvelder A.C.W.M., et.al.(2010). Trust and reliability, Part II, A plan
for the innovation of the system of building regulations (in Dutch). ERB, Delft.
Scholten N.P.M., Wijnands R.J., Groosman M., et al.(2008). Trust and reliability, Part I, A vision on the
functionality of building regulations (in Dutch). ERB, Delft.
Stig Å. (2012) The Swedish experiences of building control – The new Planning and Building Act, National
Board of Housing Building and Planning Boverket.
4th International Conference CIVIL ENGINEERING`13 Proceedings Part II
BUILDING AND RENOVATION
_____________________________________________________________________________________________________________
_______________________________________________________________________________________
39
PROBABILISM, THE WAY OUT FOR PERFORMANCE BASED BUILDING
REGULATIONS
Dr.Nico P.M.Scholten, PhD
Foundation Expert Centre Regulations in Building (ERB)
E-mail: [email protected]
ABSTRACT
Performance based regulations emerge increasingly. The actual situation in the Netherlands is described.
We observe from our consultancy experience permanent obstruction of innovation and prescription of well
known solutions because of a lack of understanding by local authorities. Bureaucracy and disasters force
opponents and politicians to blame the complicated and scientific nature of modern democratic performance
regulations. Political emphasis on reduction of the body of (technical) regulations however is
counterproductive. Expert opinion is that a decrease of regulatory-burden is possible by improving
regulatory methodology. Meanwhile, probabilistic thinking is developing. We cannot live nor build without
the risk of failure. The acceptance level of risk should be a political decision. Knowledge and understanding
of building regulations should increase and be fostered by improving education. Eurocodes show quite some
advance; “tight rope” calculations can be made. Application of probabilistic methods in other areas than
structural design is still in its infancy or research stage. New regulations of emissions to ground, air and
water have to be developed by reason of a sustainable world, but may not hinder re-use of building products.
The content of a building product is not important, but the risk that dangerous emissions will damage the
environment. By applying performance based principles, using probabilistic methods adequately, we could
really advance. Management by incident by issuing new regulations based on one accident is unholy. When
disaster strikes, politicians and the regulators usually create a new host of rules to prevent recurrence.
Acceptance of effects based probabilistic judgement should be the issue. Poor regulations, conflicts in
practice, huge administrative burden and quite some destruction of capital are observed in building practise.
Based on our experience we see blockades for the application of innovative technical and organisational
solutions, and the use of unsatisfactory solutions that only can be put to level only at great cost. Owner/user
orientation ensures acceptance and proper application. Research and education should aim at tools to
manage probabilistics in the building industry and assessment procedures.
Keywords: probabilism, performance, regulations
DUTCH SITUATION
The building industry, which provides 9-12 % of
the GNP of the Netherlands, does not have any self-
guiding capacity. The market is split into a large
number of sub-markets, each with its own role and
dependent of the other. The building sector has no
driving force capable of providing private guidance
to ensure that the public is served with a built
environment that is safe, healthy, useful, energy
efficient and durable. The customer has almost no
voice in this: the building owner or user has no
choice and few possibilities to influence the quality
of the product he is provided with. Mainly because
there is a scarcity of buildings, particularly houses,
lack of money and only limited possibilities to lend
money because of the crises so that the customer is
forced to accept what is offered. Architects and
builders are unable to match their offer to the
demand and certainly not to future demand. In such
a situation building regulations play a vital role.
Ensuring that publicly required, Figure 1 shows
schematically the interfaces that building
regulations have in the process of safeguarding the
public interest. The inner circle describes the public
world. The outer circle - the private market from the
research in building owners. Building regulations is
a part of this world. The satisfaction of the built
environment and the public interest should be the
driving factors of the whole system. It should be
born in mind that in Holland the owner is
responsible for fulfilling the regulations. After 1995
fundamental research1 on building regulations
stopped2. Technical building regulations have not
been part of university and vocational training
curricula for more than 20 years. In October 1992
new building legislation in the Netherlands was
introduced in the form of the revised Housing Act
(Woningwet), the Building Decree (Bouwbesluit)
and related technical documents.
1 Research about scientific content en way of expression of
regulations, standards e.g. 2 In the PhD-study “De juridische en technische grondslagen van
de bouwregelgeving – Woningwet en Bouwbesluit”, May 2001, TUD, N.P.M. Scholten, Msc a complete overview of
all studies is given.

4th International Conference CIVIL ENGINEERING`13 Proceedings Part II
BUILDING AND RENOVATION
_____________________________________________________________________________________________________________
_______________________________________________________________________________________
40
Figure 1. Building regulations and the public interest
Figure 2 shows the relation between the documents
under the new legislation. Next to complying with
these technical requirements local authority by-laws
must also be satisfied. However, these are not
technical. From November 2008 the requirements
on fire safe use of buildings have been transferred
to national level in the new legislation in the Decree
on fire safe use of structures (Gebruiksbesluit).
Figure 2. Relations between the documents
In April 2012 a following huge deregulation
operation was implemented, the Building Decree
2012. A mixture of the Building Decree 2003, the
Decree on fire safe use of buildings, the Decree of
building tunnels, all requirements of building
bylaws and implementation of European directives.
But deregulation caused 25% of the requirements to
be skipped instead of diminishing administrative
burden as wished by the public. For renovation the
level of requirements was lowered drastically,
mostly to the level that by not fulfilling a non-
compliance penalty follows immediately.
The Building Decree, the general body of
administrative regulations based on the Housing Act,
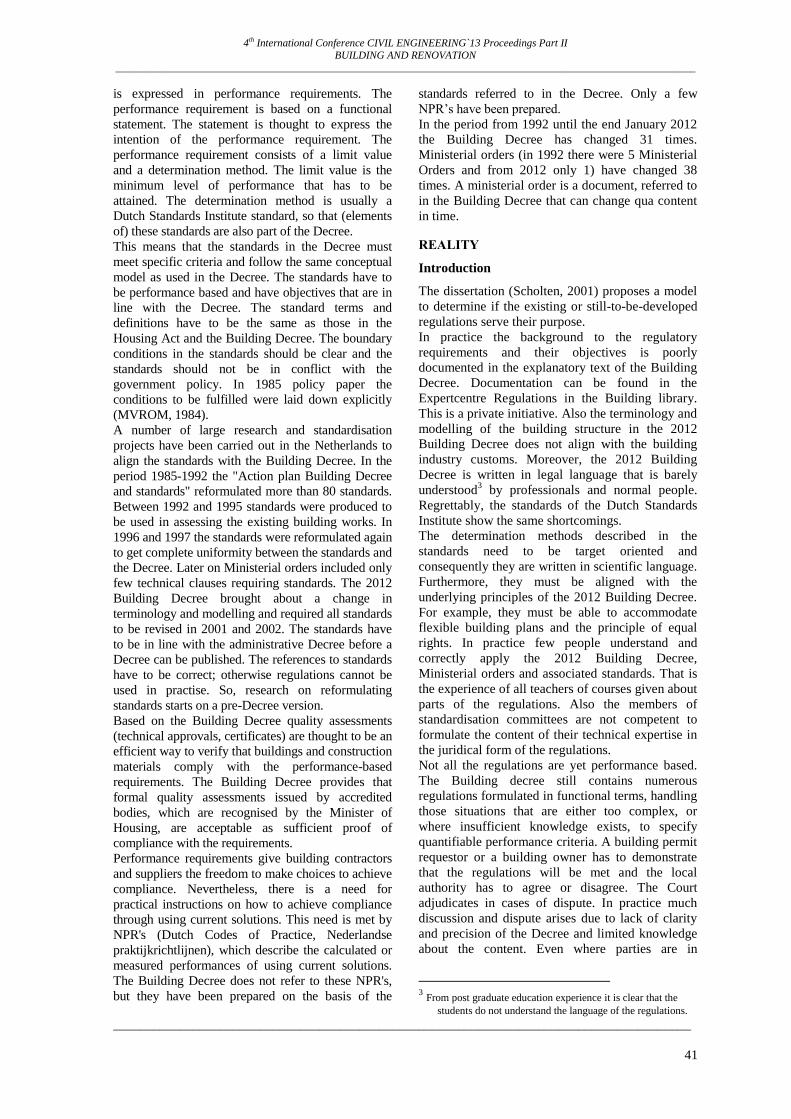
4th International Conference CIVIL ENGINEERING`13 Proceedings Part II
BUILDING AND RENOVATION
_____________________________________________________________________________________________________________
_______________________________________________________________________________________
41
is expressed in performance requirements. The
performance requirement is based on a functional
statement. The statement is thought to express the
intention of the performance requirement. The
performance requirement consists of a limit value
and a determination method. The limit value is the
minimum level of performance that has to be
attained. The determination method is usually a
Dutch Standards Institute standard, so that (elements
of) these standards are also part of the Decree.
This means that the standards in the Decree must
meet specific criteria and follow the same conceptual
model as used in the Decree. The standards have to
be performance based and have objectives that are in
line with the Decree. The standard terms and
definitions have to be the same as those in the
Housing Act and the Building Decree. The boundary
conditions in the standards should be clear and the
standards should not be in conflict with the
government policy. In 1985 policy paper the
conditions to be fulfilled were laid down explicitly
(MVROM, 1984).
A number of large research and standardisation
projects have been carried out in the Netherlands to
align the standards with the Building Decree. In the
period 1985-1992 the "Action plan Building Decree
and standards" reformulated more than 80 standards.
Between 1992 and 1995 standards were produced to
be used in assessing the existing building works. In
1996 and 1997 the standards were reformulated again
to get complete uniformity between the standards and
the Decree. Later on Ministerial orders included only
few technical clauses requiring standards. The 2012
Building Decree brought about a change in
terminology and modelling and required all standards
to be revised in 2001 and 2002. The standards have
to be in line with the administrative Decree before a
Decree can be published. The references to standards
have to be correct; otherwise regulations cannot be
used in practise. So, research on reformulating
standards starts on a pre-Decree version.
Based on the Building Decree quality assessments
(technical approvals, certificates) are thought to be an
efficient way to verify that buildings and construction
materials comply with the performance-based
requirements. The Building Decree provides that
formal quality assessments issued by accredited
bodies, which are recognised by the Minister of
Housing, are acceptable as sufficient proof of
compliance with the requirements.
Performance requirements give building contractors
and suppliers the freedom to make choices to achieve
compliance. Nevertheless, there is a need for
practical instructions on how to achieve compliance
through using current solutions. This need is met by
NPR's (Dutch Codes of Practice, Nederlandse
praktijkrichtlijnen), which describe the calculated or
measured performances of using current solutions.
The Building Decree does not refer to these NPR's,
but they have been prepared on the basis of the
standards referred to in the Decree. Only a few
NPR’s have been prepared.
In the period from 1992 until the end January 2012
the Building Decree has changed 31 times.
Ministerial orders (in 1992 there were 5 Ministerial
Orders and from 2012 only 1) have changed 38
times. A ministerial order is a document, referred to
in the Building Decree that can change qua content
in time.
REALITY
Introduction
The dissertation (Scholten, 2001) proposes a model
to determine if the existing or still-to-be-developed
regulations serve their purpose.
In practice the background to the regulatory
requirements and their objectives is poorly
documented in the explanatory text of the Building
Decree. Documentation can be found in the
Expertcentre Regulations in the Building library.
This is a private initiative. Also the terminology and
modelling of the building structure in the 2012
Building Decree does not align with the building
industry customs. Moreover, the 2012 Building
Decree is written in legal language that is barely
understood3 by professionals and normal people.
Regrettably, the standards of the Dutch Standards
Institute show the same shortcomings.
The determination methods described in the
standards need to be target oriented and
consequently they are written in scientific language.
Furthermore, they must be aligned with the
underlying principles of the 2012 Building Decree.
For example, they must be able to accommodate
flexible building plans and the principle of equal
rights. In practice few people understand and
correctly apply the 2012 Building Decree,
Ministerial orders and associated standards. That is
the experience of all teachers of courses given about
parts of the regulations. Also the members of
standardisation committees are not competent to
formulate the content of their technical expertise in
the juridical form of the regulations.
Not all the regulations are yet performance based.
The Building decree still contains numerous
regulations formulated in functional terms, handling
those situations that are either too complex, or
where insufficient knowledge exists, to specify
quantifiable performance criteria. A building permit
requestor or a building owner has to demonstrate
that the regulations will be met and the local
authority has to agree or disagree. The Court
adjudicates in cases of dispute. In practice much
discussion and dispute arises due to lack of clarity
and precision of the Decree and limited knowledge
about the content. Even where parties are in
3 From post graduate education experience it is clear that the
students do not understand the language of the regulations.
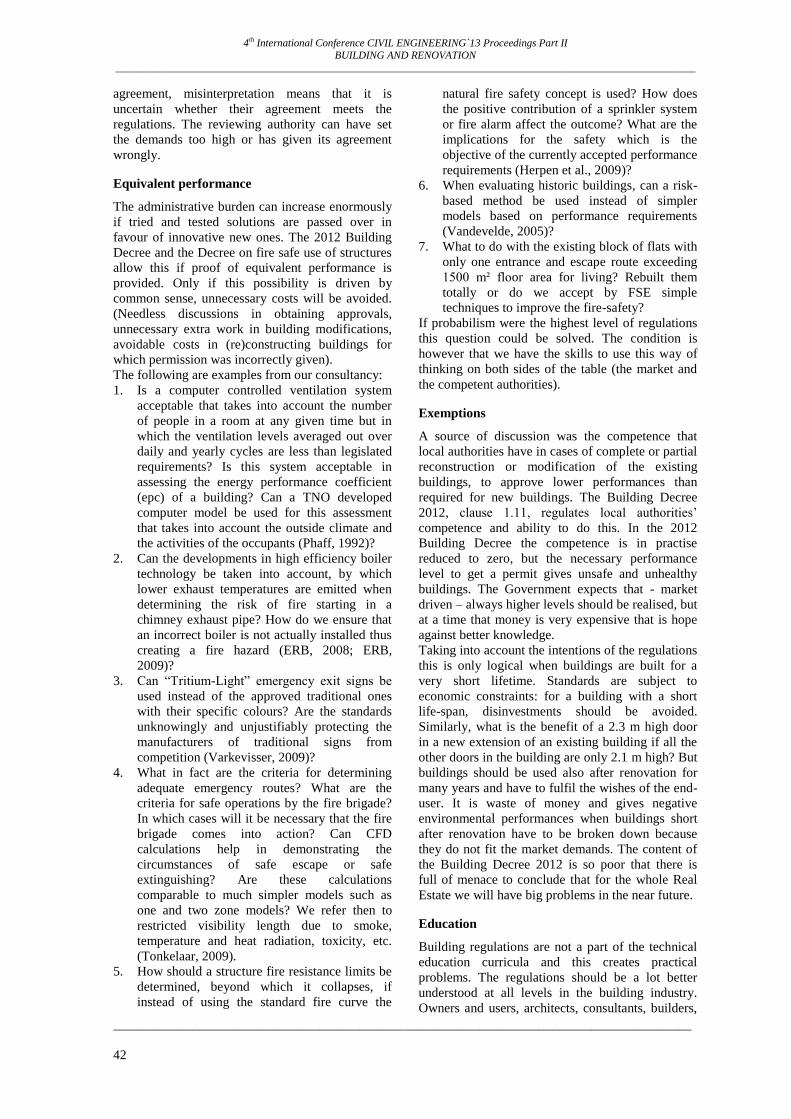
4th International Conference CIVIL ENGINEERING`13 Proceedings Part II
BUILDING AND RENOVATION
_____________________________________________________________________________________________________________
_______________________________________________________________________________________
42
agreement, misinterpretation means that it is
uncertain whether their agreement meets the
regulations. The reviewing authority can have set
the demands too high or has given its agreement
wrongly.
Equivalent performance
The administrative burden can increase enormously
if tried and tested solutions are passed over in
favour of innovative new ones. The 2012 Building
Decree and the Decree on fire safe use of structures
allow this if proof of equivalent performance is
provided. Only if this possibility is driven by
common sense, unnecessary costs will be avoided.
(Needless discussions in obtaining approvals,
unnecessary extra work in building modifications,
avoidable costs in (re)constructing buildings for
which permission was incorrectly given).
The following are examples from our consultancy:
1. Is a computer controlled ventilation system
acceptable that takes into account the number
of people in a room at any given time but in
which the ventilation levels averaged out over
daily and yearly cycles are less than legislated
requirements? Is this system acceptable in
assessing the energy performance coefficient
(epc) of a building? Can a TNO developed
computer model be used for this assessment
that takes into account the outside climate and
the activities of the occupants (Phaff, 1992)?
2. Can the developments in high efficiency boiler
technology be taken into account, by which
lower exhaust temperatures are emitted when
determining the risk of fire starting in a
chimney exhaust pipe? How do we ensure that
an incorrect boiler is not actually installed thus
creating a fire hazard (ERB, 2008; ERB,
2009)?
3. Can “Tritium-Light” emergency exit signs be
used instead of the approved traditional ones
with their specific colours? Are the standards
unknowingly and unjustifiably protecting the
manufacturers of traditional signs from
competition (Varkevisser, 2009)?
4. What in fact are the criteria for determining
adequate emergency routes? What are the
criteria for safe operations by the fire brigade?
In which cases will it be necessary that the fire
brigade comes into action? Can CFD
calculations help in demonstrating the
circumstances of safe escape or safe
extinguishing? Are these calculations
comparable to much simpler models such as
one and two zone models? We refer then to
restricted visibility length due to smoke,
temperature and heat radiation, toxicity, etc.
(Tonkelaar, 2009).
5. How should a structure fire resistance limits be
determined, beyond which it collapses, if
instead of using the standard fire curve the
natural fire safety concept is used? How does
the positive contribution of a sprinkler system
or fire alarm affect the outcome? What are the
implications for the safety which is the
objective of the currently accepted performance
requirements (Herpen et al., 2009)?
6. When evaluating historic buildings, can a risk-
based method be used instead of simpler
models based on performance requirements
(Vandevelde, 2005)?
7. What to do with the existing block of flats with
only one entrance and escape route exceeding
1500 m² floor area for living? Rebuilt them
totally or do we accept by FSE simple
techniques to improve the fire-safety?
If probabilism were the highest level of regulations
this question could be solved. The condition is
however that we have the skills to use this way of
thinking on both sides of the table (the market and
the competent authorities).
Exemptions
A source of discussion was the competence that
local authorities have in cases of complete or partial
reconstruction or modification of the existing
buildings, to approve lower performances than
required for new buildings. The Building Decree
2012, clause 1.11, regulates local authorities’
competence and ability to do this. In the 2012
Building Decree the competence is in practise
reduced to zero, but the necessary performance
level to get a permit gives unsafe and unhealthy
buildings. The Government expects that - market
driven – always higher levels should be realised, but
at a time that money is very expensive that is hope
against better knowledge.
Taking into account the intentions of the regulations
this is only logical when buildings are built for a
very short lifetime. Standards are subject to
economic constraints: for a building with a short
life-span, disinvestments should be avoided.
Similarly, what is the benefit of a 2.3 m high door
in a new extension of an existing building if all the
other doors in the building are only 2.1 m high? But
buildings should be used also after renovation for
many years and have to fulfil the wishes of the end-
user. It is waste of money and gives negative
environmental performances when buildings short
after renovation have to be broken down because
they do not fit the market demands. The content of
the Building Decree 2012 is so poor that there is
full of menace to conclude that for the whole Real
Estate we will have big problems in the near future.
Education
Building regulations are not a part of the technical
education curricula and this creates practical
problems. The regulations should be a lot better
understood at all levels in the building industry.
Owners and users, architects, consultants, builders,

4th International Conference CIVIL ENGINEERING`13 Proceedings Part II
BUILDING AND RENOVATION
_____________________________________________________________________________________________________________
_______________________________________________________________________________________
43
fitters, suppliers, authorising bodies and assessors
are struggling to apply the regulations correctly
what is the overall experience of the leading experts
in the field of building regulations leading to
unnecessary discussions, unnecessary revised
superfluous plans and unnecessary rejections, the
cost of which is all born by the end-user.
Certifying bodies and those involved in standards
meet the same problems.
The limited extra-curricular and post-doc education
on the subject adversely affects also further
development in the regulations.
Normally all goes well in straightforward cases. But
in more complicated cases, when equivalent
performance plays a role or a complex
determination method is involved, or worse, when
the regulations are not quantified, then everybody
gets off track.
The most distressing example is the revision of the
regulations in the 29th November 2009 Official
Journal on safety requirements for renovations of
structures that are not buildings (bridges, tunnels,
etc.) (Vrouwenvelder, 2009). The safety
requirements that applied to the existing buildings
were considered acceptable to apply after
renovation. There was no appreciation of the risks
that were thereby considered acceptable. Following
the advice of the Expertcentre Regulations in
Building an urgent revision to the regulations was
made and published (MJUS, 2010). But by the 2012
Building Decree the donkey had bumped for the
second time, but now for all renovations and for all
subjects.
Court cases
The situation does not improve when the legal
system is used to decide disputes. The General
Administrative Law Act (MJUS, 1992) seldom
leads to a judgement satisfactory based on purely
technical considerations. The judge reviews the
procedures that have been followed. Has the local
authority decision been arrived at reasonably? In
few cases does technical expertise enter the
discussion to allow a more substantial consideration
of the issues. Frequently understanding of the
background to the regulations is needed to judge if
unacceptable risks are involved.
The following are examples:
1. Should the fire brigade in a three story
artificially ventilated parking garage with a
sprinkler installation at any time be able to
search the garage and rescue victims close to
the fire? An extra investment of € 70.000 for a
sectional fire alarm system depends on the
answer to this question. If the chance of
victims and of a successful search by the fire
brigade is sufficiently small then the extra
investment may be considered
disproportionate. Probabilistic is a tool that
can help decide in such cases (Verdict Arnhem
Court, 2009).
2. What should be done in the case of an empty
industrial building of 12.000 m² that four squat
watchers occupy from 9.00 to 17.00 (an artist
using 40 m², an office of 40 m² with a
computer table and chair, storage of 50 m² for
100 chairs and a furniture maker with 50 m²)?
Should the four squat watchers be forced to
vacate the building within 24 hours because
there is a danger of fire spreading to an office
building 5 m distant? In this case a risk-based
approach can help find an answer. The
administrator should also set this off against
the risk of squatters occupying the building
and of fire then breaking out (Verdict The
Hague Court, 2010).
3. What is the chance of the first floor of 66 m²
collapsing in a restaurant that can
accommodate 75 people in a former hayloft?
The floor can withstand 3,5 kN/m² while the
building regulations require 5 kN/m² - but this
is based on a worst-case scenario of a group of
dancers in a discotheque. Here also a risk-
analysis can end the discussion (Verdict
Zwolle-Lelystad Court, 2009).
4. Should a care hotel located close to a gas
pipeline be equipped with a 60-minute fire
resistant shield if the probability of a fire
occurring with a radiation impact of 22 kW/m²
on the end wall is 1.10-6
per year? What is an
acceptable level of probability at which we
stop investment in further safety measures?
Must we be able to withstand all the dangers
that could possibly face us, whatever the cost?
5. How should various forms of panic exit
devices in a large discotheque be assessed?
6. Should the doors be locked which serve under
certain circumstances as emergency exits and
under other circumstances as security barriers?
For example when a building can be used as
well partly (only one or a few rooms) or as a
whole (Verdict Zutphen Court, 2009).
7. What to do with a smoke exhaust system with
elements from outside Europe, so the system
cannot be certified and the Local Authority
does not have enough knowledge. Should in
that case the premise be closed?
Only when the parties to a dispute (local authorities,
fire brigades and building owners) consider their
differences in terms of risks and probabilities the
number of disputes will drastically reduce. This
ability is present at only a few experts and they are
not working for local authorities where the
decisions are made.
Disasters
Incidents and accidents serve to shape regulations
and determine how buildings are appraised and how
the regulations are enforced. If probabilistics play a
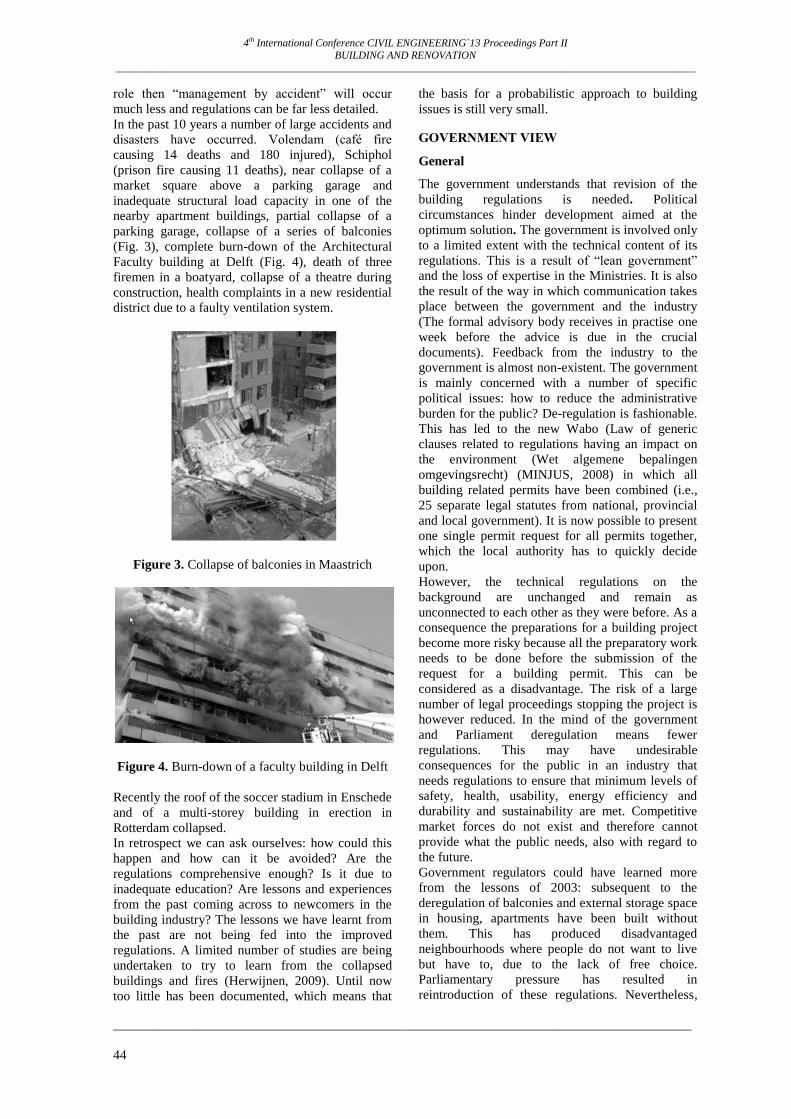
4th International Conference CIVIL ENGINEERING`13 Proceedings Part II
BUILDING AND RENOVATION
_____________________________________________________________________________________________________________
_______________________________________________________________________________________
44
role then “management by accident” will occur
much less and regulations can be far less detailed.
In the past 10 years a number of large accidents and
disasters have occurred. Volendam (café fire
causing 14 deaths and 180 injured), Schiphol
(prison fire causing 11 deaths), near collapse of a
market square above a parking garage and
inadequate structural load capacity in one of the
nearby apartment buildings, partial collapse of a
parking garage, collapse of a series of balconies
(Fig. 3), complete burn-down of the Architectural
Faculty building at Delft (Fig. 4), death of three
firemen in a boatyard, collapse of a theatre during
construction, health complaints in a new residential
district due to a faulty ventilation system.
Figure 3. Collapse of balconies in Maastrich
Figure 4. Burn-down of a faculty building in Delft
Recently the roof of the soccer stadium in Enschede
and of a multi-storey building in erection in
Rotterdam collapsed.
In retrospect we can ask ourselves: how could this
happen and how can it be avoided? Are the
regulations comprehensive enough? Is it due to
inadequate education? Are lessons and experiences
from the past coming across to newcomers in the
building industry? The lessons we have learnt from
the past are not being fed into the improved
regulations. A limited number of studies are being
undertaken to try to learn from the collapsed
buildings and fires (Herwijnen, 2009). Until now
too little has been documented, which means that
the basis for a probabilistic approach to building
issues is still very small.
GOVERNMENT VIEW
General
The government understands that revision of the
building regulations is needed. Political
circumstances hinder development aimed at the
optimum solution. The government is involved only
to a limited extent with the technical content of its
regulations. This is a result of “lean government”
and the loss of expertise in the Ministries. It is also
the result of the way in which communication takes
place between the government and the industry
(The formal advisory body receives in practise one
week before the advice is due in the crucial
documents). Feedback from the industry to the
government is almost non-existent. The government
is mainly concerned with a number of specific
political issues: how to reduce the administrative
burden for the public? De-regulation is fashionable.
This has led to the new Wabo (Law of generic
clauses related to regulations having an impact on
the environment (Wet algemene bepalingen
omgevingsrecht) (MINJUS, 2008) in which all
building related permits have been combined (i.e.,
25 separate legal statutes from national, provincial
and local government). It is now possible to present
one single permit request for all permits together,
which the local authority has to quickly decide
upon.
However, the technical regulations on the
background are unchanged and remain as
unconnected to each other as they were before. As a
consequence the preparations for a building project
become more risky because all the preparatory work
needs to be done before the submission of the
request for a building permit. This can be
considered as a disadvantage. The risk of a large
number of legal proceedings stopping the project is
however reduced. In the mind of the government
and Parliament deregulation means fewer
regulations. This may have undesirable
consequences for the public in an industry that
needs regulations to ensure that minimum levels of
safety, health, usability, energy efficiency and
durability and sustainability are met. Competitive
market forces do not exist and therefore cannot
provide what the public needs, also with regard to
the future.
Government regulators could have learned more
from the lessons of 2003: subsequent to the
deregulation of balconies and external storage space
in housing, apartments have been built without
them. This has produced disadvantaged
neighbourhoods where people do not want to live
but have to, due to the lack of free choice.
Parliamentary pressure has resulted in
reintroduction of these regulations. Nevertheless,
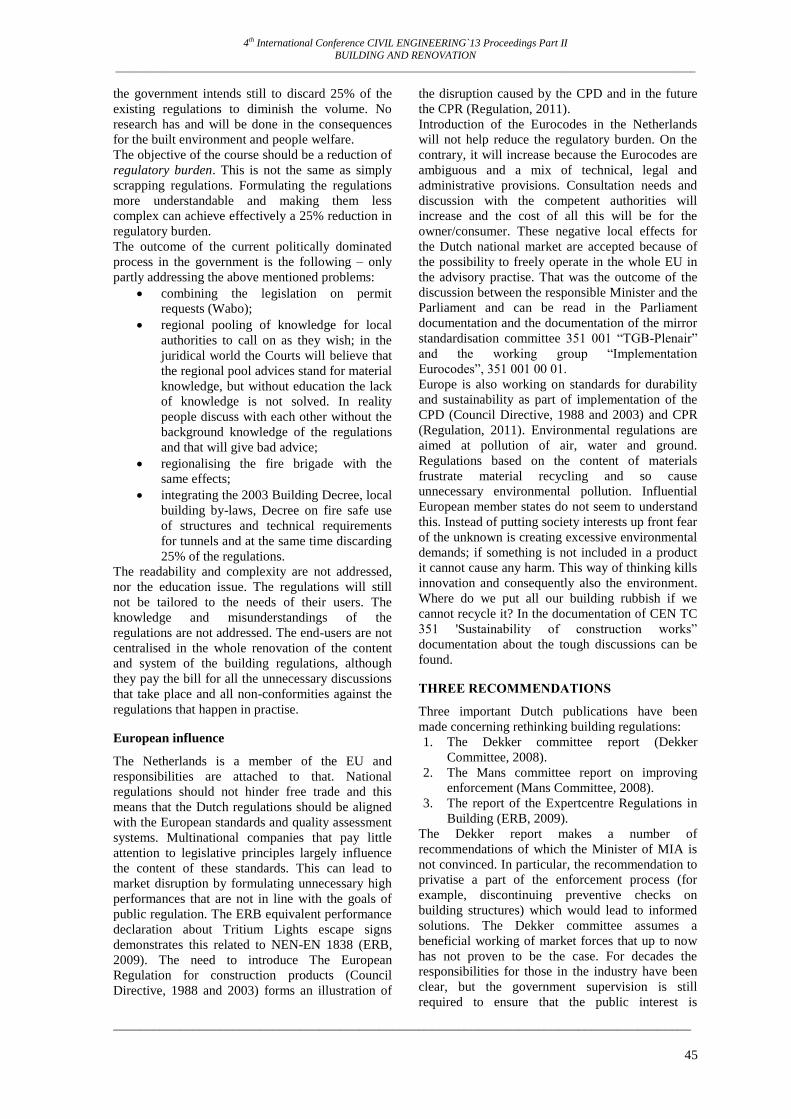
4th International Conference CIVIL ENGINEERING`13 Proceedings Part II
BUILDING AND RENOVATION
_____________________________________________________________________________________________________________
_______________________________________________________________________________________
45
the government intends still to discard 25% of the
existing regulations to diminish the volume. No
research has and will be done in the consequences
for the built environment and people welfare.
The objective of the course should be a reduction of
regulatory burden. This is not the same as simply
scrapping regulations. Formulating the regulations
more understandable and making them less
complex can achieve effectively a 25% reduction in
regulatory burden.
The outcome of the current politically dominated
process in the government is the following – only
partly addressing the above mentioned problems:
combining the legislation on permit
requests (Wabo);
regional pooling of knowledge for local
authorities to call on as they wish; in the
juridical world the Courts will believe that
the regional pool advices stand for material
knowledge, but without education the lack
of knowledge is not solved. In reality
people discuss with each other without the
background knowledge of the regulations
and that will give bad advice;
regionalising the fire brigade with the
same effects;
integrating the 2003 Building Decree, local
building by-laws, Decree on fire safe use
of structures and technical requirements
for tunnels and at the same time discarding
25% of the regulations.
The readability and complexity are not addressed,
nor the education issue. The regulations will still
not be tailored to the needs of their users. The
knowledge and misunderstandings of the
regulations are not addressed. The end-users are not
centralised in the whole renovation of the content
and system of the building regulations, although
they pay the bill for all the unnecessary discussions
that take place and all non-conformities against the
regulations that happen in practise.
European influence
The Netherlands is a member of the EU and
responsibilities are attached to that. National
regulations should not hinder free trade and this
means that the Dutch regulations should be aligned
with the European standards and quality assessment
systems. Multinational companies that pay little
attention to legislative principles largely influence
the content of these standards. This can lead to
market disruption by formulating unnecessary high
performances that are not in line with the goals of
public regulation. The ERB equivalent performance
declaration about Tritium Lights escape signs
demonstrates this related to NEN-EN 1838 (ERB,
2009). The need to introduce The European
Regulation for construction products (Council
Directive, 1988 and 2003) forms an illustration of
the disruption caused by the CPD and in the future
the CPR (Regulation, 2011).
Introduction of the Eurocodes in the Netherlands
will not help reduce the regulatory burden. On the
contrary, it will increase because the Eurocodes are
ambiguous and a mix of technical, legal and
administrative provisions. Consultation needs and
discussion with the competent authorities will
increase and the cost of all this will be for the
owner/consumer. These negative local effects for
the Dutch national market are accepted because of
the possibility to freely operate in the whole EU in
the advisory practise. That was the outcome of the
discussion between the responsible Minister and the
Parliament and can be read in the Parliament
documentation and the documentation of the mirror
standardisation committee 351 001 “TGB-Plenair”
and the working group “Implementation
Eurocodes”, 351 001 00 01.
Europe is also working on standards for durability
and sustainability as part of implementation of the
CPD (Council Directive, 1988 and 2003) and CPR
(Regulation, 2011). Environmental regulations are
aimed at pollution of air, water and ground.
Regulations based on the content of materials
frustrate material recycling and so cause
unnecessary environmental pollution. Influential
European member states do not seem to understand
this. Instead of putting society interests up front fear
of the unknown is creating excessive environmental
demands; if something is not included in a product
it cannot cause any harm. This way of thinking kills
innovation and consequently also the environment.
Where do we put all our building rubbish if we
cannot recycle it? In the documentation of CEN TC
351 'Sustainability of construction works”
documentation about the tough discussions can be
found.
THREE RECOMMENDATIONS
Three important Dutch publications have been
made concerning rethinking building regulations:
1. The Dekker committee report (Dekker
Committee, 2008).
2. The Mans committee report on improving
enforcement (Mans Committee, 2008).
3. The report of the Expertcentre Regulations in
Building (ERB, 2009).
The Dekker report makes a number of
recommendations of which the Minister of MIA is
not convinced. In particular, the recommendation to
privatise a part of the enforcement process (for
example, discontinuing preventive checks on
building structures) which would lead to informed
solutions. The Dekker committee assumes a
beneficial working of market forces that up to now
has not proven to be the case. For decades the
responsibilities for those in the industry have been
clear, but the government supervision is still
required to ensure that the public interest is
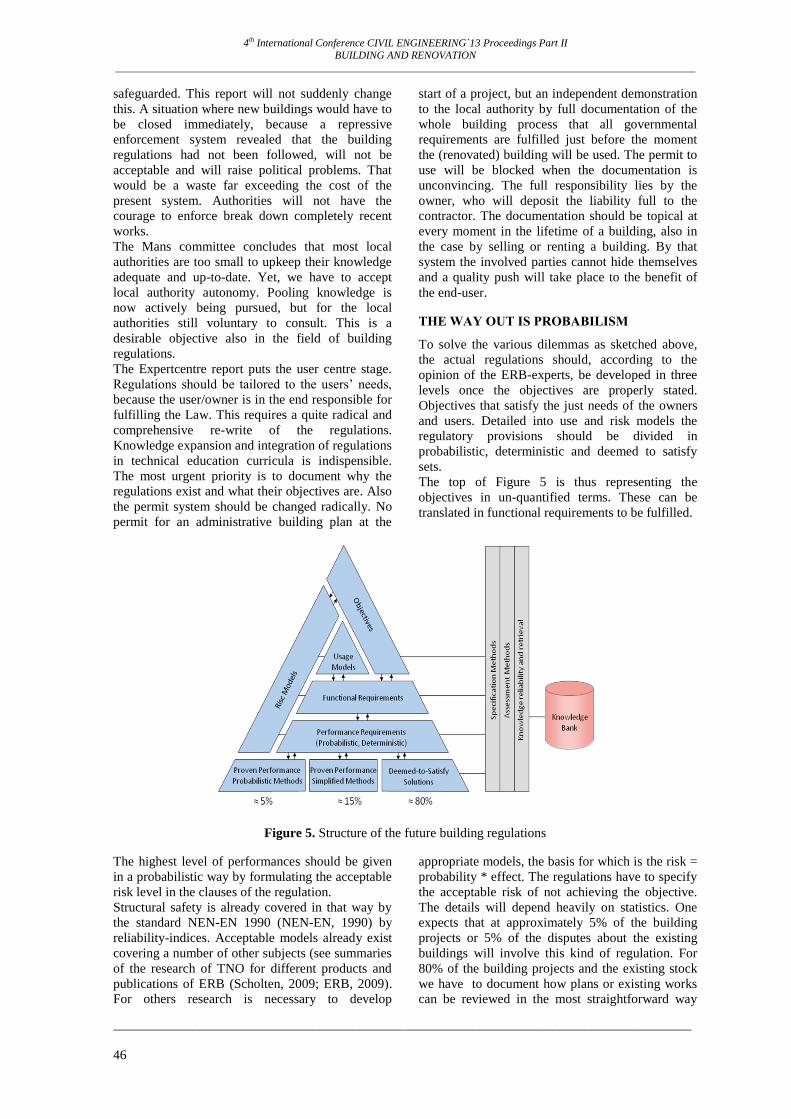
4th International Conference CIVIL ENGINEERING`13 Proceedings Part II
BUILDING AND RENOVATION
_____________________________________________________________________________________________________________
_______________________________________________________________________________________
46
safeguarded. This report will not suddenly change
this. A situation where new buildings would have to
be closed immediately, because a repressive
enforcement system revealed that the building
regulations had not been followed, will not be
acceptable and will raise political problems. That
would be a waste far exceeding the cost of the
present system. Authorities will not have the
courage to enforce break down completely recent
works.
The Mans committee concludes that most local
authorities are too small to upkeep their knowledge
adequate and up-to-date. Yet, we have to accept
local authority autonomy. Pooling knowledge is
now actively being pursued, but for the local
authorities still voluntary to consult. This is a
desirable objective also in the field of building
regulations.
The Expertcentre report puts the user centre stage.
Regulations should be tailored to the users’ needs,
because the user/owner is in the end responsible for
fulfilling the Law. This requires a quite radical and
comprehensive re-write of the regulations.
Knowledge expansion and integration of regulations
in technical education curricula is indispensible.
The most urgent priority is to document why the
regulations exist and what their objectives are. Also
the permit system should be changed radically. No
permit for an administrative building plan at the
start of a project, but an independent demonstration
to the local authority by full documentation of the
whole building process that all governmental
requirements are fulfilled just before the moment
the (renovated) building will be used. The permit to
use will be blocked when the documentation is
unconvincing. The full responsibility lies by the
owner, who will deposit the liability full to the
contractor. The documentation should be topical at
every moment in the lifetime of a building, also in
the case by selling or renting a building. By that
system the involved parties cannot hide themselves
and a quality push will take place to the benefit of
the end-user.
THE WAY OUT IS PROBABILISM
To solve the various dilemmas as sketched above,
the actual regulations should, according to the
opinion of the ERB-experts, be developed in three
levels once the objectives are properly stated.
Objectives that satisfy the just needs of the owners
and users. Detailed into use and risk models the
regulatory provisions should be divided in
probabilistic, deterministic and deemed to satisfy
sets.
The top of Figure 5 is thus representing the
objectives in un-quantified terms. These can be
translated in functional requirements to be fulfilled.
Figure 5. Structure of the future building regulations
The highest level of performances should be given
in a probabilistic way by formulating the acceptable
risk level in the clauses of the regulation.
Structural safety is already covered in that way by
the standard NEN-EN 1990 (NEN-EN, 1990) by
reliability-indices. Acceptable models already exist
covering a number of other subjects (see summaries
of the research of TNO for different products and
publications of ERB (Scholten, 2009; ERB, 2009).
For others research is necessary to develop
appropriate models, the basis for which is the risk =
probability * effect. The regulations have to specify
the acceptable risk of not achieving the objective.
The details will depend heavily on statistics. One
expects that at approximately 5% of the building
projects or 5% of the disputes about the existing
buildings will involve this kind of regulation. For
80% of the building projects and the existing stock
we have to document how plans or existing works
can be reviewed in the most straightforward way

4th International Conference CIVIL ENGINEERING`13 Proceedings Part II
BUILDING AND RENOVATION
_____________________________________________________________________________________________________________
_______________________________________________________________________________________
47
(deemed to satisfy) in deciding whether or not they
meet the regulations. For the remaining 15% of the
building projects and the remaining part of the
existing stock, regulations will need to be simplified
performance based (the middle between
probabilistic and deemed to satisfy). Regulatory
solutions are not readily available. So, an
opportunity must be created and resources made
available.
RESEARCH PROGRAMME
Referring to Figure 1, the ideal regulatory
framework needs the feedback loop to be closed
and a body of knowledge to be built up. The
backlog in documenting the background must be
quickly resolved into a memory data bank or else
too much experience and knowledge will be lost,
since the existing regulators are dying out. A new
dedicated research programme is needed for this,
providing the cradle for future oriented knowledge
as well as for breeding of a new generation of
regulators.
REFERENCES
Council Directive 89/106/EEC of 21 December 1988 on the approximation of laws, regulations and
administrative provisions of the Member States relating to construction products, amended by Council
Directive 93/68/EEC of 22 July 1993 and REGULATION (EC) No 1882/2003 OF THE EUROPEAN
PARLIAMENT AND OF THE COUNCIL of 29 September 2003.
Dekker Committee on Regulations Policy for Buildings (2008) Private if possible, public if required. Den
Haag (In Dutch).
Expertcentre Regulations in Building ERB (2009) Declaration equivalent performance for plastic smoke
exhaust systems. CoxDens®PPS en PPS/Alu. Delft (in Dutch).
Expertcentre Regulations in Building, ERB (2009) Declaration equivalent performance for Tritium Lights
escape route indicators. Escape Light bv. GV 90201 (in Dutch).
Expertcentre Regulations in Building (2009) Equivalent Performance: 10 Cases and 40 Questions and
Answers (in Dutch).
Expertcentre Regulations in Building, ERB ( 2009) Trust and Reliability. Delft (in Dutch).
Expertcentre Regulations in Building ERB (2008) Declaration equivalent performance for plastic smoke
exhaust systems. ROLUX PP 120. Delft (in Dutch).
Herpen R.A.P., Leur P.H.E., Vrouwenvelder A.C.W.M. (2009) Physical Fire Model- adjustment of risk level
to public regulations for structural safety. Zwolle (in Dutch)
Herwijne F. (2009) Lessons learned from collapses- why bridges and buildings sometimes collapse and how
to prevent that! Bouwen met Staal.Zoetermeer. 180 p. (in Dutch).
Mans Committee (2008) Revision of enforcement systems VROM-regulation. Now is the time. Den Haag
Ministry of Housing, Physical Planning and Environment, MVROM (1984) Directorate General Housing:
Principles for technical regulations in building. Zoetermeer (in Dutch).
Ministry of Justice, MJUS (2010) Amendment of the Ministerial Order Building Decree 2003 regarding
structural safety of works not being buildings. OJ 2010.393 (in Dutch).
Ministry of Justice, MINJUS (2008) Law of November 6 2008, regarding a system of permits and
enforcement for activities influencing the physical living environment (Law general provisions
environmental law.) OJ. 2008, 496.
Ministry of Justice, MJUS (1992) The General Administrative Law Act. Stb. 1992. 315 (in Dutch).
NEN-EN 1990 (1990), Eurocode - Basis of structural design (in Dutch).
Phaff J.C. (1992) Description of the VENCON software for dwellings. A model for ventilation and diffusion
of interior air pollution. TNO rapport B-92-1217 (in Dutch).
REGULATION (EU) No 305/2011 OF THE EUROPEAN PARLIAMENT AND OF THE COUNCIL of 9
March 2011 laying down harmonised conditions for the marketing of construction products and repealing
Council Directive 89/106/EEC, Official Journal of the European Union L 88, 04.04.2011, Brussels
Scholten N.P.M. (2009) Publications 2004-2008.ERB (in Dutch).
Scholten .N.P.M. (2001) Technical and legal considerations of building regulations – Housing Act and
Building Decree. PhD-study. Delft.

4th International Conference CIVIL ENGINEERING`13 Proceedings Part II
BUILDING AND RENOVATION
_____________________________________________________________________________________________________________
_______________________________________________________________________________________
48
Tonkelaar E.S. den (2009) Smoke diffusion in a access gallery with CFD. DGMR Report. F.2008. Arnhem.
0908.01.R001(in Dutch)
Vandevelde P. (2005) Fire risk evaluation to European cultural heritage – Quantification of priorities and
optimization of fire protection strategies – FIRE-TECH. EU-project.
Varkevisser J. (2009) The human observation performance at the application of "Tritium Lights" as
security/safety indicators. Meppel (in Dutch).
Verdict Arnhem Court procedure nr. 09/4001 GEMET 78. 23 October 2009 (in Dutch).
Verdict The Hague Court (2010) AWB 10/161 GEMWT (in Dutch).
Verdict Zutphen Court (2009), LJN: BK 3737, 09/592 en 09/817 (in Dutch).
Verdict Zwolle-Lelystad Court (2009) Awb 09/767. 26 juni 2009 (in Dutch).
Vrouwenvelder A.C.W.M. (2009) Safety requirements at rebuilding of existing bridges. TNO. Delft (in
Dutch).
4th International Conference CIVIL ENGINEERING`13 Proceedings Part II
BUILDING AND RENOVATION
_____________________________________________________________________________________________________________
_______________________________________________________________________________________
49
EUROCODES AND STRUCTURAL SAFETY OF THE EXISTING BUILDINGS –
CONSIDERING THE PUBLICATION OF THE DUTCH NEN 8700
Dr. Nico P.M. Scholten, PhD
Expertcenter Regulations in Building (ERB)
Email: [email protected]
Prof.Ton C.W.M. Vrouwenvelder
TNO Built Environment and Geosciences
E-mail: [email protected]
ABSTRACT
Since 1992 there have been a number of proposals to renew calculation methods available to assess the
structural safety of the existing buildings. But without operational results.
Upon publication of the Eurocodes NL decided to renew and to include them in the Dutch building
regulations. The question was how.
It was decided to develop a new Dutch national standard: NEN 8700. That shows how, in conjunction with
the 58 Eurocodes, an expert opinion can be assessed on the structural safety of an existing building.
The Building Decree 2012 refers to this standard for load actions that have to be taken into account, the
response of the structure and the required strength of structure, and references to the Eurocodes. The set up
of the new standard is explained.
A building is classified as an existing building after it has been completed.
So the standard applies to all building stock, but the owner primarily must ensure that during the design
working lifespan the legally required performance for newly built buildings remains satisfied except
accidents.
The safety assessment of an existing building differs from that of a new one in ways that are elaborated:
- cost in relation to safety;
- safety in relation to the reference period;
- availability of the actual status data versus the design data.
Unlike the regulations that apply to new buildings the new standard includes for the judgement of the lower
limit of safety of the existing structures (the moment that the use immediately has to cease):
- probability theory;
- harmonisation of the Eurocodes with safety of the existing building constructions on an arbitrary
moment;
- acknowledgement of durable safety requirements other than a 1 year period;
- exclusion of requirements pertaining to the uncertainties that may arise during the theoretical
design life;
- amendment of determination methods for the properties of the structural materials used;
- ability to review at any time the actual constructed situation.
The new standard also establishes the lowest limits of safety levels in the renovation, alteration or
enlargement of an existing building.
Reliability and load factors are summarized extracted from the underlying TNO report.
Keywords: safety assessment, regulation, existing building, renovation, standard, Eurocodes, NEN 8700
INTRODUCTION
On October 1, 1992 the Building Decree came into
force together with some 6 Ministerial Orders. As
from that moment quantifiable calculation methods
became available to assess the structural safety of
the existing buildings as laid down in the Building
Decree and later the Building Decree of 2003 and
the Building Decree 2012.
These calculation methods were based on the well-
known Dutch TGB standards series together with
the more detailed regulations in the Ministerial
Order on structural and user safety. This Order has
been legally and administratively simplified a
number of times but the content is unchanged till
April 1, 2012. This Order was originally based on
the TNO Building Research report B-91-832. After
April 1, 2012 reference is made to the Eurocodes.
There have been a number of standardisation
proposals since to publish a separate TGB series to
deal with the existing buildings, but this has not
come to anything.
The above-mentioned TNO report was issued in
2004 and published as TNO B&O report 2004-CI-
R0159.
After the publication of the Eurocodes and the
decision to include them in the Dutch building
regulations (following the introduction of the third
4th International Conference CIVIL ENGINEERING`13 Proceedings Part II
BUILDING AND RENOVATION
_____________________________________________________________________________________________________________
_______________________________________________________________________________________
50
issue of the Building Decree in 2003) the question
arose of what to do about the regulations
concerning the structural safety of the existing
buildings. The choice was not difficult because
making 58 standards to cover the existing buildings
or alternatively making 58 sets of follow-up
regulations to cover the existing buildings in the 58
Eurocodes was not an option. The choice was made
to develop a new Dutch standard: NEN 8700. This
standard shows how, in conjunction with the 58
Eurocodes, an opinion can be arrived at on the
structural safety of an existing building.
The following research questions are solved for the
Dutch situation:
1. What are the differences between the public
requirements for structural safety between
newly built buildings and existing buildings?
2. What are the backgrounds of the safety
philosophy to motivate these differences and
how can the assessment of the safety of the
existing buildings be used in practice?
3. What are the logical structural safety
requirements by renovation of the structure of
the existing buildings?
In a national or international perspective the
research can be placed as following:
New Eurocodes for the assessment of newly built
buildings are introduced in the European Union. In
the Dutch building regulations also requirements
are given for the minimum performance of the
existing buildings. So the existing regulations have
to be changed to bring them in line with the 58
Eurocodes parts. In 2010 the Eurocodes will be
compulsory. At that moment also the requirements
for existing buildings and renovation should be
available.
Within the EU discussion is opened to develop also
Eurocodes for the existing buildings. The Dutch
NEN 8700 and background report can be a good
starting point.
The main conclusions and recommendations of the
project are:
a) The safety philosophy of newly built buildings
can also be used for existing buildings and
renovation.
b) The reliability-index can be decreased for the
assessment of the existing buildings and for
buildings in renovation, because economical
aspects have to be dealt with in another way
than by newly built buildings. Because of
another reference period the actions can be
decreased. Also durability aspects are not the
same. The way safety figures of the structure
itself may be used gives also a different
assessment.
c) The study and standards provide a direction
how to judge in a practical way whether the
minimum safety requirements are fulfilled.
THE STRUCTURE
The intention is that the Building Decree 2003 will
refer to NEN 8700 for load actions that have to be
taken in account, the response of the structure and
the required strength of the structure. The new
standard will make reference to the Eurocodes.
Purpose of the standard
The standard applies to all existing buildings,
regardless of their age. A building is classified as an
existing building after it has been completed.
The owner of the building must ensure that during
the reference period the legally required standards
are or remain satisfied other than caused by an
accident. The legally required standards are the
safety standards required by legislation at the time
of construction, unless a building permit as defined
in the article 40 of the Housing Act has expressly
permitted a lower standard (for example, in the case
of renovation) or if knowingly or unknowingly an
incorrect building construction is approved. The
legal regulations that determine new structural
safety standards apply to the entire reference period,
which is defined as the design working life of the
building.
If the legally required safety level at the moment of
erection is not met, then the article 13 of the
Housing Act may on request of the Authority
require the building owner to modify the building
construction. Whether this is invoked depends
amongst others like on the timing of the
infringement in relation to the remaining service life
of the building. The Municipal authorities have the
discretion to accept a certain degree of deviation
from the regulations.
A separate issue is the private relationship between
contractual parties. If a contractual agreement has
not been met then the disadvantaged party has the
right to a civil law process and the other party is
liable for not fulfilling the contractual obligations.
MAIN CONTENTS
The safety assessment of an existing building
differs from that of a new one in a number of
essential ways:
Firstly, increased safety levels usually involve
more costs for an existing building than for
buildings that are still in the design phase. The
safety provisions embodied in safety standards
have to be set off against the cost of providing
them, and on this basis these costs are more
difficult to justify for the existing buildings.
For this reason in certain circumstances a
lower safety level is acceptable.
Secondly, the remaining lifetime of an existing
building is often different than the standard
reference period of 50 years or 15 years that
applies to new buildings. This aspect plays an
important role in determining if the building
construction is still adequately safe.
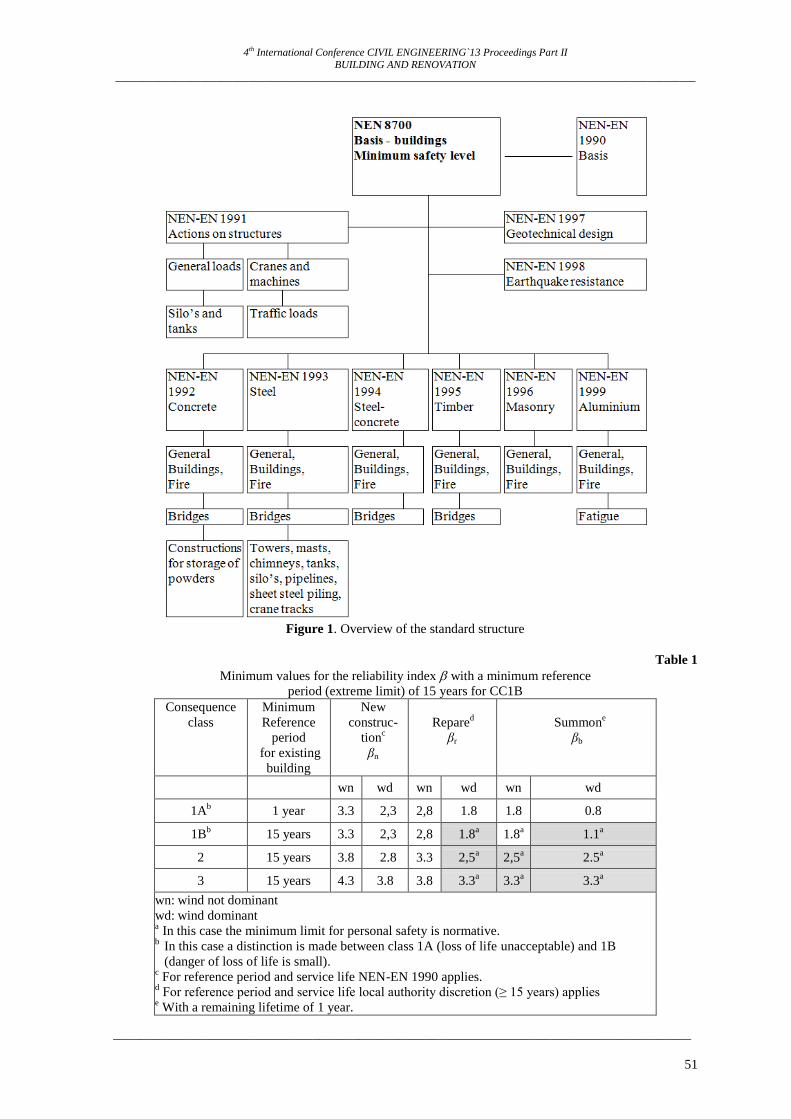
4th International Conference CIVIL ENGINEERING`13 Proceedings Part II
BUILDING AND RENOVATION
_____________________________________________________________________________________________________________
_______________________________________________________________________________________
51
Figure 1. Overview of the standard structure
Table 1
Minimum values for the reliability index with a minimum reference
period (extreme limit) of 15 years for CC1B
Consequence
class
Minimum
Reference
period
for existing
building
New
construc-
tionc
βn
Repared
βr
Summone
βb
wn wd wn wd wn wd
1Ab 1 year 3.3 2,3 2,8 1.8 1.8 0.8
1Bb 15 years 3.3 2,3 2,8 1.8
a 1.8
a 1.1
a
2 15 years 3.8 2.8 3.3 2,5a 2,5
a 2.5
a
3 15 years 4.3 3.8 3.8 3.3a 3.3
a 3.3
a
wn: wind not dominant
wd: wind dominant a In this case the minimum limit for personal safety is normative.
b In this case a distinction is made between class 1A (loss of life unacceptable) and 1B
(danger of loss of life is small). c For reference period and service life NEN-EN 1990 applies.
d For reference period and service life local authority discretion (≥ 15 years) applies
e With a remaining lifetime of 1 year.

4th International Conference CIVIL ENGINEERING`13 Proceedings Part II
BUILDING AND RENOVATION
_____________________________________________________________________________________________________________
_______________________________________________________________________________________
52
Thirdly, in an existing building actual
measurement can be made in order to gather
the facts.
More information on these aspects and their
influence in determining the reliability levels
chosen in the standard is contained in a report
produced by TNO and the Expertcenter Regulations
in Building: TNO-Report 2008-D-R0015/B.
Unlike the regulations that apply to new buildings
the requirements of the new standard include:
The regulations in NEN-EN 1990 which
concern probability theory. This pays no
attention to individual structural materials but
is dependent on the purposes for which the
building is used and pays attention to the
probability of load stresses occurring over a
short reference period. Herewith account is
taken of known actions on the building taken
place in the past and the probable properties of
the building itself and not the structural
properties of the building products as products
in the market from which the building is made.
Taking the opportunity to harmonise the
Eurocodes with the basic principles on the
safety of the existing building constructions on
an arbitrary moment. The safety assessment
assumes a remaining lifetime of 1 year.
Reference periods in determining the size of
the load factors are 1 year for buildings in
class CC1A and 15 years for buildings in class
CC1B, CC2 and CC3. This is therefore a
different assumption to the durable safety
requirements of a newly built construction.4
These have in the case of permanent buildings
a design lifetime and a reference period of 15
or 50/100 years dependent on the class of the
building. For this reason the reliability index β
and the load factor γ can be lower than those
for a new construction.
Formal acknowledgement that guarantees on
the durable safety requirements need other
than to cover a remaining lifetime period of 1
year.
Excluding requirements that relate to the
uncertainties that may arise during the
theoretical, paper design of the building.
Amendment of the methods to determine the
properties of the structural materials used in
the building; and
The ability to review at any time the actual
constructed situation (a review based on the
original design may be sufficient where there
4 The NEN 8700 and the Eurocodes make a difference
between the reference period which expresses the size of
the loads to be taken as basis for the calculations and the
service life or remaining lifetime. The remaining lifetime
is the indicator for the safety of the structure when loads
are applied.
are no indications that the actual situation is
worse).
Because the introduction of the Eurocode standards
NEN-EN 1990 up to NEN-EN 1999 represents a
breakthrough in the traditional assessment methods,
there is justification for further transforming the old
ways of working to the way that has been adopted
with the Eurocodes as described above. NEN 6720
assesses concrete on its cube compressive strength,
whilst NEN-EN 1992 assesses concrete on its
cylinder compressive strength. Timber has now
introduced strength classes, whilst for years visual
control was the method used despite the need for an
objective strength assessment. These are just a few
examples.
In the development of the new standard we have
tried not to change the confidence levels by which
building structures were declared unsafe and were
upheld by legal bodies up to the time of publication
of the new standard.
In the transition from the TGB 1990 standards to
the Eurocodes (NEN-EN 1990 to NEN-EN 1999)
the safety classes recognised in NEN 6700 have
been transformed to consequence classes. This
classifies buildings differently than in NEN 6700.
To avoid this having unintended effects for the
existing buildings the consequence class CC1 has
been split into class CC1A and CC1B. Class CC1A
includes buildings that according to NEN 6700 fall
in safety class 1 and according to the Building
Decree 2003 may be assessed using a reference
period of 1 year until the time of the introduction of
the new standard. In Class 1A human safety will be
subsidiary.
RENOVATION
The new standard also establishes the lowest limits
of safety levels in the renovation, alteration or
enlargement of an existing building. These limits
differ from those which apply to newly constructed
buildings and which are laid down in
NEN-EN 1990. Note that granting exemptions to a
level of the standard that may be below an already
legally sanctioned level is not the intention. By
doing so the authorities would be accepting a lower
standard than they had originally sanctioned.
However, the authorities could well take account of
the remaining lifespan of the building when
granting a permit for renovation, alteration or
enlargement. The remaining lifespan can be
different from that of an entirely new building.
Exceptional circumstances also may occur whereby
exemption could be granted, for example, after the
occurrence of an accident.
The standard does not contain specific rules relating
to minimum safety levels for renovation, alteration
or enlargement of a building whereby the remaining
lifespan and therefore the reference period of the
building to be renovated are taken into account. The
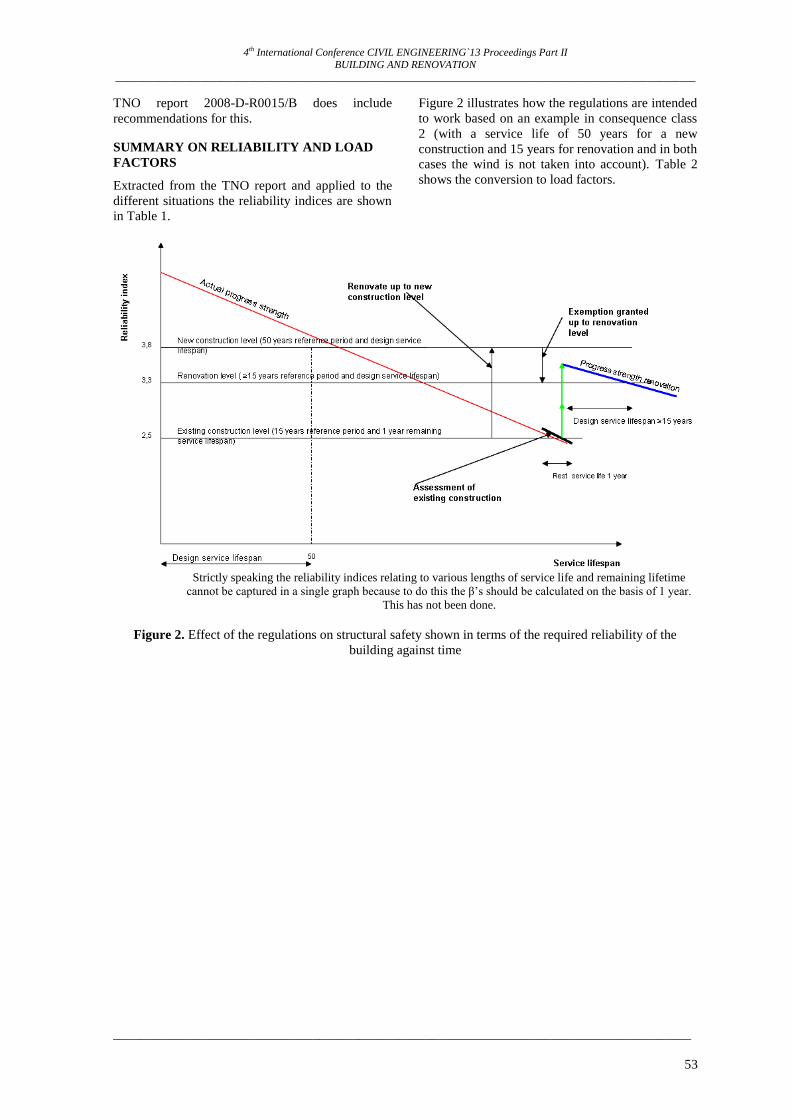
4th International Conference CIVIL ENGINEERING`13 Proceedings Part II
BUILDING AND RENOVATION
_____________________________________________________________________________________________________________
_______________________________________________________________________________________
53
TNO report 2008-D-R0015/B does include
recommendations for this.
SUMMARY ON RELIABILITY AND LOAD
FACTORS
Extracted from the TNO report and applied to the
different situations the reliability indices are shown
in Table 1.
Figure 2 illustrates how the regulations are intended
to work based on an example in consequence class
2 (with a service life of 50 years for a new
construction and 15 years for renovation and in both
cases the wind is not taken into account). Table 2
shows the conversion to load factors.
Strictly speaking the reliability indices relating to various lengths of service life and remaining lifetime
cannot be captured in a single graph because to do this the β’s should be calculated on the basis of 1 year.
This has not been done.
Figure 2. Effect of the regulations on structural safety shown in terms of the required reliability of the
building against time
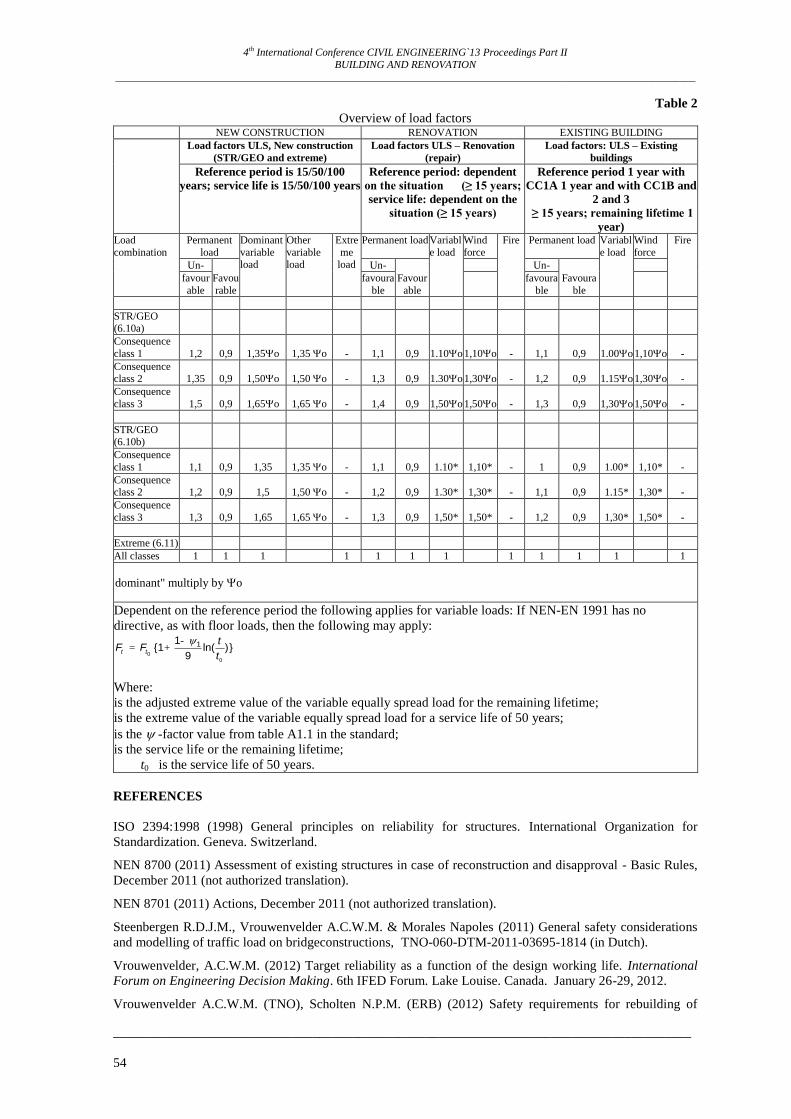
4th International Conference CIVIL ENGINEERING`13 Proceedings Part II
BUILDING AND RENOVATION _____________________________________________________________________________________________________________
_______________________________________________________________________________________
54
Table 2
Overview of load factors NEW CONSTRUCTION RENOVATION EXISTING BUILDING
Load factors ULS, New construction
(STR/GEO and extreme)
Load factors ULS – Renovation
(repair)
Load factors: ULS – Existing
buildings
Reference period is 15/50/100
years; service life is 15/50/100 years
Reference period: dependent
on the situation (≥ 15 years;
service life: dependent on the
situation (≥ 15 years)
Reference period 1 year with
CC1A 1 year and with CC1B and
2 and 3
≥ 15 years; remaining lifetime 1
year) Load
combination
Permanent
load
Dominant
variable load
Other
variable load
Extre
me load
Permanent load Variabl
e load
Wind
force
Fire Permanent load Variabl
e load
Wind
force
Fire
Un-
Favou
rable
Un-
Favour
able
Un-
Favoura
ble
favour
able
favoura
ble favoura
ble
STR/GEO (6.10a)
Consequence
class 1 1,2 0,9 1,35o 1,35 o - 1,1 0,9 1.10o 1,10o - 1,1 0,9 1.00o 1,10o -
Consequence class 2 1,35 0,9 1,50o 1,50 o - 1,3 0,9 1.30o 1,30o - 1,2 0,9 1.15o 1,30o -
Consequence
class 3 1,5 0,9 1,65o 1,65 o - 1,4 0,9 1,50o 1,50o - 1,3 0,9 1,30o 1,50o -
STR/GEO (6.10b)
Consequence
class 1 1,1 0,9 1,35 1,35 o - 1,1 0,9 1.10* 1,10* - 1 0,9 1.00* 1,10* -
Consequence class 2 1,2 0,9 1,5 1,50 o - 1,2 0,9 1.30* 1,30* - 1,1 0,9 1.15* 1,30* -
Consequence
class 3 1,3 0,9 1,65 1,65 o - 1,3 0,9 1,50* 1,50* - 1,2 0,9 1,30* 1,50* -
Extreme (6.11)
All classes 1 1 1 1 1 1 1 1 1 1 1 1
* = if "not dominant" multiply by o
Dependent on the reference period the following applies for variable loads: If NEN-EN 1991 has no
directive, as with floor loads, then the following may apply:
Where:
Ft is the adjusted extreme value of the variable equally spread load for the remaining lifetime;
Ft0 is the extreme value of the variable equally spread load for a service life of 50 years;
1 is the -factor value from table A1.1 in the standard;
t is the service life or the remaining lifetime;
t0 is the service life of 50 years.
REFERENCES
ISO 2394:1998 (1998) General principles on reliability for structures. International Organization for
Standardization. Geneva. Switzerland.
NEN 8700 (2011) Assessment of existing structures in case of reconstruction and disapproval - Basic Rules,
December 2011 (not authorized translation).
NEN 8701 (2011) Actions, December 2011 (not authorized translation).
Steenbergen R.D.J.M., Vrouwenvelder A.C.W.M. & Morales Napoles (2011) General safety considerations
and modelling of traffic load on bridgeconstructions, TNO-060-DTM-2011-03695-1814 (in Dutch).
Vrouwenvelder, A.C.W.M. (2012) Target reliability as a function of the design working life. International
Forum on Engineering Decision Making. 6th IFED Forum. Lake Louise. Canada. January 26-29, 2012.
Vrouwenvelder A.C.W.M. (TNO), Scholten N.P.M. (ERB) (2012) Safety requirements for rebuilding of
-= +
00
11{1 ln( )}
9t t
tF F
t

4th International Conference CIVIL ENGINEERING`13 Proceedings Part II
BUILDING AND RENOVATION _____________________________________________________________________________________________________________
_______________________________________________________________________________________
55
existing bridges, TNO-034-DTM-2012-01104 (in Dutch).
Vrouwenvelder A.C.W.M. (TNO), Scholten N.P.M. (ERB), Steenbergen R. D.J.M. (TNO) (2011) Safety
asessment of existing buildings- background report for NEN 8700, TNO-060-DTM-2011-03086 (in Dutch).
Vrouwenvelder A.C.W.M. (TNO), Scholten N.P.M. (ERB) (2008) Safety assessment existing construction,
Background report for NEN 8700, 2008-D-R0015/B (in Dutch).
Vrouwenvelde A.C.W.M., Scholten N.P.M, de Winter P.E., (2004) Safety assessment existing construction,
Background report for the relative sections of the Building Decree 2003, TNO 2004-CI-R0159 (in Dutch).
Vrouwenvelder A.C.W.M., de Winter P.E. (2003) Structural safety assessment existing construction,
Background report for the relative sections of the Building Decree 2003, TNO B-91-832 (in Dutch).

4th International Conference CIVIL ENGINEERING`13 Proceedings Part II
LANDSCAPE ARCHITECTURE
_____________________________________________________________________________________________________________
_______________________________________________________________________________________
56
THE BENEFITS OF GREEN ROOFING FOR LATVIAN BUILDING
ENVIRONMENT
Patricija Kara
Riga Technical University, Institute of Materials and Structures
E-mail: [email protected]
Peteris Pastars
Riga Technical University, Faculty of Civil Engineering
ABSTRACT
Green roofs serve several purposes for a building, such as absorbing rainwater, providing insulation,
creating a habitat for wildlife and helping to lower urban air temperatures and mitigate the heat island
effect. The modern trend started when green roofs were developed in Germany in the 1960s, and has since
spread to many countries. Today, it is estimated that about 10% of all German roofs have been “greened”.
Green roofs are also becoming increasingly popular in the United States, although they are not as common
as in Europe; however, one sees more and more architects opting for green roofs as an alternative to large
flat roofs. A green or vegetated roof is not such a traditional roof type for the Latvian building environment.
Mainly because of a lot of the ideas that it harms the whole structure, problems with leaking, problems with
hydro isolation, too large a weight and a lot of additional maintenance work and costs. And the greatest idea
is that this roof type is totally unsuitable for local weather conditions when historically green roofs are
widely used in Norway and also in Great Britain where weather conditions are much more harmful for
greenery. These ideas mainly are coming from the fear to get into a situation with high risk to maintain a
building with a green roof and if it is cost effective. In the present research, review is given on green roofing
worldwide and Latvia, different roof systems and describes the benefits of green roof implementation.
Key words: Green roofs, extensive and intensive roofs.
INTRODUCTION
There has never been so much interest in the
ecological impact of buildings as there is today. The
difficulty is that green is so fashionable that
everyone is jumping on the bandwagon, claiming
astonishing sustainability or remarkably low-energy
consumption (Jodidio, 2009). Buildings are one of
the heaviest consumers of natural resources and
account for a significant portion of the greenhouse
gas emissions that affect climate change. One very
old method to improve sustainability is to bury
architecture, or to cover it with vegetation. A layer
of earth serves as insulation (permits 6° reduction in
internal temperatures in summer) and ultimately
allows nature to return to its rightful place on a
given site. The thermal benefits that green roofs
provide may also have indirect benefits for people
living or working within the buildings. This has not
been researched, but anecdotal evidence from
Germany in the late 1990s is of interest. In a survey
of staff absence due to sickness at the Bundepost
offices in Stuttgart, it was shown that staff in one
building demonstrated significantly lower absences
than those in others. The only change in the 4-year
period that could be identified was that one of the
buildings was given a green roof; this building
supported lower staff sickness levels. It is possible
that the green roof reduced the fluctuation of daily
mean temperatures within the upper levels of the
building, and/or the vegetation helped cool and
moisturize in-going air near ventilation ducts
(Fig.1.) (Livingroofs.org). Nowadays, Stuttgart is
one of the “greenest” cities.
Figure. 1 Green roof versus convention roof comparison
(Source: www.greenroofguidelines.co.uk)
Bringing nature into a city center provides relief
from an otherwise artificial environment (Jodidio,
2009). Modern humans have a bad habit of
replacing naturally occurring water-absorbent soil
and plant systems with impervious surfaces as
roads, parking lots and roofs (Snell, 2009).
LANDSCAPE ARCHITECTURE
Building and Renovation
4th International Conference CIVIL ENGINEERING`13 Proceedings Part II
LANDSCAPE ARCHITECTURE
_____________________________________________________________________________________________________________
_______________________________________________________________________________________
57
Considering the roof space is generally underused
and ugly in most cities, covering it with vegetation
is good solution as from the aesthetical point of
view and as from an ecological one too. Green roof
technology provides an exciting and virtually
endless palette of design opportunities for
innovators, who can play a key role in the
reinvention of miles of wasted roof space on our
buildings (Cantor, 2008). Roof gardens and green
roofs both belong to a type of roof that supports
vegetation, which have numerous social, economic
and environmental benefits and can contribute
positively to issues surrounding climate change,
flooding, biodiversity and declining green space in
urban areas (www.thegreenroofcentre.co.uk). Green
roofs cost a fraction of a roof garden and are
lightweight with thin soil profiles and require
minimal maintenance in comparison to roof
gardens. Green roofs descended from the vernacular
architecture of various centuries in all parts of the
globe, whereas roof gardens are known as luxury
items of the affluent since the famous hanging
gardens of Babylon in ancient Mesopotamia
(between 6th and 7th century B.C) (Werthmann,
2007). The Hanging Gardens have been identified
as one of the seven ancient wonders of the world.
They are described in written records and have been
confirmed by archaeological evidence. One record
states that the Hanging Gardens: consisted of
vaulted terraces raised one above another, and
resting upon cube-shaped pillars. These are hollow
and filled with earth to allow trees of the largest
size to be planted. The pillars, the vaults, and
terraces are constructed of baked brick and asphalt
(Design Considerations, 2009). Modern green roofs,
which are made of a system of manufactured layers
deliberately placed over roofs to support growing
medium and vegetation, are a relatively new
phenomenon. However, green roofs or sod roofs in
Northern Scandinavia, Iceland, Great Britain and
Canada have been around for centuries for
insulation from extreme cold. For example,
traditionally, such earth structures were used for
partially submerged food, wine/beer cellars and
bomb shelters (Ferguson, 2012). In Scandinavia,
roofs were covered with sod that was stripped from
surrounding grassy meadows. This was done to
insulate homes. Underneath the sod are structurally
heavy timber beams interspaced with birch bark to
act as a waterproofing layer. Eventually, cheaper,
lighter, more effective and mass-market based
systems were developed to replace sod roofs (The
history of green roof technology). Therefore, green
roofs are not a new thing, they are an old thing that
we have rediscovered. Until 1970, green roofs were
regarded as luxurious home amenities. In the same
year, Professor Hans Luz, a German Landscape
Architect, proposed the use of green roofs as a
means of improving the quality of the urban
environment (The history of green roof technology).
In the beginning of the twentieth century, green
roofs experienced a renaissance through the
modernist movement. The invention of the flat
wood-cement roof was the first key point of the
advancement of green roofs to inhabit a new
healthy outdoor space by all levels of society
(Werthmann, 2007). At the beginning wood-cement
roofs in Berlin were covered with a layer of gravel
and clay. Through wind seeding grass began to
grow spontaneously. Roof gardens became popular
on multi-storey buildings in Berlin in the late
nineteenth century and continued to be constructed
on large city-centre structures throughout the
twentieth century (Green roof guidelines). The
modern trend started when green roofs were
developed in Germany in the 1960s, and has since
spread to many countries. In the 19th century, in
Germany Forschungsgesellschaft Landschaftsent-
wicklung Landschaftsbau e.V or The Landscaping
and Landscape Development Research Society E.V
(FLL) were established. And in 1982 by FLL the
first Guidelines were published for Green roofs,
where there was included for the first time,
information about effective design and planning of
green roofs that included soil deepness, grading
composition of soil in use, waterproofing and
drainage that nowadays serve as a handbook for the
correct implementation that is also adopted by other
countries. Since that moment, green roof
technology covered areas started growing in
geometrically progression, not only in Germany,
but also all over the world – in Europe, Asia (firstly
in Beijing) and the USA. Green roofs are becoming
increasingly popular in the United States, although
they were not as common as in Europe, except in
the last few years, when green roof technology was
imported to the USA. Germany supposedly has the
highest implementation rate of green roofs in the
world, but it took thirty years of research and
twenty years of proactive green roof policies to
reach the current market rate of about seven
percent. At the end the twentieth century, the green
roof gained renewed relevance through
environmentalism when its varied benefits were
recognized as useful for alleviating problems of
heavily urbanized areas (Werthmann, 2007). Green
roof experts in the German-speaking countries
already identified and labeled it as a “simple
intensive roof-greening” in the 1970s. In England,
the combination is called a “semi-extensive or semi-
intensive green roof” (Werthmann, 2007). The
terms “extensive” and “intensive” describe the
grade of maintenance needed for a specific
cultivation system and its degree of sustainability.
Green roofs are considered extensive because they
should require only a little maintenance and be self-
regenerating. There are two types of green roofs
defined – extensive and intensive, but in a few of
the definitions as well, semi intensive – roof type
between intensive and extensive can be found, and a
4th International Conference CIVIL ENGINEERING`13 Proceedings Part II
LANDSCAPE ARCHITECTURE
_____________________________________________________________________________________________________________
_______________________________________________________________________________________
58
brown roof type that excludes the preprocessing of
vegetation installation (Greenroofs.com). Extensive
roofs serve as an ecological covering that provides
society with environmental benefits and the
building owner with life cycle cost benefits. A
description based on the depth of the growing
medium on the green roof is: Extensive green roofs
typically have a growing medium at a depth of 4 to
6 inches, which may be retrofitted onto an existing
building or planned as part of a new construction
(Dictionary of terms). A lightweight (0.7 – 2.4
kN/m2), low-maintenance roof system, with limited
choice of plants (often sedum because of their
stability on windy, frosty and heat impacted
environment, also sedum or stonecrop, comes in
many varieties and colors, has very shallow roots
and can absorb up to 50% of its weight in rainwater,
thereby alleviating drainage problems typically
associated with flat roofs) planted into a shallow
substrate that is low in nutrients, with less energy
efficiency and storm water retention benefits, and
also unattractive to some, especially in winter
(Werthmann, 2007). Intensive green roofs typically
have minimal depth of growing of 15 cm. Intensive
green roofs more closely resemble ground level
gardens and must be engineered to support the
highest level of loading (1.8 - 6.0 kN/m2) on a
building because of it thickness. Generally, the
maximum depth of growing cannot be determined
because of a wide diversity of applicable plants.
Therefore, intensive roofs have a greater diversity
of plants and habitats, can be made very attractive
visually, have good insulation properties, more
energy efficiency and storm water retention
capability and longer membrane life. Other
disadvantages besides great weight loading on the
roof can be mentioned: a need for irrigation and
drainage systems requiring energy, water, materials;
higher capital and maintenance costs; more
complex systems and expertise.
Technical shortcomings like leakage problems of
the early roof gardens created an aura of suspicion
and avoidance – prejudices that persist up to today.
Methods of exchanging the gravel of ballast roofs
for a thin coat (three to five inches) of growing
medium were tested. The low weight of the soil
made structural reinforcement of the existing roofs
unnecessary, thus substantially reducing cost and
this minimal type of a “roof greening” provided
similar environmental benefits as traditional roof
gardens. The thin coating retained and cleaned rain
water, cooled and humidified the surrounding air,
filtered dust, reduced noise levels, insulated against
heat, helping lower urban air temperatures and
migrated the heat island effect, provided a habitat
for flora and fauna, and prolonged the life
expectancy of the roof. The lifetime of a
conventional roof is about 20 years, whereas a
green roof should last 40 years or longer (Getter,
2006). The technology was widely implemented as
a remedy against many problems of urban density,
such as frequent flooding, water and air pollution,
high energy consumption and non dependence on
climate issues as one might assume. For several
years, until German intensive green roofing
implementation, the roof-top remained a privilege
of the wealthy living in historic districts, the
democratic promise of the modern movement to
build roof gardens for everybody has obviously
failed. For example, the Rockefeller Center, built in
1937 had the concept of the Hanging Gardens,
which was to give the building occupants a pleasant
view of the surrounding greenery (The history of
green roof technology). Since the biggest factor was
the considerable additional expense of a roof garden
compared to a regular roof and the reinforcement of
the whole structure that has to hold the weight of
the garden.
At the current moment there are 3 different types of
green roof systems in use – complete systems,
modular systems and precultivated vegetated
blankets. Variations between them are generally
found in the manner in which the growing medium
and drainage layers are treated. The main difference
between those types can be defined in how the
growing medium and drainage layers are treated.
Only several companies offer ready complete
systems, but there are only a few companies around
the world that work on production of high quality
vegetated blankets. There are many construction
companies and manufacturers established and ready
with predefined technical solutions for the most
commonly applicable and the most problematic
nodes in green roofs. Those systems and
connections are presented together as one full
system. In spite of the lack of special standards,
green roofs now are designed according to
structural regulations. Mainly in Europe, all
structural designs are in accordance with the Euro
Code, starting with fire resistance, wind and snow
loads and finally according to construction
structural designs. The most popular guidelines are
developed by Fachvereinigung
Bauwerksbergrpünung e. V. (FBB) – Germany,
Landscape Research, Development and
Construction Society (FLL) – Germany, Green roof
organization (GRO)) – UK, U.S. Green Building
Council (organization that mainly works on LEED)
- USA and City of Toronto Building division –
USA. Those are main guidelines are widely
accepted. Besides, there are a lot of different local
guidelines and they are adjusted for local
conditions, but mainly they have the same basis.
MATERIALS AND METHODS
Green roofs are not so popular at the moment in
Latvia but within the last decade several objects had
been built. like, for example, Eastern Latvian
creative service centre – Zeimuls or Caran d’Ache
located in Rezekne, which was built in 2012 (Fig.2)
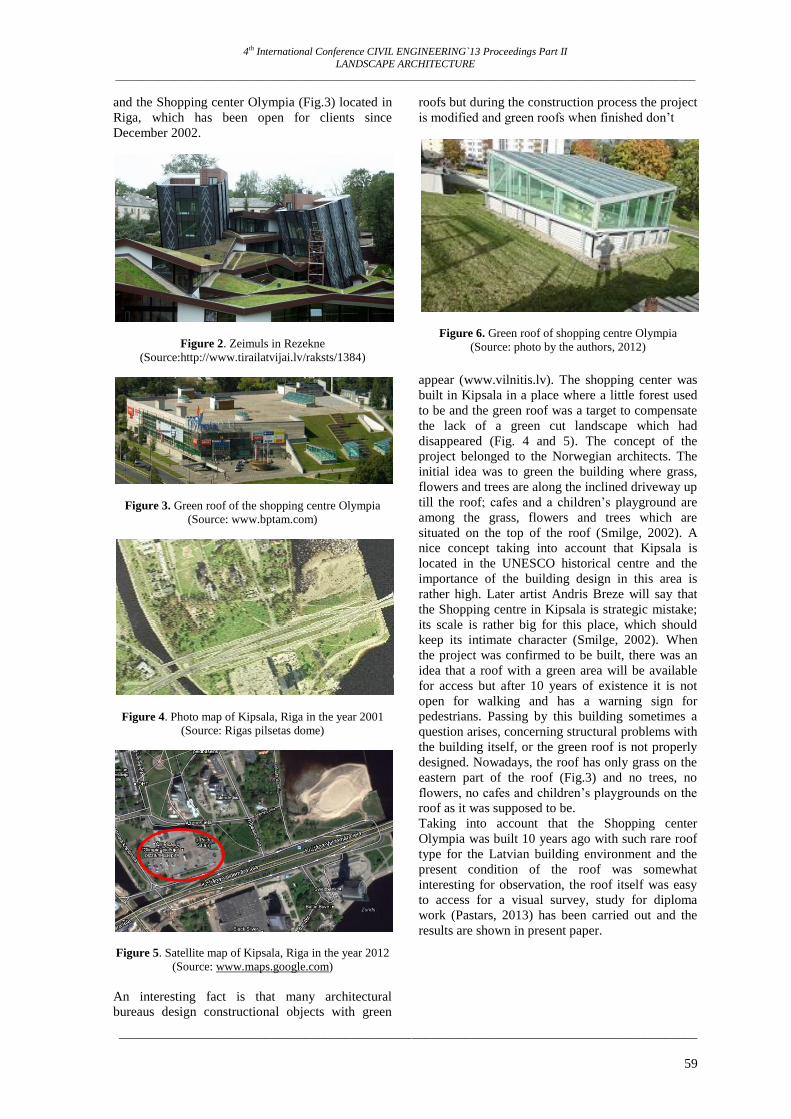
4th International Conference CIVIL ENGINEERING`13 Proceedings Part II
LANDSCAPE ARCHITECTURE
_____________________________________________________________________________________________________________
_______________________________________________________________________________________
59
and the Shopping center Olympia (Fig.3) located in
Riga, which has been open for clients since
December 2002.
Figure 2. Zeimuls in Rezekne (Source:http://www.tirailatvijai.lv/raksts/1384)
Figure 3. Green roof of the shopping centre Olympia
(Source: www.bptam.com)
Figure 4. Photo map of Kipsala, Riga in the year 2001
(Source: Rigas pilsetas dome)
Figure 5. Satellite map of Kipsala, Riga in the year 2012
(Source: www.maps.google.com)
An interesting fact is that many architectural
bureaus design constructional objects with green
roofs but during the construction process the project
is modified and green roofs when finished don’t
Figure 6. Green roof of shopping centre Olympia
(Source: photo by the authors, 2012)
appear (www.vilnitis.lv). The shopping center was
built in Kipsala in a place where a little forest used
to be and the green roof was a target to compensate
the lack of a green cut landscape which had
disappeared (Fig. 4 and 5). The concept of the
project belonged to the Norwegian architects. The
initial idea was to green the building where grass,
flowers and trees are along the inclined driveway up
till the roof; cafes and a children’s playground are
among the grass, flowers and trees which are
situated on the top of the roof (Smilge, 2002). A
nice concept taking into account that Kipsala is
located in the UNESCO historical centre and the
importance of the building design in this area is
rather high. Later artist Andris Breze will say that
the Shopping centre in Kipsala is strategic mistake;
its scale is rather big for this place, which should
keep its intimate character (Smilge, 2002). When
the project was confirmed to be built, there was an
idea that a roof with a green area will be available
for access but after 10 years of existence it is not
open for walking and has a warning sign for
pedestrians. Passing by this building sometimes a
question arises, concerning structural problems with
the building itself, or the green roof is not properly
designed. Nowadays, the roof has only grass on the
eastern part of the roof (Fig.3) and no trees, no
flowers, no cafes and children’s playgrounds on the
roof as it was supposed to be. Taking into account that the Shopping center
Olympia was built 10 years ago with such rare roof
type for the Latvian building environment and the
present condition of the roof was somewhat
interesting for observation, the roof itself was easy
to access for a visual survey, study for diploma
work (Pastars, 2013) has been carried out and the
results are shown in present paper.
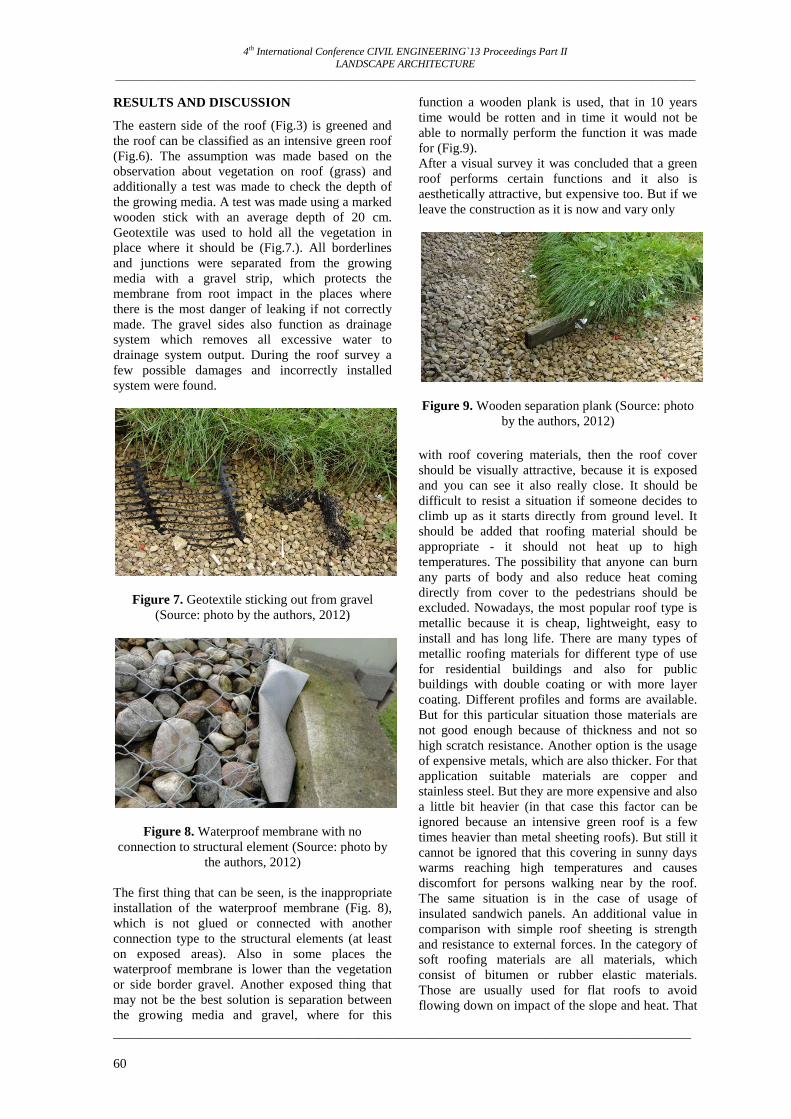
4th International Conference CIVIL ENGINEERING`13 Proceedings Part II
LANDSCAPE ARCHITECTURE
_____________________________________________________________________________________________________________
_______________________________________________________________________________________
60
RESULTS AND DISCUSSION
The eastern side of the roof (Fig.3) is greened and
the roof can be classified as an intensive green roof
(Fig.6). The assumption was made based on the
observation about vegetation on roof (grass) and
additionally a test was made to check the depth of
the growing media. A test was made using a marked
wooden stick with an average depth of 20 cm.
Geotextile was used to hold all the vegetation in
place where it should be (Fig.7.). All borderlines
and junctions were separated from the growing
media with a gravel strip, which protects the
membrane from root impact in the places where
there is the most danger of leaking if not correctly
made. The gravel sides also function as drainage
system which removes all excessive water to
drainage system output. During the roof survey a
few possible damages and incorrectly installed
system were found.
Figure 7. Geotextile sticking out from gravel
(Source: photo by the authors, 2012)
Figure 8. Waterproof membrane with no
connection to structural element (Source: photo by
the authors, 2012)
The first thing that can be seen, is the inappropriate
installation of the waterproof membrane (Fig. 8),
which is not glued or connected with another
connection type to the structural elements (at least
on exposed areas). Also in some places the
waterproof membrane is lower than the vegetation
or side border gravel. Another exposed thing that
may not be the best solution is separation between
the growing media and gravel, where for this
function a wooden plank is used, that in 10 years
time would be rotten and in time it would not be
able to normally perform the function it was made
for (Fig.9).
After a visual survey it was concluded that a green
roof performs certain functions and it also is
aesthetically attractive, but expensive too. But if we
leave the construction as it is now and vary only
Figure 9. Wooden separation plank (Source: photo
by the authors, 2012)
with roof covering materials, then the roof cover
should be visually attractive, because it is exposed
and you can see it also really close. It should be
difficult to resist a situation if someone decides to
climb up as it starts directly from ground level. It
should be added that roofing material should be
appropriate - it should not heat up to high
temperatures. The possibility that anyone can burn
any parts of body and also reduce heat coming
directly from cover to the pedestrians should be
excluded. Nowadays, the most popular roof type is
metallic because it is cheap, lightweight, easy to
install and has long life. There are many types of
metallic roofing materials for different type of use
for residential buildings and also for public
buildings with double coating or with more layer
coating. Different profiles and forms are available.
But for this particular situation those materials are
not good enough because of thickness and not so
high scratch resistance. Another option is the usage
of expensive metals, which are also thicker. For that
application suitable materials are copper and
stainless steel. But they are more expensive and also
a little bit heavier (in that case this factor can be
ignored because an intensive green roof is a few
times heavier than metal sheeting roofs). But still it
cannot be ignored that this covering in sunny days
warms reaching high temperatures and causes
discomfort for persons walking near by the roof.
The same situation is in the case of usage of
insulated sandwich panels. An additional value in
comparison with simple roof sheeting is strength
and resistance to external forces. In the category of
soft roofing materials are all materials, which
consist of bitumen or rubber elastic materials.
Those are usually used for flat roofs to avoid
flowing down on impact of the slope and heat. That
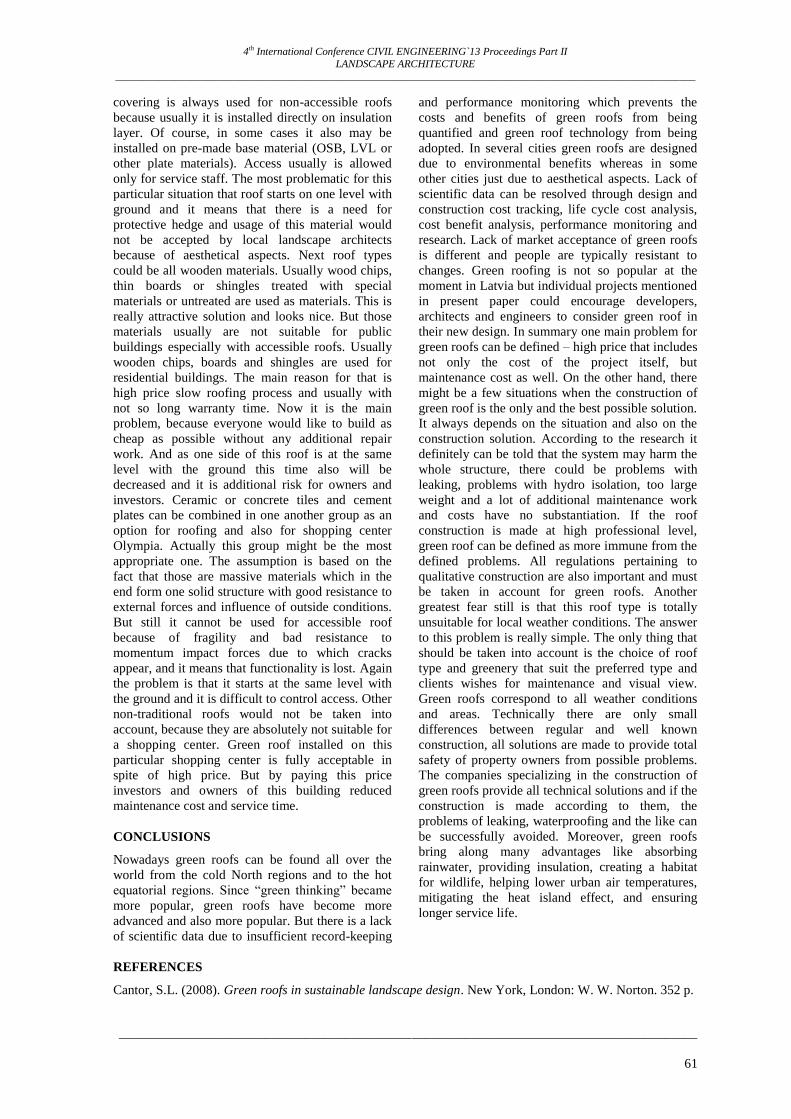
4th International Conference CIVIL ENGINEERING`13 Proceedings Part II
LANDSCAPE ARCHITECTURE
_____________________________________________________________________________________________________________
_______________________________________________________________________________________
61
covering is always used for non-accessible roofs
because usually it is installed directly on insulation
layer. Of course, in some cases it also may be
installed on pre-made base material (OSB, LVL or
other plate materials). Access usually is allowed
only for service staff. The most problematic for this
particular situation that roof starts on one level with
ground and it means that there is a need for
protective hedge and usage of this material would
not be accepted by local landscape architects
because of aesthetical aspects. Next roof types
could be all wooden materials. Usually wood chips,
thin boards or shingles treated with special
materials or untreated are used as materials. This is
really attractive solution and looks nice. But those
materials usually are not suitable for public
buildings especially with accessible roofs. Usually
wooden chips, boards and shingles are used for
residential buildings. The main reason for that is
high price slow roofing process and usually with
not so long warranty time. Now it is the main
problem, because everyone would like to build as
cheap as possible without any additional repair
work. And as one side of this roof is at the same
level with the ground this time also will be
decreased and it is additional risk for owners and
investors. Ceramic or concrete tiles and cement
plates can be combined in one another group as an
option for roofing and also for shopping center
Olympia. Actually this group might be the most
appropriate one. The assumption is based on the
fact that those are massive materials which in the
end form one solid structure with good resistance to
external forces and influence of outside conditions.
But still it cannot be used for accessible roof
because of fragility and bad resistance to
momentum impact forces due to which cracks
appear, and it means that functionality is lost. Again
the problem is that it starts at the same level with
the ground and it is difficult to control access. Other
non-traditional roofs would not be taken into
account, because they are absolutely not suitable for
a shopping center. Green roof installed on this
particular shopping center is fully acceptable in
spite of high price. But by paying this price
investors and owners of this building reduced
maintenance cost and service time.
CONCLUSIONS
Nowadays green roofs can be found all over the
world from the cold North regions and to the hot
equatorial regions. Since “green thinking” became
more popular, green roofs have become more
advanced and also more popular. But there is a lack
of scientific data due to insufficient record-keeping
and performance monitoring which prevents the
costs and benefits of green roofs from being
quantified and green roof technology from being
adopted. In several cities green roofs are designed
due to environmental benefits whereas in some
other cities just due to aesthetical aspects. Lack of
scientific data can be resolved through design and
construction cost tracking, life cycle cost analysis,
cost benefit analysis, performance monitoring and
research. Lack of market acceptance of green roofs
is different and people are typically resistant to
changes. Green roofing is not so popular at the
moment in Latvia but individual projects mentioned
in present paper could encourage developers,
architects and engineers to consider green roof in
their new design. In summary one main problem for
green roofs can be defined – high price that includes
not only the cost of the project itself, but
maintenance cost as well. On the other hand, there
might be a few situations when the construction of
green roof is the only and the best possible solution.
It always depends on the situation and also on the
construction solution. According to the research it
definitely can be told that the system may harm the
whole structure, there could be problems with
leaking, problems with hydro isolation, too large
weight and a lot of additional maintenance work
and costs have no substantiation. If the roof
construction is made at high professional level,
green roof can be defined as more immune from the
defined problems. All regulations pertaining to
qualitative construction are also important and must
be taken in account for green roofs. Another
greatest fear still is that this roof type is totally
unsuitable for local weather conditions. The answer
to this problem is really simple. The only thing that
should be taken into account is the choice of roof
type and greenery that suit the preferred type and
clients wishes for maintenance and visual view.
Green roofs correspond to all weather conditions
and areas. Technically there are only small
differences between regular and well known
construction, all solutions are made to provide total
safety of property owners from possible problems.
The companies specializing in the construction of
green roofs provide all technical solutions and if the
construction is made according to them, the
problems of leaking, waterproofing and the like can
be successfully avoided. Moreover, green roofs
bring along many advantages like absorbing
rainwater, providing insulation, creating a habitat
for wildlife, helping lower urban air temperatures,
mitigating the heat island effect, and ensuring
longer service life.
REFERENCES
Cantor, S.L. (2008). Green roofs in sustainable landscape design. New York, London: W. W. Norton. 352 p.

4th International Conference CIVIL ENGINEERING`13 Proceedings Part II
LANDSCAPE ARCHITECTURE
_____________________________________________________________________________________________________________
_______________________________________________________________________________________
62
Design Considerations for the Implementation of Green Roofs. (2009) [online] Available:
www.metrovancouver.org/buildsmart
Dictionary of Terms. Green roofs plant organization [online] Available:
http://www.greenroofplants.com/green-rooftechnology/ dictionary-of-terms/
Ferguson, J. (2012). Building a Green Roof in Lithuania. Journal of Sustainable Architecture and Civil
Engineering, Vol.1(1), p. 14-19.
Getter K. L., Rowe D. B.(2006). The role of extensive green roofs in sustainable development. HortScience
41(5), p. 1276-1285
Green roof guidelines [online] Available: http://www.greenroofguidelines.co.uk
Greenroofs.com, FAQ’s [online] Available: http://www.greenroofs.com/Greenroofs101/faqs.htm
Green Roofs - Environmental Advantages [online] Available: http://www.livingroofs.org
Jodidio P.(2009). Green architecture now! Taschen GMBH, Cologne, 416 p.
Pastars P. (2013). Green roofs and technical solutions. Reconstruction of Castle in Preili. Diploma project for
obtaining Professional bachelor degree, RTU, 139 p.
Snell C., Callahan T. (2009). Building green: a complete how-to guide to alternative building methods –
earth plaster, straw bale, cordwood, cob, living roofs. New York: Lark Crafts, 615 p.
Smilge S. Stratēģiska kļūda [Strategic mistake]. In: newspaper Diena, 19 December 2002 [online]
Available:http://www.diena.lv/arhivs/strategiska-kluda-11541165?from-full
The history of green roof technology (2006) [online] chttp://www.ifenergy.com/50226711/
the_history_of_green_roof_technology.php
The green roof centre - Benefits of green roofs [online] Available:
http://www.thegreenroofcentre.co.uk/green_ roofs/benifits_of_green_roofs
Vilnitis A. Norvēģijas zaļie jumti [Norwegian green roofs] [online] Available:
http://www.vilnitis.lv/pardomas-un-padomi/norvegijas-zalie-jumti-260.html
Werthmann, C.(2007). Green Roof - A Case Study: Michael Van Valkenburgh Associates Design for the
Headquarters of the American Society of Landscape Architects. Princeton Architectural Press, 160 p.
Zaļais jumts ar bagātīgu augu buķeti [Green roof with rich plant bouquet][online] Available:
http://www.tirailatvijai.lv/raksts/1384

4th International Conference CIVIL ENGINEERING`13 Proceedings Part II
LANDSCAPE ARCHITECTURE
_____________________________________________________________________________________________________________
_______________________________________________________________________________________
63
LANDSCAPING OF SIBERIAN CITIES
Olga Pasko
National Research Tomsk Polytechnic University, Department of General Geology and Land Management
E-mail: [email protected]
ABSRACT
One of the land management tasks is an improvement of natural landscape. It is often performed by means of
decorating urban areas with flowerbeds. As a rule, flowerbeds decorate squares, access roads, objects of
landscaping (gardens, parks, boulevards and woodland parks). They help to regulate transport and
pedestrian movement, and from ecological point of view they improve city environment. The aim of the
research was to identify the most widespread and original types of flowerbeds in Siberia and to specify the
most suitable flower species.
Key words: landscaping, Siberia, city, flower garden.
INTRODUCTION
Traditionally, flowerbeds are created in landscape
or regular style (Downing, 2010). Landscape style
flowerbeds include groups, blocks, mixed borders,
solitaires (single plants), flowering lawns, alpine
gardens. They are created out of perennial plants of
different forms and sizes. Regular style flowerbeds
include geometrical parterres, ridges, borders
(Nehring, 2002). A special group is represented by
modular flowerbeds which are created by using
minor architectural forms and vases, containers or
baskets for plants (Container Gardening). Nearly all
types of flowerbeds are used in Siberian cities
landscaping. As a rule, the central part of the city,
where administrative buildings are situated, is
decorated with parterres that comprise an assembly
of flowerbeds, ridges or borders. Usually, annual
plants are used, such as salvia divinorum, China
aster, Begonia, Iresine, Cineraria, different forms of
Sedum to be used as a background (Pasko, 2012).
MATERIALS AND METHODS
Experiments were conducted in an experimental
area of the Siberian Botanical Garden of Tomsk
State University. It is located in the fifth
agroclimatic region of Tomsk Oblast, refers to the
subtaiga (southern) part of the region and is
characterized as moderately warm and moderately
humid (Evseeva, Romashova, 2011). Winter is long
with an absolute minimum temperature of down to -
58°C. The length of the frost-free period is about
105—125 days. The sum of temperatures above 10°
is 1700°С, the amount of precipitation during the
same period is about 180-240 mm, 350—520 mm
during a year (Agroclimatic resources..., 1975).
According to the Agrometeorological Bulletin from
the Hydrometeocenter of Tomsk Oblast, the average
annual air temperature in the area of the
experiments is 0.6°С. The number of days per year
with temperatures above 5°C is equal to 153, above
10°C - 113, and the sum of temperatures above
10°C reaches 1750°C. The vegetation period is
determined by a stable transition of a daily average
temperature through +5°C, in Tomsk May begins
early. The duration of the warm period with an
average daily temperature >0°C is 185 days, frost-
free period - 95 days (86 - 148 days). The danger of
frost exists until mid-June and increases again from
mid-August. Fluctuations in multiyear average
temperatures in Tomsk region during the summer
months are within 3°C. Autumn and spring on the
contrary are characterized by large amplitude
fluctuations (up to 20—30°С).
The amount of precipitation falling in summer is
relatively significant. The maximum falls in the
summer. The average monthly distribution of
rainfall is as follows: May — 44, June — 70, July
— 75, August — 71 and September — 46 mm. In
early periods of development plants often suffer
from the lack of moisture but in the end – from
over-moistening.
The experimental area of the Siberian Botanical
Garden, where the observation took place, is located
on gray forest medium loamy soils with the content
of humus of about 3-4%, and mobile forms of
phosphorus and potassium about 10.5 mg/100 g of
soil. The soils are characterized by low water and
air permeability and the propensity to crust
formation. The reaction of the soil solution is
slightly acid (5.9-6.0).
The soil was dug, enriched with organic fertilizers
and mulched with sifted peat before sowing the
seeds or planting the flowering plants in the ground.
The first thinning was performed after germination,
the second – after the unfolding of true leaves.
Further care of the plants consisted of timely
weeding, hoeing, and tying up of climbing plants.
At the end of the experiment, the pericarps were
carefully cut and wrapped in paper bags. Ripening
was carried out in a dry warm room for a month.
The plants were threshed. Seeds were cleaned and
put in paper bags, which were stored at a

4th International Conference CIVIL ENGINEERING`13 Proceedings Part II
LANDSCAPE ARCHITECTURE
_____________________________________________________________________________________________________________
_______________________________________________________________________________________
64
temperature of 22-24°С. Then the germination was
determined.
The objects of study were 45 species of annuals
related to five families (Vorontsov, 2011). They
were characterized by a great diversity of habitual
signs, decorative qualities and rates of development:
Summer Pheasant's-eye — Adonis aestivalis L.
(Ranunculaceae), Love-Lies-Bleeding —
Amaranthus caudatus L. (Amaranthaceae), Chinese
Aster— Callistephus chinensis Nees. (Asteraceae),
Spreading Marigold— Tagetes patula L.
(Asteraceae), Viola Wittrock — Viola wittrockiana
Gams. (Violaceae), Treasure Flower — Gazania
splеndens hort. (Asteraceae), Strawflower —
Helychrisum bracteatum (Vent) Willd.
(Asteraceae), Annual Baby's-breath — Gypsophila
elegans Bieb. (Caryophylaceae), Sweet Pea —
Lathyrus odoratus L. (Fabaceae), Rocket Larkspur
— Dеlрhinium Ajacis L. (Ranunculaceae), Tall
Morning Glory — Ipomoea purpurea (L.) Roth.
(Convolvulaceae), Slipper Flower — Calceolaria
hybrida L. (Scrophulariaceae), Elegant Clarkia —
Clarkia elegans Dougl. (Onagraceae), Golden
Tickseed — Coreopsis tinctoria Nutt. (Asteraceae),
Flowering Flax — Linum grandiflorum Desf.
(Linaceae), Garden Nasturtium — Tropaeolum
majus L. (Tropaeolaceae), Scarlet Sage — Salvia
splendens Sello ex Nees (Labiatae), Drummond's
Phlox — Phlox Drummondii Hook.
(Polemoniaceae), Common Zinnia — Zinnia
elegans Jacq. (Asteraceae), California Poppy —
Eschscholzia californica L. (Papaveraceae).
Some species used in the experiment were
represented by the following kinds: Chinese Aster
'Blauer Turm' kind; Spreading Marigold 'Frills'
kind; Sweet Pea 'Spenser' group, 'Ambition' kind;
Garden Nasturtium 'Feuerball' kind; Scarlet Sage
'Scharlach' kind; Drummond's Phlox 'Atropurpurea'
kind; California Poppy 'Mandarin' kind.
Most plants were planted by the non-seedling
method of cultivation. Seedling cultivation was
used for Chinese Aster, Viola Wittrock, Treasure
Flower, Strawflower, Scarlet Sage, and
Drummond's Phlox.
Determination of timing of the onset of
phenological phases and duration of periods of plant
growth and development was carried out according
to traditional methods (Beideman, 1974;
Voroshilov, 1960). In addition, the sum of effective
temperatures (in °C) required for the onset of
budding, flowering, fruiting and seed maturation
phenophases was calculated (Pasko, 1995).
Experiments were carried out in quadruple
repetition in plots of an area of about 10 m2. A
random selection of not less than 20 model plants
from different points of the plot was used to obtain
reliable results. The processing of biometric data
was performed by a standard method (Dospekhov,
1985).
RESULTS AND DISCUSSION
Special attention should be paid to flowerbeds
compositions in the city of Kemerovo (see Figure
2). They combine tricky geometrical forms made
from different color flowers and leaf plants (Sedum,
Iresine, Lobelia, China aster, one year Kochia).
Green sculptures of animals, traditionally created in
Krasnoyarsk and Barnaul can be of great interest. In
Barnaul the streets are decorated with models of a
sitting bear, Ivonna horse, peculiar Russian fairy
tale character Chudo-Yudo-ryba-kit, etc. The
sculptures have steel or wire mesh support frames
filled with soil substrate, where the seeds are
planted. Germinating crop seeds cover the sculpture
surface with a lawn that imitates animal fur. Not far
from the building of the Regional Administration on
a hill, there is a flowerbed clock which looks like a
clock-face, the background and marks are made of
flowers and the moving hands are made of golden
painted metal.
Krasnoyarsk masters are also noted for their
original works. The brand sculptures of the city are
big scale realistic models of elephants, bears and
giraffes, created on bases of stiff support frames
filled with soil substrate and covered with ground
covering plants like bluish Sedum (which imitate
fur and skin) and purple Iresine (eyes, nose, mouth).
Everyone who has visited Krasnoyarsk recollects
containers with big palm trees which decorate
central alleys of the city – those are the presents
from one of the former citizens who moved to
Krasnodar. Tomsk special features are cachepots
with begonias fixed on lamp posts and rectangular
vases on the handrails of street barriers. Lately, in
several places of the city flower “fountains” have
been installed – steel constructions coming out of
the center of the composition and having round
cachepots with flowering plants on ends.
In Tyumen and Tobolsk flowerbed compositions
are diverse. The main accent is made on trimmed
lawns and landscape style flowerbeds, which
harmonize naturally with old churches. In modern
parts of these cities we can point out flower
pyramids 2.5-3.0 m high. They look like square
containers with soil substrate put into one another
and covered with exuberant begonias.
Traditionally, a wide variety of flowerbeds can be
found in Omsk. Among them there are large scale
flowerbeds in parks and small flower compositions
in Japanese, Scandinavian and Russian styles that
attract cafes customers.
The analysis of species and variety diversity of
flowers allows one to conclude that mainly annual
flowers are used for the city landscaping. Perennial
flowers like peonies, roses, irises, tulips, narcissus
bloom impressively in Siberia but for a very short
time. That is why the emphasis is laid on annual
flowers which decorate the environment with bright
colors and diverse forms, create a feeling of an open
air celebration and make the area very attractive.

4th International Conference CIVIL ENGINEERING`13 Proceedings Part II
LANDSCAPE ARCHITECTURE
_____________________________________________________________________________________________________________
_______________________________________________________________________________________
65
According to our data the period of annual flowers
vegetation in open air is limited by 5 months, the
period of flowering – by 2 months (see the figure
3).
The obtained data allowed us to define the most
suitable species for efficient landscaping of Siberian
cities and to widen their range to at least 50 species.
Thus, the current research allowed the authors to
find out species suitable for the creation of
compositions for continuous flowering, species
suitable for field-seed growing, as well as to
consider the most widespread and original types of
flowerbeds in Siberia.
a b
c d
Figure 2. Examples of annual flower plants in landscaping - Siberian cities.
a, b - Krasnoyarsk, с - Tomsk, d - Barnaul (Source: Photo by the author, 2009-2012)

4th International Conference CIVIL ENGINEERING`13 Proceedings Part II
LANDSCAPE ARCHITECTURE _____________________________________________________________________________________________________________
_______________________________________________________________________________________
66
Figure 3. Phenological spectrum of one year flowers development in Tomsk
(as of five years of research by the author)
CONCLUSIONS
The decorative effect of plants is not only restricted
to the non-seedling method. In spite of significant
difference in duration of the initial phases, 46% of
the species are characterized by simultaneous mass
flowering and 38% of them – by almost
simultaneous flowering. The remaining introducents
with a long period of vegetative growth (Treasure
Flower, Giant Blue-Eyed Mary) differ significantly
in terms of flowering. The difference reaches 50
days. It is natural that they can achieve the phase of
mass flowering only with the seedling cultivation
method.
The maximum percentage of annuals with rapid
development was observed in Novosibirsk, the
minimum — in Yakutsk and Tomsk. In Tomsk
plants , which unvaryingly give mature seeds, but
do not complete the life cycle are primarily used for
landscaping. In Irkutsk their use is insignificant.
The difference in species sets of annuals of the third
and fourth groups in the above mentioned
geographic areas is insignificant.
REFERENCES
Container Gardening. A growing revolution [online] [accessed on 10.05.2009.].
http://www.livetogarden.com/planting/container-gardening.aspx
Downing A. (2010). Treatise on the Theory and Practice of Landscape Gardening: adapted to North
America. Dumbarton Oaks reprints and facsimiles in landscape architecture, Vol. 2. Dumbarton Oaks:
Publishing house. 532 p.
Common Zinnia
Drummond's Phlox
Slipper Flower
Summer Pheasant's-eye
Summer Pheasant's-eye
California Poppy
Spreading Marigold
Garden Nasturtium
Flowering Flax
Golden Tickseed
Elegant Clarkia
Tall Morning Glory
Rocket Larkspur
Love-Lies-Bleeding
Annual Baby's-breath
June July August September

4th International Conference CIVIL ENGINEERING`13 Proceedings Part II
LANDSCAPE ARCHITECTURE _____________________________________________________________________________________________________________
_______________________________________________________________________________________
67
Nehring D. (2002). Les projets de jardins de Furtembach l'Ancien. Histoire des jardins de la Renaissance.
Paris : Publishing houseFlammarion. P. 156-158.
Pasko O. (2012). How best to grow annuals in Siberia. Floriculture. No 4. P. 49-53 (русск.).
Evseeva N.S., Romashova T.V. (2011). Dangerous meteorological phenomena as part of natural risk (by the
example of the south of Tomsk Oblast). Tomsk State University Bulletin. No. 353. Tomsk: Tomsk State
University. P. 199-205.
Agroclimatic resources of Tomsk Oblast (1975). – Leningrad: Gidrometeoizdat. 148 p.
Vorontsov V.V. (2011). Illustrated Floris Guide. Moscow: Fiton+ Publishers. 420 p.
Pasko O.А. Annuals morphogenesis. Floriculture. 1995. No. 4 . P. 12—13.
Dospekhov B.А. (1985) Methods of field experience. 5th ed. corr. and add. Moscow: Agropromizdat. 351 p.
4th International Conference CIVIL ENGINEERING`13 Proceedings Part II
ENVIRONMENT AND ENVIRONMENTAL EFFECTS _____________________________________________________________________________________________________________
_______________________________________________________________________________________
68
HIGH STRENGTH WASTEWATER TREATMENT PROCESS SIMULATION
Romans Neilands*, Simona Larsson**, Roberts Neilands***, Boriss Gjunsburgs* **,
Maris Bernats** *, Elina Strade** **
*,**,***,* **, ** *Riga Technical University, Department of Water Engineering and Technology
** **JSC “Grindeks”, Head of Wastewater Treatment Plant
E-mail: *[email protected], **[email protected], ***[email protected],
* **[email protected], ** *[email protected], ** **[email protected]
ABSTRACT
Researchers and engineers are continuously striving to enable quicker and more individualized wastewater
treatment processes control solutions for the development of process models, which is a long procedure with
calibration and validation, and online data supply as they are dynamic systems introducing another level of
sophistication (Sen and Randall, 2008). The existing mathematical wastewater treatment models give a
forecast for treatment results under various flow and pollutant circumstances, but results still are
dissatisfactory due to the changeable dynamics of pollutants, which affects the treatment systems directly.
The investigation was done for an existing pharmaceutical factory wastewater treatment plant with a moving
bed biofilm reactor(MBBR) process, which offers the specific advantages of the biofilm system in the
treatment of high strength wastewater. The basic research was undertaken to verify a model and investigate
the biodegradable and slowly biodegradable COD fraction variations influence on the model’s results.
Key words: Wastewater treatment, process simulation and control, biofilm, fungi.
INTRODUCTION
The objectives of this research were to simulate the
existing pharmaceutical factory (JSC “Grindeks”)
wastewater treatment process using BioWin ASM
2D model, where important process scenarios are
possible to investigate.
The simulation period was 1 year for all the given
scenarios, but the feasibility of the scenarios was
investigated through the impact of high strength
organic loading rates, COD fraction component
conversation and maximum specific substrate
removal rate at temperatures ranging from 28 to 32
°C and flow rates ranging from 10 to 30 m3/h,
which correspond to existing WWTP performances.
Many of the waste streams resulting from the
pharmaceutical factory have high pollutant
strengths and thus are of concern to the
environmental pollution issue. However, this
research concentrated on the wastewater from the
process line (buffer tank) and treated wastewater
effluent to the existing Riga town sewer system,
where they must apply the limits given from local
municipality. The wastewater from the factory is of
particular concern because it contains BOD5
ranging from 1000 to 4 500 mg/l, COD
concentration from 1000 to 10 000 mg/l, and in the
effluent they must reach the 600 mg/l for COD and
500 mg/l for suspended solids, also a limitation for
total nitrogen, phosphorus and another pollutants
exist as well, which time by time create difficulties
for the process stability resulting in the pollutant
concentration limit exceeding in the effluent.
MATERIALS AND METHODS
WWT plant description
The wastewater treatment process consists of the
following main components: buffer tank, five in
series moving bed biofilm reactors (MBBR) with
plastic suspended carriers and finally a flocculation
and flotation unit for suspended solid removal. In a
MBBR process, the biofilm grows on small carrier
elements suspended throughout the liquid in the
reactor.
At the end of the 1980's MBBR biofilm technology
was developed at the Norwegian University of
Science and Technology in Trondheim by professor
Odegaard and coworkers (Odegaard, 2006).
Biofilm carrier elements type K3TM
(AnoxKaldnes)
made of polyethylene, which has a density slightly
less than water and size of 12×25 mm, with a
surface area of 500 m2/m
3. The wastewater from the
factory process line is moved to a buffer tank with a
wet volume of 200 m3. The wastewater is pumped
with frequency controlled pumps to the first
biological reactor. The wet volume of each reactor
is also 200 m3 and all five biological reactors
contain 50% carrier material K3TM
. The flow rates,
temperature, pH and oxygen concentration are
monitored in each reactor separately. The air flow
rate in the reactors can be between 250 – 1000
ENVIRONMENT AND ENVIRONMENTAL EFFECTS
Building and Renovation

4th International Conference CIVIL ENGINEERING`13 Proceedings Part II
ENVIRONMENT AND ENVIRONMENTAL EFFECTS _____________________________________________________________________________________________________________
_______________________________________________________________________________________
69
Nm3/h. In the first reactor MBBR1 most of the
easily degradable organic content will be removed.
In reactor MBBR2 the reduction of larger molecules
and in the third reactor MBBR3 more organic
biological degradation takes place. In the fourth
reactor MBBR4 the nitrification process takes
place, but in the fifth reactor MBBR5 the
denitrification process takes place. The reactor
MBBR5 is equipped with both an aeration system
and a gentle mixer for mixing the suspended
carriers. In the case when the MBBR5 is used as
nitrification stage, the reactor is aerated (Lind et al.,
2009).
BioWin 3.0 simulator model ASM 2D
BioWin is a Microsoft Windows-based wastewater
treatment process simulator used world-wide in the
analysis and design of wastewater treatment plants.
Fig. 1 shows a pharmaceutical factory wastewater
treatment plant system configuration set up in
BioWin accordingly to the existing WWTP (Lind et
al., 2009; Gujer et al., 1995).
Substrate transformation and utilization in the
biofilm processes is more complex than in activated
sludge, therefore a more complex ASM 2D model
was used for the modeling of the MBBR process
(Gujer et al., 1995; Gjunsburgs et al., 2006). This is
principally because of the introduction of diffusion
within the biofilm and also a parallel suspended
growth bacterial activity is taking place (Sen and
Randall, 2008).
To perform the comparative analysis, the model
was mainly aimed at the biological step, where
organic matter and nitrogen removal were
incorporated. Using the BioWin 3.0 simulator model
ASM 2D, the model step in various scenarios, and
COD for high and low load range are presented in
the article. Simulations were performed using the
data from the existing WWTP from the year 2011,
and influent data are presented in Figures 2-3,
effluent data are presented in Fig. 4.
Figure 1. BioWin model WWTP layout
Figure 2. The incoming wastewater flow rate for year 2011 (7 month period)
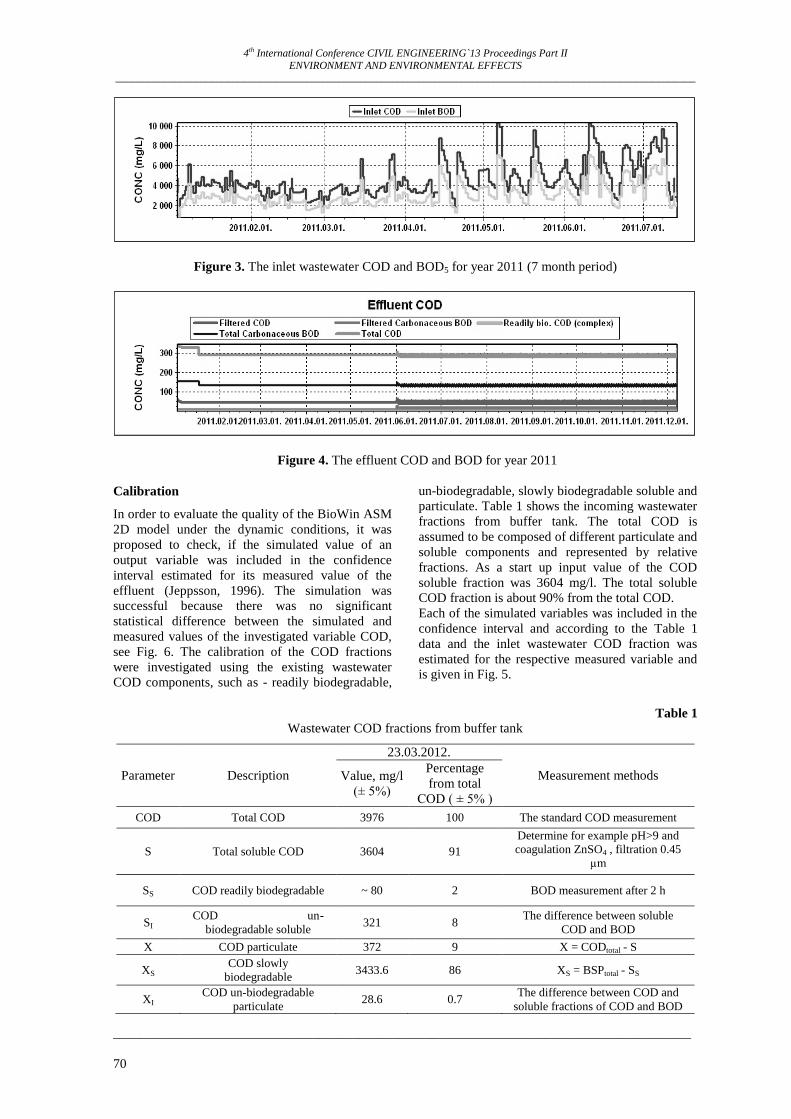
4th International Conference CIVIL ENGINEERING`13 Proceedings Part II
ENVIRONMENT AND ENVIRONMENTAL EFFECTS _____________________________________________________________________________________________________________
_______________________________________________________________________________________
70
Figure 3. The inlet wastewater COD and BOD5 for year 2011 (7 month period)
Figure 4. The effluent COD and BOD for year 2011
Calibration
In order to evaluate the quality of the BioWin ASM
2D model under the dynamic conditions, it was
proposed to check, if the simulated value of an
output variable was included in the confidence
interval estimated for its measured value of the
effluent (Jeppsson, 1996). The simulation was
successful because there was no significant
statistical difference between the simulated and
measured values of the investigated variable COD,
see Fig. 6. The calibration of the COD fractions
were investigated using the existing wastewater
COD components, such as - readily biodegradable,
un-biodegradable, slowly biodegradable soluble and
particulate. Table 1 shows the incoming wastewater
fractions from buffer tank. The total COD is
assumed to be composed of different particulate and
soluble components and represented by relative
fractions. As a start up input value of the COD
soluble fraction was 3604 mg/l. The total soluble
COD fraction is about 90% from the total COD.
Each of the simulated variables was included in the
confidence interval and according to the Table 1
data and the inlet wastewater COD fraction was
estimated for the respective measured variable and
is given in Fig. 5.
Table 1
Wastewater COD fractions from buffer tank
Parameter Description
23.03.2012.
Measurement methods Value, mg/l
(± 5%)
Percentage
from total
COD ( ± 5% )
COD Total COD 3976 100 The standard COD measurement
S Total soluble COD 3604 91
Determine for example pH>9 and
coagulation ZnSO4 , filtration 0.45
µm
SS COD readily biodegradable ~ 80 2 BOD measurement after 2 h
SI COD un-
biodegradable soluble 321 8
The difference between soluble
COD and BOD
X COD particulate 372 9 X = CODtotal - S
XS COD slowly
biodegradable 3433.6 86 XS = BSPtotal - SS
XI COD un-biodegradable
particulate 28.6 0.7
The difference between COD and
soluble fractions of COD and BOD

4th International Conference CIVIL ENGINEERING`13 Proceedings Part II
ENVIRONMENT AND ENVIRONMENTAL EFFECTS _____________________________________________________________________________________________________________
_______________________________________________________________________________________
71
The comparison between measured and model
obtained data for COD and BOD5 values is given in
Fig. 6. The kinetic parameters and biofilm
diffusivity coefficients of the soluble components,
for the first stage of investigation were taken from
references (Gjunsburgs et al., 2006; Lapara, 1998;
Sen and Randall, 2008) for the ASM 2D model and
used for the process simulation in the MBBR for the
existing wastewater treatment plant. The calibration
and validation of the current BioWin model must be
based upon laboratory scale experiments for the
coming investigation stages, but for the start of
investigation, the model behavior has been verified
with available resources from literature
(Tchobanoglous and Burton, 1991; Guisasola et al.,
2003).
Biodegradation with Fungi
The slowly biodegradable COD fraction consists of
different ingredients, where phenol components are
present. The phenol from the biodegradability point
of view can be classified as a slowly biodegradable
fraction of COD (Guisasola et al., 2003; Kekisheva
et al., 2007). Biodegradation of the particular
fraction was also investigated in this model. The
laboratory investigations were performed with the
aim to replace bacteria in one of the MBBR with
fungi.
The slowly biodegradable colloidal and particulate
variation profile is given in Fig. 7.
For determination of treatment efficiency of slowly
degradable substance with fungi (Rancano et al.,
2003; Wesenberg et al., 2003; Majeau et al., 2010),
batch tests of degradation of phenol containing
wastewater was elaborated. Initially 4 fungi stock
cultures were tested, from which Trametes
Versicolor showed most degradation pattern.
Batch tests were performed in a culture medium by
adding phenol wastewater, with a final
concentration of 400 mg/l, and stock culture
(T.versicolor). Experiments were done in 250 ml
flasks containing 100 ml culture medium, 50 ml
citric – phosphate buffer for maintaining a pH of
5.0, 7.5 ml phenol wastewater and 10 ml
(OD=0.700 Abs) stock culture. The stock culture
was inoculated from a liquid medium. Flasks were
placed in an incubator with an orbital shaker at 30 oC temperature and 150 rpm rotation and the pH
(5.0) was controlled manually. Experiments were
done in sterile conditions by autoclaving all
cultures.
Figure 5. The incoming wastewater fractions for BioWin model
Figure 6. The effluent COD and BOD5 value comparison for model and measured data
Figure 7. The slowly biodegradable COD fraction profile for average load scenarios

4th International Conference CIVIL ENGINEERING`13 Proceedings Part II
ENVIRONMENT AND ENVIRONMENTAL EFFECTS _____________________________________________________________________________________________________________
_______________________________________________________________________________________
72
medium, buffers, and flasks prior to adding the
stock culture. Flasks were covered with cotton
corks for aerobic conditions. The duration of the
experiment was 7 days, where samples were taken
on days 0, 1, 2, 3, 5 and 7. All experiments were
performed in 3 repetitions. The culture medium in
experiment, per 100 ml contained: 0.08g KH2PO4,
0.02g K2HPO4, 0.05g MgSO4, 0.50g yeast extract
and 0.03g NH4NO3. Before the experiment, a stock
culture was inoculated from an agar plate in a
growing liquid medium for 7 days. On the final day
all media with formed fungi were homogenized and
added to the experiment flasks. The phenol
concentration was determined with a
spectrophotometer.
RESULTS AND DISCUSSION
Biodegradation with Bacteria
The BioWin model was prepared for twelve
wastewater treatment scenarios, and the simulation
was performed for the following hydraulic load
variations from an average of 10 - 16 m3/h up to
extremely high 21 - 30 m3/h, also the scenarios for
COD load variation was perform for average from
3000 - 6000 mg/l up to extremely high over 9000
mg/l and also for low load range < 1000 mg/l. The
temperature for all simulations was in average range
from 28 to 32 °C, but also the additional scenarios
for extremely high temperature range till 45 °C was
investigated. In this article due to the limits only the
hydraulic flow rate, COD and the biodegradable
and slowly biodegradable COD fraction variation
simulations are presented. For the scenarios with
hydraulic loads increases, there was no significant
influence to the variations on treated wastewater
effluent for COD and BOD values. In this scenario
the temperature was 30 °C and MBBRs process was
capable of producing stable COD removal, still the
oxygen supply rate was in the design range till 1000
Nm3/h, see Figs. 8 and 9.
The decreasing stability was recognized for
temperature 45 °C possible due to high oxygen
uptake rate imposed by high COD consumption
rate, see Figs. 10 and 11.
Figure 8. The Inlet hydraulic flow profile with sharp flow rate increase
Figure 9. The effluent COD variation profile for the scenarios with flowrate increase, for temperature 30 °C
Figure 10. The effluent COD and BOD variation profile for scenarios with flow rate increase,
temperature of 45 °C
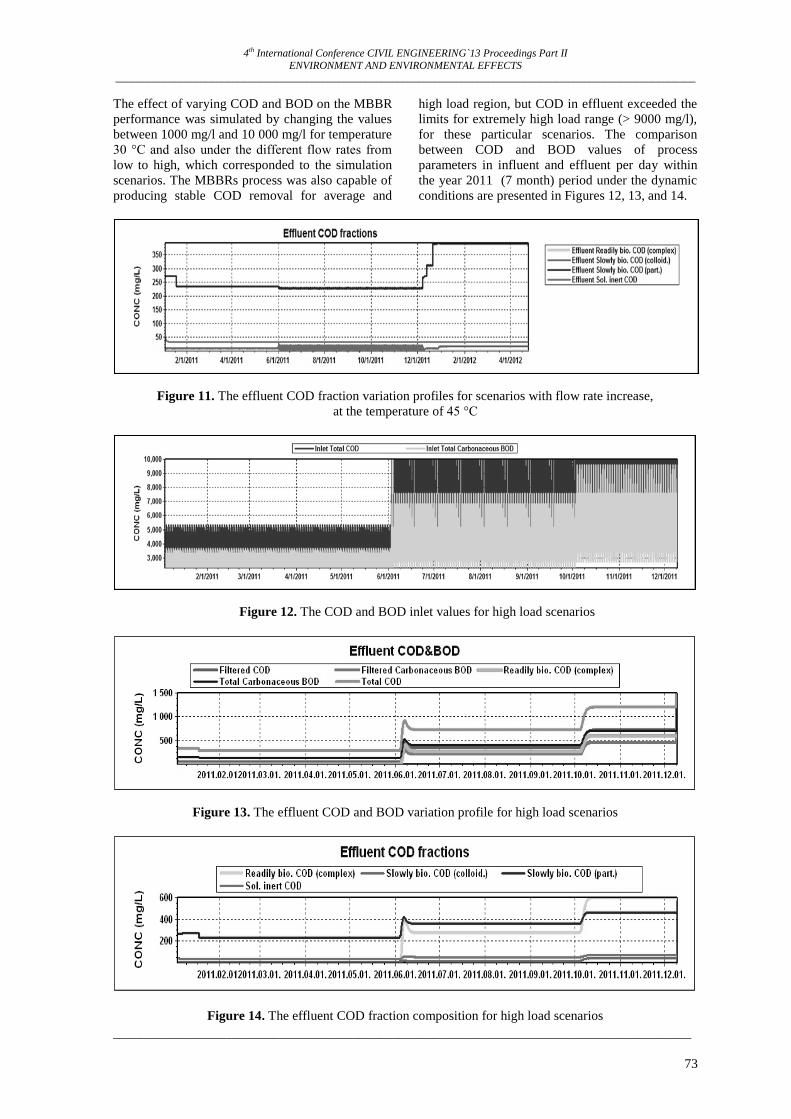
4th International Conference CIVIL ENGINEERING`13 Proceedings Part II
ENVIRONMENT AND ENVIRONMENTAL EFFECTS _____________________________________________________________________________________________________________
_______________________________________________________________________________________
73
The effect of varying COD and BOD on the MBBR
performance was simulated by changing the values
between 1000 mg/l and 10 000 mg/l for temperature
30 °C and also under the different flow rates from
low to high, which corresponded to the simulation
scenarios. The MBBRs process was also capable of
producing stable COD removal for average and
high load region, but COD in effluent exceeded the
limits for extremely high load range (> 9000 mg/l),
for these particular scenarios. The comparison
between COD and BOD values of process
parameters in influent and effluent per day within
the year 2011 (7 month) period under the dynamic
conditions are presented in Figures 12, 13, and 14.
Figure 11. The effluent COD fraction variation profiles for scenarios with flow rate increase,
at the temperature of 45 °C
Figure 12. The COD and BOD inlet values for high load scenarios
Figure 13. The effluent COD and BOD variation profile for high load scenarios
Figure 14. The effluent COD fraction composition for high load scenarios
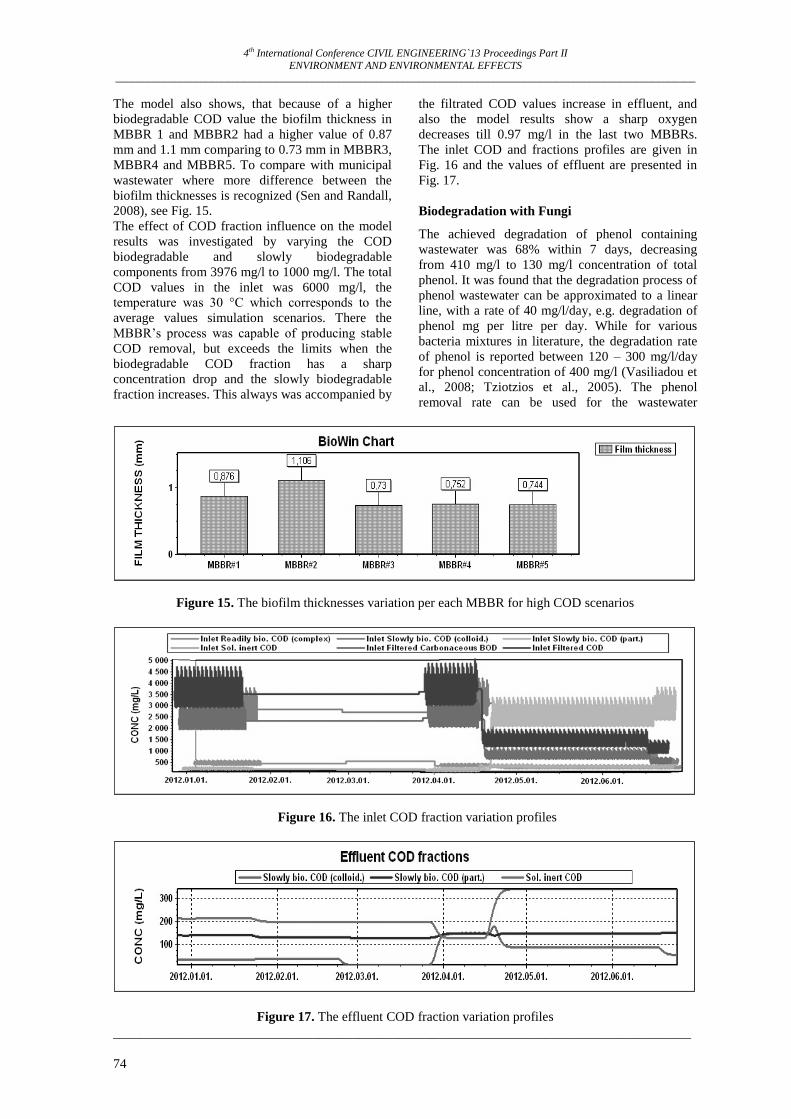
4th International Conference CIVIL ENGINEERING`13 Proceedings Part II
ENVIRONMENT AND ENVIRONMENTAL EFFECTS _____________________________________________________________________________________________________________
_______________________________________________________________________________________
74
The model also shows, that because of a higher
biodegradable COD value the biofilm thickness in
MBBR 1 and MBBR2 had a higher value of 0.87
mm and 1.1 mm comparing to 0.73 mm in MBBR3,
MBBR4 and MBBR5. To compare with municipal
wastewater where more difference between the
biofilm thicknesses is recognized (Sen and Randall,
2008), see Fig. 15.
The effect of COD fraction influence on the model
results was investigated by varying the COD
biodegradable and slowly biodegradable
components from 3976 mg/l to 1000 mg/l. The total
COD values in the inlet was 6000 mg/l, the
temperature was 30 °C which corresponds to the
average values simulation scenarios. There the
MBBR’s process was capable of producing stable
COD removal, but exceeds the limits when the
biodegradable COD fraction has a sharp
concentration drop and the slowly biodegradable
fraction increases. This always was accompanied by
the filtrated COD values increase in effluent, and
also the model results show a sharp oxygen
decreases till 0.97 mg/l in the last two MBBRs.
The inlet COD and fractions profiles are given in
Fig. 16 and the values of effluent are presented in
Fig. 17.
Biodegradation with Fungi
The achieved degradation of phenol containing
wastewater was 68% within 7 days, decreasing
from 410 mg/l to 130 mg/l concentration of total
phenol. It was found that the degradation process of
phenol wastewater can be approximated to a linear
line, with a rate of 40 mg/l/day, e.g. degradation of
phenol mg per litre per day. While for various
bacteria mixtures in literature, the degradation rate
of phenol is reported between 120 – 300 mg/l/day
for phenol concentration of 400 mg/l (Vasiliadou et
al., 2008; Tziotzios et al., 2005). The phenol
removal rate can be used for the wastewater
Figure 15. The biofilm thicknesses variation per each MBBR for high COD scenarios
Figure 16. The inlet COD fraction variation profiles
Figure 17. The effluent COD fraction variation profiles
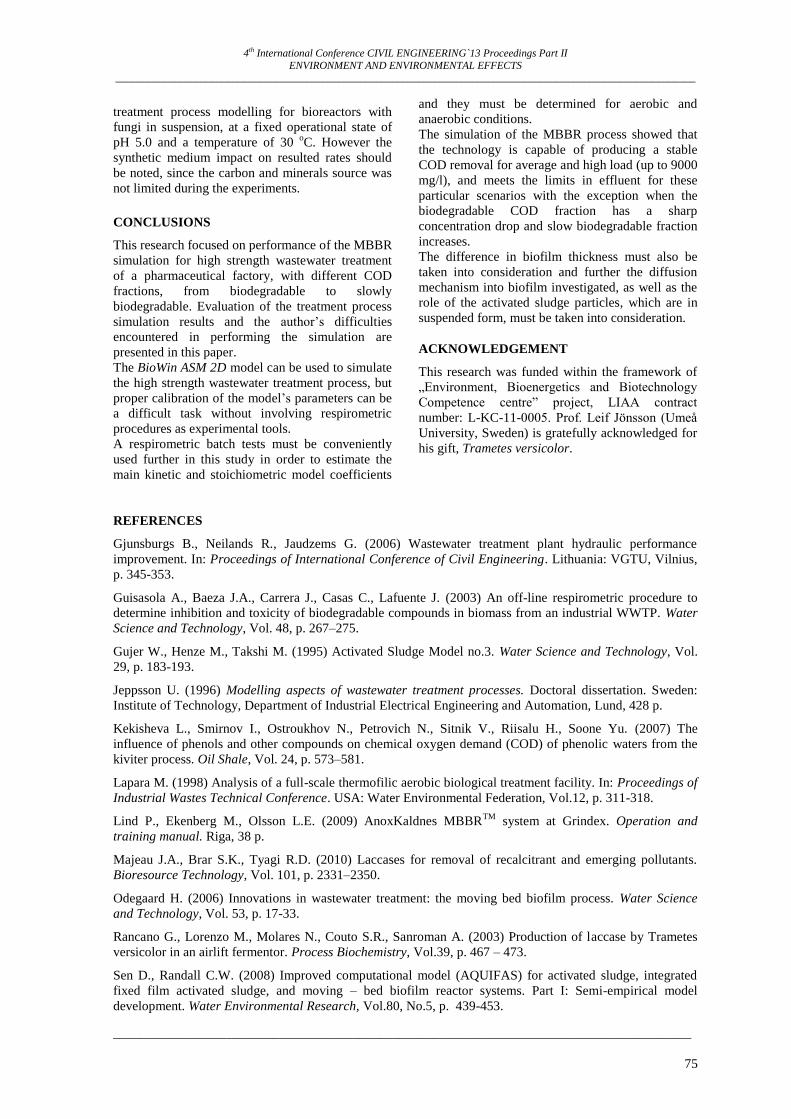
4th International Conference CIVIL ENGINEERING`13 Proceedings Part II
ENVIRONMENT AND ENVIRONMENTAL EFFECTS _____________________________________________________________________________________________________________
_______________________________________________________________________________________
75
treatment process modelling for bioreactors with
fungi in suspension, at a fixed operational state of
pH 5.0 and a temperature of 30 oC. However the
synthetic medium impact on resulted rates should
be noted, since the carbon and minerals source was
not limited during the experiments. CONCLUSIONS
This research focused on performance of the MBBR
simulation for high strength wastewater treatment
of a pharmaceutical factory, with different COD
fractions, from biodegradable to slowly
biodegradable. Evaluation of the treatment process
simulation results and the author’s difficulties
encountered in performing the simulation are
presented in this paper.
The BioWin ASM 2D model can be used to simulate
the high strength wastewater treatment process, but
proper calibration of the model’s parameters can be
a difficult task without involving respirometric
procedures as experimental tools.
A respirometric batch tests must be conveniently
used further in this study in order to estimate the
main kinetic and stoichiometric model coefficients
and they must be determined for aerobic and
anaerobic conditions.
The simulation of the MBBR process showed that
the technology is capable of producing a stable
COD removal for average and high load (up to 9000
mg/l), and meets the limits in effluent for these
particular scenarios with the exception when the
biodegradable COD fraction has a sharp
concentration drop and slow biodegradable fraction
increases.
The difference in biofilm thickness must also be
taken into consideration and further the diffusion
mechanism into biofilm investigated, as well as the
role of the activated sludge particles, which are in
suspended form, must be taken into consideration.
ACKNOWLEDGEMENT
This research was funded within the framework of
„Environment, Bioenergetics and Biotechnology
Competence centre” project, LIAA contract
number: L-KC-11-0005. Prof. Leif Jönsson (Umeå
University, Sweden) is gratefully acknowledged for
his gift, Trametes versicolor.
REFERENCES
Gjunsburgs B., Neilands R., Jaudzems G. (2006) Wastewater treatment plant hydraulic performance
improvement. In: Proceedings of International Conference of Civil Engineering. Lithuania: VGTU, Vilnius,
p. 345-353.
Guisasola A., Baeza J.A., Carrera J., Casas C., Lafuente J. (2003) An off-line respirometric procedure to
determine inhibition and toxicity of biodegradable compounds in biomass from an industrial WWTP. Water
Science and Technology, Vol. 48, p. 267–275.
Gujer W., Henze M., Takshi M. (1995) Activated Sludge Model no.3. Water Science and Technology, Vol.
29, p. 183-193.
Jeppsson U. (1996) Modelling aspects of wastewater treatment processes. Doctoral dissertation. Sweden:
Institute of Technology, Department of Industrial Electrical Engineering and Automation, Lund, 428 p.
Kekisheva L., Smirnov I., Ostroukhov N., Petrovich N., Sitnik V., Riisalu H., Soone Yu. (2007) The
influence of phenols and other compounds on chemical oxygen demand (COD) of phenolic waters from the
kiviter process. Oil Shale, Vol. 24, p. 573–581.
Lapara M. (1998) Analysis of a full-scale thermofilic aerobic biological treatment facility. In: Proceedings of
Industrial Wastes Technical Conference. USA: Water Environmental Federation, Vol.12, p. 311-318.
Lind P., Ekenberg M., Olsson L.E. (2009) AnoxKaldnes MBBRTM
system at Grindex. Operation and
training manual. Riga, 38 p.
Majeau J.A., Brar S.K., Tyagi R.D. (2010) Laccases for removal of recalcitrant and emerging pollutants.
Bioresource Technology, Vol. 101, p. 2331–2350.
Odegaard H. (2006) Innovations in wastewater treatment: the moving bed biofilm process. Water Science
and Technology, Vol. 53, p. 17-33.
Rancano G., Lorenzo M., Molares N., Couto S.R., Sanroman A. (2003) Production of laccase by Trametes
versicolor in an airlift fermentor. Process Biochemistry, Vol.39, p. 467 – 473.
Sen D., Randall C.W. (2008) Improved computational model (AQUIFAS) for activated sludge, integrated
fixed film activated sludge, and moving – bed biofilm reactor systems. Part I: Semi-empirical model
development. Water Environmental Research, Vol.80, No.5, p. 439-453.

4th International Conference CIVIL ENGINEERING`13 Proceedings Part II
ENVIRONMENT AND ENVIRONMENTAL EFFECTS _____________________________________________________________________________________________________________
_______________________________________________________________________________________
76
Tchobanoglous G., Burton F.L. (1991) Wastewater engineering: treatment, disposal and reuse. 3rd
Ed.
Metcalf & Eddy Inc: McGraw Hill, 1334 p.
Tziotzios G., Teliou M., Kaltsouni V., Lyberatos G., Vayenas D.V. (2005) Biological phenol removal using
suspended growth and packed bed reactors. Biochemical Engineering Journal, Vol. 26, p. 65–71.
Vasiliadou I.A., Tziotzios G., Vayenas D.V. (2008) A kinetic study of combined aerobic biological phenol
and nitrate removal in batch suspended growth cultures. International Biodeterioration & Biodegradation,
Vol. 61, p.261–271.
Wesenberg D., Kyriakides I., Agathos S.N. (2003) White-rot fungi and their enzymes for the treatment of
industrial dye effluents. Biotechnology Advances, Vol. 22, p. 161 – 187.

4th International Conference CIVIL ENGINEERING`13 Proceedings Part II
ENVIRONMENT AND ENVIRONMENTAL EFFECTS _____________________________________________________________________________________________________________
_______________________________________________________________________________________
77
PREPARATION OF COAL-WATER SLURRY USING A HIGH-SPEED
MIXER-DISPERSER
Aleksandrs Polyakovs
Corvus Company Ltd.
e-mail: [email protected]
Viktors Mironovs
Riga Technical University, Faculty of Civil Engineering,
Laboratory of Powder Materials.
e-mail: [email protected]
Aleksandrs Korjakins
Riga Technical University, Faculty of Civil Engineering,
Chair of Building materials and Products
e-mail: [email protected]
Andrej Shishkin
Riga Technical University, Faculty of Civil Engineering
e-mail: [email protected]
Janis Baronins
Riga Technical University, Faculty of Civil Engineering
e-mail: [email protected]
ABSTRACT
The present article describes a method of preparation coal-water slurry using a high speed mixer-disperser
(HSMD).The method is based on the multiple impacts in a liquid media by dispersing elements in the
appearance of cavitation effects. Considering the design features of a high-speed mixer-disperser it was
found that the processing of coal-water slurry increases their stability due to particle size deceasing.
Key words: mixer-disperser, cavitation, water-coal slurry, water-coal fuel.
INTRODUCTION
Water-coal slurry (WCS) technology was developed
during the worldwide oil crisis of the 1970’s to
produce a novel and clean fluid fuel as a substitute
for petroleum. The slurry is prepared as a mixture
of 60–70% fine coal, 29–39% water, and about 1%
additives (dispersants involved) determined
specifically for each different type of coal (Yun et
al., 2011),(Zhu et al., 2012). Creation of fine WCS
during mixing is difficult because of bad
distribution of coal particles in water. To solve this
problem, special surfactants (Zhou et al.,
2007),(Zhou et al., 2012), various mixers and
disperser are used, for example, the propeller
mixers, rotary pulsation devices, etc. (Sidenko,
1977). In works (Knapp et al., 1970), (Polyakov et
al., 2008) it is found that with increasing the speed
disperser elements can have simultaneously
occurring effects as high-speed shock wave,
ultrasonic vibration, cavitation process and as a
result hydraulic impacts in a liquid medium.
The particular interest is in the cavitation process -
generation in fluid cavitation bubbles (cavities) by
local reduction of pressure in the fluid. In the initial
phase of fluid cavitation small size bubbles are
allocated. When cavities get to the area of high
pressure, the steam bubbles collapse. Thus, there is
a hydraulic shock (Knapp et al., 1970). Destruction
of cavitation bubbles generates shock waves that
destroy firm particles and mix them, forming thus a
stable suspension. Kinetic stability in dispersed systems, ability of a
dispersed system to maintain an even distribution of
particles throughout the entire volume of the
dispersed phase, are characterized by the Stokes'
law. The Stokes' law is derived by solving the
Stokes’ flow limit for small Reynold numbers of the
Navier–Stokes’ equations number (1) (Batchelor,
1967).
6d sF Rv (1)
where:
Fd – frictional force – known as Stokes' drag –
acting on the interface between the fluid and the
particle (N),
μ – dynamic viscosity (N s/m2),
R – radius of the spherical object (m)
vs – particle settling velocity (m/s).
If the particles are falling in the viscous fluid by
their own weight due to gravity, then a terminal
velocity, also known as the settling velocity, is
reached when this frictional force combined with
the buoyant force exactly balances the gravitational
force. The resulting settling velocity (or terminal
velocity) is given by (Venkatalaxmi et al., 2004)
equation number (2):
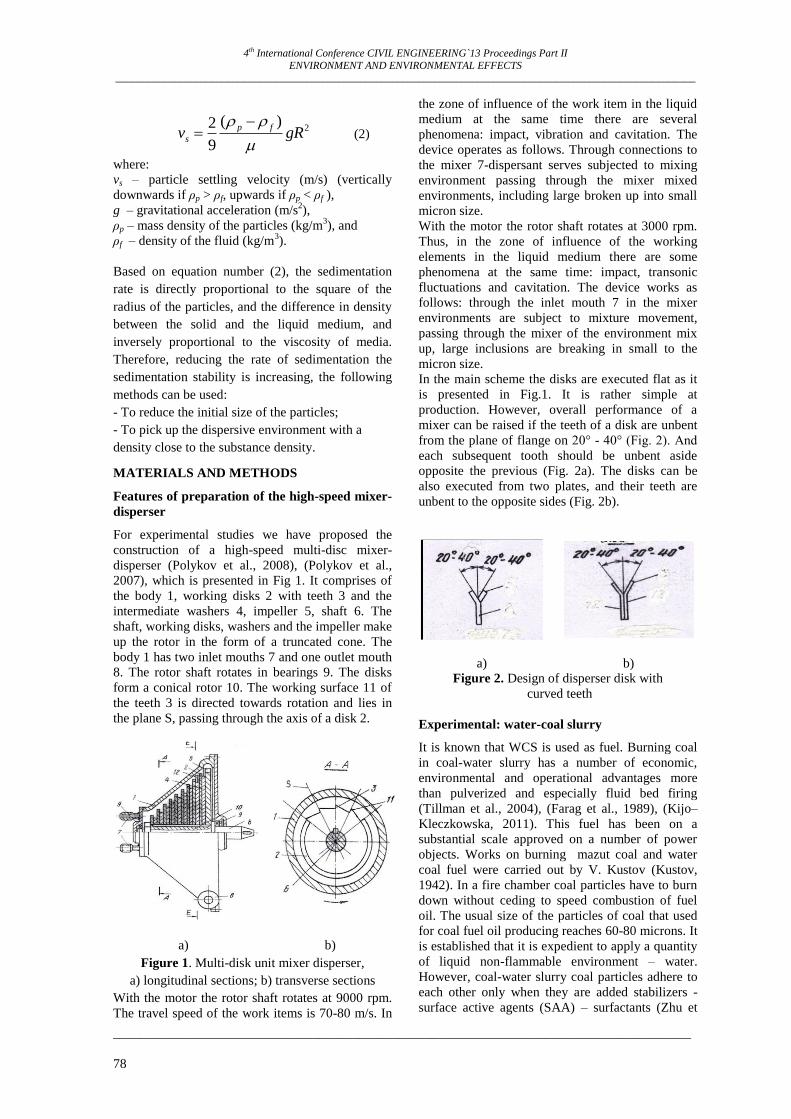
4th International Conference CIVIL ENGINEERING`13 Proceedings Part II
ENVIRONMENT AND ENVIRONMENTAL EFFECTS _____________________________________________________________________________________________________________
_______________________________________________________________________________________
78
2
( )2
9
p f
sv gR
(2)
where:
vs – particle settling velocity (m/s) (vertically
downwards if ρp > ρf, upwards if ρp < ρf ),
g – gravitational acceleration (m/s2),
ρp – mass density of the particles (kg/m3), and
ρf – density of the fluid (kg/m3).
Based on equation number (2), the sedimentation
rate is directly proportional to the square of the
radius of the particles, and the difference in density
between the solid and the liquid medium, and
inversely proportional to the viscosity of media.
Therefore, reducing the rate of sedimentation the
sedimentation stability is increasing, the following
methods can be used:
- To reduce the initial size of the particles;
- To pick up the dispersive environment with a
density close to the substance density.
MATERIALS AND METHODS
Features of preparation of the high-speed mixer-
disperser
For experimental studies we have proposed the
construction of a high-speed multi-disc mixer-
disperser (Polykov et al., 2008), (Polykov et al.,
2007), which is presented in Fig 1. It comprises of
the body 1, working disks 2 with teeth 3 and the
intermediate washers 4, impeller 5, shaft 6. The
shaft, working disks, washers and the impeller make
up the rotor in the form of a truncated cone. The
body 1 has two inlet mouths 7 and one outlet mouth
8. The rotor shaft rotates in bearings 9. The disks
form a conical rotor 10. The working surface 11 of
the teeth 3 is directed towards rotation and lies in
the plane S, passing through the axis of a disk 2.
a) b)
Figure 1. Multi-disk unit mixer disperser,
a) longitudinal sections; b) transverse sections
With the motor the rotor shaft rotates at 9000 rpm.
The travel speed of the work items is 70-80 m/s. In
the zone of influence of the work item in the liquid
medium at the same time there are several
phenomena: impact, vibration and cavitation. The
device operates as follows. Through connections to
the mixer 7-dispersant serves subjected to mixing
environment passing through the mixer mixed
environments, including large broken up into small
micron size.
With the motor the rotor shaft rotates at 3000 rpm.
Thus, in the zone of influence of the working
elements in the liquid medium there are some
phenomena at the same time: impact, transonic
fluctuations and cavitation. The device works as
follows: through the inlet mouth 7 in the mixer
environments are subject to mixture movement,
passing through the mixer of the environment mix
up, large inclusions are breaking in small to the
micron size.
In the main scheme the disks are executed flat as it
is presented in Fig.1. It is rather simple at
production. However, overall performance of a
mixer can be raised if the teeth of a disk are unbent
from the plane of flange on 20° - 40° (Fig. 2). And
each subsequent tooth should be unbent aside
opposite the previous (Fig. 2a). The disks can be
also executed from two plates, and their teeth are
unbent to the opposite sides (Fig. 2b).
a) b) Figure 2. Design of disperser disk with
curved teeth
Experimental: water-coal slurry
It is known that WCS is used as fuel. Burning coal
in coal-water slurry has a number of economic,
environmental and operational advantages more
than pulverized and especially fluid bed firing
(Tillman et al., 2004), (Farag et al., 1989), (Kijo–
Kleczkowska, 2011). This fuel has been on a
substantial scale approved on a number of power
objects. Works on burning mazut coal and water
coal fuel were carried out by V. Kustov (Kustov,
1942). In a fire chamber coal particles have to burn
down without ceding to speed combustion of fuel
oil. The usual size of the particles of coal that used
for coal fuel oil producing reaches 60-80 microns. It
is established that it is expedient to apply a quantity
of liquid non-flammable environment – water.
However, coal-water slurry coal particles adhere to
each other only when they are added stabilizers -
surface active agents (SAA) – surfactants (Zhu et
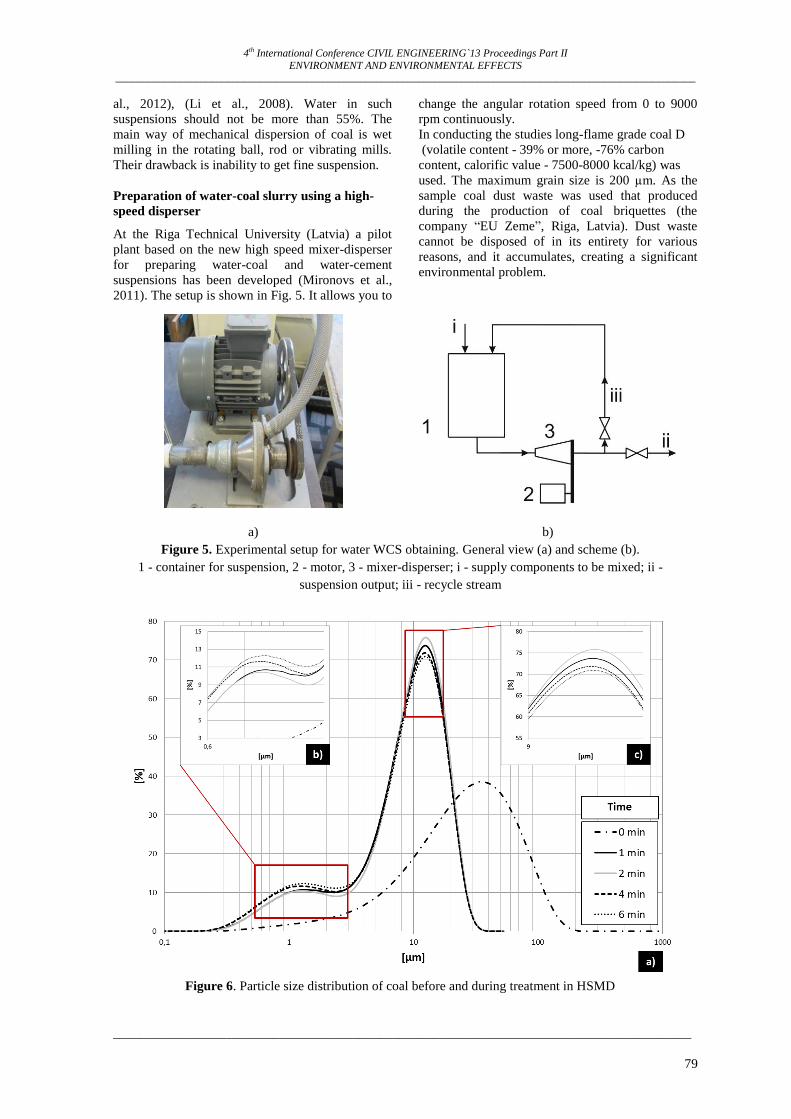
4th International Conference CIVIL ENGINEERING`13 Proceedings Part II
ENVIRONMENT AND ENVIRONMENTAL EFFECTS _____________________________________________________________________________________________________________
_______________________________________________________________________________________
79
al., 2012), (Li et al., 2008). Water in such
suspensions should not be more than 55%. The
main way of mechanical dispersion of coal is wet
milling in the rotating ball, rod or vibrating mills.
Their drawback is inability to get fine suspension.
Preparation of water-coal slurry using a high-
speed disperser
At the Riga Technical University (Latvia) a pilot
plant based on the new high speed mixer-disperser
for preparing water-coal and water-cement
suspensions has been developed (Mironovs et al.,
2011). The setup is shown in Fig. 5. It allows you to
change the angular rotation speed from 0 to 9000
rpm continuously.
In conducting the studies long-flame grade coal D
(volatile content - 39% or more, -76% carbon
content, calorific value - 7500-8000 kcal/kg) was
used. The maximum grain size is 200 µm. As the
sample coal dust waste was used that produced
during the production of coal briquettes (the
company “EU Zeme”, Riga, Latvia). Dust waste
cannot be disposed of in its entirety for various
reasons, and it accumulates, creating a significant
environmental problem.
a) b)
Figure 5. Experimental setup for water WCS obtaining. General view (a) and scheme (b).
1 - container for suspension, 2 - motor, 3 - mixer-disperser; i - supply components to be mixed; ii -
suspension output; iii - recycle stream
Figure 6. Particle size distribution of coal before and during treatment in HSMD

4th International Conference CIVIL ENGINEERING`13 Proceedings Part II
ENVIRONMENT AND ENVIRONMENTAL EFFECTS _____________________________________________________________________________________________________________
_______________________________________________________________________________________
80
Dust-like coal waste is mixed with water and a
surfactant in a ratio of: coal - 750.0 g, water -
1000.0 g, surfactant ((-)-Ethyl l-lactate by Fluka
(now Sigma-Aldrich)) - 1.50 ml, till smooth. The
received mass was poured into the container (1) for
suspension of the high-speed mixer-disperser (3),
given to rotation by the electric motor (2) Fig. 5(b).
Treatment in high-speed mixer-disperser was
carried out for 1 to 6 minutes at 9000 rpm of the
rotor. During the process of dispersing (6 min), the
temperature of the suspension increased from 17°C
to 35°C.
Particle size distribution analysis
The size of the particles of coal after their
processing in the disperser was defined by the
method of granulometric laser diffraction on the
device Analysette 22 Nano Tec (FRITSCH GmbH).
The following parameters are used during the
measurements.
Figure 7. High-speed mixer-disperser DRS10
(capacity -10 m3/h, pressure - 0.2 MPa, motor
power - 5,5 kW)
Measured media: distilled and deionized water
(light refractive index: 1.3312). Optical properties:
light reflection coefficient 1.8, the absorption
coefficient 0.5 (both factors are taken due to that
more exact values are not known), unless otherwise
indicated. Ultrasound: is off. Water pump power:
30%. Direct laser beam hidden by 7 - 13%. The
method of calculation: very broad. The measured
particle size range: 0.1 to 50 µm.
RESULTS AND DISCUSSION
The resulting suspension remains stable for 4 days.
During dispersing probes of WCS for particle size
distribution are taken on 1-th, 2-d, 4-th, 6-th
minutes. The results are presented in Fig. 6, which
shows the curves of the particle size distribution: at
baseline (0 minutes) and after treatment.
As seen in Fig. 6, after 1 min of treatment in HSMD
the particle size decreases significantly: from one
particle mode d50=25 µm 2 modes d50=13 µm and
d50=1.3 µm are formed. This fraction is almost
absent in the source material. Apparently, this is the
maximum possible range of grinding particles of
coal, which provides the used mixer-disperser at the
noted above conditions (rotation speed, water-coal
rate, type of coal). The increase the dispersion time
from 1 minute to 2 gives a small (from 73% to
76%) growth in the fraction d50=13 µm. Due to
increased processing time, the mode of d50=13 µm
reduced (Fig. 6 (b)), but the mode with d50=1.3 µm
increased, (Fig. 6 (c)). It can be concluded that
long-term (more than 2 min) treatment is not
practical because it does not contribute to the
further significant refinement of the material.
The firm CORVUS Company (Latvia) started
production of a high-speed mixer-disperser DRS10,
which is shown in Fig. 7.
CONCLUSIONS
Using of the high-speed mixer-disperser stable
water coal suspension with considerable fineness
coal particles is prepared that will allow to increase
the quality of burning water coal fuels in industrial
boiler rooms and improve ecology in places of
overload of coal.
Increasing processing time in HSMD more than for
2 min treatment is not practical, because it does not
contribute to the further significant refinement of
the material.
Coal dust short-time processing time for WCF
obtaining is prospective for this technology in
future implementation on commercial scale.
Increase a temperature of the environment during of
preparation of water coal suspension evidences
existence of the cavitation effect during the
disperser work.
REFERENCES
Batchelor, G K. (1967) An Introduction to Fluid Dynamics. Cambridge: Cambridge University Press. 615 p.
Farag, Ihab H. and Joseph L. V. (1989) Heat Transfer in Gas Turbine Combustor Fueled with Coal-water
Mixture. International Communications in Heat and Mass Transfer, Vol.16, No.1, p. 31–41.
Kijo–Kleczkowska, A. (2011) Combustion of Coal–water Suspensions. Fuel, Vol. 90 No. 2, p. 865–877.
Knapp, R.T, Daily J.W., and Hammitt F.G. (1970) Cavitation. New York: McGrau-Hill Book Company.
Kustov, K. (1942) Toplivnije Suspenzii [in Russan]. M.L.: Publishing House of the Academy of Sciences of
the USSR. p 182.

4th International Conference CIVIL ENGINEERING`13 Proceedings Part II
ENVIRONMENT AND ENVIRONMENTAL EFFECTS _____________________________________________________________________________________________________________
_______________________________________________________________________________________
81
Li, Peng-Wei, Dong-jie Yang, Hong-ming Lou, and Xue-qing Qiu (2008) Study on the Stability of Coal
Water Slurry Using Dispersion-stability Analyzer. Journal of Fuel Chemistry and Technology Vol.36, No. 5,
p. 524–529.
Mironovs, V., Polykov A. and Korjakins A. (2011) A Method and Facility for Preparation of Suspensions.
Patent Nr. LV14364B
Polyakov, A. and Polyakova E. (2008). Mixer-Disperser. Patent Nr. DE202007014913
Polykov, A. and Polykova E. (2007). Mixer-Disperser, Patent Nr.LV 13592B
Sidenko, P. (1977) Size Reduction in the Chemical Industry [in Russian].” Khimiya: p. 26–40.
Tillman, D. A, and Stanley H. N. (2004) Chapter 3 In: Coal-water Slurries and Related Waste Coal
Opportunity Fuels BT - Fuels of Opportunity. Oxford: Elsevier. p. 89–127
Venkatalaxmi, A., Padmavathi B. S. and Amaranath T. (2004) A General Solution of Unsteady Stokes
Equations. Fluid Dynamics Research, Vol.35, No. 3, p.229–236.
Yun, Zengjie, Guoguang Wu, Xianliang Meng, Yuliang Zhang, Frank Shi, Yaqun He, and Xiaoqiang Luo
(2011) A Comparative Investigation of the Properties of Coal–water Slurries Prepared from Australia and
Shenhua Coals. Mining Science and Technology, Vol.21, No. 3, p.343–347.
Zhou, Mingsong, Kai Huang, Dongjie Yang, and Xueqing Qiu (2012) Development and Evaluation of
Polycarboxylic Acid Hyper-dispersant Used to Prepare High-concentrated Coal–water Slurry. Powder
Technology, Vol.229, No. 0, p.185–190.
Zhou, Mingsong, Xueqing Qiu, Dongjie Yang, and Weixing Wang (2007) Synthesis and Evaluation of
Sulphonated Acetone–formaldehyde Resin Applied as Dispersant of Coal–water Slurry. Energy Conversion
and Management, Vol.48, No. 1, p.204–209.
Zhu, Junfeng, Guanghua Zhang, Zhuo Miao, and Ting Shang (2012) Synthesis and Performance of a
Comblike Amphoteric Polycarboxylate Dispersant for Coal–water Slurry. Colloids and Surfaces A:
Physicochemical and Engineering Aspects, Vol.412, p.101–107.