classical sabermetrics vs. formal statistical inference: towards a
TRANSCRIPT
Classical Sabermetrics vs.
Formal Statistical Inference:
Towards a Unified Approach to
Quantitative Baseball Research
Patrick Kilgo, Brian Schmotzer, Hillary Superak, Paul Weiss, Jeff Switchenko, Lisa Elon, Jason Lee, and Lance Waller

Baseball Research
• Anyone can do baseball research
▫ Publicly available datasets
▫ Lots of support within the sabermetric community
• Traditionally, baseball enthusiasts (and not insiders) have made the largest contributions to sabermetrics
• No other business sector has ever been more influenced by outsiders and laymen than has baseball research
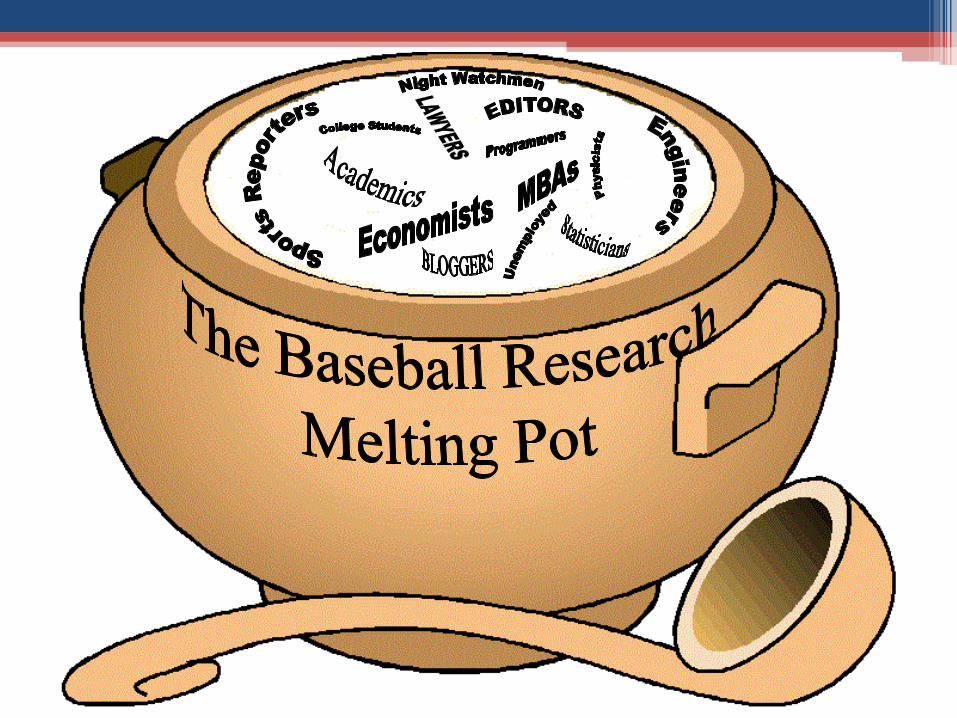

Different Perspectives
With so many people from such a variety of backgrounds, tensions were bound to arise…

Turf War Ideologies
• All the work generated by the “melting pot” can be categorized into one of two general areas:
▫ Classical Sabermetrics
▫ Formal Statistical Inference
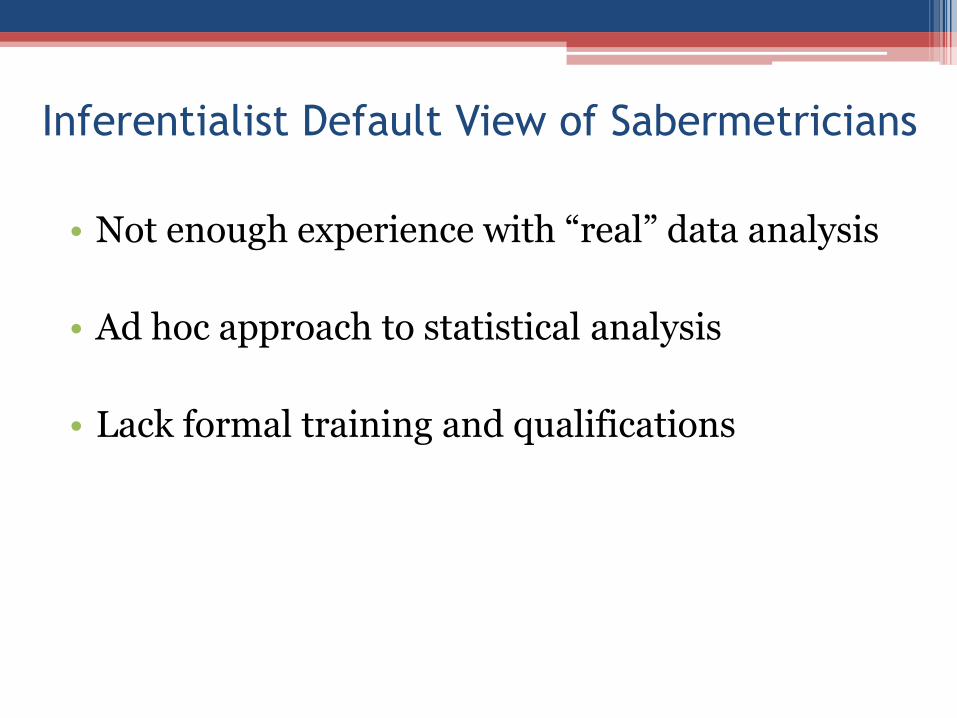
Inferentialist Default View of Sabermetricians
• Not enough experience with “real” data analysis
• Ad hoc approach to statistical analysis
• Lack formal training and qualifications
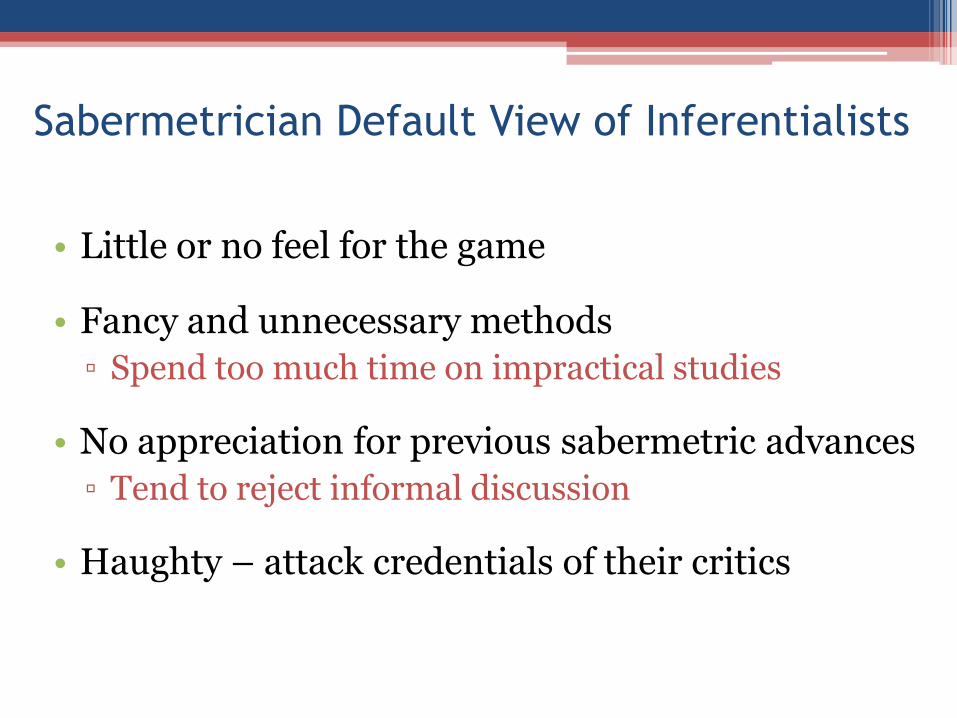
Sabermetrician Default View of Inferentialists
• Little or no feel for the game
• Fancy and unnecessary methods
▫ Spend too much time on impractical studies
• No appreciation for previous sabermetric advances
▫ Tend to reject informal discussion
• Haughty – attack credentials of their critics
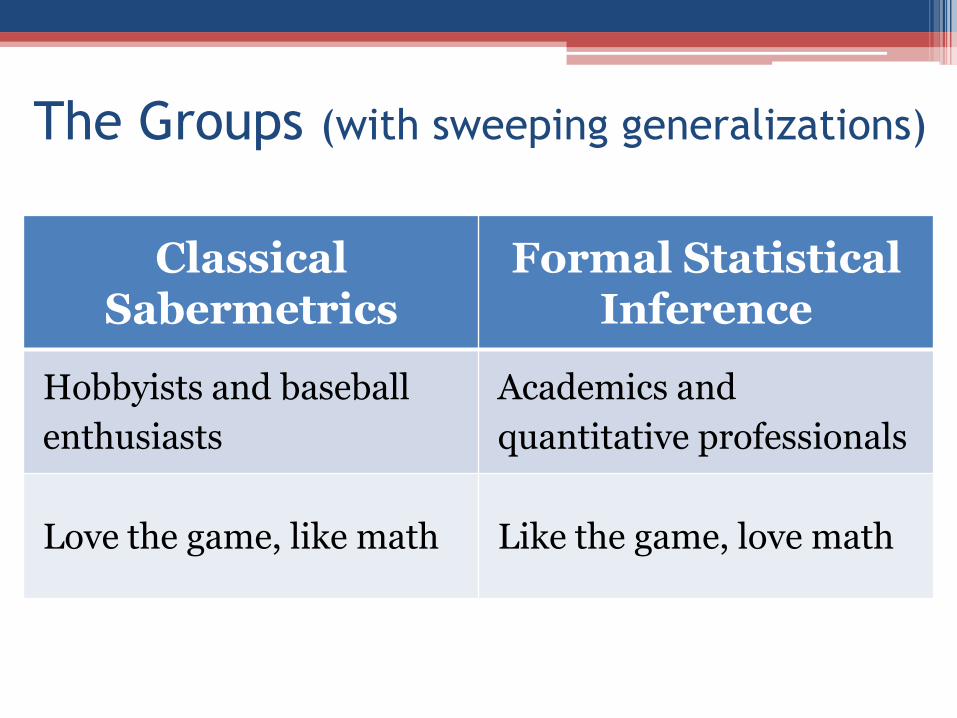
The Groups (with sweeping generalizations)
Classical Sabermetrics
Formal Statistical Inference
Hobbyists and baseball
enthusiasts
Academics and
quantitative professionals
Love the game, like math Like the game, love math
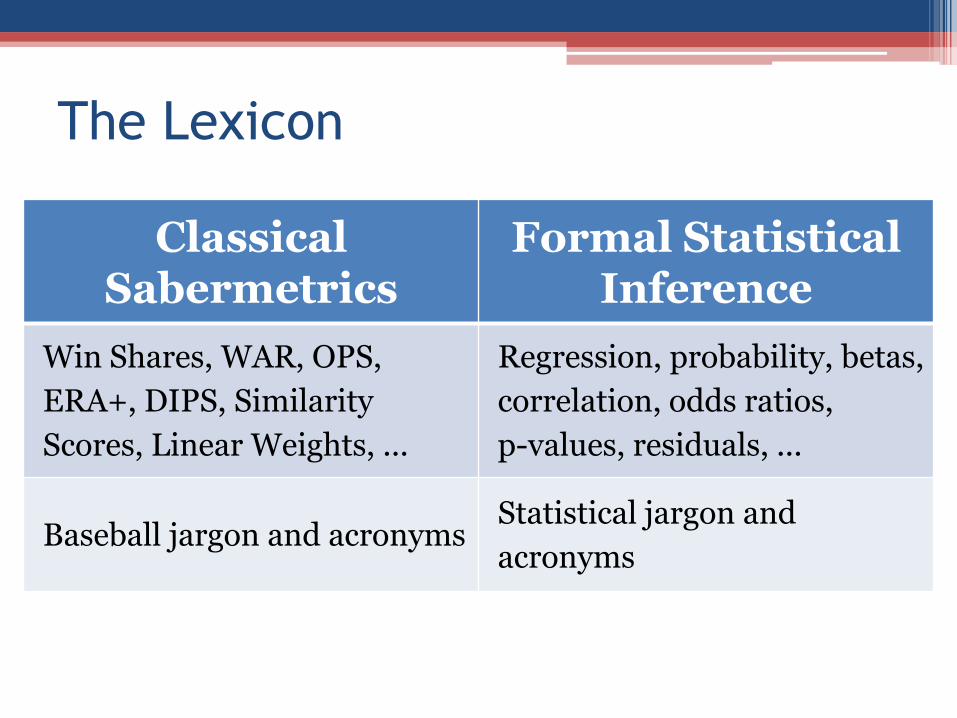
The Lexicon
Classical Sabermetrics
Formal Statistical Inference
Win Shares, WAR, OPS,
ERA+, DIPS, Similarity
Scores, Linear Weights, ...
Regression, probability, betas,
correlation, odds ratios,
p-values, residuals, ...
Baseball jargon and acronymsStatistical jargon and
acronyms
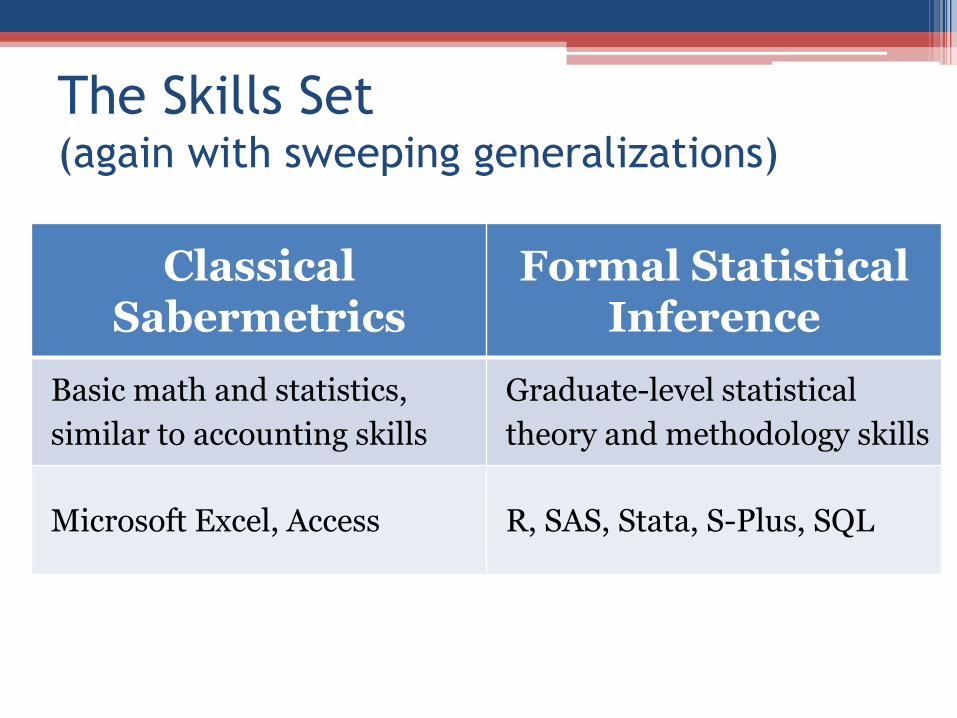
The Skills Set (again with sweeping generalizations)
Classical Sabermetrics
Formal Statistical Inference
Basic math and statistics,
similar to accounting skills
Graduate-level statistical
theory and methodology skills
Microsoft Excel, Access R, SAS, Stata, S-Plus, SQL
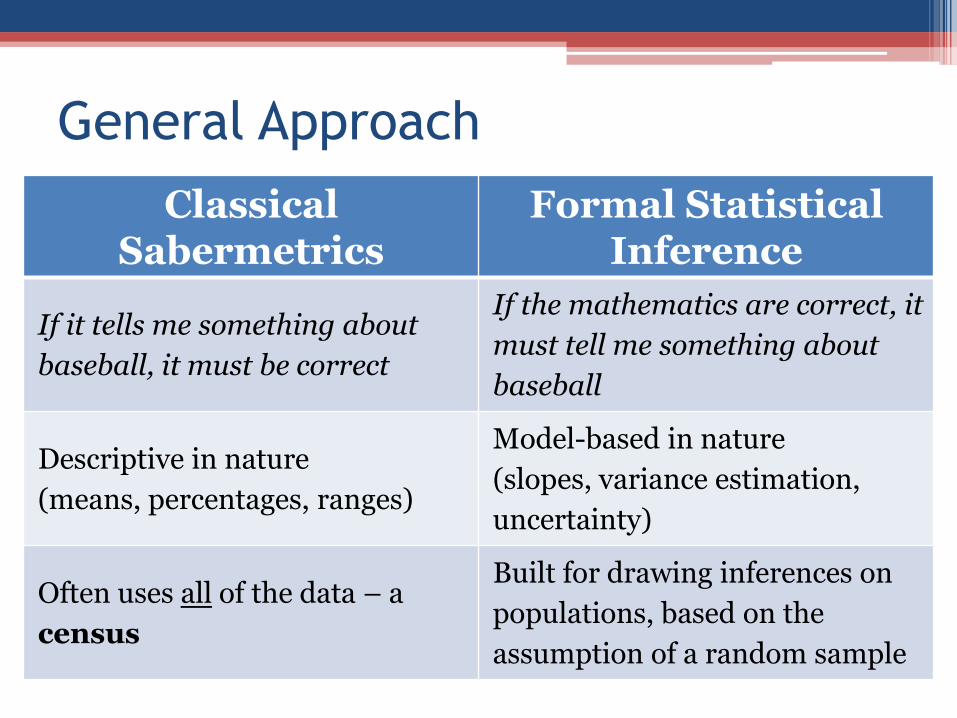
General Approach
Classical Sabermetrics
Formal Statistical Inference
If it tells me something about
baseball, it must be correct
If the mathematics are correct, it
must tell me something about
baseball
Descriptive in nature
(means, percentages, ranges)
Model-based in nature
(slopes, variance estimation,
uncertainty)
Often uses all of the data – a
census
Built for drawing inferences on
populations, based on the
assumption of a random sample

General Approach, Part 2
Classical Sabermetrics
Formal Statistical Inference
Trial and error Pre-hoc decision-making
Emphasis on comparative
analysis between units –
teams, players, leagues, eras, …
Emphasis on analysis of effects –
the DH, steroids, weather, …
No assumptions about
underlying data structures
Lots of assumptions about
underlying data structures
Limited ability to address
confounding effects
Can “easily” account for
confounding effects
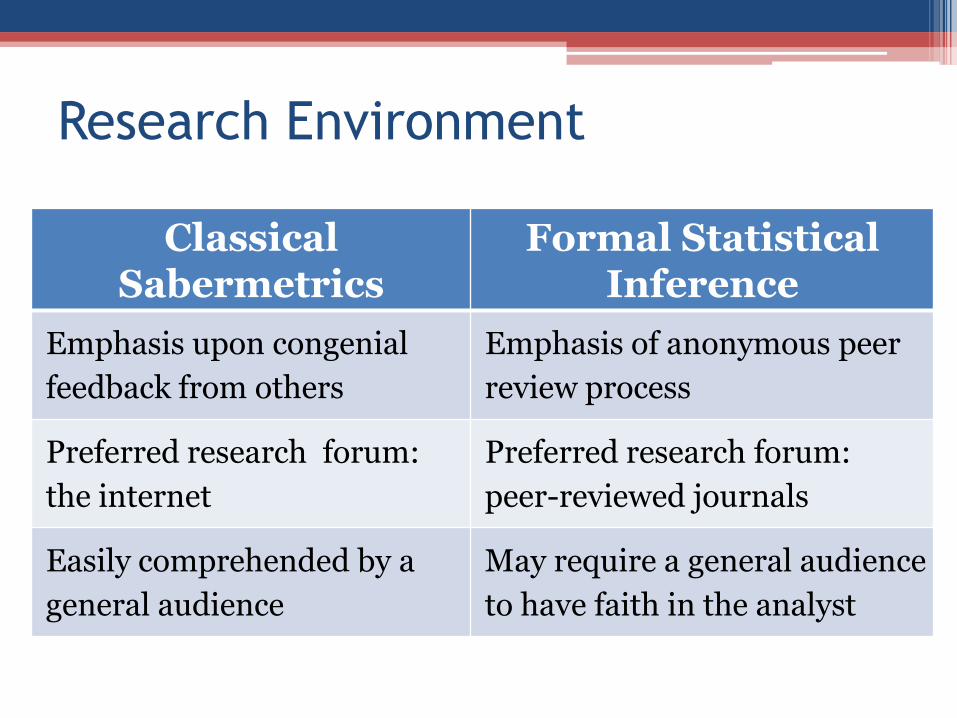
Research Environment
Classical Sabermetrics
Formal Statistical Inference
Emphasis upon congenial
feedback from others
Emphasis of anonymous peer
review process
Preferred research forum:
the internet
Preferred research forum:
peer-reviewed journals
Easily comprehended by a
general audience
May require a general audience
to have faith in the analyst
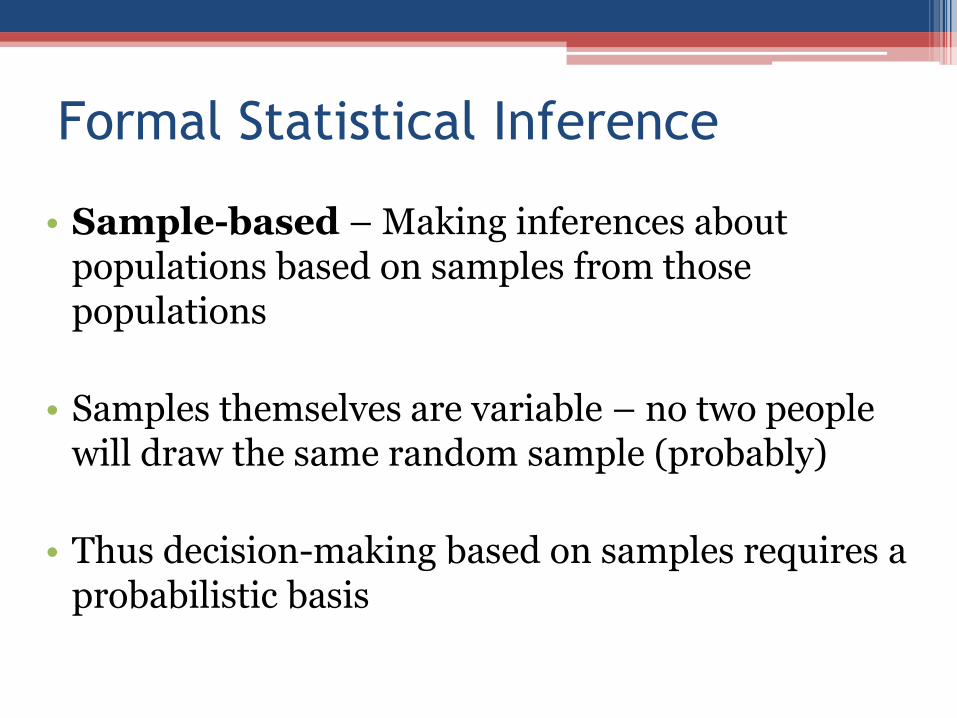
Formal Statistical Inference
• Sample-based – Making inferences about populations based on samples from those populations
• Samples themselves are variable – no two people will draw the same random sample (probably)
• Thus decision-making based on samples requires a probabilistic basis
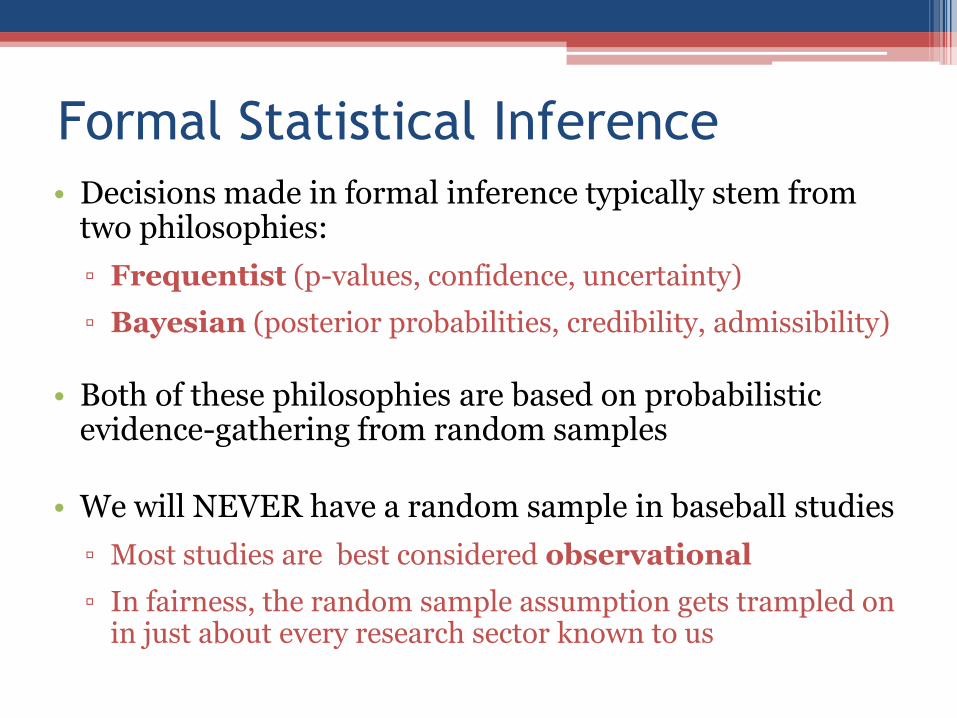
Formal Statistical Inference
• Decisions made in formal inference typically stem from two philosophies:
▫ Frequentist (p-values, confidence, uncertainty)
▫ Bayesian (posterior probabilities, credibility, admissibility)
• Both of these philosophies are based on probabilistic evidence-gathering from random samples
• We will NEVER have a random sample in baseball studies
▫ Most studies are best considered observational
▫ In fairness, the random sample assumption gets trampled on in just about every research sector known to us
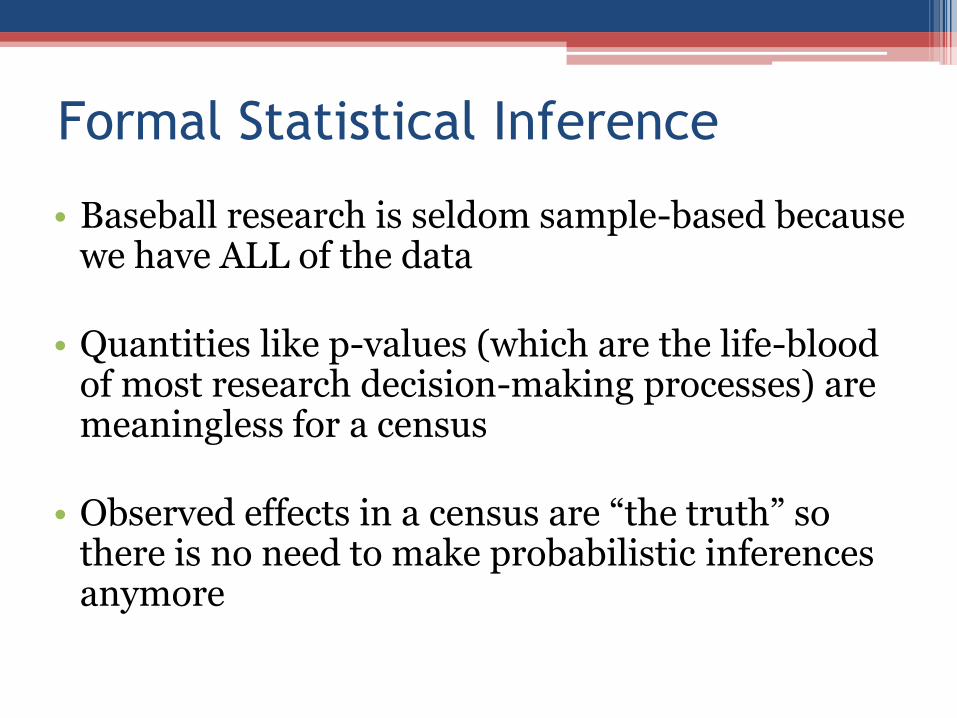
Formal Statistical Inference
• Baseball research is seldom sample-based because we have ALL of the data
• Quantities like p-values (which are the life-blood of most research decision-making processes) are meaningless for a census
• Observed effects in a census are “the truth” so there is no need to make probabilistic inferences anymore
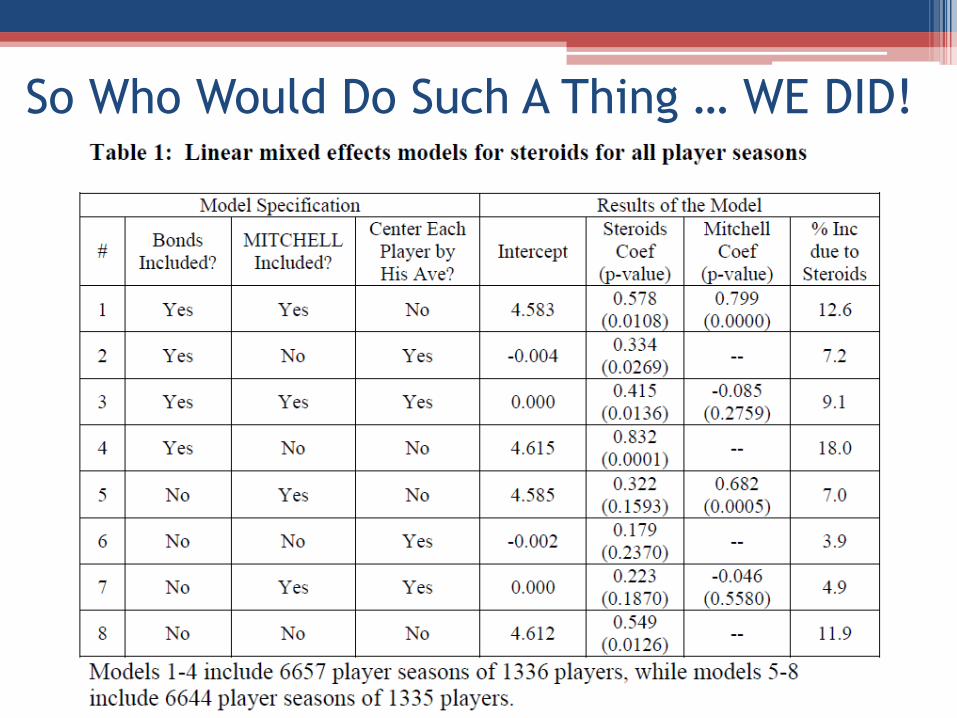
So Who Would Do Such A Thing … WE DID!
Utility of Formal Inference in a Census
• If the probabilistic basis for a p-value is not there in a census, is there any use for inference?
▫ In some cases, “yes”
▫ In some cases, “no”
▫ And it’s probably not always easy to tell which
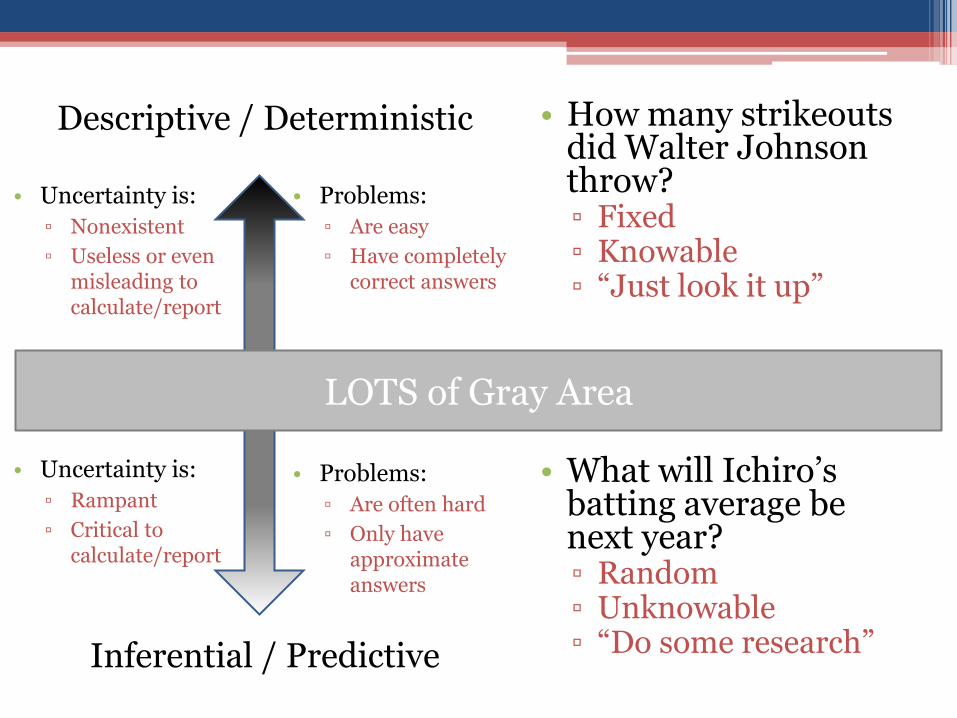
Descriptive / Deterministic
Inferential / Predictive
• How many strikeouts did Walter Johnson throw?▫ Fixed▫ Knowable▫ “Just look it up”
• What will Ichiro’s batting average be next year?▫ Random▫ Unknowable▫ “Do some research”
• Uncertainty is:
▫ Nonexistent
▫ Useless or even misleading to calculate/report
• Uncertainty is:
▫ Rampant
▫ Critical to calculate/report
• Problems:
▫ Are easy
▫ Have completely correct answers
• Problems:
▫ Are often hard
▫ Only have approximate answers
LOTS of Gray Area
Common Baseball Research Designs
• Purely Descriptive (usually on a census)
• Inferential Based on a Sample
• Mixture of Descriptive and Inferential Approaches from a Census
▫ Sometimes for associative purposes –establishing a cause-effect relationship
▫ Sometimes for predictive purposes –generating a good estimate of future performance
Example #1: Purely Descriptive
• 2011 SABR presentation on whether umpires give preferences to veterans with respect to called balls and strikes
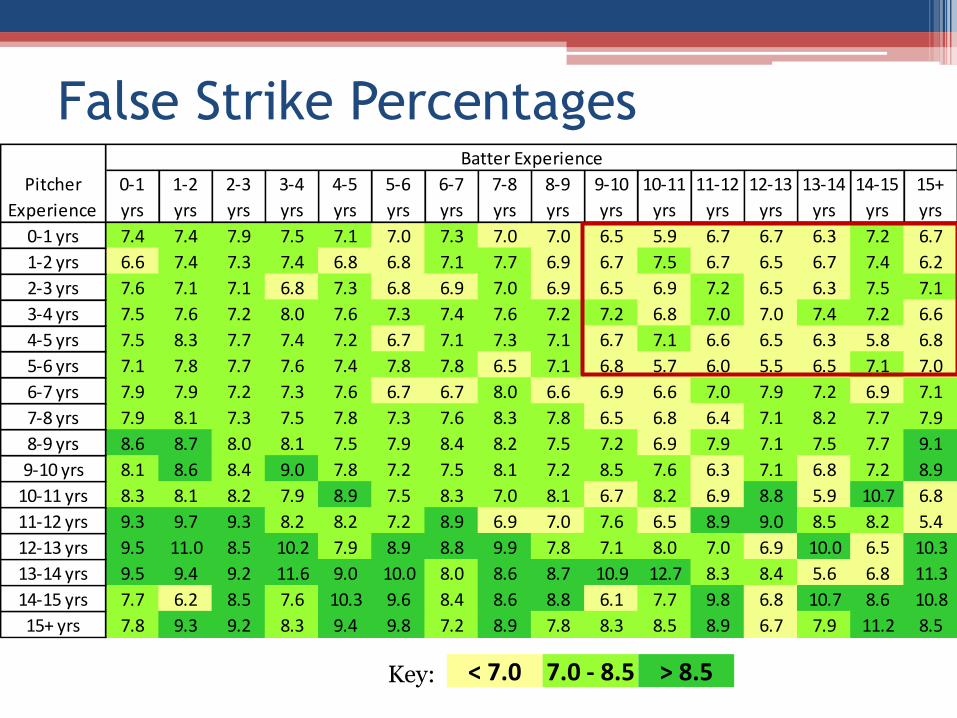
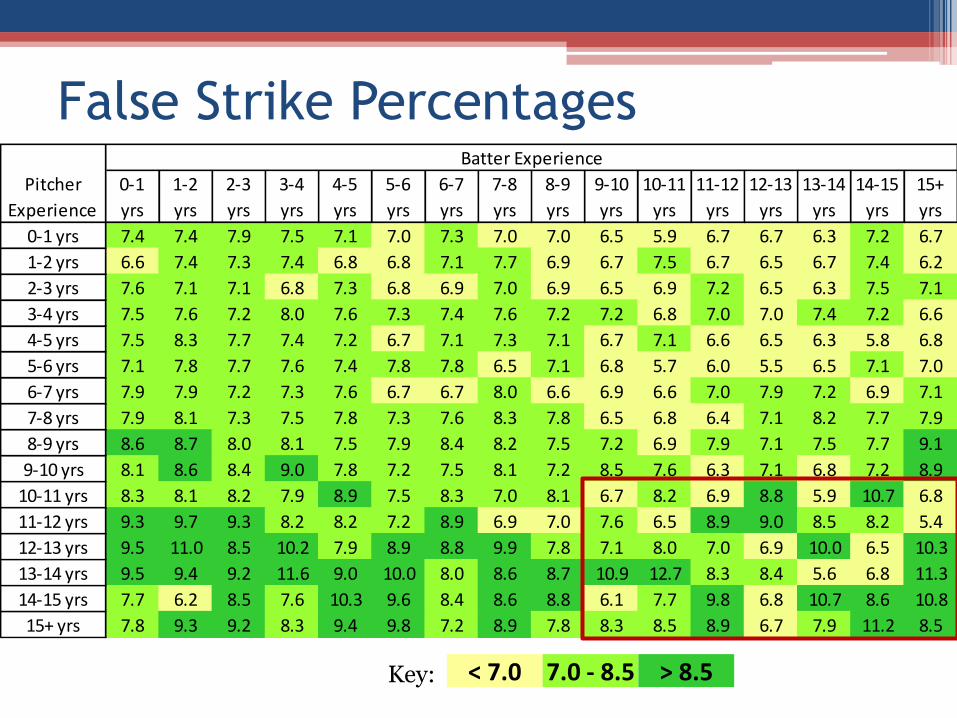
• Higher false strike rates for veteran pitchers compared to less-experienced
• Lower false strike rates for veteran hitters compared to less-experienced
• Vice versa for false ball rates

0-1
yrs
1-2
yrs
2-3
yrs
3-4
yrs
4-5
yrs
5-6
yrs
6-7
yrs
7-8
yrs
8-9
yrs
9-10
yrs
10-11
yrs
11-12
yrs
12-13
yrs
13-14
yrs
14-15
yrs
15+
yrs
0-1 yrs 7.4 7.4 7.9 7.5 7.1 7.0 7.3 7.0 7.0 6.5 5.9 6.7 6.7 6.3 7.2 6.7
1-2 yrs 6.6 7.4 7.3 7.4 6.8 6.8 7.1 7.7 6.9 6.7 7.5 6.7 6.5 6.7 7.4 6.2
2-3 yrs 7.6 7.1 7.1 6.8 7.3 6.8 6.9 7.0 6.9 6.5 6.9 7.2 6.5 6.3 7.5 7.1
3-4 yrs 7.5 7.6 7.2 8.0 7.6 7.3 7.4 7.6 7.2 7.2 6.8 7.0 7.0 7.4 7.2 6.6
4-5 yrs 7.5 8.3 7.7 7.4 7.2 6.7 7.1 7.3 7.1 6.7 7.1 6.6 6.5 6.3 5.8 6.8
5-6 yrs 7.1 7.8 7.7 7.6 7.4 7.8 7.8 6.5 7.1 6.8 5.7 6.0 5.5 6.5 7.1 7.0
6-7 yrs 7.9 7.9 7.2 7.3 7.6 6.7 6.7 8.0 6.6 6.9 6.6 7.0 7.9 7.2 6.9 7.1
7-8 yrs 7.9 8.1 7.3 7.5 7.8 7.3 7.6 8.3 7.8 6.5 6.8 6.4 7.1 8.2 7.7 7.9
8-9 yrs 8.6 8.7 8.0 8.1 7.5 7.9 8.4 8.2 7.5 7.2 6.9 7.9 7.1 7.5 7.7 9.1
9-10 yrs 8.1 8.6 8.4 9.0 7.8 7.2 7.5 8.1 7.2 8.5 7.6 6.3 7.1 6.8 7.2 8.9
10-11 yrs 8.3 8.1 8.2 7.9 8.9 7.5 8.3 7.0 8.1 6.7 8.2 6.9 8.8 5.9 10.7 6.8
11-12 yrs 9.3 9.7 9.3 8.2 8.2 7.2 8.9 6.9 7.0 7.6 6.5 8.9 9.0 8.5 8.2 5.4
12-13 yrs 9.5 11.0 8.5 10.2 7.9 8.9 8.8 9.9 7.8 7.1 8.0 7.0 6.9 10.0 6.5 10.3
13-14 yrs 9.5 9.4 9.2 11.6 9.0 10.0 8.0 8.6 8.7 10.9 12.7 8.3 8.4 5.6 6.8 11.3
14-15 yrs 7.7 6.2 8.5 7.6 10.3 9.6 8.4 8.6 8.8 6.1 7.7 9.8 6.8 10.7 8.6 10.8
15+ yrs 7.8 9.3 9.2 8.3 9.4 9.8 7.2 8.9 7.8 8.3 8.5 8.9 6.7 7.9 11.2 8.5
Batter Experience
Pitcher
Experience
False Strike Percentages
Key: < 7.0 7.0 - 8.5 > 8.5

• Among Younger Pitchers (< 6.5 Yrs. Experience)
▫ Top 40: 7.8% False Strike Rate
▫ Others: 7.1% False Strike Rate
• Among Older Pitchers ( > 6.5 Yrs. Experience)
▫ Top 40: 9.3% False Strike Rate
▫ Others: 7.9% False Strike Rate
Preference Toward the Best Pitchers

• Among Younger Batters (< 6.5 Yrs. Experience)
▫ Top 40: 7.6% False Ball Rate
▫ Others: 7.7% False Ball Rate
• Among Older Batters ( > 6.5 Yrs. Experience)
▫ Top 40: 7.2% False Ball Rate
▫ Others: 7.8% False Ball Rate
Preference Toward the Best Batters
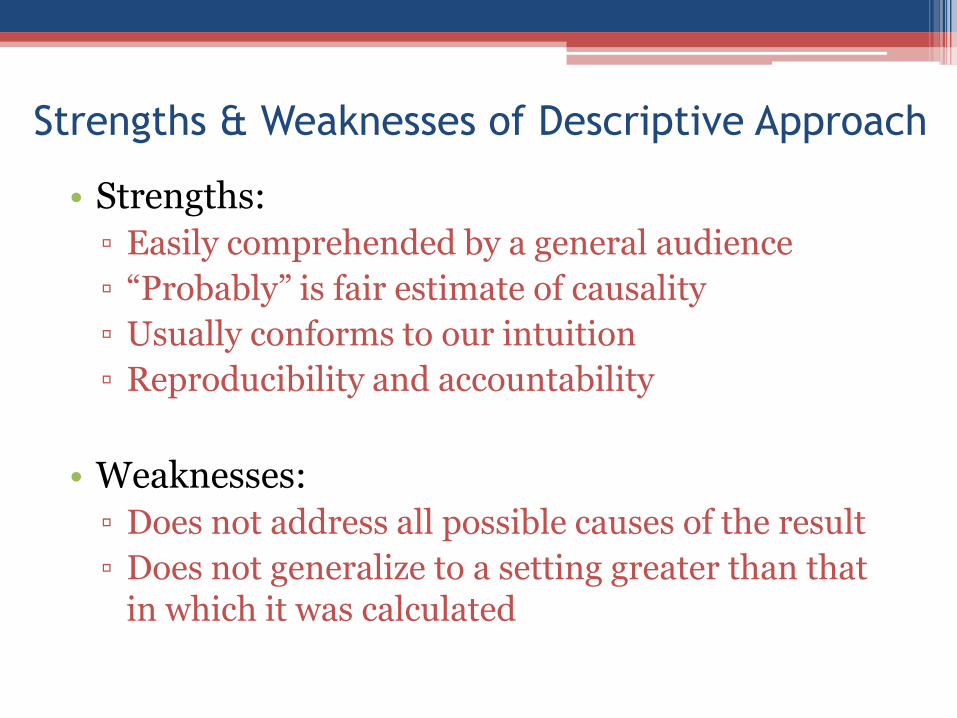
Strengths & Weaknesses of Descriptive Approach
• Strengths:
▫ Easily comprehended by a general audience
▫ “Probably” is fair estimate of causality
▫ Usually conforms to our intuition
▫ Reproducibility and accountability
• Weaknesses:
▫ Does not address all possible causes of the result
▫ Does not generalize to a setting greater than that in which it was calculated
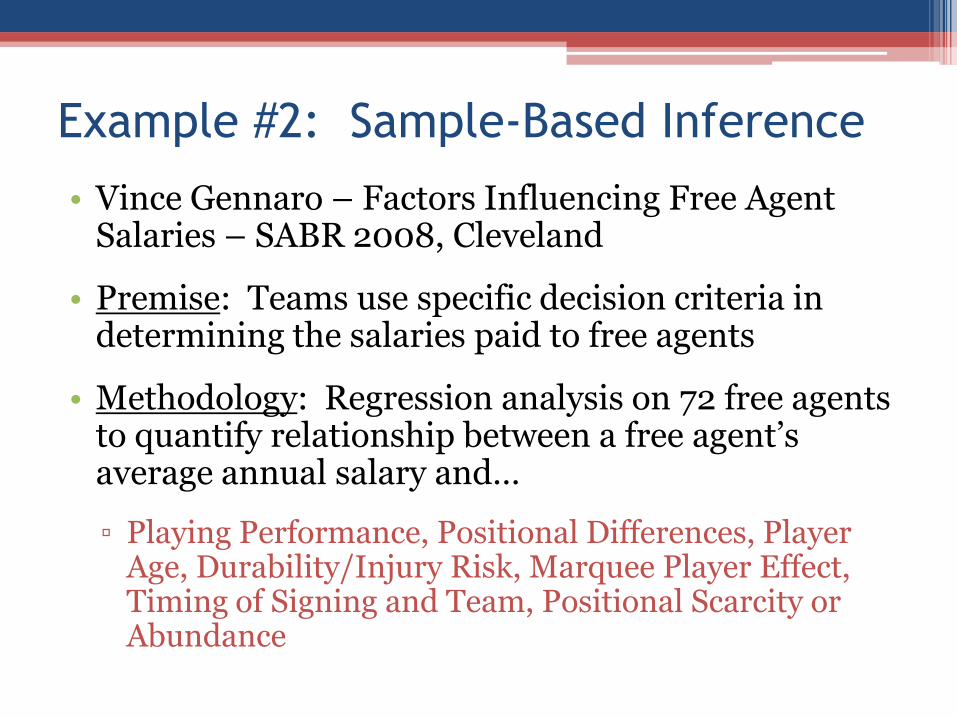
Example #2: Sample-Based Inference
• Vince Gennaro – Factors Influencing Free Agent Salaries – SABR 2008, Cleveland
• Premise: Teams use specific decision criteria in determining the salaries paid to free agents
• Methodology: Regression analysis on 72 free agents to quantify relationship between a free agent’s average annual salary and…
▫ Playing Performance, Positional Differences, Player Age, Durability/Injury Risk, Marquee Player Effect, Timing of Signing and Team, Positional Scarcity or Abundance
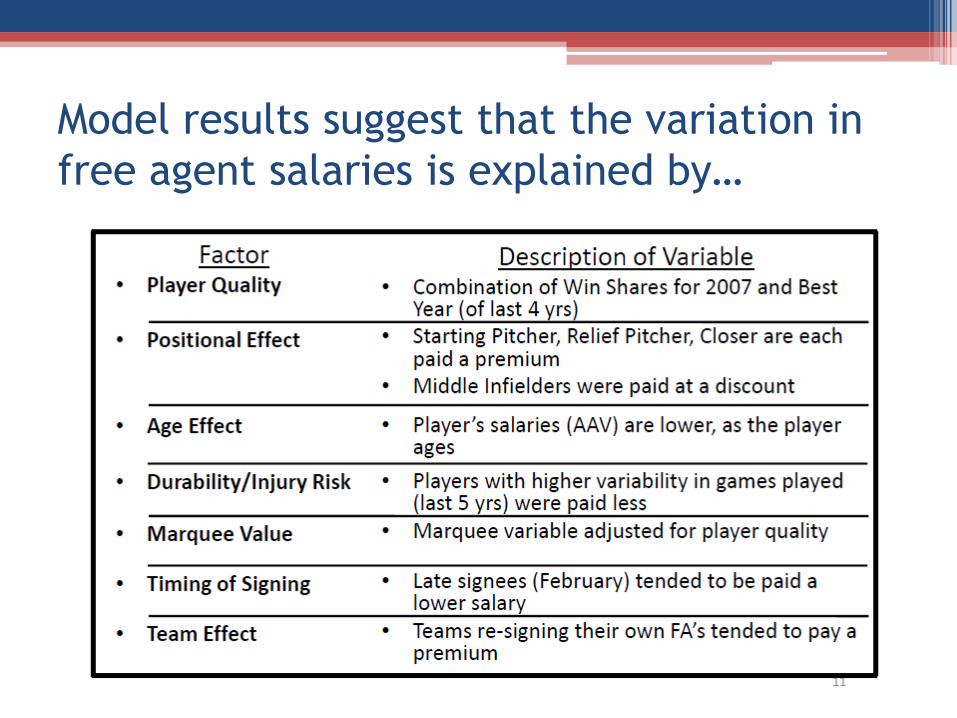
Model results suggest that the variation in
free agent salaries is explained by…
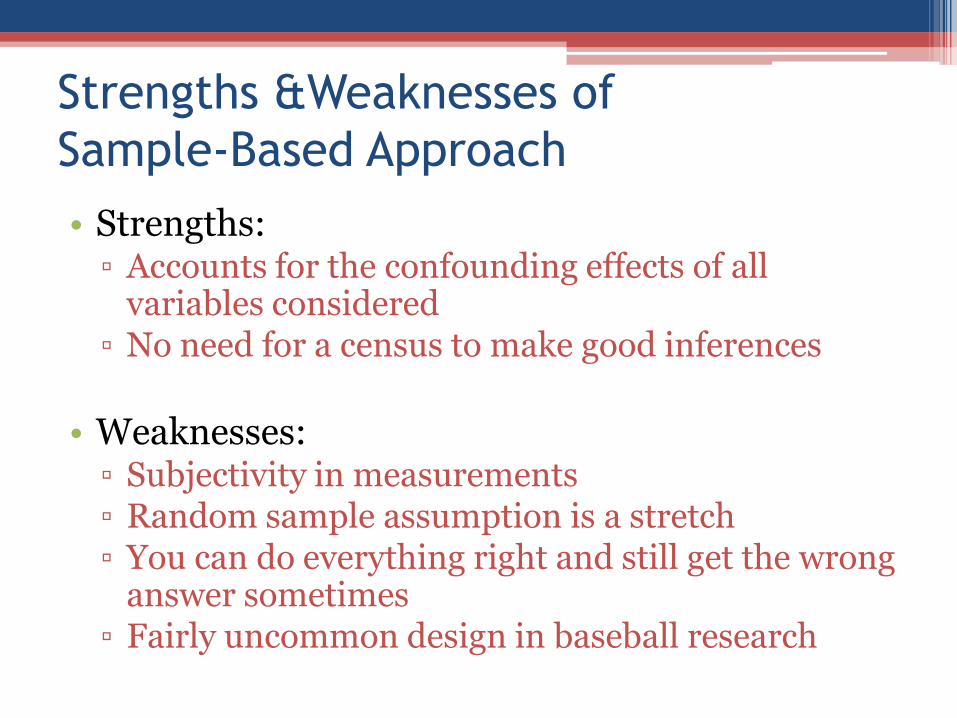
Strengths &Weaknesses of
Sample-Based Approach
• Strengths:▫ Accounts for the confounding effects of all
variables considered▫ No need for a census to make good inferences
• Weaknesses:▫ Subjectivity in measurements▫ Random sample assumption is a stretch▫ You can do everything right and still get the wrong
answer sometimes▫ Fairly uncommon design in baseball research

Example #3: Mixture of Methods for
Associative Purposes
Tim McCarver quotes (paraphrased):
• During a playoff broadcast four years ago:
“Catchers have poorer at-bats as the game wears on
because their hand gets sore.”
• During the 2009 All-Star Game with Joe Mauer batting:
“Catchers will often have their 3rd, 4th, and 5th plate
appearances be throw-away ABs.”
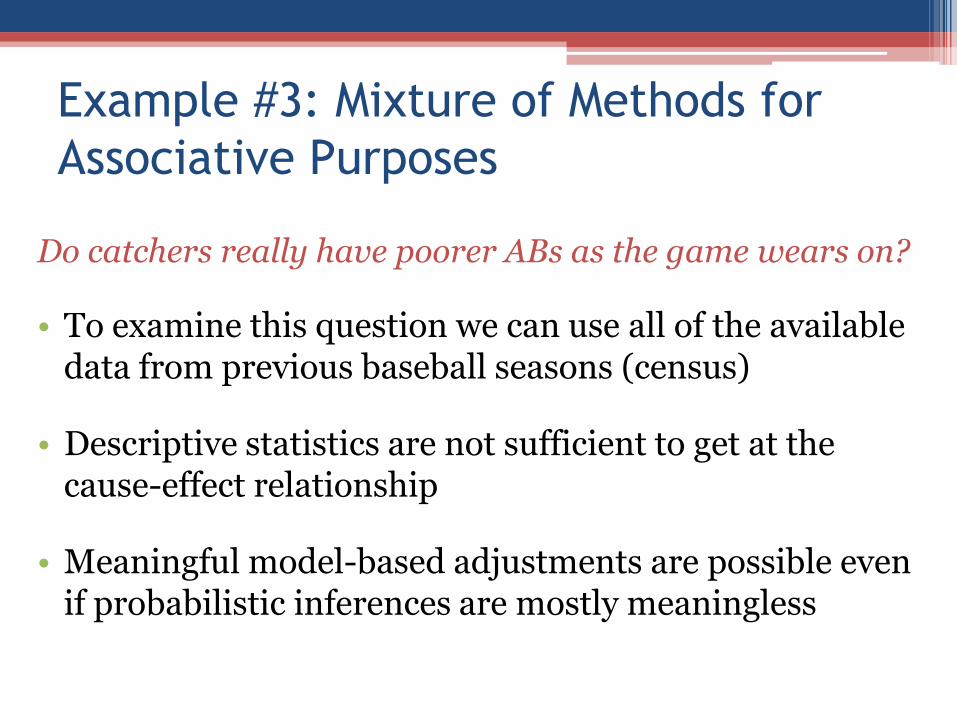
Example #3: Mixture of Methods for
Associative Purposes
Do catchers really have poorer ABs as the game wears on?
• To examine this question we can use all of the available data from previous baseball seasons (census)
• Descriptive statistics are not sufficient to get at the cause-effect relationship
• Meaningful model-based adjustments are possible even if probabilistic inferences are mostly meaningless
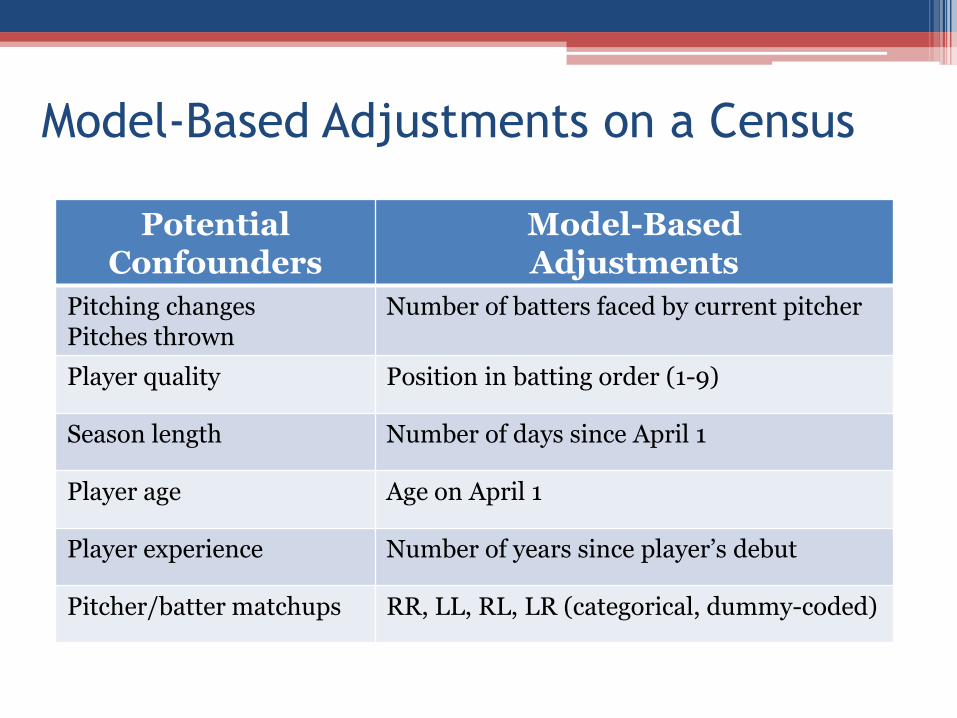
Model-Based Adjustments on a Census
Potential Confounders
Model-Based Adjustments
Pitching changesPitches thrown
Number of batters faced by current pitcher
Player quality Position in batting order (1-9)
Season length Number of days since April 1
Player age Age on April 1
Player experience Number of years since player’s debut
Pitcher/batter matchups RR, LL, RL, LR (categorical, dummy-coded)
Model-Based Adjustments on a Census
• Team plate appearances, number of batters faced, and
player age were modeled with quadratic terms to
account for non-linear relationships
• Key variable: Interaction between team PA and
defensive position

Home Runs
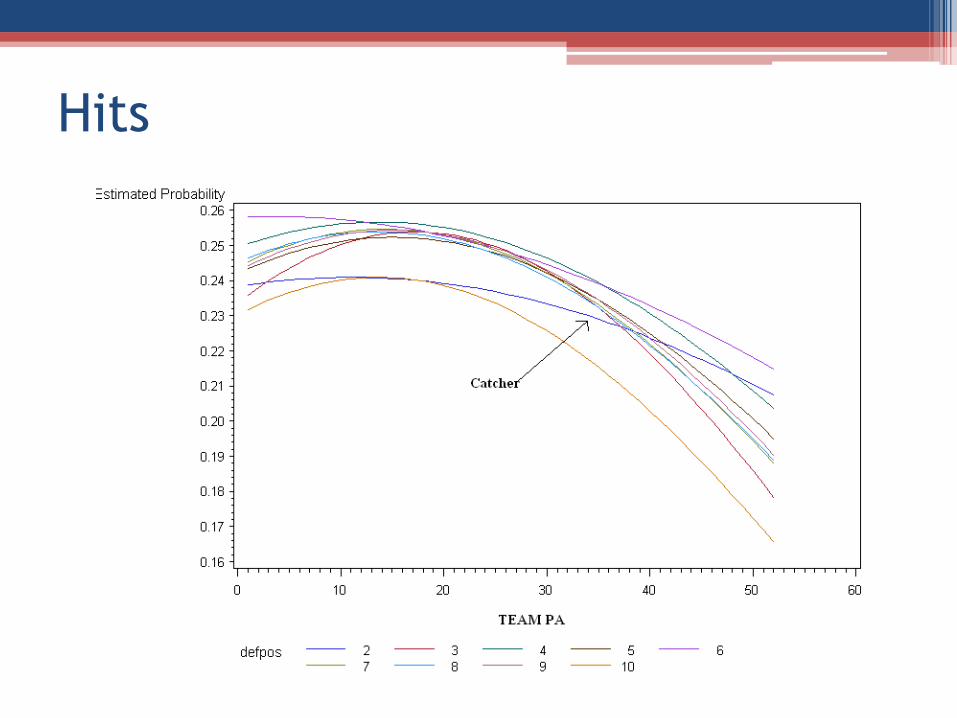
Hits
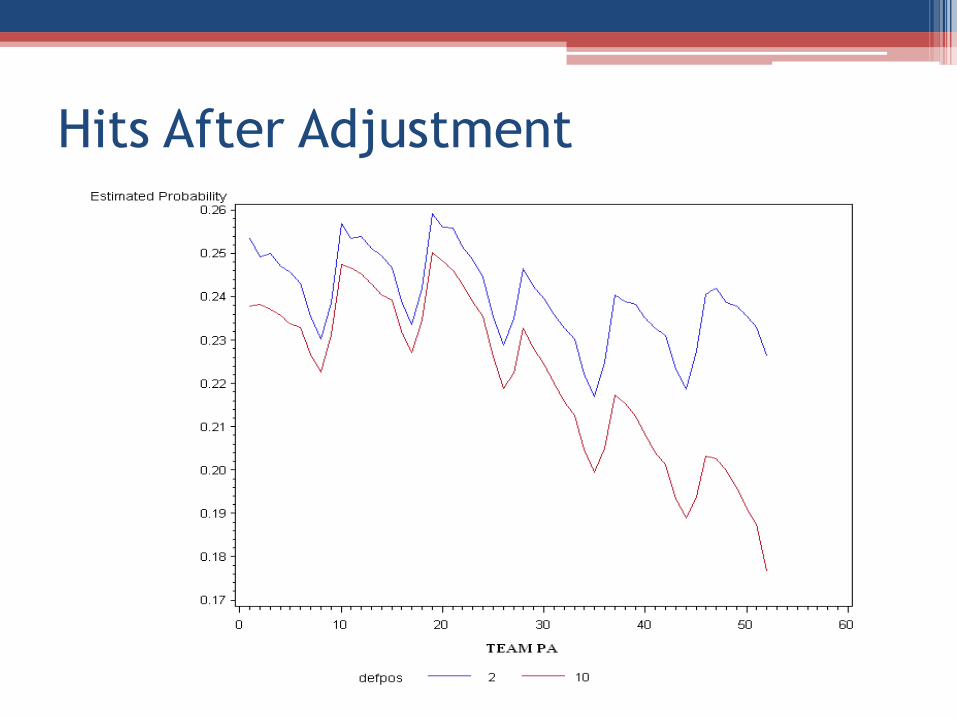
Hits After Adjustment
Example #3 – Conclusions
• Tim McCarver was mostly wrong
• No evidence of a disproportionate performance
decline for catchers with respect to OBP, HR, hits
• In fact, catchers are the most consistent players from
inning to inning
• Ability to adjust for other “competing” explanations a
major strength for an associative study of this sort
Strengths & Weaknesses of Mixed
Methods – Associative Purposes
• Strengths:
▫ Can account for repeated measures –correlation due to person
▫ Ability to control for confounders – HUGE!
• Weaknesses
▫ Audience had to take our word for it
▫ “Gray area” using these methods in a census
Mixed Methods – Predictive Purposes
• Possible to use a model-based approach on a census to predict future performance
• Useful in applying uncertainty levels to predictions made from a census
▫ Example: We might predict 25 Wins Shares for Ichiro Suzuki with confidence bounds of 20 and 30
• Very Gray Area: Not theoretically clear how uncertainty quantities generated from a probability basis applies to a census
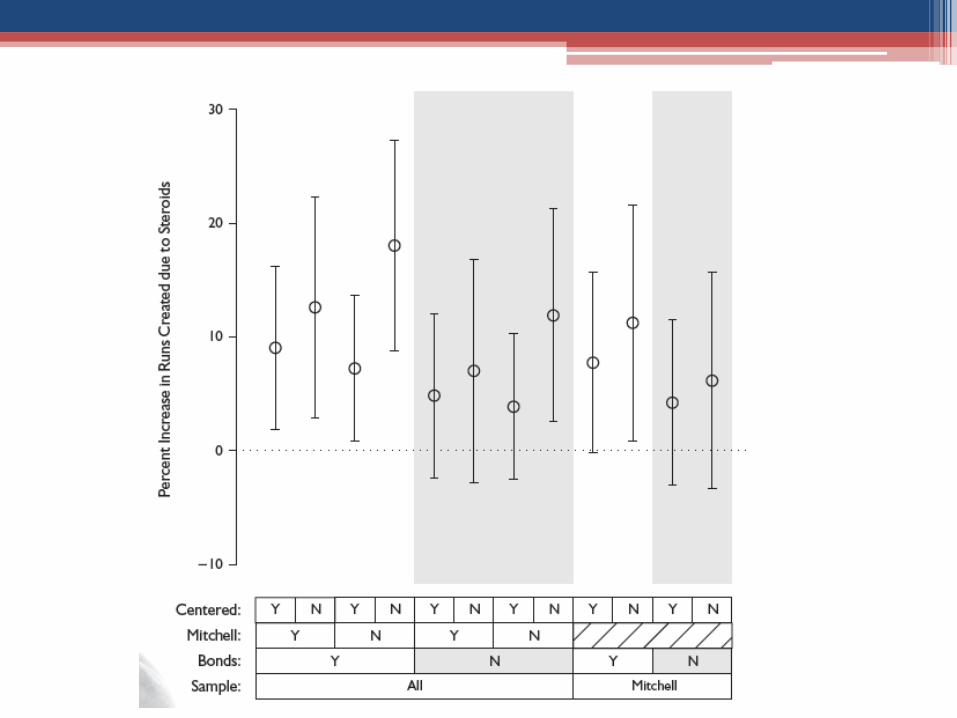
Example #4: Mixture of Methods for
Predictive Purposes – Steroids Study
• Aforementioned steroids study was performed on a census
▫ Several limitations of the study were admitted up front but still criticized by people who didn’t read the whole paper
• Estimates of uncertainty still have some validity on what might happen in the future if steroid use continued
Take the best from both approaches…
• Classical Sabermetrics
▫ Easy to understand
▫ Usually leads to correct inferences
▫ Powered the statistical revolution in baseball
• Formal statistical inference
▫ Ability to get better estimates via adjustments
▫ Ability to make inferences when sample-based analysis is possible
▫ Better “pre-hoc” accounting of underlying data structures
Our Opinion
• Don’t overvalue the p-value!
• Don’t overvalue the academic peer review process in the baseball research setting
▫ Journal editors see the final product… but have no oversight as to the conduct of the study beyond commenting on what is written
▫ Journal editors usually don’t have access to the data source, nor are they inclined to investigate for themselves

Conclusions
• Baseball Research …
▫ Seldom meets the conditions for formal inference
▫ Has many research problems where the optimal solutions are debatable
• Sabermetric (Descriptive) Approaches …
▫ Seldom can fully interrogate cause and effect
• Formal Inference Approaches …
▫ Provide estimated effects which should be closer to the truth than classical descriptive estimates
Suggestions
• As a service, the Statistical Analysis Committee of SABR could provide an advisory board made up of individuals who understand these intricacies
• Emulate the sabermetric peer review process
▫ Lively fact-checking and vigorous open debate
• Turn down the snobbery – we’re all just trying to have a little fun here!
▫ Baseball research is supposed to be about enjoying a hobby with like-minded friends
THANK YOU!