classification of cellulosic materials by … · sems of fine and coarse flax fibers 19 ... ftir...
TRANSCRIPT
Classification and Characterization of Cellulosic Materials by Chemometrics
Matthew Leonard
Matthew Leonard, B.Sc. (Chemistry)
Honours RMIT - 2010
i
Classification and Characterization of Cellulosic Materials
by Chemometrics
A thesis presented for Bachelor of Applied Science Honours in Chemistry
School of Applied Sciences (Chemistry)
RMIT University
November 2010
by
Matthew Leonard
B.Sc. (Chemistry), La Trobe University 2007
Matthew Leonard, B.Sc. (Chemistry)
Honours RMIT - 2010
ii
Declaration
I, Matthew Leonard, certify that except where due acknowledgment has been made, this work is
mine alone; it has not been submitted previously, in whole or in part, to qualify for any other
academic award; the content of the thesis is the result of work which has been carried out since the
official commencement date of the approved research program; and, any editorial work, paid or
unpaid, carried out by a third party is acknowledged.
Matthew Leonard
04-Nov-2010
Matthew Leonard, B.Sc. (Chemistry)
Honours RMIT - 2010
iii
Acknowledgements
Professor Robert Shanks, for taking me on board as a student. You have seen talent in me that few
noticed before. Your adoption of others’ ideas and positive thinking and has allowed me to realize
my full potential. I look forward to many more years of us working together. Thank you.
Dr Bruce James, for taking the time and attention to help me find my confidence. You have freed
me from a life of caste. You always saw my true nature. I miss you.
Dr Jeff Hughes, for taking me on board as a student. Your approach to teaching is first class. We are
blessed that people like you still exist. Your common sense and work rate are matched by no
lecturer. You have empowered me with key elements previously absent from my repertoire. Thank
you.
Dr Ian Potter, for always being there for a chat, some good advice and a laugh. I continue to channel
your unique ability to selectively focus on good science and teaching. Thank you.
Roslyn Lampard, for instilling in me that study always comes first, not to be afraid to use
knowledge to the best of our abilities and that hard work pays off. You have encouraged me to think
long term and helped me on the path to leadership. Thank you.
Associate Professor Barry Meehan, for help with sample collection. You have set a positive
example for me and given me many new ideas. Thank you.
Karl Lang, for finding the time to welcome me to RMIT. Not only have you made me feel
comfortable in my workspace, but you have kept things functional when nobody else could. You
are a very underappreciated person. You have never let me down. Thank you.
Professor Philip Marriott, for teaching me impromptu advanced separation science. A game of catch
up was required to achieve results. Your diligence allowed me to succeed. Thank you.
Dr Janetta Culvenor, for demonstrating a calm and effectual handle of situations. You have been an
example to me of a good scientist and person for a very long time. Thank you.
Dr Nichola Porter, for helping drive me to a more sustainable life. Your honest confidence places
people at ease, while getting the job done right. You have shown me how to spot detail in a sea of
information. Thank you.
Steve Spoljaric, for constantly being nearby to help with the smallest problems. From making a
coffee to writing a thesis, you are always able to pitch in. You will have a great career as a scientist.
I look forward to your future work after your PhD. Thank you.
Peter Laming, for teaching me many small curiosities. Your honest advice has guided me well.
Thank you.
Izan Roshawaty Mustapa, for being close by with a glowing smile daily. Despite your workload of
family and study, you always remain positive. I admire your hands on approach and determination
to achieve your PhD. Thank you.
Professor Mike Adams, for welcoming me to RMIT with a kind smile. Despite the many stresses of
your position, you manage to go out of your way to make others feel good about themselves. You
have also taught me the concept of Principal Components Analysis and the role of the
Chemometrician. Thank you.

Matthew Leonard, B.Sc. (Chemistry)
Honours RMIT - 2010
iv
Dr Mohammed Al Kobaisi, for being there to share a laugh at the toughest moments. Your advice
on people skills has helped me greatly. You are a kind hearted and talented individual. Australia is a
better place now that you have joined us. Thank you.
Dr Ing Kong, for support and appreciation and the occasional walk for a hot chocolate. Your
presence has made a very positive difference. Thank you.
Cam Pham, for welcoming me to RMIT. You have had a struggle to get through your degree. You
are a highly skilled chemist, with great future prospects. I look forward to us spending more time
together after Honours. I will continue to advocate for you becoming gainfully employed. I wish I
was in a position to help you more. You are great company. Thank you.
Frank Antolasic, for sharing your observations and working hard to keep my spectra on track.
Thank you.
Dr. Cybele Lotti, for putting a smile on my face and supplying valuable samples. Thank you.
Blake Plowman, for help with Raman spectra that showed the way. Your depth of knowledge has
been very valuable. Thank you.
Michael Czajka, for your thoughts and willingness to learn. Your persistence and open mind has led
you to adopt many good ideas and share them with others. You have helped me tirelessly with a
variety of topics. You are a true Polymath, something to which I aspire. Thank you.
Bryan Hill, for good advice towards stressful situations and feedback on work done. I will now have
a good friend in WA. Thank you.
My housemates; Lauren, Oliver and Angel, for an unforgettable year. You have provided me with
much needed support. Thank you.
To my partner and future wife, Jennifer, for being so close in an emotional way. You are the most
loving person I have ever met. I am so relieved that I managed to find you before we were old. I
look forward to seeing you first and last every day. We will have a happy life together and one
reason for that is that you have helped me to get through my postgraduate studies. I will love you
forever. Thank you.

Matthew Leonard, B.Sc. (Chemistry)
Honours RMIT - 2010
v
Table of contents
Declaration .................................................................................................................................. ii
Acknowledgements..................................................................................................................... iii
Table of contents ........................................................................................................................ v
List of figures .............................................................................................................................. vi
List of tables ................................................................................................................................ iix
List of terms ................................................................................................................................ ix
Abstract ....................................................................................................................................... x
1 Introduction .................................................................................................................... 1
Cellulosics 1
Cellulose 1
Hemicellulose 3
Pectin 3
Lignin 6
Tannins 8
Aim and objectives 12
Recent research 13
Instrumental methods for analysis of cellulosics 16
Chemometric methods 21
Instruments used 23
Chemometric techniques used 25
2 Methodology ................................................................................................................... 26
Sample collection and preparation 26
Instrumentation 28
Data treatment 32
3 Results and Discussion ................................................................................................... 33
TGA 33
FTIR 35
Raman 37
WAXS 38
Chemometrics 41
TGA instrument Intra-Day variance 41
FTIR standard deviation and drift 42
Principal Components Analysis 43
Linear Discriminant Analysis 44
4 Conclusion....................................................................................................................... 49
5 References ....................................................................................................................... 50

Matthew Leonard, B.Sc. (Chemistry)
Honours RMIT - 2010
vi
6 Appendices ...................................................................................................................... 55
Appendix A: Thermograms 55
Appendix B: FTIR spectra 58

Matthew Leonard, B.Sc. (Chemistry)
Honours RMIT - 2010
vii
List of figures
Figure 1.1. Molecular structure of cellulose 1
Figure 1.2. Mercerized cotton towel 2
Figure 1.3. Cellulose I and II 2
Figure 1.4. Major hemicellulose monomers 3
Figure 1.5. A piece of hemicellulose 3
Figure 1.6. Homogalacturonan – base molecule of pectin 4
Figure 1.7. Borate 1:2 ester diol crosslinked with two Rhamnogalacturonan II units 5
Figure 1.8. A piece of lignin polymer 6
Figure 1.9. Common monolignols 7
Figure 1.10. Proposed model of structural organization of cellulosics in wood 7
Figure 1.11. Gallic acid – A monomer of tannin 8
Figure 1.12. Condensed tannin 9
Figure 1.13. Complexed tannin 9
Figure 1.14. X-ray diffractograms of treated hemp fibres 13
Figure 1.15. Schematic of the crystalline structure transformation by NaOH treatment 14
Figure 1.16. Thermograms and DTG curves of biomass obtained by TGA 16
Figure 1.17. Proposed kinetic scheme for the main step of cellulose pyrolysis 17
Figure 1.18. Raman spectra of generated mixtures of cellulose I and II 19
Figure 1.19. SEMs of fine and coarse flax fibers 19
Figure 1.20. RDA misclassification plot of polyethylene samples by density 23
Figure 2.1. Studley Park Reserve, Kew 26
Figure 2.2. Serrated Tussock sample 26
Figure 2.3. Dried Serrated Tussock 27
Figure 2.4. Banana fruit fibres 27
Figure 2.5 Coconut with husk fibres 27
Figure 2.6. Perkin Elmer TGA7 29
Figure 2.7. KBr grinding of sample and diffuse reflectance sampler 29
Figure 2.8. Perkin Elmer RamanStation 400F spectrometer 30
Figure 2.9. Flax samples in Nanostar sample holder 31
Figure 2.10. Bruker Nanostar spectrometer in 4.8 cm sample to detector mode 31
Figure 3.1. TGA thermograms of cottons and Avicel 33
Figure 3.2. TGA thermograms of bast fibres and woods 33
Figure 3.3. TGA thermogram class comparison 34
Figure 3.4. FTIR spectrum of jute 35
Figure 3.5. FTIR spectrum of coconut fibre 36
Figure 3.6. FTIR spectrum of Avicel 36
Figure 3.7. Raman spectra of hemp 38
Figure 3.8. WAXS diffractograms of cellulosics 39
Figure 3.9. Integrated diffractograms of cellulosics 40
Figure 3.10 Intra-Day variance of flax; Pyris 1 TGA 41
Figure 3.11 Intra-Day variance of flax; TGA7 41
Figure 3.12 Standard deviation of FTIR sample spectra 42
Figure 3.13 FTIR of all 4 cotton samples showing baseline drift 42
Figure 3.14 Score plot of PC1 vs PC2 from TGA data 43
Figure 3.15 Score plot of cellulosics PC1 vs PC2 (TGA data) 44
Figure 3.16. LDA class centroid profiles from TGA data 45
Figure 3.17. LDA class centroid profiles PC1-6 from FTIR 45
Figure 3.18. LDA class assignments from PC1-6 of TGA data 46
Figure 3.19. LDA cross validated class assignments from PC1-6 of TGA data 46
Figure 3.20. LDA class assignments from PC1-6 of FTIR data 47
Figure 3.21. LDA cross validated class assignments from PC1-6 of FTIR data 47

Matthew Leonard, B.Sc. (Chemistry)
Honours RMIT - 2010
viii
List of tables
Table 1.1. Cellulosic components 10
Table 1.2. XRF analysis of ashes of sugarcane bagasse 15
Table 1.3. Common instruments for cellulosics observation 20
Table 1.4. Common Chemometric techniques 22
Table 2.1. Sample classes 28
Table 3.1. Peak assignments for FTIR of cellulosics 37
Table 3.2. X-ray diffraction peak positions and diffraction planes of cellulose polymorphs 39
Table 3.3. Eigenvalues and % variance of Principal Components from TGA and FTIR data 43

Matthew Leonard, B.Sc. (Chemistry)
Honours RMIT - 2010
ix
List of terms
CP/MAS 13
C-NMR Cross Polarization Magic Angle Spinning
Carbon-13 Nuclear Magnetic Resonance
Spectroscopy
DPLS Discriminant Partial Least Squares
DSC Differential Scanning Calorimetry
FTIR Fourier Transform Infrared Spectroscopy
ICP-MS Inductively Coupled Plasma-Mass
Spectrometry
KNN K-Nearest Neighbours
LDA Linear Discriminant Analysis
MTG Modulated Thermogravimetry
NIR Near Infrared Spectroscopy
PCA Principal Components Analysis
PLS Partial Least Squares Regression
QDA Quadratic Discriminant Analysis
Raman Raman Spectroscopy
RDA Regularized Discriminant Analysis
SAXS Small Angle X-ray Scattering
SEM Scanning Electron Microscope
SIMCA Soft Independent Modelling of Class
Analogies
TGA Thermogravimetric Analysis
TG-MS Thermogravimetry-Mass Spectrometry
UV-Vis UltraViolet-Visible light Spectroscopy
WAXS Wide Angle X-ray Scattering
XPS X-ray Photoelectron Spectroscopy
XRD X-ray Diffraction
Matthew Leonard, B.Sc. (Chemistry)
Honours RMIT - 2010
x
Abstract
Cellulosics were gathered and chemical structures characterized by TGA, FTIR and WAXS.
TGA thermograms were compared and contrasted with FTIR band assignments for cellulosic
composition. TGA and FTIR data was extracted and used with chemometric methods to
classify cellulosics by source. Results showed some level of grouping and discrimination by
principal components (PC) score plots. Linear Discriminant Analysis (LDA) has correctly
differentiated 15 of 17 samples classed by source of cellulosic using both TGA and FTIR
data. Cross validated LDA class assignments were reduced to 10 out of 17 for both TGA and
FTIR data; likely due to small numbers of samples in classes (3-4). Further information may
be obtained by this approach with a more comprehensive investigation which may involve
more samples from each class and/or analysis of separate classes for further method
development of cellulosics classification.
Matthew Leonard, B.Sc. (Chemistry)
Honours RMIT - 2010
1
1. Introduction
Cellulosics are a chemical group of much interest in materials science. Due to their
abundance they are very worthwhile to understand but have complex molecular structure.
Cellulosics occur in wood, fibres and other plant materials. The main components of
cellulosics are cellulose, hemicellulose, pectins, lignin and tannins with the distribution
varying by structure and function of the cellulosics.
Native cellulosics have high porosity/air permeability1, compressive strength
2 and absorb
water3. Cellulosics exhibit a wide range of dimensional stability. They are stable at room
temperature, undergoing pyrolysis on heating and combustion on burning. These physical
properties vary by chemical composition of the cellulosics. A deep understanding of
cellulosics is important to allow prediction of such properties.
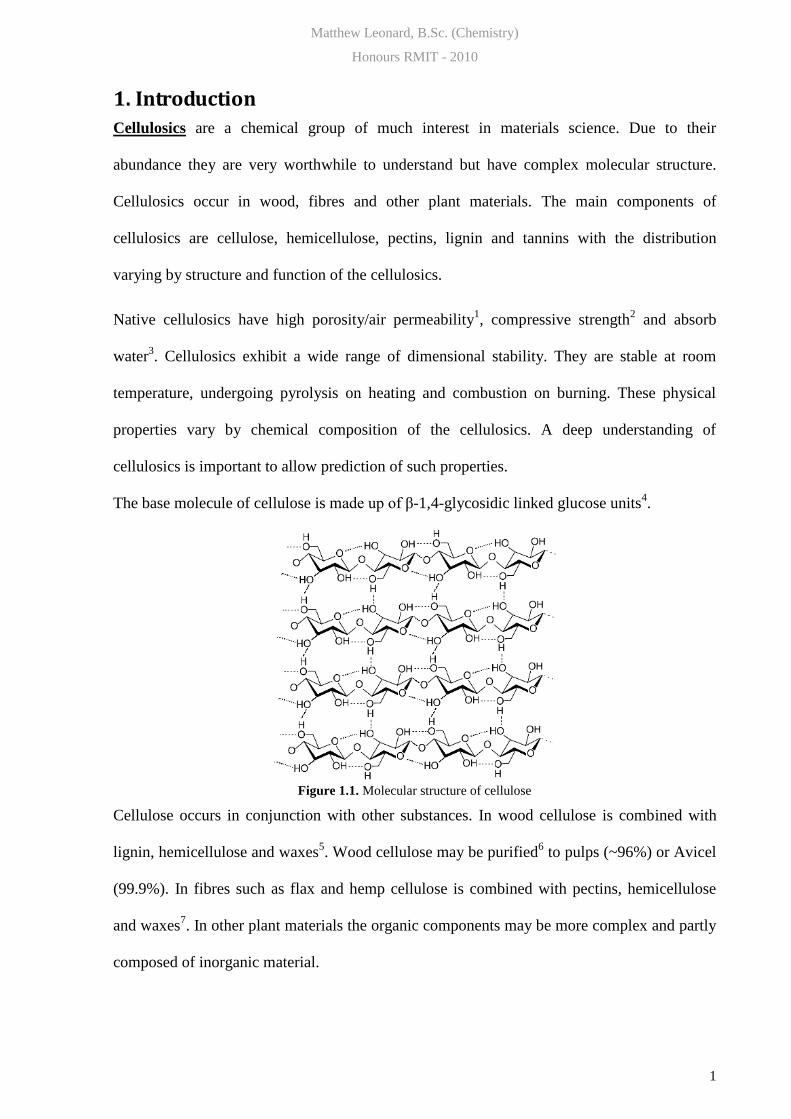
The base molecule of cellulose is made up of β-1,4-glycosidic linked glucose units4.
Figure 1.1. Molecular structure of cellulose
Cellulose occurs in conjunction with other substances. In wood cellulose is combined with
lignin, hemicellulose and waxes5. Wood cellulose may be purified
6 to pulps (~96%) or Avicel
(99.9%). In fibres such as flax and hemp cellulose is combined with pectins, hemicellulose
and waxes7. In other plant materials the organic components may be more complex and partly
composed of inorganic material.

Matthew Leonard, B.Sc. (Chemistry)
Honours RMIT - 2010
2
Native crystalline cellulose forms macrofibrils (300-500 μm) made up of microfibril bundles
of diameter 20-30 nm8. Cellulose fibres may be treated with NaOH; a process known as
mercerization9. This restructures and purifies cellulose
10 to give holocellulose; the total
polysaccharide fraction. Removal of lignin9, pectins and waxes gives fibres with enhanced
physical properties11
. Removal of pectins by mercerization leads to increased thermal
resistance12
and fibre durability13
.
Figure 1.2. Mercerized cotton towel
Cellulose has four polymorphs; I, II, III and IV, distinguishable by Wide Angle X-ray
Scattering (WAXS)14
. Cellulose crystal forms I and II co-exist in native cellulosic sources,
with Cellulose I in the majority. Cellulose I is converted irreversibly to cellulose II by NaOH
treatment known as mercerization12
. Cellulose I is thought to have a crystal structure with
monomeric chains in parallel conformation and cellulose II to have chains in an anti-parallel
conformation15
(Figure 1.3.)16
. Crystal structure I has been shown to be made up of Iα and Iβ
forms17
.
Figure 1.3. Cellulose I and II16

Matthew Leonard, B.Sc. (Chemistry)
Honours RMIT - 2010
3
Hemicellulose is an amorphous18
polysaccharide composed of hexose and pentose sugars5.
Xylose is the sugar monomer present in the largest amount19
. Other sugars include arabinose,
mannose and galactose19
.
Figure 1.4. Major hemicellulose monomers
It is hard to distinguish glucose from acid hydrolysis of cellulosics as originating from
cellulose or hemicellulose19
. Hemicellulose consists of shorter chains; 300 - 2 000 sugar
units20
as opposed to 7 000 - 15 000 in cellulose21
. Hemicellulose is a branched polymer while
cellulose is unbranched22
.
Figure 1.5. A piece of hemicellulose
Pectin; from the Greek pektikos, meaning congealed or curdled is a heteropolysaccharide
found in cellulosics. Pectin binds to cellulose23
but has a more complex structure than
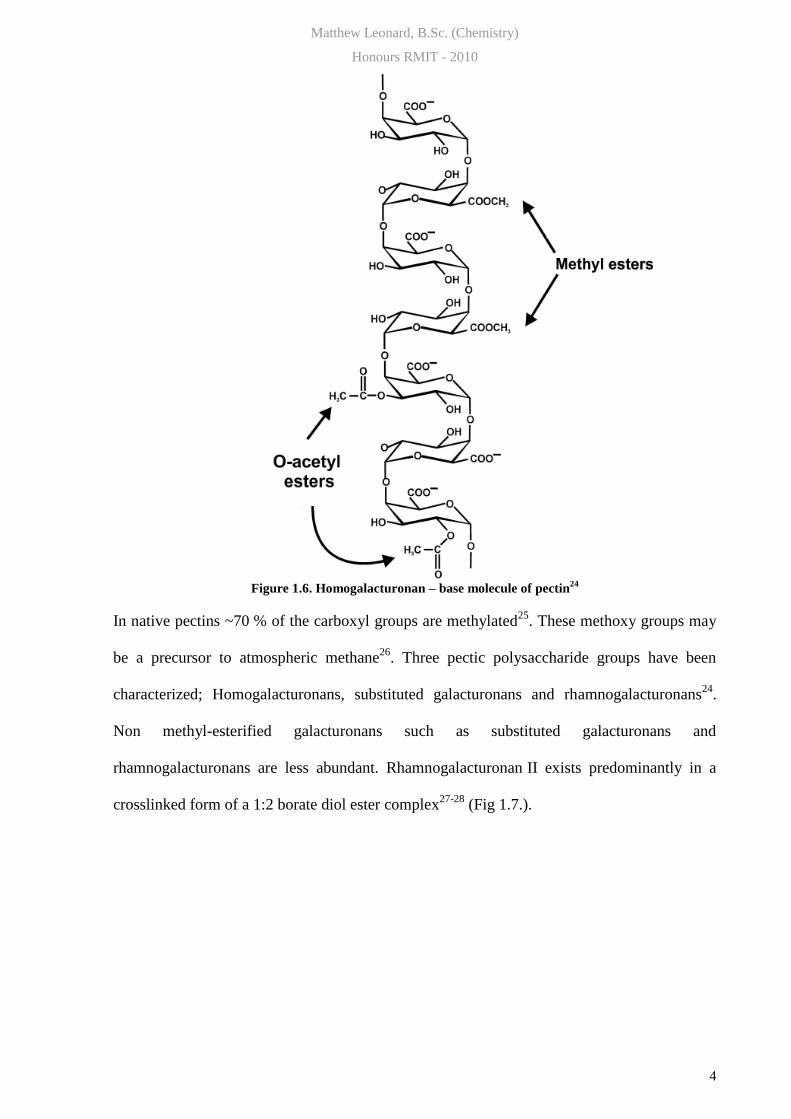
cellulose or hemicellulose. The base molecule of pectin, homogalacturonan is a linear chain of
α-(1-4)-linked D-galactosyluronic acids in which some of the carboxyl groups are methyl
esterified24
.
Matthew Leonard, B.Sc. (Chemistry)
Honours RMIT - 2010
4
Figure 1.6. Homogalacturonan – base molecule of pectin
24
In native pectins ~70 % of the carboxyl groups are methylated25
. These methoxy groups may
be a precursor to atmospheric methane26
. Three pectic polysaccharide groups have been
characterized; Homogalacturonans, substituted galacturonans and rhamnogalacturonans24
.
Non methyl-esterified galacturonans such as substituted galacturonans and
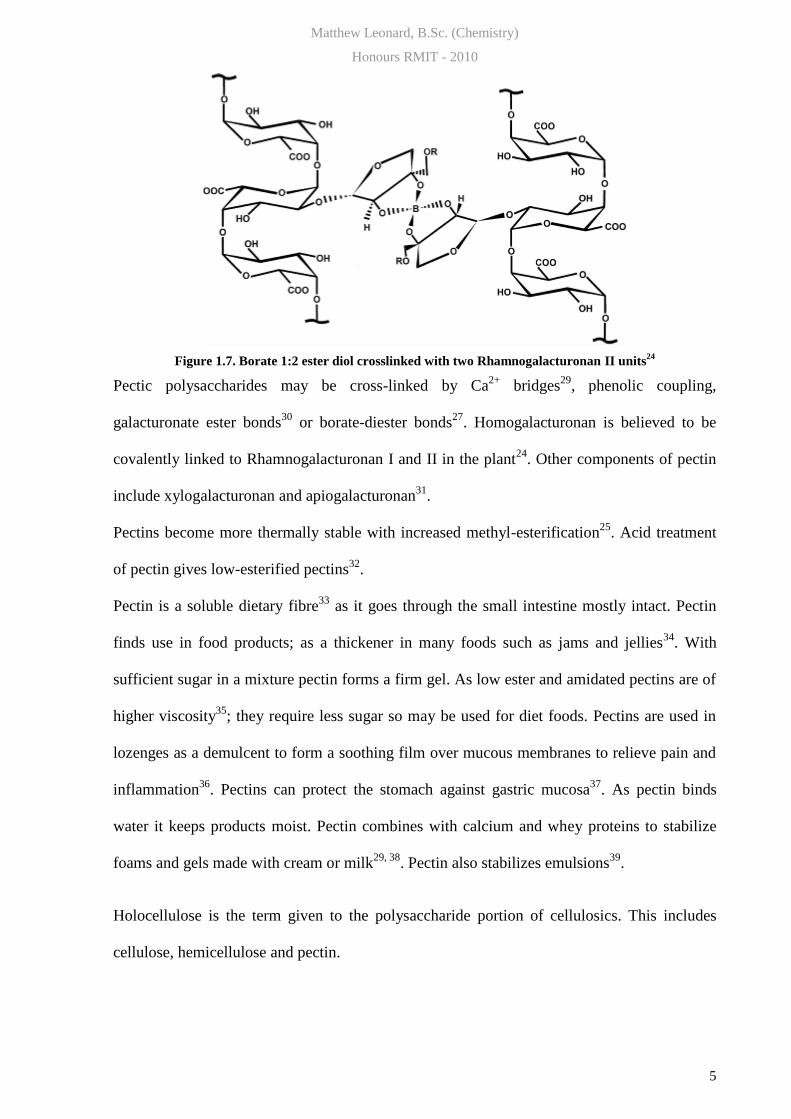
rhamnogalacturonans are less abundant. Rhamnogalacturonan II exists predominantly in a
crosslinked form of a 1:2 borate diol ester complex27-28
(Fig 1.7.).
Matthew Leonard, B.Sc. (Chemistry)
Honours RMIT - 2010
5
Figure 1.7. Borate 1:2 ester diol crosslinked with two Rhamnogalacturonan II units24
Pectic polysaccharides may be cross-linked by Ca2+
bridges29
, phenolic coupling,
galacturonate ester bonds30
or borate-diester bonds27
. Homogalacturonan is believed to be
covalently linked to Rhamnogalacturonan I and II in the plant24
. Other components of pectin
include xylogalacturonan and apiogalacturonan31
.
Pectins become more thermally stable with increased methyl-esterification25
. Acid treatment
of pectin gives low-esterified pectins32
.
Pectin is a soluble dietary fibre33
as it goes through the small intestine mostly intact. Pectin
finds use in food products; as a thickener in many foods such as jams and jellies34
. With
sufficient sugar in a mixture pectin forms a firm gel. As low ester and amidated pectins are of
higher viscosity35
; they require less sugar so may be used for diet foods. Pectins are used in
lozenges as a demulcent to form a soothing film over mucous membranes to relieve pain and
inflammation36
. Pectins can protect the stomach against gastric mucosa37
. As pectin binds
water it keeps products moist. Pectin combines with calcium and whey proteins to stabilize
foams and gels made with cream or milk29, 38
. Pectin also stabilizes emulsions39
.
Holocellulose is the term given to the polysaccharide portion of cellulosics. This includes
cellulose, hemicellulose and pectin.
Matthew Leonard, B.Sc. (Chemistry)
Honours RMIT - 2010
6
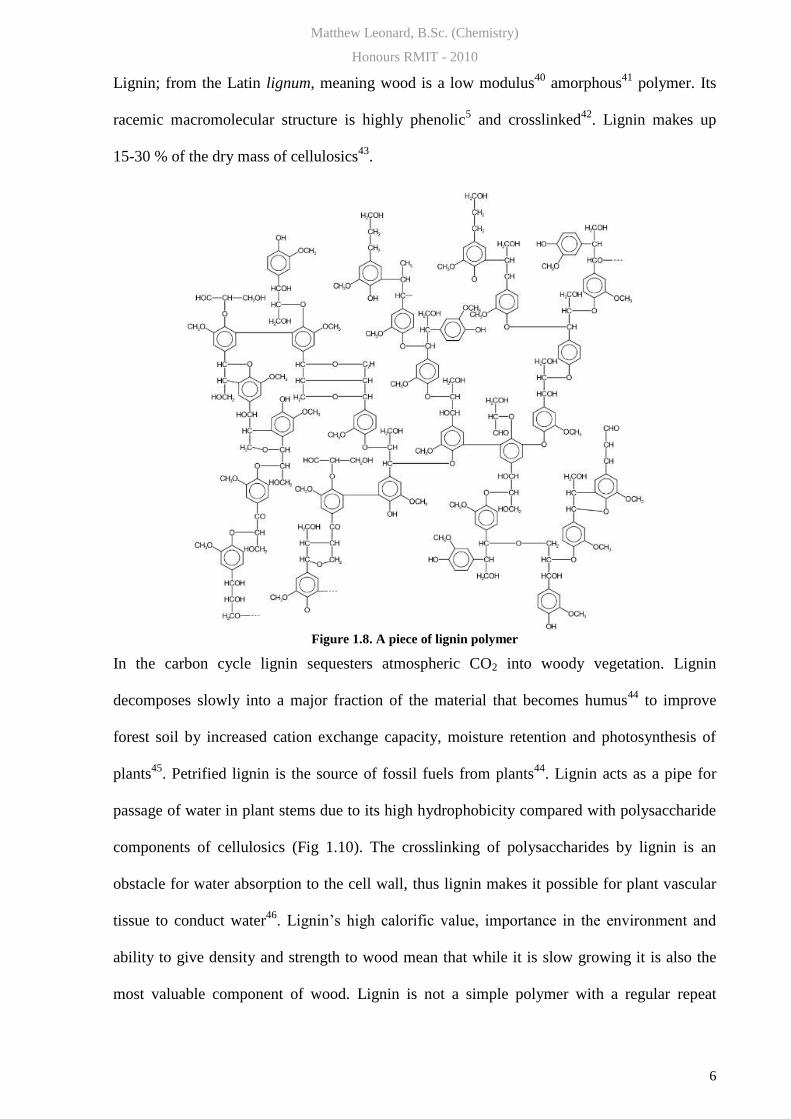
Lignin; from the Latin lignum, meaning wood is a low modulus40
amorphous41
polymer. Its
racemic macromolecular structure is highly phenolic5 and crosslinked
42. Lignin makes up
15-30 % of the dry mass of cellulosics43
.
Figure 1.8. A piece of lignin polymer
In the carbon cycle lignin sequesters atmospheric CO2 into woody vegetation. Lignin
decomposes slowly into a major fraction of the material that becomes humus44
to improve
forest soil by increased cation exchange capacity, moisture retention and photosynthesis of
plants45
. Petrified lignin is the source of fossil fuels from plants44
. Lignin acts as a pipe for
passage of water in plant stems due to its high hydrophobicity compared with polysaccharide
components of cellulosics (Fig 1.10). The crosslinking of polysaccharides by lignin is an
obstacle for water absorption to the cell wall, thus lignin makes it possible for plant vascular
tissue to conduct water46
. Lignin’s high calorific value, importance in the environment and
ability to give density and strength to wood mean that while it is slow growing it is also the
most valuable component of wood. Lignin is not a simple polymer with a regular repeat
Matthew Leonard, B.Sc. (Chemistry)
Honours RMIT - 2010
7
unit47
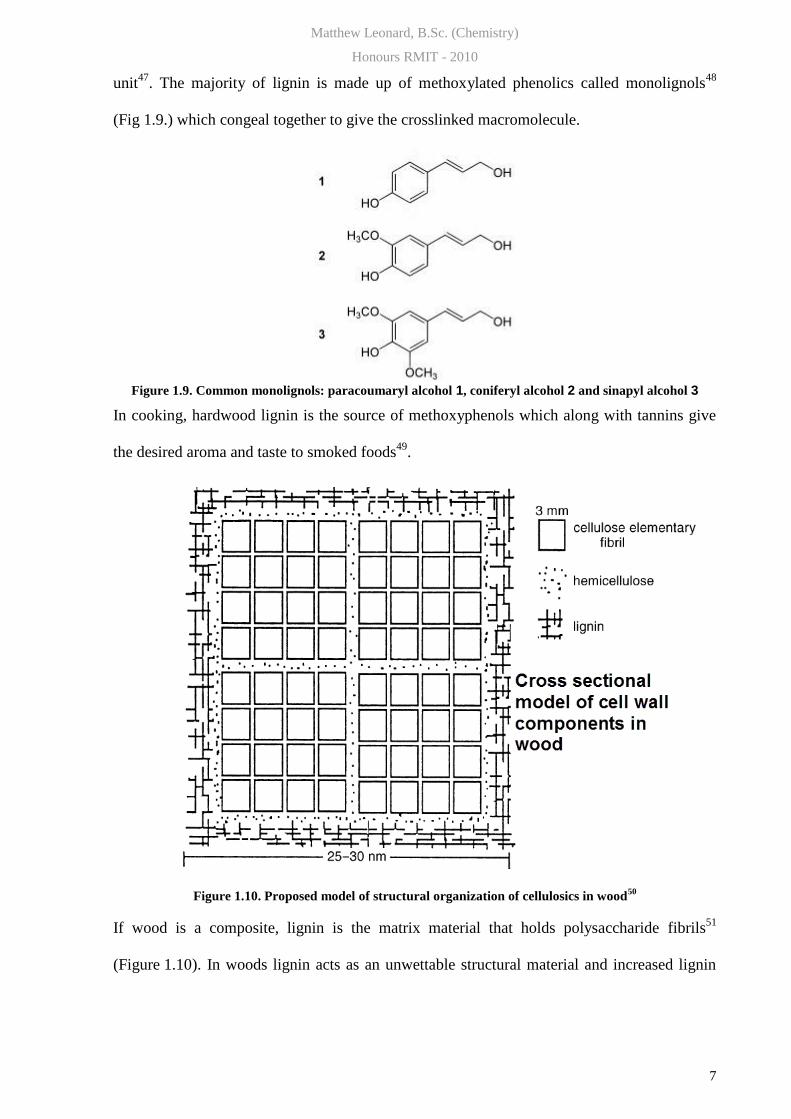
. The majority of lignin is made up of methoxylated phenolics called monolignols48
(Fig 1.9.) which congeal together to give the crosslinked macromolecule.
Figure 1.9. Common monolignols: paracoumaryl alcohol 1, coniferyl alcohol 2 and sinapyl alcohol 3
In cooking, hardwood lignin is the source of methoxyphenols which along with tannins give
the desired aroma and taste to smoked foods49
.
Figure 1.10. Proposed model of structural organization of cellulosics in wood50
If wood is a composite, lignin is the matrix material that holds polysaccharide fibrils51
(Figure 1.10). In woods lignin acts as an unwettable structural material and increased lignin

Matthew Leonard, B.Sc. (Chemistry)
Honours RMIT - 2010
8
content gives enhanced dimensional stability52
. Lignin gives mechanical strength to cell
walls53
and the plant as a whole as it is covalently bonded to holocellulose54
(Fig 1.10.).
High lignin wood is dense and a good material for many applications. Lignin is abundant in
compression wood but scarce in tension wood21
. Lignin yields more energy when burned than
cellulose55
so high lignin woods make better fuel. Mechanical pulp used for newsprint has a
portion of lignin retained. This cheaper product gives more pulp per ton of wood but higher
acid content reduces its archival properties56
. Lignin is responsible for newsprint yellowing
with age. This also explains why newsprint burns better than plain white paper. Lignin must
be chemically removed from pulp to produce high quality bleached paper57
. Removed lignin
is burned in a recovery boiler for energy to run the mill58
. More recently extracted lignin from
wood has been used for polyols in polyurethane foam59
.
Tannins are polyphenolics which can give a strong colour for leather tanning and may act as a
defence mechanism for plants. Tannins present in coffee, chocolate and red wine can cause
yellowing of teeth60
. Tannins effect grape ripening and ageing of wine61
. Tannins are found in
fruit, vegetables and nuts where they give a bitter taste62
. High tannin intake can be toxic to
humans63
.
Figure 1.11. Gallic acid – A monomer of tannin
Tannin monomers are small phenolics units (Fig 1.11.) which may be hydrolysed and
condensed (Fig 1.12.).
Matthew Leonard, B.Sc. (Chemistry)
Honours RMIT - 2010
9
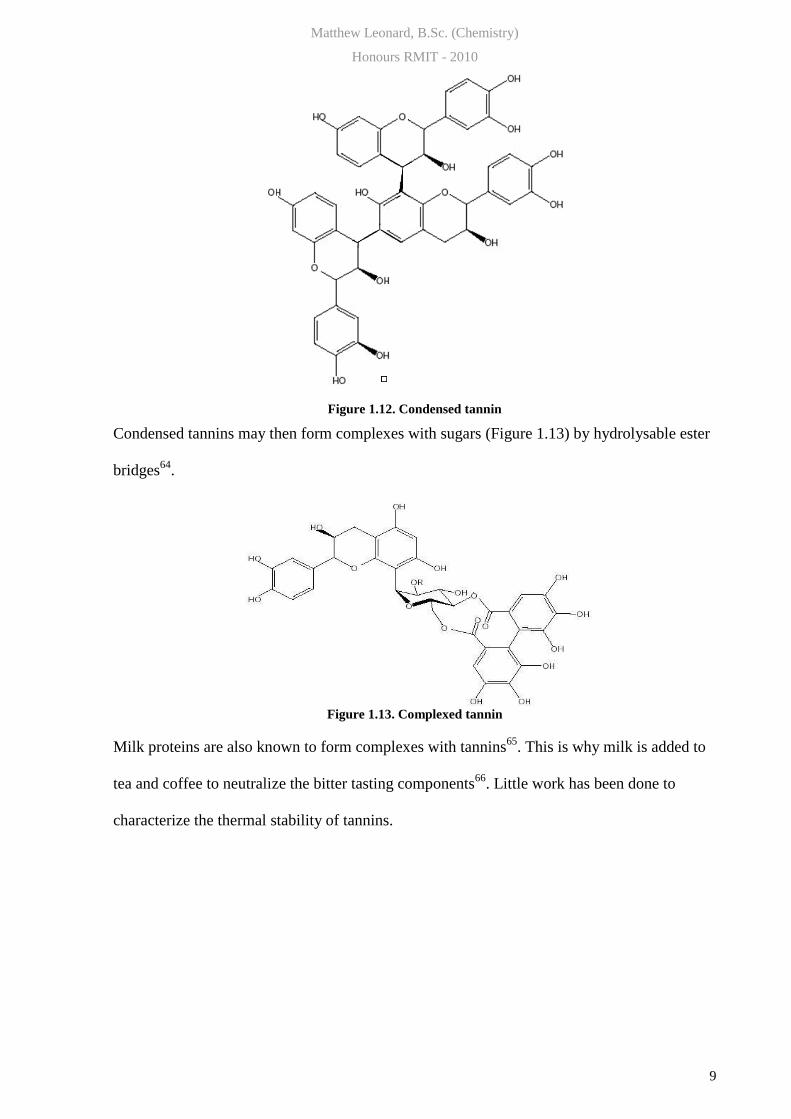
Figure 1.12. Condensed tannin
Condensed tannins may then form complexes with sugars (Figure 1.13) by hydrolysable ester
bridges64
.
Figure 1.13. Complexed tannin
Milk proteins are also known to form complexes with tannins65
. This is why milk is added to
tea and coffee to neutralize the bitter tasting components66
. Little work has been done to
characterize the thermal stability of tannins.
Matthew Leonard, B.Sc. (Chemistry)
Honours RMIT - 2010
10
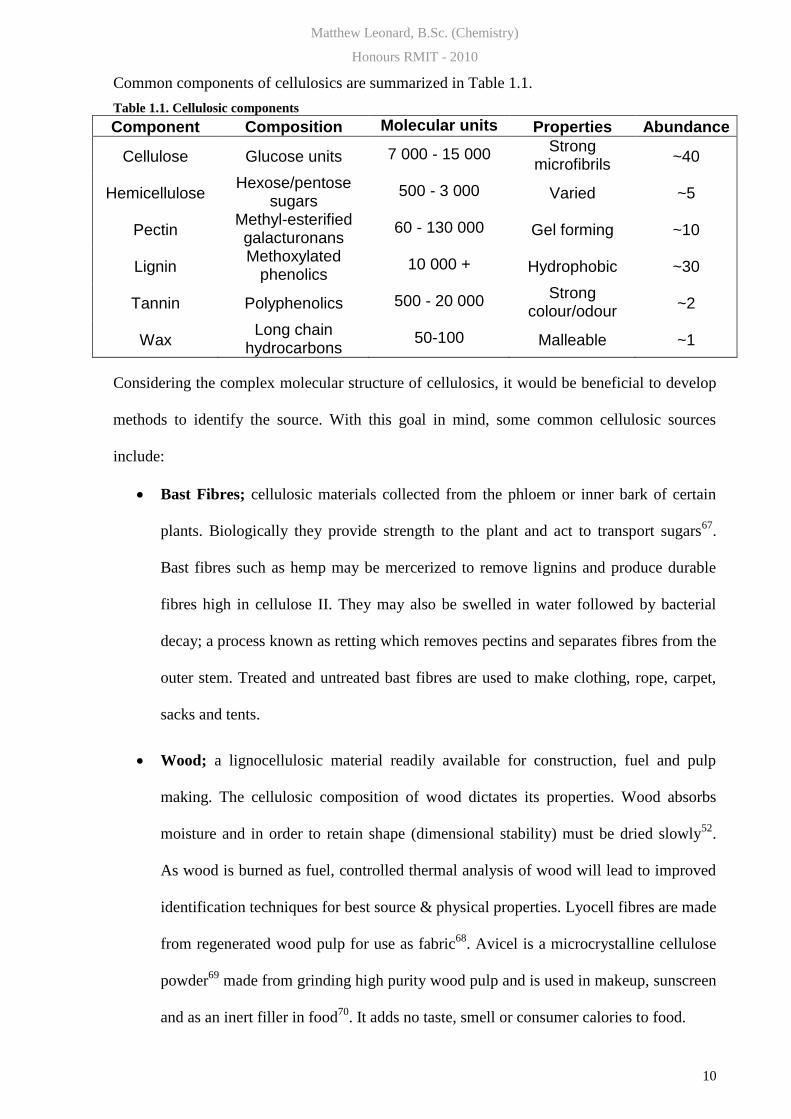
Common components of cellulosics are summarized in Table 1.1.
Table 1.1. Cellulosic components
Component Composition Molecular units Properties Abundance
Cellulose Glucose units 7 000 - 15 000 Strong
microfibrils ~40
Hemicellulose Hexose/pentose
sugars 500 - 3 000 Varied ~5
Pectin Methyl-esterified galacturonans
60 - 130 000 Gel forming ~10
Lignin Methoxylated
phenolics 10 000 + Hydrophobic ~30
Tannin Polyphenolics 500 - 20 000 Strong
colour/odour ~2
Wax Long chain
hydrocarbons 50-100 Malleable ~1
Considering the complex molecular structure of cellulosics, it would be beneficial to develop
methods to identify the source. With this goal in mind, some common cellulosic sources
include:
Bast Fibres; cellulosic materials collected from the phloem or inner bark of certain
plants. Biologically they provide strength to the plant and act to transport sugars67
.
Bast fibres such as hemp may be mercerized to remove lignins and produce durable
fibres high in cellulose II. They may also be swelled in water followed by bacterial
decay; a process known as retting which removes pectins and separates fibres from the
outer stem. Treated and untreated bast fibres are used to make clothing, rope, carpet,
sacks and tents.
Wood; a lignocellulosic material readily available for construction, fuel and pulp
making. The cellulosic composition of wood dictates its properties. Wood absorbs
moisture and in order to retain shape (dimensional stability) must be dried slowly52
.
As wood is burned as fuel, controlled thermal analysis of wood will lead to improved
identification techniques for best source & physical properties. Lyocell fibres are made
from regenerated wood pulp for use as fabric68
. Avicel is a microcrystalline cellulose
powder69
made from grinding high purity wood pulp and is used in makeup, sunscreen
and as an inert filler in food70
. It adds no taste, smell or consumer calories to food.

Matthew Leonard, B.Sc. (Chemistry)
Honours RMIT - 2010
11
Cotton; a plant native to subtropical regions. Cotton is a unique type of plant fibre. It
is valued for its high purity cellulose that comes in durable bolls. Mercerized cotton is
used for clothing and fine fabrics.
Grasses/tussock; cellulosic source that can grow unaided in many parts of the world.
Grasses and tussock are often planted for aesthetic purposes. Grasses such as
switchgrass (Panicum virgatum) and Miscanthus giganteus may be grown for biofuels.
Conversely they may be a pest, such as South American Nassella trichotoma known
as serrated tussock (introduced to Australia).
Cellulosic biomass; cellulosic by products from industry may be used for fuel. Food
waste such as from banana, coconut and olive production may give cellulosics for fuel
making prediction of calorific value important. Coconut fibres between the hard
internal shell and outer coat are retted to produce coir to make door mats, brushes or
pot plants. Cellulosic fibres from industrial waste may be used as reinforcement for
polymer matrices in composites71
.
Other cellulosic materials; Cellulose acetate, cellulose nitrate and Bacterial cellulose
are also of interest particularly for crystallinity.
With such a wide variety of cellulosics in use, the original source of a sample may not be
clear. It may also be desired to characterize crystal form or molecular component distribution
by simpler, quicker, cheaper technology than that presently used. As crystal form and
molecular component distribution determine properties of the material, rapid characterization
and classification methods may lead to a wide number of applications.
Matthew Leonard, B.Sc. (Chemistry)
Honours RMIT - 2010
12
Aim and objectives
Aim: Explore Chemometric classification techniques for cellulosics to add to knowledge of cellulosics chemistry.
Objectives:
• Gather and prepare cellulosic samples from a variety of sources
• Analyze with proven instruments using repeatable and non-biased experiments to
produce spectral data
• Extract and treat data for application of proven Chemometric techniques
• Observe chemistry of cellulosics and explore techniques to classify cellulosics by
source
• Add to knowledge for further research by showing whether there is useful information
by this approach
Matthew Leonard, B.Sc. (Chemistry)
Honours RMIT - 2010
13
Cellulosics that have been observed in recent literature include bast fibres such as jute72
,
sisal73
, flax2, 74-75
and hemp12, 76
. Bos et al. have shown compression failure of flax fibres to be
similar to that of stranded wire2. Martin et al. have compared chemically treated with native
sisal to show that removal of lignin lowers the thermal stability of sisal fibres73
. Wang et al.
have observed an interconnected web-like structure of hemp fibres after mercerization13
.
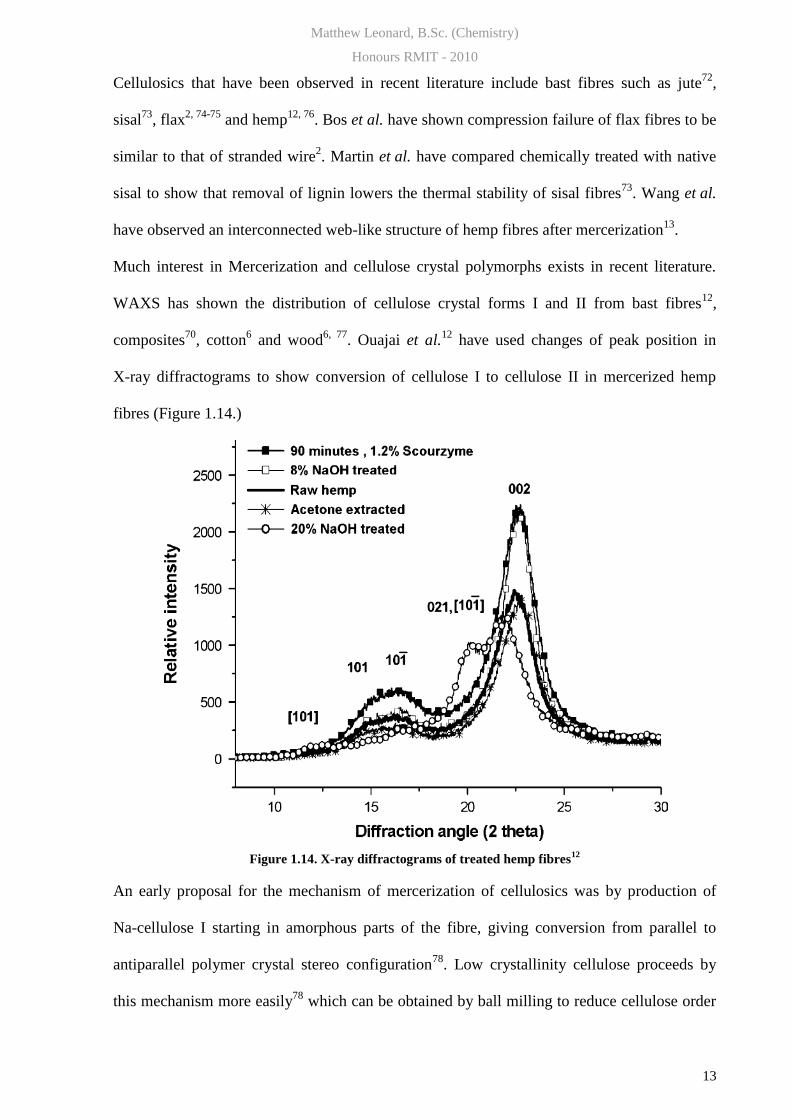
Much interest in Mercerization and cellulose crystal polymorphs exists in recent literature.
WAXS has shown the distribution of cellulose crystal forms I and II from bast fibres12
,
composites70
, cotton6 and wood
6, 77. Ouajai et al.
12 have used changes of peak position in
X-ray diffractograms to show conversion of cellulose I to cellulose II in mercerized hemp
fibres (Figure 1.14.)
Figure 1.14. X-ray diffractograms of treated hemp fibres12
An early proposal for the mechanism of mercerization of cellulosics was by production of
Na-cellulose I starting in amorphous parts of the fibre, giving conversion from parallel to
antiparallel polymer crystal stereo configuration78
. Low crystallinity cellulose proceeds by
this mechanism more easily78
which can be obtained by ball milling to reduce cellulose order

Matthew Leonard, B.Sc. (Chemistry)
Honours RMIT - 2010
14
to a mostly amorphous state79
. Fink et al. have proposed a nonuniform fringed fibrillar
model16
rather than the parallel-antiparallel transition of chain arrangement. Gwon et al. have
proposed a mechanism where Na+ ions effect the degree of fibre swelling by widening the
smallest pores of the cellulose I polymorph80
. This mechanism has an intermediate lattice
where OH groups are replaced with larger dimension ONa groups. Na is then removed by
water during rinsing to leave the reordered cellulose II polymorph (Figure 1.15.).
Figure 1.15. Schematic of the crystalline structure transformation by NaOH treatment80
Borysiak et al. have shown that degree of conversion of cellulose polymorph I to II in
beechwood depends on concentration and time of NaOH treatment77
.
Thermal properties have been observed of viscose1, 3
; a clothing fibre regenerated by
extrusion of hemp cellulose. Stanković et al. have shown that natural fibre fabrics give better
heat transfer properties than regenerated fibre fabrics1.
The thermal decomposition of cellulosics is of great interest. Wood cellulosics have been
observed for degradation and crystallinity properties in species such as Norway spruce81
,
pine82
and eucalypt83
. Thermal decomposition of Lyocell; a fibre from regenerated wood, has
been observed by Dadashian et al. using FTIR and WAXS84
. Cotton products and sources
have been observed for thermal properties85
, crystallinity86
and best harvest time87
. Crystallite

Matthew Leonard, B.Sc. (Chemistry)
Honours RMIT - 2010
15
size of cellulose polymorph Iβ has been shown not to effect activation energy for thermal
degradation88
. Brosse et al. have shown that average molecular weight of heat treated milled
wood lignin is lower than native wood lignin89
. Müller-Hagedorn et al. have observed the
pyrolysis kinetics of wood90
. Avicel has been compared to unrefined cellulose forms81
.
Chabannes et al. have shown that lignin in cell walls of transgenic tobacco is tightly and
independently regulated in individual cell types of the plant91
.
Serrated tussock; a weed of significance in Victoria92
is known as a pest due to its high fibre
and low protein content93
. Relatively little peer reviewed research of its properties has been
published. Recent biomass research includes coconut husk fibres94
, switchgrass95
and sugar-
cane bagasse92, 94, 96
. Mothé et al. have analyzed chemical composition by X-ray fluorescence
(XRF) of ash residue from sugarcane bagasse in TGA94
.
Table 1.2. XRF analysis of ashes of sugarcane bagasse94
Naik et al. have determined sugar monomer content from cellulosic biomass by acid
hydrolysis and high performance liquid chromatography (HPLC)5. The study also showed that
pinewood had a lower lignin content than other sources observed by FTIR5.
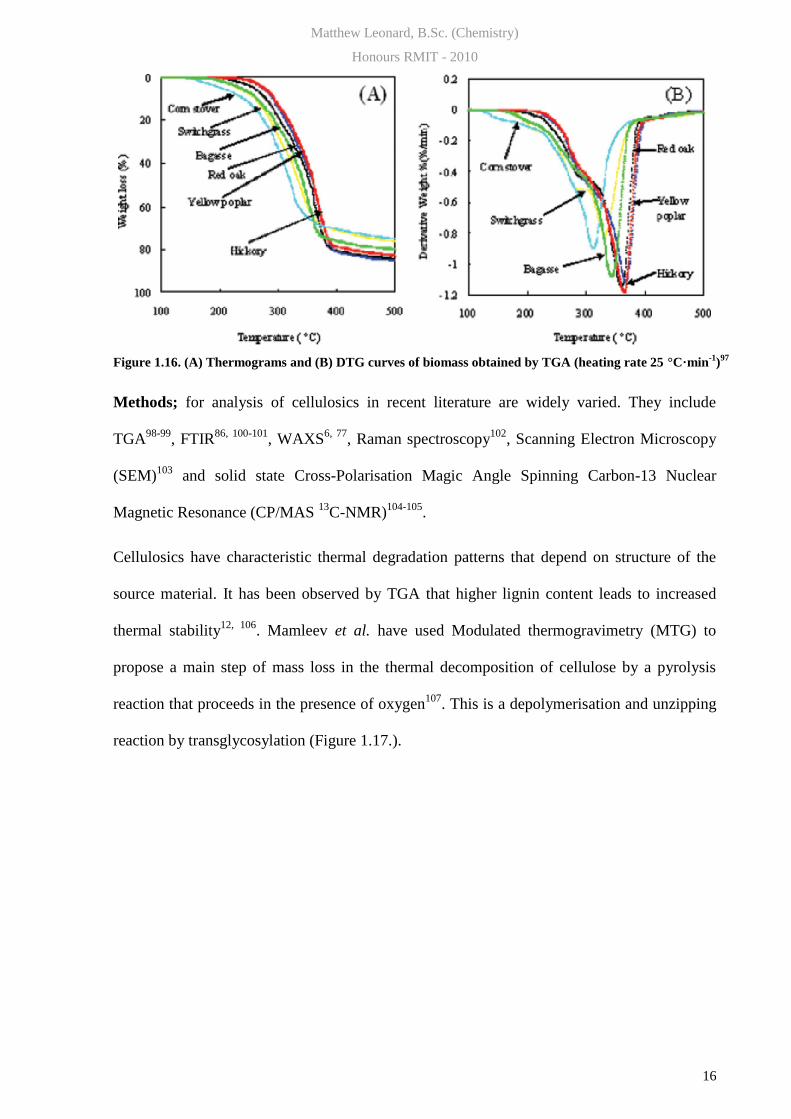
Lee et al. have compared thermograms and derivative thermograms from a variety of biomass
sources (Figure 1.16.)97
.
Matthew Leonard, B.Sc. (Chemistry)
Honours RMIT - 2010
16
Figure 1.16. (A) Thermograms and (B) DTG curves of biomass obtained by TGA (heating rate 25 °C·min-1
)97
Methods; for analysis of cellulosics in recent literature are widely varied. They include
TGA98-99
, FTIR86, 100-101
, WAXS6, 77
, Raman spectroscopy102
, Scanning Electron Microscopy
(SEM)103
and solid state Cross-Polarisation Magic Angle Spinning Carbon-13 Nuclear
Magnetic Resonance (CP/MAS 13
C-NMR)104-105
.
Cellulosics have characteristic thermal degradation patterns that depend on structure of the
source material. It has been observed by TGA that higher lignin content leads to increased
thermal stability12, 106
. Mamleev et al. have used Modulated thermogravimetry (MTG) to
propose a main step of mass loss in the thermal decomposition of cellulose by a pyrolysis
reaction that proceeds in the presence of oxygen107
. This is a depolymerisation and unzipping
reaction by transglycosylation (Figure 1.17.).

Matthew Leonard, B.Sc. (Chemistry)
Honours RMIT - 2010
17
Figure 1.17. Proposed kinetic scheme for the main step of cellulose pyrolysis107
Shanks et al. have used TGA to show change in crystallinity of hemp fibres after
mercerization12
and bioscouring103
. Donato et al. have shown that archaeological wood may
be assessed by TGA for preservation treatment 99
.
FTIR may be used to characterize cellulosics108
. Naik et al. have characterized biomass
cellulosics by FTIR of solvent extract5. Extracts showed consistent yield of glucose, but a
large deviation of cellulobiose, xylose, galactose, arabinose and mannose among cellulose
source5. Ouajai et al. have shown a way to observe the level of cellulose crystallinity by
intermolecular hydrogen bonding from FTIR spectroscopy. As hydrogen bonding can effect
the electronic environment of the covalent bonds, a change in the bands in FTIR spectra
occurs with differing crystallinity. This was confirmed by correlation with WAXS results4.
Multiple internal reflectance is a sampling method for FTIR. A diamond or other crystal is
used as an internal reflectance element and can show chemical differences between inner and
outer layer of cellulosics109
.
Matthew Leonard, B.Sc. (Chemistry)
Honours RMIT - 2010
18
X-ray diffraction (XRD) which has been used to observe cellulose110
is interchangeable with
WAXS. Both methods describe crystal unit cell dimension by 2θ angle results from scattering
of X-rays. In WAXS X-rays are diffracted by passing through crystalline samples, whereas
XRD measures diffraction. Crystalline molecules give coherent scattering111
, also known as in
phase scattering. Greater in phase scattering or order in diffractograms shows a higher level of
crystallinity. For diffraction of photons the wavelength must be close to half of the particle
size, which makes X-rays suited to diffraction by molecules. Wider angles measure smaller
particles/crystals, while smaller angles measure larger particles112
. Ouajai et al.12
and
Borysiak et al.77
have used WAXS to show level of transformation to cellulose II from
mercerization.
Raman uses the concept of inelastic scattering of light to measure molecular structure from
vibrational modes. FTIR peaks tend to be intense from polar bonds like O-H and C=O but
weak from less polar bonds like C-C and C-H. The reverse is true with Raman. Polarity of
covalent bonds gives anharmonic vibration. More polar bonds and especially those involving
hydrogen generate weak overtones in the NIR region. The Raman Effect intensifies these
overtones and Raman spectra of cellulose are more difficult to achieve. Raman has only
recently developed to a point able to give acceptable quality spectra for cellulosics47
. As well
as a powerful laser, increased excitation time at 1064 nm can give more observable spectra as
lignin, which tends to fluoresce and give noise has significantly reduced absorption at that
wavelength47
. Band intensities have been extensively assigned to vibrational modes47
.
Schenzel et al. have used Raman to observe the transformation of cellulose I → cellulose II
by conversion of a peak due to glucopyranose ring structure from 352 cm-1
to 379 cm-1
(Figure 1.18)113
. They also showed creation of a peak at 1461 cm-1
due to CH2OH
polysaccharide side chains from two different stereochemical environments converting to
one113
.

Matthew Leonard, B.Sc. (Chemistry)
Honours RMIT - 2010
19
Figure 1.18. Raman spectra of generated mixtures of cellulose I and II representing adjusted degrees of
the polymorphic transformation of cellulose I → cellulose II113
These CH2OH groups were shown to hydrogen bond in a different lattice structure to effect
twisting modes113
which caused a peak at 1294 cm-1
to move to 1265 cm-1
.
Agarwal et al. have developed a silver nanoparticle treatment to enhance surface effects of
spruce milled-wood lignin and describe lignin monomers in more detail by Raman spectra47
.
SEM has been used for surface observation of cellulose fibres6. Zhao et al. have used SEM to
compare cellulose macrofibrils partially acid hydrolyzed and untreated cotton linters. They
found that cellulose macrofibrils became more agglomerated with increased acid hydrolysis
treatment8. Faughey et al. have compared thermogram data with Scanning electron
microscopy (Figure 1.19.) to show that fibre fineness in flax may be predicted from TGA74
.
Figure 1.19. SEMs of fine (a) and coarse (b) flax fibers, showing the presence of noncellulosic
polysaccharides cementing the fiber bundles (b). (Bars represent 20 μm)74

Matthew Leonard, B.Sc. (Chemistry)
Honours RMIT - 2010
20
CP/MAS 13
C-NMR measures cellulose crystallinity by different spin-lattice relaxation times
of crystalline and amorphous cellulose114
. CP/MAS 13
C-NMR results have correlated with
WAXS115
. Wickholm et al. have used CP/MAS 13
C-NMR to assign signals to amorphous
cellulose (80-86 ppm) and para-crystalline cellulose I (86-90 ppm) from pulp and cotton
linters116
. Delmotte et al. have used CP/MAS 13
C-NMR to show crosslinking of lignin by
rearrangement of methoxy groups in wood during friction welding100
. Common instruments
for observation of cellulosics are listed in Table 1.3.
Table 1.3. Common instruments for cellulosics observation
Instrument Shows
TGA Mass loss as a function of temperature IR Asymmetric vibrational modes of covalent bonds Raman Vibrational modes of less polar bonds WAXS Crystal polymorph distribution SAXS Distance between crystallites NIR Asymmetric vibrational modes/overtones 13C-NMR Change in chemical shift of Carbon-13 nuclear magnetic resonance SEM Surface images
Small-angle X-ray scattering (SAXS) can complement WAXS to observe cellulosics117
.
Leppänen et al. have used SAXS to detect average diameter of cellulose microfibril cores
from Norway spruce wood6. Kennedy et al. have measured diameter of celery microfibril
cellulose by SAXS118
. Elazzouzi-Hafraoui et al. have observed crystalline nanoparticles from
cotton and Avicel using SAXS to compliment WAXS119
. Other recent methods for cellulosics
observation include trace metal analysis by Inductively Coupled plasma-Mass Spectrometry
(ICP-MS)5, X-ray photoelectron spectroscopy (XPS)
120-121, Ultraviolet-Visible spectroscopy
(UV-Vis)122
, Fourier transform near infrared spectroscopy (NIR)123
, modulated
thermogravimetry (MTG)107
and TGA-mass spectrometry (TG-MS)124
.
ICP-MS has been used to analyze cellulosic pyrolysis residues extracted from TGA. Helsen
et al. have used this method to compare Cr, Cu and As levels in treated and untreated
sapwood. The presence of Cr, Cu and As were shown to lower pyrolysis onset temperature
and temperature of maximum mass loss rate125
. Rout et al. have used ICP-MS to determine
Matthew Leonard, B.Sc. (Chemistry)
Honours RMIT - 2010
21
elemental concentration in TGA ash residue from Biomass oil derived from wheat and wood
sawdust18
.
Vilela et al. have observed surface properties of prepared CaCO3-Cellulose nanocomposites
by XPS to show that carbon and oxygen were the dominant elements120
. Brígida et al. have
evaluated surface element distribution of NaOCl, NaOH and H2O2 treated coconut fibers121
.
Chen et al. have used UV-Vis to assess raw sugarcane bagasse used for bioethanol production
for its visible light absorption122
. This same study found that TGA was effective for
comparison of hemicellulose, cellulose, lignin, dextran and glucose levels in raw and acid
treated bagasse122
. NIR has used vibrational mode overtones to show chemical bonds in
thicker samples to reduce sample preparation time126
.
A wide variety of methods have been used for cellulosics analysis in recent literature. They
vary in cost, time, expertise, sample preparation and sample destruction. Some methods
complement others and often more than one is necessary for meaningful results. A wise
selection of technique can give insight into the physical properties and best use of cellulosics.
Some methods provide data that is suitable for use with Chemometrics for further
identification102
.
Chemometrics; is the science of extracting useful information from chemical data. This data
is analysed using chemometric methods and results may be visualized so that seemingly
insignificant data show clear patterns. Software includes Minitab, Unscrambler123
, MatLab
and Umetrics. Software may also be used for optimization of the design of experiments127
.
Chemometric techniques may be broken down into unsupervised (pattern exploration) and
supervised (pattern recognition). Unsupervised Chemometric methods include PCA 124, 128-130
,
Partial Least Squares (PLS) regression131
and Principal Components Regression (PCR)132
.
Supervised methods include LDA, K-Nearest Neighbours (KNN) and Discriminant Partial
Least Squares (DPLS) (Table 1.4.). The related methods LDA and QDA vary by their cluster
differentiation. LDA uses a straight line to define clusters while QDA uses a quadratic.

Matthew Leonard, B.Sc. (Chemistry)
Honours RMIT - 2010
22
Table 1.4. Common Chemometric techniques
Technique Type
Principal Components Analysis (PCA) Unsupervised Partial Least Squares (PLS) Unsupervised Principal Components Regression (PCR) Unsupervised Nearest Mean Classifier Supervised Linear Discriminant Analysis (LDA) Supervised Regularized Discriminant Analysis (RDA) Supervised Quadratic Discriminant Analysis (QDA) Supervised K-Nearest Neighbours (KNN) Supervised Discriminant Partial Least Squares (DPLS) Supervised Soft Independent Modelling of Class Analogies(SIMCA) Supervised
When applied to project data an unsupervised technique is first chosen for feature selection to
reduce data dimensionality. A supervised method is chosen to discriminate sample classes. A
common unsupervised technique is PCA with a plot of the first two Principal Components
used to visualize clusters. An unsupervised method is tested and another tried later if the first
gives poor response. Choice of supervised method depends on the size of the training set, how
closely the class population follows a normal (Gaussian) distribution and whether covariances
in the classes are equal133
. Wu et al. compared LDA, RDA and QDA using NIR data133
to
show that QDA is unlikely to produce satisfactory results unless the ratio of the class sample
sizes is large relative to the number of variables. QDA had no advantage over LDA except
when class covariance matrices were quite different. RDA gave results equal or better than
LDA and QDA133
. Roggo et al. compared supervised methods on NIR data to show that non-
linear methods gave less accurate results134
.
Recent Chemometric research has used TGA124
, FTIR135
and Raman113, 136
data for feature
extraction and classification. Lee et al. have used statistical analysis for quick assessment of
thermal decomposition behaviour of Lignocellulosic biomass by NIR and TGA97
. Mann
et al.95
and Malkavaara et al.137
used PLS on FTIR and UV-Vis data respectively to construct
models for rapid lignin content prediction. Basile et al. have used PLS cross validated by
RDA to quantify serpentine in nickel laterite ores by FTIR data135
.

Matthew Leonard, B.Sc. (Chemistry)
Honours RMIT - 2010
23
Gilbert et al. have used SIMCA with FTIR data to discriminate cellulosic fabrics by dye and
processing stage130
. Lennholm et al.128
have used a PLS with CP/MAS 13
C-NMR data to
quantify cellulose I crystal forms. X-ray and NMR spectrometers are expensive so
Chemometrics aims to find low costs alternatives. WAXS Bragg peaks have been predicted
with high correlation by PLS using NIR123
and Raman data102, 113
. Other polymeric
compounds may also be assessed by Chemometrics. Hughes et al. have characterized
polyethylenes by PCA score plots from differential scanning calorimetry (DSC) data and
RDA using FTIR data138
. The RDA model correctly assigned polyethylenes by 3 density
classes from DSC data (Figure 1.20.).
Figure 1.20. RDA misclassification plot of polyethylene samples by density from DSC data
138
Statheropoulos et al. observed a styrene-isoprene copolymer139
and cellulose thermal
decomposition124
by PCA and factor analysis from TG-MS data.
Instrumental techniques used in this project:
Thermogravimetric analysis (TGA); can show cellulose, hemicellulose and lignin
distribution in cellulosics140
. TGA uses small samples (~2 mg)141
and a controlled
temperature program. Mass is recorded continuously as a function of temperature as
the sample is heated142
. Sample mass is plotted against temperature to show the
temperature where mass loss occurs in the sample. In some cases the first or second
derivative is plotted to help pick a maximum point of mass loss. As cellulosics are

Matthew Leonard, B.Sc. (Chemistry)
Honours RMIT - 2010
24
made up of hydrocarbons they decompose by combustion with oxygen. TGA aims to
overcome this by use of an inert purge gas. Cellulosics will then decompose by
pyrolysis and will give more varied decomposition temperature. Perkin Elmer
manufactures TGAs with glass rods that connect the sample crucible to the balance.
Older models have platinum rods. Heating rate has been shown to effect accuracy of
cellulosic analysis by TGA143
. TGA provides a great deal of information, but is not
molecule specific. TGA is often used as a confirmatory technique for material
synthesis; such as polymers144-145
, catalysts145-146
and inorganic materials147-148
.
Fourier transform Infrared spectroscopy (FTIR); is a well used method for
measurement of atomic vibrations. Asymmetric vibrational modes give characteristic
absorbances in the IR spectrum. FTIR can detect subtle chemical changes and spectra
can contain a great deal of information.
Raman spectroscopy; excites atoms by laser and measures emitted inelastic light.
May be used as a confirmatory technique to FTIR as it gives more intense signals
from less polar bonds; the reverse of FTIR149
.
Wide angle X-ray scattering (WAXS); diffractograms give Bragg peaks, which each
correspond to a plane in a crystal unit cell150
. Known Bragg peaks can show
distribution of cellulose polymorphs and diffractograms may be used to calculate
crystal thickness70, 151
and crystallinity index of cellulose70
.
The chemistry behind spectroscopic observations reflects structural differences of cellulosics
on a molecular level. This may be a reflection of crystal alignment and level of crystallinity4.
Native cellulose is known to exist in two main crystal forms with most materials having a
combination of both152
. No peer reviewed research has used chemometrics from TGA to
classify cellulosics by source. It is an area worth exploring as thermal degradation
mechanisms of cellulosic components may be drawn from chemometric results. This project

Matthew Leonard, B.Sc. (Chemistry)
Honours RMIT - 2010
25
aims to build on knowledge of complex cellulosics chemistry by investigating how TGA,
FTIR and Raman can be used to elucidate information.
Chemometric techniques used in this project:
Principal components analysis (PCA); is a proven unsupervised pattern finding
technique153
that forms new artificial (latent) variables known as principal components
which are linear combinations of the original variables. These principal components
are formed from distance to repeated axes that lie along data means. Each successive
component accounts for as much variation as possible not accounted for by the
previous components124
. PCA reduces data but preserves essential information caused
by the main sources of data variability133
. It is suitable for large data sets and may give
groupings that would not otherwise appear.
Linear Discriminant Analysis (LDA); is a proven supervised technique133, 154
. Class
assignments are calculated from multidimensional scatter using the Mahalanobis
distance.
(1.1)
χ’s are column vectors of measurements on a single object, C is the variance-covariance
matrix whose elements represent the covariance between any two variables. k and l are the
distance between 2 samples. T is the transpose of a matrix. A straight line is drawn between
each cluster for class assignment. This assumes that each class is equally scattered with the
same covariance structure. Misclassification plots may be drawn to display the success of the
model in assigning classes.
Tlklk xxCxx ** 1
Matthew Leonard, B.Sc. (Chemistry)
Honours RMIT - 2010
26
2. Methodology
Sample collection and preparation:
Samples of Hemp (genus Cannabis), Jute (Corchorus olitorius), Flax (Linum usitatissimum),
Rayon, viscose (regenerated cellulose) and Avicel (purified wood fibre) were obtained from
the RMIT chemistry store. Samples of white and coloured cotton were provided by
Dr. Eliangela de Morais Teixeira from EMBRAPA Agricultural Instrumentation, São Carlos -
SP, Brazil. Samples of furniture wood offcuts were supplied by a local manufacturer in High
street, Preston; Pine (Pinus radiata), Blackwood (Acacia melanoxylon), Victorian Ash
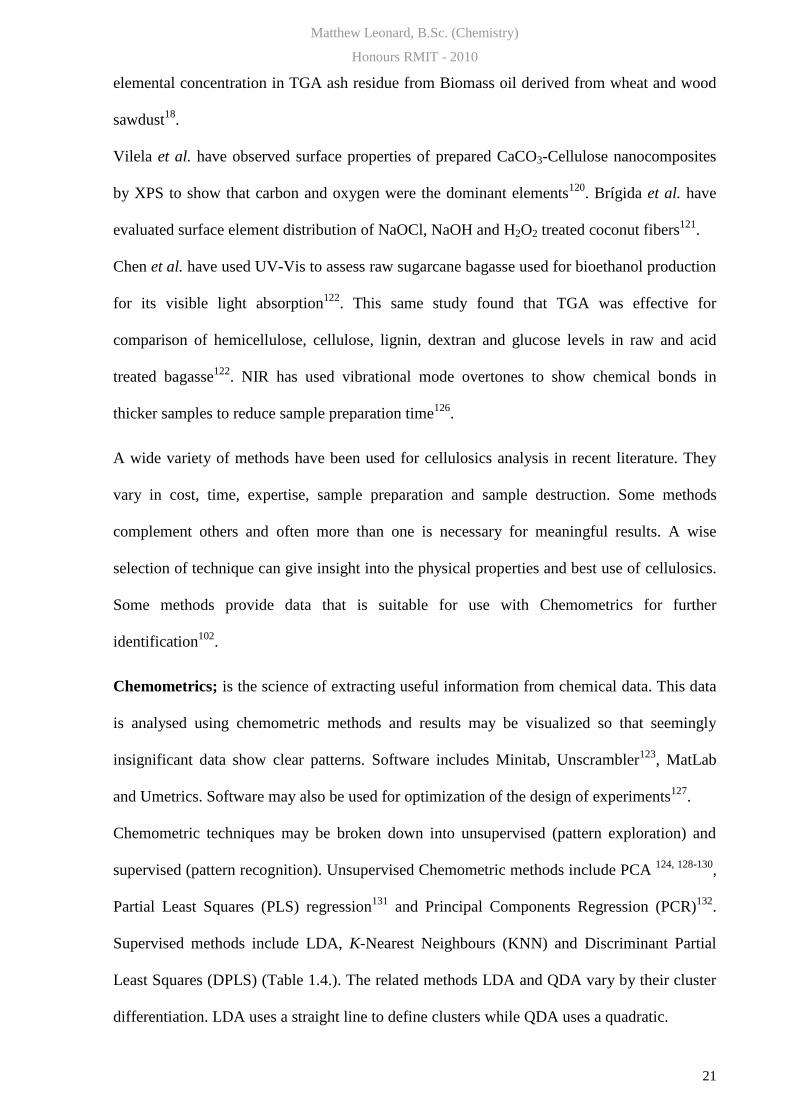
(Eucalyptus regnans) and Jarrah (Eucalyptus marginata). Samples of Serrated Tussock
(Nassella trichotoma) were collected by myself and Associate Professor Barry Meehan from
Studley Park Reserve, Kew, Victoria.
Figure 2.1. Studley Park Reserve, Kew Figure 2.2. Serrated Tussock sample
Coconut (Cocos nucifera) husk fibres were collected from the outside of 2 coconuts and
banana fruit fibres from the top of a bunch of Cavendish bananas (Genus Musa). These were
purchased by myself from Queen Victoria market, Melbourne.
Hemp, Jute, Flax, rayon, viscose and Avicel samples from the store were sufficiently dry for
testing. Serrated Tussock samples were cut and oven dried at 100 ºC for 6 h. All moisture
appeared to have gone as green fibres turned a light brown.

Matthew Leonard, B.Sc. (Chemistry)
Honours RMIT - 2010
27
Figure 2.3. Dried Serrated Tussock
Banana fibres were cut and dried at 100 ºC for 6 h to produce dry, usable pieces (Figure 2.4.).
Figure 2.4. Banana fruit fibres
Coconut husk fibres were found to be particularly dry already so were placed in oven at 60 ºC
for only 2 h.
Figure 3.5. Coconut with husk fibres
Sample preparation for X-ray scattering involved cutting wood to ~1 mm thickness, 4 mm
height and 15 mm width.
Matthew Leonard, B.Sc. (Chemistry)
Honours RMIT - 2010
28
The 17 prepared samples were divided into 5 classes (Table 2.1.).
Table 2.1. Sample classes
Sample Class
Hemp Bast Jute Bast Flax Bast
Blackwood Wood Pine Wood
Victorian Ash Wood Jarrah Wood
White cotton Cotton Green cotton Cotton Ruby cotton Cotton
Brown cotton Cotton Rayon Regenerated cellulose
Viscose Regenerated cellulose Avicel Regenerated cellulose
Banana Other Coconut Other
Serrated Tussock Other
Instrumentation
TGA experiments were run using a Perkin Elmer Pyris 1 TGA. A 2 mg sample was prepared
wearing rubber gloves to prevent contamination. Upon loading a wait time of 30 min was
adhered to allow any moisture that could evaporate at room temperature to evaporate. Purge
gas of nitrogen was used from 30-700 °C and air from 700-830 °C. A heating rate of
10 °C·min-1
was used from 30-830 °C, followed by holding for 10 min at 830 °C to burn off
any residue. Each sample run took ~ 82 min. Total turnaround time per sample was ~ 3 h. If
care was not taken thermograms may have bumps from the bench, static charge build up on
rod or an incorrectly zeroed load if sample was not allowed long enough to evaporate. In the
best case 3-4 runs per day were achieved. Validation experiments were run on both
instruments to check for intraday drift (See figures 3.10. & 3.11.). Part way through this
project the Pyris 1 TGA unexpectedly failed. As Perkin Elmer were unable to repair it within
a reasonable time a new plan was made to use an older instrument; Perkin Elmer TGA7

Matthew Leonard, B.Sc. (Chemistry)
Honours RMIT - 2010
29
(Figure 2.6). This reduced the capacity to check sample variation over the duration of the
experiment.
Figure 2.6. Perkin Elmer TGA7
FTIR spectra were run with a Perkin Elmer Spectrum 100 FTIR Spectrometer. A diamond
crystal internal reflectance element sampler was first tried. This gave poor results so the
method was changed to diffuse reflectance sampling using KBr as a background medium and
to grind samples (Figure 2.7.).
Figure 2.7. KBr grinding of sample (a) and diffuse reflectance sampler (b)
Matthew Leonard, B.Sc. (Chemistry)
Honours RMIT - 2010
30
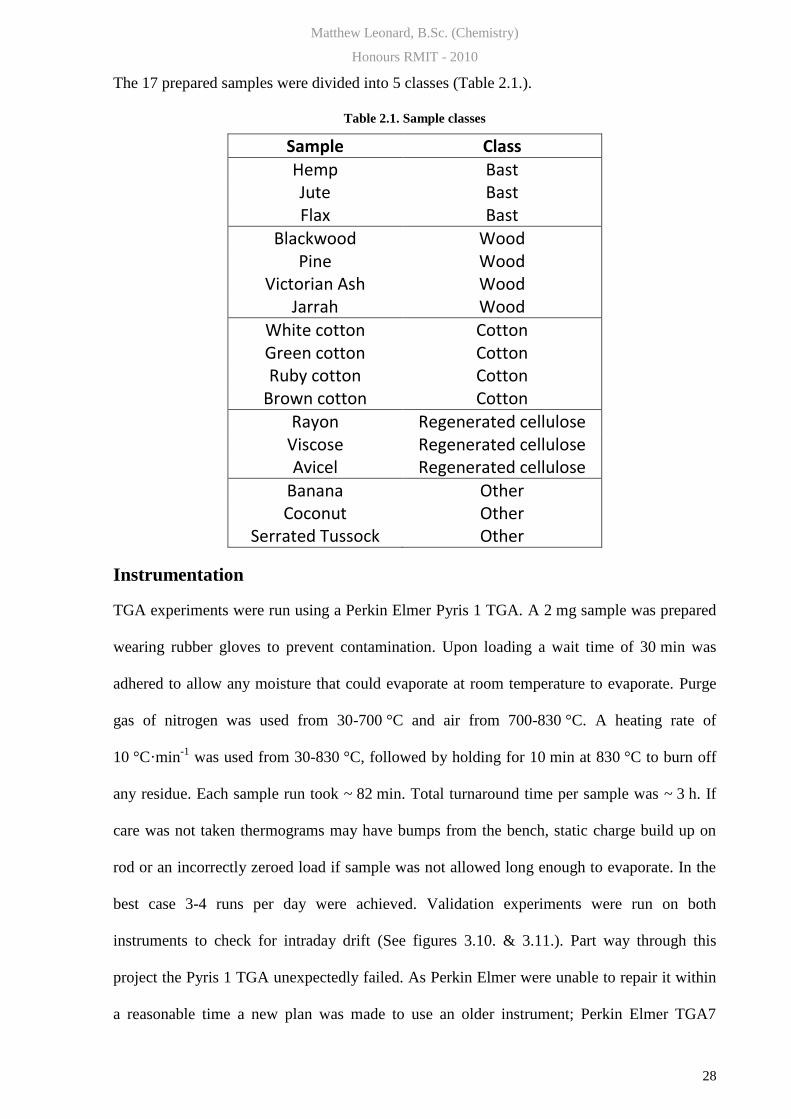
Raman experiments were attempted on a Perkin Elmer RamanStation 400F spectrometer
(Figure 2.8.).
Figure 2.8. Perkin Elmer RamanStation 400F spectrometer
Samples were placed in the laser area and aligned using a video camera. Full laser intensity
was used (100 mW) for 32 seconds, repeated 16 times.
WAXS diffractograms were carried out on native jarrah, mercerized cotton from a bath towel,
native flax and rayon. Experiments used a Bruker-Anton Paar Nanostar spectrometer.
Instrument was run with 35 mA and 40 kV. Sample pieces were taped to sample holder in
such a way that only the sample blocked the hole on the holder and left no part of the hole
uncovered (Fig 2.9.).
Matthew Leonard, B.Sc. (Chemistry)
Honours RMIT - 2010
31
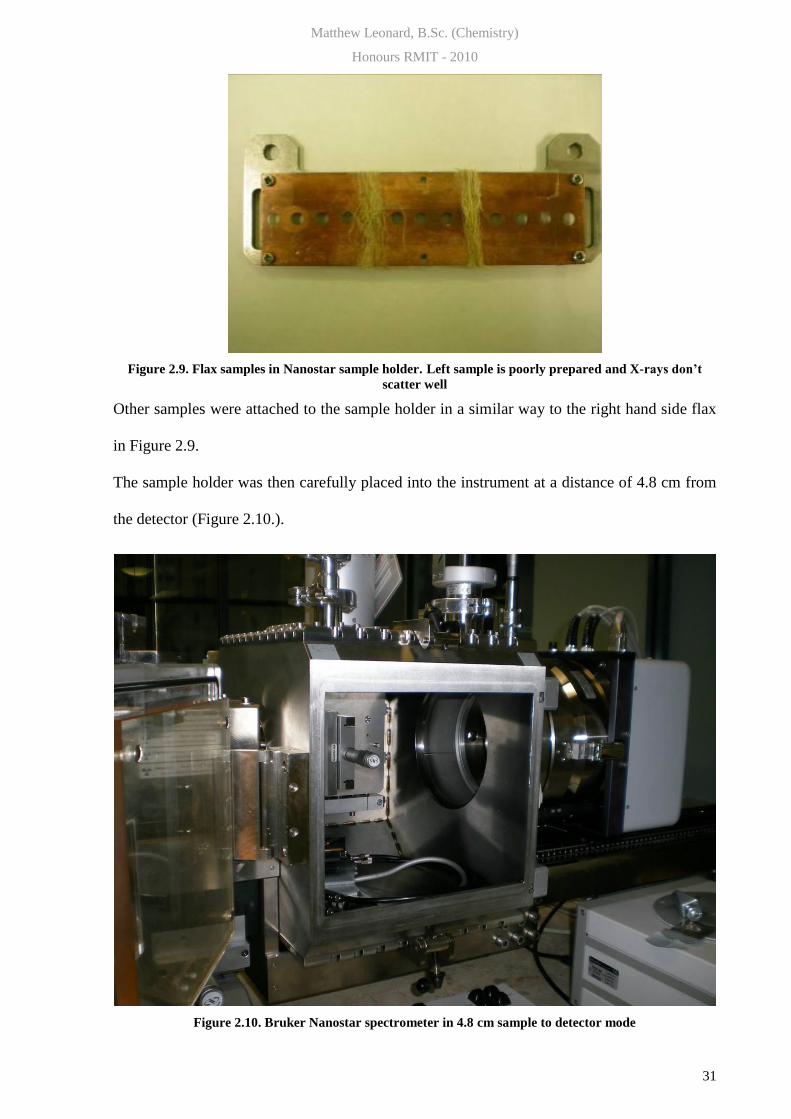
Figure 2.9. Flax samples in Nanostar sample holder. Left sample is poorly prepared and X-rays don’t
scatter well
Other samples were attached to the sample holder in a similar way to the right hand side flax
in Figure 2.9.
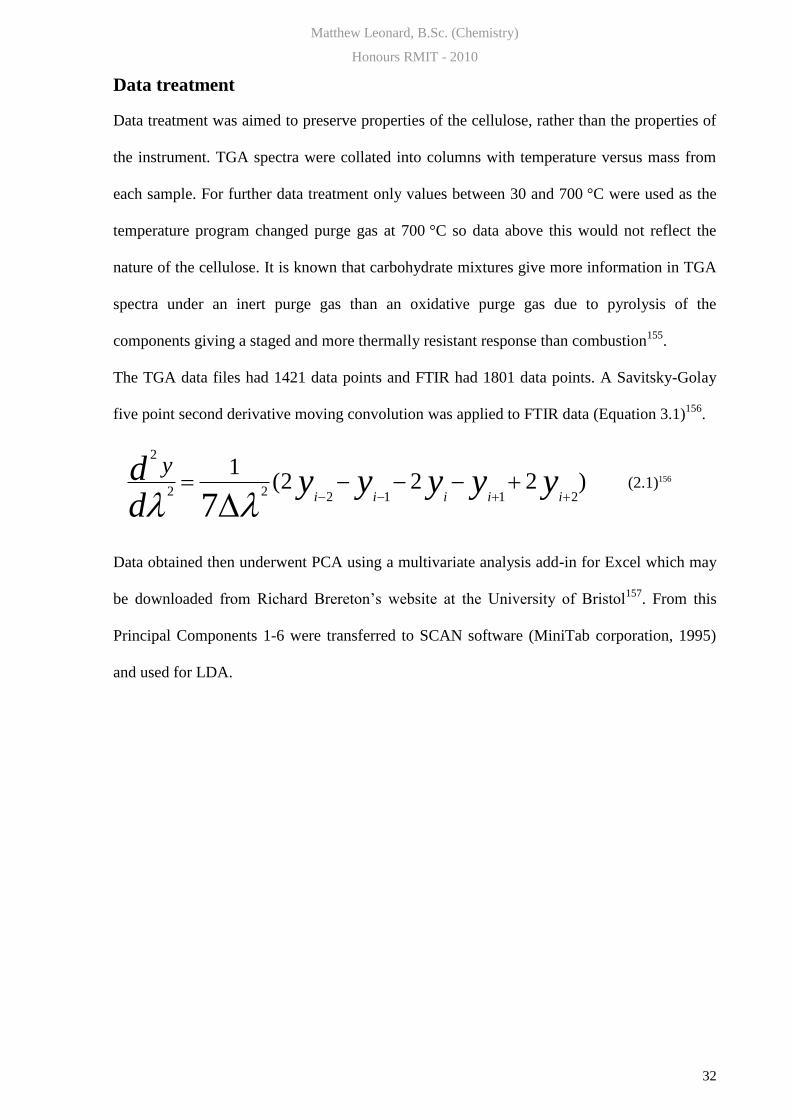
The sample holder was then carefully placed into the instrument at a distance of 4.8 cm from
the detector (Figure 2.10.).
Figure 2.10. Bruker Nanostar spectrometer in 4.8 cm sample to detector mode
Matthew Leonard, B.Sc. (Chemistry)
Honours RMIT - 2010
32
Data treatment
Data treatment was aimed to preserve properties of the cellulose, rather than the properties of
the instrument. TGA spectra were collated into columns with temperature versus mass from
each sample. For further data treatment only values between 30 and 700 °C were used as the
temperature program changed purge gas at 700 °C so data above this would not reflect the
nature of the cellulose. It is known that carbohydrate mixtures give more information in TGA
spectra under an inert purge gas than an oxidative purge gas due to pyrolysis of the
components giving a staged and more thermally resistant response than combustion155
.
The TGA data files had 1421 data points and FTIR had 1801 data points. A Savitsky-Golay
five point second derivative moving convolution was applied to FTIR data (Equation 3.1)156
.
(2.1)156
Data obtained then underwent PCA using a multivariate analysis add-in for Excel which may
be downloaded from Richard Brereton’s website at the University of Bristol157
. From this
Principal Components 1-6 were transferred to SCAN software (MiniTab corporation, 1995)
and used for LDA.
)222(1
211222
2
7yyyyy
dd
iiiii
y
Matthew Leonard, B.Sc. (Chemistry)
Honours RMIT - 2010
33
3. Results and discussion
TGA
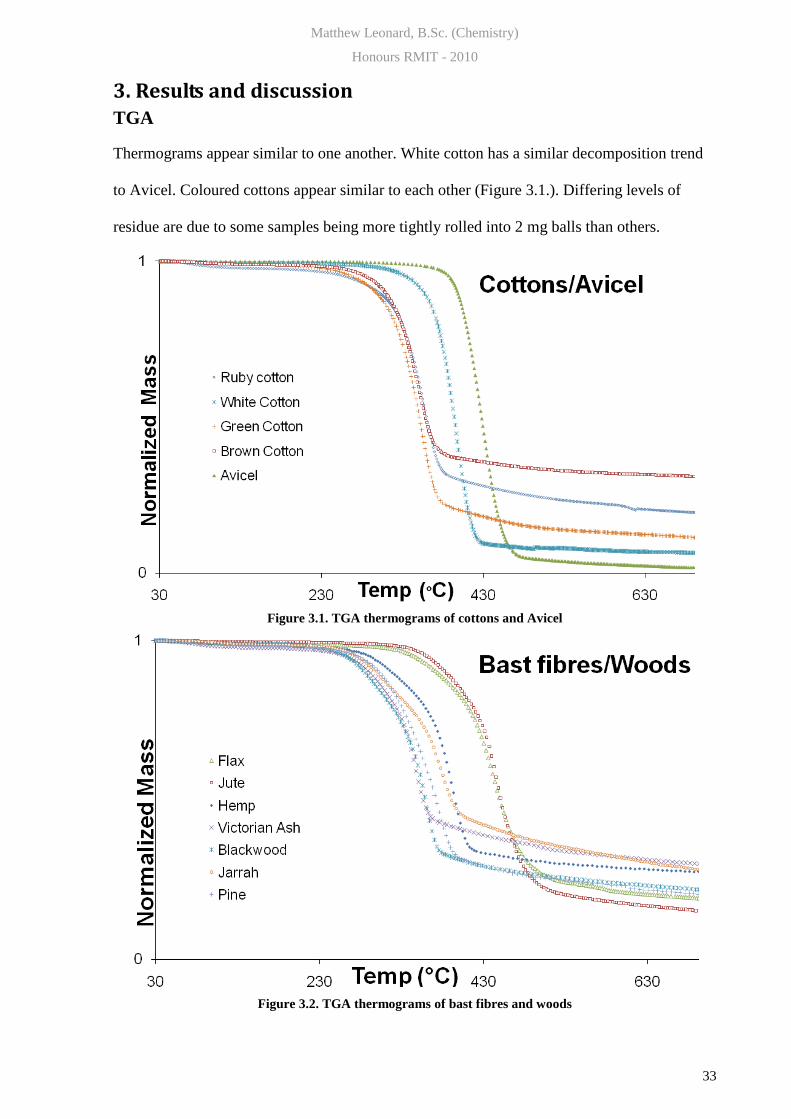
Thermograms appear similar to one another. White cotton has a similar decomposition trend
to Avicel. Coloured cottons appear similar to each other (Figure 3.1.). Differing levels of
residue are due to some samples being more tightly rolled into 2 mg balls than others.
Figure 3.1. TGA thermograms of cottons and Avicel
Figure 3.2. TGA thermograms of bast fibres and woods
Matthew Leonard, B.Sc. (Chemistry)
Honours RMIT - 2010
34
It is evident by comparison of Figure 3.1. and 3.2. that the more pure cellulose sources
(cottons/Avicel) have a more narrow mass loss trend than native cellulosics with more diverse
composition (Bast fibres/Woods). White cotton is ~ 88 % cellulose85
and Avicel is 99.9%
cellulose6 while other cellulosics only ~ 30-40 %
43. Woods and bast fibres contain a greater
degree of hemicellulose, pectins, lignin and tannins to give more spread out pyrolysis of
components. Decomposition temperatures of cellulosic components may overlap and
pyrolysis of one may effect that of another. This makes it difficult to separate mass loss by
cellulosic component.
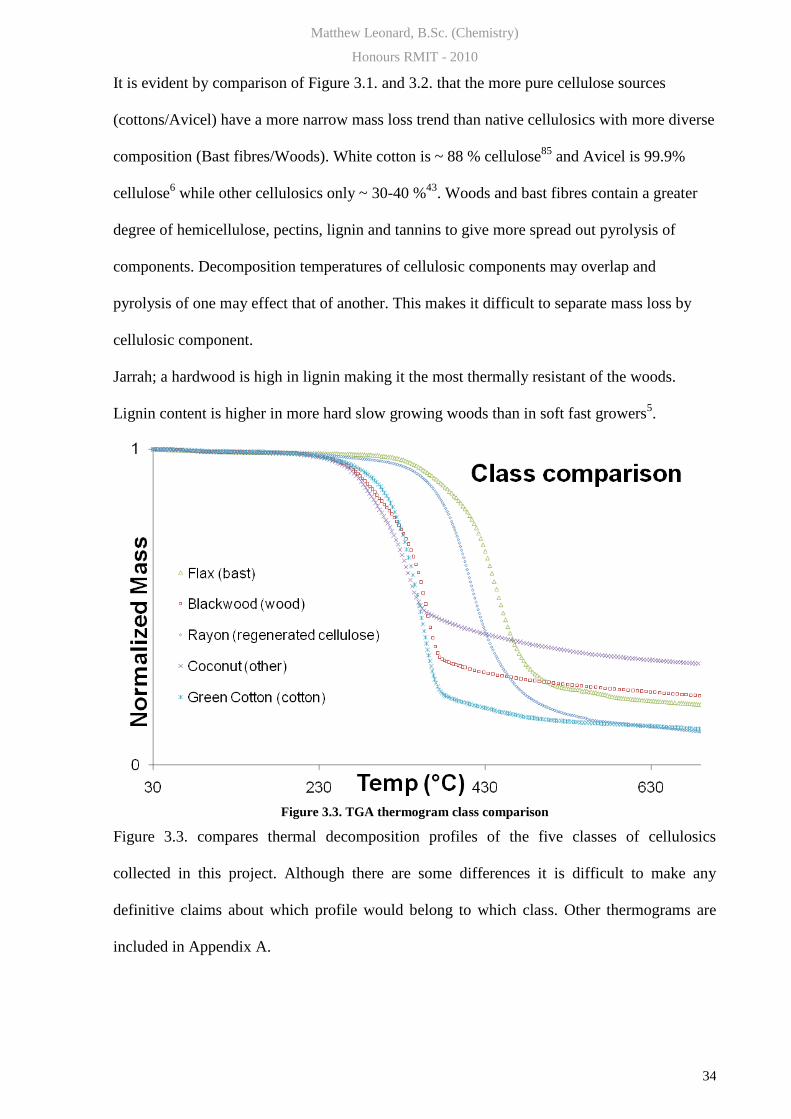
Jarrah; a hardwood is high in lignin making it the most thermally resistant of the woods.
Lignin content is higher in more hard slow growing woods than in soft fast growers5.
Figure 3.3. TGA thermogram class comparison
Figure 3.3. compares thermal decomposition profiles of the five classes of cellulosics
collected in this project. Although there are some differences it is difficult to make any
definitive claims about which profile would belong to which class. Other thermograms are
included in Appendix A.
Matthew Leonard, B.Sc. (Chemistry)
Honours RMIT - 2010
35
FTIR
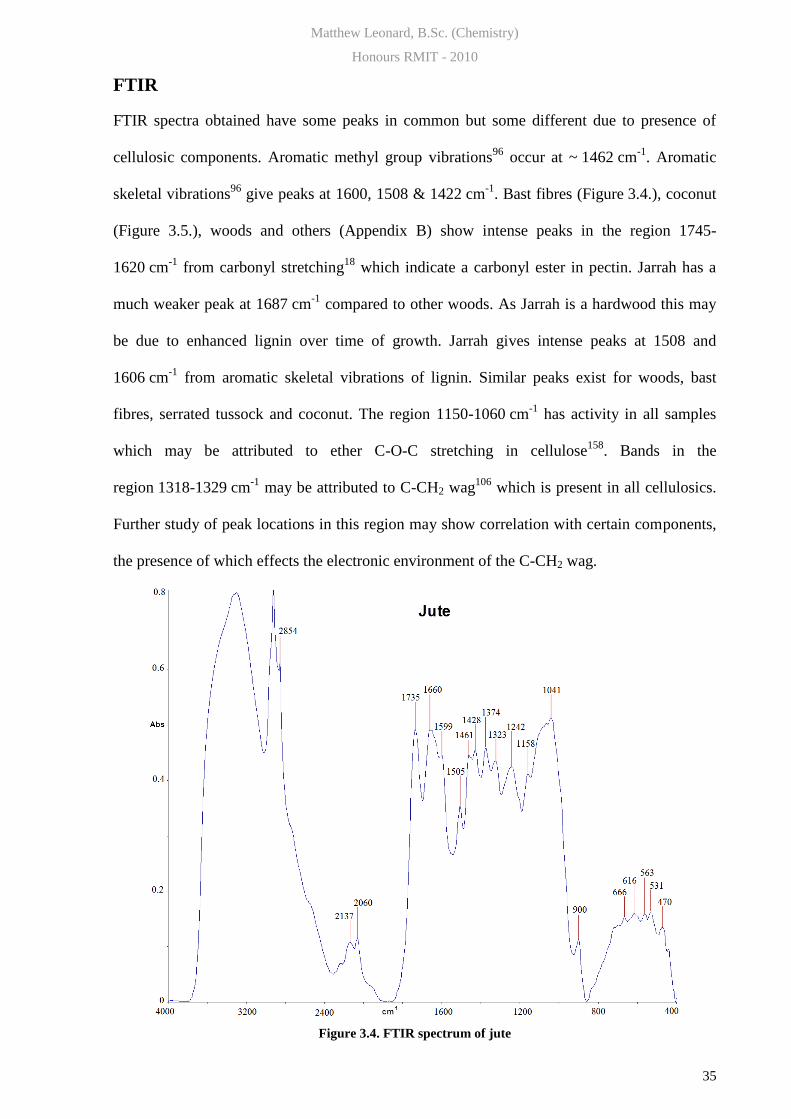
FTIR spectra obtained have some peaks in common but some different due to presence of
cellulosic components. Aromatic methyl group vibrations96
occur at ~ 1462 cm-1
. Aromatic
skeletal vibrations96
give peaks at 1600, 1508 & 1422 cm-1
. Bast fibres (Figure 3.4.), coconut
(Figure 3.5.), woods and others (Appendix B) show intense peaks in the region 1745-
1620 cm-1
from carbonyl stretching18
which indicate a carbonyl ester in pectin. Jarrah has a
much weaker peak at 1687 cm-1
compared to other woods. As Jarrah is a hardwood this may
be due to enhanced lignin over time of growth. Jarrah gives intense peaks at 1508 and
1606 cm-1
from aromatic skeletal vibrations of lignin. Similar peaks exist for woods, bast
fibres, serrated tussock and coconut. The region 1150-1060 cm-1
has activity in all samples
which may be attributed to ether C-O-C stretching in cellulose158
. Bands in the
region 1318-1329 cm-1
may be attributed to C-CH2 wag106
which is present in all cellulosics.
Further study of peak locations in this region may show correlation with certain components,
the presence of which effects the electronic environment of the C-CH2 wag.
Figure 3.4. FTIR spectrum of jute

Matthew Leonard, B.Sc. (Chemistry)
Honours RMIT - 2010
36
Figure 3.5. FTIR spectrum of coconut fibre
Figure 3.6. FTIR spectrum of Avicel
Figure 3.6. of Avicel (purified cellulose) shows the absence of peaks in the region
1745-1620 cm-1
(pectin) and 1600 & 1508 (lignin). Note: Figures 3.4.-3.6. received a baseline
correction from instrument software for viewing purposes. Table 3.1 provides a summary of
cellulosic peak assignments.

Matthew Leonard, B.Sc. (Chemistry)
Honours RMIT - 2010
37
Table 3.1. Peak assignments for FTIR of cellulosics
Region cm-1 Asymmetric vibrational mode Cellulosic component
1745-1620 Carbonyl C=O stretching Pectin 1600, 1508, 1422 Aromatic skeletal vibrations Lignin 1150-1060 Ether C-O-C stretching Cellulose/Hemicellulose ~ 1320 C-CH2 wag All
While there is some measure of discrimination for cellulosics by FTIR it is not a simple case.
For example peaks at 1462 cm-1
are caused by aromatic methyl group vibrations present in
cellulose, hemicellulose, pectin and lignin. Chemometric method development is aimed to
discriminate between such overlap.
Raman
Conditions for Raman analysis of cellulosics turned out to be complex. Cellulosics, especially
the lignin, give a lot of interference due to fluorescence. One example159
used 400 scans each
of 12 min laser time per sample to get usable spectra on an instrument with 300-500 mW laser
power output (ours only 100 mW). This instrument was also reconfigured to give more laser
time at 1064 nm wavelength, which has been shown to be a wavelength at which lignin
fluoresces least and so causes less interference and gives better signal to noise ratio136
. The
RMIT instrument (Perkin Elmer RamanStation 400F spectrometer) only focuses the laser
point to 100 microns but others focus to 1 micron. Spectra run during this project under the
conditions outlined on page 30 gave poor signal to noise ratio and very limited peak
resolution (Figure 3.7.). As this data was ill conditioned for Chemometrics the use of Raman
was discontinued in favour of TGA and FTIR.

Matthew Leonard, B.Sc. (Chemistry)
Honours RMIT - 2010
38
Figure 3.7. Raman spectra of hemp
High band density is expected for bast fibres in the region 950-1180 cm-1
due to stretching160
.
HCC and HCO bending is expected to give intense peaks160
in the region 1337-1407 cm-1
. All
cellulosics are expected to give strong Raman bands in the 890-820 cm-1
due to cellulose158
.
These should correlate with FTIR bands160
. A broadening of signal peaks is expected with
conversion of cellulose I → cellulose II113
. Raman spectra of cellulose can prepared for
chemometric analysis with more vigorous continuation of this work.
WAXS
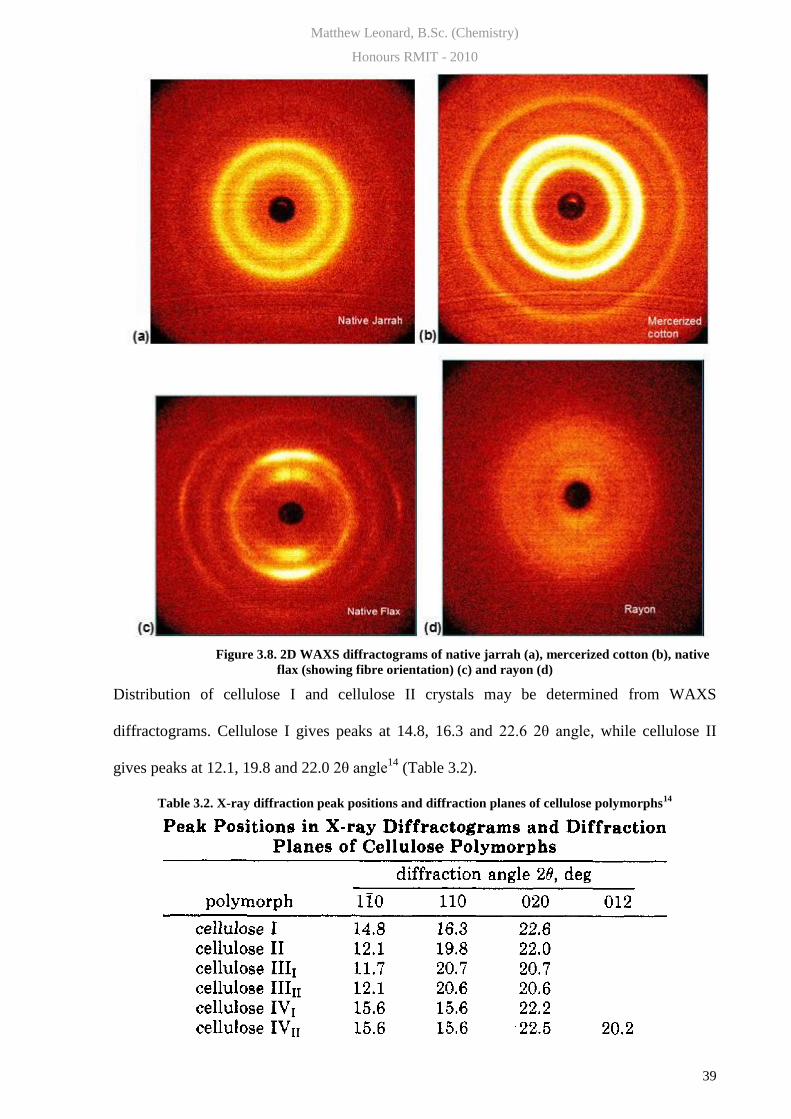
Obtained 2D WAXS diffractograms show a distinct difference between the 4 samples
(Figure 3.8.). Native Jarrah appears to contain cellulose I but may contain cellulose II and
some amorphous cellulose which scatters randomly. Mercerized cotton showed the highest
degree of order in its crystalline structure by more defined peak maxima.
Matthew Leonard, B.Sc. (Chemistry)
Honours RMIT - 2010
39
Figure 3.8. 2D WAXS diffractograms of native jarrah (a), mercerized cotton (b), native
flax (showing fibre orientation) (c) and rayon (d)
Distribution of cellulose I and cellulose II crystals may be determined from WAXS
diffractograms. Cellulose I gives peaks at 14.8, 16.3 and 22.6 2θ angle, while cellulose II
gives peaks at 12.1, 19.8 and 22.0 2θ angle14
(Table 3.2).
Table 3.2. X-ray diffraction peak positions and diffraction planes of cellulose polymorphs14
Matthew Leonard, B.Sc. (Chemistry)
Honours RMIT - 2010
40
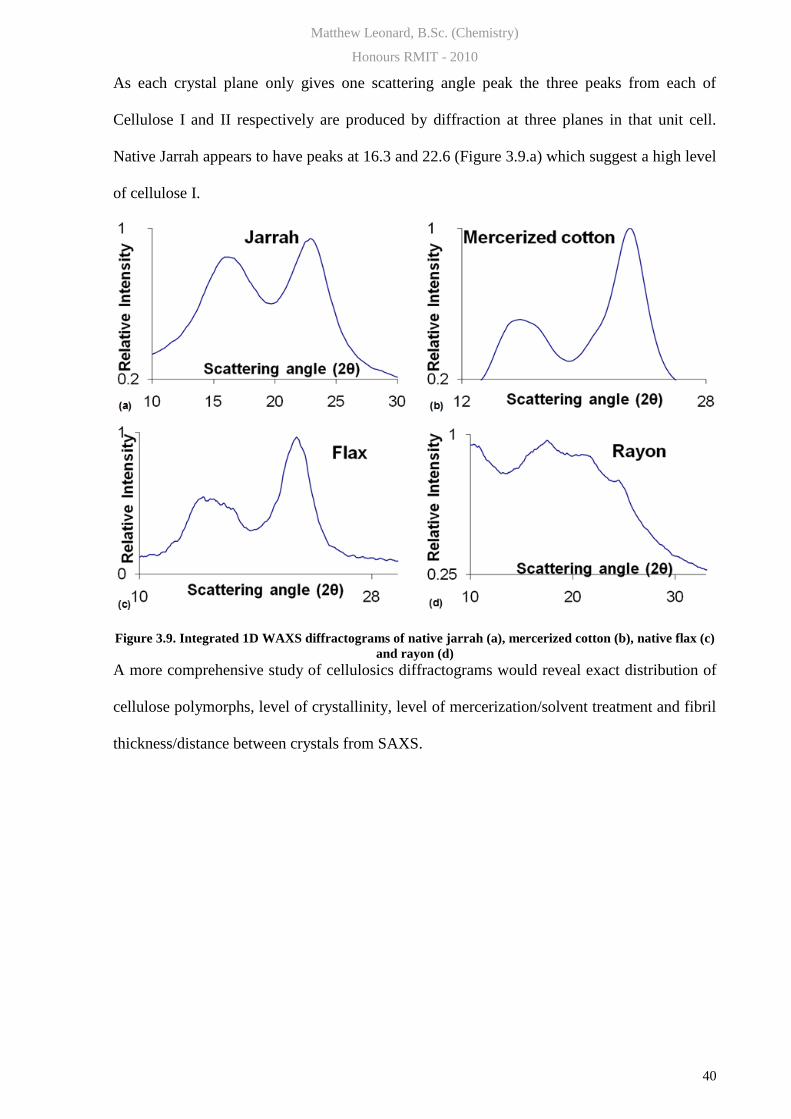
As each crystal plane only gives one scattering angle peak the three peaks from each of
Cellulose I and II respectively are produced by diffraction at three planes in that unit cell.
Native Jarrah appears to have peaks at 16.3 and 22.6 (Figure 3.9.a) which suggest a high level
of cellulose I.
Figure 3.9. Integrated 1D WAXS diffractograms of native jarrah (a), mercerized cotton (b), native flax (c)
and rayon (d)
A more comprehensive study of cellulosics diffractograms would reveal exact distribution of
cellulose polymorphs, level of crystallinity, level of mercerization/solvent treatment and fibril
thickness/distance between crystals from SAXS.
Matthew Leonard, B.Sc. (Chemistry)
Honours RMIT - 2010
41
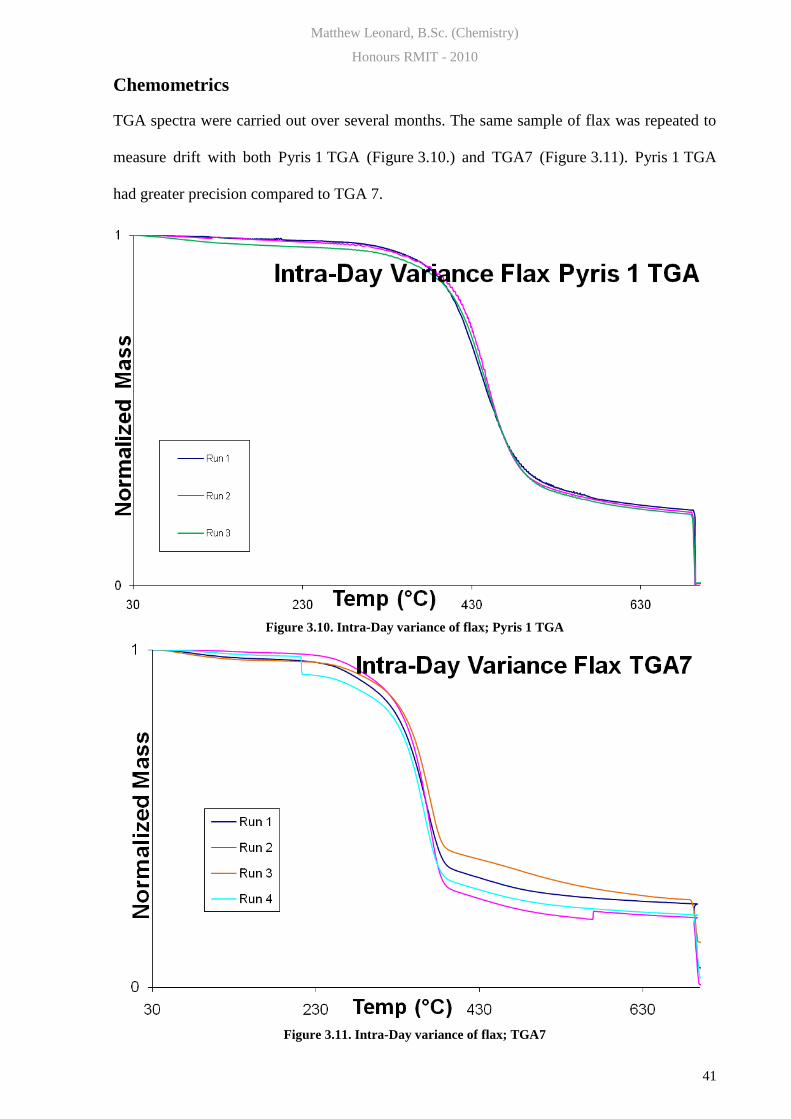
Chemometrics
TGA spectra were carried out over several months. The same sample of flax was repeated to
measure drift with both Pyris 1 TGA (Figure 3.10.) and TGA7 (Figure 3.11). Pyris 1 TGA
had greater precision compared to TGA 7.
Figure 3.10. Intra-Day variance of flax; Pyris 1 TGA
Figure 3.11. Intra-Day variance of flax; TGA7

Matthew Leonard, B.Sc. (Chemistry)
Honours RMIT - 2010
42
FTIR
A plot of standard deviation of samples at each wavenumber was drawn (Figure 3.12.). This is
used to show regions which have higher variability and hence may be better for
discrimination of classes. However variability was shown across the whole range and no
regions seemed to be preferable for discrimination.
Figure 3.12. Standard deviation of FTIR sample spectra
FTIR baselines can vary even for similar samples (Figure 3.13.) which must be addressed by
the use of derivatized data for Chemometrics.
Figure 3.13. FTIR of all 4 cotton samples showing baseline drift
Matthew Leonard, B.Sc. (Chemistry)
Honours RMIT - 2010
43
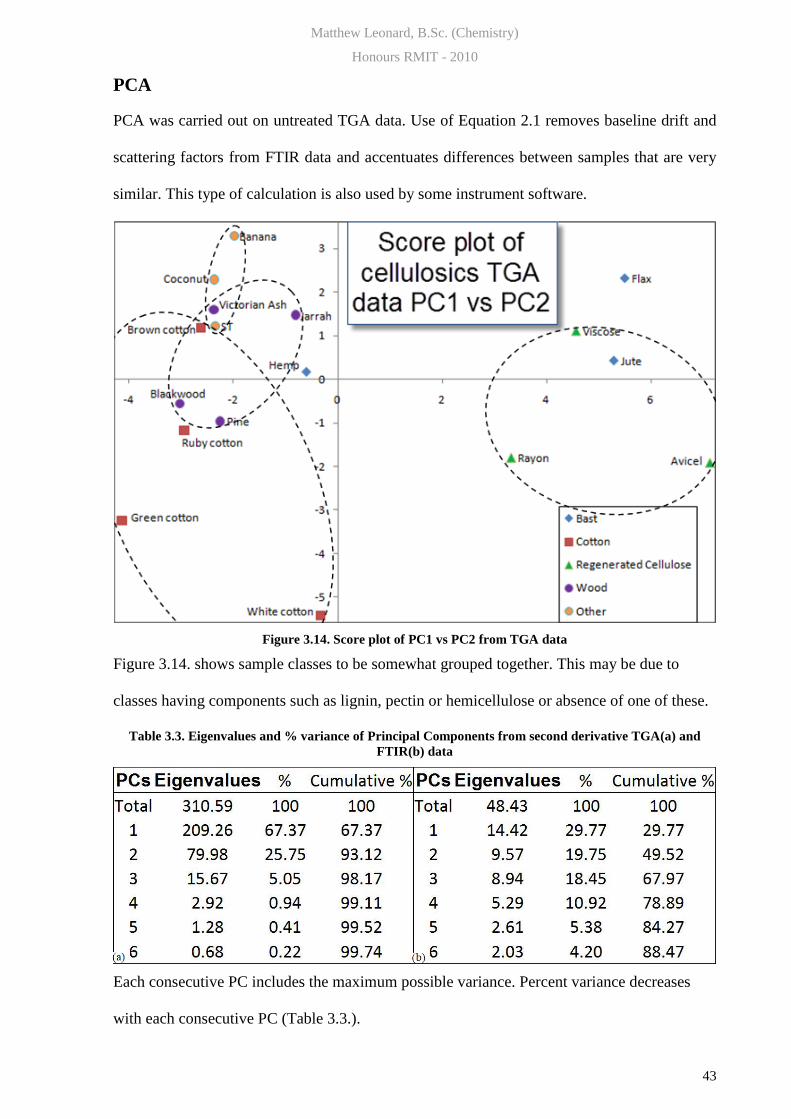
PCA
PCA was carried out on untreated TGA data. Use of Equation 2.1 removes baseline drift and
scattering factors from FTIR data and accentuates differences between samples that are very
similar. This type of calculation is also used by some instrument software.
Figure 3.14. Score plot of PC1 vs PC2 from TGA data
Figure 3.14. shows sample classes to be somewhat grouped together. This may be due to
classes having components such as lignin, pectin or hemicellulose or absence of one of these.
Table 3.3. Eigenvalues and % variance of Principal Components from second derivative TGA(a) and
FTIR(b) data
Each consecutive PC includes the maximum possible variance. Percent variance decreases
with each consecutive PC (Table 3.3.).
Matthew Leonard, B.Sc. (Chemistry)
Honours RMIT - 2010
44
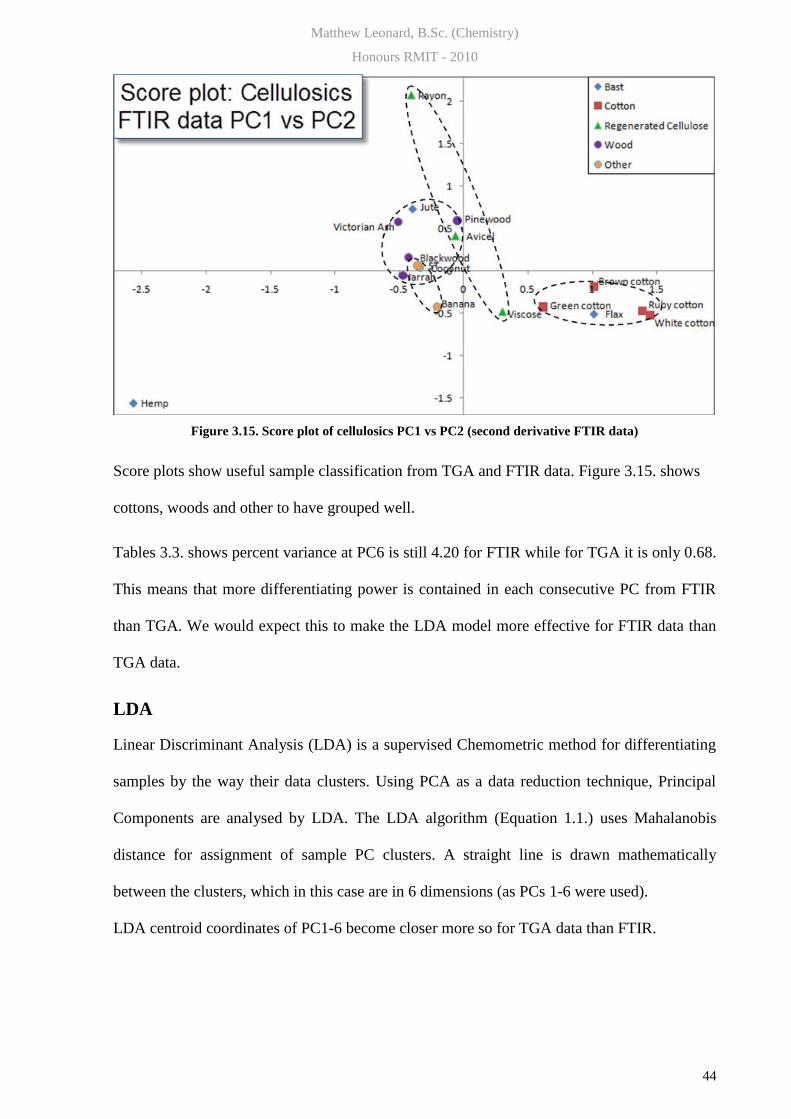
Figure 3.15. Score plot of cellulosics PC1 vs PC2 (second derivative FTIR data)
Score plots show useful sample classification from TGA and FTIR data. Figure 3.15. shows
cottons, woods and other to have grouped well.
Tables 3.3. shows percent variance at PC6 is still 4.20 for FTIR while for TGA it is only 0.68.
This means that more differentiating power is contained in each consecutive PC from FTIR
than TGA. We would expect this to make the LDA model more effective for FTIR data than
TGA data.
LDA
Linear Discriminant Analysis (LDA) is a supervised Chemometric method for differentiating
samples by the way their data clusters. Using PCA as a data reduction technique, Principal
Components are analysed by LDA. The LDA algorithm (Equation 1.1.) uses Mahalanobis
distance for assignment of sample PC clusters. A straight line is drawn mathematically
between the clusters, which in this case are in 6 dimensions (as PCs 1-6 were used).
LDA centroid coordinates of PC1-6 become closer more so for TGA data than FTIR.
Matthew Leonard, B.Sc. (Chemistry)
Honours RMIT - 2010
45
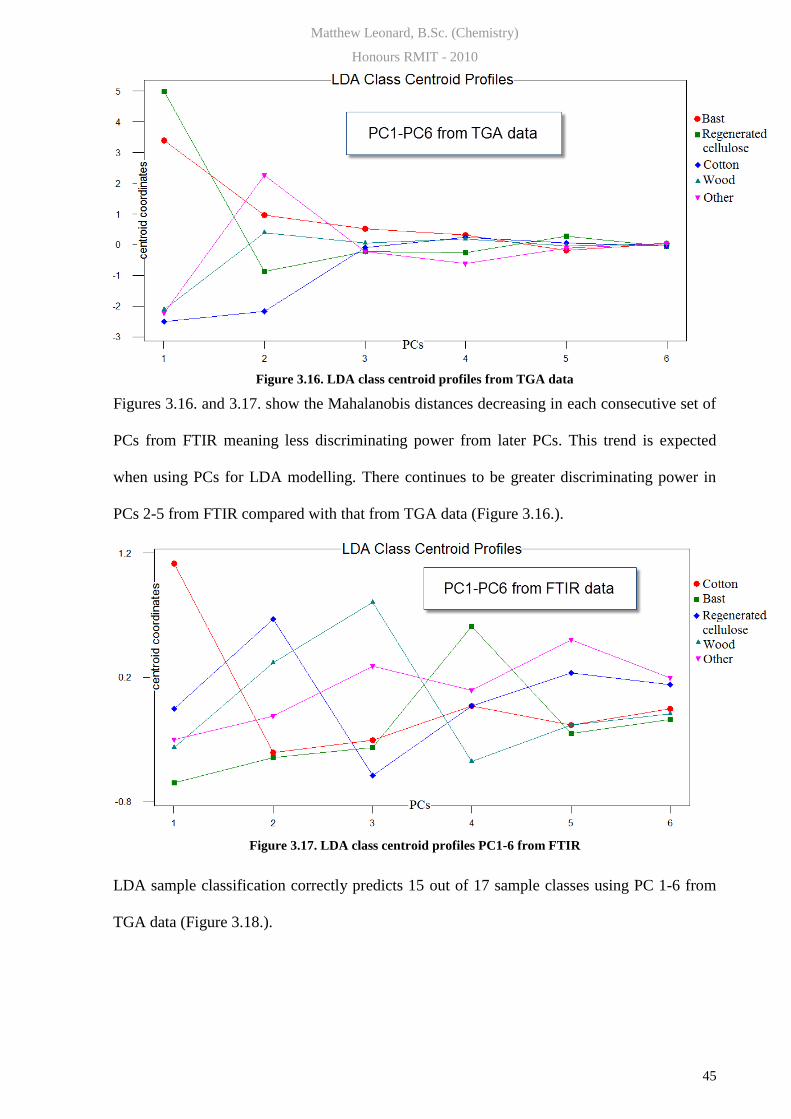
Figure 3.16. LDA class centroid profiles from TGA data
Figures 3.16. and 3.17. show the Mahalanobis distances decreasing in each consecutive set of
PCs from FTIR meaning less discriminating power from later PCs. This trend is expected
when using PCs for LDA modelling. There continues to be greater discriminating power in
PCs 2-5 from FTIR compared with that from TGA data (Figure 3.16.).
Figure 3.17. LDA class centroid profiles PC1-6 from FTIR
LDA sample classification correctly predicts 15 out of 17 sample classes using PC 1-6 from
TGA data (Figure 3.18.).

Matthew Leonard, B.Sc. (Chemistry)
Honours RMIT - 2010
46
Figure 3.18. LDA class assignments from PC1-6 of TGA data
Figure 3.19. LDA cross validated class assignments from PC1-6 of TGA data
Figure 3.19. shows cross validation by a leave out one method from each group still gives 10
out of 17 correct sample classes (47 %). The displayed error is the portion of samples
assigned incorrectly.

Matthew Leonard, B.Sc. (Chemistry)
Honours RMIT - 2010
47
Figure 3.20. LDA class assignments from PC1-6 of FTIR data
LDA sample classification correctly predicts 15 out of 17 sample classes using PC 1-6 from
TGA data (Figure 3.20.).
Figure 3.21. LDA cross validated class assignments from PC1-6 of FTIR data

Matthew Leonard, B.Sc. (Chemistry)
Honours RMIT - 2010
48
Cross validated class assignments (Figures 3.19. and 3.21.) use a leave one-out method where
a sample is omitted and a model developed on all the other samples. This sample is then
assigned to a class. This is repeated for all samples in turn. Classes have only 3 or 4 samples
so the leave out one method leaves only 2 or 3 samples. This makes cross validation of the
model difficult. PC’s 1-6 from both TGA and FTIR data still give 10 out of 17 correct sample
classes (59 %) from data using cross-validation. This is still good as there is only ~ 20 %
chance of randomly predicting the correct class.
Dendrograms were also constructed to see whether or not results gave any unexpected trends;
however these did not show any meaningful groupings.
Matthew Leonard, B.Sc. (Chemistry)
Honours RMIT - 2010
49
Conclusion
Cellulosics were analysed by TGA, FTIR and WAXS to characterize crystallinity, cellulose
polymorph and fibre orientation. TGA thermograms of varied cellulosic source have been
compared and contrasted to show the effect of chemical composition on pyrolysis behaviour.
Observations from TGA have been contrasted with FTIR band assignments. WAXS was used
to compare samples of varied crystallinity and cellulose polymorph.
Results from PCA of TGA and FTIR spectra were visualized to understand the clustering of
collected cellulosics. A good level of class differentiation by PCA and LDA was achieved.
Raman spectroscopy was attempted but a deeper approach is needed for usable spectra of
cellulosics.
Linear Discriminant Analysis of TGA and FTIR data both correctly differentiated 15 of 17
samples classed by source of cellulosic. Cross validated LDA class assignments were reduced
to 10 out of 17 for both TGA and FTIR data; likely due to small numbers of samples in
classes (3-4). However, despite the small number of samples, this study showed that useful
information may be obtained by this approach. A more comprehensive investigation is
expected to reveal useful methods for cellulosics analysis. This may involve a larger number
of samples from each class and/or analysis of classes separately. For example the same study
could be carried out with 8-10 samples of each of the five classes. Or the study could be
repeated but focus solely on wood varieties. Data collection rate for TGA of 20 temperature
measurements per minute could be reassessed. The same study could be tried with 5, 10 or 30
measurements per minute.

Matthew Leonard, B.Sc. (Chemistry)
Honours RMIT - 2010
50
References
1. D. Popović, S. B. Stanković, G. B. Poparić, Polymer Testing 27, 41-48 (2007).
2. M. J. A. Van Den Oever, H. L. Bos, O. C. J. J. Peters, Journal of Materials Science 37, 1683-
1692 (2002).
3. U. J. Griesser, O. Satoko, T. Bechtold, Journal of Applied Polymer Science 97, 1621-1625
(2005).
4. S. Ouajai, PhD, RMIT University, 2005.
5. V. V. Goud, S. Naik, P. K. Rout, K. Jacobson, A. K. Dalai, Renewable Energy 35, 1624-1631
(2010).
6. S. Andersson, K. Leppänen, M. Torkkeli, M. Knaapila, N. Kotelnikova, R. Serimaa,
Cellulose 16, 999-1015 (2009).
7. P. Wyeth, P. Garside, Studies in Conservation 48 (4), 269-275 (2003).
8. J. H. Kwak, H. Zhao, Z. C. Zhang, H. M. Brown, B. W. Arey, J. E. Holladay, Carbohydrate
Polymers 68, 235–241 (2007).
9. E. Heide, X. Zhao, T. Zhang, D. Liu, Bioresources 5 (3), 1565-1580 (2010).
10. J. R. Colvin, M. Takai, Journal of Polymer Science: Polymer Chemistry Edition 16, 1335-
1342 (1978).
11. K. C. Schenzel, P. Peetla, W. Diepenbrock, Applied Spectroscopy 60 (6), 682-691 (2006).
12. R. A. Shanks, S. Ouajai, Polymer Degradation and Stability 89, 327-335 (2005).
13. M. Sain, B. Wang, K. Oksman, Applied Composite Materials 14, 89-103 (2006).
14. M. Usuda, A. Isogai, T. Kato, T. Uryu, R. H. Atalla, Macromolecules 22, 3168-3172 (1989).
15. A. Sarko, C. Woodcock, Macromolecules 13 (5), 1183–1187 (1980).
16. B. Philipp, H.-P. Fink, Journal of Applied Polymer Science 30, 3779-3790 (1985).
17. J. Persson, J. Sugiyama, H. Chanzy, Macromolecules 24 (9), 2461–2466 (1991).
18. M. K. Naik, P. K. Rout, S. N. Naik, V. V. Goud, L. M. Das, A. K. Dalai, Energy Fuels 23,
6181–6188 (2009).
19. L. H. Krull, R. W. Jones, C. W. Blessin, G. E. Inglett, Cereal Chemistry 56 (5), 441-442
(1979).
20. Z. Hromádková, A. Ebringerová, T. Heinze, in Advanced Polymer Science (Springer-Verlag,
Berlin Heidelberg, 2005), Vol. 186, pp. 1-67.
21. T. E. Timell, Wood Science and Technology 1, 45-70 (1967).
22. R. Yan, H. Yang, H. Chen, D. H. Lee, C. Zheng, Fuel 86 (12-13), 1781-1788 (2007).
23. M.-C. J. Ralet, A. W. Zykwinska, C. D. Garnier, J.-F. J. Thibault, Plant Physiology 139,
397-407 (2005).
24. M. A. O. Niell. B. L. Ridley, D. Mohnen, Phytochemistry 57 (6), 929-967 (2001).
25. M. Branger, M. A. V. Axelos, Food Hydrocolloids 7 (2), 91-102 (1993).
26. J. T. G. Hamilton, F. Keppler, W. C. McRoberts, I. Vigano, M. Brass, T. Röckmann,
New Phytologist 178, 808-814 (2008).
27. T. Matoh, M. Kobayashi, J.-I. Azuma, Plant Physiology 110 (3), 1017-1020 (1996).
28. T. Matsunaga, T. Ishii, P. Pellerin, M. A. O’Neill, A. Darvill, P. Albersheim, Journal of
Biological Chemistry 274 (19), 13098-13104 (1999).
29. H. Nakagawa, M. Kobayashi, T. Asaka, T. Matoh, Plant Physiology 119 (1), 199-203 (1999).
30. S. C. Fry, Annual Review of Plant Physiology 37, 165-186 (1986).
31. D. Mohnen, Current opinion in plant biology 11, 266-277 (2008).
32. N. A. Kirtchev, I. N. Panchev, C. G. Kratchanov, Food Hydrocolloids 8 (1), 9-17 (1994).
33. G. R. Patil, R. Chawla, Comprehensive reviews in food science and food safety 9, 178-196
(2010).
34. A. Proctor, R. Gnanasambandam, Food Chemistry 65, 461-467 (1999).
35. K. Lau, L. Matia-Merino, E. Dickinson, Food Hydrocolloids 18, 271-281 (2004).

Matthew Leonard, B.Sc. (Chemistry)
Honours RMIT - 2010
51
36. I. Björck, P. Lingström, A. Drews, D. Birkhed, European Journal of Oral Sciences 99 (1),
30-39 (1990).
37. A. Grollman, Annals of the New York Academy of Sciences 120, 911–930 (1965).
38. S. L. Turgeona, M. Beaulieua, J.-L. Doublier, International Dairy Journal 11, 961-967 (2001).
39. V. Langendorff, J. Leroux, G. Schick, V. Vaishnav, J. Mazoyer, Food Hydrocolloids 17,
455-462 (2003).
40. W. J. Cousins, Wood Science and Technology 10, 9-17 (1976).
41. T. G. Rials, S. S. Kelley, W. G. Glasser, Journal of Materials Science 22, 617-624 (1987).
42. H. Nimz, Angewandte Chemie International Edition in English 13 (5), 313-321 (1974).
43. K. Georghiou, C. Ververis, N. Christodoulakis, P. Santas, R. Santas, Industrial crops and
products 19, 245-254 (2004).
44. M.-F. Dignac, M. Thevenot, C. Rumpel, Soil Biology & Biochemistry 42, 1200-1211 (2010).
45. R. Chevalier, J.-F. Ponge, Forest Ecology and Management 233, 165-175 (2006).
46. R. Laschimke, Thermochimica Acta 151, 35-56 (1989).
47. R. S. Reiner, U. P. Agarwal, Journal of Raman spectroscopy 40, 1527–1534 (2009).
48. W. Vermerris, R. Hatfield, Plant Physiology 126, 1351-1357 (2001).
49. M. D. Guillén, M. L. Ibargoitia, Journal of the Science of Food and Agriculture 79,
1889-1903 (1999).
50. D. Fengel, Journal of Polymer Science: Part C 36, 383-392 (1971).
51. J. Sirichaisit, S. J. Eichhorn, R. J. Young, Journal of materials science 36, 3129-3135 (2001).
52. P. Velazquez-Morales, G. Barcenas-Pazos, R. Davalos-Sotelo, Holzforschung 54 (5),
541-543 (2000).
53. T. B.-T. Lam, K. Liyama, B. A. Stone, Plant Physiology 104, 315-320 (1994).
54. H. I. Bolker, Nature 197, 489-490 (1963).
55. R. H. White, Wood and Fiber Science 19 (4), 446-452 (1987).
56. A. Abdulkhani, S. A. Mirshokraie, A. A. Enayati, A. J. Latibari, Iranian Polymer Journal 14
(11), 982-998 (2005).
57. A. J. Ragauskas, J. Sealey, Enzyme and Microbial Technology 23, 422-426 (1998).
58. O. Wallberg, A.-S. Jönsson, Desalination 237, 254-267 (2009).
59. W. G. Glasser, J. H. Lora, Journal of Polymers and the Environment 10, 39-48 (2002).
60. H. Nordbø, H. M. Eriksen, H. Kantanen, J. E. Elungsen, Journal of Clinical Periodontology
12 (5), 1345-1350 (1985).
61. T. Swain, J. L.Goldstein, Phytochemistry 2, 371-383 (1963).
62. B. W. Hanny, S. G. Polles, A. J. Harvey, Journal of Agricultural and Food Chemistry 29 (1),
196-197 (1981).
63. T. Y. Wong, K.-T. Chung, C.-I. Wei, Y.-W. Huang, Y. Lin, Critical Reviews in Food Science
and Nutrition 38 (6), 421 - 464 (1998).
64. S. Menichetti, P. Arapitsas, F. F. Vincieri, A. Romani, Journal of Agricultural and Food
Chemistry 55 (1), 48–55 (2007).
65. E. T. Mertz, B. A. K. Chibber, J. D. Axtell, Journal of Agricultural and Food Chemistry 26
(3), 679–683 (1978).
66. I. Tavazzi, M. Richelle, E. Offord, Journal of Agricultural and Food Chemistry 49 (7),
3438-3442 (2001).
67. E. Boles, S. Lalonde, H. Hellmann, L. Barker, J. W. Patrick, W. B. Frommer, J. M. Ward,
American Society of Plant Physiologists 11 (4), 707-726 (1999).
68. M. C. Grieve, Science & Justice 36 (2), 71-80 (1996).
69. D. F. Caulfield, D. T. Quillin, J. A. Koutsky, Journal of Applied Polymer Science 50 (7),
1187–1194 (1993).
70. R. H. Newman, B. J.-C. Z. Duchemin, M. P. Staiger, Cellulose 14, 311-320 (2007).
71. A. Valadez-González, P. J. Herrera-Franco, Composites Part B: engineering 36, 597-608
(2005).
72. S. Mannaa, P. Sahaa, S. R. Chowdhurya, R. Senb, D. Royc, B. Adhikari, Bioresource
Technology 101 (9), 3182-3187 (2010).
Matthew Leonard, B.Sc. (Chemistry)
Honours RMIT - 2010
52
73. M. A. Martins, A. R. Martin, O. R. R. F. da Silva, L. H. C. Mattoso, Thermochimica Acta
506, 14-19 (2010).
74. S. S. Sharma, G. J. Faughey, R. D. McCall, Journal of Applied Polymer Science 75, 508-514
(2000).
75. P. Kiekens, K. Van De Velde, Journal of Applied Polymer Science 83, 2634-2643 (2002).
76. R. A. Shanks, S. Ouajai, Cellulose 13, 31-44 (2006).
77. B. Doczekalska S. Borysiak, Fibres & Textiles in Eastern Europe 16 (6), 101-103 (2008).
78. A. Sarko, T. Okano, Journal of Applied Polymer Science 30, 325-332 (1985).
79. B. Philipp, H.-P. Fink, D. Paul, R. Serimaa, T. Paakkari, Polymer 28, 1265-1270 (1987).
80. S. Y. Lee, J. G. Gwon, G. H. Doh, J. H. Kim, Journal of Applied Polymer Science 116, 3212-
3219 (2010).
81. H. Wikberg, S. Andersson, E. Pesonen, S. L. Maunu, R. Serimaa, Trees 18, 346–353 (2004).
82. B. Doczekalska, S. Borysiak, Fibres & textiles in eastern europe 13 (5), 87-89 (2005).
83. M. Oliet, J. C. Domínguez, M. V. Alonso, M. A. Gilarranz, F. Rodríguez, Industrial crops
and products 27, 150-156 (2008).
84. Z. Yaghoobi, F. Dadashian, M. A. Wilding, Polymer Testing 24, 969-977 (2005).
85. N. Abidi, L. Cabrales, Journal of Thermal and Analytical Calorimetry 102, 485-491 (2010).
86. L. Cabrales, N. Abidi, E. Hequet, Cellulose 17, 309–320 (2010).
87. L. Cabrales, N. Abidi, E. Hequet, Thermochimica Acta 498, 27-32 (2009).
88. S. H. Eom, U.-J. Kim, M. Wada, Polymer Degradation and Stability 95, 778-781 (2010).
89. R. El Hage, N. Brosse, M. Chaouch, M. Pétrissans, S. Dumarçay, P. Gérardin, Polymer
Degradation and Stability 95, 1721-1726 (2010).
90. H. Bockhorn, M. Müller-Hagedorn, L. Krebs, U. Müller, Journal of Analytical and applied
pyrolysis 68-69, 231-249 (2003).
91. K. Ruel, M. Chabannes, A. Yoshinaga, B. Chabbert, A. Jauneau, J.-P. Joseleau A.-M.
Boudet, The Plant Journal 28 (3), 271-282 (2001).
92. J. Weiss, D. McLaren, Victorian Department of Natural Resources and Environment (Keith
Turnbull Research Institute, CRC for Australian Weed Management, Frankston, 2003).
93. G. Cross, R. G. Westbrooks, Weed Technology 7 (2), 525-528 (1993).
94. I. C. de Miranda, C. G. Mothé, Journal of Thermal Analysis and Calorimetry 97, 661-665
(2009).
95. N. Labbé, D. G. J. Mann, R. W. Sykes, K. Gracom, L. Kline, I. M. Swamidoss, J. N. Burris,
M. Davis, C. N. Stewart, Bioenergy Research 2 (246-256) (2009).
96. F. Xu, J-X. Sun, X-F. Sun, R-C. Sun, S-B. Wu, Polymer International 53, 1711-1721 (2004).
97. H.-W. Cho, S.-H. Lee, N. Labbé, M. K. Jeong, Journal of Applied Polymer Science 114,
3229-3234 (2009).
98. S. Gua, D. K. Shena, A.V. Bridgwater, Carbohydrate Polymers 82, 39-45 (2010).
99. G. L. D. I. Donato, S. Milioto, Thermogravimetric analysis 101, 1085-1091 (2010).
100. C. Ganne-Chedeville, L. Delmotte, J. M. Leban, A. Pizzi, F. Pichelin, Polymer Degradation
and Stability 93 (2), 406-412 (2008).
101. E. Bergström, L. Salmén, Cellulose 15, 23–33 (2008).
102. R. S. Reiner, U. P. Agarwal, S. A. Ralph, Cellulose 17, 721-733 (2010).
103. R. A. Shanks, S. Ouajai, Macromolecular Bioscience 5 (124-134) (2005).
104. D. Domvoglou, R. Ibbett, F. Wortmann, K. C. Schuster, Cellulose 17 (2), 231-243 (2010).
105. E.-L. Hult, K. Wickholm, P. T. Larsson, T. Iversen, H. Lennholm, Cellulose 8, 139-148
(2001).
106. E. S. Medeiros, M. F. Rosa, J. A. Malmonge, K. S. Gregorski, D. F. Wood, L. H. C. Mattoso,
G. Glenn, W. J. Orts, S. H. Imam, Carbohydrate polymers 81, 83-92 (2010).
107. S. Bourbigot, V. Mamleev, J. Yvon, Journal of Analytical and applied pyrolysis 80, 151-165
(2007).
108. G. Canche-Escamilla, H. Vazquez-Torres, C. A. Cruz-Ramos, Journal of Applied Polymer
Science 45, 645-653 (1992).

Matthew Leonard, B.Sc. (Chemistry)
Honours RMIT - 2010
53
109. A. R. Fraser, J. D. Russell, A. H. Gordon, A. Chesson, Journal of the science of food and
agriculture 45 (2), 95-107 (1988).
110. J. W. Teh, S. So, A. Rudin, W. J. Tchir, C. A. Fyfe, Journal of Applied Polymer Science 39,
531-538 (1990).
111. P. W. Schmidt, J. H. Letcher, Journal of Applied Physics 37 (2), 649-655 (1966).
112. T. A. Tombrello, C. R. Wie, T. Vreeland, Journal of Applied Physics 59 (11), 3743 - 3746
(1947).
113. H. Almlöf, K. Schenzel, U. Germgård, Cellulose 16, 407-415 (2009).
114. A. Hirai, F. Horii, R. Kitamaru, in The Structures of Cellulose, edited by R. H. Atalla (1987),
Vol. 340, pp. 119-134.
115. D. Fanter, H.-P. Fink , B. Phillip, Acta Polymerica 36, 1-8 (1985).
116. P. T. Larsson, K. Wickholm, T. Iversen, Carbohydrate Research 312, 123-129 (1998).
117. M. Sillanpää, A. Vuorema, L. Rassaei, M. J. Wasbrough, K. J. Edler, W. Thielemans, S. E. C.
Dale, S. Bending, D. Wolverson, F. Marken, Electroanalysis 22 (6), 619-624 (2009).
118. G. J. Cameron, C. J. Kennedy, A. Šturcová, D. C. Apperley, C. Altaner, T. J. Wess, M. C.
Jarvis, Cellulose 14, 235-246 (2007).
119. Y. Nishiyama, S. Elazzouzi-Hafraoui, J.-L. Putaux, L. Heux, F. Dubreuil, C. Rochas,
Biomacromolecules 9, 57-65 (2008).
120. C. S. R. Freire, C. Vilela, P. A. A. P. Marques, T. Trindade, C. P. Neto, P. Fardim,
Carbohydrate Polymers 79, 1150-1156 (2010).
121. V. M. A. Calado, A. I. S. Brígida, L. R. B. Gonçalves, M. A. Z. Coelho, Carbohydrate
Polymers 79, 832-838 (2010).
122. Y.-J. Tu, W.-H. Chen, H.-K. Sheen, International Journal of energy research 34, 265-274
(2010).
123. Z. Yang, Z.-H. Jiang, C.-L. So, C.-Y. Hse, Journal of Wood Science 53, 449-453 (2007).
124. K. Mikedi, A. Pappa, N. Tzamtzis, M. Statheropoulos, Journal of Analytical and Applied
Pyrolysis 67, 221-235 (2003).
125. E. Van den Bulck, L. Helsen, S. Mullens, J. Mullens, Journal of Analytical and Applied
Pyrolysis 52, 65-86 (1999).
126. H. W. Seisler, P. Wu, Journal of Near Infrared Spectroscopy 7, 65-76 (1999).
127. M. Montazer, A. Nazari, A. Rashidi, M. Yazdanshenas, M. B. Moghadam, Journal of Applied
Polymer Science 117, 2740-2748 (2010).
128. T. Larsson, H. Lennholm , T. Iversen, Carbohydrate Research 261, 119-131 (1994).
129. H. Lennholm. T. Josefsson, G. Gellerstedt, Cellulose 00, 1-8 (2002).
130. S. Kokot, C. Gilbert, Vibrational Spectroscopy 9, 161-167 (1995).
131. K. Schenzel, S. Fischer, K. Fischer, W. Diepenbrock, Macromolecular Symposia 223, 41-56
(2005).
132. W. F. Massy, Journal of the American Statistical Association 60 (309), 234-256 (1965).
133. Y. Mallet, W. Wu, B. Walczak, W. Penninckx, D. L. Massart, S. Heuerding, F. Erni,
Analytica Chimica Acta 329, 257-265 (1996).
134. L. Duponchel, Y. Roggo, J.-P. Huvenne, Analytica Chimica Acta 477 (2), 187-200 (2002).
135. J. Hughes, A. Basile, A. J. McFarlane, S. K. Bhargava, Minerals Engineering 23 (5), 407-412
(2010).
136. N. W. Daniel, I. R. Lewis, N. C. Chaffin, P. R. Griffith, Spectrochimica Acta 50A (11),
1943-1958 (1994).
137. R. Alén, P. Malkavaara, Chemometrics and intelligent laboratory systems 44, 287-292
(1998).
138. R. Shanks, F. Cerezo, J. Hughes, Journal of Thermal Analysis and Calorimetry 76,
1069-1078 (2004).
139. K. Mikedi, M. Statheropoulos, N. Tzamtzis, A. Pappa, Analytica Chimica Acta 461, 215–227
(2002).
140. P. C. Kuo, W.-H. Chen, Energy 35, 2580-2586 (2010).
141. G. Varhegyi, M. J. Antal, Industrial & Engineering Chemistry Research 34, 703-717 (1995).

Matthew Leonard, B.Sc. (Chemistry)
Honours RMIT - 2010
54
142. E. Zavarin, T. Nguyen, E. M. Barrall, Journal of Macromolecular Science Review
Macromolecular Chemistry 1, 1-65 (1981).
143. G. Faughey, H. S. S. Sharma, D. McCall, Journal of Textile Institute 87 (Part 1, No. 2),
249-257 (1995).
144. B. Tajeddin, L. C. Abdulah, Polymers & Polymer Composites 18 (5), 195-199 (2010).
145. M.-H. Yang, Y.-H. Lin, Thermochimica Acta 470, 52-59 (2008).
146. A. G. V. Zholobenko, J. Dwyer, Thermochimica Acta 294, 39-44 (1997).
147. H. W. Williams, Thermochimica Acta 1, 253-259 (1969).
148. K. Van Werde, J. Mullens, G. Vanhoyland, R. Nouwen, M. K. Van Bael, L. C. Van Poucke,
Thermochimica Acta 392-393, 29-35 (2002).
149. E. Brendler, K. Zhang, S. Fischer, Cellulose 17, 427-435 (2010).
150. P. D. Hatton, C. A. Lucas, S. Bates, T. W. Ryan, S. Miles, B. K. Tanner, Journal of Applied
Physics 63 (6), 1936 - 1941 (1988).
151. H.-P. Fink, B. Philipp, D. Hofmann, Polymer 30, 237-241 (1989).
152. A. C. O'Sullivan, Cellulose 4, 173-207 (1997).
153. L. Ferré, Computational Statistics & Data Analysis 19, 669-682 (1995).
154. R. G. Brereton, Chemometrics for pattern recognition, 1st ed. (Wiley, West Sussex, UK,
2009).
155. G. R. Heal, D. Dollimore, Carbon 5 (1), 65-72 (1967).
156. M. J. E. Golay, A. Savitzky, Analytical Chemistry 36 (8), 1627-1639 (1964).
157. R. G. Brereton, (University of Bristol, Bristol, UK, 2003)
http://www.chm.bris.ac.uk/org/chemometrics/.
158. A. Svantesson, F. W. Langkilde, Journal of Pharmaceutical & Biomedical Analysis 13 (4/5),
409-414 (1995).
159. S. Fischer, K. Schenzel, E. Brendler, Cellulose 12, 223-231 (2005).
160. R. H. Atalla, J. H. Wiley, Carbohydrate Research 160, 113-129 (1987).

Matthew Leonard, B.Sc. (Chemistry)
Honours RMIT - 2010
55
Appendices
Appendix A: Thermograms

Matthew Leonard, B.Sc. (Chemistry)
Honours RMIT - 2010
56
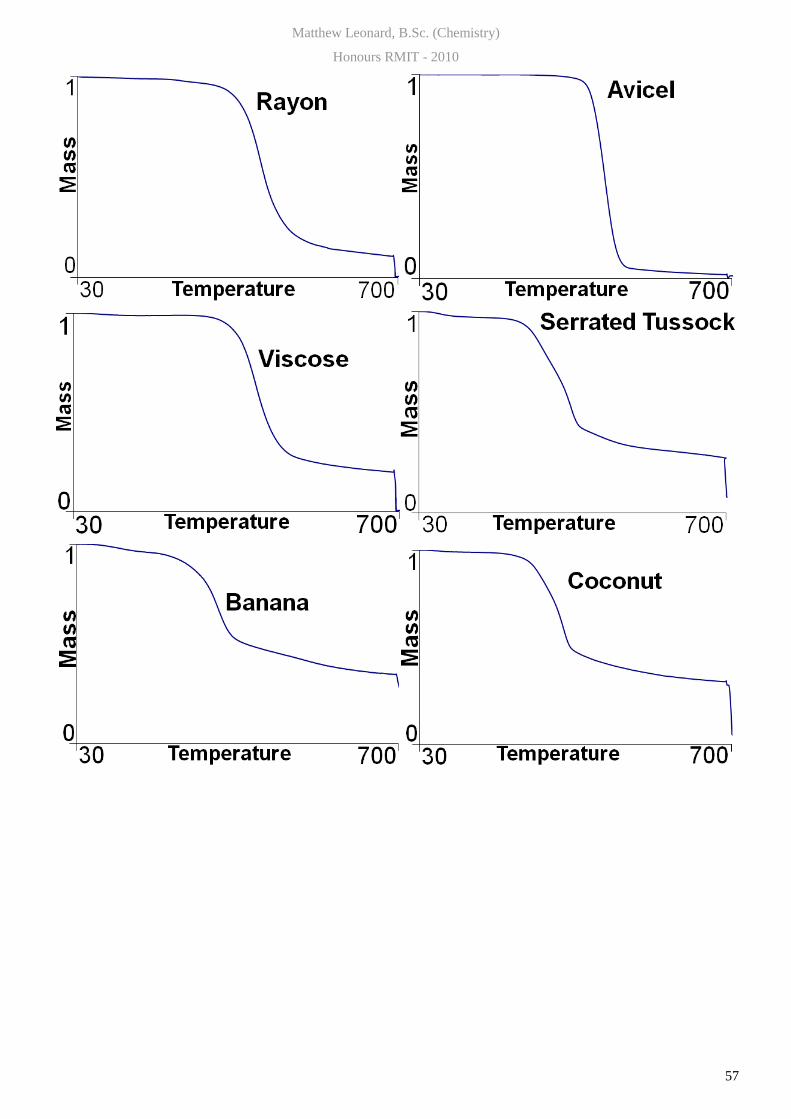
Matthew Leonard, B.Sc. (Chemistry)
Honours RMIT - 2010
57

Matthew Leonard, B.Sc. (Chemistry)
Honours RMIT - 2010
58
Appendix B: IR spectra

Matthew Leonard, B.Sc. (Chemistry)
Honours RMIT - 2010
59

Matthew Leonard, B.Sc. (Chemistry)
Honours RMIT - 2010
60