cliffside hotel geotechnical design cee121
TRANSCRIPT
Profits Incorporated 10488 Eastborne Avenue Los Angeles, California, 90024 (510) 5937394
March 13, 2015 Resort Development, Incorporated 2145 Mackenburger Drive Los Angeles, California, 90040 Attn: Dr. Stewart, Dr. Hudson Subject: Response to work authorization
Hotel development South La Senda Drive and Bay Drive
Laguna Beach, California Dear Doctor Stewart and Doctor Hudson,
In accordance with your authorization to proceed on February 3rd, 2015, this letter report presents the results of our geotechnical investigation undertaken at the site of the proposed hotel development, by Resort Development, Inc.
As per our understanding, the proposed hotel site, located in Laguna Beach, California, is
currently occupied by singlefamily homes and trailers.We understand the proposed construction consists of a hotel with three portions: a central building with two wings; and a onestory restaurant adjacent to the ocean bluff. All three portions of the hotel building are proposed to be up to four stories above grade, with the basement of the main hotel approximately 25 feet below the existing grade. The restaurant, however, is not planned to contain a basement. Your letter listed the anticipated load associated with the central portion of the proposed hotel as 350 to 700 kips, with the southern wing as 200 to 350 kips, and with the western wing as 250 to 450 kips. The proposed restaurant is expected to have relatively light column and wall loads. Additionally, your letter contained a plan showing the layout and topography of the proposed hotel site, a mass grading plan for the proposed hotel site and laboratory test results and boring logs from previous investigations at the site by Moore and Taber in 1980, and AGRA Earth and Environmental, Inc., in 1999 (figures 1, 2, and appendices 1, 2).
1
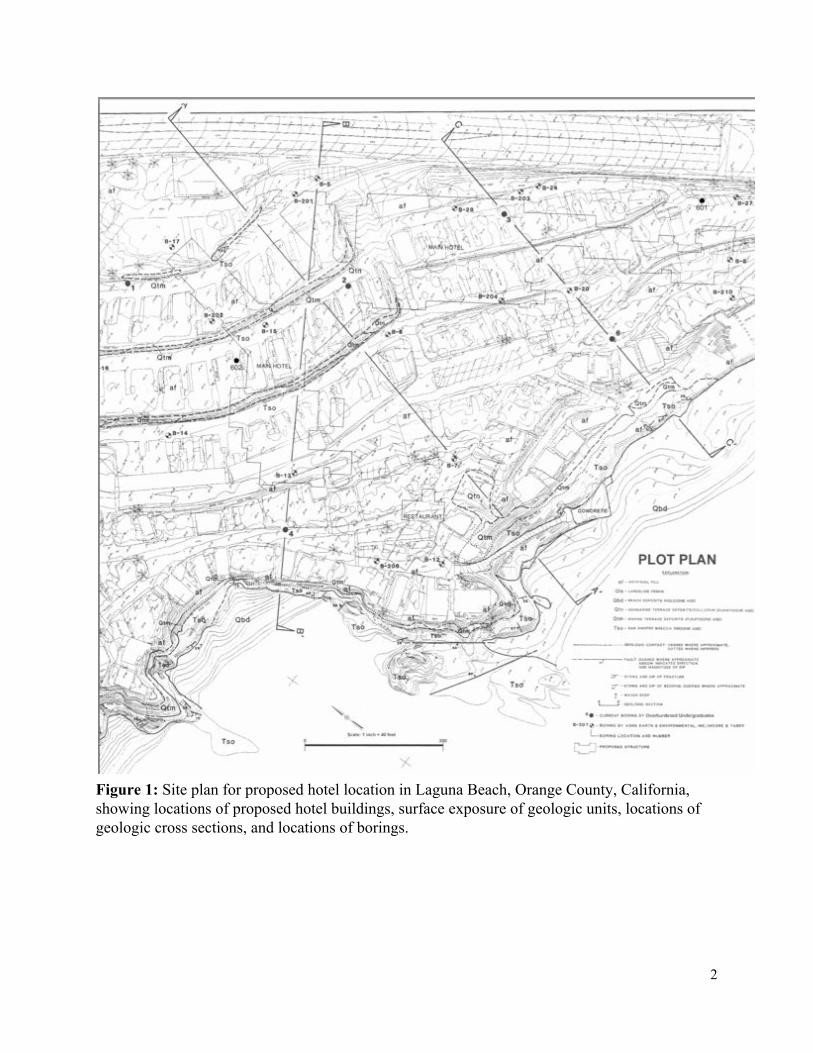
Figure 1: Site plan for proposed hotel location in Laguna Beach, Orange County, California, showing locations of proposed hotel buildings, surface exposure of geologic units, locations of geologic cross sections, and locations of borings.
2

Figure 2: Mass grading plan for the site, showing location and and thickness of fill. SCOPE OF WORK
The scope of work in this investigation included the following tasks:
1. A site investigation including the drilling of 7 borings: four using an 8” hollow stem auger, and three using a 24” diameter bucket. Subsurface samples were taken during the boring process using Shelby Tubes, Modified California Samplers (MCSs), and Standard Penetration Tests (SPTs), and geologic cross sections were prepared at three locations at the site.
2. Laboratory testing to characterize the engineering properties of both clayey and sandy foundation soils, and of the compacted fill soil.
3
3. Engineering analysis of clayey foundation soil settlement and bearing capacity under the main hotel buildings; of bearing capacity of artificial fill under the hotel restaurant; of slope stability of fill during placement; of lateral earth pressures on retaining walls and basement walls (including consideration of bearing capacity, overturning, and sliding of retaining walls); and of slope stability of the coastal bluffs.
4. Development of recommendations for slope stability during site excavation; for fill placement, grading and compaction; for foundations under the main hotel buildings and restaurant; for retaining and basement walls; and lastly for slope stability of the coastal bluffs.
This report has been prepared for the exclusive use of Resort Development Inc. for specific application to their proposed hotel site in Laguna Beach, Orange County, California in accordance with generally accepted geotechnical engineering practices. No other warranty, expressed or implied, is made. In the event that any changes in the nature, design, or location of the facility are planned or made, the conclusions and recommendations contained in this report should not be considered valid unless the changes are reviewed and conclusions of this report modified or verified in writing. The findings of this report are valid as of the present date. However, the passing of time will likely change the conditions of the existing site due to natural processes or the works of man. In addition, due to legislation or the broadening of knowledge, changes in applicable or appropriate standards may occur. Accordingly, the findings of this report may be invalidated, wholly or partly, by changes beyond our control. Therefore, this report should not be relied upon after a period of three years without being reviewed by this office. SITE CONDITIONS Prior Investigations
The data from previous investigations at this site available to us at the time of our investigation include twelve 6” flight auger borings from Moore and Taber performed in 1980 (B5, B6, B7, B8, B12, B13, B15, B17, B20, B24, B27, B28). and six 24” diameter bucket borings from AGRA Earth and Environmental Inc. performed in 1999 (B201, B202, B203, B204, B206, B210). The locations of these borings are shown in the plot plan (figure 1, appendix 1), and the boring logs are attached as appendix 2. Investigations Performed
Our site investigation included the drilling of 7 borings: four using an 8” hollow stem auger, and three using a 24” diameter bucket (locations shown in the plot plan, appendix 1). Subsurface samples were taken during the boring process using Shelby Tubes, MCSs, and SPTs. The depths and sampling methods for samples taken from each boring are shown in the boring logs (appendix 2). Samples taken during the SPTs were disturbed, and therefore used for grain size analysis and Atterberg limit tests. All other laboratory tests were performed using the relatively undisturbed samples from the Shelby Tubes and MCSs.
4
Surface Conditions
The proposed hotel site is located along a coastal bluff in Laguna Beach, Orange County, California, and is currently occupied by single family homes, trailers, and vegetation. The bluff historically has stability problems resulting in semiregular flow slides. Portions of the site are paved with asphalt, and there is some surface exposure of local soil and rock, and preexisting fill. The current ground topography, the locations of the existing structures, vegetation, and asphalt, and the surface exposure of various soil and rock units are shown in the existing plot plan of the site (figure 1, appendix 1). Subsurface Conditions
The boring logs performed as a part of this investigation were used in conjunction with the boring logs from the investigations of More and Taber in 1980 and Agra Earth and Environmental Inc. in 1999 to better constrain subsurface stratigraphy. Using the logs and the geologic map, three geologic cross sections of the site (AA’, BB’ and CC’) were prepared (appendix 1). Section AA’ and CC’ strike roughly north, and section BB’ strikes roughly northwest.
The naturallyoccurring lithology of the site is broken down into five units. Quaternary beach sand (Qbs) and Quaternary landslide deposits (Qls) are the scarcest units, and are located surficially along the coastal bluffs.
The next youngest unit in the stratigraphy section consists of Quaternary nonmarine terrace deposits (Qtn), primarily sandy silt, silty sand and silty clay. Upon inspection during boring, the material was described as massive to poorly bedded, dark reddish brown in color, porous, and wellgraded with some subangular clasts.
Quaternary marine terrace deposits (Qtm) generally underlie the nonmarine terrace deposits, and consist primarily of clayey sand and silty sand. Upon inspection during boring, the material was described as having poorly to well developed bedding, subangular to round clasts up to 4” in size, and being light brown in color. The sand to silty sand in this layer has a representative SPT blow count (N1)60 of 18, a relative density (Dr) of 63%, and an effective stress friction angle (ϕ’) of 36.8° (table 3).
Lastly, the Tertiary San Onofre breccia (Tso) underlies the marine and nonmarine terrace deposits. The breccia was described during boring as being highly weathered and oxidized, having massive to poor bedding, and being up to 60% angular clasts up to 3’ in size mostly of schist.
Additionally, there is a preexisting sandy fill throughout the site. However, there are no records of placement for the fill. The majority of this fill, where it is identified in the plot plan and borings, will be removed during the planned excavation and grading process. The exception to this is the fill along the coastal bluffs, which will be excavated and refilled using properly compacted fill.
Water seepage was encountered at a depth of 47’ in boring 3, and traces of water were observed at a depth of 35’ in boring 6, 10 minutes after termination of drilling. Generally the groundwater table (GWT) was found to be deep during drilling; however some analyses are
5
performed under the assumption of GWT rise during landscaping and irrigation of the hotel grounds. LABORATORY TESTING Gradation Test
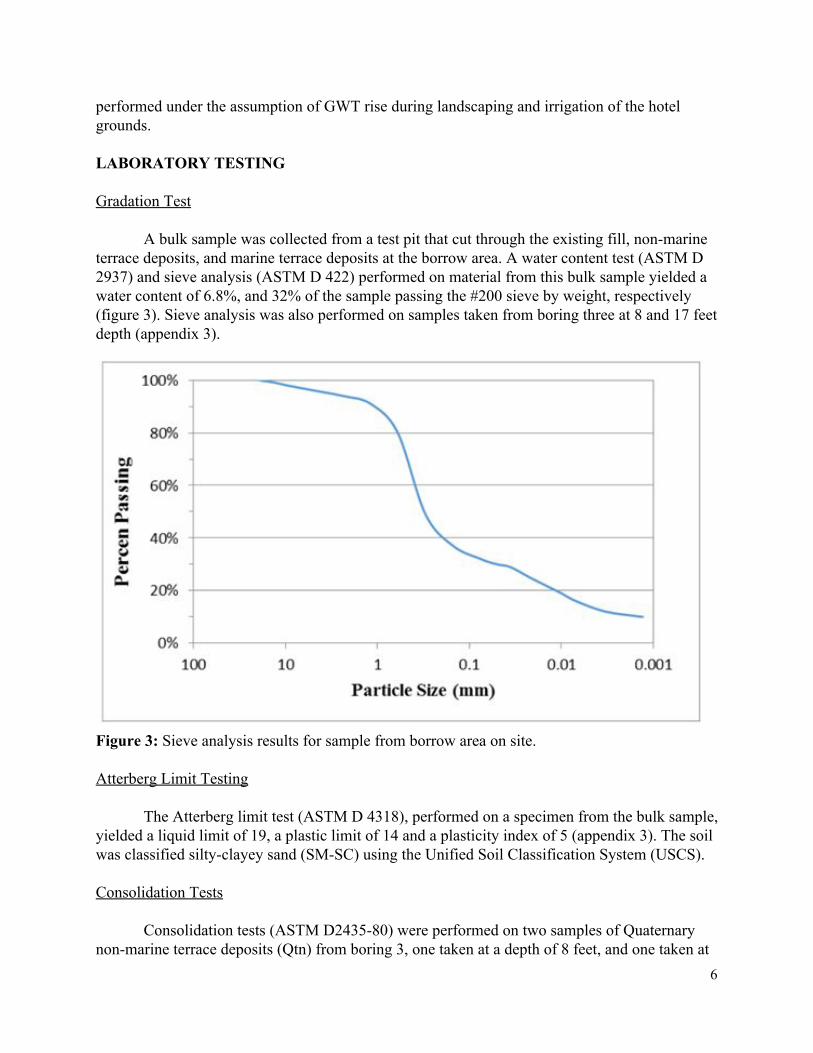
A bulk sample was collected from a test pit that cut through the existing fill, nonmarine terrace deposits, and marine terrace deposits at the borrow area. A water content test (ASTM D 2937) and sieve analysis (ASTM D 422) performed on material from this bulk sample yielded a water content of 6.8%, and 32% of the sample passing the #200 sieve by weight, respectively (figure 3). Sieve analysis was also performed on samples taken from boring three at 8 and 17 feet depth (appendix 3).
Figure 3: Sieve analysis results for sample from borrow area on site. Atterberg Limit Testing
The Atterberg limit test (ASTM D 4318), performed on a specimen from the bulk sample, yielded a liquid limit of 19, a plastic limit of 14 and a plasticity index of 5 (appendix 3). The soil was classified siltyclayey sand (SMSC) using the Unified Soil Classification System (USCS). Consolidation Tests
Consolidation tests (ASTM D243580) were performed on two samples of Quaternary nonmarine terrace deposits (Qtn) from boring 3, one taken at a depth of 8 feet, and one taken at
6
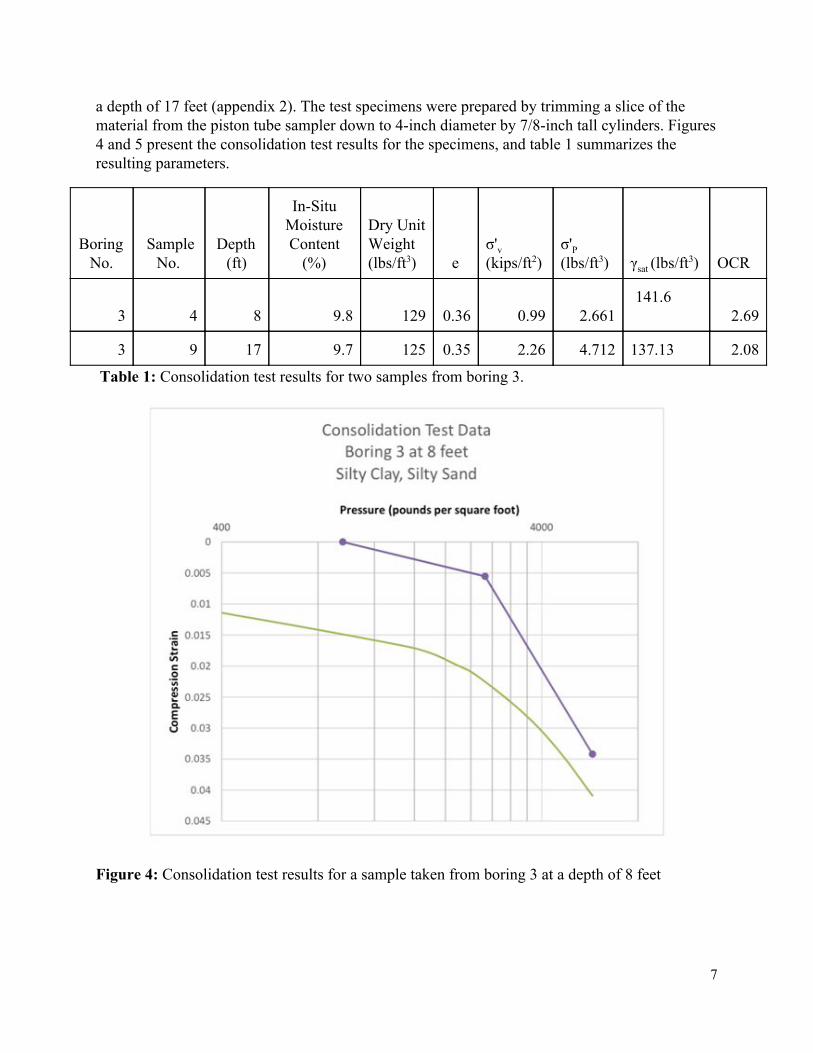
a depth of 17 feet (appendix 2). The test specimens were prepared by trimming a slice of the material from the piston tube sampler down to 4inch diameter by 7/8inch tall cylinders. Figures 4 and 5 present the consolidation test results for the specimens, and table 1 summarizes the resulting parameters.
Boring No.
Sample No.
Depth (ft)
InSitu Moisture Content (%)
Dry Unit Weight (lbs/ft3) e
σ'v (kips/ft2)
σ'P (lbs/ft3) γsat (lbs/ft3) OCR
3 4 8 9.8 129 0.36 0.99 2.661 141.6
2.69
3 9 17 9.7 125 0.35 2.26 4.712 137.13 2.08
Table 1: Consolidation test results for two samples from boring 3.
Figure 4: Consolidation test results for a sample taken from boring 3 at a depth of 8 feet
7
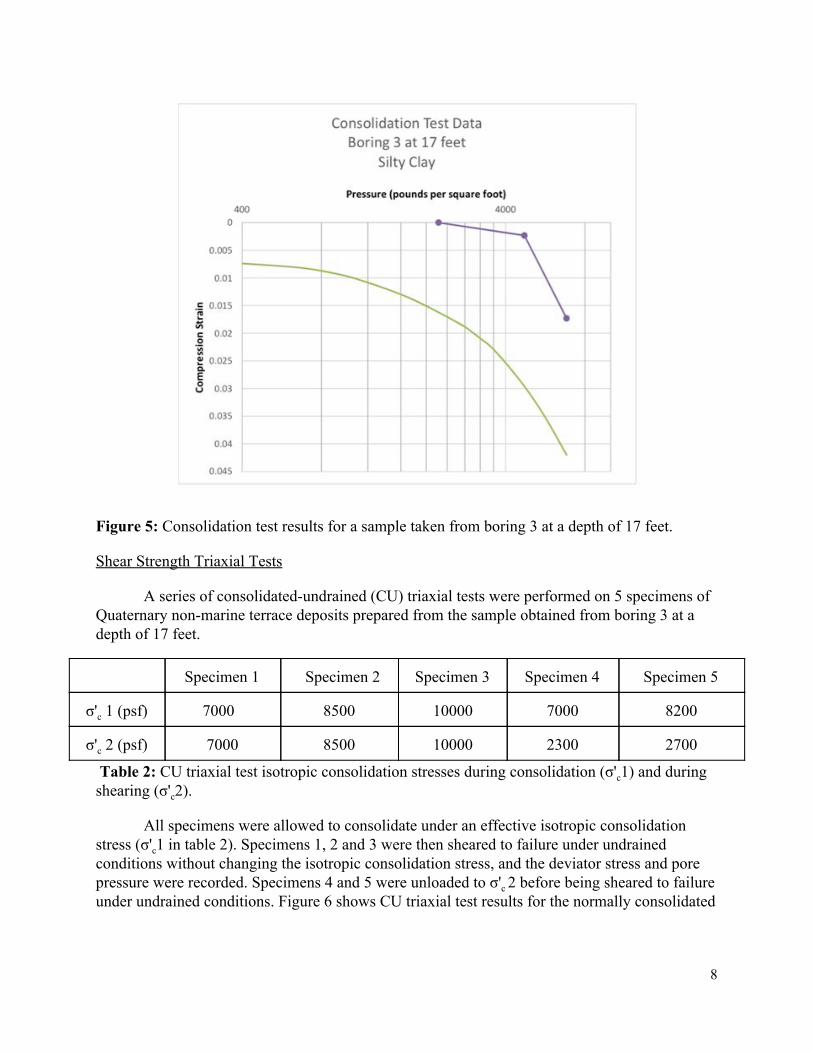
Figure 5: Consolidation test results for a sample taken from boring 3 at a depth of 17 feet.
Shear Strength Triaxial Tests
A series of consolidatedundrained (CU) triaxial tests were performed on 5 specimens of Quaternary nonmarine terrace deposits prepared from the sample obtained from boring 3 at a depth of 17 feet.
Specimen 1 Specimen 2 Specimen 3 Specimen 4 Specimen 5
σ'c 1 (psf) 7000 8500 10000 7000 8200
σ'c 2 (psf) 7000 8500 10000 2300 2700
Table 2: CU triaxial test isotropic consolidation stresses during consolidation (σ'c1) and during shearing (σ'c2).
All specimens were allowed to consolidate under an effective isotropic consolidation stress (σ'c1 in table 2). Specimens 1, 2 and 3 were then sheared to failure under undrained conditions without changing the isotropic consolidation stress, and the deviator stress and pore pressure were recorded. Specimens 4 and 5 were unloaded to σ'c 2 before being sheared to failure under undrained conditions. Figure 6 shows CU triaxial test results for the normally consolidated
8
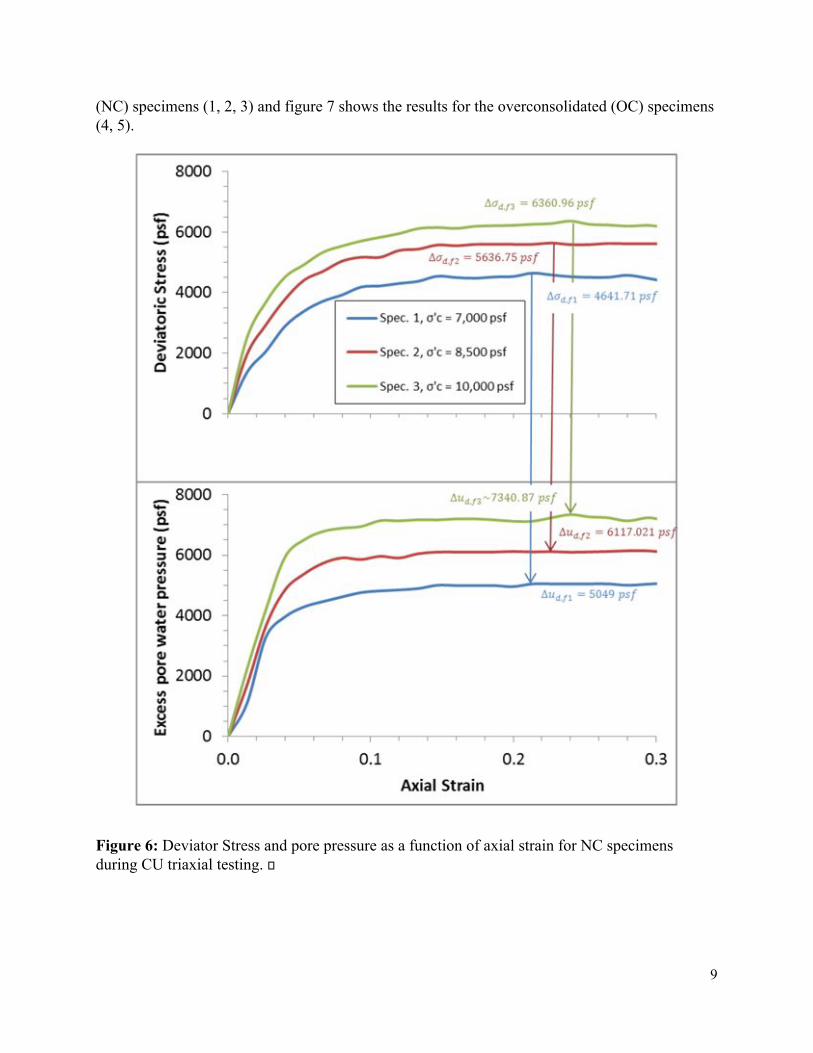
(NC) specimens (1, 2, 3) and figure 7 shows the results for the overconsolidated (OC) specimens (4, 5).
Figure 6: Deviator Stress and pore pressure as a function of axial strain for NC specimens during CU triaxial testing.
9
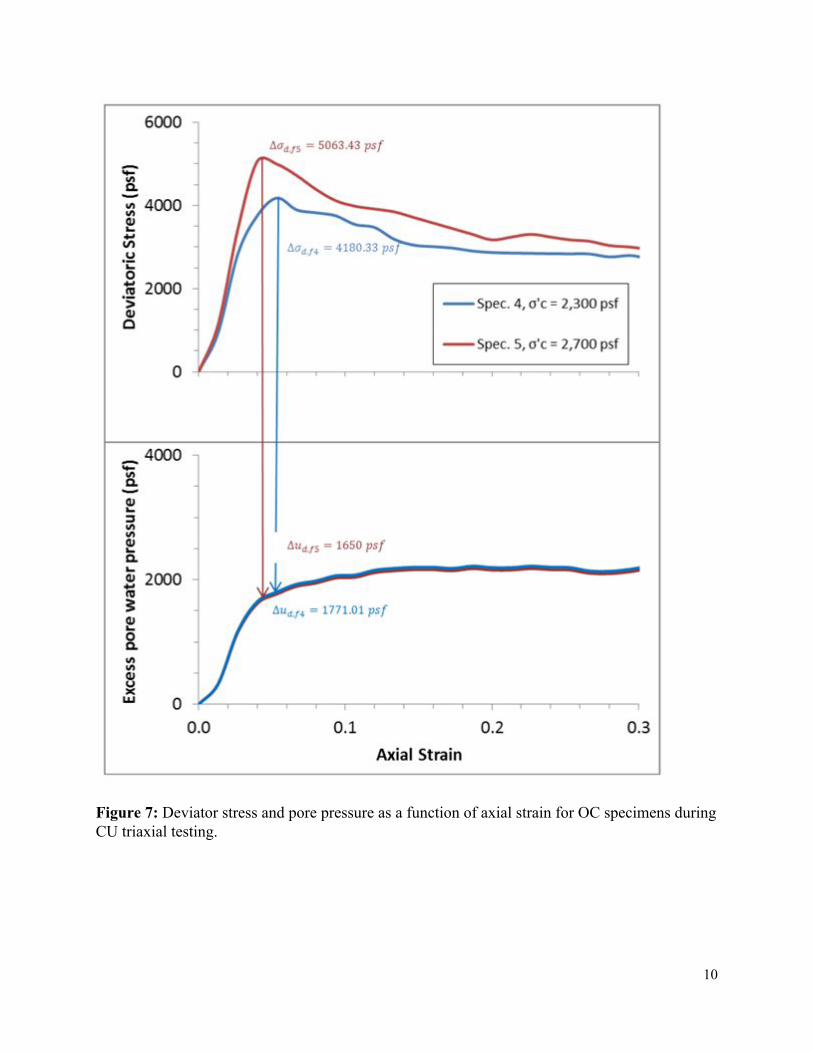
Figure 7: Deviator stress and pore pressure as a function of axial strain for OC specimens during CU triaxial testing.
10
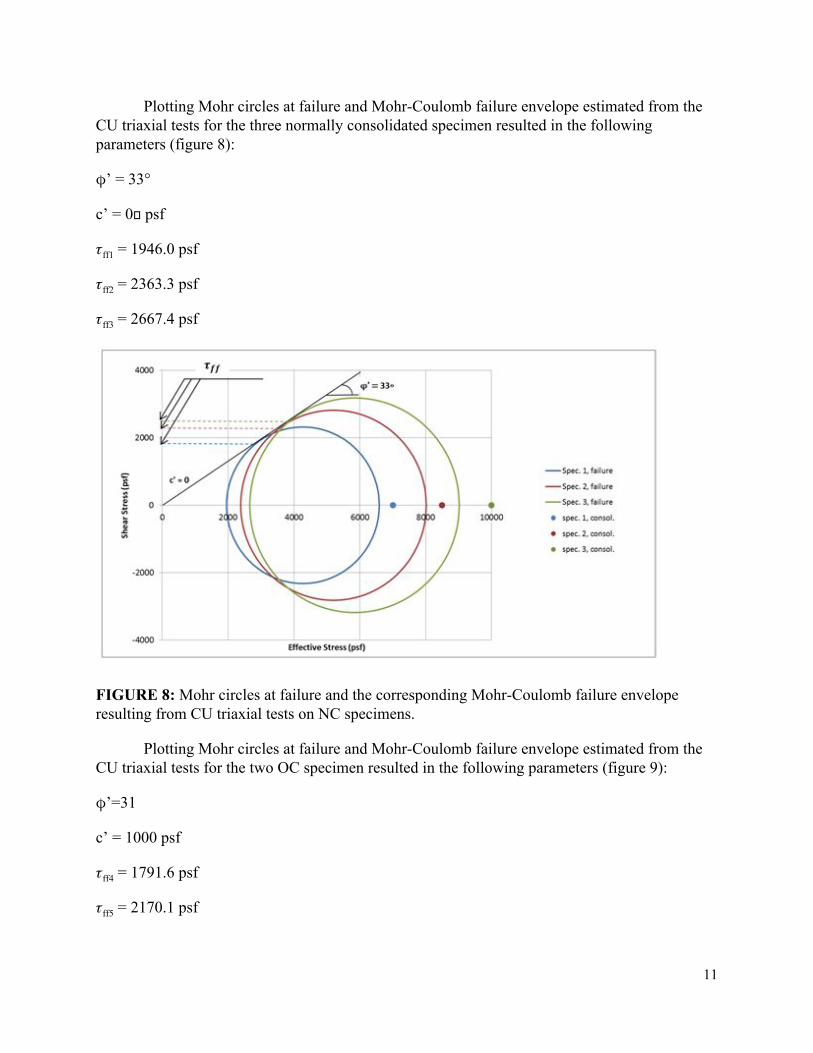
Plotting Mohr circles at failure and MohrCoulomb failure envelope estimated from the CU triaxial tests for the three normally consolidated specimen resulted in the following parameters (figure 8):
ϕ’ = 33°
c’ = 0 psf
ᵰff1 = 1946.0 psf
ᵰff2 = 2363.3 psf
ᵰff3 = 2667.4 psf
FIGURE 8: Mohr circles at failure and the corresponding MohrCoulomb failure envelope resulting from CU triaxial tests on NC specimens.
Plotting Mohr circles at failure and MohrCoulomb failure envelope estimated from the CU triaxial tests for the two OC specimen resulted in the following parameters (figure 9):
ϕ’=31
c’ = 1000 psf
ᵰff4 = 1791.6 psf
ᵰff5 = 2170.1 psf
11
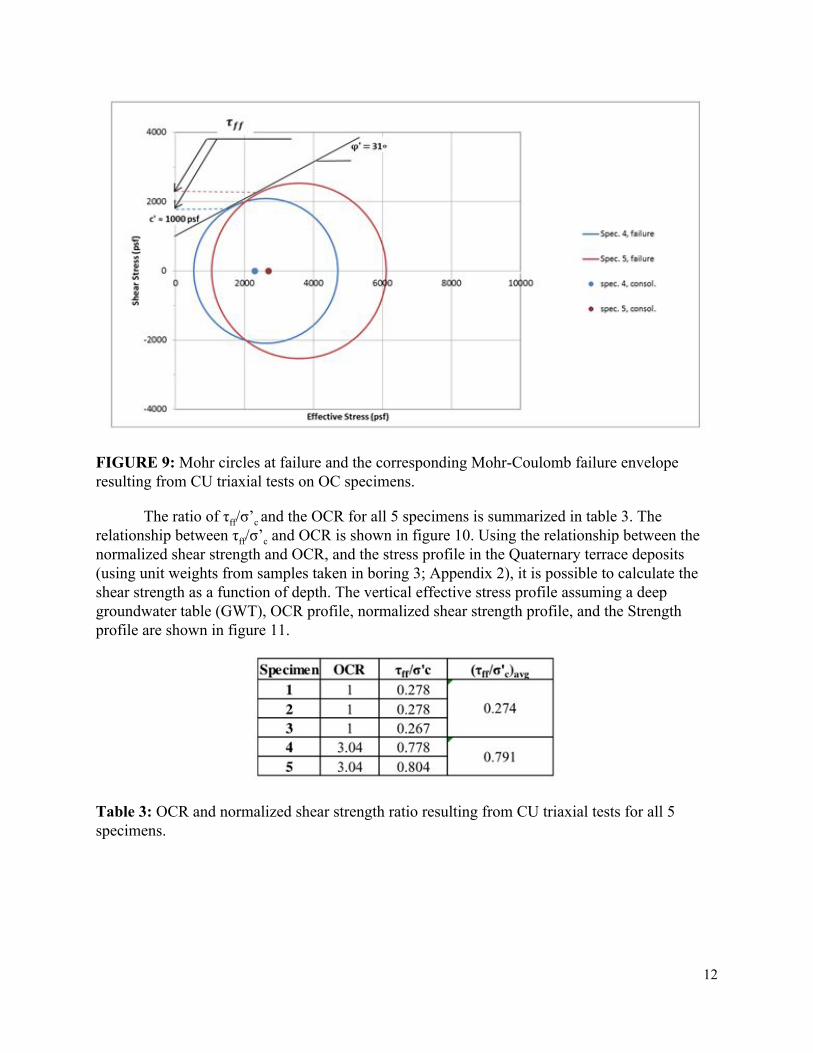
FIGURE 9: Mohr circles at failure and the corresponding MohrCoulomb failure envelope resulting from CU triaxial tests on OC specimens.
The ratio of τff/σ’c and the OCR for all 5 specimens is summarized in table 3. The relationship between τff/σ’c and OCR is shown in figure 10. Using the relationship between the normalized shear strength and OCR, and the stress profile in the Quaternary terrace deposits (using unit weights from samples taken in boring 3; Appendix 2), it is possible to calculate the shear strength as a function of depth. The vertical effective stress profile assuming a deep groundwater table (GWT), OCR profile, normalized shear strength profile, and the Strength profile are shown in figure 11.
Table 3: OCR and normalized shear strength ratio resulting from CU triaxial tests for all 5 specimens.
12
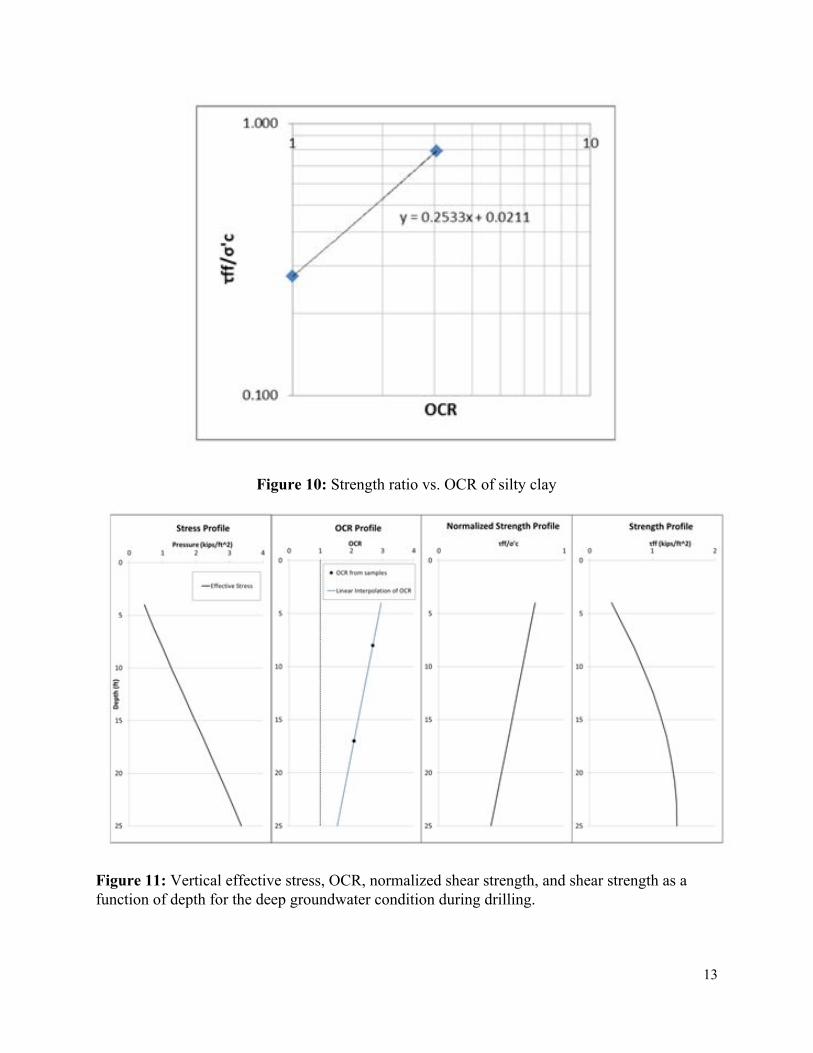
Figure 10: Strength ratio vs. OCR of silty clay
Figure 11: Vertical effective stress, OCR, normalized shear strength, and shear strength as a function of depth for the deep groundwater condition during drilling.
13
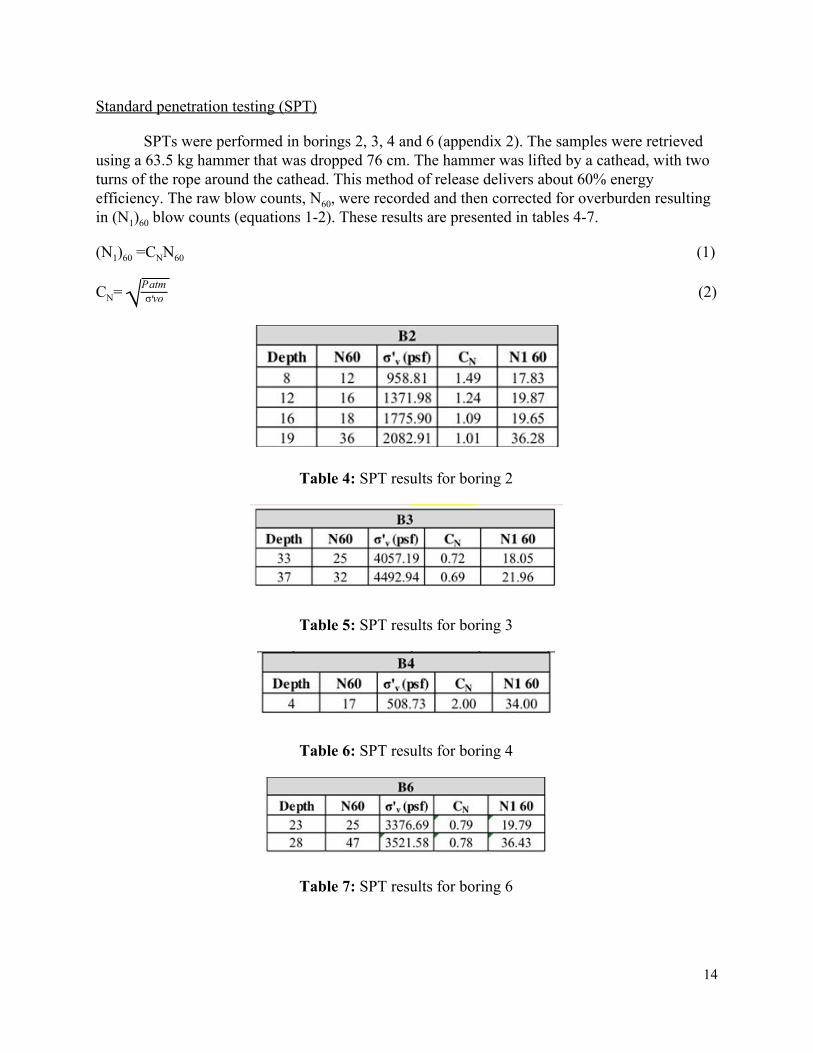
Standard penetration testing (SPT)
SPTs were performed in borings 2, 3, 4 and 6 (appendix 2). The samples were retrieved using a 63.5 kg hammer that was dropped 76 cm. The hammer was lifted by a cathead, with two turns of the rope around the cathead. This method of release delivers about 60% energy efficiency. The raw blow counts, N60, were recorded and then corrected for overburden resulting in (N1)60 blow counts (equations 12). These results are presented in tables 47.
(N1)60 =CNN60 (1)
CN= √ σvo′
Patm (2)
Table 4: SPT results for boring 2
Table 5: SPT results for boring 3
Table 6: SPT results for boring 4
Table 7: SPT results for boring 6
14
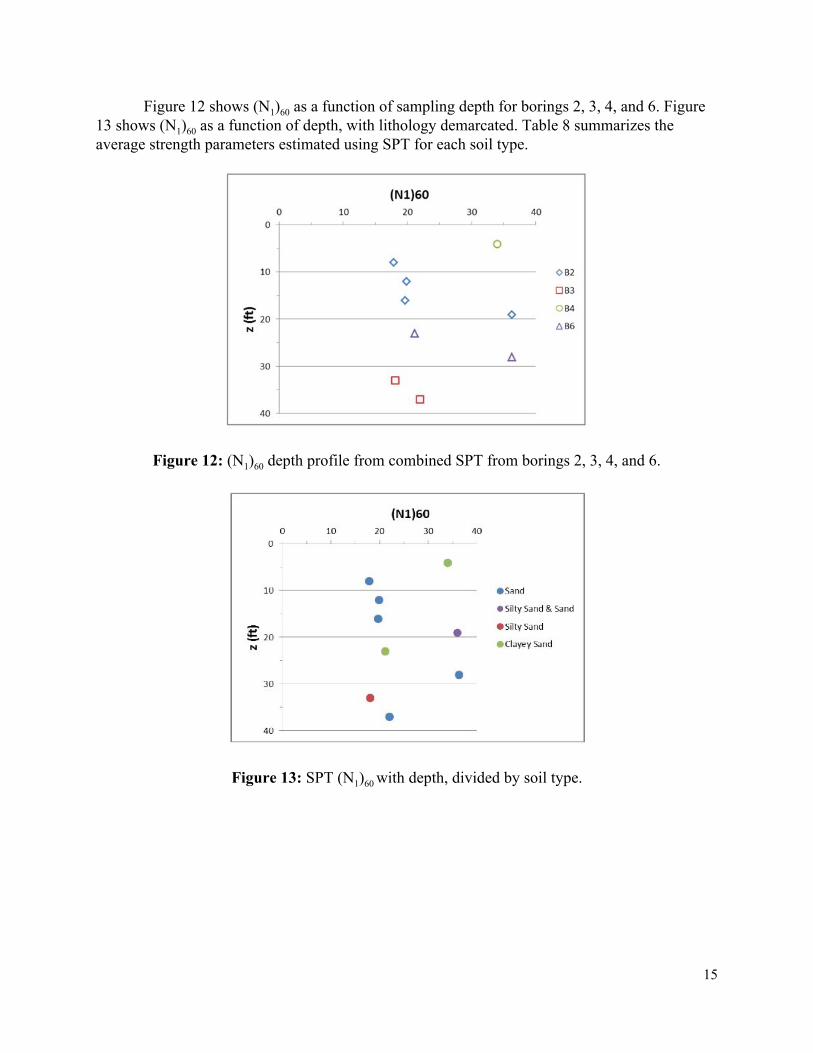
Figure 12 shows (N1)60 as a function of sampling depth for borings 2, 3, 4, and 6. Figure 13 shows (N1)60 as a function of depth, with lithology demarcated. Table 8 summarizes the average strength parameters estimated using SPT for each soil type.
Figure 12: (N1)60 depth profile from combined SPT from borings 2, 3, 4, and 6.
Figure 13: SPT (N1)60 with depth, divided by soil type.
15
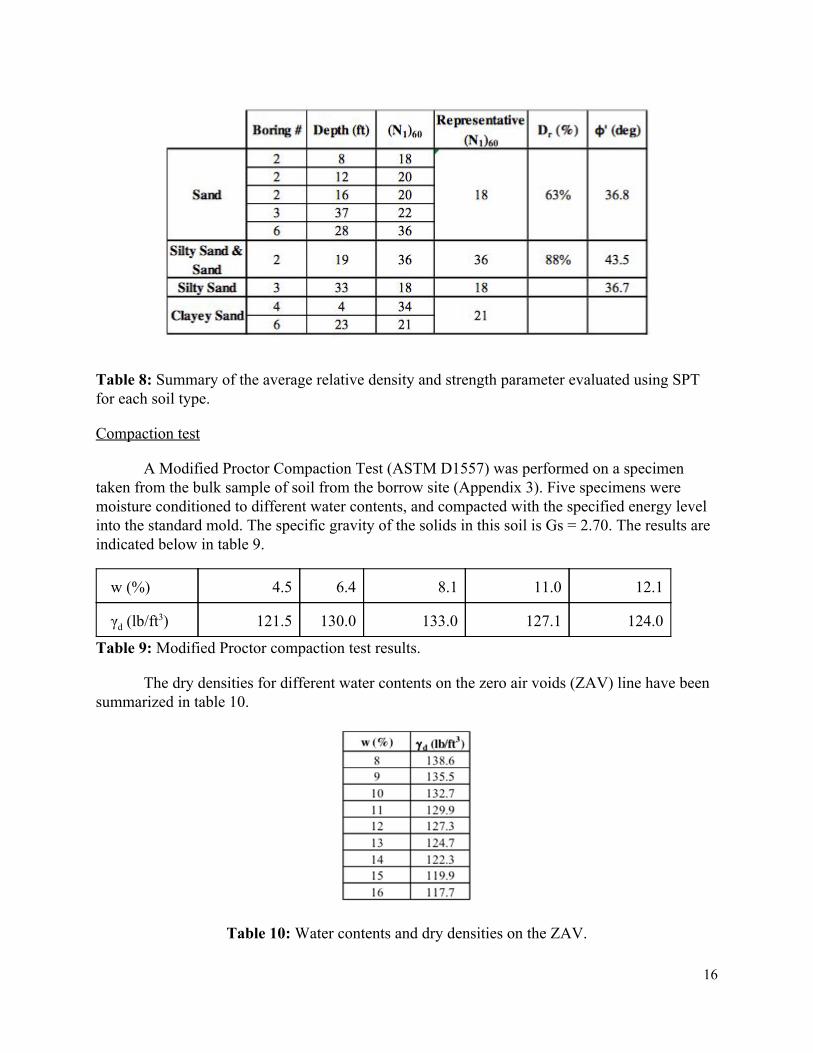
Table 8: Summary of the average relative density and strength parameter evaluated using SPT for each soil type.
Compaction test
A Modified Proctor Compaction Test (ASTM D1557) was performed on a specimen taken from the bulk sample of soil from the borrow site (Appendix 3). Five specimens were moisture conditioned to different water contents, and compacted with the specified energy level into the standard mold. The specific gravity of the solids in this soil is Gs = 2.70. The results are indicated below in table 9.
w (%) 4.5 6.4 8.1 11.0 12.1
γd (lb/ft3) 121.5 130.0 133.0 127.1 124.0
Table 9: Modified Proctor compaction test results.
The dry densities for different water contents on the zero air voids (ZAV) line have been summarized in table 10.
Table 10: Water contents and dry densities on the ZAV.
16

The Modified Proctor compaction test (ASTM D1557) gives an optimum moisture content of 8.0% and a maximum dry density of 133.f lb/ft3 (figure 14).
Figure 14: Modified Proctor compaction curve for fill.
Hydrocompression tests were performed after soaking the soil and applying surcharges of 900 pounds per square foot (psf), 1800 psf and 2700 psf. The test results are shown in table 11 , and the contour lines on the compaction curves are displayed in figure 15 (see also appendix 3 for ASTM D1883 results).
Table 11: Hydrocompression test results.
17
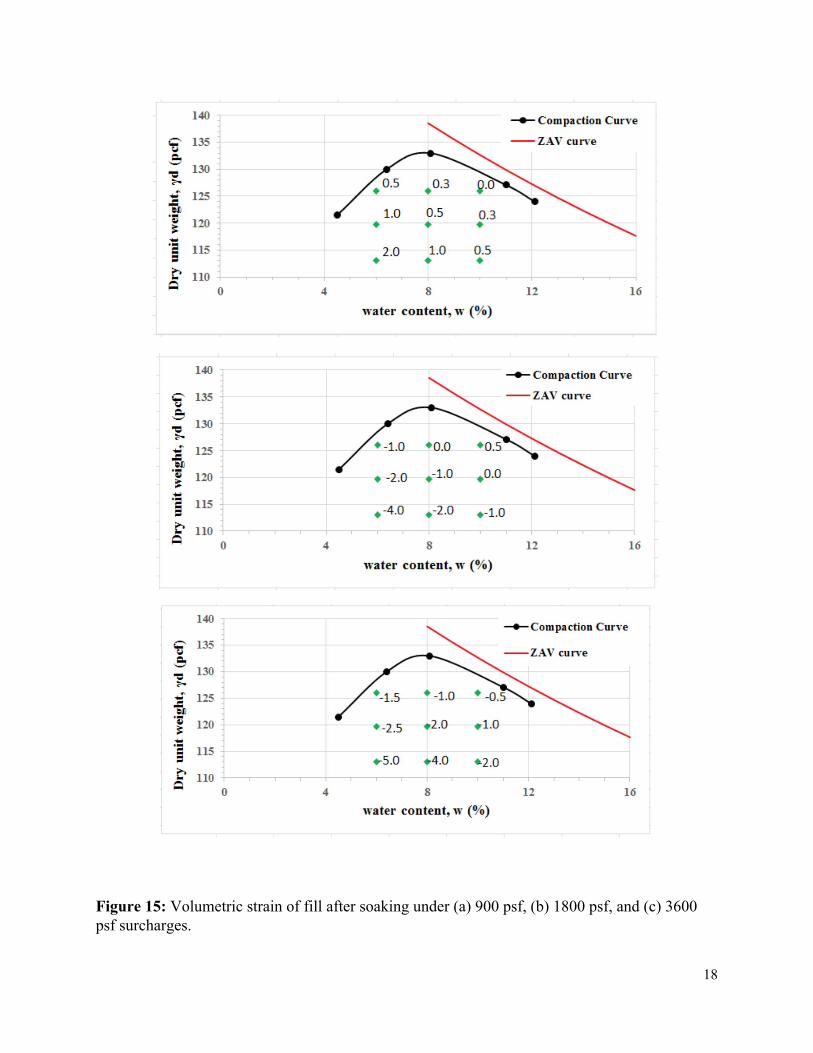
Figure 15: Volumetric strain of fill after soaking under (a) 900 psf, (b) 1800 psf, and (c) 3600 psf surcharges.
18
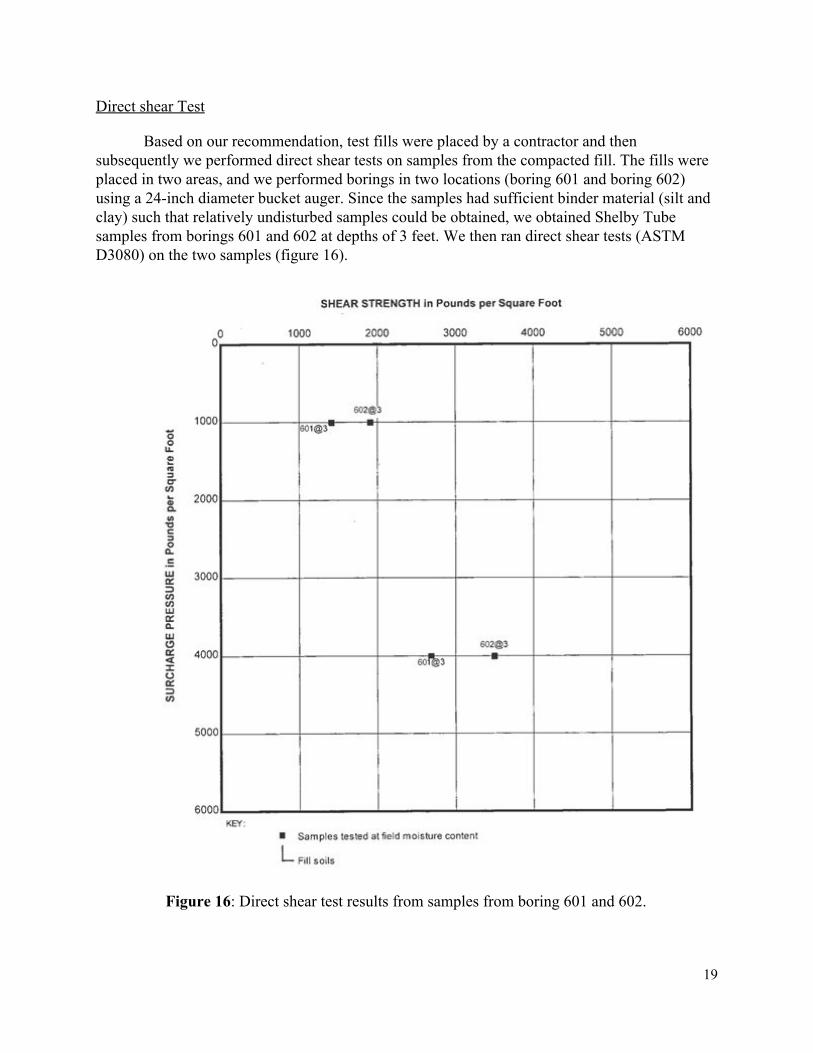
Direct shear Test
Based on our recommendation, test fills were placed by a contractor and then subsequently we performed direct shear tests on samples from the compacted fill. The fills were placed in two areas, and we performed borings in two locations (boring 601 and boring 602) using a 24inch diameter bucket auger. Since the samples had sufficient binder material (silt and clay) such that relatively undisturbed samples could be obtained, we obtained Shelby Tube samples from borings 601 and 602 at depths of 3 feet. We then ran direct shear tests (ASTM D3080) on the two samples (figure 16).
Figure 16: Direct shear test results from samples from boring 601 and 602.
19

ANALYSIS AND RECOMMENDATIONS Grading and Fill Placement
The location and thickness of the proposed artificial fill is shown in the mass grading plan (appendix 1). The fill will be borrowed onsource; in other words the fill will be excavated from the site. In order to prevent failure due to differential movement of structural components, it is necessary that the volumetric strains of the fill under surcharge pressure after soaking are limited to 0.5% or less for swell and 1.0% or less for hydrocompression.
Compaction tests performed on samples of the borrowed fill are shown in figures 14 and 15. The shaded areas in figure 17 represent the dry unit weight and water contents that meet the design criteria of limiting swell upon wetting to less than 0.5% and hydrocompression to less than 1.0%.
It is recommended that for fills less than 13 feet in depth (expected to have overburden pressures of 9001800 psf), the minimum relative compaction should be 89% of the maximum dry density obtainable according to the ASTM D1557 compaction test and a water content between optimum to 2% over optimum. For fills greater than or equal to 13 feet (expected to have overburden pressures greater than 1800 psf), the relative compaction should be greater than 94% of the maximum dry density according to the ASTM D1557 compaction test, and a water content between optimum and 4% over optimum.
20
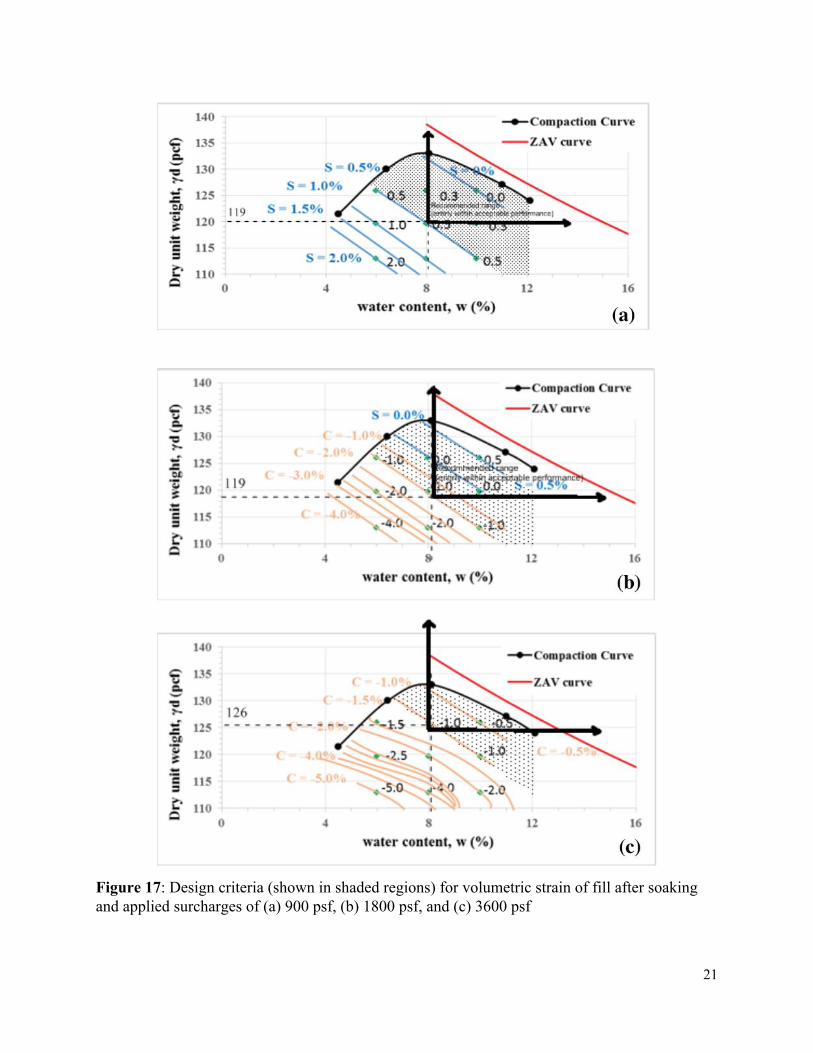
Figure 17: Design criteria (shown in shaded regions) for volumetric strain of fill after soaking and applied surcharges of (a) 900 psf, (b) 1800 psf, and (c) 3600 psf
21
Slope Stability During Site Excavation
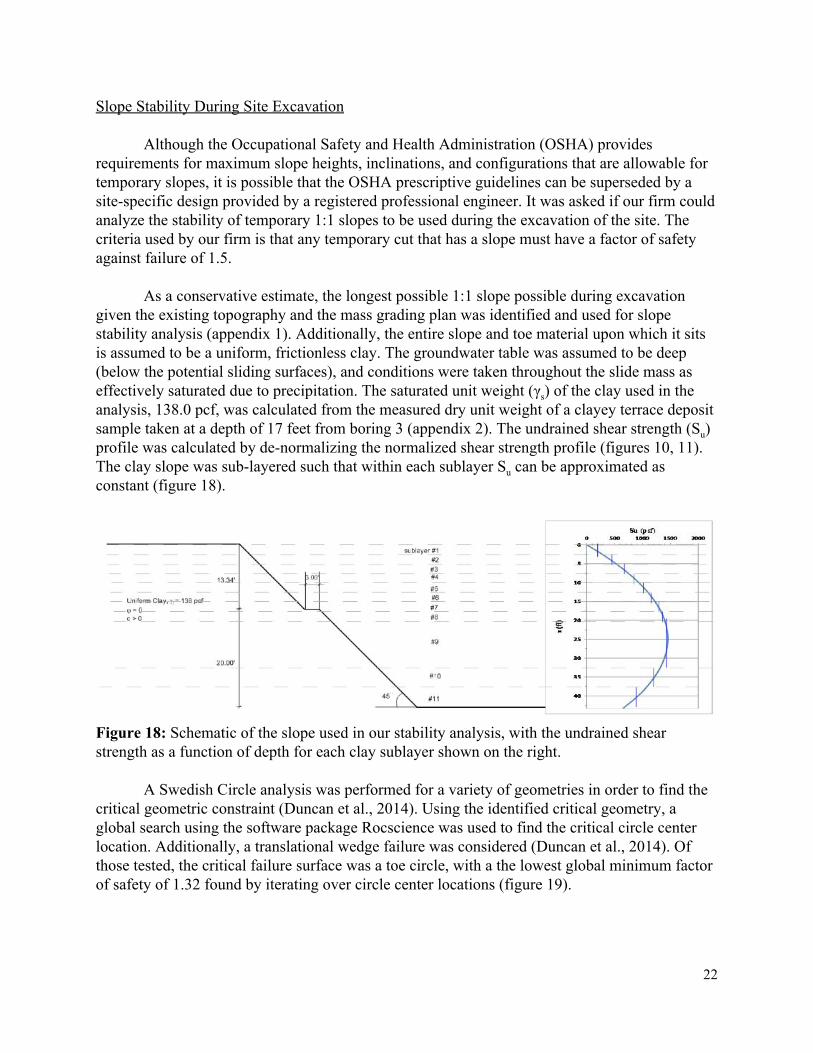
Although the Occupational Safety and Health Administration (OSHA) provides requirements for maximum slope heights, inclinations, and configurations that are allowable for temporary slopes, it is possible that the OSHA prescriptive guidelines can be superseded by a sitespecific design provided by a registered professional engineer. It was asked if our firm could analyze the stability of temporary 1:1 slopes to be used during the excavation of the site. The criteria used by our firm is that any temporary cut that has a slope must have a factor of safety against failure of 1.5. As a conservative estimate, the longest possible 1:1 slope possible during excavation given the existing topography and the mass grading plan was identified and used for slope stability analysis (appendix 1). Additionally, the entire slope and toe material upon which it sits is assumed to be a uniform, frictionless clay. The groundwater table was assumed to be deep (below the potential sliding surfaces), and conditions were taken throughout the slide mass as effectively saturated due to precipitation. The saturated unit weight (γs) of the clay used in the analysis, 138.0 pcf, was calculated from the measured dry unit weight of a clayey terrace deposit sample taken at a depth of 17 feet from boring 3 (appendix 2). The undrained shear strength (Su) profile was calculated by denormalizing the normalized shear strength profile (figures 10, 11). The clay slope was sublayered such that within each sublayer Su can be approximated as constant (figure 18).
Figure 18: Schematic of the slope used in our stability analysis, with the undrained shear strength as a function of depth for each clay sublayer shown on the right. A Swedish Circle analysis was performed for a variety of geometries in order to find the critical geometric constraint (Duncan et al., 2014). Using the identified critical geometry, a global search using the software package Rocscience was used to find the critical circle center location. Additionally, a translational wedge failure was considered (Duncan et al., 2014). Of those tested, the critical failure surface was a toe circle, with a the lowest global minimum factor of safety of 1.32 found by iterating over circle center locations (figure 19).
22
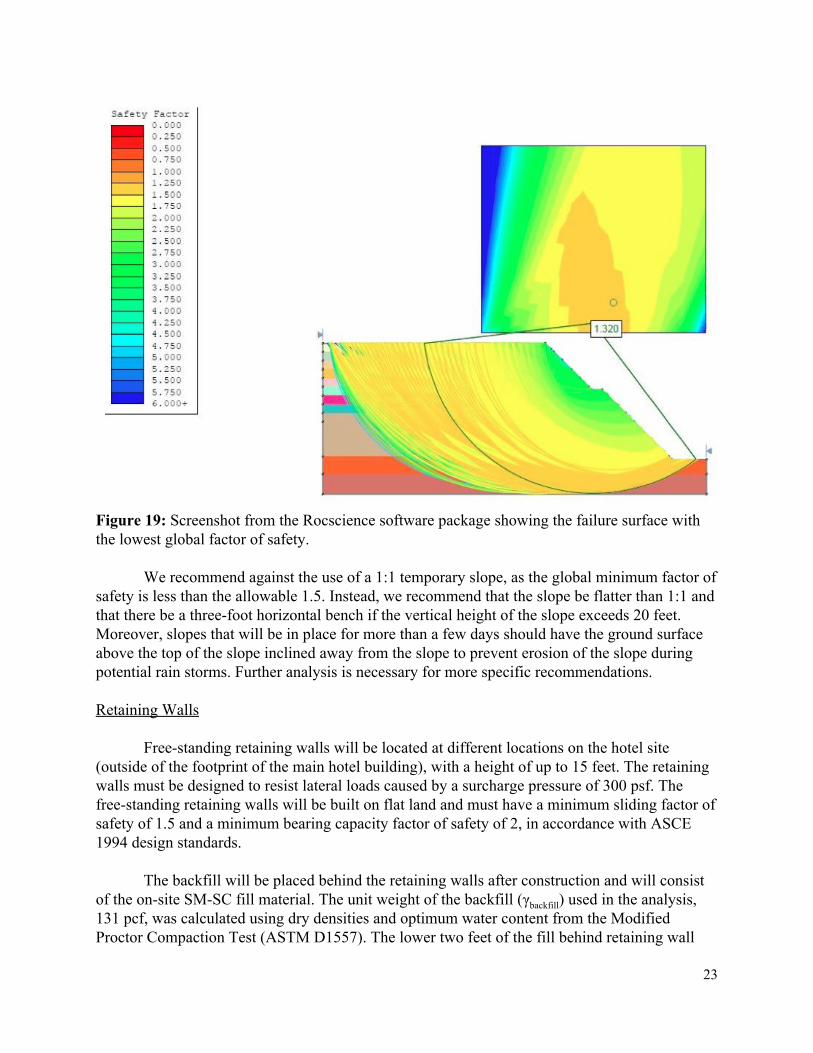
Figure 19: Screenshot from the Rocscience software package showing the failure surface with the lowest global factor of safety. We recommend against the use of a 1:1 temporary slope, as the global minimum factor of safety is less than the allowable 1.5. Instead, we recommend that the slope be flatter than 1:1 and that there be a threefoot horizontal bench if the vertical height of the slope exceeds 20 feet. Moreover, slopes that will be in place for more than a few days should have the ground surface above the top of the slope inclined away from the slope to prevent erosion of the slope during potential rain storms. Further analysis is necessary for more specific recommendations. Retaining Walls
Freestanding retaining walls will be located at different locations on the hotel site (outside of the footprint of the main hotel building), with a height of up to 15 feet. The retaining walls must be designed to resist lateral loads caused by a surcharge pressure of 300 psf. The freestanding retaining walls will be built on flat land and must have a minimum sliding factor of safety of 1.5 and a minimum bearing capacity factor of safety of 2, in accordance with ASCE 1994 design standards.
The backfill will be placed behind the retaining walls after construction and will consist of the onsite SMSC fill material. The unit weight of the backfill (γbackfill) used in the analysis, 131 pcf, was calculated using dry densities and optimum water content from the Modified Proctor Compaction Test (ASTM D1557). The lower two feet of the fill behind retaining wall
23

will be compacted to at least 94% of the maximum dry density obtainable with the ASTM D1557 method of compaction, and the upper 13 feet will be compacted to at least 89% of the maximum dry density obtainable with the ASTM D1557 method of compaction. Corresponding to this, the water content will be compacted to in the range of optimum water content to 4% over optimum.
Direct shear tests (ASTM D3080) were performed on fill samples from Borings 601 and 602 after two test sections of fill were placed. From the two samples, an average friction angle of 25° was derived. The foundation soil of is a clean sand layer of terrace deposits with a unit weight (γfield) of 105 pcf and a friction angle of 36°, from SPT (table 8). All values are calculated assuming good drainage.
A method of Rankine earth pressure analysis was utilized to predict active and passive earth pressures acting on the freestanding retaining walls. It can be assumed that the soil is cohesionless and the wall is frictionless, as outlined in Coduto et al 2010. The freestanding retaining walls are analyzed using conventional stability analysis (ASCE 1994) to determine the wall’s ability to withstand sliding, overturning and bearing capacity. The retaining walls have an active earth pressure of 5452 lb/ft resulting from the backfill. Additionally, the surcharge pressure present on the ground surface behind the wall will create an active earth pressure of 1800 lb/ft. The walls will also have a passive pressure of 1450 lb/ft. Figure 20 illustrates the variation of earth pressure with depth. For the freestanding cantilever retaining walls, a footing width of 15.5 ft is required to satisfy the aforementioned design conditions.
Figure 20: Lateral Earth Pressures vs. Depth for Retaining Walls
It is recommended to use a 15 ft high cantilever concrete retaining wall. We recommend
using a shallow spread footing foundation with a minimum width of 15.5 feet. These footing dimensions will ensure a sliding factor of safety of at least 1.5 and a bearing capacity factor of safety well over 2, as required by the ASCE 1994 design criteria.
The above pressures assume that sufficient drainage will be provided behind the walls to prevent the buildup of hydrostatic pressures from surface and subsurface water infiltration. Adequate drainage may be provided by a subdrain system consisting of a 4inch rigid perforated pipe bedded in ¾inch clean, open graded rock. The entire rock/pipe unit should be wrapped in
24
an approved, nonwoven polyester geotextile. The rock and fabric placed behind the wall should be at least one foot in width and should extend to within one foot of finished grade. The upper one foot of backfill should consist of onsite, compacted soil of low permeability. The subdrain pipe should be connected to a system of closed pipes that lead to suitable discharge facilities.
These ditches, which will collect runoff water from the slopes, should be sloped to drain to suitable discharge facilities. The top of the walls should extend at least one foot above the ditch. All structural backfill placed behind the walls should be compacted to at least 90 percent relative compaction based on the ASTM D1557 standard.
Basement Walls
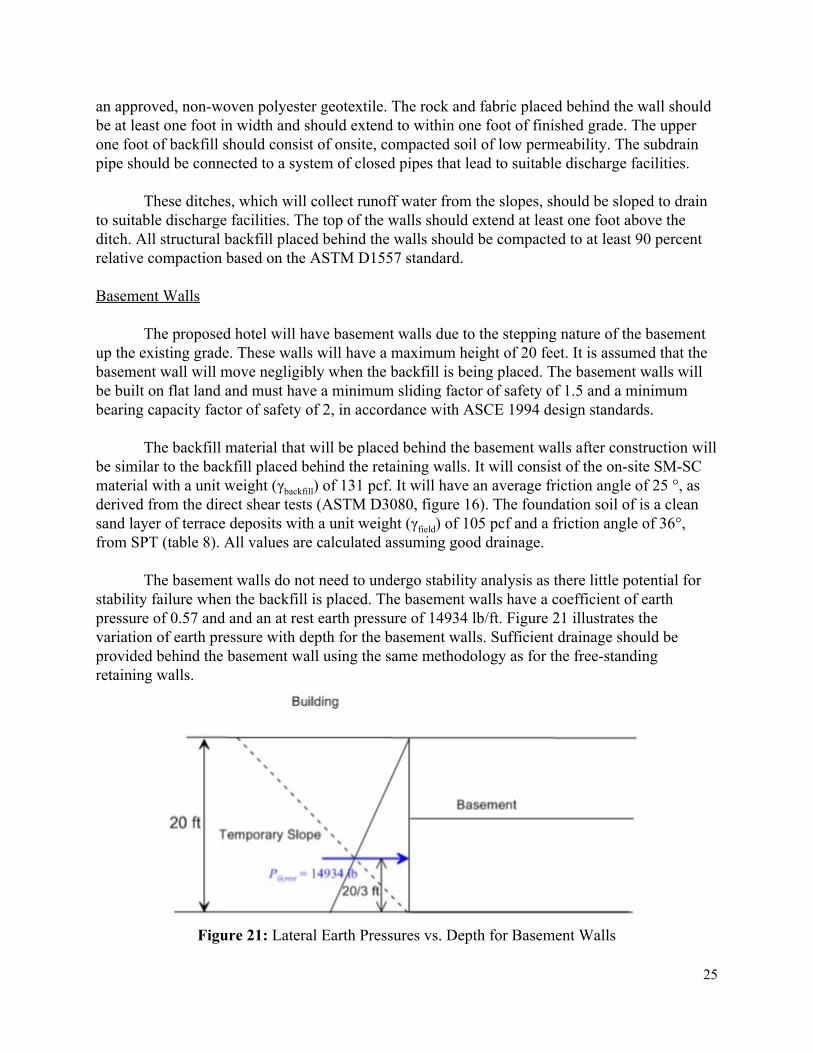
The proposed hotel will have basement walls due to the stepping nature of the basement up the existing grade. These walls will have a maximum height of 20 feet. It is assumed that the basement wall will move negligibly when the backfill is being placed. The basement walls will be built on flat land and must have a minimum sliding factor of safety of 1.5 and a minimum bearing capacity factor of safety of 2, in accordance with ASCE 1994 design standards.
The backfill material that will be placed behind the basement walls after construction will
be similar to the backfill placed behind the retaining walls. It will consist of the onsite SMSC material with a unit weight (γbackfill) of 131 pcf. It will have an average friction angle of 25 °, as derived from the direct shear tests (ASTM D3080, figure 16). The foundation soil of is a clean sand layer of terrace deposits with a unit weight (γfield) of 105 pcf and a friction angle of 36°, from SPT (table 8). All values are calculated assuming good drainage.
The basement walls do not need to undergo stability analysis as there little potential for
stability failure when the backfill is placed. The basement walls have a coefficient of earth pressure of 0.57 and and an at rest earth pressure of 14934 lb/ft. Figure 21 illustrates the variation of earth pressure with depth for the basement walls. Sufficient drainage should be provided behind the basement wall using the same methodology as for the freestanding retaining walls.
Figure 21: Lateral Earth Pressures vs. Depth for Basement Walls
25
Hotel Foundations
The following foundation design conditions were taken from either the RFP, or from local / state / federal building codes, or from generally accepted geotechnical engineering practices:
The hotel foundation columns will be each spaced 30 ft. apart. The maximum differential settlement between the Type 1 footings must be less than ½
inch, and less than 1 inch for between Type 3 footings. The indicated loads for each footing type, based on subfooting material and based on
location: Type 1: 350700 kips (clay, sand & bedrock), located along CC’ Type 2: 200350 kips (bedrock), located along BB’ Type 3: 250450 kips (sand), located along BB’
The factor of safety must be greater than 3.0 against bearing cap failure for each footing. For each footing type, two embedment depths will be examined: 2 & 5 ft., to evaluate
strength gains provided by deeper footings.
Additionally, all the previous testing designations and specifications given up to this point are assumed to have been met. Any other assumptions of trivial nature that were made in the following analysis are presented in their respective sections of this report.
The properties of the soil are as follows:
Type 1 Footings (Clay, Sand & Bedrock): The footings for this section of the foundation will be arranged adjacently on bedrock
(San Onofre Breccia) and soil (Marine Terrace Deposits). The bedrock is assumed to be incompressible and to have excess bearing strength relative to the soils. The soils present at this location are layered silty sand and clayey sand (referred in this report as ‘clay’), sand, and bedrock (figure 22). The groundwater table, initially beneath the bedrock, will be assumed to rise to the base of the foundation due to irrigation, which will create saturated soil conditions. The rise of the groundwater table will increase the overconsolidation ratios for all soil sublayers that were previously above the initial groundwater table. Additionally, this means that the undrained shear strengths will be used for the clay analysis (figure 23). For foundations located on soils, the layering will be assumed to be clay on top, with a sandy layer underneath, and bedrock beneath that. The sand is assumed to have immediate settlement, while the clay is presumed to consolidate over time. The column load for this section, as stated in the design conditions, is 700 kips.
26
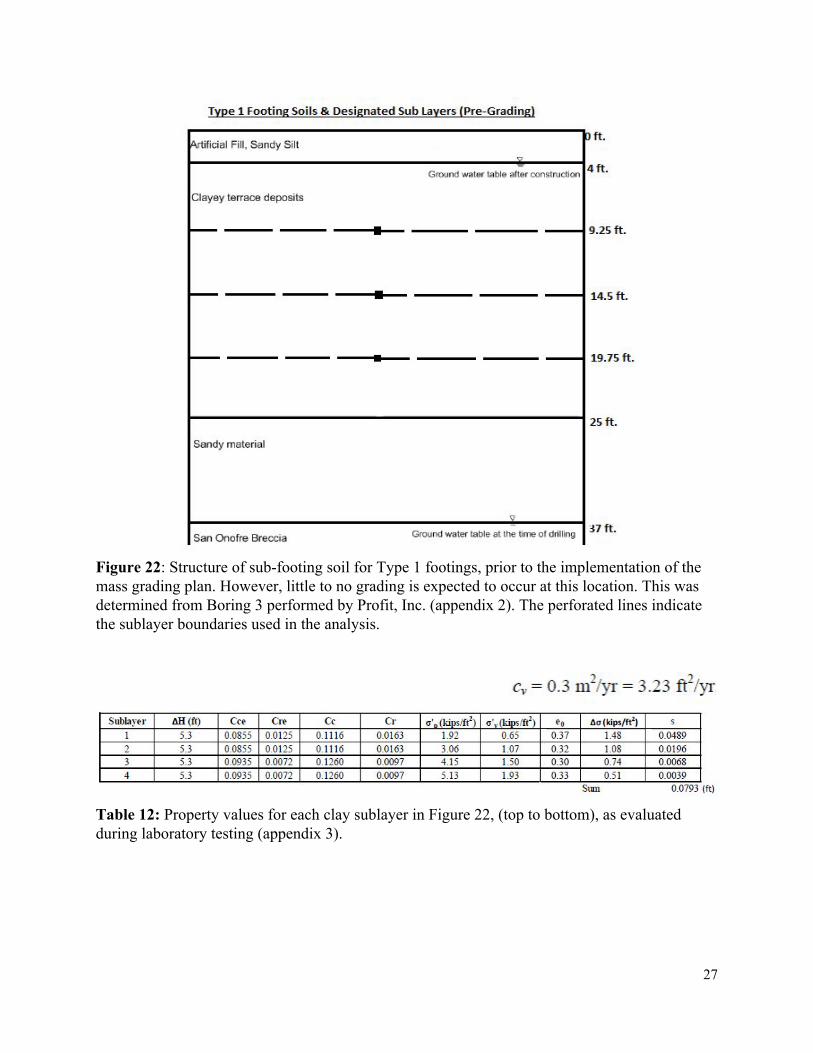
Figure 22: Structure of subfooting soil for Type 1 footings, prior to the implementation of the mass grading plan. However, little to no grading is expected to occur at this location. This was determined from Boring 3 performed by Profit, Inc. (appendix 2). The perforated lines indicate the sublayer boundaries used in the analysis.
Table 12: Property values for each clay sublayer in Figure 22, (top to bottom), as evaluated during laboratory testing (appendix 3).
27

Figure 23: Undrained shear strength profile for clay beneath Type 1 footings. The undrained strengths were used, because the groundwater table is assumed to rise due to irrigation around the hotel.
Type 2 Footings (Bedrock): The Type 2 footings will rest entirely on solid bedrock, which is assumed to have
significantly higher strength parameters than the surrounding soils. As such it will experience effectively zero settlement. The columns loading for this section is expected to be 350 kips.
Type 3 Footings (Sand): The Type 3 footings will be arranged on sandy deposits with bedrock underneath (figure
24). The sand is considered to experience immediate settlement, and to drain rapidly and thus not cause any appreciable increase in pore pressure. The following charts outline the relevant properties for this soil (Table 13). The columns loading for this segment were indicated as 450 kips.
28

Figure 24: Structure of subfooting soil for Type 3 footings, prior to the mass grading plan implementation. Determined from Boring B13 performed by Moore and Taber (appendix 2).
Table 13: Relevant initial properties of sand beneath Type 3 footings. The unit weight for the sands was assumed relatively uniform, and calculated to be 109 pcf in the laboratory testing (appendix 3).
The analysis was carried out in the order of settlement first, then bearing capacity second in order to evaluate which would be the controlling factor in the footing design. For the clay settlement calculations (Type 1 Footings), the Terzaghi 1D model (Holtz et al., 2011) was used, using the double drainage variable due to the presence of the sand layer beneath the clay. The clay was divided into four representative sublayers (figure 22), then analyzed layer by layer. The sand settlements (Type 3 Footings) were calculated using the Burland and Burbidge 1985 procedure. Finally, the Meyerhof general bearing capacity equation was then used in each case to evaluate the maximum allowable bearing pressure for the foundations (Das, 2010).
After retrieving the laboratory test results and running the analysis procedures outlined above, the following results were obtained. For Type 1 footings, the bearing capacity is the controlling factor of foundation dimensions, for Type 2 footings, the bearing capacity and settlement are considered irrelevant, and for Type 3 footings, the controlling factor is the settlement. Three footing dimensions were tested for each case, and two embedment depths were tested. For the final design for Type 1 footings, the expected settlement on the clay is 0.95 inches, and it is expected to occur over time, with 43% (0.41 inches) settlement after 5 years (figures 25 and 26). For the Type 2 footings, there is no expected settlement, because it is situated directly on the bedrock. For the final design for Type 3 footings, the sand is expected to settle 0.96 inches almost immediately.
29
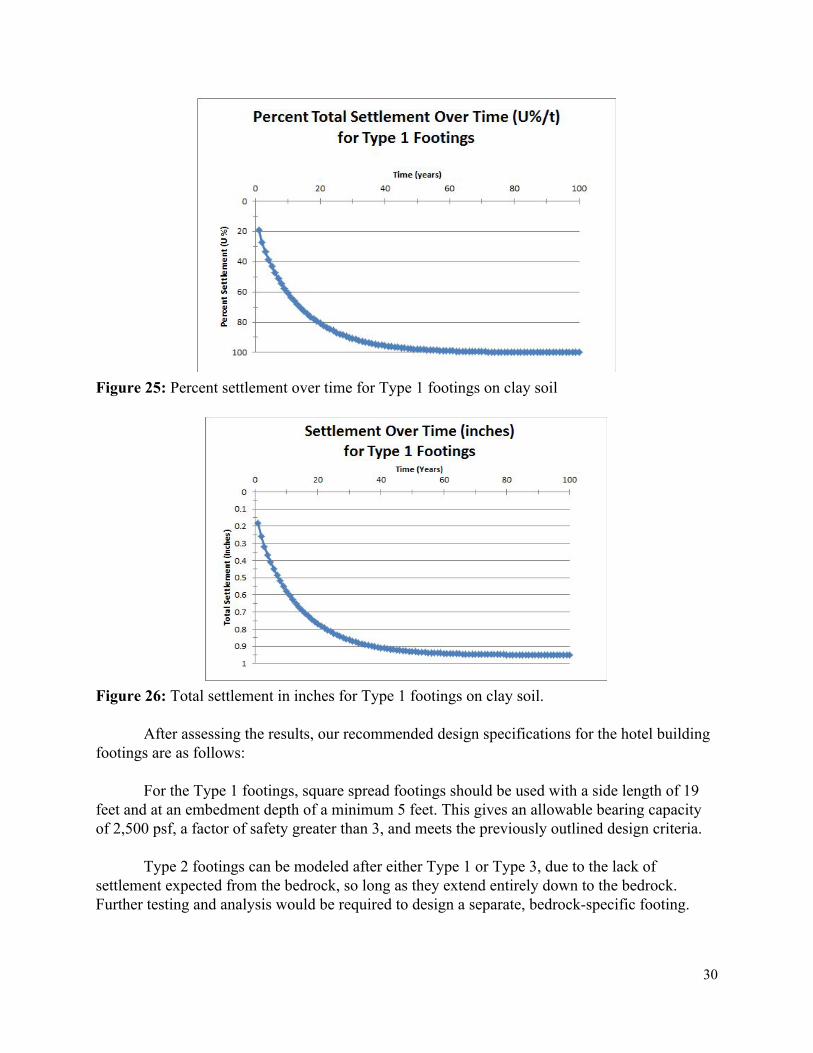
Figure 25: Percent settlement over time for Type 1 footings on clay soil
Figure 26: Total settlement in inches for Type 1 footings on clay soil.
After assessing the results, our recommended design specifications for the hotel building footings are as follows:
For the Type 1 footings, square spread footings should be used with a side length of 19 feet and at an embedment depth of a minimum 5 feet. This gives an allowable bearing capacity of 2,500 psf, a factor of safety greater than 3, and meets the previously outlined design criteria.
Type 2 footings can be modeled after either Type 1 or Type 3, due to the lack of settlement expected from the bedrock, so long as they extend entirely down to the bedrock. Further testing and analysis would be required to design a separate, bedrockspecific footing.
30
Type 3 footings should be square shallow spread footings, with 13 feet per side and embedded at a minimum of two feet below the surface, which will give a bearing capacity of 2,500 psf. This gives a factor of safety greater than 3 and meets the previously outlined design criteria. Slope Stability of Coastal Bluffs
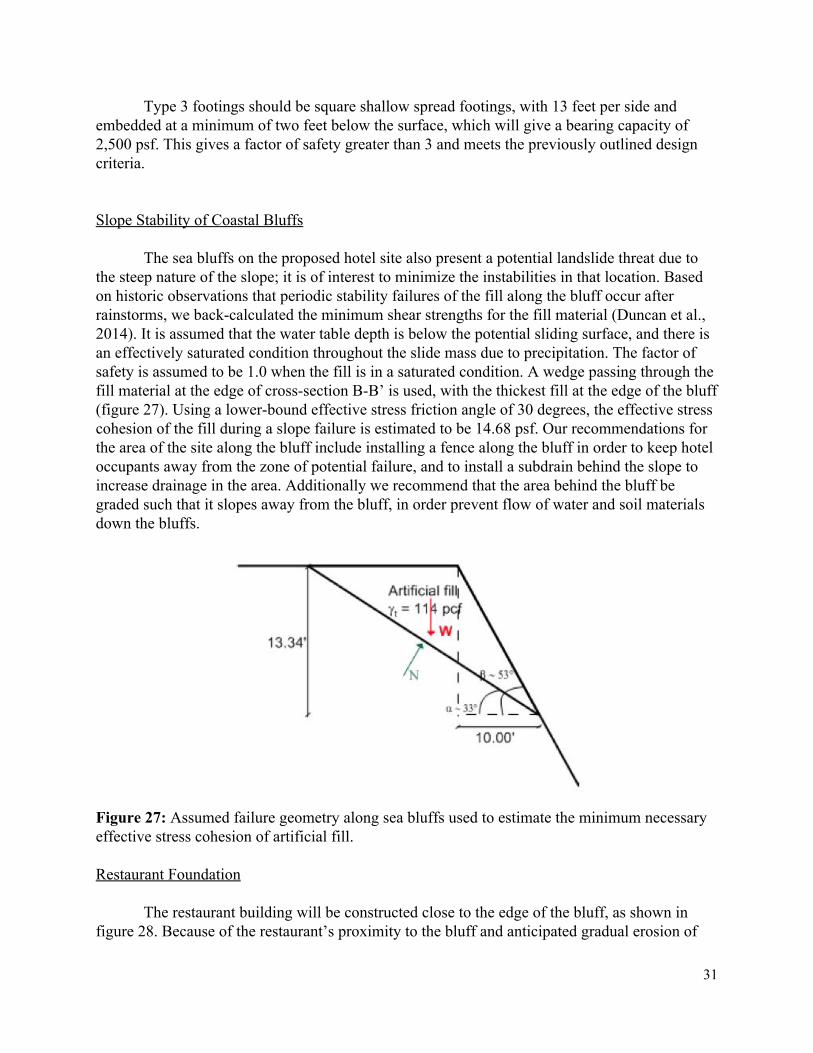
The sea bluffs on the proposed hotel site also present a potential landslide threat due to the steep nature of the slope; it is of interest to minimize the instabilities in that location. Based on historic observations that periodic stability failures of the fill along the bluff occur after rainstorms, we backcalculated the minimum shear strengths for the fill material (Duncan et al., 2014). It is assumed that the water table depth is below the potential sliding surface, and there is an effectively saturated condition throughout the slide mass due to precipitation. The factor of safety is assumed to be 1.0 when the fill is in a saturated condition. A wedge passing through the fill material at the edge of crosssection BB’ is used, with the thickest fill at the edge of the bluff (figure 27). Using a lowerbound effective stress friction angle of 30 degrees, the effective stress cohesion of the fill during a slope failure is estimated to be 14.68 psf. Our recommendations for the area of the site along the bluff include installing a fence along the bluff in order to keep hotel occupants away from the zone of potential failure, and to install a subdrain behind the slope to increase drainage in the area. Additionally we recommend that the area behind the bluff be graded such that it slopes away from the bluff, in order prevent flow of water and soil materials down the bluffs.
Figure 27: Assumed failure geometry along sea bluffs used to estimate the minimum necessary effective stress cohesion of artificial fill. Restaurant Foundation
The restaurant building will be constructed close to the edge of the bluff, as shown in figure 28. Because of the restaurant’s proximity to the bluff and anticipated gradual erosion of
31
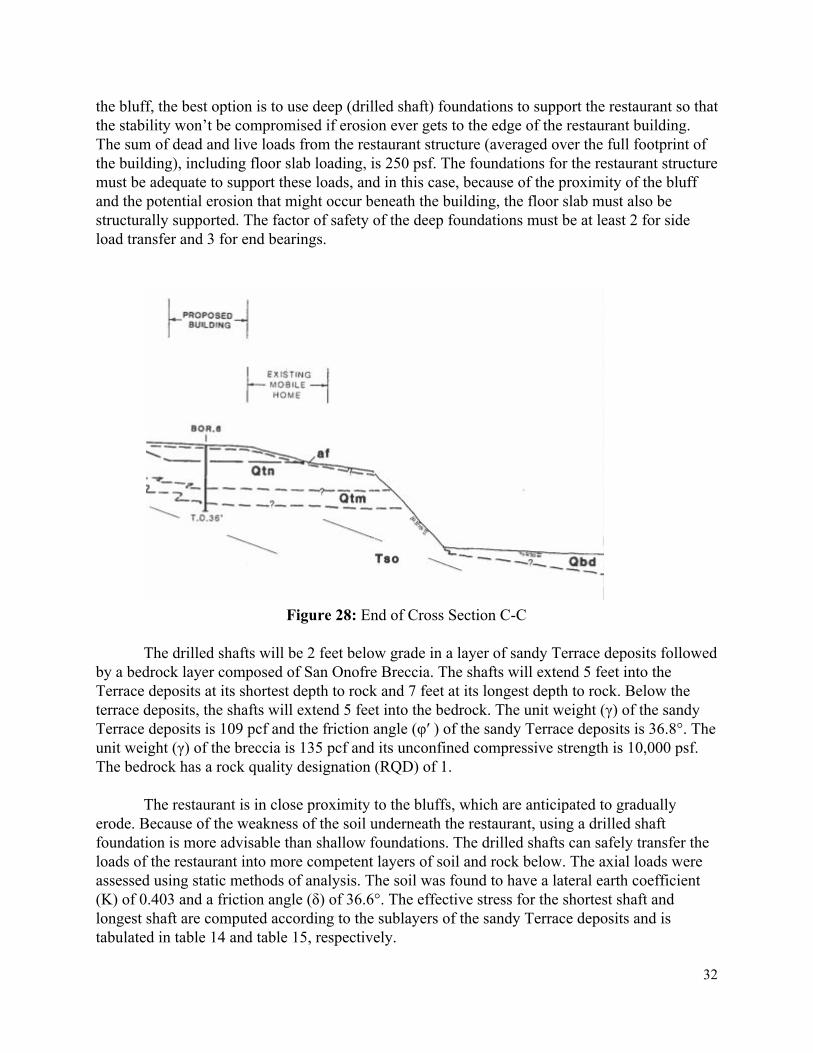
the bluff, the best option is to use deep (drilled shaft) foundations to support the restaurant so that the stability won’t be compromised if erosion ever gets to the edge of the restaurant building. The sum of dead and live loads from the restaurant structure (averaged over the full footprint of the building), including floor slab loading, is 250 psf. The foundations for the restaurant structure must be adequate to support these loads, and in this case, because of the proximity of the bluff and the potential erosion that might occur beneath the building, the floor slab must also be structurally supported. The factor of safety of the deep foundations must be at least 2 for side load transfer and 3 for end bearings.
Figure 28: End of Cross Section CC
The drilled shafts will be 2 feet below grade in a layer of sandy Terrace deposits followed
by a bedrock layer composed of San Onofre Breccia. The shafts will extend 5 feet into the Terrace deposits at its shortest depth to rock and 7 feet at its longest depth to rock. Below the terrace deposits, the shafts will extend 5 feet into the bedrock. The unit weight (γ) of the sandy Terrace deposits is 109 pcf and the friction angle (φ′ ) of the sandy Terrace deposits is 36.8°. The unit weight (γ) of the breccia is 135 pcf and its unconfined compressive strength is 10,000 psf. The bedrock has a rock quality designation (RQD) of 1.
The restaurant is in close proximity to the bluffs, which are anticipated to gradually
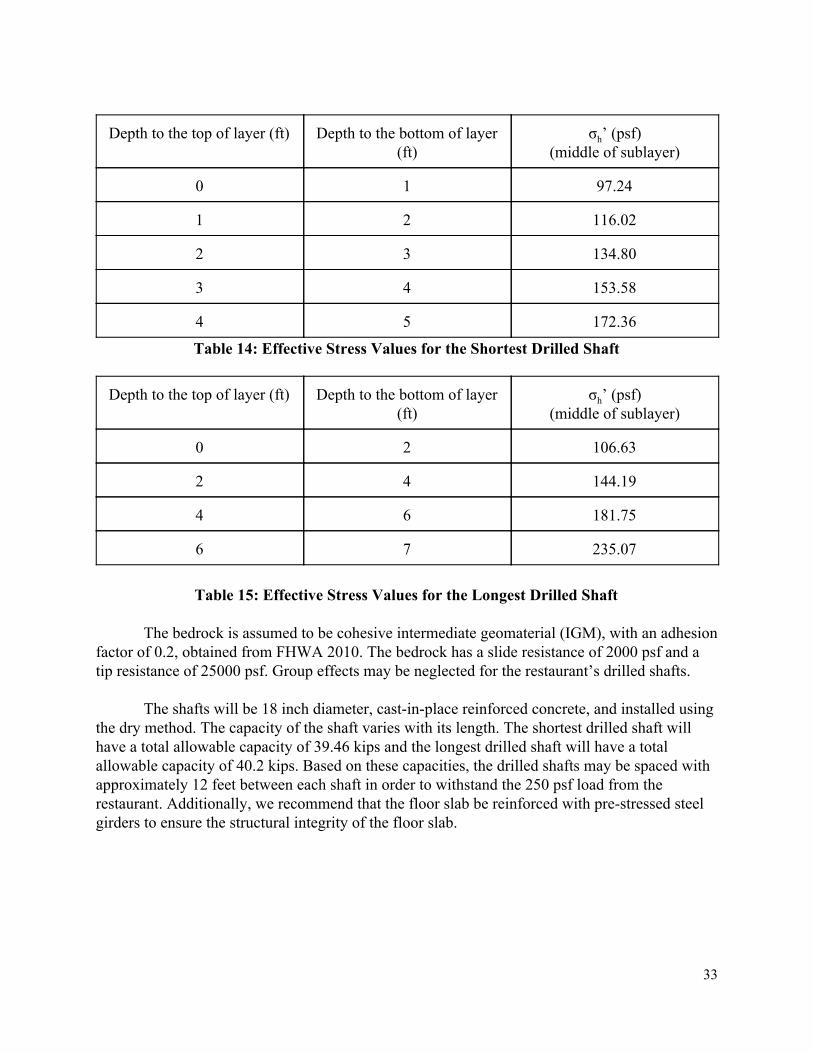
erode. Because of the weakness of the soil underneath the restaurant, using a drilled shaft foundation is more advisable than shallow foundations. The drilled shafts can safely transfer the loads of the restaurant into more competent layers of soil and rock below. The axial loads were assessed using static methods of analysis. The soil was found to have a lateral earth coefficient (K) of 0.403 and a friction angle (δ) of 36.6°. The effective stress for the shortest shaft and longest shaft are computed according to the sublayers of the sandy Terrace deposits and is tabulated in table 14 and table 15, respectively.
32
Depth to the top of layer (ft) Depth to the bottom of layer (ft)
σh’ (psf) (middle of sublayer)
0 1 97.24
1 2 116.02
2 3 134.80
3 4 153.58
4 5 172.36
Table 14: Effective Stress Values for the Shortest Drilled Shaft
Depth to the top of layer (ft) Depth to the bottom of layer (ft)
σh’ (psf) (middle of sublayer)
0 2 106.63
2 4 144.19
4 6 181.75
6 7 235.07
Table 15: Effective Stress Values for the Longest Drilled Shaft
The bedrock is assumed to be cohesive intermediate geomaterial (IGM), with an adhesion
factor of 0.2, obtained from FHWA 2010. The bedrock has a slide resistance of 2000 psf and a tip resistance of 25000 psf. Group effects may be neglected for the restaurant’s drilled shafts.
The shafts will be 18 inch diameter, castinplace reinforced concrete, and installed using the dry method. The capacity of the shaft varies with its length. The shortest drilled shaft will have a total allowable capacity of 39.46 kips and the longest drilled shaft will have a total allowable capacity of 40.2 kips. Based on these capacities, the drilled shafts may be spaced with approximately 12 feet between each shaft in order to withstand the 250 psf load from the restaurant. Additionally, we recommend that the floor slab be reinforced with prestressed steel girders to ensure the structural integrity of the floor slab.
33
Plan Review and Construction Observation
In ensuring the safety and soundness of the analysis presented, we recommend that a suitably qualified geotechnical engineer review the project plan and specifications before you proceed with construction in order to check conformance with the recommendations put forward in this report. Additionally, we recommend that a qualified geotechnical engineer have the opportunity to observe the construction and ensure that everything is completed in accordance with the recommendations in this report. Lastly, we recommend an indepth fiveyear evaluation of the site and structures to ensure it is performing as expected. We will not claim any liability if the recommendations set forth in this report are not implemented during the subsequent phases of this project.
If you have any questions concerning this matter, or we can be of any further service to you, please contact us. Yours sincerely,
Kamal Deep Sheokand Principal Engineer
Grace A. Parker Project Engineer
Adam C. Richardson Staff Engineer
Pranasha Shrestha Project Engineer
34
REFERENCES Burland, JB, and Burbridge, MC (1985). ‘‘Settlement of foundations on sand and gravel.’’
Proc. Inst. Civ. Eng., Struct. Build., 78(6), 1325– 1381. Coduto, DP, MR Yeung, and WA Kitch (2010). Geotechnical Engineering: Principles &
Practices, 2nd ed., Prentice Hall. Das, BM (2010). Principles of Foundation Engineering, 7th ed., Cengage Learning
Engineering. Duncan, JM, SG Wright, and TL Brandon (2014). Soil Strength and Slope Stability, 2nd ed.,
Wiley Technology and Engineering. Holtz, RD, WD Kovacs, and TC Sheahan (2011). An Introduction to Geotechnical Engineering,
2nd ed., Pearson Engineering Geology. “Retaining and Flood Walls.” (1994) Technical Engineering and Design Guides as adapted from
the US Army Corps of Engineers, No. 4, ASCE Press. ATTACHMENTS: appendix 1, appendix 2, appendix 3.
35

APPENDIX 1: Plot plan, geologic cross sections AA’, BB’, and CC’, mass grading plan. APPENDIX 2: Boring logs from prior investigations (Moore and Taber, 1980, and AGRA Earth and Environmental, Inc., 1999), and from our investigation. APPENDIX 3: Additional lab tests (sieve analysis, gradation and Atterberg limits, compaction CBR and swell tests (ASTM D 1883))
36