climate and crop modeling by gummadi sridhar,gizachew legesse,pauline chivenge, martin moyo,lieven...
TRANSCRIPT

Picture here
Climate and crop modeling

Overview of modelling work in ESA
Agricultural Systems
Climate CRAFT, Downscaling
Climate analysisClimate scenariosYield forecasting
CropAPSIMDSSAT
Ex-Ante AnalysisClimate change impacts
Yield gapRisk analysis
LandscapeSWAT
RUSLE2Watershed impactsBiomass estimation
EconomicToA-MD
IMPACT??Tradeoff analysis
SpatialGIS
Remote sensing
Change detectionCrop suitabilityTarget domains
Livestock???

The Team and Skills
• Gummadi Sridhar – DSSAT, EPIC, APSIM, SWAT, CRAFT etc.
• Gizachew Legesse – SWAT, GIS/Remote sensing
• Pauline Chivenge –SWAT, APSIM • Martin Moyo - APSIM• Lieven Claessens – ToA-MD

Data Resources
• Climate data for >200 stations– Ethiopia, Kenya, Uganda, Tanzania, Zimbabwe,
Sudan, Madagascar, Mozambique
• Soil data for more than 100 Profiles• Crop varieties calibrated - ?????• Farmer survey data• Flow data for catchments Ziway lake in
Ethiopia and Gwayi in Zimbabwe• GIS data layers for Ethiopia (mostly from
available global resources)

On going activities
• Assessing climate change impacts – AgMIP• Ex-ante analysis of agricultural systems - DS• Forecast based decision making - CCAFS• Yield forecasting – CCAFS• Assessing Impacts of watershed
management – WLE• Catchment modelling - WLE• National assessment of sorghum production
- DC

DSSAT vs APSIM
• Much of E. Africa impacts are small
• Impacts are more negative– Short duration varieties – High input management– Long rain season

Changes in SAT

Ex-Ante Analysis
Period of simulation 1982-2013Planting between 1 March and 30 AprilHarvested or killed by 1 Jun32 year average grain yield 897 kg/ha32 year average biomass yield 3748 kg/haAverage contribution of nitrogen @2% N in biomass 75 kg N/ha

Forecast based decision making

Potential for intercropping during kiremtseason
Period of simulation 1982-2013Pigeonpea medium durationMize with no fertilizerPrice of maize: 4.3/kgPP grain price: 7.3/kg

Watershed Impacts
Year Mean Soil Loss (kg/ha)
2001 7.22010 7.72015 4.8
Change 2001-2010
2010-2015
2001-2015
Increase 8.9 88 36Decrease 91.1 12 38
Unchanged 6

Calibration:• R2 = 0.71 (p=0.05)• 16% overestimation• Overestimates low flow;
underestimating high flowsValidation:• R2 = 0.64 (p=0.05)• 56% overall overestimation• Model overestimates all rainfall
flows, esp high rainfall flows
Catchment modelling
Remote Sensing
GIS
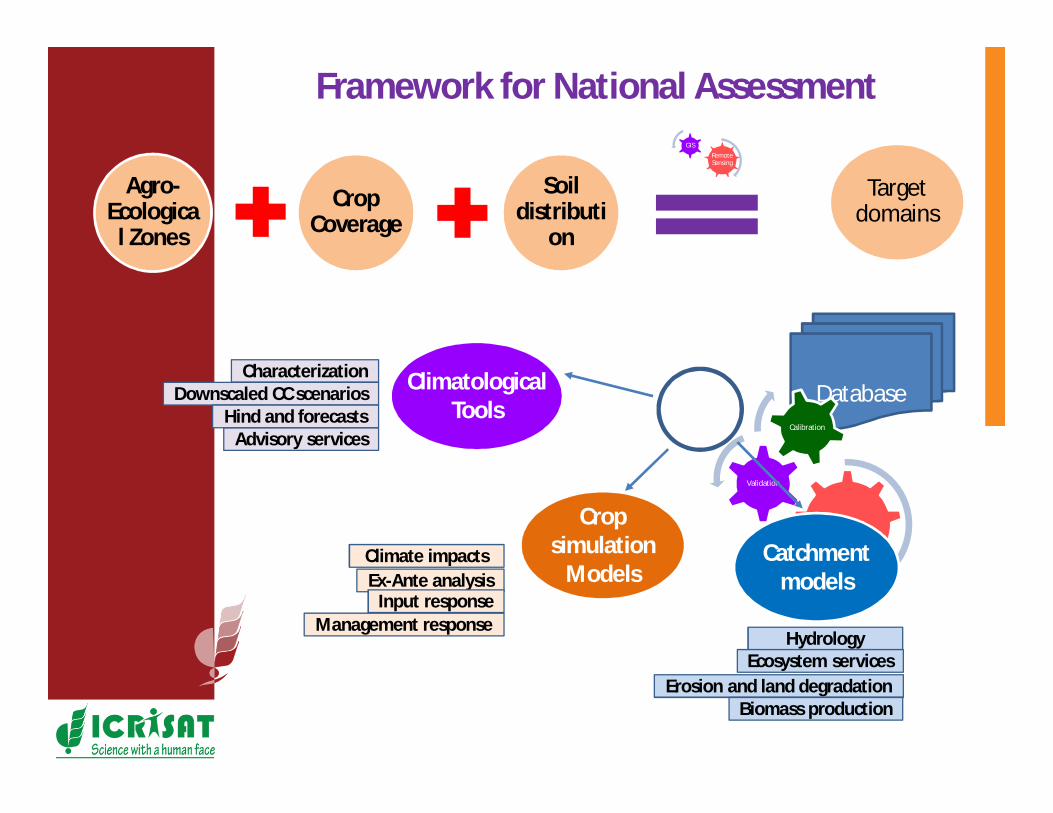
Framework for National Assessment
Target domains
Agro-Ecologica
l Zones
Crop Coverage
Soil distributi
on
Database
Simulation
Validation
Calibration
Climatological Tools
Crop simulation
ModelsCatchment
models
CharacterizationDownscaled CC scenarios
Hind and forecastsAdvisory services
Climate impactsEx-Ante analysis
Input responseManagement response
HydrologyEcosystem services
Erosion and land degradationBiomass production
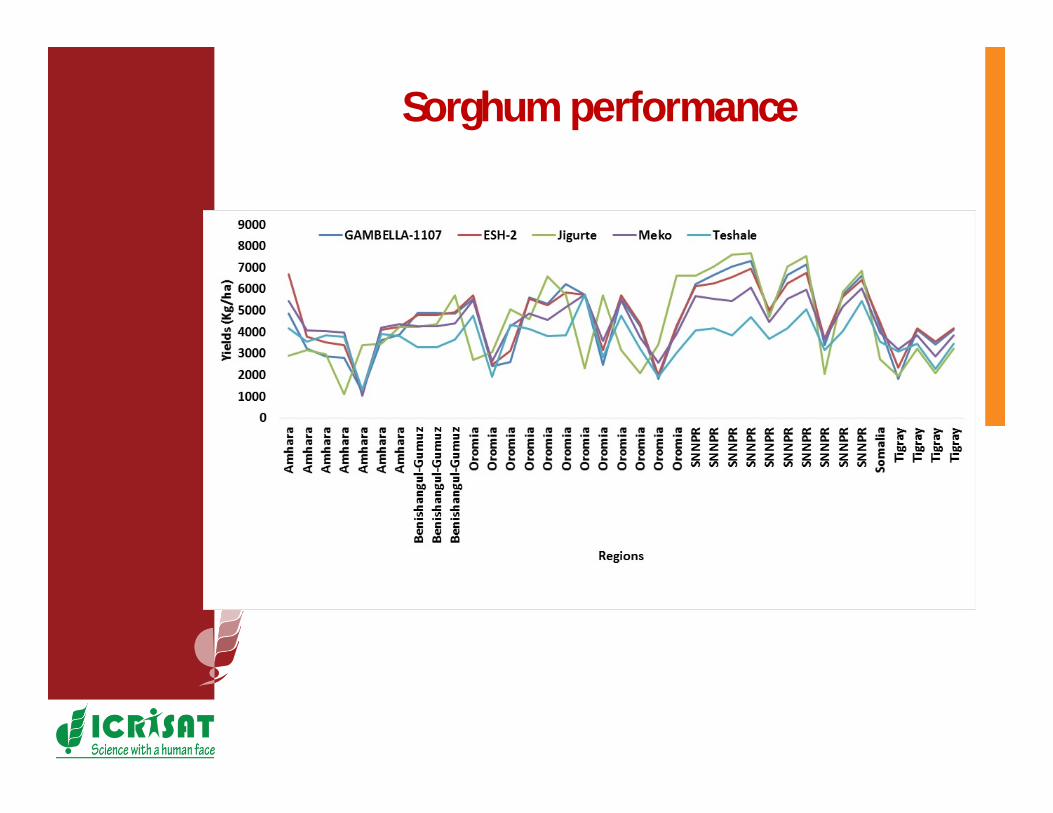
Sorghum performance

Crop Suitability
• Identify areas where the crop is well adapted
• Define the limits for high potential areas– Rainfall– Average temperature– Altitude
• Map the high and low potential areas

Yield Gap
Trade off Analysis

Moving forward
• Organize and strengthen database development
• Modelling frameworks (CRAFTS)– Targeting technologies– Ex-ante assessment/Yield gap– Forecasting and early warning
• More applications• More work on mandate crops and
calibration of relevant varieties• Whole system modelling• Strengthen livestock modelling

ICRISAT is a member of the CGIAR Consortium
Thank you!