
Picture here
Climate and crop modeling

Overview of modelling work in ESA
Agricultural Systems
Climate CRAFT, Downscaling
Climate analysisClimate scenariosYield forecasting
CropAPSIMDSSAT
Ex-Ante AnalysisClimate change impacts
Yield gapRisk analysis
LandscapeSWAT
RUSLE2Watershed impactsBiomass estimation
EconomicToA-MD
IMPACT??Tradeoff analysis
SpatialGIS
Remote sensing
Change detectionCrop suitabilityTarget domains
Livestock???

The Team and Skills
• Gummadi Sridhar – DSSAT, EPIC, APSIM, SWAT, CRAFT etc.
• Gizachew Legesse – SWAT, GIS/Remote sensing
• Pauline Chivenge –SWAT, APSIM • Martin Moyo - APSIM• Lieven Claessens – ToA-MD

Data Resources
• Climate data for >200 stations– Ethiopia, Kenya, Uganda, Tanzania, Zimbabwe,
Sudan, Madagascar, Mozambique
• Soil data for more than 100 Profiles• Crop varieties calibrated - ?????• Farmer survey data• Flow data for catchments Ziway lake in
Ethiopia and Gwayi in Zimbabwe• GIS data layers for Ethiopia (mostly from
available global resources)

On going activities
• Assessing climate change impacts – AgMIP• Ex-ante analysis of agricultural systems - DS• Forecast based decision making - CCAFS• Yield forecasting – CCAFS• Assessing Impacts of watershed
management – WLE• Catchment modelling - WLE• National assessment of sorghum production
- DC

DSSAT vs APSIM
• Much of E. Africa impacts are small
• Impacts are more negative– Short duration varieties – High input management– Long rain season

Changes in SAT

Ex-Ante Analysis
Period of simulation 1982-2013Planting between 1 March and 30 AprilHarvested or killed by 1 Jun32 year average grain yield 897 kg/ha32 year average biomass yield 3748 kg/haAverage contribution of nitrogen @2% N in biomass 75 kg N/ha

Forecast based decision making

Potential for intercropping during kiremtseason
Period of simulation 1982-2013Pigeonpea medium durationMize with no fertilizerPrice of maize: 4.3/kgPP grain price: 7.3/kg

Watershed Impacts
Year Mean Soil Loss (kg/ha)
2001 7.22010 7.72015 4.8
Change 2001-2010
2010-2015
2001-2015
Increase 8.9 88 36Decrease 91.1 12 38
Unchanged 6

Calibration:• R2 = 0.71 (p=0.05)• 16% overestimation• Overestimates low flow;
underestimating high flowsValidation:• R2 = 0.64 (p=0.05)• 56% overall overestimation• Model overestimates all rainfall
flows, esp high rainfall flows
Catchment modelling
Remote Sensing
GIS
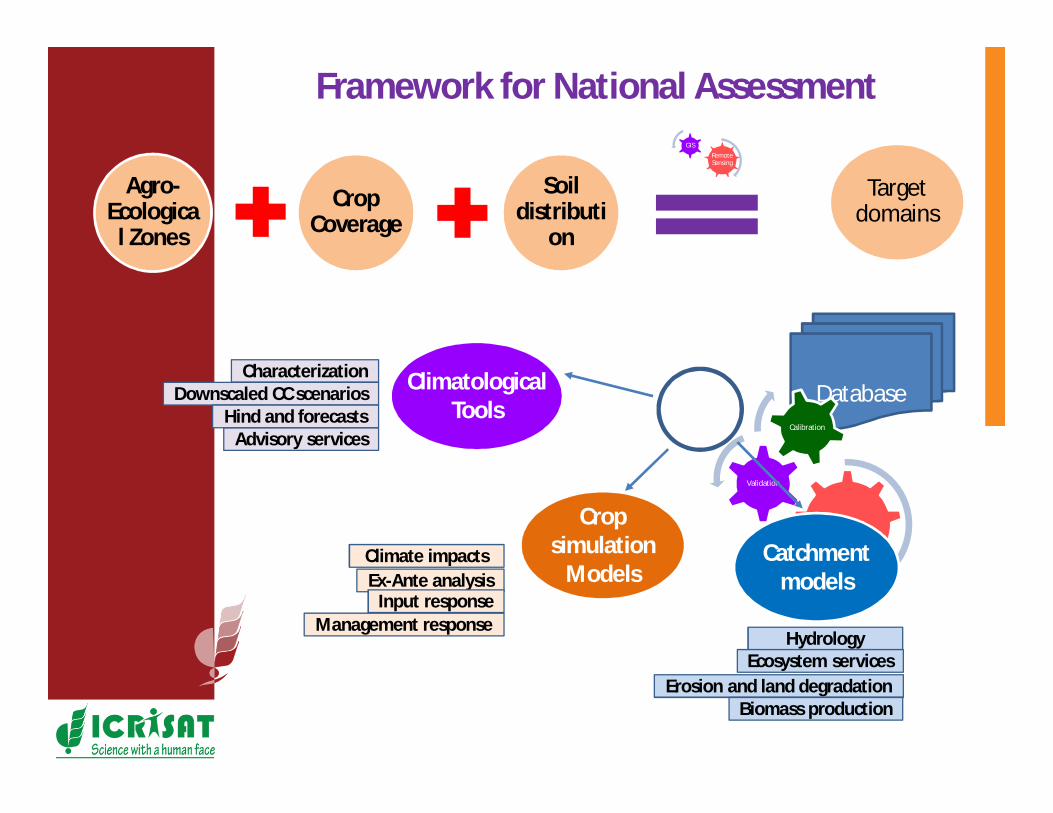
Framework for National Assessment
Target domains
Agro-Ecologica
l Zones
Crop Coverage
Soil distributi
on
Database
Simulation
Validation
Calibration
Climatological Tools
Crop simulation
ModelsCatchment
models
CharacterizationDownscaled CC scenarios
Hind and forecastsAdvisory services
Climate impactsEx-Ante analysis
Input responseManagement response
HydrologyEcosystem services
Erosion and land degradationBiomass production
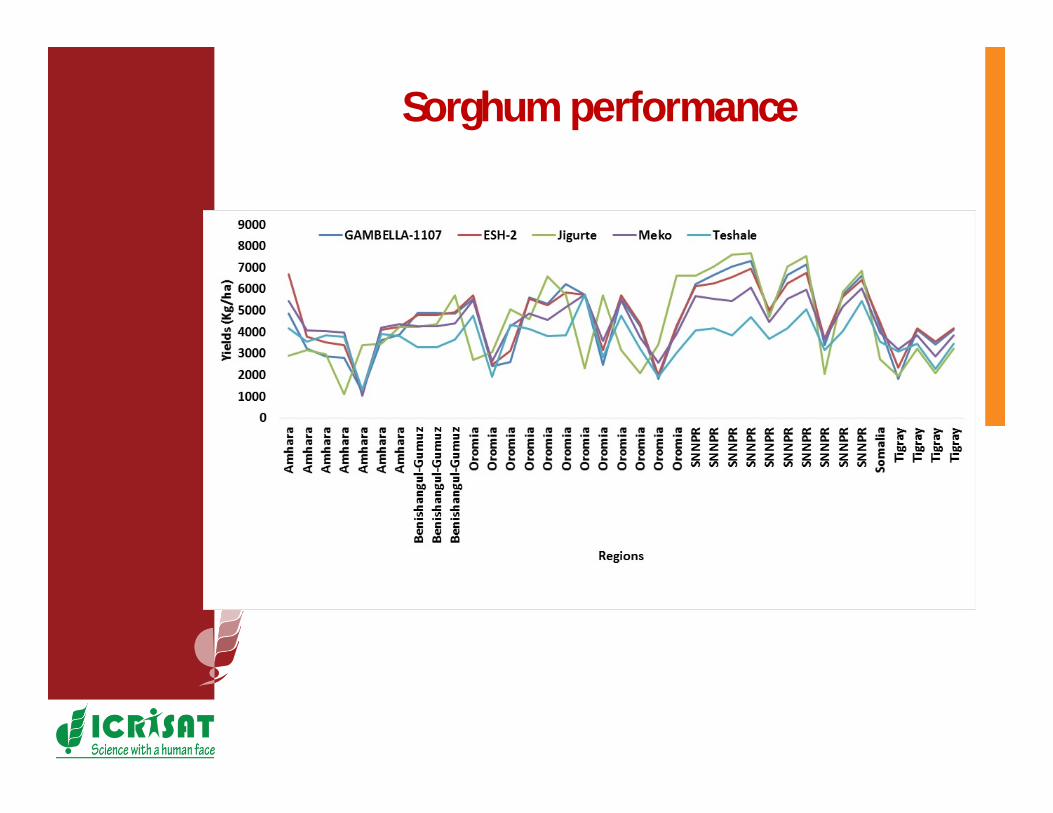
Sorghum performance

Crop Suitability
• Identify areas where the crop is well adapted
• Define the limits for high potential areas– Rainfall– Average temperature– Altitude
• Map the high and low potential areas

Yield Gap
Trade off Analysis

Moving forward
• Organize and strengthen database development
• Modelling frameworks (CRAFTS)– Targeting technologies– Ex-ante assessment/Yield gap– Forecasting and early warning
• More applications• More work on mandate crops and
calibration of relevant varieties• Whole system modelling• Strengthen livestock modelling

ICRISAT is a member of the CGIAR Consortium
Thank you!


