climate change impact assessment in taiwan -...
TRANSCRIPT

1
Climate Change Impact Assessment in Taiwan
Chung-Ming Liu1,2*, Shu-Hua Lin1,2 1Global Change Research Center, National Taiwan University, Taipei 2Dept. of Atmospheric Sciences, National Taiwan University, Taipei
*corresponding author email: [email protected]
Stephen H. Schneider3,4, Terry L. Root3
3Woods Institute for the Environment, Stanford University, Y2E2 Room 385A, Mail Code 4205, 473 Via Ortega, Stanford, CA 94305
4Department of Biology, Stanford University
Kuo-Tien Lee5, Hsueh-Jung Lu5 5Department of Environmental Biology and Fisheries Science, National Taiwan
Ocean University, Keelung
Pei-Fen Lee6, Chia-Ying Ko6
6Institute of Ecology and Evolutionary Biology, National Taiwan University
Chyi-Rong Chiou7 7School of Forestry and Resource Conservation, National Taiwan University
Hsing-Juh Lin8
8Department of Life Sciences, National Chung Hsing University, Taichung
Chang-feng Dai9 9Institute of Oceanography, National Taiwan University, Taipei
Kwang-Tsao Shao10
10Biodiversity Research Center, Academia Sinica, Nankang, Taipei
Wen-Cheng Huang11 11Department of Harbor and River Engineering, National Taiwan Ocean
University, Keelung
Huu-Sheng Lur12 12Department of Agronomy, National Taiwan University, Taipei
Yuan Shen13
13Department of Soil and Environmental Sciences, National Chung-Hsing University, Taichung.
Chwan-Chuen King14
14 Institute of Epidemiology, College of Public Health, National Taiwan University, Taipei, Taiwan.
2
ABSTRACT
Climatic warming is discernible in Taiwan, as evidenced by a warming rate
of 1.1-1.6°C/century, a clear trend of a continuous increase in days without rain
and a steady increase in the yearly contribution of heavy rainfall to the annual
precipitation total. Devastating disasters associated with record-breaking
rainfalls have put Taiwan in a vulnerable position and now Taiwan faces the
challenges of intensified typhoon intrusions and steady sea level rise. Ecological
systems can detect such changes and are expected to be widely affected by such
changes. Fisheries have been suffering because valuable cold-water fish stocks
have retreated northward. Therefore, fishers are adapting to profit, using species
that come from the southern warm oceans. Agricultural practices have also been
changing, but the harvest is disturbed by droughts and typhoon damages. The
future of water resource management will rely on a successful transition from
the current water-dependent industry to a less water-dependent society. In recent
years, adaptation strategies and action plans have been proposed, but Taiwan is
still far from strengthening its resilience to climate change and lowering its
vulnerability.
Keywords: climate change, impact assessment, vulnerability, Taiwan
[This paper was completed in August 2010 and was submitted to the Climatic
Change then. It is still under review.]

3
1. Introduction
Global warming over the past 100 years has been accompanied by changes
in physical and biological systems (IPCC, 2007). Mountain glaciers and ice caps
have been estimated to be melting at approximately 0.50 mm yr–1 (Lemke et al.,
2007), sea level has risen by an average rate of 1.8 mm yr–1 (Bindoff et al., 2007),
fish species with southern biogeographical affinities have moved northward
(Grebmeier et al., 2006), plants have flowered one to three days earlier per
decade in most of the northern hemisphere (Rosenzweig et al., 2007) and animal
and plant species have shifted toward the poles or to higher altitudes (Root et al.,
2002). To understand global changes, climate change impact assessments have
been conducted by parties of the UNFCCC (United Framework on Climate
Change Convention) under Article 4.1.
In Taiwan, research was initiated in the 1990s that focused on research
programs organized by projects under IGBP (International Geosphere-Biosphere
Programme), such as International Global Atmospheric Chemistry (IGAC), Past
Global Changes (PAGES) and the Earth System Science Partnership. In the
2000s, the funding shifted toward local impact studies on water resources,
climate, ecology and agriculture (Liu and Hwa et al., 2009).
Island-wide warming of 1-1.4oC/century was first reported by Hsu and Chen
(2002). They projected a temperature increase of 0.9-2.74oC with minor
precipitation changes if the level of global CO2 increased by 1.9 times the
1961-1990 level. Yu et al. (2002) attempted to generate future warming climates
from the past local temperature and precipitation trends in a studied catchment
region statistically. They concluded that there was an increase of available water
in the wet season and a decrease in the dry season in the future. Chang (2002)
adopted yield response regression models for 60 crops and a price-endogenous
mathematical model to estimate the potential impact of climate change on
Taiwan’s agricultural sector. She suggested that warming and climate

4
variations should have a significant but non-monotonic impact on crop yields.
Because various adaptive approaches were considered, society as a whole was
not expected to suffer from warming unless precipitation increased considerably.
Recently, Li et al. (2009) projected more extreme precipitation and surface
runoff with a persistent increase of evapotranspiration in both wet and dry
seasons during the 21st century due to a projected consistently higher
temperature. A weather generation model was applied to generate daily
temperature and precipitation estimates from AOGCM outputs under different
climate scenarios. A physically-based water balance model was used to simulate
the land hydrology. A decision support system for assessing water shortage and
allocation with climate change was thereafter proposed by Liu and Tung et al.
(2009). Additionally, a stochastic simulation approach was developed to assess
the future annual typhoon rainfall over watershed areas (Cheng et al., 2009). The
addition of heavier sediments into water reservoirs could be a serious threat to a
stable supply of fresh water in Taiwan.
Downscaling climate data from the AOGCM to Taiwan is apparently the
most challenging task in dealing with local climate impact studies (Liu et al.,
2010; Lin et al., 2010). Meanwhile, ecological changes due to climate warming
are difficult to determine because of limited monitoring data from the past.
In this study, we grouped findings from different disciplines to identify the
major physical and biological changes in Taiwan that are linked to the warming
over the last century. Additionally, we attempted to evaluate possible future
changes in the land and marine ecological systems and their impacts on water
resources, disaster management, agriculture and fisheries.
2. Climate change in Taiwan
2.1 1900-2009
From 1900 to 2009, temperatures recorded at eight lowland meteorology
stations in Taiwan (marked in Fig. 1) have been increasing at a rate of
5
approximately 1.1-1.6°C/century (Fig. 2a). This rate is higher than the global
rate of 0.74°C/century, but it is comparable to the warming conditions in other
Eastern Asia regions (Wang and Gaffen, 2001; Chung et al., 2004; Trenberth et
al., 2007). In the last 30 years, the warming rate has doubled and reached
0.23-0.40°C/decade. The possible influence of urbanization has been suggested
as the cause of this increase (Lin et al., 2005; Fujibe, 2009).
Additionally, the daily maximum temperature increased at half the speed of
the increase in the daily minimum temperature, even though both increased over
the last 30 years. Following Zhai and Pan (2003), we took the number of days
with daily maximum temperatures higher than or equal to 35°C in the major
metropolitan city, Taipei (marked in Fig. 1), as an indicator of hot days in
Taiwan. The decadal mean number of days was between 5-22 days/year, but
increased to 37 days/year in the 2000s.
Precipitation before 1960 seemed to be increasing gradually, but it
fluctuated with no significant trend after 1960 (Fig. 2b). The frequency of days
with relative humidity higher than 90% decreased after 1960, and the frequency
of mist, drizzle (precipitation less than 1 mm/hr) and light rains also showed a
decreasing trend. This trend is likely associated with a higher saturation level
with the increase of temperature (Dai, 2006). Days with precipitation less than
0.1 mm (i.e., rainless days) increased significantly to a rate of 1.7-11
days/decade at the lowland stations. The highest increase was observed over
southern Taiwan, where the decadal mean of rainless days used to be 145-229
days/year before 1960 and became 232-272 days/year in the 2000s.
With no significant change in annual rainfall and an increase of rainless
days, strong rainfalls are contributing more and more to the total annual
precipitation. Groisman et al. (2005) classified days with rainfall exceeding the
95th percentile of each year as the heavy rainfall events. Figure 2c illustrates the
yearly averaged contribution of those events to the annual precipitation. An

6
increasing trend occurred after 1954, although the trend is not yet statistically
meaningful. The average yearly contribution of heavy rainfall events was
measured to be approximately 28% and varied with respect to different regions.
Over northern Taiwan, the decadal mean contribution during the 2000s was
approximately 19%-23%, whereas it was 31%-34% over the southern area.
In the analysis above, only data from eight lowland stations were used, since
they kept the longest measurement record. Still, the general trend after 1950 is
similar with the inclusion of data from 20 additional climate stations.
It is worth noting that stations in the mountainous area have continued to
document record-breaking rainfalls. For instance, on July 31, 1996, a record of
1094.5 mm of rainfall was set by Typhoon Herb at Alishan (marked in Fig. 1).
However, this record was soon replaced by a new record of 1161.5 mm and then
1165.5 mm on August 8 and 9 of 2009 by Typhoon Morakot. Additionally,
typhoons, which are the main source of precipitation and natural disasters,
struck Taiwan at a decadal average rate of 2.2-3.5 times per year in the
1960s-1990s, but increased to 4.3 times per year in the 2000s. However, there
was actually a decreasing trend of typhoons formed in the northwest Pacific,
with a change from the decadal mean of 26-29 typhoons per year in the
1960s-1990s to 23 typhoons per year in the 2000s. Warm sea surface
temperature anomalies over the equatorial western and central Pacific appear to
have caused such changes (Tu et al., 2009).
Furthermore, in an effort to link extreme rainfall with temperature increases,
Liu and Fu et al. (2009) concluded that with each one-degree increase in
atmospheric temperature, the probability of strong rainfall (hourly rainfall
greater than 13 mm) increased by 110%. However, the probability of weak
rainfall (hourly rainfall less than 1 mm) declined by 70%.
2.2 Climate projection
Lin et al. (2010) outlined a statistical downscaling approach to
7
predict the climate change in Taiwan based on the outputs of 21 global
circulation models (GCMs) released from the IPCC data center. The procedure
adjusted the monthly mean AOGCM outputs near Taiwan with respect to the
NCEP reanalysis data (Kistler et al., 2001) in order to remove any systematic
bias in the model outputs. Additionally, a transfer function (i.e., a multiple
variant linear regression) was established to link NCEP reanalysis variants (i.e.,
predictors such as temperature, sea-level pressure and precipitation) with local
climatic observations (i.e., predictors such as temperature or precipitation).
Finally, the GCM outputs were adjusted and transferred to establish the future
projected temperature and precipitation data at each climate station for the 21st
century.
Figure 3 shows that under the SRES A1B scenario, the ensemble projection
of the average temperature will increase in 2080-2099 compared to the
1980-1999 values by approximately 2.3oC, while it will increase by 2.5oC and
1.5oC, under scenarios A2 and B1, respectively. Higher increases are expected
over the western lowland region, as compared to the mountainous and eastern
coastal regions. Additionally, a net rainfall increase of 5.2-5.6% is expected,
with major increases over the eastern and northern regions but decreases over
the central and southern areas (Fig. 3). Consistency between models of the
future projection is quite high.
The disadvantage of the monthly mean projection is the lack of data to
foretell changes in extreme values. In order to do so, a dynamic downscaling
dataset simulated by a regional climate model (RCM), NCEP-RSM (Lee et al.,
2005), after driving by the high-resolution AOGCM ECHAM4/OPYC3
(Roeckner et al., 1996) under SRES A2 and B2, was used. The NCEP-RSM was
selected because of its ability to closely match the circulation of the driver after
a careful comparison of the model performance against two other RCMs for the
East Asia region (Liu et al., 2010). However, due to limited resources,
8
there is no continuous projection for the entire 21st century by the NCEP-RSM
except for the two transient periods of the 2040s and 2090s.
We considered Taipei, Taichung, Hengchun and Taitung (marked in Fig. 1)
to represent the northern, central, southern and eastern regions of Taiwan,
respectively. Under the A2 scenario, NCEP-RSM forecasted the summer daily
maximum temperature in the 2090s to be an average of 3.2°C, 3.0°C, 2°C and
2°C higher than the 1990s for the northern, central, southern and eastern regions,
respectively. Clearly, extremely high temperatures will continue to set new
records. Additionally, the model predicted a relatively significant change for the
dry season (from September to April). It is expected that the number of rainless
days in the southern region will increase by 50 days or more in the 2090s
relative to the 1990s, representing a change of approximately 60%. Concerning
the projection of the number of days with heavy rainfall and changes in rainfall
intensity, there was no clear result due to limits of the model’s resolution,
although record-breaking rainfalls are highly likely.
3. Impact on the ecological system
3.1 Forest
Taiwan is a mountainous island, and the forest ecosystems are highly
diverse due to various topography and geology. Therefore, there are many forest
types along altitudinal gradients, such as subtropical rain forests, evergreen
broad-leaved forests, coniferous and broad-leaved mixed forests and sub-alpine
coniferous forests in high mountain regions. The dominant coniferous forest
types of high mountain regions in Taiwan are Abies kawakamii forests, Tsuga
chinensis var. formosana forests and Chamaecyparis forests (including
Chamaecyparis obtusa var. formosana and Chamaecyparis formosensis forests).
The distribution of forest vegetation is not homogeneous because the habitat
varies along altitudinal gradients. Hence, there are ecotones among forest
communities. The distribution of high mountain coniferous forests and
9
ecotones can be distinguished by using species distribution modeling, such as
the classification and regression tree (CART) (Yen et al., 2008). The species
data was extracted from the vegetation database of the National Vegetation
Diversity Inventory and Mapping Project (Chiou et al., 2009). The results show
that the threshold value of the occurring probability to define suitable habitats is
0.067 for Abies kawakamii forests (1021 km2), 0.146 for Tsuga chinensis var.
formosana forests (3028 km2) and 0.108 for Chamaecyparis forests (2872 km2).
The forest margin or ecotone is sensitive and affected by climate change
(Brubaker, 1986), especially in the treeline of the high mountain region. By
using the high resolution data downscaled from global climate models (Hijmans
et al., 2005), the decreasing rates of suitable habitats for Abies kawakamii forests,
A-T ecotone, Tsuga chinensis var. formosana forests, T-C ecotone and
Chamaecyparis forests in Taiwan under IPCC SRES-A2 and B2 scenarios with
respect to the recent inventory was projected (Sun, 2010). The climate
parameters used were the warmth index (WI), minimal temperature of the
coldest month (TMC), accumulated summer precipitation (PRS) and
accumulated winter precipitation (PRW).
The results in Fig. 4 demonstrate that by 2080, the habitat areas of both the
Abies kawakamii forests and the Tsuga chinensis var. formosana forests will
decrease by approximately 58%-90%, while the Chamaecyparis forest will
decrease by 20%. The suitable habitat of the A-T ecotone will no longer exist
under the A2 scenario. Moreover, the area of the T-C ecotone will decrease from
1581 km2 to 28-46 km2, with a rate of decrease larger than 97%. It can be
concluded that the rate of upward shift of Abies kawkamii is higher than that of
Tsuga chinensis var. formosana, while Tsuga chinensis var. formosana is higher
than Chamaecyparis forest. In addition, when the suitable habitat of a single
dominant species forest is compressed, the distribution of the ecotones will be
also compressed considerably.

10
3.2 Birds
Birds have long been used as environmental indicators of the state of the
world’s ecosystems, because they live in almost every type of environment, they
are at the top of the food chain, they represent a range of diets, and they can be
easily observed and monitored with the complete classification. Since individual
metabolism and food resources are affected by temperature, bird species are
highly sensitive to weather and are already responding to increased global
temperatures (Walther et al., 2002; Parmesan and Yohe, 2003; Root et al., 2003;
Crick, 2004).
In Taiwan, a change in the number of a total of 13 species of breeding birds
at locations above 3100 m a.s.l. in the Yushan National Park (marked in Fig. 1)
was been monitored in 1992, 2006 and 2009 (Ding, 1993; Tung et al., 2007; Lin
and Lee, 2009). These monitoring sites have limited outside access. Within
14-17 years, more species moved to areas >3600 m a.s.l. (Fig. 5), which matches
a decreasing trend of winter snow days from 40 days to 11 days. Of the 13
species monitored, three mid-elevation species, i.e. species with major
distribution ranges of 2000-3000 m in elevation, increased in population density
(number of individuals/ha). Five high-elevation species, i.e. occurring at >3000
m in elevation, decreased in density. An additional five high-elevation species
showed no clear variation trend.
Ko (2010) applied a maximum-entropy approach (i.e., Maxent) (Phillips et
al., 2006) of a species distribution model to simulate the spatial changes in bird
species under projected climates from different scenarios. She also concluded
that species richness would be apparent at higher elevation regions in Taiwan.
For instance, the endemic Taiwan Yuhina (Yuhina brunneiceps) would gradually
move toward higher elevations, but would experience a narrowing spatial
distribution under the A2 scenario with climate projection by the Climate
Modeling and Analysis (CCCma) Coupled Global Climate Model from

11
Canadian Centre (Flato et al., 2000) (Fig. 6). Similar patterns are also projected
for a summer visiting species, the Fairy Pitta (Pitta nympha), which is listed as
vulnerable by the IUCN (BirdLife International, 2001) with a total global
population of less than 10,000. The Fairy Pitta winters in Borneo, located north
of Australia, and visits Taiwan every late April and stays until late September.
The bird inhabits secondary lowland forests. The model projects that prior to
2050, the habitat of the Fairy Pitta will experience relatively few changes, but
between 2050 and 2100, they will have to move to the mid-elevations when their
overall suitable areas are reduced.
In general, the shift in bird species’ elevation ranges affects species
richness. Current species richness of breeding birds will decrease in low and
mid-elevation areas, while the richness in higher elevation regions (exceeding
2,500 m a.s.l.) is expected to increase in the future. Furthermore, the current
distributional hotspots will gradually disappear, and no particular hotspots will
be formed using the current standard value (species richness >72 in a grid of 1
km x 1 km).
In the coastal regions, many habitats for winter migrants are predicted to be
destroyed due to sea level rise. Many of the coastal wetlands will be affected,
especially along the southwest coast, at the Danshui River mouth in the north
and at the Lanyang River mouth in the east (marked in Fig. 1), where the
elevations are low. This will result in a significant reduction in habitats for the
winter migrant species and probably the reduction of the global number of
migrating birds. For instance, the black-faced spoonbill (Platalea minor) has a
world population of approximately 2000 in 2008 and 50% of the population
winters along the southwest coast of Taiwan and is expected to be affected
inevitably.
3.3 The Formosan landlocked salmon
The endemic Formosan landlocked salmon (Oncorhynchus masou

12
formosanus) is an Ice Age relic organism in Taiwan, and it is one of the most
precious natural and cultural assets. Although it belongs to the land-based cold
zone salmon and trout family, it survives in the tropical and subtropical regions
of Taiwan in habitats that are among the southernmost in the global distribution
of natural salmon populations (Oshima, 1955). It represents a major
biogeography discovery. The Formosan landlocked salmon has been listed as a
critically endangered species by the International Union for Conservation of
Nature (IUCN) (Kottelat, 1996). The Chichiawan Stream and its tributaries in
the Wuling Basin (marked in Fig. 1) are the last refuge of the landlocked salmon.
Data collected in the habitat region from 2005-2008 were carefully analyzed by
Lin et al. (2009). They concluded that the optimal reproductive water
temperature for salmon is approximately 12oC. If the summer temperature
exceeds 16oC in any stream segment, there will be no survival of salmon there.
Moreover, if typhoons occur in Taiwan in the fall or winter, the torrential rains
will wash away yearling and new autumn hatchling salmon, causing a huge
decline in the number of salmon in the following year. It is predicted that each
flooding is accompanied with a 30% decrease in the population.
In the future, if the water temperatures increase by 1oC, the habitat of the
Formosan landlocked salmon is likely to be reduced by 50%, in alliance with a
serious habitat fragmentation problem. If the water temperatures increase by 3oC,
then no salmon will survive (Lin et al., 2008). In addition, as typhoon-induced
record-breaking rainfalls continue to cause the stream velocity to exceed 100 cm
s-1, fewer salmon are expected to endure the harsh environment (Chung et al.,
2008).
3.4 Coral reefs
Taiwan’s adjacent coral reefs were subject to the influences of anomalous
high sea surface temperatures (SSTs) in the western Pacific in 1998 and 2007,
with varying degrees of coral bleaching and mortality. For example,
13
serious coral bleaching and mortality was reported in 1998 from southern Japan,
extending southward to the Penghu Islands and the southeastern waters of
Taiwan, during an El Niño - La Niña climate change event (Dai et al., 2002). In
addition, a cold-water intrusion around the Penghu Islands (marked in Fig. 1) in
February 2008 caused SSTs to drop below 16oC. This lasted for 20 days and led
to a large-scale coral bleaching and the death of 172 species of reef fishes and
invertebrates in the northern Penghu Islands (Hsieh et al., 2008).
Genetic programming based on data collected during 1986-2004 was
previously used to develop a niche model of the coral reef distribution
surrounding Taiwan (Tsai et al. 2004). With the projected increase of coastal
SST by the second version of the Canadian Centre for Climate Modeling and
Analysis (CCCma) Coupled Global Climate Model (CGCM2) (Flato and Hibler,
1992) under the SRES A2 scenario, the ecological model projected that by 2025
an increase in the SST by 0.5-0.75oC will not lead to an exceedance of the
maximum temperature tolerance for corals (30oC). Rather, many regions will
become even more suitable for coral growth (Fig. 7), so coral species may have
increased diversity and an expanded distribution range, while some waters may
increase their number of marine species. By 2055, SSTs are expected to increase
by 1.2-1.3oC and richness in the northern sea species may continue to expand.
However, sensitive coral species in southern and eastern waters will disappear,
and the number of species will show a significant drop throughout, resulting in
significant changes in species composition. By 2085, the SST surrounding
Taiwan is projected to increase by 2.0-2.5oC and cause severe reductions in the
number of coral species and even coral extinction, except for corals along the
north and northeast coast. In addition, the normal distribution of coral
communities will be greatly affected due to the changes in species composition,
which is likely to develop toward a stress-tolerant community. Marine species
surrounding Taiwan are likely to fluctuate with the changing coral reefs.
14
3.5 Marine ecosystems
Marine ecosystems are influenced by water temperature, water acidification,
rising sea levels, changes of ocean currents and patterns, climate anomalies, and
other factors (Fischlin, et al., 2007). For example, Typhoon Wyne shifted the
reef fish community structure around the southern tip of Taiwan in 1984 (Jan et
al., 2001), the El Nino–Southern Oscillation was associated with fluctuations in
the abundance of larval anchovy in coastal waters off southwestern Taiwan (Tsai
et al., 1997), and the intrusion of cold waters caused fish kills at the southern tip
of Taiwan in 1988 and 2008 (Shao et al., 2008). These factors and their related
interactions have a significant impact on marine productivity, biodiversity,
community distribution, and marine bio-physiological functions (e.g., growth,
metabolism, reproduction, and behavior).
Unfortunately, anthropogenic factors such as overfishing, habitat destruction,
pollution and thermal discharge, and alien species invasion have been causing
direct and obvious damages to marine biological diversity. For example,
overfishing and eutrophication were the causes of the decline of coral reef
ecosystems in areas around the southern tip of Taiwan (Liu and Shao et al., 2009;
Liu and Lin et al., 2009). Artificial concrete coastlines now cover 55% of the
total length of the coastline in Taiwan and have destroyed many natural habitats
of intertidal marine organisms. Meanwhile, despite gradual improvement in the
quality of coastal waters in the past decades, illegal discharges still exist which
cause eutrophication problems (Lin et al., 2007). Thermal discharges created
malformed juvenile or young thornfish and mullet at the nuclear power plant
near Keelung in northern Taiwan (Hung et al., 1998; Shao, 1995). Sciaenops
ocellatus, a marine fish introduced for cage-culture purposes, was found to be
invasive along the western coastal Taiwan (Liao et al., 2009).
Finally, after considering the factors above, we conclude that the damages to
the marine biological diversity surrounding Taiwan caused by human

15
influences are likely to be faster and more intense than those associated with
climate change.
4. Impacts on the society
4.1 Water resources
Taiwan has abundant rainfall of approximately 2510 mm per year, which is
three times the average global rainfall (Wurbs and James, 2002). However, the
average annual per capita of available rainfall is only 3000 cubic meters, or
43.5% of the global average. Therefore, Taiwan can be classified as a water
scarce country. Furthermore, with steep slopes and short river lengths, rainfall
rapidly discharges into the sea and its capture for use is quite difficult. In
addition, the wet and dry seasons are distinct, regional rainfall is uneven, water
storage is not easy, and redistribution of water resources is difficult. Only about
22% of the annual precipitation is available for use. Therefore, Taiwan can be
classified as in a moderate water stress country (Alcamo et al., 2003).
Unfortunately, due to historical manipulation by the government in
maintaining a fairly low water price, the average daily per capita water
consumption was 271 liters in 2009, 13% higher than the global average. The
consumption by the agriculture and industry sectors remained around 72% and
9% of the total water usage, respectively. However, the household water usage
grew at a rate of 3% per decade. Since 1960, serious shortage of rainfall
occurred in 1963, 1971, 1976, 1980, 1993, 1995, 2002 and 2003 (as indicated in
Fig. 2b). However, according the official record of fallow farmlands caused by
irrigation-stopped events of water shortage, drought events actually occurred in
1963, 1964, 1971, 1980, 1984, 1985, 1987, 1988, 1991, 1993, 1994, 1996, 1998,
2002, 2003, 2004, 2006 and 2009. Clearly, excessive waste of water frequently
put Taiwan in a demand-oriented drought.
The annual total water demands in the 1990s were 16.6 billion tons. The
Taiwan Water Resources Administration estimated that under a
16
projected decrease in the total population after the 2010s and a transition of the
current water dependent industry to a water-smart society, the net demands will
reach at most 18.5 billion tons in 2020, and then reach a constant level afterward.
To assess the balance between water supply and demand in the future, Lin et al.
(2010) defined a yearly water resource index, F, as:
FQ
D
Q
D
t
t
c
c×=×1 (1).
This equation can be rearranged to give:
)/()/(
tt
ccQD
QDF = (2),
where D stands for demand, Q stands for river run-off, sub-index c stands for the
past mean control period (1990s) and t stands for a certain future time. It is
assumed here that the condition between supply and demand, on average, was
balanced for the past period, with F = 1.0. Therefore, after 1990, if F is equal to
or larger than 1.0, it indicates that the water management condition is similar or
better than that in the past. However, when F is lower than 1.0, the condition can
be shown to be worsening. Five water resource index categories can be
distinguished: unbalanced toward a wet climate (F > 1.25), slightly unbalanced
toward a wet climate (1.25 F > 1.05), balanced (1.05 F 0.95), slightly ≧ ≧ ≧
unbalanced toward a dry climate (0.95 > F 0.75), and unbalanced toward a dry ≧
climate (0.75 > F).
Based on the projected temperature and precipitation for the 21st century
from a statistical downscaling of GCM outputs and a feed forward neural
network (FFNN) method to estimate regional river runoff (Lin et al., 2010), the
probability of F occurring in five different categories in each decade under the
SRES A2 scenario can be projected and plotted as shown in Fig. 8. The decadal
mean F index is also plotted. The mean value in the 1990s was 1.0, and this
17
was taken as the base condition for comparison. In general, the occurring
frequencies of the last two categories (i.e., slightly unbalanced toward a dry
climate (0.95 > F≧0.75) and unbalanced toward a dry climate (0.75 > F)) will
be around 78%-94% with a mean F value of 0.8, i.e., a slightly unbalanced
condition toward a dry climate. Clearly, to avoid more frequent droughts in the
future, efforts are needed to considerably cut down water demands.
4.2 Extreme rainfall disasters
Extreme rainfall disasters in Taiwan are mainly associated with typhoons.
Heavy rainfall after frequent earthquakes, i.e., at least two earthquakes of
magnitude 6 or higher on the Richter scale annually, shatters the stability of the
mountain slope, where the worst damages have occurred. Official records
indicate that there has been an annual average of three typhoon disasters before
1980, then 3.8 disasters between 1981-1999 and 5.2 disasters in the 2000s.
Economic losses are increasing (NFA, 2010). The worst economic loss was in
2009, with a total loss of $500 million USD.
Typhoon Morakot, a Category 2 storm that hit Taiwan in August of 2009
with an unprecedented and record-breaking rainfall far beyond the local coping
range over the southern Taiwan, altered the local vulnerability abruptly from a
status of neutrally safe to a complete breakdown. The net amount of rain during
the typhoon intrusion period was more than the yearly average of 2510 mm at
most stations, while the return period estimated at most mountain stations was
more than 2000 years (NDPPC, 2009).
Though flooding was expected in the lowlands, the devastating landslides in
the mountains were a surprise. Images shot by the Formosat-2 satellite before
and after the Morakot event suggests that 2.6-7.2% of the watershed area of
three major rivers was disrupted. This is similar to the effects of a major
earthquake. Following the typhoon, sediment yield in these rivers was 13-22
times the annual mean yield (Liu, 2009). Additionally, 2.5-8.3% of the
18
forest areas in these watershed areas were flushed down by landslides. Logs
weighing up to 718 kilotons floated quickly with the strong river current, along
with mudflow and rocks, and destroyed at least 51 bridges. Meanwhile, up to
5000 houses collapsed, and nearly 700 people were either dead or missing due to
overbanking of the water. Rivers were widened 1.75-6 times their original width.
One ill-fated village was destroyed by a combination of river overbanking,
landslide and the breakdown of an upslope debris dam. The most unexpected
consequence was due to the turbidity of water reaching downstream dams. The
turbidity registered up to 100,000 nephelometric turbidity units (NTU), thus
causing at least one million people to be without access to fresh water for nearly
two weeks (NDPPC, 2009).
Typhoons and earthquakes are common nightmares for people living along
the western Pacific Rim. The most vulnerable areas are constantly monitored
and evacuated. Disaster warning, prevention measures and relief procedures are
practiced constantly. Sea walls, river banks, flood discharge trenches, bridges
and even dams are required by law to be constructed and operated to endure
extreme rainfall events that happen every 200 years, but not 2000 years.
By organizing the data from 25 climate stations in Taiwan with at least 50
years of accumulated data each, we identified each station’s five highest daily
rainfalls and then calculated the frequency of these high rainfall days falling
within each decade. From this, we determined that the occurrences in the 2000s
were the highest (Fig. 9), followed by the 1960s and 1990s. This is in agreement
with the conclusion by the Intergovernmental Panel on Climate Change (Meehl
et al., 2007) that the frequencies of extreme events are very likely to increase in
the future. However, the serious damages associated with typhoon Morakot were
not caused only by the unprecedented rainfall, but also by the insufficient
weather forecast, unforeseen large-scale landslides and debris flows,
unsuccessful evacuation plans, and slow-responding relief measures.
19
In the future, adapting to unpredictable record-breaking rainfall events will
not only be a sustainability issue in Taiwan, but also a survival challenge.
Disaster management has to be adapted to face the unavoidable future.
4.3 Food security
Taiwan's food needs generally include the staple food category and the
livestock feed. Staple food consists primarily of rice and wheat. The rapid
economic growth since the late 1970s has significantly changed the dietary
pattern in Taiwan by decreasing the consumption of rice and increasing the
consumption of meat and wheat flour (Shen and Yao, 2009). In 2009, there was
an approximate annual need of 1.3 million tons of rice with a self-sufficiency
rate of more than 90%. Demand for wheat is about one million tons a year, but
all wheat products are imported. Sorghum has a self-sufficiency rate of about
6%, whereas 6 million tons of corn, soybean and barley are imported annually
with a self-sufficiency rate between 0 to 1.5%. In all, Taiwan's self-sufficiency
rate of total cereal consumption is only about 33%. Accordingly, the impact of
climate change on Taiwan's food security will not only affect the regional
production but will also affect the foreign grain production unless local
production can compensate any deficiencies in imports.
Rice yield and quality are sensitive to the increase of averaged and
nighttime temperatures on enhancing the plant respiration (Huang and Lur,
2000). Change in cultivated varieties for warmer climate is being considered.
Meanwhile, farmers are learning to adjust the planting operation to cope with
the warming climate. For instance, the central and southern farmers have
advanced the transplanting period of the first crop of rice, which is usually
between January and July, and have delayed planting and harvesting the
second-crop rice, which is usually between June to December (Lur et al., 2009).
Unfortunately, frequent autumn typhoons have caused losses of the
second crop and have consequently caused a rise in the price of rice. The
20
threat of typhoon disasters to grain production and food security cannot be
ignored.
In addition, irrigation water is likely to be limited, pests and diseases under
warmer climate are likely to increase their effects (Shen and Yao, 2009), and
arable land area could decrease because of sea level rise, land subsidence, soil
salinization, pollution, agricultural land use changes and other factors.
Meanwhile, international climate variability and the development of biomass
plants may affect the international wheat, corn and soybean prices, leading to an
increase in the use of flour products, feed and animal product prices, and even
adversely affecting average consumer prices. A number of developing trends
may affect the food security, and the vulnerability of Taiwan is not likely to be
lowered.
4.4 Fisheries
Taiwan's coastal fisheries have been affected by climate warming. The sea
surface temperature (SST) of the four square zones of waters surrounding
Taiwan (marked in Fig. 1) has increased dramatically after the mid-1990s. The
differences between 1996-2009 and 1982-1995 are about 0.29-0.54oC (Table 1).
The southeastern corner has experienced the lowest temperature increase.
Consequently, commercial fish stocks that normally migrate southward with the
China Coastal Current (marked in Fig. 1) to Taiwan’s waters for spawning and
wintering have been retreating northward, while warm-water species are being
carried northward by the Kuroshio Current and the South China Sea Current
(marked in Fig. 1) (Hsieh et al., 2009). In the last 30 years, catches of grey
mullet (Mugil cephalus L.) and black pomfret (Parastromateus niger) have
dropped by more than 90%. Table 2 summarizes the impacts that have occurred
on various marine fisheries (including shallow water culture). In contrast, the
proportion of the summer catch to the annual catch has been climbing from

21
about 5% in the early 1990s to nearly 40% in the 2000s, but with fish species of
much lesser economic value.
In addition, occurrences of El Niño/La Niña usually result in warmer/colder
surrounding seawater and hence unfavorable/favorable impacts on fisheries, as
summarized in Table 3. However, the exceptional intrusion of China’s coastal
waters in early 2008 (a La Niña year) resulted in a drop of 12oC in the surface
waters surrounding the Penghu Islands (marked in Fig. 1) and caused the death
of fish (172 species in 58 families) in cage culture fisheries as well as in the sea,
with a financial loss of more than $30 million USD.
Since fish movements are very sensitive to changes of SST, the projection of
the ECHAM4/OPYC3 model (Roeckner et al., 1996) under the SRES A2
scenario (Fig. 10) estimated that catches of the China Coastal Current species
near Taiwan, such as spotted mackerel (Scomber australasicus), hairtail
(Trichiurus lepturus), Grey mullet (Mugil cephalus L.) and black pomfret
(Parastromateus niger), will be reduced to very low levels or eventually to zero
by the end of this century (Lee, 2009). In the meantime, catches of Kuroshio
Current and South China Sea species, such as anchovy (Encrasicholina
punctifer), bullet tuna (Auxis rocheii), yellowfin tuna (Thunuus albacares) and
skipjack (Katsuwonus pelamis) will increase. For instance, bullet tuna will
increase by 4% by 2030 and 19% by 2100. However, the majority of these
species with increasing abundance have lower economic value in the present
fish market.
In the future, higher seawater acidification due to increasing atmospheric
carbon levels may affect the calcification of hard coral reefs and bony fishes
(Daw et al., 2007). In addition, the rise of sea level due to global warming may
influence aquaculture in the tidal zone. Furthermore, frequent typhoons and
exceptional cold-water intrusions can easily cause devastating effects on coastal
marine ecosystems. These impacts on fisheries should not be neglected.
22
6. Summary and conclusions
Warming in Taiwan has been occurring at a rate of approximately
1.1-1.6°C/century and 0.23-0.40°C/decade over the last 30 years. Although there
has been no significant long-term trend of rainfall increase or decrease detected,
rainless days have increased significantly at a rate of 1.7-11 days/decade. The
highest increase of rainless days occurred in southern Taiwan, where the decadal
mean of rainless days was 145-229 days/year before 1960, but became 232-272
days/year in the 2000s. Additionally, the yearly contribution of heavy rainfalls to
the annual precipitation increased after 1954 by a rate 0.4%/decade. Over
northern Taiwan, the decadal mean contribution in the 2000s was about
19%-23%, whereas it was 31%-34% over the southern area. The most
note-worthy phenomenon is a continuous occurrence of record-breaking rainfall
events (Fig. 9), which usually accompany typhoon intrusions and serious
disasters. Economic losses due to weather disasters are becoming greater. The
worst loss so far was in 2009, with a total loss of $500 million USD (NFA,
2010).
At the highest meterorological station, Yushan (marked in Fig. 1), the 1st
day of snow was 143-144 days after July 1st in the 1970s and 1980s, but was
delayed by approximately 20-22 days in the 1990s and 2000s and by
approximately 55 days in an extremely warm year (Fig. 11). The yearly total
length of snow days was on average about 148-160 days in the 1970s and 1980s,
but was shortened to 139 days in the 1990s, and then 116 days in the 2000s. The
decadal mean of yearly accumulated snow changed slightly, but the variaiton
was largest in the 2000s. The decadal change of the mean daily snowfall (Fig.
11d) clearly illustrates the phenomenon that although there were shorter snow
days in 2000s, a larger daily snowfall happened when the yearly accumulated
snow was the largest. Clearly, warming has caused the delay of snowfall and the
shortening of snow days, but record-breaking daily snow could still
23
happen in the 2000s, similar to the occurrence of record-breaking rainfall at
mid- and lower-elevation stations.
The effect of warming on the mountain ecological system was revealed after
monitoring 13 species of breeding birds in the Yushan National Park in 1992,
2006 and 2009. Within this period, more species moved to >3600 m areas, with
three mid-elevation species expanding in population density, five high-elevation
species decreasing and five other species showing no clear trend. These findings
suggest that the richness of bird species will be apparent at higher elevation
regions in Taiwan in the future, but with a lower number of hotspots. This is also
supported by the projection of decreased suitable habitat of dominant species
forests and ecotones in the high-mountain ranges.
Furthermore, the vulnerability of land-based freshwater ecosystems to
global warming and frequent extreme rainfall events can be identified after a
careful study of the endemic Formosan landlocked salmon. For every 1oC
increase of the water temperature, the habitat is of salmon is likely to be reduced
by 50%. If the water temperature increases by 3oC, then no salmon will survive.
Additionally, with each typhoon-induced flooding in the fall or winter, a
decrease of the population by 30% is expected, although yearling salmons are
currently raised and released under a conservation plan.
A dramatic increase or decrease of seawater temperature caused by climate
variation has already resulted in coral breaching and dramatic fish kills.
Additionally, warmer waters associated with the advancement of the Kuroshio
Current and the retreat of the China Coast Current since the mid-1990s has
significantly affected the southward migration of valuable fish stocks and has
increased South China Sea fish species. Therefore, the projection under a global
warming trend suggests a significant reduction in the number of coral species
and marine species in the coral community and a substantial change of fishery
with more stocks of fishes from southern waters with less economic

24
value. The other devastating factor not to be ignored is the human influence on
the marine biological diversity surrounding Taiwan, which is projected to be
more efficient at causing damage than climatic change.
The stability of an isolated island society is very sensitive to a stable supply
of water. With an occasionally shortage of rainfall and an excessive waste of
water, Taiwan has been frequently in a demand-oriented drought for the past 20
years. Under a projected decrease in the total population after the 2010s, this
study suggests that frequent occurrences of conditions of a dry climate are
expected in the 21st century, unless a transition of the current water-dependent
industry to a less water-dependent society occurred.
With the expectation of warmer climate in the future, changes in managing
the water consumption and the development of new rice breeds to endure with
higher plant transpiration rates are currently being developed (Shen and Yao,
2009). In the meantime, farmers are advancing the transplanting period of the
first crop of rice and delaying the planting and harvesting of the second crop of
rice to fit with the earlier arrival of spring and the later retreat of autumn in the
recent decade. Unfortunately, frequent autumn typhoons have caused huge
losses of the second crop and have raised the price of rice. Furthermore, with a
self-sufficiency rate of only 33% of the total cereal consumption, Taiwan’s food
security is quite vulnerable to the turbulence of the global food market. Chang
(2002) and Shen and Yao (2009) proposed various adaptive approaches. This
study stressed that there are a number of developing trends affecting the food
security in Taiwan and the vulnerability is not likely to be lowered.
In recent years, epidemics of dengue hemorrhagic fever (DHF), mainly from
dengue-endemic areas, have triggered frequent alarms in society (Chen et al.,
1996; Shang et al., 2010). In southern Taiwan, Aedes aegypti mosquitoes (the
indoor vector) are abundant and epidemics of dengue involving clinically severe
cases of DHF occur nearly every autumn (Pai and Lu, 2009). The
25
possibility of increasing imported cases and the northward extension of the
distribution of Aedes aegypti due to global warming in the future increase the
risk to the public exposing under the threat of dengue/DHF. Closer monitoring
through mosquito and environmental surveillance are exercised intensively by
the government.
Finally, the devastating disaster associated with Typhoon Morakot in
August 2009 triggered a serious debate among local policy makers on how to
strengthen the resilience to tackle the challenge of an increasing frequency of
record-breaking rainfalls. To persuade people to move out of most vulnerable
areas, such as subsiding coasts, landslide-prone mountain slopes, and frequently
flooding riverbanks, is a reasonable but difficult task. Long-term investments
and historical family bindings are often the reason behind the reluctance to move.
Even if the government intervenes, the problem of finding safer places in this
small island is not a trivial issue. Therefore, establishing a quick response
system to warn and rescue people in a weather disaster event is currently on the
highest priority. On May 21, 2010, a military exercise has assumed that a super
typhoon X poses as the major rival challenging the national security and
simulated response from the military to local governments on a large-scale
retreat and rescuing. In the meantime, the national emergency response standard
operating procedure has been reviewed and modified.
The expected warming in this current century will definitely damage the
habitats of birds, land-locked fishes and coastal corals and affect the migration
of valuable fishes in the surrounding waters. Damage to the fishery industry is
clearly happening already, while the stability of the food and water supply are
also in question. However, the most troubling challenge is the expected
occurrence of more frequent record-breaking rainfall events. Such events are
projected but are not foreseeable. Although they are usually associated with
typhoon intrusions, the forecasting of these events has never been easy and

26
the response has hardly been satisfactory in the past. Currently, adaptation
strategies and action plans of comprehensive extent are proposed (Chen et al.,
2010), but Taiwan is still far from strengthening its resilience and lowering its
vulnerability.

27
Acknowledgements
Research supports from the National Science Council of the Republic of
China on all related projects were crucial to the completion of this paper. This
study was completed while the corresponding author was on leave to Stanford
University under grant NSC 99-2918-I-002-016. The first author is deeply in
debt to the deceased Prof. Stephen Schneider for granting the visit and providing
insights and strength for the completion of this difficult task.

28
References
Alcamo, J., P. Döll, T. Henrichs, F. Kaspar, B. Lehner, T. Rösch, and S. Siebert,
2003: Global estimates of water withdrawals and availability under current
and future “business-as-usual” conditions”. Hydrological Sciences Journal ,
48, 339-348.
Bindoff, N.L., J. Willebrand, V. Artale, A, Cazenave, J. Gregory, S. Gulev, K.
Hanawa, C. Le Quere, S. Levitus, Y. Nojiri, C.K. Shum, L.D. Talley and A.
Unnikrishnan, 2007: Observations: Oceanic Climate Change and Sea Level.
In: Climate Change 2007: The Physical Science Basis. Contribution of
Working Group I to the Fourth Assessment Report of the
Intergovernmental Panel on Climate Change [Solomon, S., D. Qin, M.
Manning, Z. Chen, M. Marquis, K.B. Averyt, M. Tignor and H.L. Miller
(eds.)]. Cambridge University Press, Cambridge, United Kingdom and
New York, NY, USA.
BirdLife International, 2001: Threatened birds of Asia: the BirdLife
International Red Data Book. Cambridge, UK: BirdLife International.
Brubaker, L. B., 1986: Responses of tree populations to climatic change.
Vegetatio, 67, 119–130.
Chang, C.-C., 2002: The potential impact of climate change on Taiwan’s
agriculture. Agricultural Economics, 27, 51–64.
Chang, Y., K. T. Lee, M. A. Lee, K.W. Lan, 2009: Satellite Observation on the
Exceptional Intrusion of Cold Water in the Taiwan Strait. Terr. Atmos.
Ocean. Sci., 20(4), 661-669.
Chen, C.-F., M.-L. Liou, C.-M. Liu, C.-I Hua, L.-Y. Su and Y.-C. Lee, 2010:
Key Elements on Designing a Climate Change Adaptation Framework.
(submitted to Climatic Change)
Chen, K. Y., 2005: Population Fluctuation of the Spotted Mackerel (Scomber
australasicus) in the Northeastern Waters off Taiwan. Ms. Thesis,
29
National Taiwan Ocean University. 54pp. (in Chinese)
Chen, W. J., S. L. Chen, L. J. Chien, C. C. Chen, C. C. King, M. R. Harn, K. P.
Hwang and J. H. Fang, 1996: Silent transmission of the dengue virus in
southern Taiwan. Am. J. Trop. Med. Hyg., 55,12-6.
Cheng, K.-S., J.-C. Hou, Y.-C. Wu and J.-J. Liou, 2009: Assessing the impact of
climate change on annual typhoon rainfall—a stochastic simulation
approach. Paddy Water Environ., 7, 333–340.
Chiou, C.-R., Hsieh, C.-F., Wang, J.-C., Chen, M.-Y., Liu, H.-Y., Yeh, C.-L.,
Yang, S.-Z., Chen, T.-Y., Hsia, Y.-J. and Song, G.-Z. M., 2009: The first
national vegetation inventory in Taiwan. Taiwan Journal of Forestry
Science, 24, 295-302. (in Chinese)
Chiu, H. Y., 2006: A study on the fluctuation in catch of Japanese eel (Anguilla
japonica) elvers immigrating into the waters off Kungliao. Ms. Thesis,
National Taiwan Ocean University. 59pp. (in Chinese)
Chung, L.-C., H.-J. Lin, S.-P. Yo, C.-S. Tzeng, C.-H. Yeh and C. H. Yang, 2008:
Relationship between the Formosan landlocked salmon Oncorhynchus
masou formosanus population and the physical substrate of its habitat after
partial dam removal from Kaoshan Stream, Taiwan. Zoological Studies, 47,
25-36.
Chung, Y.-S., M.-B. Yoon and H.-S. Kim, 2004: On climate variations and
changes observed in South Korea. Climatic Change 66: 151–161.
Crick, H. Q. P., 2004: The impact of climate change on birds. Ibis, 146, 48-56.
Daw, T., W. N. Adger, K. Brown and M. C. Badjeck, 2009: Climate change and
capture fisheries: potential impacts, adaptation and mitigation. In Cochrane,
K., C. De Young, D. Solo, and T. Bahri (eds). Climate change implications
for fisheries and aquaculture: overview of current scientific knowledge.
FAO Fisheries and Aquaculture Technical Paper, No. 530, Rime, FAO,
pp.107-150.
30
Dai, A., 2006: Recent climatology, variability, and trends in global surface
humidity. J. Climate, 19, 3589-3606.
Dai, C.F., G. Chen, M. Inaba, K. Iwao, F. Iwase, Y. Kakuma, K. Kajiwara, T.
Kimura, K. Nomura, K. Oki, K. Sakai, T. Shibuno, H. Yamano, M. Yoshida,
2002: Status of coral reefs in East Asia: China, Japan, Korea and Taiwan. In:
Wilkinson C (ed) Status of Coral Reefs of the World: 2002, p. 153-162,
Australian Institute of Marine Science, Townsville, Queensland, Australia.
Ding, T. S., 1993: Avian community ecology of mature forest in Mt. Yushan. M.S.
Thesis, National Taiwan University, Taipei, 80pp. (In Chinese, English
abstract)
Fischlin, A., G.F. Midgley, J.T. Price, R. Leemans, B. Gopal, C. Turley, M.D.A.
Rounsevell, O.P. Dube, J. Tarazona, A.A. Velichko, 2007: Ecosystems,
their properties, goods, and services. Climate Change 2007: Impacts,
Adaptation and Vulnerability. Contribution of Working Group II to the
Fourth Assessment Report of the Intergovernmental Panel on Climate
Change, M.L. Parry, O.F. Canziani, J.P. Palutikof, P.J. van der Linden and
C.E. Hanson, Eds., Cambridge University Press, Cambridge, 211-272.
Flato, G. M., Boer, G. J., Lee, W. G., McFarlane, N. A., Ramsden, D., Reader, M.
C., and Weaver, A. J. 2000: The Canadian Centre for Climate Modelling
and Analysis Global Coupled Model and its Climate. Climate Dynamics, 16,
451-467.
Flato, G. M. and Hibler, W. D. III, 1992: Modelling Pack Ice as a Cavitating
Fluid. J. Phys. Oceanogr., 22, 626-651.
Fujibe, F., 2009: Detection of urban warming in recent temperature trends in
Japan. Int. J. Climatol., 29, 1811–1822.
Grebmeier, J.M., J.E. Overland, S.E. Moore, E.V. Farley, E.C. Carmack, L.W.
Cooper, K.E. Frey, J.H. Helle, F.A.McLaughlin and S.L.McNutt, 2006: A
major ecosystem shift in the northern Bering Sea. Science, 311,
31
1461-1464.
Groisman, P. Y., R. W. Knight, D. R. Easterling, T. R. Karl, G. C. Hegerl, V. N.
Razuvaev, 2005: Trends in intense precipitation in the climate record. J.
Climate, 18, 1326-1350.
Hijmans, R.J., S.E. Cameron, J.L. Parra, P.G. Jones and A. Jarvis, 2005: Very
high resolution interpolated climate surfaces for global land areas.
International Journal of Climatology, 25, 1965-1978.
Hsieh, C. H., C. S. Chen, T. S. Chiu, K. T. Lee, F. J. Shieh, J. Y. Pan and M. A.
Lee, 2009: Time series analyses reveal transient relationships between
abundance of larval anchovy and environmental variables in the coastal
waters southwest of Taiwan. Fisheries Oceanography, 18(2), 102-117.
Hsieh, H. J., Y. L. Hsieh, M. S. Jeng, W. S. Tsai, W. C. Su, and C. A. Chen, 2008:
Tropical fishes killed by the cold. Coral Reefs, 27.599.
Hsu, H-H, and C-T Chen, 2002: Observed and projected climate change in
Taiwan. Meteorology and Atmospheric Physics, 79, 87-104.
Huang, J. J. and H. S. Lur, 2000: Influences of temperature during grain filling
stages on grain quality in rice (Oryza sativa L.) 1. Effects of temperature on
yield components, milling quality, and grain physico-chemical properties. J.
Agric. Assoc. China, 1, 370-389.
Hung, T. C., C. C. Huang and K. T. Shao., 1998: Ecological survey of coastal
water adjacent to nuclear power plants in Taiwan. Chemistry and Ecology,
15: 129-142.
IPCC, 2007: Climate Change 2007: Impacts, Adaptation and Vulnerability.
Contribution of Working Group II to the Fourth Assessment Report of the
Intergovernmental Panel on Climate Change, M.L. Parry, O.F. Canziani,
J.P. Palutikof, P.J. van der Linden and C.E. Hanson, Eds., Cambridge
University Press, Cambridge, UK.
Jan, R. Q, J. P. Chen, C. Y. Lin and K. T. Shao., 2001: Long-term monitoring
32
of the coral reef fish communities around a nuclear power plant. Aquatic
Ecology, 35, 233-243.
Kistler R, Kalnay E, Collins W, Saha S, White G, Woollen J, Chelliah M,
Ebisuzaki W, Kanamitsu M, Kousky V, vanden Dool H, Jenne R, Viorino
M, 2001: The NCEP-NCAR 50-year reanalysis: monthly means CD-ROM
and documentation. Bulletin of Amer. Meteorolo. Socie., 82, 247–267.
Ko, C.-Y., 2010: Current and Future Distributions of Endemic Bird Species.
Ph.D. Thesis, National Taiwan University, 150pp.
Kottelat M., 1996. Oncorhynchus formosanus. 2006 IUCN Red List of
Threatened Species. Ver. 2.3. Internet resource. available at
http://www.iucnredlist.org (last accessed on 25 December 2006).
Lee, C. T., M. C. Wu, and S. C. Chen, 2005: Regional Spectral Model
Simulation of the Summertime Regional Climate over Taiwan and Adjacent
Areas. J. Terrestrial Atmos. and Oceanic Sci. (TAO), 16, 487.
Lee, K. T., 2009: The impact assessment of climate change on fishery of Taiwan
and adaptation strategy. Proceeding of the Cross-Strait Fisheries Week
2009 in Fuzhou, 88-92. (in Chinese)
Lemke, P., J. Ren, R.B. Alley, I. Allison, J. Carrasco, G. Flato, Y. Fujii, G.
Kaser, P. Mote, R.H. Thomas and T. Zhang, 2007: Observations: Changes
in Snow, Ice and Frozen Ground. In: Climate Change 2007: The Physical
Science Basis. Contribution of Working Group I to the Fourth Assessment
Report of the Intergovernmental Panel on Climate Change [Solomon, S., D.
Qin, M. Manning, Z. Chen, M. Marquis, K.B. Averyt, M. Tignor and H.L.
Miller (eds.)]. Cambridge University Press, Cambridge, United Kingdom
and New York, NY, USA.
Liao, Y. C, L. S. Chen and K. T. Shao, 2009: Predatory Atlantic red drum fish,
Sciaenops ocellatus, invades along the western Taiwanese coast of
Indo-West Pacific. Biological Invasions (in press) DOI

33
10.1007/s10530-009-9642-x.
Li, M.-H. , W. Tien and C.-P. Tung, 2009: Assessing the impact of climate
change on the land hydrology in Taiwan. Paddy Water Environ., 7,
283–292.
Lin, H.-J., C.-B. Hsu, C.-H. Yeh, W.-H. Kuan, T.-R. Peng, S.-J. Kao, S.-T. Tsai.,
M.-H. Kuo, J.-T. Yang, W.-B. Yeh, S.-H. Wu, C.-S. Tzeng, Y.-H. Sun and
K.-T. Shao. 2009: Wuling Long-Term Ecological Research and Modeling.
J. National Taiwan Museum 62(4):13-24, 2009. (in Chinese)
Lin, H.J., C.C. Hsu and H. R. Guo, 2007: Increased lower limb cellulitis after a
typhoon followed by a flood. Epidemiology, 18(3), 410.
Lin, H.-J., C.-H. Yeh, W.-H. Kuan, T.-R. Peng, S.-J. Kao, S.-T. Tsai., M.-H.
Kuo, J.-T. Yang, W.-B. Yeh, S.-H. Wu, C.-S. Tzeng, Y.-H. Sun and K.-T.
Shao., 2008: Wuling Long-Term Ecological Research and Modeling. Final
report to Shei-Pa National Park. (in Chinese)
Lin, H.-J., C.-Y. Wu, S.-J. Kao, W.-Y. Kao and P.-J. Meng, 2007: Mapping
anthropogenic nitrogen through point sources in coral reefs using δ15N in
macroalgae. Marine Ecology Progress Series, 335, 95-109.
Lin, L. and P. F. Lee, 2009: The research project of building biodiversity GIS
database of national parks. Construction and Planning Agency, Taipei,
242pp. (In Chinese, English abstract)
Lin, S.-H., C.-M. Liu, W.-C. Huang, S.-S. Lin, Z.-H. Yen, H.-R. Wang, J.-T.
Kuo and Y. C. Lee, 2010: Developing a yearly warning index to assess the
climatic impact on the water resources of Taiwan, a complex-terrain island.
(Submitted to J. Hydrology).
Lin, W.-Z., H.-C. Tsai, C.-H. Wang and W.-H. Teng, 2005:
Urbanization-induced regional climate change on the western plain of
Taiwan for the period 1964~1999. 2005 WSEAS Int. Conf. on Environment,
Ecosystems and Development, Venice, Italy, November 2-4, 2005, p.

34
7-13.
Liu, C. M., 2009: From draught to record-breaking flooding over southern
Taiwan. 6th Annual Climate Change Research Symposium, Sept. 8-10, 2009,
Sacramento, California, USA.
Liu, C. M., C. I. Huang and P. s. Yu, 2009: Climate Change Long-term Impact
Assessment and Adaptation Strategies Project. Council for Economic
Planning and Development, No. 97022703, 583pp. (in Chinese)
Liu, C.-M., M.-C. Wu, S. Paul, C.-Y. Chen, S.-H. Lin, W.-S. Lin, Y.-C. Lee, H.-H.
Hsu, R.-Y. Tzeng and C.-T. Chen, 2010: Super-ensemble of three RCMs for
climate projection over East Asia and Taiwan. Theoretical and Applied
Meteorology, DOI 10.1007/ s00704-010-0275-x (on line).
Liu, P.-J., K.-T. Shao, R.-Q. Jan, T.-Y. Fan, S.-L. Wong, J.-S. Hwang, J.-P. Chen,
C.-C. Chen and H.-J. Lin, 2009: A trophic model of fringing coral reefs in
Nanwan Bay, southern Taiwan suggests overfishing. Marine Environ. Res.,
68, 106-117.
Liu, P.-J., S.-M. Lin, T.-Y. Fan, P.-J. Meng, K.-T. Shao and H.-J. Lin, 2009: Rates
of overgrowth by macroalgae and attack by sea anemones are greater for
live coral than dead coral under conditions of nutrient enrichment.
Limnology and Oceanography, 54, 1167–1175.
Liu, S. C., C. Fu, C.-J. Shiu, J.-P. Chen, and F. Wu, 2009, Temperature
dependence of global precipitation extremes, Geophys. Res. Lett., 36,
L17702, doi:10.1029/2009GL040218.
Liu, T.-M., C. P. Tung, K. Y. Ke, L. H. Chuang and C. Y. Lin, 2009:
Application and development of a decision-support system for assessing
water shortage and allocation with climate change. Paddy Water Environ.,
7,301–311.
Lu, H. J., K. T. Lee, H. L. Lin and C. H. Liao, 2001: Spatio-temporal
distribution of yellowfin tuna, Thunnus albacares, and bigeye tuna, T.
35
obesus, in the Tropical Pacific Ocean in relation to large-scale temperature
fluctuation during ENSO episodes. Fisheries Science, 67, 1046-1052.
Lur, H.-S., C.-L. Hsu, C.-W. Wu, C.-Y. Lee, C.-L. Lao, Y.-C. Wu, S.-J. Chang,
C.-Y. Wang and M. Kondo, 2009: Changes in Temperature, Cultivation
Timing and Grain Quality of Rice in Taiwan in Recent Years. Crop,
Environment and Bioinformatics, 6, 175-182.
Meehl, G.A., T.F. Stocker, W.D. Collins, P. Friedlingstein, A.T. Gaye, J.M.
Gregory, A. Kitoh, R. Knutti, J.M. Murphy, A. Noda, S.C.B. Raper, I.G.
Watterson, A.J. Weaver and Z.-C. Zhao, 2007: Global Climate Projections.
In: Climate Change 2007: The Physical Science Basis. Contribution of
Working Group I to the Fourth Assessment Report of the
Intergovernmental Panel on Climate Change [Solomon, S., D. Qin, M.
Manning, Z. Chen, M. Marquis, K.B. Averyt, M. Tignor and H.L. Miller
(eds.)]. Cambridge University Press, Cambridge, United Kingdom and
New York, NY, USA.
National Fire Agency (NFA), Ministry of the Interior, Executive Yuan
(Taiwan/ROC), 2010: Statistics of natural disasters over the years.
http://www.nfa.gov.tw/Show.aspx?MID=97&UID=827&PID=97 (in
Chinese).
National Disaster Prevention and Protection Commission (NDPPC), Executive
Yuan (Taiwan/ROC), 2009: Report from the Morakot Disaster Response
Center on August 21, 2009. (in Chinese)
Oshima M., 1955: Masu Salmon (Oncorhynchus masu Brevoort), and Biwa
Salmon, Oncorhynchus rhodurus (Jordan and McGregor). Nireshobo,
Tokyo, Japan. 79 pp. (in Japanese)
Pai, H. H. and Y. L. Lu, 2009: Seasonal abundance of vectors at outdoor
environments in endemic and nonendemic districts of dengue in Kaohsiung,
South Taiwan. J. Environ. Health, 71, 56-60.
36
Parmesan, C. and G. Yohe, 2003: A globally coherent fingerprint of climate
change impacts across natural systems. Nature, 421, 37–42.
Phillips, S. J., R. P. Anderson and R. E. Schapire, 2006: Maximum entropy
modeling of species geographic distribution. Ecological Modelling, 190,
231-259.
Roeckner, E., J. M. Oberhuber, A. Bacher, M. Christoph and I. Kirchner, 1996:
ENSO variability and atmospheric response in a global coupled
atmosphere-ocean GCM. Clim. Dyn., 12, 737-754.
Rosenzweig, C., G. Casassa, D.J. Karoly, A. Imeson, C. Liu, A. Menzel, S.
Rawlins, T.L. Root, B. Seguin, P. Tryjanowski, 2007: Assessment of
observed changes and responses in natural and managed systems. Climate
Change 2007: Impacts, Adaptation and Vulnerability. Contribution of
Working Group II to the Fourth Assessment Report of the
Intergovernmental Panel on Climate Change, M.L. Parry, O.F. Canziani,
J.P. Palutikof, P.J. van der Linden and C.E. Hanson, Eds., Cambridge
University Press, Cambridge, UK, 79-131.
Root, T.L., J. T. Price, K. R. Hall, S. H. Schneider, C. Rosenzweig and J. A.
Pounds, 2002: Fingerprints of global warming on wild animals and plants.
Nature, 421, 57-60.
Shao, K. T., 1995: The effect of climate change to coastal fish distribution in
Taiwan. In S.S. Yang (ed.) Climate change and Agriculture production,
p.189-206, Taiwan Agricultural biochemistry Society. (in Chinese)
Shao, K. T., T. Y. Fan, P. J. Meng, Z. W. Chang, K. H. Lee, B. Z. Liu, S. Y.
Huang and Z. Y. Change, 2008: Cause of death of a large amount of coral
reef marine fish at Maopitou, Kenting, on July 3, 2008. (in Chinese, private
communication).
Shen, Y. and M. H. Yao, 2009: Evaluation of impact of climate change to
response strategies. Project report, agriculture of Taiwan and

37
NSC96-2625-Z005-008, National Science Council, Republic of China
(Taiwan) (in Chinese).
Shang, C.-S., C.-T. Fang, C.-M. Liu, T.-H. Wen, K.-H. Tsai and C.-C. King,
2010: The Role of Imported Cases and Favorable Meteorological
Conditions in the Onset of Dengue Epidemics. (accepted by PLoS
Neglected Tropical Diseases)
Sun, S.-T., 2010: Applying species distribution model on the establishment of
monitoring plots under climate change. Master’s thesis, School of Forestry
and Resource Conservation, National Taiwan University, Taipei, Taiwan. (in
Chinese)
Tsai, C. F. P. Y. Chen, C. P. Chen, M. A. Lee, G. Y. Shiah and K. T. Lee, 1997:
Fluctuation in abundance of larval anchovy and environmental condition in
coastal waters off south-western Taiwan as associated with the El Nino –
Southern Oscillation. Fishery Oceanography 6, 238-249.
Tsai, W. S., C. F. Dai, I. C. Yang and C. P. Tung, 2004: Using Genetic
Programming to Modeling Spatial Distribution of Corals and the Impacts
of Climatic Changes: A Case Study from Taiwan. Proceedings of the 10th
International Coral Reef Symposium, Okinawan, Japan, pp. 1441-144
Trenberth, K.E., P.D. Jones, P. Ambenje, R. Bojariu, D. Easterling, A. Klein
Tank, D. Parker, F. Rahimzadeh, J.A. Renwick, M. Rusticucci, B. Soden
and P. Zhai, 2007: Observations: Surface and atmospheric climate change.
In: Climate Change 2007: The Physical Science Basis. Contribution of
Working Group I to the Fourth Assessment Report of the
Intergovernmental Panel on Climate Change [Solomon, S., D. Qin, M.
Manning, Z. Chen, M. Marquis, K.B. Averyt, M. Tignor and H.L. Miller
(eds.)]. Cambridge University Press, Cambridge, United Kingdom and
New York, NY, USA
Tu, J. Y., C. Chou and P.-S. Chu, 2009: The abrupt shift of typhoon activity in

38
the vicinity of Taiwan and its association with Western North Pacific–East
Asian climate change. J. Climate, 22, 3617-3628.
Tung, C. P., P. F. Lee, and C. J. Ko, 2007: Early warning indicators and
framework of climate change to terrestrial ecosystem in Taiwan.
Environmental Protection Administration, Taipei, 46pp. (In Chinese,
English abstract)
Walther, G.-R., E. Post, P. Convey, A. Menzel, C. Parmesan, T.J.C. Beebee,
J.-M. Fremont, O. Hoegh-Guldberg and F. Bairlein, 2002: Ecological
responses to recent climate change. Nature, 416, 389–395.
Wang, J. X. L., and D. J. Gaffen, 2001: Late-twentieth-century climatology and
trends of surface humidity and temperature in China. J. Climate, 14,
2833–2845.
Wurbs, R.A. and W.P. James, 2002: Water Resources Engineering. Prentice
Hall, NJ. 828pp.
Yen, S.-M., C.-R. Chiou and K.-T Chang, 2008: Modeling the species
distribution of three dominant coniferous species in Taiwan. Taiwan
Journal of Forest Science, 23,165-181. (in Chinese)
Yu, P.S., Yang, T.C., Wu, C.K., 2002: Impact of climate change on water
resources in southern Taiwan. J. Hydrology, 260, 161– 175.
Zhai, P. and X. Pan, 2003: Trends in temperature extremes during 1951–1999 in
China. Geophys. Res. Lett., 30, 1913-1916, doi:10.1029/2003GL018004.
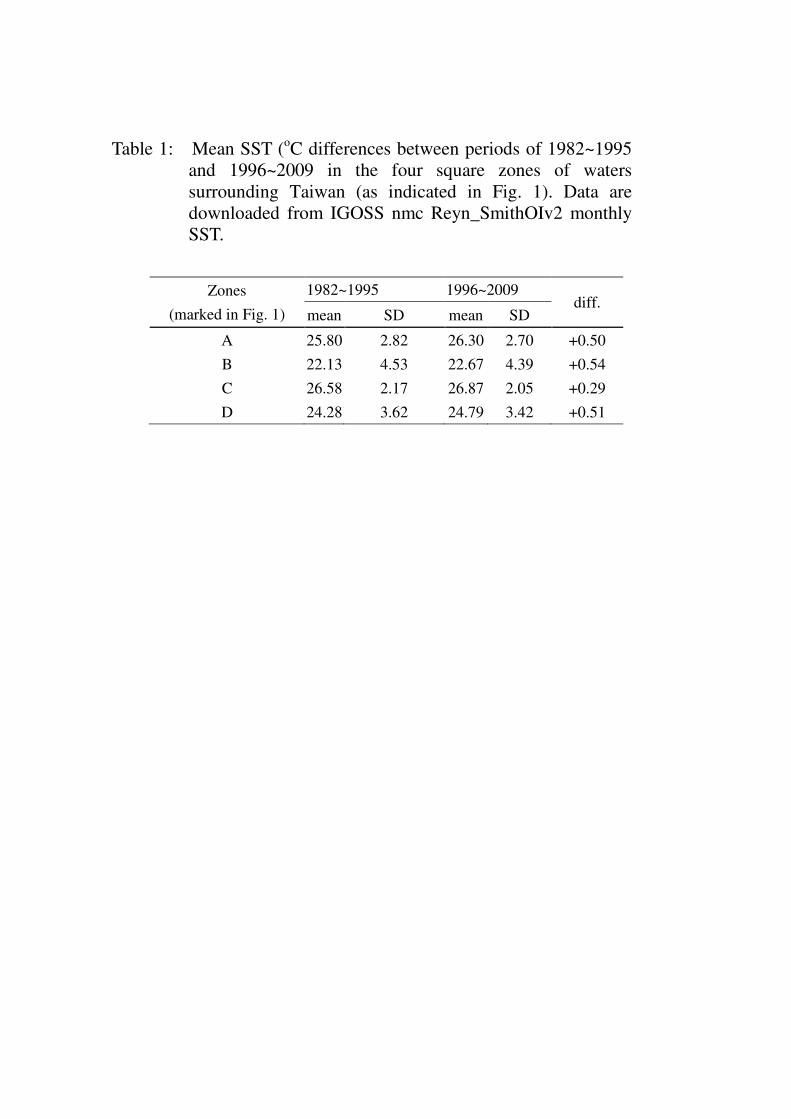
Table 1: Mean SST (oC differences between periods of 1982~1995 and 1996~2009 in the four square zones of waters surrounding Taiwan (as indicated in Fig. 1). Data are downloaded from IGOSS nmc Reyn_SmithOIv2 monthly SST.
Zones
(marked in Fig. 1)
1982~1995 1996~2009 diff.
mean SD mean SD
A 25.80 2.82 26.30 2.70 +0.50
B 22.13 4.53 22.67 4.39 +0.54
C 26.58 2.17 26.87 2.05 +0.29
D 24.28 3.62 24.79 3.42 +0.51

Table 2: Impact of SST increase after mid 1990s on the important commercial fishes in the surrounding waters of Taiwan.
Type of fishery
Target species Fishing ground Impact
offshore tuna long line fishing
(1977-2008) (Lu et al.,
2001)
Skipjack tuna (Euthynnus pelamis) Yellowfin tuna (Thunuus albacares)
southern, eastern, and northern waters of Taiwan
Warmer water was accompanied with an increase in recruitment and hence an increase of 10-20% in total catch.
Albacore (Thunnus alalunga) Bigeye tuna(Thunnus obesus)
Warmer water was accompanied with a decrease in recruitment and hence a decrease of 10-20% in total catch.
paired purse seine
(Lee, 2009)
Grey mullet (Mugil cephalus L.) (1958-2000) western waters of Taiwan
Warm water of a branch of Kuroshio Current flew into the Yun-Chang Ridge (F1 in Fig. 1), which prevented grey mullet from migrating southward for spawning. The total number of grey mullet to migrate southward decreased from 2.73 million fish in 1980 to 200,000 fish after 2000.
Black pomfret (Parastromateus niger) (1981-2008) western waters of Taiwan
Southward migration was interfered due to a retreat of the China Coastal Current. Annual catch decreased from 11,231 tonnes in 1981 to1,182 tonnes in 2000.
large purse seine for
carangid fishes (1982-2008) (Chen, 2005)
Chub mackerel (Scomber japonicus) Japanese Jack mackerel (Trachurus japonicus) Pacific red-tail scad (Decapterus kurroides akaadsi)
northeastern waters of Taiwan
Dominated 60-75% of the total catch before mid-1990s, but down to 25-40% after.
Spotted mackerel (Scomber australasicus) Slender scad (Decapterus lajang)
Dominated 25-40% of the total catch before mid-1990s, but up to 60-75% after.
larval anchovy fishery
(1982-2008) (Hsieh et al.,
2009)
Japanese anchovy (Engraulis japonicus) Buccaneer anchovy (Encrasicholina punctifer) Shorthead anchovy (Encrasicholina heteroloba)
I-Lan Bay (F2 in Fig. 1) and coastal water of Fang-Liao (F3 in Fig. 1)
Before mid-1990s, 90% of the total catch in spring was Japanese anchovy, but it down to 5-20% in 2000-2004. Over the southwestern waters, genus Encrosicholina dominated completely after mid-1990s.
shallow seawater
oyster aquaculture (1982-2008)
Pacific oyster (Crassostrea gigas) coastal water of western Taiwan
Warmer water caused frequent ovulation and semination, creating difficulty in larvae settling. Total production of oyster decreased by 21.4% in the last twenty years.
inshore abalone
aquaculture (1995-2007)
Small abalone (Haliotis aqualilis)
coastal water of Gong-Liao (F4 in Fig. 1), Taipei County
Retreat of the China Coastal Current during breeding period of abalone caused a change in the nitrate/phosphate ratio of water and resulted in the dominance of diatom in algal composition and hence a failure of larvae settling. In 1995, the annual production of abalone was 1,500 tonnes with a market value of more than US$ 30 million, but it decreased to 139 tonnes with a market value only about US$ 0.3 million total in 2007.

Table 3: Extent of impact of climate variability and extremes on the important commercial fishes of Taiwan
Types of fishery
Target species Phenomenon Impact
glass eels fishery (Chiu, 2006)
Japanese eel (Anguilla japonica)
El Niño years: 1994-1995, 1997-1998, and 2002-2003. Averaged December SST in zones B and D were 0.73oC higher than previous normal year.
Eastward shifting of the Indo-Pacific warm pool and a weakening Kuroshio Current caused a reduction of glass eels recruitment.
La Niña years: 1995-1996, 1999-2000 and 2000-2001. Averaged December SST in zones B and D were 0.79oC lower than previous normal year.
Westward shifting of the Indo-Pacific warm pool and a strengthening in the China Coastal Current caused an increase in glass eels recruitment. Annual productions in three La Niña years were 10 times those in three El Niño years
paired purse seine fishery (Lee, 2009)
Grey mullet (Mugil cephalus)
El Niño years: 1977-1978, 1982-1983, and1986-1987. Averaged December SST in zone A was 0.58oC higher than previous normal year.
Strengthening of a branch of Kuroshio Current into southwestern Taiwan waters and a weakening of China Coastal Current reduced the southward spawning of mullet. A reduction of more than 30% in production of the preceding year was observed.
coastal fishery at Penghu Islands (marked in Fig. 1) (Chang et al., 2009)
wild and aquaculture fishes in the archipelagic shallow waters
La Niña year: 2007-2008. Averaged February SST was 8.2oC lower than previous 5-year mean.
An abnormal intrusion of China Coastal Current resulted in a significant drop of 12oC in the surface waters surrounding Penghu Islands in February. Death of huge quantities of fishes of 172 species in 58 families caused a financial loss of more than US$ 30million.
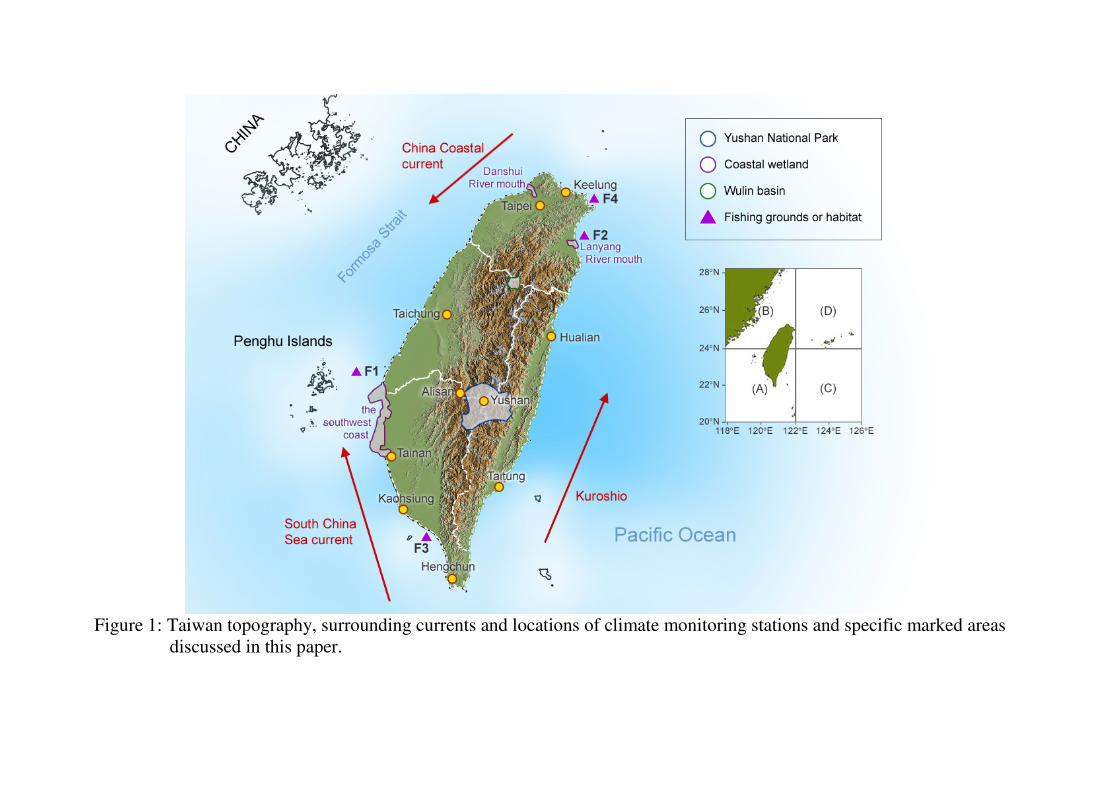
Figure 1: Taiwan topography, surrounding currents and locations of climate monitoring stations and specific marked areas
discussed in this paper.
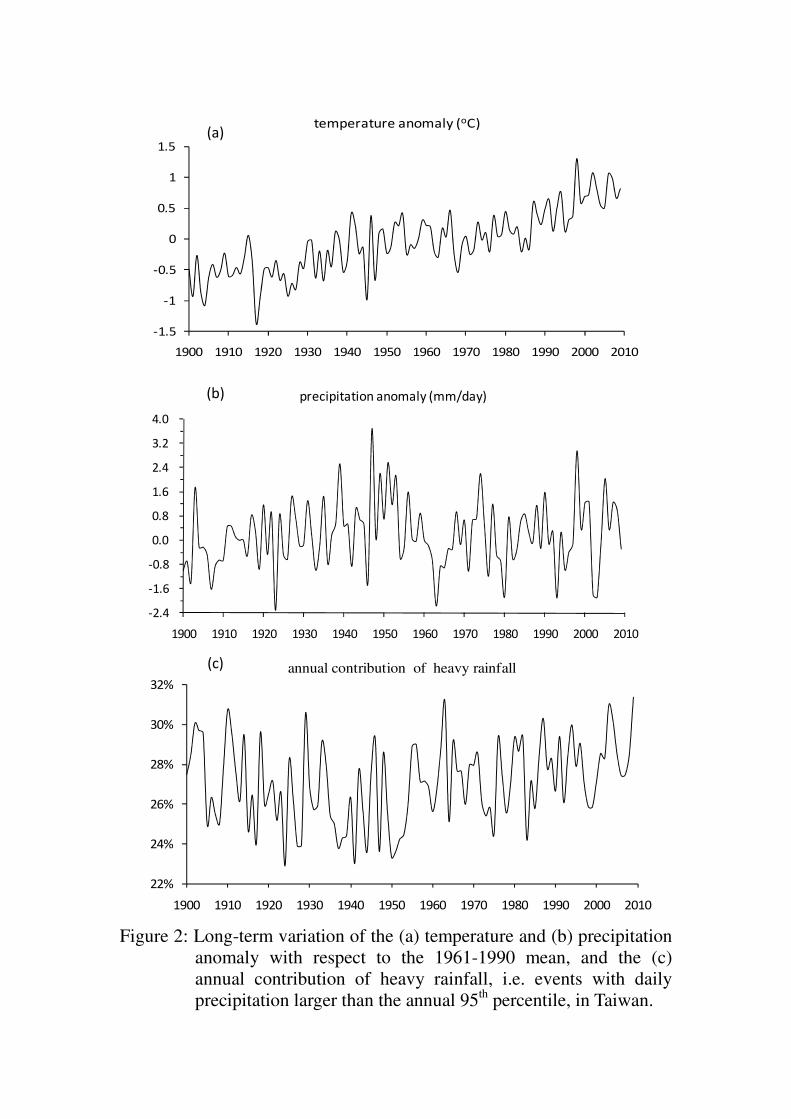
-1.5
-1
-0.5
0
0.5
1
1.5
1900 1910 1920 1930 1940 1950 1960 1970 1980 1990 2000 2010
temperature anomaly (oC)
-2.4
-1.6
-0.8
0.0
0.8
1.6
2.4
3.2
4.0
1900 1910 1920 1930 1940 1950 1960 1970 1980 1990 2000 2010
precipitation anomaly (mm/day)
22%
24%
26%
28%
30%
32%
1900 1910 1920 1930 1940 1950 1960 1970 1980 1990 2000 2010
annual contribution of heavy rainfall
Figure 2: Long-term variation of the (a) temperature and (b) precipitation
anomaly with respect to the 1961-1990 mean, and the (c) annual contribution of heavy rainfall, i.e. events with daily precipitation larger than the annual 95th percentile, in Taiwan.
(a)
(b)
(c)
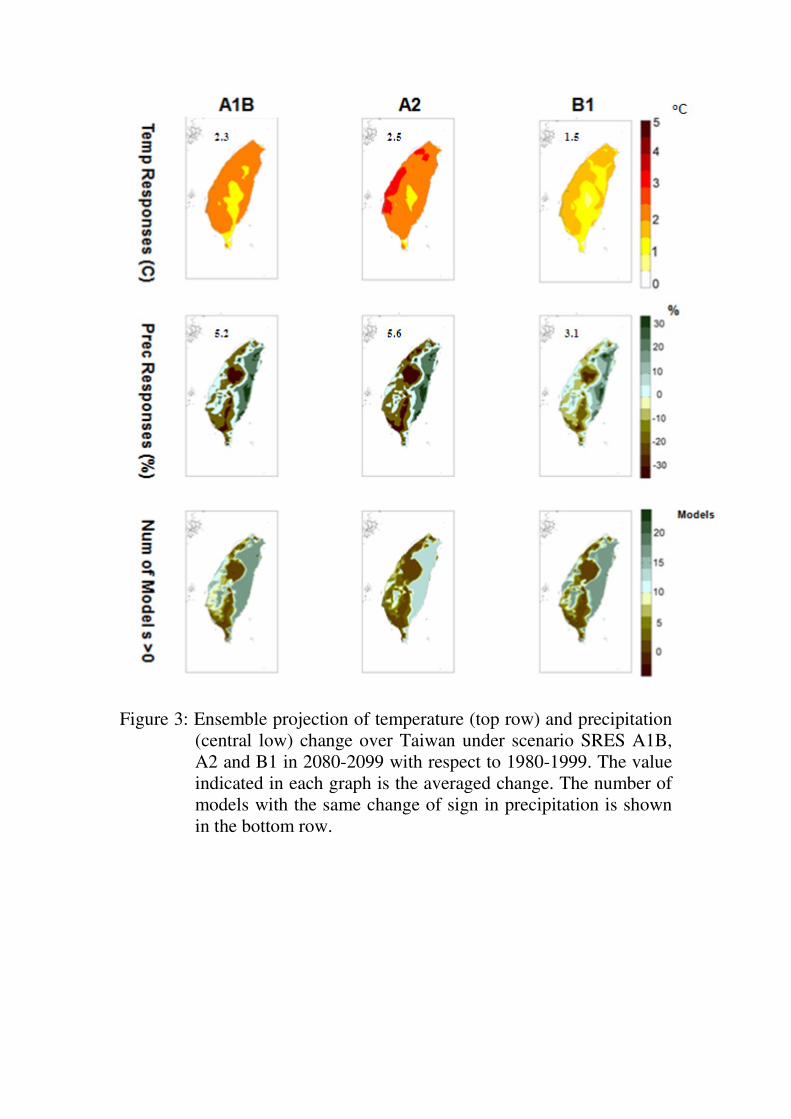
Figure 3: Ensemble projection of temperature (top row) and precipitation (central low) change over Taiwan under scenario SRES A1B, A2 and B1 in 2080-2099 with respect to 1980-1999. The value indicated in each graph is the averaged change. The number of models with the same change of sign in precipitation is shown in the bottom row.

Figure 4: The projected decreasing rate of suitable habitat of different forest types and ecotone in 2080 with respect to the recent forest inventory by Chiou et al. (2009). A is Abies kawakamii forest; T is Tsuga chinensis var. formosana; C is Chamaecyparis formosensis mixed with Chamaecyparis obtusa var. formosana (Chamaecyparis) forest; AT is the Abies kawakamii and Tsuga chinensis var. formosana ecotone; TC is the Tsuga chinensis var. formosana and Chamaecyparis ecotone. Mark ○ indicates the A2 scenario and ● the B2 scenario.

Figure 5: Change in breeding bird species richness from 1992 to 2009 in alpine mountain monitoring sites over 3100 m in Yushan National Park of Taiwan (marked in Fig. 1).

Figure 6: Projected changes in species spatial distribution of endemic Taiwan Yuhina (Yuhina brunneiceps) under A2 scenario in 2020, 2050 and 2100 with climate projection by the Climate Modelling and Analysis (CCCma) Coupled Global Climate Model from Canadian Centre.

Figure 7: Summarized distribution patterns of coral species richness in reef areas of Taiwan in the present, and projected in 2025, 2055, and 2085.
unit: species
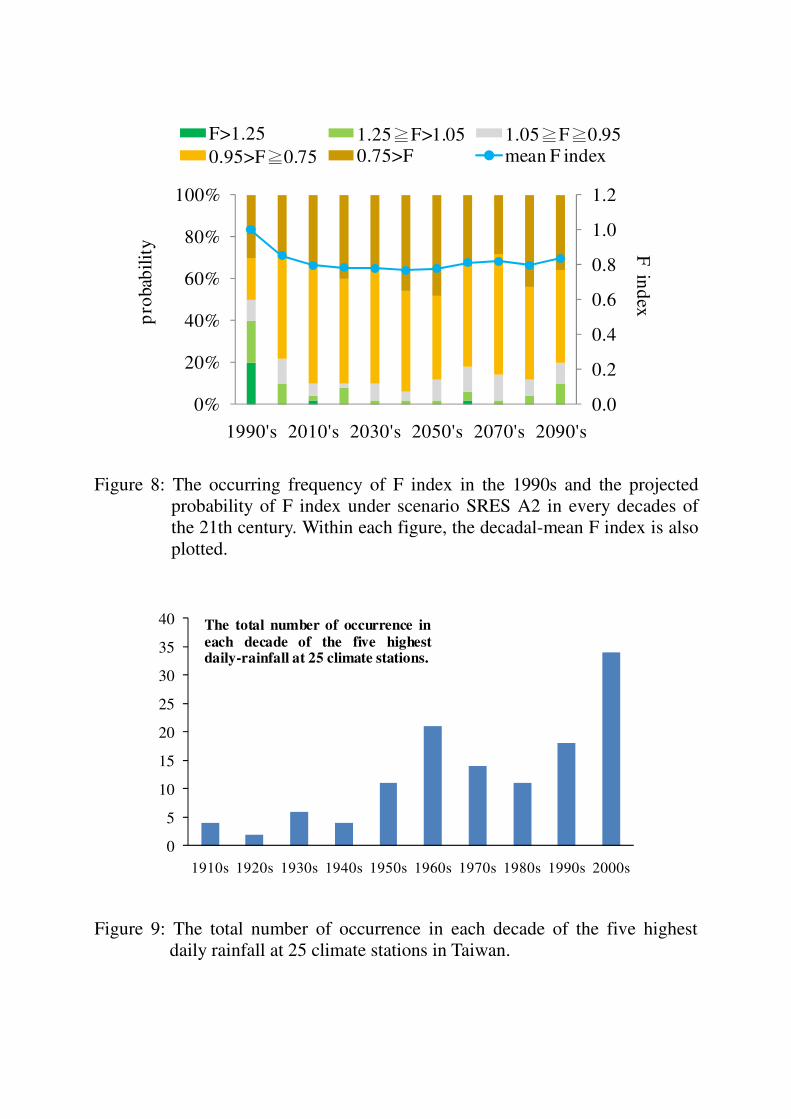
0.0
0.2
0.4
0.6
0.8
1.0
1.2
0%
20%
40%
60%
80%
100%
1990's 2010's 2030's 2050's 2070's 2090's
F>1.25 1.25≧F>1.05 1.05≧F≧0.950.95>F≧0.75 0.75>F mean F index
pro
bab
ilit
y
F in
dex
Figure 8: The occurring frequency of F index in the 1990s and the projected probability of F index under scenario SRES A2 in every decades of the 21th century. Within each figure, the decadal-mean F index is also plotted.
0
5
10
15
20
25
30
35
40
1910s 1920s 1930s 1940s 1950s 1960s 1970s 1980s 1990s 2000s
The total number of occurrence in
each decade of the five highestdaily-rainfall at 25 climate stations.
Figure 9: The total number of occurrence in each decade of the five highest daily rainfall at 25 climate stations in Taiwan.
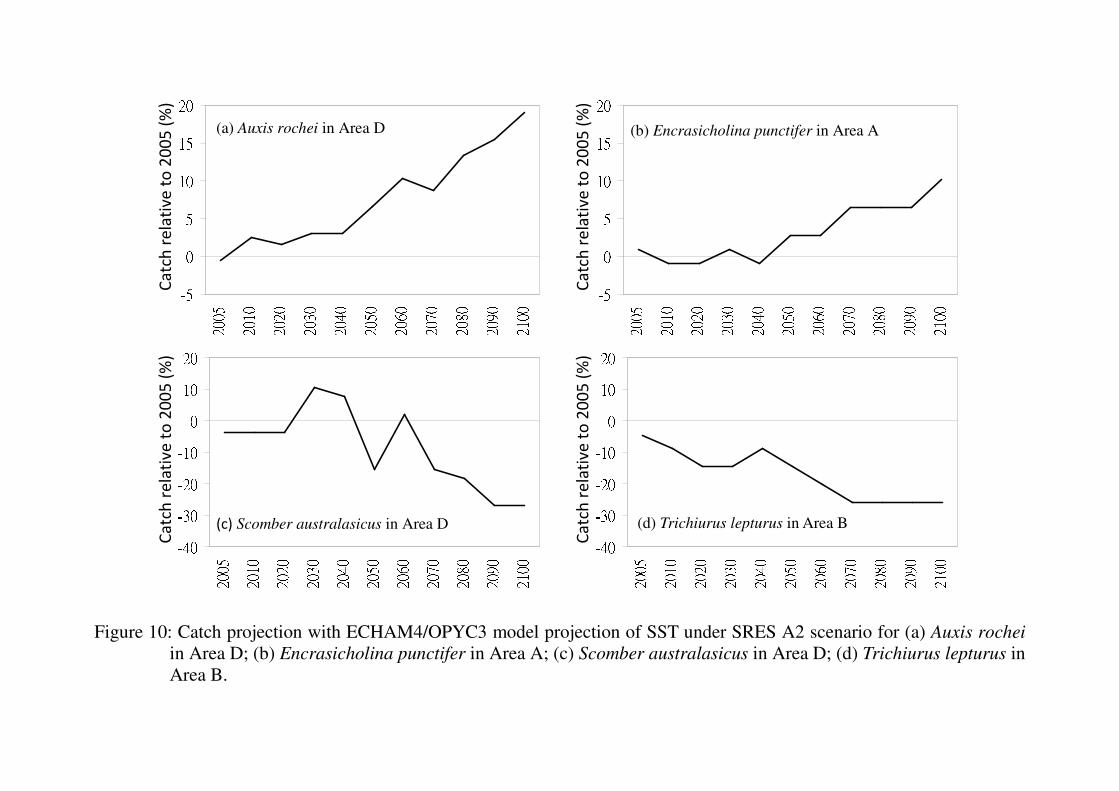
-505101520
2005 2010 2020 2030 2040 2050 2060 2070 2080 2090 2100Ca
tch
re
lati
ve
to
20
05
(%
)
-505101520
2005 2010 2020 2030 2040 2050 2060 2070 2080 2090 2100 Ca
tch
re
lati
ve
to
20
05
(%
)
-40-30-20-1001020
2005 2010 2020 2030 2040 2050 2060 2070 2080 2090 2100Ca
tch
re
lati
ve
to
20
05
(%
)
-40-30-20-1001020
2005 2010 2020 2030 2040 2050 2060 2070 2080 2090 2100Ca
tch
re
lati
ve
to
20
05
(%
)
Figure 10: Catch projection with ECHAM4/OPYC3 model projection of SST under SRES A2 scenario for (a) Auxis rochei
in Area D; (b) Encrasicholina punctifer in Area A; (c) Scomber australasicus in Area D; (d) Trichiurus lepturus in Area B.
(b) Encrasicholina punctifer in Area A
(c) Scomber australasicus in Area D (d) Trichiurus lepturus in Area B
(a) Auxis rochei in Area D

Figure 11: Box plot of The decadal change of (a) the 1st day of snow after July 1st, (b) the annual total snow day, (c) the annual
accumulated snow and (d) the mean daily snow at Yushan high-elevation station, i.e. 3,858m a.s.l. (Marked in Fig. 1). Each box consists of the 75% percentile, medium and the 25% percentile, with dashed lines extending to the upper adjacent value (UAV) and the lower adjacent value (LAV) and sometimes a cross to represent the maximum or the minimum value.
(a) (b)
(c) (d)