climate-change impacts on sagebrush habitat and west nile ... · climate-change impacts on...
TRANSCRIPT
Climate-change impacts on sagebrush habitat and West Nilevirus transmission risk and conservation implicationsfor greater sage-grouse
Anne Schrag • Sarah Konrad • Scott Miller •
Brett Walker • Steve Forrest
� Springer Science+Business Media B.V. 2010
Abstract Greater sage-grouse (Centrocercus uroph-
asianus) are threatened by loss of sagebrush habitat and
the spread of West Nile virus throughout much of their
range in North America; yet, future impacts of climate
change on these potential stressors have not been
addressed. Here, we aim to quantify the potential
impacts of climate change on the distribution of
climatically suitable habitat for sagebrush and on
transmission risk for West Nile virus in the eastern
portion of the species’ range. We used Maxent to
model the current and future climatically suitable
habitat for two dominant sagebrush species in the study
area, and we used a degree-day model to predict future
West Nile virus transmission risk under likely climate-
change scenarios. Our models suggest that areas with
the highest future suitability for sagebrush habitat will
be found in southwestern Wyoming and north-central
Montana. The degree-day model suggests that greater
sage-grouse in western portions of the study area,
which are generally higher in elevation than where
West Nile virus currently occurs, will see increasing
risk of transmission in the future. We developed a
spatially explicit map of suggested management
actions based on our predictions that will aid in
conservation of the species into the coming decades.
Keywords Climate � Greater sage-grouse �Northern Great Plains � Northern Rockies � Species
distribution modeling � West Nile virus
Introduction
Successful conservation of species requires spatially
explicit information on current and future threats to
their survival (Margules and Pressey 2000). For
species that encompass large geographical ranges, it
is often necessary to apply a regional-scale approach
to conservation, as opposed to working only locally
or within jurisdictional boundaries (Ferrier et al.
2004). The sagebrush ecosystem, which spans the
western US and Canada, is a system of high
A. Schrag (&)
Northern Great Plains Program, 202 S. Black,
Ste. 3, Bozeman, Montana 59715, USA
e-mail: [email protected]
S. Konrad � S. Miller
Department of Renewable Resources, University
of Wyoming, 1000 E. University Ave., Laramie,
Wyoming 82071, USA
e-mail: [email protected]
S. Miller
e-mail: [email protected]
B. Walker
Wildlife Biology Program, University of Montana,
Missoula, Montana 59812, USA
e-mail: [email protected]
S. Forrest
Northern Great Plains Program, World Wildlife Fund,
202 S. Black, Ste. 3, Bozeman, Montana 59715, USA
e-mail: [email protected]
123
GeoJournal
DOI 10.1007/s10708-010-9369-3

conservation value that contains many species of
conservation interest (Knick et al. 2003). However,
anthropogenic and ecological changes threaten both
sagebrush communities and sagebrush-dependent
species (Knick et al. 2003; Connelly et al. 2004;
Aldridge et al. 2008; Meinke et al. 2008).
One sagebrush-obligate species of heightened
concern is the greater sage-grouse (Centrocercus
urophasianus). The greater sage-grouse is no longer
present along the periphery of its former range in
North America (Schroeder et al. 2004), and long-term
monitoring efforts suggest that populations through-
out the West have declined over the past 40 years
(Knick et al. 2003; Connelly et al. 2004; Aldridge
et al. 2008). Studies have shown that decreases in the
amount of sagebrush habitat lead to declines in sage-
grouse abundance and declines have largely been
attributed to loss and/or degradation of sagebrush
habitat (Knick et al. 2003; Connelly et al. 2004;
Aldridge et al. 2008; Meinke et al. 2008). More
recently, impacts from infectious diseases such as
West Nile virus (WNv) (Naugle et al. 2004, 2005;
Walker et al. 2007a; Walker and Naugle 2010) and
increasing habitat loss and degradation associated
with energy development (Manville 2004; Walker
et al. 2007b; Doherty et al. 2008; Naugle et al. 2010)
have emerged as concerns.
Climate change is likely to influence sage-grouse
conservation both directly and indirectly and may act
synergistically with other stressors. Historically,
sagebrush has inhabited cold, dry areas where it can
outcompete shallow-rooted grasses and forbs (Wells
1970). Increasing temperatures and greater available
moisture, especially later in the summer, may
decrease its competitive advantage over these species
(Schwinning et al. 2005). Increasing temperatures
associated with climate change also may lead to
earlier onset of WNv transmission and facilitate
spread of the virus to higher elevations (Naugle et al.
2005). During periods of drought, which are expected
to be more frequent and possibly more intense under
climate change, sage-grouse may also move toward
water earlier in the year and, subsequently, come into
contact with mosquitoes for longer periods during the
transmission season (Naugle et al. 2004). In addition,
drought and severe winters have been found to
decrease survival of greater sage-grouse broods and
adults, respectively (Holloran et al. 2005; Moynahan
et al. 2006; Aldridge and Boyce 2008). Climate
change may also lead to more frequent fires, which
will yield a competitive advantage for grass species
(Westerling et al. 2006). Invasive species, such as
cheatgrass (Bromus tectorum), can cause fires to burn
more frequently, which leads to a competitive
disadvantage for fire-intolerant sagebrush species
such as Wyoming big sagebrush (Artemisia tridentata
var. wyomingensis; Baker 2006). Also, because many
crops at northern latitudes are currently temperature-
limited, warmer seasonal temperatures associated
with climate change may lead to greater conversion
of native shrub-steppe to tilled agriculture in the near-
term (Motha and Baier 2005; Stubbs 2007).
Species distribution models can be used to quan-
tify the relationship between the location of a species
across the landscape and the climatic conditions that
are suitable for their long-term viability (Pearson and
Dawson 2003; Guisan and Thuiller 2005; Pearson
et al. 2007). These models allow for examination of
the predicted impacts of future climate change by
replacing current climatic parameters with future
predicted climatic variables, allowing for a compar-
ison of the current and future climatically suitable
habitat (e.g., Bradley 2009; Schrag et al. 2008). Some
studies have argued that the practical application of
species distribution models for making conservation
decisions is limited because non-climatic factors,
which are not taken into account in these models, also
influence the distribution of species across the
landscape (Pearson and Dawson 2003; Guisan and
Thuiller 2005; Beale et al. 2008). However, other
studies have shown that the basic principles that drive
bioclimatic envelope modeling are supported, and the
biogeographical information that these models pro-
vide can be useful in understanding which factors
most highly influence spatial patterns of species
across the landscape and how those patterns may
change under future conditions (Martı́nez-Meyer
et al. 2004; Pearson et al. 2007).
The goal of this paper is to inform current greater
sage-grouse conservation actions by modeling poten-
tial impacts of climate change on two species of
sagebrush and on the risk of West Nile virus
transmission in the northern portion of their range.
We chose this focal area because it lies at the
periphery of their range in the US, and the impacts of
climate on these species of sagebrush has not been
examined at this scale. We first examined the impacts
of climate change on the climatically suitable habitat
GeoJournal
123

for two dominant sagebrush species in the eastern
half of the species’ range, Wyoming big sagebrush
and silver sagebrush (Artemisia cana), using future
predicted climate data from downscaled global
circulation models (GCMs). Then, we examined the
impact of climate change on the risk of West Nile
virus transmission using degree-day models. When
viewed in relation to the current known distributions
of greater sage-grouse habitat, these analyses allowed
us to make recommendations for conserving specific
areas likely to provide high-quality sagebrush habitat
in the future, as well as to identify areas where risk of
West Nile virus transmission will increase.
Methods
Study area
The focal region for this study included the US states of
Montana, Wyoming, North Dakota and South Dakota.
The study area ranges in elevation from approximately
300 m in the eastern half of the Dakotas to over
4,000 m in the western parts of Wyoming. Eastern
areas of the study region generally have higher overall
temperatures, and western parts of the area show more
temperature variability due to greater topographic
relief. Precipitation falls primarily in the form of snow
in mountainous portions of the study region, while
most precipitation in the plains is rainfall.
Sagebrush distribution modeling: species data
Two species of sagebrush are common in the study
area: Wyoming big sagebrush and silver sagebrush.
We used point data from the LANDFIRE Program to
map the distribution of these sagebrush species across
the landscape (LANDFIRE 2009). The LANDFIRE
Program compiles digital maps of vegetation com-
position throughout the U.S. Numerous surveys—all
with distinct objectives—are used to sample and
classify vegetation on the ground. LANDFIRE per-
sonnel assisted us by developing a database that
included the Global Positioning System coordinates
of each presence point location for the two species of
sagebrush (Fig. 1). We used a total of 973 points for
silver sagebrush and 1,160 points for Wyoming big
sagebrush for the analysis.
Fig. 1 Locations of sagebrush samples derived from the LANDFIRE dataset within the study area. Circles represent locations of
Wyoming big sagebrush, and squares represent locations of silver sagebrush
GeoJournal
123

Sagebrush distribution modeling: current climate
data
Current climate variables were derived from the
PRISM dataset (Daly et al. 1997). These data are
available in a grid format and represent weather station
data from remote locations that have been spatially
interpolated across the landscape using techniques that
incorporate elevational lapse rates (Daly et al. 1997).
We used normals (i.e., the arithmetic mean of the
variables over the three decades) for the time period
from 1971 to 2000 for temperature and precipitation,
which are available at 800-m resolution, to represent
current conditions. We derived variables for seasonal
average temperature and total precipitation, as well as
average annual temperature and total precipitation, by
combining monthly data to create seasonal and annual
variables (Tables 1, 2).
Sagebrush distribution modeling: future climate
scenarios
We obtained future climate data from the World
Climate Research Programme (WCRP) Coupled
Model Intercomparison Project (CMIP3). Data are
available from the Intergovernmental Panel on Cli-
mate Change AR4 Report data archive. The data are
available on a monthly basis through the year 2099
from an original resolution of approximately 222 km2
(2�) grid cells. Statistical downscaling was used to
develop data sets at 12 km resolution (Maurer 2007).
We used six GCMs (listed in Table 3) to represent
a suite of possible climate futures (Santa Clara
University 2008). We selected GCMs based on the
degree to which they successfully approximated past
climatic conditions in the Pacific Northwest, northern
Rockies and northern Great Plains (J. Escheid,
personal communication). We assumed that the
Table 1 List of climatic predictor variables and their relative
contribution to the silver sagebrush distribution model
Climate variables % Contribution
July precipitation 30.9
Summer (JJA) precipitation 23.8
January average temperature 7.9
July average temperature 6.7
Spring (MAM) precipitation 5.8
Fall (SON) average temperature 5.7
Fall precipitation 5.7
Winter (DJF) average temperature 4.5
Spring (MAM) average temperature 3.3
Annual average temperature 1.9
Annual precipitation 1.7
Summer (JJA) average temperature 1.4
January precipitation 0.4
Winter (DJF) precipitation 0.4
Variables represent the 1971–2000 normal for current climate
and 2030 for future climate. Data are from Daly et al. (1997)
and WCRP CMIP3 (Santa Clara University 2008)
Table 2 List of climatic predictor variables and their relative
contribution to the Wyoming big sagebrush distribution model
Climate variables % Contribution
July precipitation 44.5
Summer (JJA) precipitation 23.7
Spring (MAM) average temperature 7.2
January precipitation 4.9
Annual average temperature 3.6
Winter (DJF) precipitation 3.5
January average temperature 3.3
Fall (SON) average temperature 2.4
July average temperature 1.9
Winter (DJF) average temperature 1.7
Fall (SON) precipitation 1.2
Summer (JJA) average temperature 1.1
Spring (MAM) precipitation 0.7
Annual precipitation 0.3
Variables represent the 1971–2000 normal for current climate
and 2030 for future climate. Data are from Daly et al. (1997)
and WCRP CMIP3 (Santa Clara University 2008)
Table 3 GCMs included in this analysis
Model
ID
Modeling group and country
CCC Canadian Centre for Climate Modelling and
Analysis, Climate Research Branch,
Environment Canada
CSIRO CSIRO Atmospheric Research, Australia
GFDL US Department of Commerce, NOAA,
Geophysical Fluid Dynamics Laboratory, USA
GISS NASA, Goddard Institute for Space Studies, USA
NCAR NSF National Center for Atmospheric Research,
USA
UKMO Hadley Center for Climate Prediction and Research,
Met Office, UK
GeoJournal
123

ability of the model to accurately predict past
conditions was the most reliable indicator of its
ability to predict future climate conditions.
We modeled one future emissions scenario. We
selected the SRES A1B scenario, which represents a
‘‘business as usual’’ future (Intergovernmental Panel
on Climate Change 2007) and is commonly used in
predictive distribution modeling studies. We chose
one future time step—the year 2030—that represents
a time both far enough in the future to allow for
management action and close enough to the current
year to be meaningful for managers. We obtained
monthly average temperature and daily total precip-
itation grids for six GCMs and clipped grids to the
study area. We converted daily precipitation into
monthly precipitation by multiplying daily totals by
the number of days in each month. We then derived
seasonal and annual variables from monthly variables.
Sagebrush distribution modeling: data analysis
We used the Maxent method for modeling sagebrush
bioclimatic envelopes under future climate scenarios.
Maxent has recently been applied to bioclimatic
envelope modeling and is particularly useful in situa-
tions where only presence data are available (Pearson
et al. 2007; Raes and ter Steege 2007). Mathematical
explanations for the method by which Maxent
produces species distribution models, along with
testing and validation of the approach, are found in
Phillips et al. (2006). We chose Maxent as the analysis
method because it is robust even with the inclusion of
variables that are collinear (Evangelista et al. 2009).
We developed a layer of 10,000 background points
to describe the suite of possible combinations of
environmental variables within the study area (fol-
lowing Phillips et al. 2006). These background points
aided model building by providing a backdrop against
which the environmental conditions associated with
presence point locations were evaluated. To test the
ability of the model to predict an independent data
set, we split the data set into two parts. We used 75%
of the data to train the model and 25% of the data to
test the model. We then used the value for the area
under the receiver operating curve (AUC) for the test
data set to determine how well the model would
predict species distributions by comparing the model
AUC value for the test data to the AUC value for a set
of null models (methods described below).
Maxent allows the user to define the method by
which the program fits the environmental layers (e.g.,
the climate layers described above) to constrain the
probability distribution. The program has an ‘‘auto-
features’’ option, whereby the user does not limit the
fitting of the variables to one particular type of
feature (e.g., linear, quadratic, hinge, threshold,
product), but instead allows all types of features to
be used. Previous studies suggest that overfitting can
be a problem with large sample sizes (n [ 79) using
presence-only data and the auto-features option in
Maxent (Raes and ter Steege 2007). Therefore, we
ran the model using the following methods: (1) the
auto-features option; and (2) using only linear,
quadratic and hinge features. When using the auto-
features option, the AUC for the model was inflated
as compared with results when not using the auto-
features option, suggesting overfitting of the model
(Raes and ter Steege 2007). Therefore, we reported
the results of the model using only linear, quadratic
and hinge features, which serves as a more conser-
vative estimate of the distribution of sagebrush
habitat under current and future climate conditions.
We evaluated the model by comparing our results
against a null model. Because we used only presence
data to build the model, AUC values alone are not a
suitable method for validating the accuracy of the
model in differentiating between presences and
absences (Pearson et al. 2007; Raes and ter Steege
2007). Our first step was to test for an environmental
bias in our sampling locations, which we did by
building 100 distribution models of 973 and 1,160
random points within the study area (15,500 total
12 km2 cells). We then built another 100 distribution
models with 973 and 1,160 points (to match the
sample sizes for each species) within only the cells
that originally had sagebrush presences recorded. We
then compared the AUC values for the distribution
model built on the random points to the distribution
model based on the sample points drawn from our
sample cell locations, and the values were signifi-
cantly different (p \ 0.01). This result indicated that
we had an environmentally biased sample.
To ensure that we were comparing our environ-
mentally biased model to a null model that took into
account these environmental limitations, we created a
bias-corrected null model against which to test our
distribution model. We drew a random sample of
points from the distribution of our original sagebrush
GeoJournal
123
sample and repeated 100 times. This model is the
bias-corrected null model. We then compared species
distribution model AUC values to those AUC values
from the bias-corrected null model for each species.
We compared the AUC value from our model to the
frequency histogram for the bias-corrected null model
to determine if the distribution model AUC value fell
outside the 95% confidence interval for the random
model (Raes and ter Steege 2007).
West Nile virus spatial risk model
We developed West Nile virus transmission risk
models by combining information on temperature
thresholds for WNv transmission with predicted
future temperature data from GCMs (as described
above). We began by generating points in a regular
array every 0.125 degrees across the study area to
match the resolution of the GCM data, resulting in
4,690 data points. We used HydroGET, a web service
client for ArcGIS, to download daily temperature
minima and maxima at each point from the DAY-
MET spatially interpolated climate dataset (Thornton
et al. 1997) for the period January 1, 1980 through
December 31, 2003. These dates represent the full
extent of the DAYMET database.
Because the GCMs only provide average monthly
temperatures rather than the daily temperature max-
ima and minima needed for the degree-day analysis
of WNv transmission, we derived the future maxi-
mum and minimum temperatures as follows. First, we
reduced the historical temperature data to 24-year
mean maxima and minima for each month. We then
used these values to calculate median monthly
temperatures, which were compared to average
monthly temperatures predicted by the GCMs. We
calculated monthly maxima and minima for the GCM
data by applying the difference between the extreme
temperatures and the median temperatures of the
historical data to the GCM data. For example, if
historical July maximum and minimum temperatures
were 30 and 16�C, respectively, with a median
temperature of 23�C, the corresponding maximum
and minimum temperatures for the same point in the
GCM was found by adding and subtracting 7�C to the
GCM average temperature.
We assessed the risk of WNv transmission using a
degree-day model that uses historical and future daily
maximum and minimum temperature (Zou et al.
2007). Due to data restrictions from the GCMs, every
day of the month was assigned the same maximum
and minimum temperatures. The model parameters
most appropriate for the study area were calculated
following Konrad et al. (2009) by spatially and
temporally comparing sage-grouse deaths from WNv
in northeastern Wyoming and south-central Montana
with local temperatures during the days preceding the
birds’ deaths. We assumed a 12-day vector feeding
period that equates to the sum of three four-day
gonotrophic cycles (Reisen et al. 1993) and a
minimum amplification threshold temperature of
14.3�C (Reisen et al. 2006; Zou et al. 2007). These
values are appropriate for the mosquito Culex tarsa-
lis, the primary arthropod vector of WNv in western
sagebrush habitats (Turell et al. 2005). The sage-
grouse data resulted in an estimate of 82 degree-days
(DD) to complete the mosquito’s extrinsic incubation
period (EIP). This estimate is similar to the 76 DD
calculated by comparison of WNv-killed crows and
degree-day temperature in California (Konrad et al.
2009). The estimate of 82 DD fits the local WNv
genotype and mosquito population as of 2006, but it
should be noted that the WNv genotype has already
changed since its introduction to the continental US
in 1999 (Davis et al. 2005), and there is a possibility
that future changes in the virus genotype or in the
local mosquito species will have an unpredictable
effect on virus transmission risk.
If the temperature over the course of the 12-day
vector feeding period exceeds 82 DD, then WNv
transmission is considered possible. Each grid cell
was evaluated for each day of the year for both the
historical and future temperatures. Data from the
summer months (when both mosquitoes are active
and warmer temperatures allow WNv transmission)
are presented in this study.
Regional assessment model
To develop the regional assessment model, we
reclassified cells into seven categories based on
predicted future sagebrush distribution. We aggre-
gated the distribution of the two species (from the
maps in Fig. 2) by using the least presence threshold
(Pearson et al. 2007) to distinguish between presence
and absence. The least presence threshold requires
calculation of the lowest predicted value associated
with any presence point on the map; all values above
GeoJournal
123

this threshold are classified as presences and values
below this threshold are classified as absences. We
then aggregated the results for each species, such that
presence of either species resulted in presence of
sagebrush for the entire cell. For WNv risk, we used a
composite of risk across all three summer months and
again reclassified cells as either at risk or not at risk
over the three-month period. We created management
Fig. 2 a Models of current
and future predicted
climatically suitable
conditions for silver
sagebrush in 2030 using the
Maxent modeling method,
where black represents a
probability of occurrence of
1.0 and white represents a
probability of occurrence of
0.0, on a continuous scale of
0.0–1.0. Spatial resolution
is 12 km. Model order is as
follows: a current; b CCC
model; c CSIRO model;
d GFDL model; e GISS
model; f NCAR model;
g UKMO model. b Models
of current and future
predicted climatically
suitable conditions for
Wyoming big sagebrush in
2030 using the Maxent
modeling method, where
black represents a
probability of occurrence of
1.0 and white represents a
probability of occurrence of
0.0, on a continuous scale of
0.0–1.0. Spatial resolution
is 12 km. Model order is as
follows: a current; b CCC
model; c CSIRO model;
d GFDL model; e GISS
model; f NCAR model;
g UKMO model
GeoJournal
123
recommendations for each cell based on predicted
future impacts of climate change on sagebrush and
West Nile virus transmission risk. We developed this
assessment only for Montana and Wyoming because
we did not have WNv risk data for North and South
Dakota.
Results
Sagebrush distribution modeling: trends
and mapping
The species distribution models show a shift in the
location of optimal bioclimatic conditions for sage-
brush across the study area under the various future
climate scenarios (Fig. 2). Summer (June–August)
precipitation, and July precipitation in particular, was
the variable most likely to influence the bioclimatic
envelope for both species of sagebrush (Tables 1, 2).
Silver sagebrush had the highest probability of occur-
rence in areas that receive between 100–150 mm of
summer precipitation and between 35–50 mm in July,
while Wyoming big sagebrush had the highest prob-
ability of occurrence in areas that receive\100 mm of
precipitation in the summer and 15–40 mm in July.
Models that predicted increases in precipitation,
especially during the summer (e.g., CSIRO, NCAR),
showed decreases in sagebrush by approximately 6%.
The remaining models, which showed decreases in
precipitation, showed overall stable to slight increases
in sagebrush habitat (approximately 3–5%, except for
CSIRO, which was an outlier at 21%).
All six models for silver sagebrush (Fig. 2a)
showed a high probability of suitable bioclimatic
conditions for sagebrush in some portion of the
southwestern corner of Wyoming, and three of the
models showed a high probability of suitable condi-
tions in north-central Montana. For Wyoming big
sagebrush (Fig. 2b), results were similar, but more
dramatic. All six models showed suitable conditions
in southwestern Wyoming, with three of the six
models showing almost no suitable conditions outside
of Wyoming. The remaining three models—CCC,
GFDL and UKMO—showed suitable conditions in
some areas of north-central Montana. Changes in the
eastern part of the study area varied among models
and were present in only one model (GFDL) for
Wyoming big sagebrush (Fig. 2b). Three models—
CCC, GFDL and UKMO—showed climatic condi-
tions suitable for silver sagebrush in eastern South
Dakota (Fig. 2a).
Species distribution modeling: model evaluation
We evaluated the ability of the model to differentiate
between presences and pseudo-absences by compar-
ing the model AUC results to the bias-corrected null
model AUC results. The silver sagebrush model had a
training AUC of 0.942 and a testing AUC of 0.930,
and the Wyoming big sagebrush model had a training
AUC of 0.943 and a testing AUC of 0.935, both of
which exceeded the 95% confidence interval cutoff
for the bias-corrected null model. These results
indicate that the sagebrush distribution models were
significantly different from random and were able to
discriminate between true presences and absences of
sagebrush under current climatic conditions. We
assume that this discriminatory ability holds for
future climate scenarios.
West Nile virus spatial risk model
The results of the WNv transmission risk model
showed an overall trend toward increasing transmis-
sion risk throughout the study area during peak
transmission season (June–August). Five of the six
models (all except CSIRO) showed increases in
transmission risk in July, and four of the six models
showed increased transmission risk in August (all
except CSIRO and NCAR) (Table 4, Fig. 3).
Table 4 Percent change in area of transmission risk for West
Nile virus in 2030 by GCM and month, compared to
1980–2003 average
Model June July August
CCC 0.14 23.5 2.86
CSIRO 0 -30.19 -24.84
GFDL 56.1 57.87 51.79
GISS 0.02 16.83 22.43
NCAR 13.5 23.86 -4.99
UKMO 0.17 32.43 36.1
This model is based on data that suggest transmission after 82
degree days (Konrad et al. 2009) and was calculated using
change in number of 12-km pixels between the two time
frames
GeoJournal
123
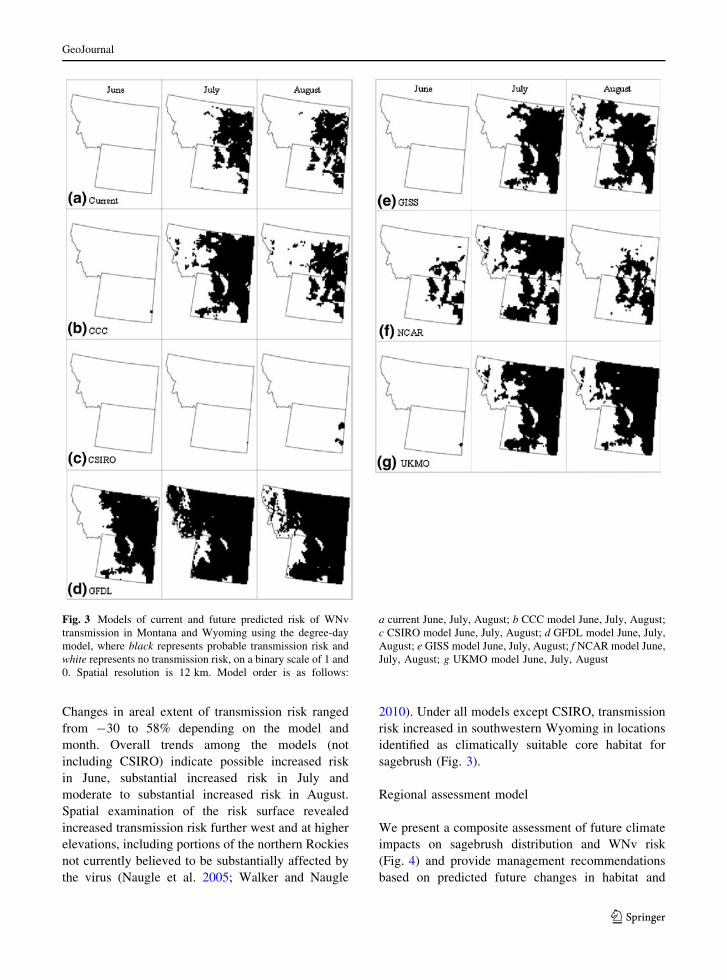
Changes in areal extent of transmission risk ranged
from -30 to 58% depending on the model and
month. Overall trends among the models (not
including CSIRO) indicate possible increased risk
in June, substantial increased risk in July and
moderate to substantial increased risk in August.
Spatial examination of the risk surface revealed
increased transmission risk further west and at higher
elevations, including portions of the northern Rockies
not currently believed to be substantially affected by
the virus (Naugle et al. 2005; Walker and Naugle
2010). Under all models except CSIRO, transmission
risk increased in southwestern Wyoming in locations
identified as climatically suitable core habitat for
sagebrush (Fig. 3).
Regional assessment model
We present a composite assessment of future climate
impacts on sagebrush distribution and WNv risk
(Fig. 4) and provide management recommendations
based on predicted future changes in habitat and
Fig. 3 Models of current and future predicted risk of WNv
transmission in Montana and Wyoming using the degree-day
model, where black represents probable transmission risk and
white represents no transmission risk, on a binary scale of 1 and
0. Spatial resolution is 12 km. Model order is as follows:
a current June, July, August; b CCC model June, July, August;
c CSIRO model June, July, August; d GFDL model June, July,
August; e GISS model June, July, August; f NCAR model June,
July, August; g UKMO model June, July, August
GeoJournal
123
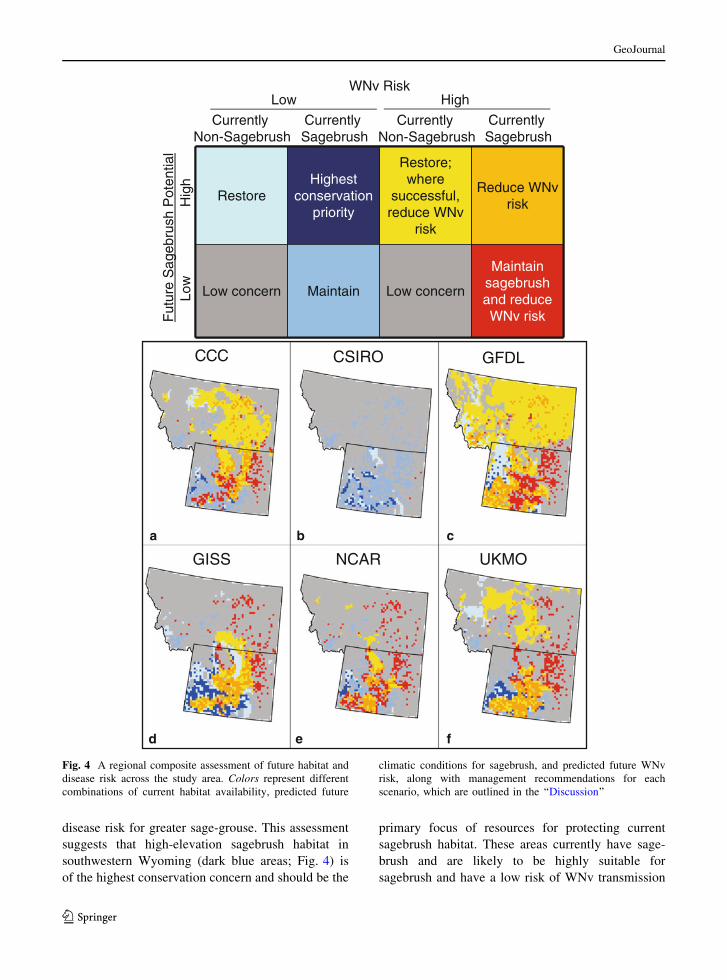
disease risk for greater sage-grouse. This assessment
suggests that high-elevation sagebrush habitat in
southwestern Wyoming (dark blue areas; Fig. 4) is
of the highest conservation concern and should be the
primary focus of resources for protecting current
sagebrush habitat. These areas currently have sage-
brush and are likely to be highly suitable for
sagebrush and have a low risk of WNv transmission
RestoreHighest
conservationpriority
Restore;where
successful,reduce WNv
risk
Reduce WNvrisk
Low concern Maintain Low concern
Maintainsagebrushand reduceWNv risk
RestoreHighest
conservationpriority
Restore;where
successful,reduce WNv
risk
Reduce WNvrisk
Low concern Maintain Low concern
Maintainsagebrushand reduceWNv riskF
utur
eS
ageb
rush
Pot
entia
l
WNv Risk
CurrentlyNon-Sagebrush
CurrentlySagebrush
Low High
Low
Hig
h
CurrentlyNon-Sagebrush
CurrentlySagebrush
a b c
fed
CCC CSIRO GFDL
GISS NCAR UKMO
Fig. 4 A regional composite assessment of future habitat and
disease risk across the study area. Colors represent different
combinations of current habitat availability, predicted future
climatic conditions for sagebrush, and predicted future WNv
risk, along with management recommendations for each
scenario, which are outlined in the ‘‘Discussion’’
GeoJournal
123
in the future. Neighboring areas of southwestern
Wyoming and Montana are good candidates for
maintaining current sagebrush populations and lim-
iting competing threats (e.g., energy development)
into the future (medium blue areas; Fig. 4). Restora-
tion projects have the highest potential for success in
western Wyoming in most models and in north-
central and northwestern Montana in some models.
Some portions of these areas do not currently have
robust sagebrush habitat but likely will have climatic
conditions necessary for sagebrush establishment in
the future (light blue areas; Fig. 4). Management
practices that reduce transmission of West Nile virus
will become increasingly important throughout most
of Wyoming and eastern Montana. These areas have
and will continue to have suitable conditions for
sagebrush, but also have a high risk of WNv
transmission (orange areas, Fig. 4). Restoration pro-
jects could be beneficial in the Bighorn area on the
Montana-Wyoming border and in much of eastern
Montana that currently lacks sagebrush. Areas where
restoration is successful should be managed to reduce
WNv transmission (yellow areas; Fig. 4). In eastern
Wyoming and portions of southwestern Wyoming,
decreasing WNv transmission should be a priority,
with restoration of degraded habitat occurring where
possible (red areas; Fig. 4).
Discussion
Predictive models of climatically suitable habitat for
sagebrush and high-risk areas for WNv transmission
in the face of predicted future climate change provide
important information to aid in the conservation of
imperiled, sagebrush-dependent species, such as
greater sage-grouse. Our results suggest there will
be changes in the location of climatically suitable
conditions for sagebrush by 2030, with key areas
located in southwestern Wyoming, north-central
Montana and possibly northeastern Wyoming.
One method for qualitatively evaluating the results
of species distribution models is to examine if the
important predictor variables coincide with known
drivers of current and historic distributions of the
species. The results of this study support known
historic distributions of sagebrush in relation to
climate, and paleoecological data document the
occurrence of sagebrush in cold, dry regions. The
presence of sagebrush pollen is characteristic of arid
landscapes that are climatically dominated by low
precipitation and low winter temperatures and is
representative of an arid, ‘‘winter-cold desert’’ land-
scape (Wells 1970). Sagebrush pollen was shown to
increase during times of ‘‘maximum aridity’’, which
occurred from 8,000 to 4,000 years BP in the prairie
regions of the northern plains of the US (Clark et al.
2001). Recent studies on the relationship between
semi-arid shrubs and precipitation show that summer
drought favors deep-rooted shrubs over more shal-
low-rooted grasses and forbs (Schwinning et al.
2005). It should be noted that species distribution
models for cheatgrass have suggested that decreasing
summer precipitation may lead to increased suitable
climatic habitat for cheatgrass by creating a compet-
itive advantage over native shrubs and grasses whose
growth rates are tied to summer moisture availability
(Bradley 2009). However, our study suggests that,
within certain summer precipitation ranges, suitable
climatic habitat for sagebrush may increase.
The results of our WNv transmission risk model
suggest that the virus may spread to previously
uninfected areas at high elevations in the western
portion of our study area. The westward spread of
WNv may also be facilitated by coalbed methane
development and the associated standing water that
provides habitat for mosquitoes (Doherty 2007; Zou
et al. 2007). This threat may increase in the future
because coalbed methane drilling locations are found
at higher elevations in southwestern Wyoming. The
majority of the models showed slight to substantial
increases in transmission risk early in the transmis-
sion season (June and July), suggesting that earlier
infections and deaths due to WNv in greater sage-
grouse are likely.
Although we used statistically downscaled climate
models to develop these species distribution models,
the feasibility of making management decisions on
the ground using 12 km resolution data should be
acknowledged. For instance, while the results of our
sagebrush models agree with both historic and current
distribution data, models based on precipitation must
be interpreted with caution. Future predicted values
of precipitation, which drive the sagebrush biocli-
matic envelope model, are generally considered less
accurate than future predicted temperature values
(Canadian Institute for Climate Studies 2010). Sci-
entific consensus abounds on predicted increases in
GeoJournal
123
future temperature and, therefore, the results of our
temperature-driven WNv model may be interpreted
with more certainty. There are several factors that
contribute to virus transmission, including mosquito
abundance, virus reservoirs, amplifying hosts and
larval habitat; however, we use temperature as a
critical and limiting factor as a proxy for virus
transmission risk. One of the six future climate
scenarios (CSIRO) showed decreases in transmission
risk because average summer monthly temperatures
were predicted to decrease. This result is somewhat
counterintuitive, and may be due to either error in the
predictive capability of the original GCM or error
associated with downscaling the GCM results to
12 km resolution (Maurer 2007). In addition, making
decisions on a local scale using 12 km resolution data
can be challenging, as predictions in one particular
cell of the model may not translate to what is
occurring on the ground. We acknowledge these
limitations and suggest that the results be applied in a
predictive, regional context and that monitoring
trends in both species distributions and West Nile
virus occurrence across the landscape will help to
inform on-the-ground decision making on shorter
time scales and smaller spatial scales.
Sagebrush is a long-lived plant that may persist on
the landscape for up to a century following the onset
of unsuitable climatic conditions (Howard 1999).
Thus, decreases in suitable climatic habitat, as shown
in this study, do not necessarily indicate the elimi-
nation of individuals from the landscape, but rather
climatic conditions that are less conducive to the
long-term survival and reproduction of the species.
Alternatively, predicted species occurrence does not
necessarily equate to species persistence on the
landscape. The sagebrush community may have been
increasing or decreasing during the initial collection
of location data, which could lead to false negative or
false positive predictions, respectively (Wilson et al.
2005). Moreover, in the face of increasingly unsuit-
able climatic conditions, disturbance, such as fire or
mechanical destruction of sagebrush, could lead to a
situation where sagebrush recovery is highly unlikely
following the disturbance event. In addition, biocli-
matic envelope models ideally are built using the
entire distribution of the species; however, in this
case, we were particularly interested in understanding
impacts in a specific area of the distribution and, thus,
focused our efforts there. We acknowledge that this
decision limits our ability to draw inference outside
of our study area, as not all of the climatic conditions
under which sagebrush has established are repre-
sented in our sample.
Cumulative impacts of predicted climate change
on sagebrush habitat and West Nile virus transmis-
sion are likely to reduce suitable sage-grouse habitat
in the northern Great Plains and northern Rockies.
However, we can identify two conservation priorities
for greater sage-grouse. The spatial representations of
the ‘‘best available’’ habitat for the sage-grouse, both
currently and twenty years in the future, indicate that
areas in southwestern Wyoming will serve as impor-
tant core refugia for sage-grouse populations, due to
persistent sagebrush habitat, but will also experience
elevated risk for West Nile virus transmission. Areas
in north-central Montana are considered important
fringe populations because they are located near the
northern extent of the bird’s range and currently
contain intact sagebrush habitat. Dispersal pathways
(e.g., intact sagebrush habitat) that connect these
populations and the core population in southwestern
Wyoming should be protected. Peripheral sage-
grouse populations are more likely to be extirpated
than populations that inhabit core areas, and these
populations may contain location-specific adaptive
capacity that could contribute genetic diversity to the
species as a whole (Fig. 4; Lesica and Allendorf
1995; Channell and Lomolino 2000; Guo et al. 2005;
Aldridge et al. 2008).
Our results support a regional-scale approach to
conserving greater sage-grouse in the face of numer-
ous threats to their long-term viability. Implementing
measures to secure sage-grouse habitat in those areas
where our models predict the highest probability of
persistence will allow for the most efficient and
effective use of limited conservation resources
(Pressey et al. 2007). Greater sage-grouse in some
parts of our study area migrate long distances
([60 km) between seasonal habitats (Connelly et al.
2004; Tack 2006). Thus, protecting not only those
core areas with the highest probability of persistence,
but also those areas that will maintain connectivity
between core areas will be an important management
strategy for this species (Tack 2006).
Allowing wildlife to adapt to climate change is
often spoken of in terms of resilience (Millar et al.
2007). Successful conservation in the face of climate
change, which could exacerbate habitat loss and
GeoJournal
123

increase disease risk, will require reducing other
stressors on the population. We recommend increased
emphasis on conservation and protection of areas
with a high probability of suitable sagebrush habitat
in the future, including both core and peripheral
areas. Within those areas, proactive management of
anthropogenic water sources will be required to
reduce the spread of mosquitos that transmit West
Nile virus. In addition, restoring converted areas back
to native sagebrush-steppe and preventing wide-
spread loss of sagebrush habitat to new development
(energy, urban, residential, agricultural, etc.), partic-
ularly along the range periphery (Aldridge et al.
2008), will be important. We may also promote long-
term resilience to change by maintaining habitat
within dispersal corridors between fringe and core
populations. Finally, to determine the effectiveness of
these measures, regional monitoring programs should
be implemented that can identify when thresholds are
about to or already have been surpassed in order to
prompt appropriate conservation or regulatory action.
Acknowledgments Funding for the sagebrush distribution
modeling was provided through a grant from Hewlett Packard
to the World Wildlife Fund. Funding for the West Nile virus
transmission risk modeling was provided by USDA specific
cooperative agreement #5410-32000-014-15. We gratefully
acknowledge the assistance of Karen Short, who provided
LANDFIRE sagebrush data points. We thank the climate
modeling groups that developed the GCMs for contributing
their work through the WCRP CMIP3 for public use in
ecosystem impacts research.
References
Aldridge, C. L., & Boyce, M. S. (2008). Accounting for fitness:
Combining survival and selection when assessing wild-
life-habitat relationships. Israel Journal of Ecology andEvolution, 54, 389–419.
Aldridge, C. L., Nielsen, S. E., Beyer, H. L., Boyce, M. S.,
Connelly, J. W., Knick, S. T., et al. (2008). Range-wide
patterns of greater sage-grouse persistence. Diversity andDistributions, 14, 983–994.
Baker, W. L. (2006). Fire and restoration of sagebrush eco-
systems. Wildlife Society Bulletin, 34, 177–185.
Beale, C. M., Lennon, J. J., & Gimona, A. (2008). Opening the
climate envelope reveals no macroscale associations with
climate in European birds. Proceedings of the NationalAcademy of Sciences, 105, 14908–14912.
Bradley, B. A. (2009). Regional analysis of the impacts of
climate change on cheatgrass invasion shows potential
risk and opportunity. Global Change Biology, 15,
196–208.
Canadian Institute for Climate Studies. (2010). About predic-
tions.
http://www.cics.uvic.ca/index.cgi?/Products/
About_CICS_Predictions. Accessed 5 February 2010.
Channell, R., & Lomolino, M. V. (2000). Dynamic biogeog-
raphy and conservation of endangered species. Nature,403, 84–86.
Clark, J. S., Grimm, E. C., Lynch, J., & Mueller, P. G. (2001).
Effects of Holocene climate change on the C4 grassland/
woodland boundary in the northern plains, USA. Ecology,82, 620–636.
Connelly, J. W., Knick, S. T., Schroeder, M. A., Stiver, S. J.
(2004). Conservation assessment of greater sage-grouse
and sagebrush habitats. Western Association of Fish and
Wildlife Agencies. Unpublished Report. Cheyenne,
Wyoming.
Daly, C., Taylor, G. H., Gibson, W. P. (1997). The PRISM
approach to mapping precipitation and temperature. 10thConference on applied climatology, Reno, NV, American
Meteorological Society, 10–12.
Davis, C. T., Ebel, G. D., Lanciotti, R. S., Brault, A. C.,
Guzman, H., Siirin, M., et al. (2005). Phylogenetic anal-
ysis of North American West Nile virus isolates,
2001–2004: Evidence for the emergence of a dominant
genotype. Virology, 342, 252–265.
Doherty, M. K. (2007). Mosquito populations in the Powder
River Basin, Wyoming: A comparison of natural, agri-
cultural and effluent coal bed natural gas aquatic habitats.
Master’s thesis, Montana State University, Bozeman, MT,
95 pp.
Doherty, K. E., Naugle, D. E., Walker, B. L., & Graham, J. M.
(2008). Greater sage-grouse winter habitat selection and
energy development. Journal of Wildlife Management, 72,
187–195.
Evangelista, P. H., Stohlgren, T. J., Morisette, J. T., & Kumar,
S. (2009). Mapping invasive tamarisk (Tamarix): a com-
parison of single-scene and time-series analyses of
remotely sensed data. Remote Sensing, 1, 519–533.
Ferrier, S., Powell, G. V. N., Richardson, K. S., Manion, G.,
Overton, J. M., Allnutt, T. F., et al. (2004). Mapping more
of terrestrial biodiversity for global conservation assess-
ment. BioScience, 54, 1101–1109.
Guisan, A., & Thuiller, W. (2005). Predicting species distri-
bution: offering more than simple habitat models. EcologyLetters, 8, 993–1009.
Guo, Q., Taper, M., Schoenberger, M., & Brandle, J. (2005).
Spatial-temporal population dynamics across species
range: From centre to margin. Oikos, 108, 47–57.
Holloran, M. J., Heath, B. J., Lyon, A. G., Slater, S. J., Kuipers,
J. L., & Anderson, S. H. (2005). Greater sage-grouse
nesting habitat selection and success in Wyoming. Jour-nal of Wildlife Management, 69, 349–638.
Howard, J. L. (1999). Artemisia tridentata subsp. wyoming-ensis. In: Fire Effects Information System, [online]. US
Department of Agriculture, Forest Service, Rocky
Mountain Research Station, Fire Sciences Laboratory
(Producer). http://www.fs.fed.us/database/feis/. Accessed
18 September 2008.
Intergovernmental Panel on Climate Change (IPCC). (2007).
Climate change 2007: the physical science basis. Con-
tribution of Working Group I to the Fourth Assessment
GeoJournal
123

Report of the Intergovernmental Panel on Climate
Change. http://ipcc-wg1.ucar.edu/wg1/wg1-report.html.
Accessed 31 December 2008.
Knick, S. T., Dobkin, D. S., Rotenberry, J. T., Schroeder, M.
A., Vander Haegen, W. M., & van Riper, C., I. I. I. (2003).
Teetering on the edge or too late? Conservation and
research issues for avifauna of sagebrush habitats. Con-dor, 105, 611–634.
Konrad, S. K., Miller, S. N., Reeves, W. K., & Tietze, N. S.
(2009). Spatially explicit West Nile virus risk modeling in
Santa Clara County, CA. Vector-Borne and ZoonoticDiseases, 9, 267–274.
LANDFIRE Program. (2009). LANDFIRE homepage.
http://www.landfire.gov/. Accessed 20 July 2009.
Lesica, P., & Allendorf, F. W. (1995). When are peripheral
populations valuable for conservation? ConservationBiology, 9, 753–760.
Manville, A.M. II. (2004). Prairie grouse leks and wind tur-bines: U.S. Fish and Wildlife Service justification for a 5-
mile buffer from leks; additional grassland songbirdrecommendations. Division of Migratory Bird Manage-
ment, USFWS, Arlington, VA, peer-reviewed briefing
paper. 17 pp.
Margules, C. R., & Pressey, R. L. (2000). Systematic conser-
vation planning. Nature, 405, 243–253.
Martı́nez-Meyer, E., Peterson, A. T., & Hargrove, W. W.
(2004). Ecological niches as Stable distributional con-
straints on mammal species, with implications for Pleis-
tocene extinctions and climate change projections for
biodiversity. Global Ecology and Biogeography, 13,
305–314.
Maurer, E. P. (2007). Uncertainty in hydrologic impacts of
climate change in the Sierra Nevada, California under two
emissions scenarios. Climatic Change, 82, 309–325.
Meinke, C. W., Knick, S. T., & Pyke, D. A. (2008). A spatial
model to prioritize sagebrush landscapes in the Inter-
mountain West (U.S.A.) for restoration. RestorationEcology, Published online 28 Jun 2008.
Millar, C. I., Stephenson, N. L., & Stephens, S. L. (2007).
Climate change and forests of the future: Managing in the
face of uncertainty. Ecological Applications, 17,
2145–2151.
Motha, R. P., & Baier, W. (2005). Impacts of present and
future climate change and climate variability on agricul-
ture in the temperate regions: North America. ClimaticChange, 70, 137–164.
Moynahan, B. J., LIndber, M. S., & Thomas, J. W. (2006).
Factors contributing to process variance in annual survival
of female greater sage-grouse in Montana. EcologicalApplications, 16, 1529–1538.
Naugle, D. E., Aldridge, C. L., Walker, B. L., Cornish, T. E.,
Moynahan, B. J., Holloran, M. J., et al. (2004). West Nile
virus: Pending crisis for greater sage-grouse. EcologyLetters, 7, 704–713.
Naugle, D. E., Aldridge, C. L., Walker, B. L., Doherty, K. E.,
Matchett, M. R., McIntosh, J., et al. (2005). West Nile
virus and sage-grouse: What more have we learned?
Wildlife Society Bulletin, 33, 616–623.
Naugle, D. E., Doherty, K. E., Walker, B. L., Holloran, M. J.,
Copeland, H. E. (2010). Greater sage-grouse and energy
development in western North America. Studies in AvianBiology (in press).
Pearson, R. G., & Dawson, T. P. (2003). Predicting the impacts
of climate change on the distribution of species: Are area
bioclimatic envelope models useful? Global Ecology andBiogeography, 12, 361–371.
Pearson, R. G., Raxworthy, C. J., Nakamura, N., & Peterson,
A. T. (2007). Predicting species distributions from small
numbers of occurrence records: A test case using cryptic
geckos in Madagascar. Journal of Biogeography, 34,
102–117.
Phillips, S. J., Anderson, R. P., & Schapire, R. E. (2006).
Maximum entropy modelling of species geographic dis-
tributions. Ecological Modelling, 190, 231–259.
Pressey, R. L., Cabeza, M., Watts, M. E., Cowling, R. M., &
Wilson, K. A. (2007). Conservation planning in a
changing world. Trends in Ecology & Evolution, 22,
583–592.
Raes, N., & ter Steege, H. (2007). A null-model for signifi-
cance testing of presence-only species distribution mod-
els. Ecography, 30, 727–736.
Reisen, W. K., Fang, Y., & Martı́nez, V. M. (2006). Effects of
temperature on the transmission of West Nile virus by
Culex tarsalis (Diptera: Culicidae). Journal of MedicalEntomology, 43, 309–317.
Reisen, W. K., Meyer, R. P., Presser, S. B., & Hardy, J. L.
(1993). Effect of temperature on the transmission of
western equine encephalomyelitis and St. Louis enceph-
alitis viruses by Culex tarsalis (Diptera: Culicidae).
Journal of Medical Entomology, 30, 151–160.
Santa Clara University. (2008). Statistically downscaled WCRPCMIP3climate projections. Available online at: [http://
gdo-dcp.ucllnl.org/downscaled_cmip3_projections/dcp
Interface.html]. Accessed on 20 July 2009.
Schrag, A. M., Bunn, A. G., & Graumlich, L. J. (2008).
Influence of bioclimatic variables on tree-line conifer
distribution in the Greater Yellowstone Ecosystem:
Implications for species of conservation concern. Journalof Biogeography, 35, 698–710.
Schroeder, M. A., Aldridge, C. L., Apa, A. D., Bohne, J. R.,
Braun, C. E., Bunnell, S. D., et al. (2004). Distribution of
sage-grouse in North America. Condor, 106, 363–376.
Schwinning, S., Starr, B. I., & Ehleringer, J. R. (2005). Sum-
mer and winter drought in a cold desert ecosystem (Col-
orado Plateau) part I: Effects on soil water and plant water
uptake. Journal of Arid Environments, 60, 547–566.
Stubbs, M. (2007). Land conversion in the Northern Plains.Congressional Research Service Report for Congress,
Order Code RL33950. Published on 5 Apr 2007.
Tack, J. (2006). Sage-grouse and the human footprint: Impli-
cations for conservation of small and declining popula-
tions. Master’s thesis, University of Montana, Missoula,
106 pp.
Thornton, P. E., Running, S. W., & White, M. A. (1997).
Generating surfaces of daily meteorological variables over
large regions of complex terrain. Journal of Hydrology,190, 214–251.
Turell, M. J., Dohm, D. J., Sardelis, M. R., O’Guinn, M. L.,
Andreadis, T. G., & Blow, J. A. (2005). An update on the
potential of North American mosquitoes (Diptera:
GeoJournal
123
Culicidae) to transmit West Nile virus. Journal of MedicalEntomology, 42, 57–62.
Walker, B. L. & Naugle, D. E. (2010). West Nile virus ecology
in sagebrush habitat and impacts on greater sage-grouse
populations. Studies in Avian Biology (in press).
Walker, B. L., Naugle, D. E., & Doherty, K. E. (2007a).
Greater sage-grouse population response to energy
development and habitat loss. Journal of Wildlife Man-agement, 71, 2644–2654.
Walker, B. L., Naugle, D. E., Doherty, K. E., & Cornish, T. E.
(2007b). West Nile virus and greater sage-grouse: Esti-
mating infection rate in a wild bird population. AvianDiseases, 51, 691–696.
Wells, P. V. (1970). Postglacial vegetational history of the
Great Plains. Science, 167, 1574–1582.
Westerling, A. L., Hidalgo, H. G., Cayan, D. R., & Swetnam,
T. W. (2006). Warming and earlier spring increase wes-
tern U.S. forest wildfire activity. Science, 313, 940–943.
Wilson, K. A., Westphal, M. I., Possingham, H. P., & Elith, J.
(2005). Sensitivity of conservation planning to different
approaches to using predicted species distribution data.
Biological Conservation, 122, 99–112.
Zou, L., Miller, S. N., & Schmidtmann, E. T. (2007). A GIS
tool to estimate West Nile virus risk based on a degree-
day model. Environmental Monitoring Assessment, 129,
413–420.
GeoJournal
123