climate change in the south west queensland...
TRANSCRIPT
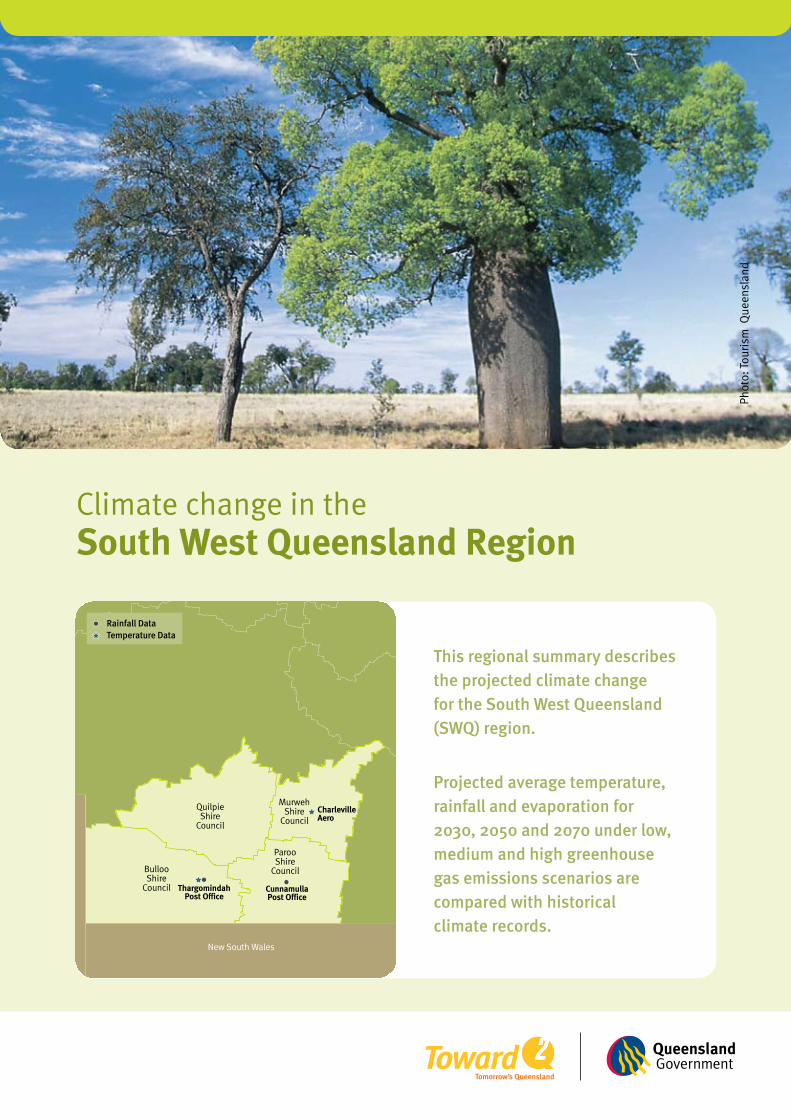
Climate change in the South West Queensland Region
This regional summary describes the projected climate change for the South West Queensland (SWQ) region.
Projected average temperature, rainfall and evaporation for 2030, 2050 and 2070 under low, medium and high greenhouse gas emissions scenarios are compared with historical climate records.
Rainfall DataTemperature Data
SWQ_Map
New South Wales
BullooShire
Council
QuilpieShire
Council
ParooShire
Council
MurwehShire
CouncilCharlevilleAero
ThargomindahPost Office
CunnamullaPost Office
Phot
o: T
ouris
m Q
ueen
slan
d
ClimateQ: toward a greener QueenslandSWQ2
Key findingsTemperature
Average annual temperature in the SWQ region has increased •by 0.8 °C over the last decade (from 21.6 °C to 22.4 °C).
Projections indicate an increase of up to 5.2 °C by 2070, leading •to annual temperatures well beyond those experienced over the last 50 years.
By 2070, Charleville may have over twice the number of days •over 35 °C (increasing from an average of 64 per year, to 130 per year by 2070) and Thargomindah may have more than 1.5 times the number of days over 35 °C (increasing from an average of 91 per year, to an average 147 per year by 2070).
RainfallAverage annual rainfall in the last decade fell nearly 16 per cent •compared to the previous 30 years. This is generally consistent with natural variability experienced over the last 110 years, which makes it difficult to detect any influence of climate change at this stage.
Models have projected a range of rainfall changes from an annual •increase of 20 per cent to a decrease of 38 per cent by 2070. The ‘best estimate’ of projected rainfall change shows a decrease under all emissions scenarios.
EvaporationProjections indicate annual potential evaporation could increase •3–15 per cent by 2070.
Extreme eventsMore intense and long-lived cyclones have a greater chance •of impacting on inland regions such as in SWQ, from the decay of cyclones into rain-bearing depressions, or the cyclones themselves tracking further inland.
A regional profile
Climate and landscapeThe SWQ region, one of the most remote areas in the state, has a semi-arid to arid climate, with summers being very hot while winters are generally warm and dry. Rainfall in the region is highly seasonal and irregular, with most rain falling during the summer (October–March) either as heavy thunderstorms or rain depressions.
DemographicsIn 2007, the region’s population was 8 172, and is projected to decline marginally to around 8 160 by 2026.(OESR, 2007; DIP, 2008)
Important industries of the regionMajor economic activities include oil, gas and gemstone (opal) extraction, beef, sheep and game meat processing, small areas of wheat cropping, and irrigated crops of dates, grapes and organic wheat (Warrego River system).
Approximately 30 per cent of the region’s population is employed in the agriculture, forestry and fishing industries. Pastoral production contributes as much as $162 million per annum.
Tourism and the retail trade are also major contributors to employment in the rural centres. Possible future industries are based on natural gas export and power generation.
Charleville (3 500) is the major business and service hub for South West Queensland.
(Extracted from the Draft South West Queensland Regional Plan)
Phot
o: T
ouris
m Q
ueen
slan
d
ClimateQ: toward a greener Queensland SWQ3
Understanding the climate and how it changesQueensland’s climate is naturally variable; however, climate change will lead to shifts beyond this natural variability. To assess the risk of human-induced climate change requires an understanding of the current climate using historical data and future climate scenarios. These future scenarios are prepared using data from Global Climate Models.
MethodHistorical climate dataHistorical climate data collected by the Bureau of Meteorology (BoM) were aggregated across the SWQ region. The fluctuations and trends in the observed data are presented including extremes in temperature and the frequency of cyclones.
Greenhouse emission scenariosThe World Meteorological Organization (WMO) and the United Nations established the Intergovernmental Panel on Climate Change (IPCC) in 1988. The IPCC assesses the latest scientific, technological and socio-economic literature on climate change.
To estimate the potential impacts of future climate change on Queensland, climate change projections were developed using the IPCC low (B1), medium (A1B) and high (A1FI) greenhouse gas emissions scenarios. The low-range scenario (B1) assumes a rapid shift to less fossil fuel intensive industries. The mid-range (A1B) scenario assumes a balanced use of different energy sources. The high (A1FI) scenario assumes continued dependence on fossil fuels.
Greenhouse gas emissions are currently tracking above the highest IPCC emissions scenario (A1FI). The low and medium scenarios are presented to show the potential benefits of action to reduce greenhouse gas emissions.
Climate change projectionsQueensland climate change projections were produced by the Commonwealth Scientific and Industrial Research Organisation (CSIRO) and the Bureau of Meteorology (BoM) based on the results from 23 Global Climate Models. Projections were provided for 2030, 2050 and 2070. However, as the climate can vary significantly from one year to the next, these projections show changes in average climate for three future 30-year periods centered on 2030, 2050 and 2070.
Current climate Temperature (BoM, 2008)Historical temperature records indicate the average temperature in the SWQ region has risen, with this increase accelerating over the last decade (1998–2007). The average annual temperature was 21.6 °C in the 30-year period from 1971–2000, which is a 0.1 °C increase on the 1961–1990 average. However, over the last decade it has risen by a further 0.8 °C, suggesting an accelerated rise in temperature.
Phot
o: T
ouris
m Q
ueen
slan
d
ClimateQ: toward a greener QueenslandSWQ4
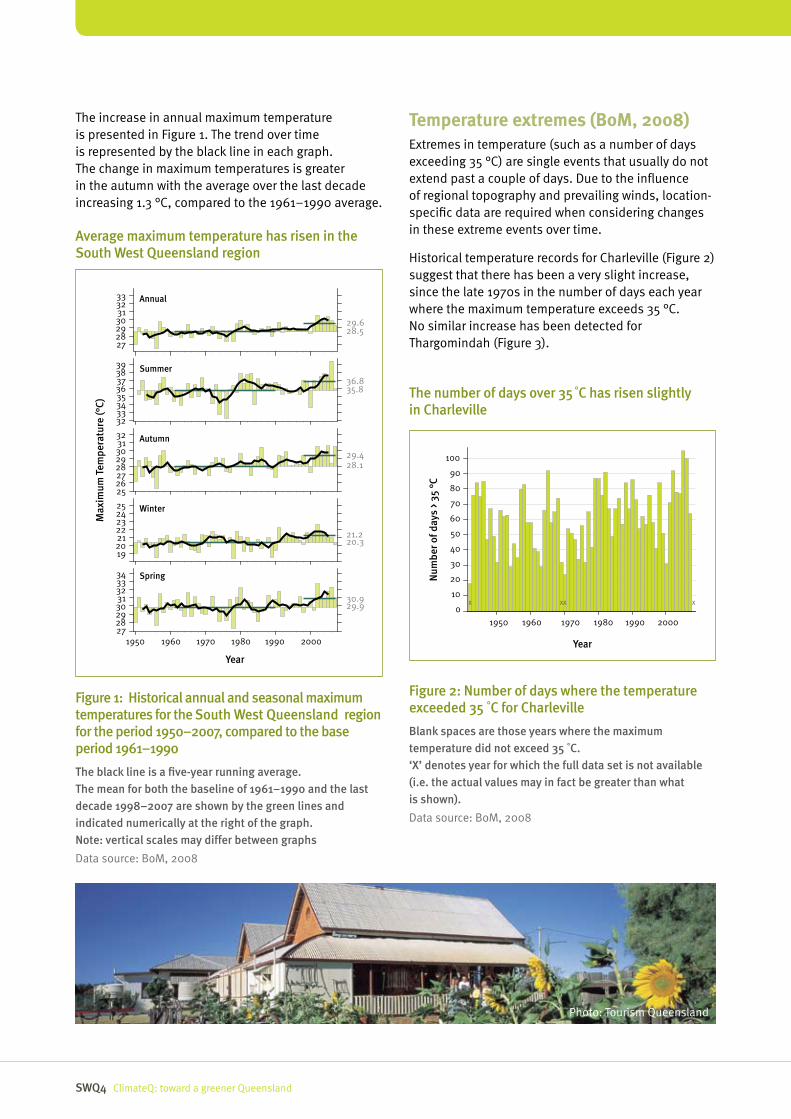
Temperature extremes (BoM, 2008)Extremes in temperature (such as a number of days exceeding 35 °C) are single events that usually do not extend past a couple of days. Due to the influence of regional topography and prevailing winds, location-specific data are required when considering changes in these extreme events over time.
Historical temperature records for Charleville (Figure 2) suggest that there has been a very slight increase, since the late 1970s in the number of days each year where the maximum temperature exceeds 35 °C. No similar increase has been detected for Thargomindah (Figure 3).
The increase in annual maximum temperature is presented in Figure 1. The trend over time is represented by the black line in each graph. The change in maximum temperatures is greater in the autumn with the average over the last decade increasing 1.3 °C, compared to the 1961–1990 average.
FIGURE RS_SWQ_1
27282930313233
3233343536373839
2526272829303132
19202122232425
2728293031323334
28.529.6
35.836.8
28.129.4
20.321.2
29.930.9
Max
imum
Tem
pera
ture
(°C)
Year
1950 1960 1970 1980 1990 2000
Annual
Summer
Autumn
Winter
Spring
Figure 1: Historical annual and seasonal maximum temperatures for the South West Queensland region for the period 1950–2007, compared to the base period 1961–1990
The black line is a five-year running average. The mean for both the baseline of 1961–1990 and the last decade 1998–2007 are shown by the green lines and indicated numerically at the right of the graph. Note: vertical scales may differ between graphs
Data source: BoM, 2008
Average maximum temperature has risen in the South West Queensland region
FIGURE RS_SWQ_2
Num
ber o
f day
s >
35 °
C
Year
0
10
20
30
40
50
60
70
80
90
100
1950 1960 1970 1980 1990 2000
Figure 2: Number of days where the temperature exceeded 35 ˚C for Charleville
Blank spaces are those years where the maximum temperature did not exceed 35 ˚C. ‘X’ denotes year for which the full data set is not available (i.e. the actual values may in fact be greater than what is shown).
Data source: BoM, 2008
The number of days over 35 ˚C has risen slightly in Charleville
Photo: Tourism Queensland
ClimateQ: toward a greener Queensland SWQ5
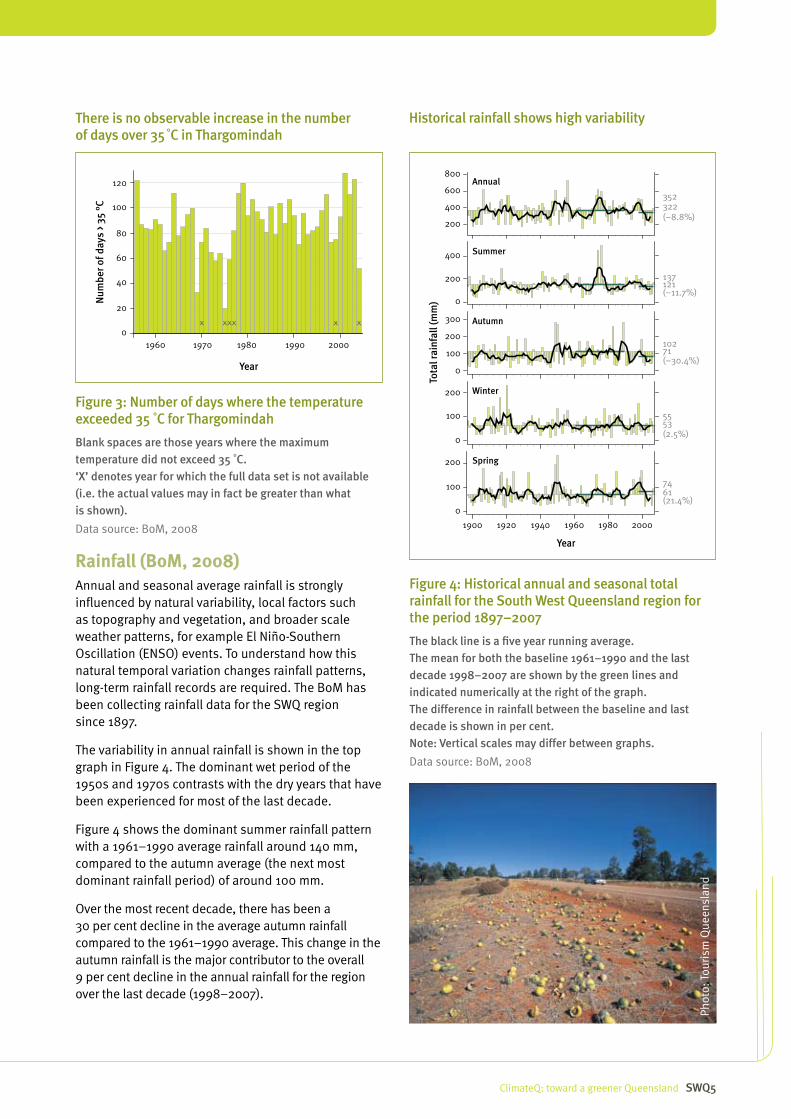
Rainfall (BoM, 2008)Annual and seasonal average rainfall is strongly influenced by natural variability, local factors such as topography and vegetation, and broader scale weather patterns, for example El Niño-Southern Oscillation (ENSO) events. To understand how this natural temporal variation changes rainfall patterns, long-term rainfall records are required. The BoM has been collecting rainfall data for the SWQ region since 1897.
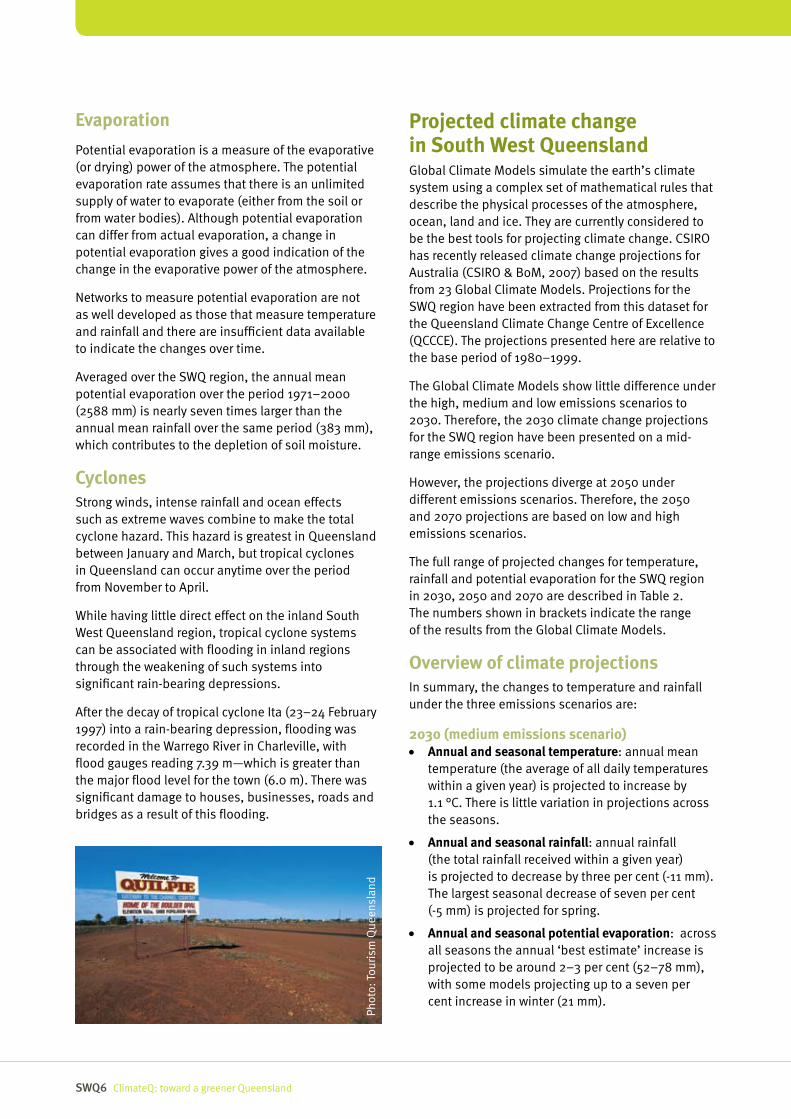
The variability in annual rainfall is shown in the top graph in Figure 4. The dominant wet period of the 1950s and 1970s contrasts with the dry years that have been experienced for most of the last decade.
Figure 4 shows the dominant summer rainfall pattern with a 1961–1990 average rainfall around 140 mm, compared to the autumn average (the next most dominant rainfall period) of around 100 mm.
Over the most recent decade, there has been a 30 per cent decline in the average autumn rainfall compared to the 1961–1990 average. This change in the autumn rainfall is the major contributor to the overall 9 per cent decline in the annual rainfall for the region over the last decade (1998–2007).
FIGURE RS_SWQ_4
Annual
Summer
Autumn
Winter
Spring
Tota
l rai
nfal
l (m
m)
1900 1920 1940 1960 1980 2000
Year
352322(−8.8%)
137121(−11.7%)
10271(−30.4%)
5553(2.5%)
7461(21.4%)
200
400
600
800
0
200
400
0
100
200
300
0
100
200
0
100
200
Figure 4: Historical annual and seasonal total rainfall for the South West Queensland region for the period 1897–2007
The black line is a five year running average. The mean for both the baseline 1961–1990 and the last decade 1998–2007 are shown by the green lines and indicated numerically at the right of the graph. The difference in rainfall between the baseline and last decade is shown in per cent. Note: Vertical scales may differ between graphs.
Data source: BoM, 2008
Historical rainfall shows high variability
FIGURE RS_SWQ_3
Num
ber o
f day
s >
35 °
C
Year
0
20
40
60
80
100
120
1960 1970 1980 1990 2000
Figure 3: Number of days where the temperature exceeded 35 ˚C for Thargomindah
Blank spaces are those years where the maximum temperature did not exceed 35 ˚C. ‘X’ denotes year for which the full data set is not available (i.e. the actual values may in fact be greater than what is shown).
Data source: BoM, 2008
There is no observable increase in the number of days over 35 ˚C in Thargomindah
Phot
o: T
ouris
m Q
ueen
slan
d
ClimateQ: toward a greener QueenslandSWQ6
Evaporation
Potential evaporation is a measure of the evaporative (or drying) power of the atmosphere. The potential evaporation rate assumes that there is an unlimited supply of water to evaporate (either from the soil or from water bodies). Although potential evaporation can differ from actual evaporation, a change in potential evaporation gives a good indication of the change in the evaporative power of the atmosphere.
Networks to measure potential evaporation are not as well developed as those that measure temperature and rainfall and there are insufficient data available to indicate the changes over time.
Averaged over the SWQ region, the annual mean potential evaporation over the period 1971–2000 (2588 mm) is nearly seven times larger than the annual mean rainfall over the same period (383 mm), which contributes to the depletion of soil moisture.
Cyclones Strong winds, intense rainfall and ocean effects such as extreme waves combine to make the total cyclone hazard. This hazard is greatest in Queensland between January and March, but tropical cyclones in Queensland can occur anytime over the period from November to April.
While having little direct effect on the inland South West Queensland region, tropical cyclone systems can be associated with flooding in inland regions through the weakening of such systems into significant rain-bearing depressions.
After the decay of tropical cyclone Ita (23–24 February 1997) into a rain-bearing depression, flooding was recorded in the Warrego River in Charleville, with flood gauges reading 7.39 m—which is greater than the major flood level for the town (6.0 m). There was significant damage to houses, businesses, roads and bridges as a result of this flooding.
Projected climate change in South West Queensland Global Climate Models simulate the earth’s climate system using a complex set of mathematical rules that describe the physical processes of the atmosphere, ocean, land and ice. They are currently considered to be the best tools for projecting climate change. CSIRO has recently released climate change projections for Australia (CSIRO & BoM, 2007) based on the results from 23 Global Climate Models. Projections for the SWQ region have been extracted from this dataset for the Queensland Climate Change Centre of Excellence (QCCCE). The projections presented here are relative to the base period of 1980–1999.
The Global Climate Models show little difference under the high, medium and low emissions scenarios to 2030. Therefore, the 2030 climate change projections for the SWQ region have been presented on a mid-range emissions scenario.
However, the projections diverge at 2050 under different emissions scenarios. Therefore, the 2050 and 2070 projections are based on low and high emissions scenarios.
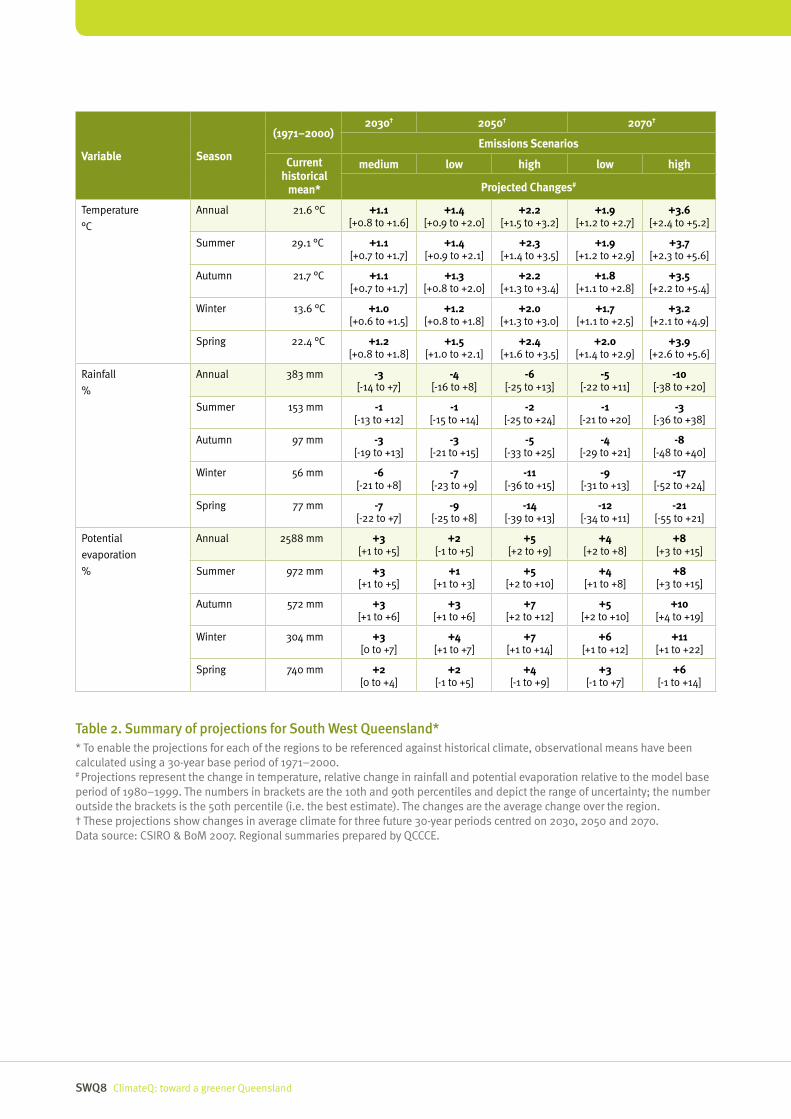
The full range of projected changes for temperature, rainfall and potential evaporation for the SWQ region in 2030, 2050 and 2070 are described in Table 2. The numbers shown in brackets indicate the range of the results from the Global Climate Models.
Overview of climate projectionsIn summary, the changes to temperature and rainfall under the three emissions scenarios are:
2030 (medium emissions scenario)Annual and seasonal temperature• : annual mean temperature (the average of all daily temperatures within a given year) is projected to increase by 1.1 °C. There is little variation in projections across the seasons.
Annual and seasonal rainfall• : annual rainfall (the total rainfall received within a given year) is projected to decrease by three per cent (-11 mm). The largest seasonal decrease of seven per cent (-5 mm) is projected for spring.
Annual and seasonal potential evaporation• : across all seasons the annual ‘best estimate’ increase is projected to be around 2–3 per cent (52–78 mm), with some models projecting up to a seven per cent increase in winter (21 mm).
Phot
o: T
ouris
m Q
ueen
slan
d
ClimateQ: toward a greener Queensland SWQ7
2050 (low and high emissions scenarios)Annual and seasonal temperature• : annual temperature is projected to increase by 1.4 °C and 2.2 °C under the low and high emissions scenarios respectively. There is little variation in projections across the seasons.
Annual and seasonal rainfall• : annual rainfall is projected to decrease by four per cent (-15 mm) and six per cent (-23 mm) under the low and high emissions scenarios respectively. The largest seasonal decrease of 14 per cent (-11 mm) under the high emissions scenario is projected for spring.
Annual and seasonal potential evaporation• : under a high emissions scenario an increase in annual potential evaporation of up to nine per cent (233 mm) is projected with the best estimate being five per cent (129 mm). Winter is projected to have the greatest increase of up to 14 per cent (43 mm).
2070 (low and high emissions scenarios)Annual and seasonal temperature• : annual temperature is projected to increase by 1.9 °C and 3.6 °C under the low and high emissions scenarios respectively. There is little variation in projections across the seasons.
Annual and seasonal rainfall• : annual rainfall is projected to decrease by five per cent (-19 mm) and 10 per cent (-38 mm) under the low and high emissions scenarios respectively. The largest seasonal decrease under a high emissions scenario of 21 per cent (-16 mm) is projected for spring.
Annual and seasonal potential evaporation• : under a high emissions scenario, annual evaporation is projected to increase by as much as 15 per cent (388 mm). Winter is projected to be the season most impacted with increases up to 22 per cent (67 mm) in some models.
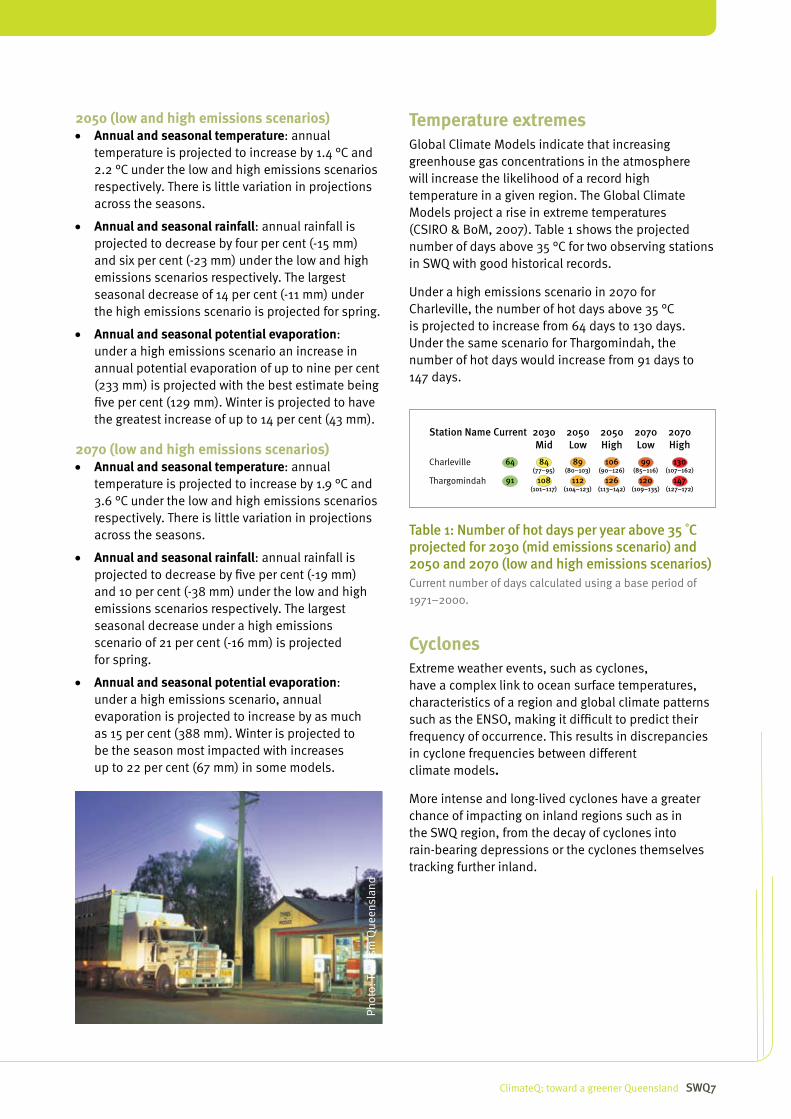
Temperature extremesGlobal Climate Models indicate that increasing greenhouse gas concentrations in the atmosphere will increase the likelihood of a record high temperature in a given region. The Global Climate Models project a rise in extreme temperatures (CSIRO & BoM, 2007). Table 1 shows the projected number of days above 35 °C for two observing stations in SWQ with good historical records.
Under a high emissions scenario in 2070 for Charleville, the number of hot days above 35 °C is projected to increase from 64 days to 130 days. Under the same scenario for Thargomindah, the number of hot days would increase from 91 days to 147 days.
Cyclones Extreme weather events, such as cyclones, have a complex link to ocean surface temperatures, characteristics of a region and global climate patterns such as the ENSO, making it difficult to predict their frequency of occurrence. This results in discrepancies in cyclone frequencies between different climate models.
More intense and long-lived cyclones have a greater chance of impacting on inland regions such as in the SWQ region, from the decay of cyclones into rain-bearing depressions or the cyclones themselves tracking further inland.
TABLE 1.
14712012611210891(127–172)(109–135)(113–142)(104–123)(101–117)
Thargomindah
13099106898464(107–162)(85–116)(90–126)(80–103)(77–95)
Charleville
Station Name Current 2030Mid
2050Low
2050High
2070Low
2070High
Table 1: Number of hot days per year above 35 ˚C projected for 2030 (mid emissions scenario) and 2050 and 2070 (low and high emissions scenarios)Current number of days calculated using a base period of 1971–2000.
Phot
o: T
ouris
m Q
ueen
slan
d
ClimateQ: toward a greener QueenslandSWQ8
Variable Season
(1971–2000)2030† 2050† 2070†
Emissions Scenarios
Current historical
mean*
medium low high low high
Projected Changes#
Temperature
°C
Annual 21.6 °C +1.1 [+0.8 to +1.6]
+1.4 [+0.9 to +2.0]
+2.2 [+1.5 to +3.2]
+1.9 [+1.2 to +2.7]
+3.6 [+2.4 to +5.2]
Summer 29.1 °C +1.1 [+0.7 to +1.7]
+1.4 [+0.9 to +2.1]
+2.3 [+1.4 to +3.5]
+1.9 [+1.2 to +2.9]
+3.7 [+2.3 to +5.6]
Autumn 21.7 °C +1.1 [+0.7 to +1.7]
+1.3 [+0.8 to +2.0]
+2.2 [+1.3 to +3.4]
+1.8 [+1.1 to +2.8]
+3.5 [+2.2 to +5.4]
Winter 13.6 °C +1.0 [+0.6 to +1.5]
+1.2 [+0.8 to +1.8]
+2.0 [+1.3 to +3.0]
+1.7 [+1.1 to +2.5]
+3.2 [+2.1 to +4.9]
Spring 22.4 °C +1.2 [+0.8 to +1.8]
+1.5 [+1.0 to +2.1]
+2.4 [+1.6 to +3.5]
+2.0 [+1.4 to +2.9]
+3.9 [+2.6 to +5.6]
Rainfall
%
Annual 383 mm -3 [-14 to +7]
-4 [-16 to +8]
-6 [-25 to +13]
-5 [-22 to +11]
-10 [-38 to +20]
Summer 153 mm -1 [-13 to +12]
-1 [-15 to +14]
-2 [-25 to +24]
-1 [-21 to +20]
-3 [-36 to +38]
Autumn 97 mm -3 [-19 to +13]
-3 [-21 to +15]
-5 [-33 to +25]
-4 [-29 to +21]
-8 [-48 to +40]
Winter 56 mm -6 [-21 to +8]
-7 [-23 to +9]
-11 [-36 to +15]
-9 [-31 to +13]
-17 [-52 to +24]
Spring 77 mm -7 [-22 to +7]
-9 [-25 to +8]
-14 [-39 to +13]
-12 [-34 to +11]
-21 [-55 to +21]
Potential
evaporation
%
Annual 2588 mm +3 [+1 to +5]
+2 [-1 to +5]
+5 [+2 to +9]
+4 [+2 to +8]
+8 [+3 to +15]
Summer 972 mm +3 [+1 to +5]
+1 [+1 to +3]
+5 [+2 to +10]
+4 [+1 to +8]
+8 [+3 to +15]
Autumn 572 mm +3 [+1 to +6]
+3 [+1 to +6]
+7 [+2 to +12]
+5 [+2 to +10]
+10 [+4 to +19]
Winter 304 mm +3 [0 to +7]
+4 [+1 to +7]
+7 [+1 to +14]
+6 [+1 to +12]
+11 [+1 to +22]
Spring 740 mm +2 [0 to +4]
+2 [-1 to +5]
+4 [-1 to +9]
+3 [-1 to +7]
+6 [-1 to +14]
Table 2. Summary of projections for South West Queensland** To enable the projections for each of the regions to be referenced against historical climate, observational means have been calculated using a 30-year base period of 1971–2000. # Projections represent the change in temperature, relative change in rainfall and potential evaporation relative to the model base period of 1980–1999. The numbers in brackets are the 10th and 90th percentiles and depict the range of uncertainty; the number outside the brackets is the 50th percentile (i.e. the best estimate). The changes are the average change over the region.† These projections show changes in average climate for three future 30-year periods centred on 2030, 2050 and 2070. Data source: CSIRO & BoM 2007. Regional summaries prepared by QCCCE.
ClimateQ: toward a greener Queensland SWQ9
Impacts of climate change on the South West Queensland regionIncreasing temperatures and evaporation, more prolonged drought combined with periodic extreme flow events are projected to be the main climate change impacts in South West Queensland. The temperature projections for inaction on climate change suggest a temperature increase well outside the range of temperatures ever experienced over the last 50 years. The projections for temperature and number of hot days are all in the same direction—increasing.
In 2007 a sustainable yields study on water availability in the Warrego (the eastern part of the SWQ region) was undertaken by the CSIRO. It was found that climate change could significantly change rainfall and runoff; however, the extent of change by 2030 is uncertain. The sustainable yields study presented the range of projections for both low and high emissions scenarios for 2030. Under these scenarios, mean annual rainfall could fall by up to eight per cent or increase by up to 11 per cent, respectively. Given these changes in rainfall, the mean annual runoff could fall by up to 25 per cent or increase by up to 46 per cent (CSIRO, 2007).
As less than two per cent of the rain that falls in the Warrego portion of the Murray Darling Basin currently ends up as runoff, and as streamflow mostly occurs as
large infrequent floods, an increase in runoff of nearly 50 per cent could have very large flooding impacts. In contrast, a decrease of nearly 25 per cent will have large negative impact on flows in the major rivers.
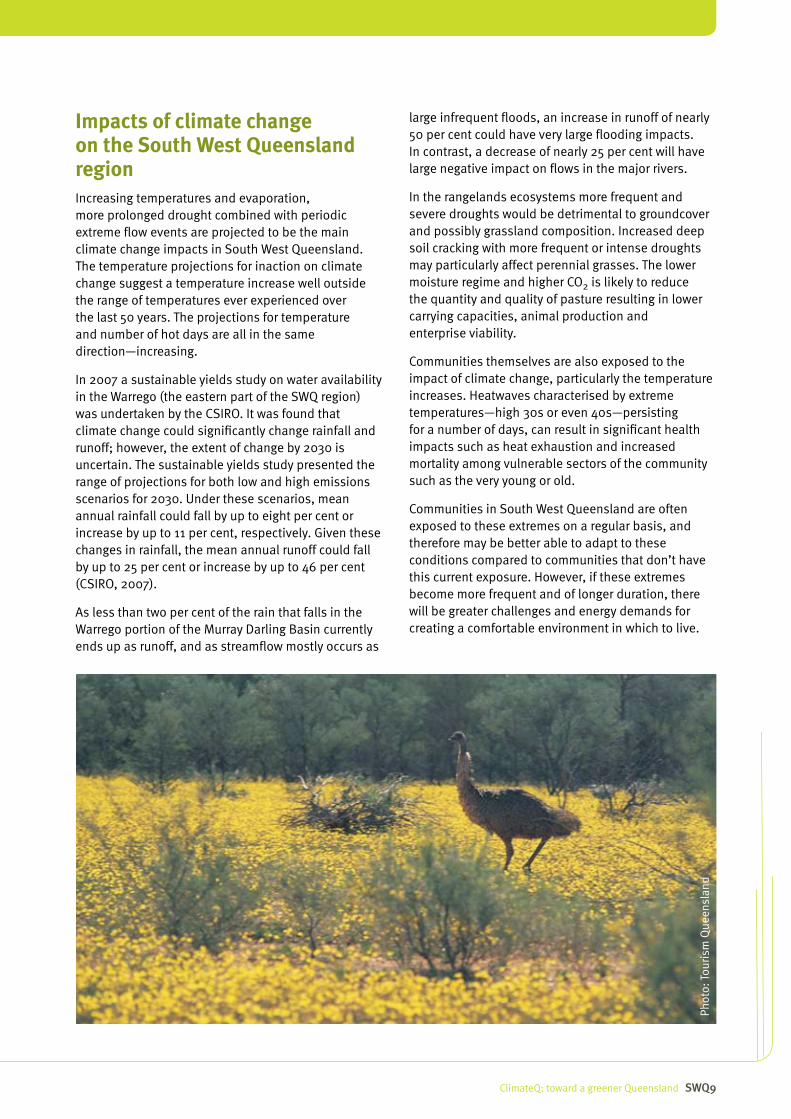
In the rangelands ecosystems more frequent and severe droughts would be detrimental to groundcover and possibly grassland composition. Increased deep soil cracking with more frequent or intense droughts may particularly affect perennial grasses. The lower moisture regime and higher CO2 is likely to reduce the quantity and quality of pasture resulting in lower carrying capacities, animal production and enterprise viability.
Communities themselves are also exposed to the impact of climate change, particularly the temperature increases. Heatwaves characterised by extreme temperatures—high 30s or even 40s—persisting for a number of days, can result in significant health impacts such as heat exhaustion and increased mortality among vulnerable sectors of the community such as the very young or old.
Communities in South West Queensland are often exposed to these extremes on a regular basis, and therefore may be better able to adapt to these conditions compared to communities that don’t have this current exposure. However, if these extremes become more frequent and of longer duration, there will be greater challenges and energy demands for creating a comfortable environment in which to live.
Phot
o: T
ouris
m Q
ueen
slan
d
ClimateQ: toward a greener QueenslandSWQ10
References
Bureau of Meteorology (BoM) 2008, Bureau of Meteorology, Canberra, <www.bom.gov.au/silo/products/cli_chg>
Commonwealth Scientific and Industrial Research Organisation (CSIRO) and BoM 2007, Climate change in Australia: Technical Report 2007, CSIRO, Melbourne, <www.climatechangeinaustralia.gov.au>
CSIRO 2007, Water availability in the Warrego, report to the Australian Government for the CSIRO Murray-Darling Basin Sustainable Yields Project, Commonwealth Scientific and Industrial Research Organisation, Canberra, <www.clw.csiro.au/publications/waterforahealthycountry/mdbsy/pdf/Warrego-Report.pdf>
Department of Infrastructure and Planning (DIP) 2007, Draft South West Queensland Regional Plan, Department of Infrastructure and Planning, Brisbane, <http://www.dip.qld.gov.au/resources/plan/south-west/draft-s-w-plan.pdf>
DIP 2008, Queensland Future Populations: Appendix C (based on reformed Local Government Areas), Department of Infrastructure and Planning, Brisbane, <www.dip.qld.gov.au/resources/report/future-population/appendix-c.xls>
Office of Economic and Statistical Research 2007, Queensland Regional Profiles, (based on reformed Local Government Areas), Office of Economic and Statistical Research, Brisbane, <statistics.oesr.qld.gov.au/qld-regional-profiles>
Phot
o: T
ouris
m Q
ueen
slan
d